Embed Size (px)
Citation preview
The State of Infectious Diseases Clinical Trials: ASystematic Review of ClinicalTrials.govNeela D. Goswami1., Christopher D. Pfeiffer2,3., John R. Horton4, Karen Chiswell4, Asba Tasneem4,
Ephraim L. Tsalik1,5*
1 Division of Infectious Diseases and International Health, Department of Medicine, Duke University School of Medicine, Durham, North Carolina, United States of America,
2 Department of Hospital and Specialty Medicine, Portland VA Medical Center, Portland, Oregon, United States of America, 3 Division of Infectious Diseases, Oregon
Health and Science University, Portland, Oregon, United States of America, 4 Duke Clinical Research Institute, Durham, North Carolina, United States of America,
5 Emergency Medicine Service, Durham VA Medical Center, Durham, North Carolina, United States of America
Abstract
Background: There is a paucity of clinical trials informing specific questions faced by infectious diseases (ID) specialists. TheClinicalTrials.gov registry offers an opportunity to evaluate the ID clinical trials portfolio.
Methods: We examined 40,970 interventional trials registered with ClinicalTrials.gov from 2007–2010, focusing on studyconditions and interventions to identify ID-related trials. Relevance to ID was manually confirmed for each programmaticallyidentified trial, yielding 3570 ID trials and 37,400 non-ID trials for analysis.
Results: The number of ID trials was similar to the number of trials identified as belonging to cardiovascular medicine(n = 3437) or mental health (n = 3695) specialties. Slightly over half of ID trials were treatment-oriented trials (53%, vs. 77%for non-ID trials) followed by prevention (38%, vs. 8% in non-ID trials). ID trials tended to be larger than those of otherspecialties, with a median enrollment of 125 subjects (interquartile range [IQR], 45–400) vs. 60 (IQR, 30–160) for non-ID trials.Most ID studies are randomized (73%) but nonblinded (56%). Industry was the funding source in 51% of ID trials vs. 10%that were primarily NIH-funded. HIV-AIDS trials constitute the largest subset of ID trials (n = 815 [23%]), followed byinfluenza vaccine (n = 375 [11%]), and hepatitis C (n = 339 [9%]) trials. Relative to U.S. and global mortality rates, HIV-AIDSand hepatitis C virus trials are over-represented, whereas lower respiratory tract infection trials are under-represented in thislarge sample of ID clinical trials.
Conclusions: This work is the first to characterize ID clinical trials registered in ClinicalTrials.gov, providing a framework todiscuss prioritization, methodology, and policy.
Citation: Goswami ND, Pfeiffer CD, Horton JR, Chiswell K, Tasneem A, et al. (2013) The State of Infectious Diseases Clinical Trials: A Systematic Review ofClinicalTrials.gov. PLoS ONE 8(10): e77086. doi:10.1371/journal.pone.0077086
Editor: Tim Friede, University Medical Center Gottingen, Germany
Received December 13, 2012; Accepted September 3, 2013; Published October 16, 2013
Copyright: � 2013 Goswami et al. This is an open-access article distributed under the terms of the Creative Commons Attribution License, which permitsunrestricted use, distribution, and reproduction in any medium, provided the original author and source are credited.
Funding: This work was supported by grant U19FD003800 from the US Food and Drug Administration awarded to Duke University for the Clinical TrialsTransformation Initiative. Dr. Tsalik’s efforts were also supported by Award Number 1IK2CX000530 from the Clinical Science Research and Development Service ofthe Veterans Health Administration Office of Research and Development. The funders had no role in study design, data collection and analysis, decision topublish, or preparation of the manuscript.
Competing Interests: The authors have declared that no competing interests exist.
* E-mail: [email protected]
. These authors contributed equally to this work.
Introduction
In the context of modern, evidence-based prevention and
treatment of infectious diseases, clinical trials provide information
about the accuracy of molecular or microbiological diagnostics,
the prognosis of infectious syndromes, and the potential risks and
benefits of anti-infective regimens. However, there is a paucity of
clinical trials informing the specific questions faced by infectious
disease (ID) specialists. More than 50% of the recommendations
contained in the practice guidelines published by the Infectious
Diseases Society of America (IDSA) are based solely upon expert
opinion; less than a quarter are based on evidence from
randomized controlled trials (RCTs) [1,2]. There is also increasing
concern about the role of the medical products industry in the
design and conduct of research, and in formulating practice
guidelines [3]. But despite these concerns, the current spectrum of
ID clinical trials has largely gone without systematic scrutiny
regarding patterns of topical focus, geographical distribution, and
levels of industry involvement.
ClinicalTrials.gov, a U.S. Food and Drug Administration
(FDA)-initiated registry of more than 100,000 trials from 174
countries, provides a unique opportunity to take a ‘‘snapshot’’ of
ID trials in terms of content and sponsorship. In September of
2007, registration of trials of drugs, biologics, and devices with
ClinicalTrials.gov became a legal requirement for a large segment
of clinical research conducted under U.S. jurisdiction; in addition,
many peer-reviewed journals require registration with Clinical-
Trials.gov or a comparable registry as a condition of publication
[4]. Although clinical trials as a whole have been summarized from
this registry [5,6], ID trials have not been described, in part
PLOS ONE | www.plosone.org 1 October 2013 | Volume 8 | Issue 10 | e77086
because they had not been prospectively designated as infection-
related trials.
Recently, the Clinical Trials Transformation Initiative (CTTI)
transformed the ClinicalTrials.gov database into a searchable
relational dataset of registry content and regrouped studies into
clinical specialties, thereby allowing targeted analysis. In this cross-
sectional study, we aimed to characterize the scope and nature of
ID clinical trials in this registry through a systematic analysis of
characteristics of the registered trials, including trial methodology,
geographic distribution, and funding source. We also evaluated the
alignment between current clinical research priorities and the
infections that cause the highest morbidity and mortality in the
United States and around the world.
Materials and Methods
We performed a systematic analysis of characteristics of
infectious disease trials registered with ClinicalTrials.gov from
October 1, 2007 to September 27, 2010. We chose Clinical-
Trials.gov for our analysis over other registries because of its large
size, international field of studies, publically available data element
definitions and design details, inclusion of a full range of clinical
conditions, broad group of trial sponsors [7], and its regulatory
mandate [8], and also because ClinicalTrials.gov is the largest
registry to allow bulk download of its entire dataset. The methods
used by ClinicalTrials.gov to register clinical trials have been
described previously [7,9,10]. Briefly, trial sponsors and investi-
gators from around the world can enter trial data through a Web-
based data entry system. The sample we examined in the present
study includes trials that were registered to meet legal obligations
such as from the FDA Amendments Act of 2007, as well as those
registered to comply with requirements for peer-reviewed publi-
cation by the International Committee of Medical Journal Editors
[4].
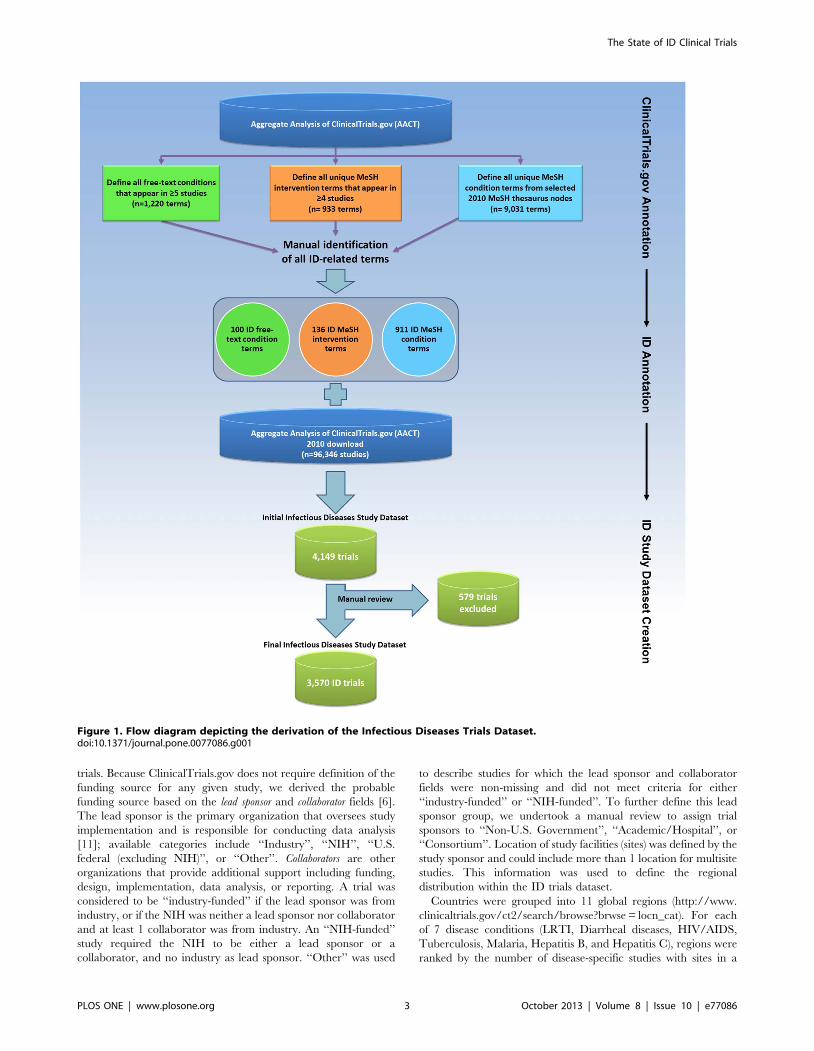
Creation of the ID Study DatasetWe downloaded a dataset comprising all 96,346 clinical trials
registered with ClinicalTrials.gov from its inception through
September 27, 2010. We focused on trials registered on or after
October 2007, as this date corresponded with the beginning of the
U.S. legal requirement [8] for registering certain trials of drugs,
biologics, and devices. We next designed and implemented a
relational database (Oracle RDBMS, version 11.1 g [Oracle
Corporation, Redwood Shores, California, USA]) to analyze the
aggregate data. The resulting Aggregate Analysis of Clincal-
Trials.gov (AACT) database is publicly available, along with data
definitions and comprehensive data dictionaries, at the CTTI
website [11]. We focused on interventional trials, which were
identified based on the study type field included in the Clinical-
Trials.gov registry. This field offers 4 options: Interventional,
Observational, Expanded Access, and Not Applicable [11]. We
used study type field as a filter, which resulted in 40,970
interventional trials registered during the 3-year period from
October 2007 to September 2010 (Figure 1).
Next, we regrouped studies by clinical specialties within this
derivative database [12]. In order to identify trials that were
potentially relevant to ID, we focused on 2 trial characteristics:
condition and intervention, which were defined either by data
submitters or linked to Medical Subject Heading (MeSH) terms
generated by a National Library of Medicine (NLM) algorithm
based on the 2010 MeSH thesaurus [12]. A manual review of
9031 unique condition-related MeSH terms identified 911 (10%)
terms relevant to ID. Not all conditions could be linked to MeSH
terms; therefore, free-text condition terms appearing in 5 or more
studies were also annotated for relevance to ID. Using this
approach, out of 1220 unique, frequently occurring free-text
condition terms, we identified 100 (8%) ID-related terms.
The second trial characteristic used to identify ID-relevant
studies was the intervention term. We focused only on intervention
terms that appeared in 4 or more studies and reviewed these for
relevance to ID. This process identified 136 ID-related interven-
tion MeSH terms out of 933 reviewed (15%). The results of
algorithmic classifications were validated by comparison with
classifications based on manual review [12]. All annotations were
performed by 3 ID physicians (N.D.G., C.D.P., and E.L.T.). The
identified terms relevant to ID are listed in Appendix S1.
Using a computer-based search, we identified 4149 studies with
at least 1 ID-relevant term in the NLM-generated MeSH
‘‘condition’’ field, the submitted free-text ‘‘condition’’ field, or
the submitted intervention name field. The authors (N.D.G.,
C.D.P., and E.L.T.) then manually reviewed each study to exclude
non-ID studies and assign each study to an ID subcategory. Trials
were included if they focused on a communicable disease. Trials
evaluating non-communicable diseases were included only if the
study hypothesis was that microbes played a role in the disease
under study (e.g., probiotics to prevent hepatic encephalopathy).
Studies that examined ID complications were included only if the
intervention focused on the infection itself (e.g., post-herpetic
neuralgia that included antiviral therapy).
Additional details are available in supplemental material
(Checklist S1 and Diagram S1).
Subcategorization of the ID Study DatasetAfter defining the ID trials dataset, we subcategorized trials
based on study title and description. When possible, subcategories
were defined based on World Health Organization (WHO) cause-
of-death groupings [13]. ‘‘Maternal Conditions’’ and ‘‘Perinatal
Conditions’’ were excluded, because these categories include both
communicable and non-communicable conditions. In addition to
these 18 WHO-defined categories, 40 additional subcategories (for
a total of 58) were defined such that each trial was assigned to at
least 1 subcategory (Figure 2). Trials that fit equally well into
multiple subcategories were assigned to more than 1 category. The
percentage of all ID-related mortality and ID-related disability-
adjusted life years (DALY) attributable to the following conditions
was calculated from the WHO Global Burden of Disease [13–15]:
HIV-AIDS, hepatitis C, lower respiratory tract infection (LRTI),
hepatitis B, malaria, diarrheal diseases, sexually transmitted
diseases (STD) excluding HIV, tuberculosis, childhood cluster
diseases (pertussis, poliomyelitis, diphtheria, measles, and tetanus),
and meningitis.
Analytical MethodsSAS software, version 9.2 (SAS Institute, Cary, NC, USA) was
used to calculate frequencies and percentages for categorical trial
characteristics and median and interquartile ranges (IQRs) for
continuous characteristics. A chi-squared test was used to evaluate
whether trials that were focused on prevention or vaccines were
more likely to restrict enrollment to children than non-prevention
or non-vaccine trials, respectively. Disease prevalence and disease-
specific DALYs were derived from the WHO 2004 Global Burden
of Disease report, whereas disease-specific mortality was derived
from its 2008 update [13–15]. Enrollment (number of trial
participants) was reported for each trial. For active trials that had
not completed recruitment, the anticipated enrollment was
recorded. For trials that had completed or terminated recruitment,
the value was updated to record actual enrollment. Summary
statistics were calculated by pooling across active and completed
The State of ID Clinical Trials
PLOS ONE | www.plosone.org 2 October 2013 | Volume 8 | Issue 10 | e77086
trials. Because ClinicalTrials.gov does not require definition of the
funding source for any given study, we derived the probable
funding source based on the lead sponsor and collaborator fields [6].
The lead sponsor is the primary organization that oversees study
implementation and is responsible for conducting data analysis
[11]; available categories include ‘‘Industry’’, ‘‘NIH’’, ‘‘U.S.
federal (excluding NIH)’’, or ‘‘Other’’. Collaborators are other
organizations that provide additional support including funding,
design, implementation, data analysis, or reporting. A trial was
considered to be ‘‘industry-funded’’ if the lead sponsor was from
industry, or if the NIH was neither a lead sponsor nor collaborator
and at least 1 collaborator was from industry. An ‘‘NIH-funded’’
study required the NIH to be either a lead sponsor or a
collaborator, and no industry as lead sponsor. ‘‘Other’’ was used
to describe studies for which the lead sponsor and collaborator
fields were non-missing and did not meet criteria for either
‘‘industry-funded’’ or ‘‘NIH-funded’’. To further define this lead
sponsor group, we undertook a manual review to assign trial
sponsors to ‘‘Non-U.S. Government’’, ‘‘Academic/Hospital’’, or
‘‘Consortium’’. Location of study facilities (sites) was defined by the
study sponsor and could include more than 1 location for multisite
studies. This information was used to define the regional
distribution within the ID trials dataset.
Countries were grouped into 11 global regions (http://www.
clinicaltrials.gov/ct2/search/browse?brwse = locn_cat). For each
of 7 disease conditions (LRTI, Diarrheal diseases, HIV/AIDS,
Tuberculosis, Malaria, Hepatitis B, and Hepatitis C), regions were
ranked by the number of disease-specific studies with sites in a
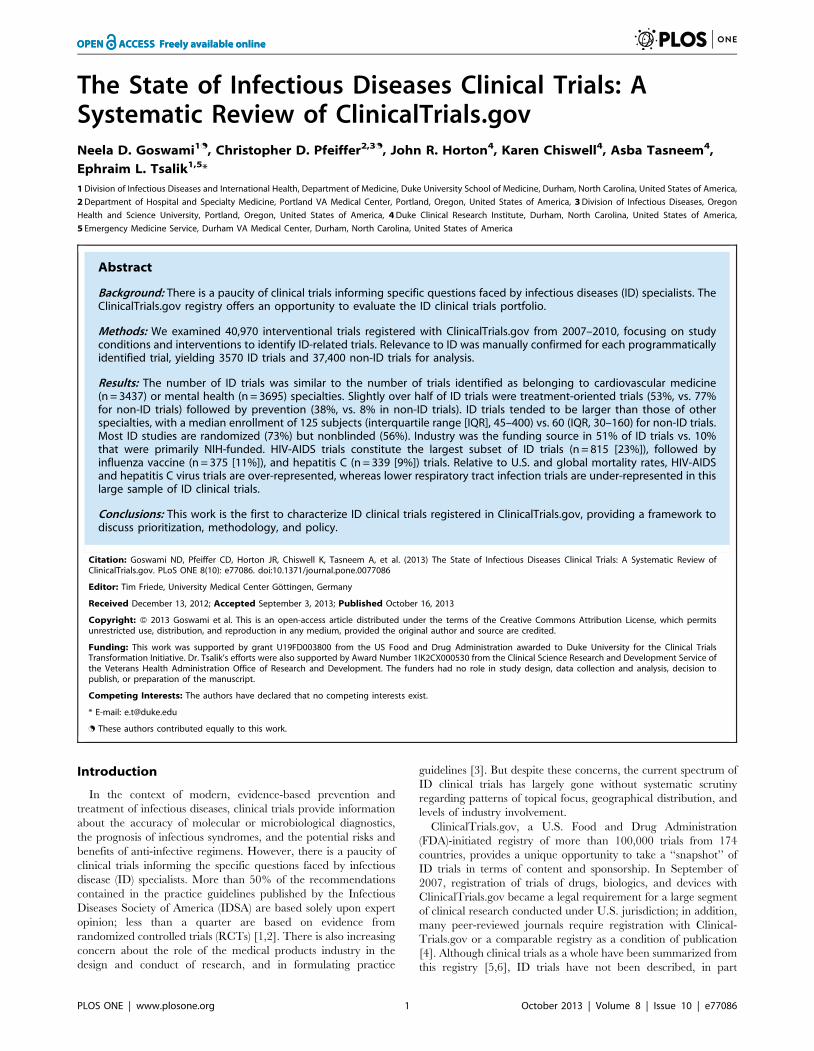
Figure 1. Flow diagram depicting the derivation of the Infectious Diseases Trials Dataset.doi:10.1371/journal.pone.0077086.g001
The State of ID Clinical Trials
PLOS ONE | www.plosone.org 3 October 2013 | Volume 8 | Issue 10 | e77086
region, and by the total number of disease-specific deaths in a
region [15]. These 2 rankings were compared graphically to
examine the geographic distribution of trials in a specific disease
relative to the geographic variation in mortality for that disease.
FundingThis work was supported by a grant from the FDA awarded to
Duke University. The study sponsor had no role in the design or
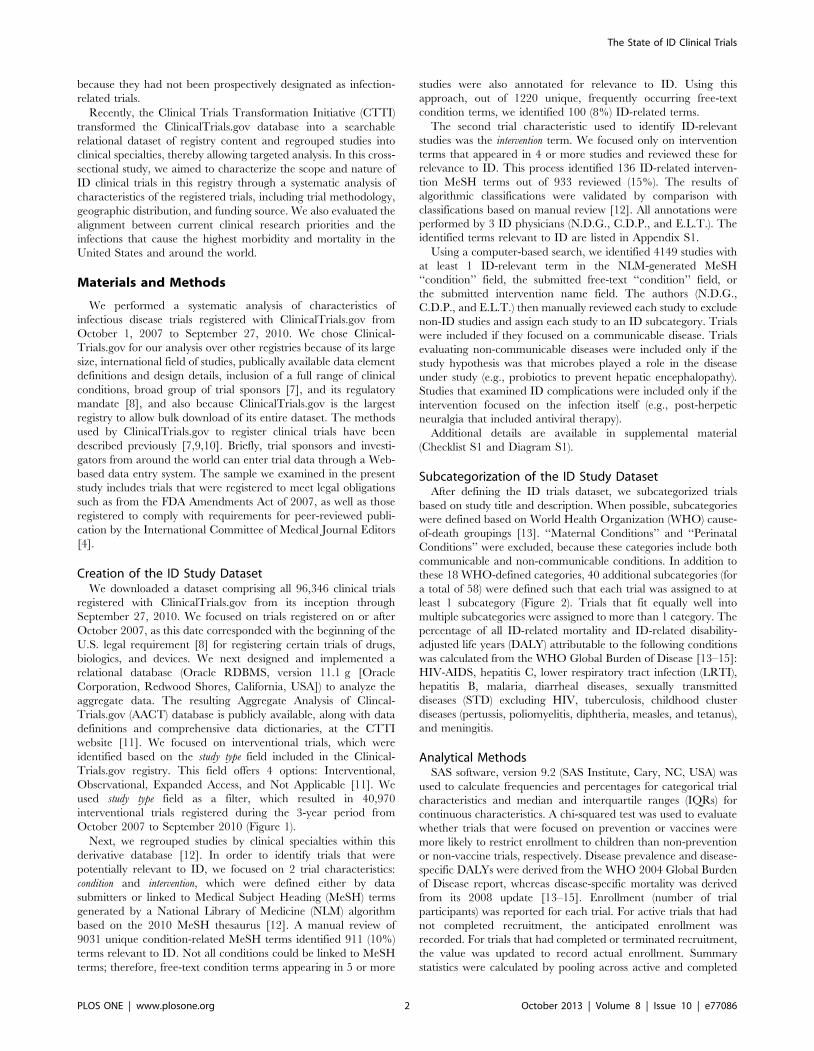
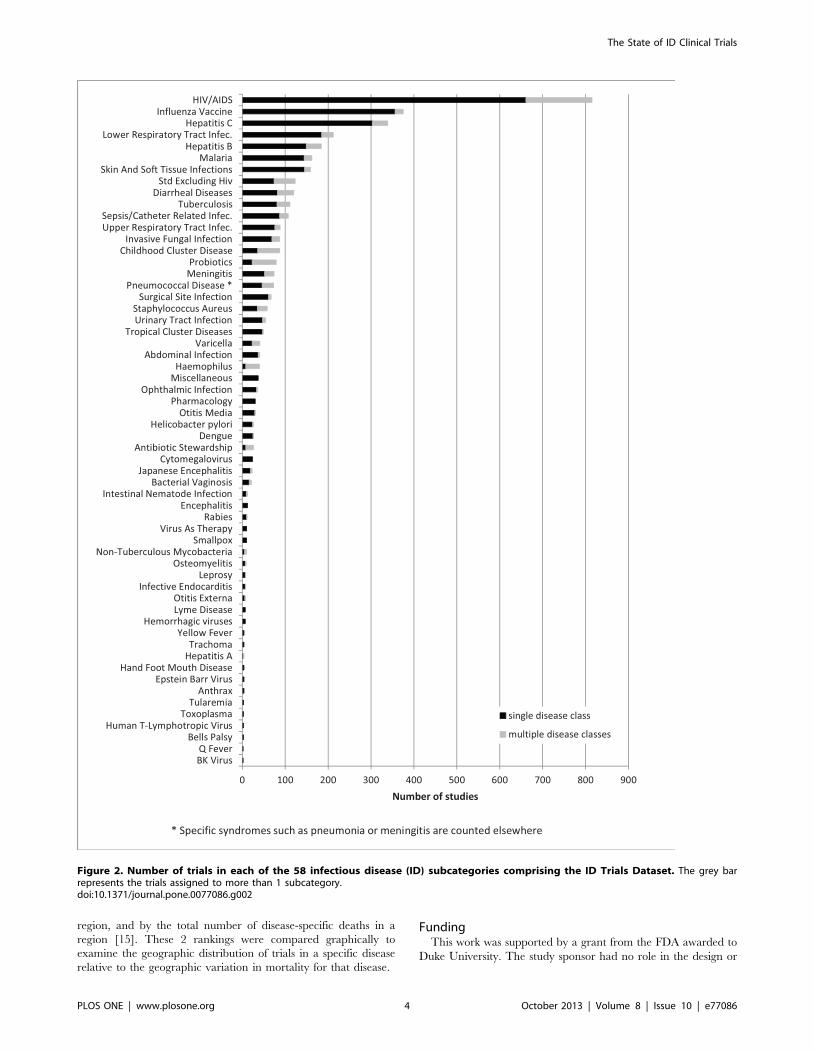
Figure 2. Number of trials in each of the 58 infectious disease (ID) subcategories comprising the ID Trials Dataset. The grey barrepresents the trials assigned to more than 1 subcategory.doi:10.1371/journal.pone.0077086.g002
The State of ID Clinical Trials
PLOS ONE | www.plosone.org 4 October 2013 | Volume 8 | Issue 10 | e77086
performance of this study, or in the writing of the manuscript. All
authors had full access to all study data.
Results
The initial dataset downloaded on September 27, 2010 included
96,346 clinical trials registered with ClinicalTrials.gov. A total of
40,970 interventional trials were registered from October 1, 2007,
after enactment of mandatory registration in September 27, 2007;
of these, 3570 (9%) were defined as the ID trials dataset (Figure 1).
This was similar to the number of cardiovascular medicine
(n = 3437 [8%]) and mental health trials (n = 3695 [9%]) but less
than the number of oncology trials (n = 8992 [22%]) [6].
Of 3570 ID trials, 3207 (90%) were assigned to 1 subcategory,
329 (9%) were assigned to 2 subcategories, and less than 1% were
assigned to more than 2 subcategories. The distribution of trials
across 58 ID subcategories is presented in Figure 2. The
representation of certain disease subcategories within the Clin-
icalTrials.gov registry is compared with ID-related mortality and
disability (as defined by the WHO Global Burden of Disease) in
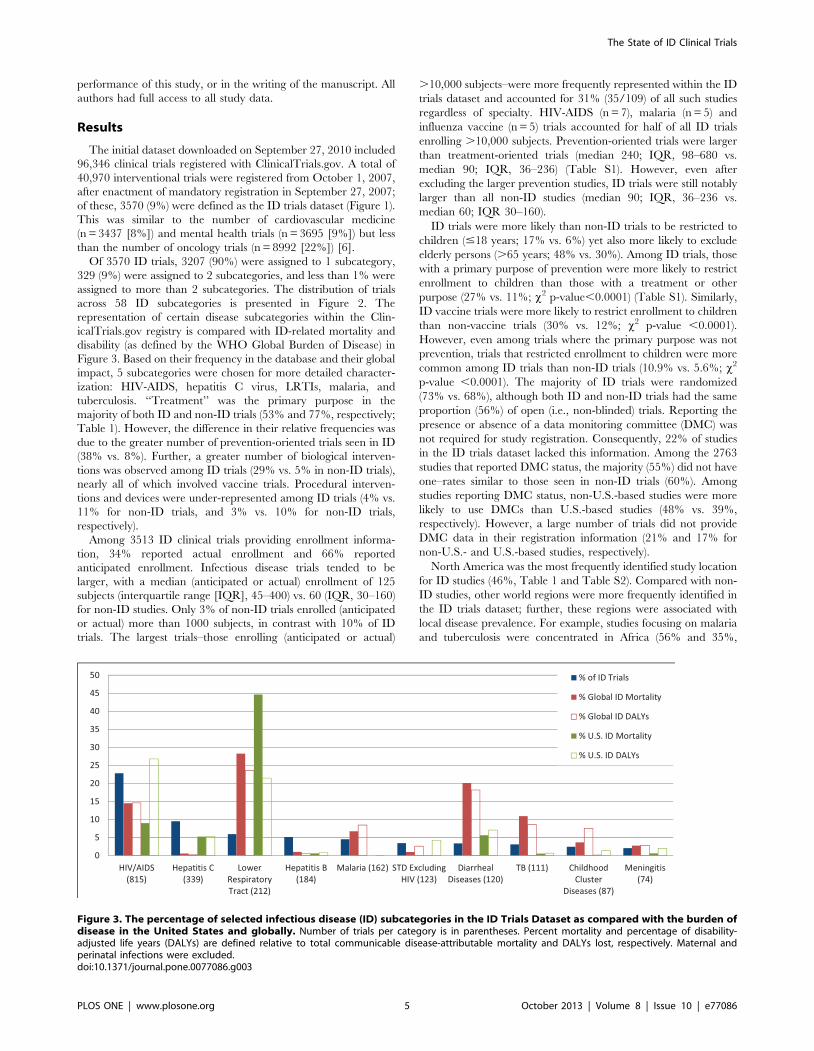
Figure 3. Based on their frequency in the database and their global
impact, 5 subcategories were chosen for more detailed character-
ization: HIV-AIDS, hepatitis C virus, LRTIs, malaria, and
tuberculosis. ‘‘Treatment’’ was the primary purpose in the
majority of both ID and non-ID trials (53% and 77%, respectively;
Table 1). However, the difference in their relative frequencies was
due to the greater number of prevention-oriented trials seen in ID
(38% vs. 8%). Further, a greater number of biological interven-
tions was observed among ID trials (29% vs. 5% in non-ID trials),
nearly all of which involved vaccine trials. Procedural interven-
tions and devices were under-represented among ID trials (4% vs.
11% for non-ID trials, and 3% vs. 10% for non-ID trials,
respectively).
Among 3513 ID clinical trials providing enrollment informa-
tion, 34% reported actual enrollment and 66% reported
anticipated enrollment. Infectious disease trials tended to be
larger, with a median (anticipated or actual) enrollment of 125
subjects (interquartile range [IQR], 45–400) vs. 60 (IQR, 30–160)
for non-ID studies. Only 3% of non-ID trials enrolled (anticipated
or actual) more than 1000 subjects, in contrast with 10% of ID
trials. The largest trials–those enrolling (anticipated or actual)
.10,000 subjects–were more frequently represented within the ID
trials dataset and accounted for 31% (35/109) of all such studies
regardless of specialty. HIV-AIDS (n = 7), malaria (n = 5) and
influenza vaccine (n = 5) trials accounted for half of all ID trials
enrolling .10,000 subjects. Prevention-oriented trials were larger
than treatment-oriented trials (median 240; IQR, 98–680 vs.
median 90; IQR, 36–236) (Table S1). However, even after
excluding the larger prevention studies, ID trials were still notably
larger than all non-ID studies (median 90; IQR, 36–236 vs.
median 60; IQR 30–160).
ID trials were more likely than non-ID trials to be restricted to
children (#18 years; 17% vs. 6%) yet also more likely to exclude
elderly persons (.65 years; 48% vs. 30%). Among ID trials, those
with a primary purpose of prevention were more likely to restrict
enrollment to children than those with a treatment or other
purpose (27% vs. 11%; x2 p-value,0.0001) (Table S1). Similarly,
ID vaccine trials were more likely to restrict enrollment to children
than non-vaccine trials (30% vs. 12%; x2 p-value ,0.0001).
However, even among trials where the primary purpose was not
prevention, trials that restricted enrollment to children were more
common among ID trials than non-ID trials (10.9% vs. 5.6%; x2
p-value ,0.0001). The majority of ID trials were randomized
(73% vs. 68%), although both ID and non-ID trials had the same
proportion (56%) of open (i.e., non-blinded) trials. Reporting the
presence or absence of a data monitoring committee (DMC) was
not required for study registration. Consequently, 22% of studies
in the ID trials dataset lacked this information. Among the 2763
studies that reported DMC status, the majority (55%) did not have
one–rates similar to those seen in non-ID trials (60%). Among
studies reporting DMC status, non-U.S.-based studies were more
likely to use DMCs than U.S.-based studies (48% vs. 39%,
respectively). However, a large number of trials did not provide
DMC data in their registration information (21% and 17% for
non-U.S.- and U.S.-based studies, respectively).
North America was the most frequently identified study location
for ID studies (46%, Table 1 and Table S2). Compared with non-
ID studies, other world regions were more frequently identified in
the ID trials dataset; further, these regions were associated with
local disease prevalence. For example, studies focusing on malaria
and tuberculosis were concentrated in Africa (56% and 35%,
Figure 3. The percentage of selected infectious disease (ID) subcategories in the ID Trials Dataset as compared with the burden ofdisease in the United States and globally. Number of trials per category is in parentheses. Percent mortality and percentage of disability-adjusted life years (DALYs) are defined relative to total communicable disease-attributable mortality and DALYs lost, respectively. Maternal andperinatal infections were excluded.doi:10.1371/journal.pone.0077086.g003
The State of ID Clinical Trials
PLOS ONE | www.plosone.org 5 October 2013 | Volume 8 | Issue 10 | e77086
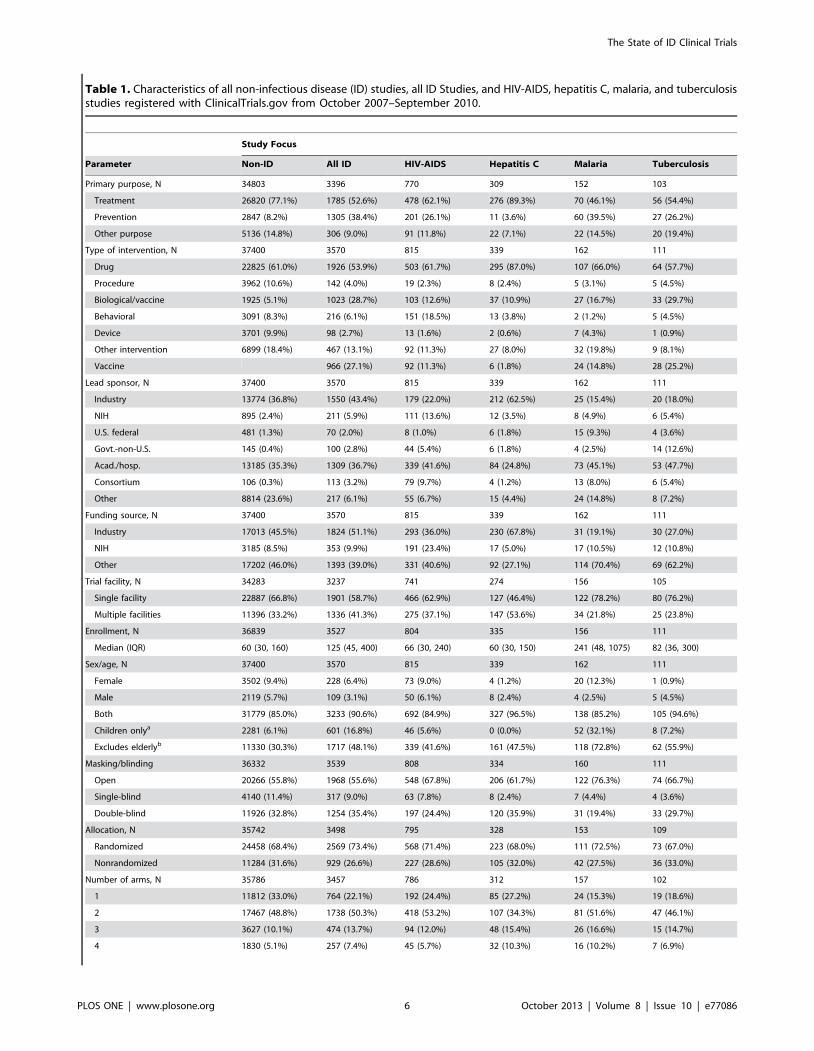
Table 1. Characteristics of all non-infectious disease (ID) studies, all ID Studies, and HIV-AIDS, hepatitis C, malaria, and tuberculosisstudies registered with ClinicalTrials.gov from October 2007–September 2010.
Study Focus
Parameter Non-ID All ID HIV-AIDS Hepatitis C Malaria Tuberculosis
Primary purpose, N 34803 3396 770 309 152 103
Treatment 26820 (77.1%) 1785 (52.6%) 478 (62.1%) 276 (89.3%) 70 (46.1%) 56 (54.4%)
Prevention 2847 (8.2%) 1305 (38.4%) 201 (26.1%) 11 (3.6%) 60 (39.5%) 27 (26.2%)
Other purpose 5136 (14.8%) 306 (9.0%) 91 (11.8%) 22 (7.1%) 22 (14.5%) 20 (19.4%)
Type of intervention, N 37400 3570 815 339 162 111
Drug 22825 (61.0%) 1926 (53.9%) 503 (61.7%) 295 (87.0%) 107 (66.0%) 64 (57.7%)
Procedure 3962 (10.6%) 142 (4.0%) 19 (2.3%) 8 (2.4%) 5 (3.1%) 5 (4.5%)
Biological/vaccine 1925 (5.1%) 1023 (28.7%) 103 (12.6%) 37 (10.9%) 27 (16.7%) 33 (29.7%)
Behavioral 3091 (8.3%) 216 (6.1%) 151 (18.5%) 13 (3.8%) 2 (1.2%) 5 (4.5%)
Device 3701 (9.9%) 98 (2.7%) 13 (1.6%) 2 (0.6%) 7 (4.3%) 1 (0.9%)
Other intervention 6899 (18.4%) 467 (13.1%) 92 (11.3%) 27 (8.0%) 32 (19.8%) 9 (8.1%)
Vaccine 966 (27.1%) 92 (11.3%) 6 (1.8%) 24 (14.8%) 28 (25.2%)
Lead sponsor, N 37400 3570 815 339 162 111
Industry 13774 (36.8%) 1550 (43.4%) 179 (22.0%) 212 (62.5%) 25 (15.4%) 20 (18.0%)
NIH 895 (2.4%) 211 (5.9%) 111 (13.6%) 12 (3.5%) 8 (4.9%) 6 (5.4%)
U.S. federal 481 (1.3%) 70 (2.0%) 8 (1.0%) 6 (1.8%) 15 (9.3%) 4 (3.6%)
Govt.-non-U.S. 145 (0.4%) 100 (2.8%) 44 (5.4%) 6 (1.8%) 4 (2.5%) 14 (12.6%)
Acad./hosp. 13185 (35.3%) 1309 (36.7%) 339 (41.6%) 84 (24.8%) 73 (45.1%) 53 (47.7%)
Consortium 106 (0.3%) 113 (3.2%) 79 (9.7%) 4 (1.2%) 13 (8.0%) 6 (5.4%)
Other 8814 (23.6%) 217 (6.1%) 55 (6.7%) 15 (4.4%) 24 (14.8%) 8 (7.2%)
Funding source, N 37400 3570 815 339 162 111
Industry 17013 (45.5%) 1824 (51.1%) 293 (36.0%) 230 (67.8%) 31 (19.1%) 30 (27.0%)
NIH 3185 (8.5%) 353 (9.9%) 191 (23.4%) 17 (5.0%) 17 (10.5%) 12 (10.8%)
Other 17202 (46.0%) 1393 (39.0%) 331 (40.6%) 92 (27.1%) 114 (70.4%) 69 (62.2%)
Trial facility, N 34283 3237 741 274 156 105
Single facility 22887 (66.8%) 1901 (58.7%) 466 (62.9%) 127 (46.4%) 122 (78.2%) 80 (76.2%)
Multiple facilities 11396 (33.2%) 1336 (41.3%) 275 (37.1%) 147 (53.6%) 34 (21.8%) 25 (23.8%)
Enrollment, N 36839 3527 804 335 156 111
Median (IQR) 60 (30, 160) 125 (45, 400) 66 (30, 240) 60 (30, 150) 241 (48, 1075) 82 (36, 300)
Sex/age, N 37400 3570 815 339 162 111
Female 3502 (9.4%) 228 (6.4%) 73 (9.0%) 4 (1.2%) 20 (12.3%) 1 (0.9%)
Male 2119 (5.7%) 109 (3.1%) 50 (6.1%) 8 (2.4%) 4 (2.5%) 5 (4.5%)
Both 31779 (85.0%) 3233 (90.6%) 692 (84.9%) 327 (96.5%) 138 (85.2%) 105 (94.6%)
Children onlya 2281 (6.1%) 601 (16.8%) 46 (5.6%) 0 (0.0%) 52 (32.1%) 8 (7.2%)
Excludes elderlyb 11330 (30.3%) 1717 (48.1%) 339 (41.6%) 161 (47.5%) 118 (72.8%) 62 (55.9%)
Masking/blinding 36332 3539 808 334 160 111
Open 20266 (55.8%) 1968 (55.6%) 548 (67.8%) 206 (61.7%) 122 (76.3%) 74 (66.7%)
Single-blind 4140 (11.4%) 317 (9.0%) 63 (7.8%) 8 (2.4%) 7 (4.4%) 4 (3.6%)
Double-blind 11926 (32.8%) 1254 (35.4%) 197 (24.4%) 120 (35.9%) 31 (19.4%) 33 (29.7%)
Allocation, N 35742 3498 795 328 153 109
Randomized 24458 (68.4%) 2569 (73.4%) 568 (71.4%) 223 (68.0%) 111 (72.5%) 73 (67.0%)
Nonrandomized 11284 (31.6%) 929 (26.6%) 227 (28.6%) 105 (32.0%) 42 (27.5%) 36 (33.0%)
Number of arms, N 35786 3457 786 312 157 102
1 11812 (33.0%) 764 (22.1%) 192 (24.4%) 85 (27.2%) 24 (15.3%) 19 (18.6%)
2 17467 (48.8%) 1738 (50.3%) 418 (53.2%) 107 (34.3%) 81 (51.6%) 47 (46.1%)
3 3627 (10.1%) 474 (13.7%) 94 (12.0%) 48 (15.4%) 26 (16.6%) 15 (14.7%)
4 1830 (5.1%) 257 (7.4%) 45 (5.7%) 32 (10.3%) 16 (10.2%) 7 (6.9%)
The State of ID Clinical Trials
PLOS ONE | www.plosone.org 6 October 2013 | Volume 8 | Issue 10 | e77086
respectively) but infrequently located in North America (13% and
17%, respectively). In contrast, 42% of LRTI trials were located in
North America and 36% in Europe, but only 6% were located in
Africa. We also plotted the geographic distribution of trials relative
to the burden of disease across eleven world regions based on rank
(Figure 4). For the 7 disease conditions analyzed (LRTI, Diarrheal
Table 1. Cont.
Study Focus
Parameter Non-ID All ID HIV-AIDS Hepatitis C Malaria Tuberculosis
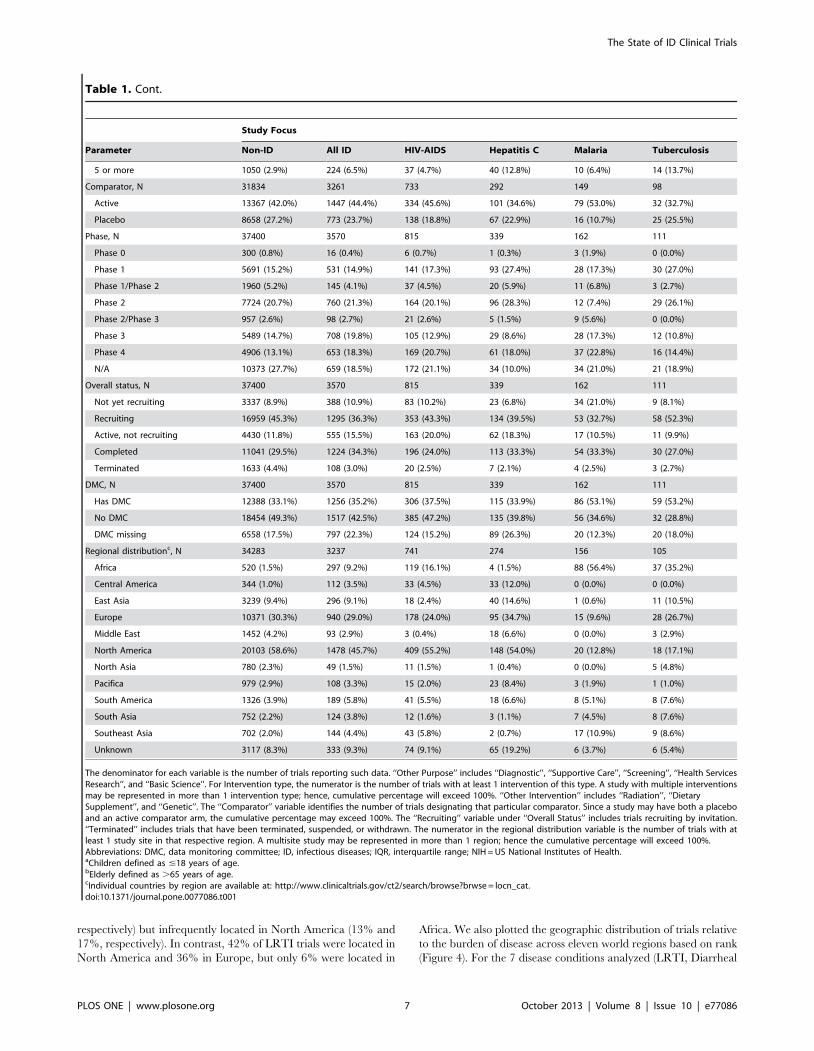
5 or more 1050 (2.9%) 224 (6.5%) 37 (4.7%) 40 (12.8%) 10 (6.4%) 14 (13.7%)
Comparator, N 31834 3261 733 292 149 98
Active 13367 (42.0%) 1447 (44.4%) 334 (45.6%) 101 (34.6%) 79 (53.0%) 32 (32.7%)
Placebo 8658 (27.2%) 773 (23.7%) 138 (18.8%) 67 (22.9%) 16 (10.7%) 25 (25.5%)
Phase, N 37400 3570 815 339 162 111
Phase 0 300 (0.8%) 16 (0.4%) 6 (0.7%) 1 (0.3%) 3 (1.9%) 0 (0.0%)
Phase 1 5691 (15.2%) 531 (14.9%) 141 (17.3%) 93 (27.4%) 28 (17.3%) 30 (27.0%)
Phase 1/Phase 2 1960 (5.2%) 145 (4.1%) 37 (4.5%) 20 (5.9%) 11 (6.8%) 3 (2.7%)
Phase 2 7724 (20.7%) 760 (21.3%) 164 (20.1%) 96 (28.3%) 12 (7.4%) 29 (26.1%)
Phase 2/Phase 3 957 (2.6%) 98 (2.7%) 21 (2.6%) 5 (1.5%) 9 (5.6%) 0 (0.0%)
Phase 3 5489 (14.7%) 708 (19.8%) 105 (12.9%) 29 (8.6%) 28 (17.3%) 12 (10.8%)
Phase 4 4906 (13.1%) 653 (18.3%) 169 (20.7%) 61 (18.0%) 37 (22.8%) 16 (14.4%)
N/A 10373 (27.7%) 659 (18.5%) 172 (21.1%) 34 (10.0%) 34 (21.0%) 21 (18.9%)
Overall status, N 37400 3570 815 339 162 111
Not yet recruiting 3337 (8.9%) 388 (10.9%) 83 (10.2%) 23 (6.8%) 34 (21.0%) 9 (8.1%)
Recruiting 16959 (45.3%) 1295 (36.3%) 353 (43.3%) 134 (39.5%) 53 (32.7%) 58 (52.3%)
Active, not recruiting 4430 (11.8%) 555 (15.5%) 163 (20.0%) 62 (18.3%) 17 (10.5%) 11 (9.9%)
Completed 11041 (29.5%) 1224 (34.3%) 196 (24.0%) 113 (33.3%) 54 (33.3%) 30 (27.0%)
Terminated 1633 (4.4%) 108 (3.0%) 20 (2.5%) 7 (2.1%) 4 (2.5%) 3 (2.7%)
DMC, N 37400 3570 815 339 162 111
Has DMC 12388 (33.1%) 1256 (35.2%) 306 (37.5%) 115 (33.9%) 86 (53.1%) 59 (53.2%)
No DMC 18454 (49.3%) 1517 (42.5%) 385 (47.2%) 135 (39.8%) 56 (34.6%) 32 (28.8%)
DMC missing 6558 (17.5%) 797 (22.3%) 124 (15.2%) 89 (26.3%) 20 (12.3%) 20 (18.0%)
Regional distributionc, N 34283 3237 741 274 156 105
Africa 520 (1.5%) 297 (9.2%) 119 (16.1%) 4 (1.5%) 88 (56.4%) 37 (35.2%)
Central America 344 (1.0%) 112 (3.5%) 33 (4.5%) 33 (12.0%) 0 (0.0%) 0 (0.0%)
East Asia 3239 (9.4%) 296 (9.1%) 18 (2.4%) 40 (14.6%) 1 (0.6%) 11 (10.5%)
Europe 10371 (30.3%) 940 (29.0%) 178 (24.0%) 95 (34.7%) 15 (9.6%) 28 (26.7%)
Middle East 1452 (4.2%) 93 (2.9%) 3 (0.4%) 18 (6.6%) 0 (0.0%) 3 (2.9%)
North America 20103 (58.6%) 1478 (45.7%) 409 (55.2%) 148 (54.0%) 20 (12.8%) 18 (17.1%)
North Asia 780 (2.3%) 49 (1.5%) 11 (1.5%) 1 (0.4%) 0 (0.0%) 5 (4.8%)
Pacifica 979 (2.9%) 108 (3.3%) 15 (2.0%) 23 (8.4%) 3 (1.9%) 1 (1.0%)
South America 1326 (3.9%) 189 (5.8%) 41 (5.5%) 18 (6.6%) 8 (5.1%) 8 (7.6%)
South Asia 752 (2.2%) 124 (3.8%) 12 (1.6%) 3 (1.1%) 7 (4.5%) 8 (7.6%)
Southeast Asia 702 (2.0%) 144 (4.4%) 43 (5.8%) 2 (0.7%) 17 (10.9%) 9 (8.6%)
Unknown 3117 (8.3%) 333 (9.3%) 74 (9.1%) 65 (19.2%) 6 (3.7%) 6 (5.4%)
The denominator for each variable is the number of trials reporting such data. ‘‘Other Purpose’’ includes ‘‘Diagnostic’’, ‘‘Supportive Care’’, ‘‘Screening’’, ‘‘Health ServicesResearch’’, and ‘‘Basic Science’’. For Intervention type, the numerator is the number of trials with at least 1 intervention of this type. A study with multiple interventionsmay be represented in more than 1 intervention type; hence, cumulative percentage will exceed 100%. ‘‘Other Intervention’’ includes ‘‘Radiation’’, ‘‘DietarySupplement’’, and ‘‘Genetic’’. The ‘‘Comparator’’ variable identifies the number of trials designating that particular comparator. Since a study may have both a placeboand an active comparator arm, the cumulative percentage may exceed 100%. The ‘‘Recruiting’’ variable under ‘‘Overall Status’’ includes trials recruiting by invitation.‘‘Terminated’’ includes trials that have been terminated, suspended, or withdrawn. The numerator in the regional distribution variable is the number of trials with atleast 1 study site in that respective region. A multisite study may be represented in more than 1 region; hence the cumulative percentage will exceed 100%.Abbreviations: DMC, data monitoring committee; ID, infectious diseases; IQR, interquartile range; NIH = US National Institutes of Health.aChildren defined as #18 years of age.bElderly defined as .65 years of age.cIndividual countries by region are available at: http://www.clinicaltrials.gov/ct2/search/browse?brwse = locn_cat.doi:10.1371/journal.pone.0077086.t001
The State of ID Clinical Trials
PLOS ONE | www.plosone.org 7 October 2013 | Volume 8 | Issue 10 | e77086
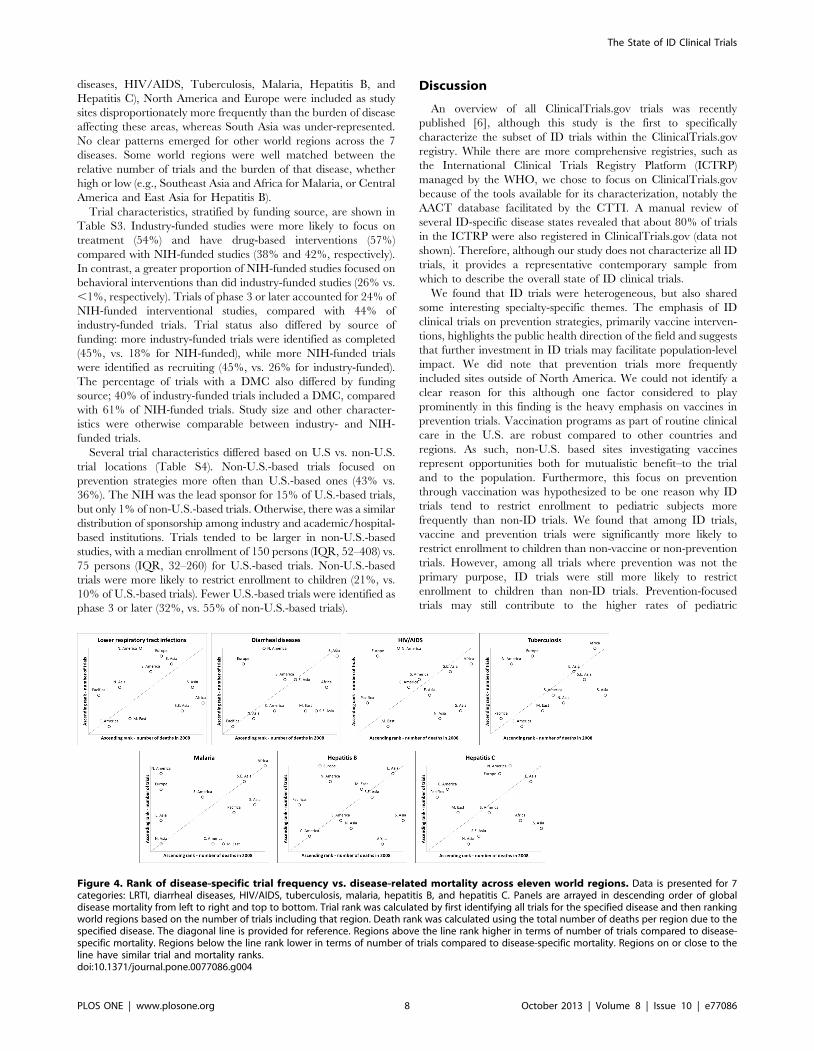
diseases, HIV/AIDS, Tuberculosis, Malaria, Hepatitis B, and
Hepatitis C), North America and Europe were included as study
sites disproportionately more frequently than the burden of disease
affecting these areas, whereas South Asia was under-represented.
No clear patterns emerged for other world regions across the 7
diseases. Some world regions were well matched between the
relative number of trials and the burden of that disease, whether
high or low (e.g., Southeast Asia and Africa for Malaria, or Central
America and East Asia for Hepatitis B).
Trial characteristics, stratified by funding source, are shown in
Table S3. Industry-funded studies were more likely to focus on
treatment (54%) and have drug-based interventions (57%)
compared with NIH-funded studies (38% and 42%, respectively).
In contrast, a greater proportion of NIH-funded studies focused on
behavioral interventions than did industry-funded studies (26% vs.
,1%, respectively). Trials of phase 3 or later accounted for 24% of
NIH-funded interventional studies, compared with 44% of
industry-funded trials. Trial status also differed by source of
funding: more industry-funded trials were identified as completed
(45%, vs. 18% for NIH-funded), while more NIH-funded trials
were identified as recruiting (45%, vs. 26% for industry-funded).
The percentage of trials with a DMC also differed by funding
source; 40% of industry-funded trials included a DMC, compared
with 61% of NIH-funded trials. Study size and other character-
istics were otherwise comparable between industry- and NIH-
funded trials.
Several trial characteristics differed based on U.S vs. non-U.S.
trial locations (Table S4). Non-U.S.-based trials focused on
prevention strategies more often than U.S.-based ones (43% vs.
36%). The NIH was the lead sponsor for 15% of U.S.-based trials,
but only 1% of non-U.S.-based trials. Otherwise, there was a similar
distribution of sponsorship among industry and academic/hospital-
based institutions. Trials tended to be larger in non-U.S.-based
studies, with a median enrollment of 150 persons (IQR, 52–408) vs.
75 persons (IQR, 32–260) for U.S.-based trials. Non-U.S.-based
trials were more likely to restrict enrollment to children (21%, vs.
10% of U.S.-based trials). Fewer U.S.-based trials were identified as
phase 3 or later (32%, vs. 55% of non-U.S.-based trials).
Discussion
An overview of all ClinicalTrials.gov trials was recently
published [6], although this study is the first to specifically
characterize the subset of ID trials within the ClinicalTrials.gov
registry. While there are more comprehensive registries, such as
the International Clinical Trials Registry Platform (ICTRP)
managed by the WHO, we chose to focus on ClinicalTrials.gov
because of the tools available for its characterization, notably the
AACT database facilitated by the CTTI. A manual review of
several ID-specific disease states revealed that about 80% of trials
in the ICTRP were also registered in ClinicalTrials.gov (data not
shown). Therefore, although our study does not characterize all ID
trials, it provides a representative contemporary sample from
which to describe the overall state of ID clinical trials.
We found that ID trials were heterogeneous, but also shared
some interesting specialty-specific themes. The emphasis of ID
clinical trials on prevention strategies, primarily vaccine interven-
tions, highlights the public health direction of the field and suggests
that further investment in ID trials may facilitate population-level
impact. We did note that prevention trials more frequently
included sites outside of North America. We could not identify a
clear reason for this although one factor considered to play
prominently in this finding is the heavy emphasis on vaccines in
prevention trials. Vaccination programs as part of routine clinical
care in the U.S. are robust compared to other countries and
regions. As such, non-U.S. based sites investigating vaccines
represent opportunities both for mutualistic benefit–to the trial
and to the population. Furthermore, this focus on prevention
through vaccination was hypothesized to be one reason why ID
trials tend to restrict enrollment to pediatric subjects more
frequently than non-ID trials. We found that among ID trials,
vaccine and prevention trials were significantly more likely to
restrict enrollment to children than non-vaccine or non-prevention
trials. However, among all trials where prevention was not the
primary purpose, ID trials were still more likely to restrict
enrollment to children than non-ID trials. Prevention-focused
trials may still contribute to the higher rates of pediatric
Figure 4. Rank of disease-specific trial frequency vs. disease-related mortality across eleven world regions. Data is presented for 7categories: LRTI, diarrheal diseases, HIV/AIDS, tuberculosis, malaria, hepatitis B, and hepatitis C. Panels are arrayed in descending order of globaldisease mortality from left to right and top to bottom. Trial rank was calculated by first identifying all trials for the specified disease and then rankingworld regions based on the number of trials including that region. Death rank was calculated using the total number of deaths per region due to thespecified disease. The diagonal line is provided for reference. Regions above the line rank higher in terms of number of trials compared to disease-specific mortality. Regions below the line rank lower in terms of number of trials compared to disease-specific mortality. Regions on or close to theline have similar trial and mortality ranks.doi:10.1371/journal.pone.0077086.g004
The State of ID Clinical Trials
PLOS ONE | www.plosone.org 8 October 2013 | Volume 8 | Issue 10 | e77086
enrollment, although there are likely to be other explanatory
factors such as the greater burden of infectious diseases carried by
children as compared with other chronic or non-communicable
diseases. Conversely, ID trials tended to exclude elderly subjects
more often than non-ID trials. This may again relate to the
disproportionate burden of communicable diseases affecting
children. However, this exclusion of the elderly was seen in ID
subcategories that do affect elderly persons with a disproportion-
ately high burden of morbidity and mortality. Careful consider-
ation should be given before excluding elderly subjects in future
study designs. We note that this analysis of the ClinicalTrials.gov
registry likely underestimates the prevalence of preventative
strategies, because the legal requirement for registration with
ClinicalTrials.gov exempts phase 1 trials, trials not involving a
drug, biologic, or device, and trials not under U.S. jurisdiction.
This applies not only to ID trials but likely extends to other trial
categories as well.
We also found that ID trials tended to be larger than trials in
other specialties, both in terms of median actual or anticipated
subject enrollment, and in representation of studies enrolling (actual
or anticipated) .10,000 subjects. Despite the larger median size of
ID studies, we observed considerable heterogeneity in this regard.
For example, the median size of 4 trachoma trials was 8438 subjects;
40 trials focusing on Haemophilus had a median enrollment of 600
subjects; and 111 trials focusing on STDs (excluding HIV) had a
median enrollment of 400 subjects. This contrasts with several other
subcategories with a concentration of small trials: the median size
for HIV-AIDS trials was 66 subjects; for HCV trials, 60 subjects.
Clinical trialists continue to face ongoing challenges with regard to
the ability to enroll adequate numbers of research participants [16],
but this issue is not universally applicable across the field of ID. We
cannot, however, determine whether differences in study size reflect
differences in prioritization, funding, or other resources. Though
these factors may be playing a role, it is also true that some diseases
and trials require fewer participants to meet the specified objectives
– scientific, epidemiological, statistical, or otherwise. This consid-
eration applies to different infectious diseases as well as to non-
infectious conditions. The results and methodology presented here
suggest an opportunity to consolidate clinical research efforts for
maximal impact.
This snapshot of ID clinical trials may also be useful for guiding
future funding and policy decision-making. In our review, we
found that frequency of particular ID trial subcategories did not
correlate directly with their global or U.S. health impact. For
example, although HIV-AIDS trials represented 23% of the ID
trials dataset, it accounts for 15% of global communicable disease-
related mortality and 9% of U.S. communicable disease-related
mortality (Figure 3). Trials focusing on hepatitis C also constituted
a larger percentage of the ID trials dataset than the estimated
global mortality. In contrast, LRTI studies made up only 6% of ID
studies, but LRTI ranks as the most common cause of global and
U.S. communicable disease-related deaths (28% and 45%,
respectively) [14,15]. Diarrheal diseases also contribute a signif-
icant burden of global communicable disease-related mortality
and disability [13–15] but were not substantially represented in the
ClinicalTrials.gov ID portfolio. This discrepancy is cited as one
reason for the failure to achieve Millennium Development Goals
to reduce childhood death due to diarrheal disease [17]. The
greatest discrepancy between representation in the ID trials
dataset and communicable disease-related mortality rates was
observed with the category of ‘‘High-Intensity Intestinal Nema-
tode Infections’’. This most prevalent of ID-related conditions
affects more than 150 million people worldwide annually [13];
however, only 12 such trials (,1%) were identified in the ID trials
dataset. Another common clinical problem, particularly in
economically developed nations, is prosthetic joint infection (PJI)
and osteomyelitis [18–20]. Although optimal treatment of PJI and
osteomyelitis is a common challenge for many ID practitioners, we
identified only 10 trials focusing on these infections.
The lack of correlation between diseases with high global
mortality and the number of clinical trials targeting these
infections was striking, and suggests a need for further emphasis
on research in high-mortality clinical syndromes. Even among
infections that cause high morbidity in the United States, such as
PJI and osteomyelitis, we found few trials focused on these
conditions in the ClinicalTrials.gov registry. The absence of
promising therapies may explain why trials for a particular disease
are under-represented, in which case future studies should
emphasize basic science and drug discovery. For example, the
relatively high prevalence of hepatitis C trials may be related to the
recent discovery of new protease inhibitor therapies.
Despite the significant value provided by the ID trials dataset in
this analysis, this resource has limitations. First, ClinicalTrials.gov
was primarily designed as a public repository for research trials and
was not intended to support aggregate analysis. Second, because the
methodology developed to annotate the ClinicalTrials.gov database
by clinical specialty relied on a group of experts drawn exclusively
from a single institution (Duke University), further validation would
be appropriate. Third, this analysis includes interventional trials for
which the FDA requires registration, which may introduce a bias
toward trials involving therapeutics rather than other intervention
strategies. However, publishers who have adopted the International
Committee of Medical Journal Editors’ Uniform Requirements
mandate registration of all interventional studies, regardless of
intervention type, phase, or location [4]. Despite the FDAAA
requirement to register all applicable interventional studies within
21 days of a study’s start, many fail to do so in a timely manner [21].
As a result, there are likely to be some trials begun within our
October 2007–September 2010 window that were not registered
and therefore are not included here.
Our analysis also excludes observational and other non-
interventional epidemiologic studies and thus we present a cross-
section of ID clinical trials, not a comprehensive review of all ID-
related clinical research. When study sponsors or investigators
register a clinical trial in ClinicalTrials.gov, not all fields are
mandatory. For example, registrants were not required to specify
whether a DMC was involved in the trial. This limits our
interpretation of the available data, given how frequently this
particular parameter was missing. It also suggests that Clinical-
Trials.gov may need to revise the list of mandatory fields so as to
provide a more robust assessment of a given clinical trial.
Another caveat to the interpretation of our findings is that the
number of trials or participants within a given disease area is not a
surrogate measure for resource investment. Some small trials may
indeed be very expensive and some large trials may be relatively
inexpensive. Unfortunately, ClinicalTrials.gov does not record
data on financial or resource expenditures. Furthermore, research
into some disease states may not require ClinicalTrials.gov
registration and would therefore appear to be underrepresented.
This includes health systems research such as implementation
research and quality improvement research.
Our analysis of ClinicalTrials.gov revealed that ID trials are
well-represented as a proportion of the overall clinical trials
enterprise, tend to be larger than non-ID trials, and have a greater
representation outside of the United States than do other
specialties. However, there is considerable variation across ID
trials, much of which reflects the heterogeneity of infectious
diseases themselves. Our analysis highlights discrepancies between
The State of ID Clinical Trials
PLOS ONE | www.plosone.org 9 October 2013 | Volume 8 | Issue 10 | e77086
the number and quality of trials in some disease states relative to
the global burden of those diseases, and may prompt examination
of how best to prioritize and coordinate research funding both
within and across national boundaries. Data generated from high-
quality clinical trials not only improves disease management but
also informs clinical practice guidelines. The results presented here
should inform improvements in clinical research methodology,
focus resources more deliberately, and serve as a launchpad for
establishing future clinical research priorities.
Supporting Information
Table S1 Characteristics of ID studies stratified byprimary purpose, October 2007–September 2010.(DOC)
Table S2 Frequency and percentage of ID trials basedon region and country.(DOCX)
Table S3 Infectious disease clinical trial attributes byfunding source: Industry, NIH, or Other.(DOCX)
Table S4 Infectious disease clinical trial attributes bystudy location: U.S., Non-U.S., and Both.(DOCX)
Appendix S1 List of ID Terms Used to Identify PotentialInfectious Disease Trials from the ClinicalTrials.govRegistry.
(DOC)
Diagram S1 PRISMA diagram.
(DOC)
Checklist S1 PRISMA checklist.
(DOC)
Acknowledgments
We are indebted to the fellows and faculty in the Duke University Division
of Infectious Diseases & International Health for their invaluable insight
and critical review of this manuscript, and to Drs. Mary Klotman and John
Perfect for facilitating our involvement in this study. We also thank
Jonathan McCall, MS, for providing editorial support. Mr. McCall is a
medical editor employed by the Duke Clinical Research Institute, Durham,
NC, and received no compensation for his efforts beyond his usual salary.
Author Contributions
Conceived and designed the experiments: NDG CDP ELT. Performed the
experiments: JRH KC AT. Analyzed the data: JRH KC AT. Wrote the
paper: NDG CDP ELT. Revised the manuscript for important intellectual
content: NDG CDP ELT JRH KC AT.
References
1. Lee DH, Vielemeyer O (2011) Analysis of overall level of evidence behind
Infectious Diseases Society of America practice guidelines. Arch Intern Med171: 18–22.
2. Khan AR, Khan S, Zimmerman V, Baddour LM, Tleyjeh IM (2010) Quality
and strength of evidence of the Infectious Diseases Society of America clinicalpractice guidelines. Clin Infect Dis 51: 1147–1156.
3. Johnson L, Stricker RB (2010) The Infectious Diseases Society of America Lymeguidelines: a cautionary tale about the development of clinical practice
guidelines. Philos Ethics Humanit Med 5: 9.
4. The International Committee of Medical Journal Editors. Uniform requirementsfor manuscripts submitted to biomedical journals: Obligation to register clinical
trials. Available: http://www.icmje.org/publishing_10register.html. Accessed 27Jul 2012.
5. Zarin DA, Tse T, Williams RJ, Califf RM, Ide NC (2011) The ClinicalTrials.govresults database–update and key issues. N Engl J Med 364: 852–860.
6. Califf RM, Zarin DA, Kramer JM, Sherman RE, Aberle LH, et al. (2012)
Characteristics of clinical trials registered in ClinicalTrials.gov, 2007–2010.JAMA 307: 1838–1847.
7. Zarin DA, Ide NC, Tse T, Harlan WR, West JC, et al. (2007) Issues in theregistration of clinical trials. JAMA 297: 2112–2120.
8. U.S. Food and Drug Administration website. Public Law 105–115. The Food
and Drug Administration Modernization Act. 2009. Available: http://www.fda.gov/RegulatoryInformation/Legislation/FederalFoodDrugandCosmeticActFDCAct/
SignificantAmendmentstotheFDCAct/FDAMA/FullTextofFDAMAlaw/default.htm. Ac-cessed 24 Jul 2012.
9. Gillen JE, Tse T, Ide NC, McCray AT (2004) Design, implementation andmanagement of a web-based data entry system for ClinicalTrials.gov. Stud
Health Technol Inform 107(Pt 2): 1466–1470.
10. Zarin DA, Tse T, Ide NC (2005) Trial registration at ClinicalTrials.gov betweenMay and October 2005. N Engl J Med 353: 2779–2787.
11. Clinical Trials Transformation Initiative website. AACT - Database foraggregate analysis of ClinicalTrials.gov. 2012. Clinical Trials Transformation
Initiative Web site. Available: https://www.ctti-clinicaltrials.org/project-topics/
clinical-trials.gov/aact-database. Accessed 24 Jul 2012.
12. Tasneem A, Aberle L, Ananth H, Chakraborty S, Chiswell K, et al. (2012) The
Database for Aggregate Analysis of ClinicalTrials.gov (AACT) and subsequent
regrouping by clinical specialty. PloS One 7: e33677.
13. Mathers CD, Fat DM, Boerma JT, World Health Organization (2008) The
global burden of disease: 2004 update. Geneva, Switzerland: World Health
Organization.
14. World Health Organization website. WHO Health Statistics and Health
Information Systems: Global Burden of Disease. Disease and injury country
estimates. 2011. Available: http://www.who.int/healthinfo/global_burden_
disease/estimates_country/en/index.html. Accessed 31 Oct 2012.
15. World Health Organization website. WHO Health Statistics and Health
Information Systems: Global Burden of Disease. Disease and injury regional
estimates. 2011. Available: http://www.who.int/healthinfo/global_burden_
disease/estimates_regional/en/index.html. Accessed 31 Oct 2012.
16. English R, Lebovitz Y, Griffin R, Forum on Drug Discovery, Development, and
Translation. Transforming Clinical Research in the United States: Challenges
and Opportunities: Workshop Summary. Washington, DC: The National
Academies Press; 2010. Available: http://www.nap.edu/catalog.php?record_
id = 12900. Accessed 28 Aug 2012.
17. Wazny K, Zipursky A, Black R, Curtis V, Duggan C, et al. (2013) Setting
research priorities to reduce mortality and morbidity of childhood diarrhoeal
disease in the next 15 years. PLoS Med 10(5): e1001446.
18. Kurtz S, Ong K, Lau E, Mowat F, Halpern M (2007) Projections of primary and
revision hip and knee arthroplasty in the United States from 2005 to 2030.
J Bone Joint Surg Am 89: 780–785.
19. Widmer AF (2001) New developments in diagnosis and treatment of infection in
orthopedic implants. Clin Infect Dis (Suppl 2): S94–S106.
20. Darouiche RO (2004) Treatment of infections associated with surgical implants.
N Engl J Med 350: 1422–1429.
21. Gill CJ (2012) How often do US-based human subjects research studies register
on time, and how often do they post their results? A statistical analysis of the
Clinicaltrials.gov database. BMJ Open 2: e001186.
The State of ID Clinical Trials
PLOS ONE | www.plosone.org 10 October 2013 | Volume 8 | Issue 10 | e77086