Embed Size (px)
Citation preview

The State of Mississippi’s Economy
November 13, 2008
Oktibbeha County Leadership Development


Per Capita Income
$38,564
$19,477
$28,527
$13,089
$0
$5,000
$10,000
$15,000
$20,000
$25,000
$30,000
$35,000
$40,000
$45,000
1990 1991 1992 1993 1994 1995 1996 1997 1998 1999 2000 2001 2002 2003 2004 2005 2006 2007
US MS
Source: U.S. Bureau of Economic Analysis

Non-Farm Monthly Employment Growth
0
1
2
3
4
5
6
7
Ind
ex
19
39
= 1
00
US MS
Source: U.S. Bureau of Labor Statistics and IHL Calculations

Mississippi Employment by Major Industry, 1990 - 2008
150
200
250
300
350
400
450
1990 1991 1992 1993 1994 1995 1996 1997 1998 1999 2000 2001 2002 2003 2004 2005 2006 2007 2008
Th
ou
san
ds
of
Job
s
MFG Trade, Trans. & Utilities Services Gov.
Source: U.S. Bureau of Labor Statistics

Goods Producing Verses Service Producing Jobs in MS
0
100
200
300
400
500
600
700
800
900
1000
Th
ou
san
ds
1990 1991 1992 1993 1994 1995 1996 1997 1998 1999 2000 2001 2002 2003 2004 2005 2006 2007
Goods Services
Source: U.S. Bureau of Labor Statistics

Mississippi 14.7%United States 10.1%
Less than 10%
10% to 20%
20% and Above
No Manufacturing
Manufacturing Employment as a Percentage of Total Employment, 2007
0.0%
Issaquena
0.0%Jefferson 0.9%
Jeff. Davis
1.5%
Tunica
2.1%Sharkey
3.6%Simpson
3.8%
Montgomery
3.8%Tallahatchie
3.9%
Hinds4.3%
Claiborne
4.3%
Greene
5.1%Harrison
5.5%
Neshoba
5.6%George
6.0%
Franklin
6.3%Adams
6.7%
Forrest
7.0%Pearl River
7.4%
Rankin
7.5%Lamar
7.8%Oktibbeha
8.3%Hancock
8.8%
Quitman
8.9%Lafayette
9.0%
Wilkinson
9.0%
Coahoma
9.3%
Lincoln
9.9%Sunflower
10.1%
Washington
10.1%
Lauderdale
10.6%Yazoo
11.7%De Soto
12.8%Marion
13.8%
Tate
13.8%Stone
14.1%Bolivar
14.6%
Marshall
15.3%
Lowndes
16.7%
Carroll16.8%
Choctaw
17.4%
Wayne
17.6%
Pike
17.9%
Warren
18.4%Madison
18.6%
Panola
18.7%Leflore
18.8%
Holmes19.1%Attala
20.4%Yalobusha
20.6%
Clarke
21.6%Webster
21.9%
Benton
22.0%
Alcorn
23.5%Humphreys
24.3%Lee
24.7%
Newton
25.2%
Walthall
25.3%
Lawrence
25.4%
Kemper
25.8%Calhoun
26.0%
Covington
26.5%Copiah
27.3%Jones
27.4%Itawamba
27.9%
Leake
28.3%Monroe29.1%
Grenada
29.1%Union
29.2%Jackson
30.2%
Winston
31.1%Perry
31.5%Clay
31.6%
Jasper
32.1%Prentiss
33.6%
Amite
37.2%Tishomingo
37.6%
Noxubee
37.8%
Smith
38.3%
Tippah
44.7%
Scott
47.9%Chickasaw
58.8%Pontotoc

Mississippi Non-Farm Earnings By Major Source, 2007
$13,371
$9,416
$8,562
$5,515
$5,017
$3,384
$2,755
$2,712
$1,680
$1,460
$433
$826
$0 $2,000 $4,000 $6,000 $8,000 $10,000 $12,000 $14,000 $16,000
Government
Trade, Transportation and Utilities
Manufacturing
Health Care and Social Assistance
Professional and Business Services
Construction
FInancial Activities
Leisure and Hospitality
Other Services
Natural Resources and Mining
Information
Educational services
Millions of $
0.8%
1.5%
2.6%
3.0%
4.9%
5.0%
6.1%
9.1%
15.5%
17.1%
10.0%
Percentages represent share of total in 2007
MS Total Nonfarm Earnings in 2007, was $55.1 Billion
Source: U.S. Bureau of Economic Analysis
24.3%

Mississippi Retail SalesThree Month Moving Average
$2,300
$3,300
$4,300
$5,300
$6,300
$7,300
$8,300
$9,300
$10,300
$11,300
$12,300
Mill
ion
s o
f 2
00
4 $
Source: Mississippi Tax Commission and IHL Calculations

Mississippi Retail SalesJan. – July, 2005 VS. 2008
Loss
0.0% to 15.0%
Between 15% and 25%
Greater than 25%
Source: Mississippi Tax Commission
Mississippi 19.0%
Hancock
-31.4%
Issaquena
-27.9%
Quitman
-20.5%Choctaw
-15.1%
Benton
-10.6%
Montgomery
-8.8%Yalobusha
-8.4%Coahoma
-7.7%Claiborne
-3.8%
Newton
-3.2%Humphreys
-1.9%Tunica
-1.1%
Tishomingo
-0.9%Attala
-0.4%Webster
2.1%
Washington
2.2%Grenada
3.6%Simpson
4.1%Chickasaw
4.5%Tate
4.6%
Marshall
4.9%
Jeff. Davis
6.2%
Wayne
7.3%
Winston
8.2%Lee
9.2%
Monroe
10.5%Perry
10.6%
Kemper
10.6%Oktibbeha
10.9%
Lowndes
11.2%
Leflore
11.2%
Alcorn11.9%
De Soto
12.3%Yazoo
12.7%
Hinds
13.2%
Clay13.6%
Sunflower
13.7%
Lauderdale
13.9%
Noxubee
14.0%
Pike
14.2%Calhoun
15.2%Panola
15.4%
Lincoln
16.1%Bolivar
16.2%
Scott16.7%
Rankin
17.2%
Madison
17.2%
Leake
17.2%Sharkey
17.3%
Smith
17.6%
George
19.9%
Wilkinson
21.0%
Neshoba
21.5%
Greene
21.6%Prentiss
21.8%
Holmes
23.0%
Lafayette
23.5%Marion
24.0%
Warren
24.3%Covington
24.8%
Amite
25.1%Franklin
26.4%Lawrence
27.5%Itawamba
27.7%
Tippah
27.9%
Carroll
29.4%Harrison
31.0%
Stone
33.4%Lamar
33.8%Jones
37.6%Jefferson
38.9%Adams
39.5%
Forrest
41.3%Copiah
43.7%
Pontotoc
48.9%
Pearl River
52.4%
Jackson
59.2%Union
70.1%
Clarke
72.1%
101.1%
Walthall
135.1%
Jasper
174.0%Tallahatchie

Retail Sales Pull Factor, 2006
Less than 0.50
0.51 to .75
.75 to 1.00
1.00 and over
Source: Mississippi Tax Commission and IHL Calculations
0.19Carroll
0.24Benton
0.27Amite
0.29Tallahatchie
0.30Issaquena
0.31Kemper
0.33Lawrence
0.33Franklin
0.34Quitman
0.36Clarke
0.37Jefferson
0.38Yalobusha
0.38Greene
0.40Choctaw
0.41Holmes
0.41Walthall
0.44Calhoun
0.44Perry
0.45Marshall
0.45Smith0.46
Claiborne
0.46Webster
0.47Noxubee
0.48Itawamba
0.49Tippah
0.50Wilkinson
0.51Jeff. Davis
0.52Newton
0.53Yazoo
0.54Copiah
0.54Clay
0.54Pontotoc
0.55Sunflower
0.55Jasper
0.56Monroe
0.57Sharkey
0.58Tate
0.59Chickasaw
0.60Humphreys
0.62Leake
0.62Prentiss0.63
Union
0.64Montgomery
0.65Simpson
0.67Hancock
0.70Winston
0.70Coahoma
0.71Attala
0.71Scott
0.73Bolivar
0.76Covington
0.80Neshoba
0.81George
0.82Oktibbeha
0.82Lafayette
0.83Warren
0.84Madison
0.85Stone0.89
Pearl River0.90
Jackson
0.90Panola
0.90Leflore
0.93De Soto
0.94Wayne
0.95Washington
0.98Alcorn
1.02Lowndes
1.02Hinds
1.07Marion
1.07Adams
1.08Jones
1.08Lauderdale
1.12Lincoln
1.12Rankin
1.16Pike
1.18Grenada
1.25Lee
1.31Forrest
1.46Harrison
1.48Lamar
2.17Tunica
0.63Tishomingo

Mississippi Average Fall Enrollment by Grade, 1995-2005
41,695
26,003
28,836
34,278
40,425
37,865
40,071
38,603
38,616
38,864
38,846
39,275
20,000
25,000
30,000
35,000
40,000
45,000
50,000
1stGrade
2ndGrade
3rdGrade
4thGrade
5thGrade
6thGrade
7thGrade
8thGrade
9thGrade
10thGrade
11thGrade
12thGrade
Fa
ll S
tud
en
t E
nro
llme
nt
Average Number of Births 6 Years Prior to 1st Grade 42,353
Average Number of “Traditional” Graduates 23,722
On average, for the last 10 school years,about 41,700 students entered 9th grade, yetonly 26,000 enrolled in the 12th grade. Evenless graduated with a traditional H.S.diploma. What happens each year to lose those 15,700+ students?
Source: Annual Reports of the State Superintendent of Public Education

Public SchoolAchievementLevel Index
Mississippi 426
0 -199 level 1200-299 level 2300-399 level 3400-499 level 4500-600 level 5
242Quitman
275Amite
278Jefferson
280Tallahatchie
289Holmes
294Issaquena
294Sharkey
304Jefferson Davis
311Marshall313
Tunica
322Sunflower
326Humphreys
327Carroll
328Coahoma
331Adams
349Panola
349Yazoo
356Noxubee
356Kemper
359Leflore
368Copiah
368Walthall
375Clay
376Simpson
376Wilkinson
376Franklin
380Oktibbeha
380Jasper
381Chickasaw
386Warren
386Winston
389Washington
389Bolivar
393Hinds
394Benton
396Calhoun
399Pike
400Lowndes401
Choctaw
402Scott
403Marion
407Covington
412Leake
416Smith
419Tate
420Neshoba
422Stone
423Monroe
424Lauderdale
427Clarke
429George
432Lawrence
437Pearl River
440Montgomery
441Lincoln 443
Forrest
443Wayne
444Jones
444Alcorn
445Greene
453Itawamba
454Yalobusha
455Perry
456Attala
456Webster
460Hancock
464Madison
465Lee
465Grenada
472Lafayette
475Tippah
480Prentiss
481Rankin
482Newton
485Jackson
491De Soto
493Harrison
498Claiborne
504Tishomingo
508Lamar
511Pontotoc
512Union
0 to 300300 to 400400 to 500500 to 600


Mississippi BirthsSource: MS Department of Health Annual Reports
41332 40978 4152742917 42678
44075
42227 4151142321 42809 42327
46046
18744 18458 18853 19500 19603 20272 19590 19556 1989020684 20908
24323
7319 7068 6932 6978 6845 6787 6231 5925 5670 5726 56336619
0
5000
10000
15000
20000
25000
30000
35000
40000
45000
50000
1995 1996 1997 1998 1999 2000 2001 2002 2003 2004 2005 2006
Births Single Mother Births Single Teen Mother Births
45.3% 47.1%45.9%45.4%45.4%45.0% 46.4%46.0%
30.3%31.8%33.5%34.9%35.8%36.8%38.3%39.0
%
Percentage of births to single mothers
Percentage of single mother births to single teen mothers
48.3%47.0%
27.7%28.5%
49.4%
26.9%
52.8%
27.2%

Workforce Participation by Educational Attainment Mississippians 25-64 Years of Age, 2005
56.9%
72.2%
78.8%84.5%
0.0%
10.0%
20.0%
30.0%
40.0%
50.0%
60.0%
70.0%
80.0%
90.0%
H.S.Dropout
H.S.Diploma
SomeCollege orAA Degree
Bachelor'sDegree or
Higher
Source: U.S. Census, American Community Survey

Unemployment Rateby Educational Attainment Mississippians 25-64 Years of Age, 2005
12.6%
7.5%
5.6%
2.9%
0.0%
2.0%
4.0%
6.0%
8.0%
10.0%
12.0%
14.0%
H.S.Dropout
H.S.Diploma
SomeCollege orAA Degree
Bachelor'sDegree or
Higher
Source: U.S. Census, American Community Survey

Median Annual Earningsby Educational Attainment Mississippians 25-64 Years of Age, 2005
$16,966
$21,631
$26,160
$44,275
$0
$5,000
$10,000
$15,000
$20,000
$25,000
$30,000
$35,000
$40,000
$45,000
H.S.Dropout
H.S.Diploma
SomeCollege orAA Degree
Bachelor'sDegree or
Higher
Source: U.S. Census, American Community Survey

Mississippi Medicaid Program Analysis by Educational Attainment
44.09%
29.33%
3.05%4.34%
10.62%10.56%
12.94%
263,976
167,878
92,541
42,711
18,21112,210
3,3560%
5%
10%
15%
20%
25%
30%
35%
40%
45%
50%
Children Dropouts High SchoolDiploma
SomeCollege butno degree
AssociatesDegree
BachelorsDegree
Masters orhigherDegree
Pro
bab
liit
y o
f R
eceiv
ing
Med
icaid
Ben
efi
ts
0
50,000
100,000
150,000
200,000
250,000
300,000
Nu
mb
er
of
Med
icaid
Ben
efi
cia
ries
High School Dropouts are approximately 18% of Mississippi's Population, but they have a higher probability ( 29%) of receiving Medicaid benefits.There are an estimated 167,878 high school dropouts on Medicaid in Mississippi.

Mississippi Male Incarceration Ratesby Educational Attainment
2.39%
0.99%
0.73%
0.17%
0.00%
0.50%
1.00%
1.50%
2.00%
2.50%
H.S.Dropout
H.S.Diploma
SomeCollege orAA Degree
Bachelor'sDegree or
Higher
Source: Calculated for 2000 Census and US Department of Justice Data

Investing in Education
Some Graduate orHigh School College or Bachelor's Professional
Costs Dropout Diploma AA Degree Degree DegreeK-12 Education Cost 44,014$ 52,702$ 52,702$ 52,702$ 52,702$ Medicaid & Incarceration 38,712$ 19,766$ 17,595$ 6,497$ 5,775$ School Cost Beyond H.S. 8,612$ 24,120$ 37,520$ Total Cost to State 82,726$ 72,468$ 78,909$ 83,319$ 95,997$
Tax Returns to the State 59,097$ 87,412$ 117,696$ 177,445$ 229,810$
Net Returns to the State (23,629)$ 14,944$ 38,787$ 94,126$ 133,813$
Returns Per $1 Invested 0.71$ 1.21$ 1.49$ 2.13$ 2.39$
Source: Calculations by IHL based on Appropriations data for 2005
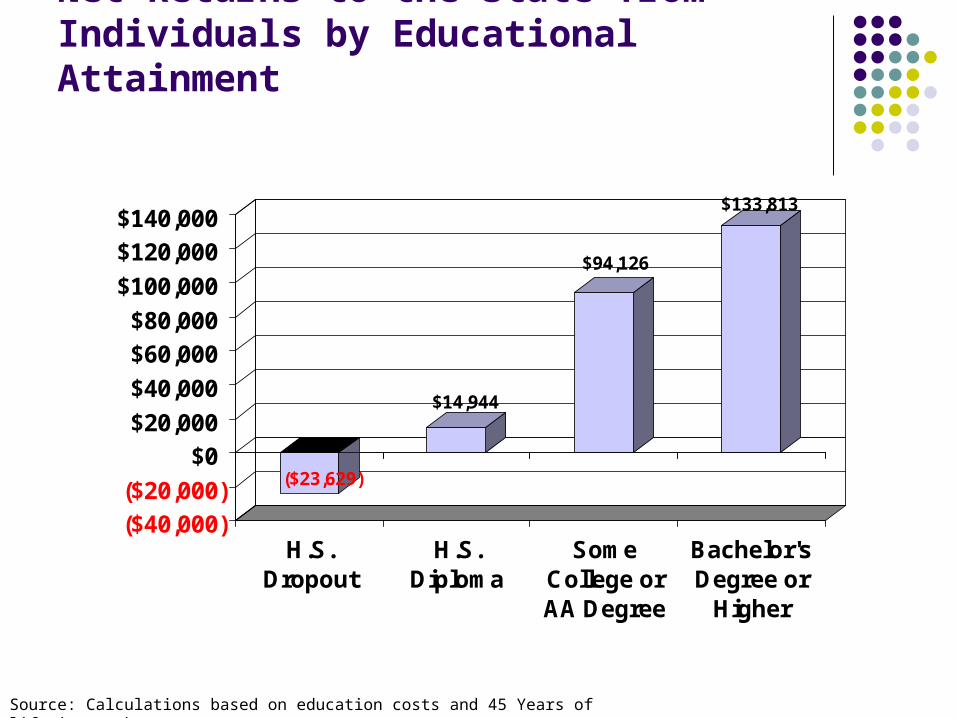
Net Returns to the State from Individuals by Educational Attainment
($23,629)
$14,944
$94,126
$133,813
($40,000)
($20,000)
$0
$20,000
$40,000
$60,000
$80,000
$100,000
$120,000
$140,000
H.S.Dropout
H.S.Diploma
SomeCollege orAA Degree
Bachelor'sDegree or
Higher
Source: Calculations based on education costs and 45 Years of lifetime work.

State Public Lifetime Costs and Benefits to Mississippi by Educational Attainment of Individuals
Source: Calcuations based on 2005 Annual Median Earnings, Education and Other Costs
$40,000
$60,000
$80,000
$100,000
$120,000
$140,000
$160,000
$180,000
$200,000
$220,000
$240,000
H.S. Dropout H.S. Diploma Some College or AAdegree
B.S. Degree Graduate or Professional
State Lifetime Public Costs for 45 years State Lifetime Public Benefits over 45 years
% of MS Adults in each group
21.55 % 32.03 % 27.75 % 12.15 % 6.52 %
For each $ invested in education, the simple return to the state by education attainment is
$0.71 $1.21
$1.49 $2.13 $2.39