Embed Size (px)
Citation preview
The State of SaaS Sprawl in 2021CHALLENGES OF A DISTRIBUTED WORKFORCE
AND LARGE APP PORTFOLIO

‘SaaS sprawl’ — you’ve heard the phrase a dozen times by now, but it doesn’t seem significant in the context of
your critical IT priorities. You know what your cloud technology stack looks like (for the most part). You feel fairly
confident about your level of visibility into governance and application usage. That’s good enough, right?
The truth is many businesses have a much larger blind spot than they realize when it comes to SaaS apps.
More and more business units are independently purchasing app subscriptions or downloading freemium
tools. That’s great for employee productivity in the short term, but it can create new challenges for the IT teams
tasked with managing the SaaS portfolio and ensuring governance.
Every SaaS purchase outside of IT has the potential to expand your security risk surface and create
fragmentation that prevents your employees from doing their best work. More tools means greater opportunity
for users to work in silos without a clear view of interdependencies. SaaS sprawl also drastically impacts your
business spend, whether you see the bill or not. Having many team-owned tools can lead to unregulated SaaS
budgets and an increased cost of ownership due to situations like missed renewals.
To understand the current state of SaaS sprawl, we looked at an anonymized subset of Productiv data across
hundreds of instances and tens of thousands of SaaS apps. The results offer a clear picture of how
decentralized SaaS management is affecting businesses both large and small across app visibility, employee
productivity, and risk governance.
SaaS sprawl is a big deal
The truth is many businesses have a The truth is many businesses have a much larger blind spot than they realize much larger blind spot than they realize when it comes to SaaS apps. when it comes to SaaS apps.
02

03
Key takeawaysHIGHLIGHTS
Shadow IT is growing across the board, but most prevalent among
high-growth businesses.
The number of apps not owned or managed by IT grew by 4 percentage points (from 52%
to 56%) on average in the last year. Small organizations have the highest percentage of
Shadow IT, likely due to having younger and fast-evolving SaaS portfolios.
Most departments now have 40-60 tools each, with 200+ apps at the
company level.
Departments related to Security, IT, and product development had the highest average
number of tools. In addition, analysis of app categories revealed significant overlap across
critical functions such as messaging and file storage that often leads to fragmentation and
collaboration breakdowns.
Average percentage of engaged users across all apps is 45%.
We measured how employees are engaging with apps at the feature level (which is more
accurate than using login data), and found average engagement to be low. This implies
companies are having trouble aligning licensing to how employees are using tools. Apps
purchased outside of IT have a higher engagement rate, suggesting employees are finding
more value in the tools they select for themselves.
The majority of apps have 3 or fewer security certifications, and Shadow
IT is typically less compliant.
Our analysis found 83% of tools were compliant with less than half of the 7 most common
certifications. Shadow IT had fewer certifications on average compared to apps managed by
IT, reinforcing the need for IT to be made aware of all tools in the company’s SaaS portfolio.
Nearly 70% of apps managed by IT are behind SSO.
SSO is a key tool organizations are using to provide governance and access control, and
more than half of all IT-managed apps are behind SSO. Enterprises have the highest SSO
coverage across their apps, which may be the result of more robust security protocols.
04
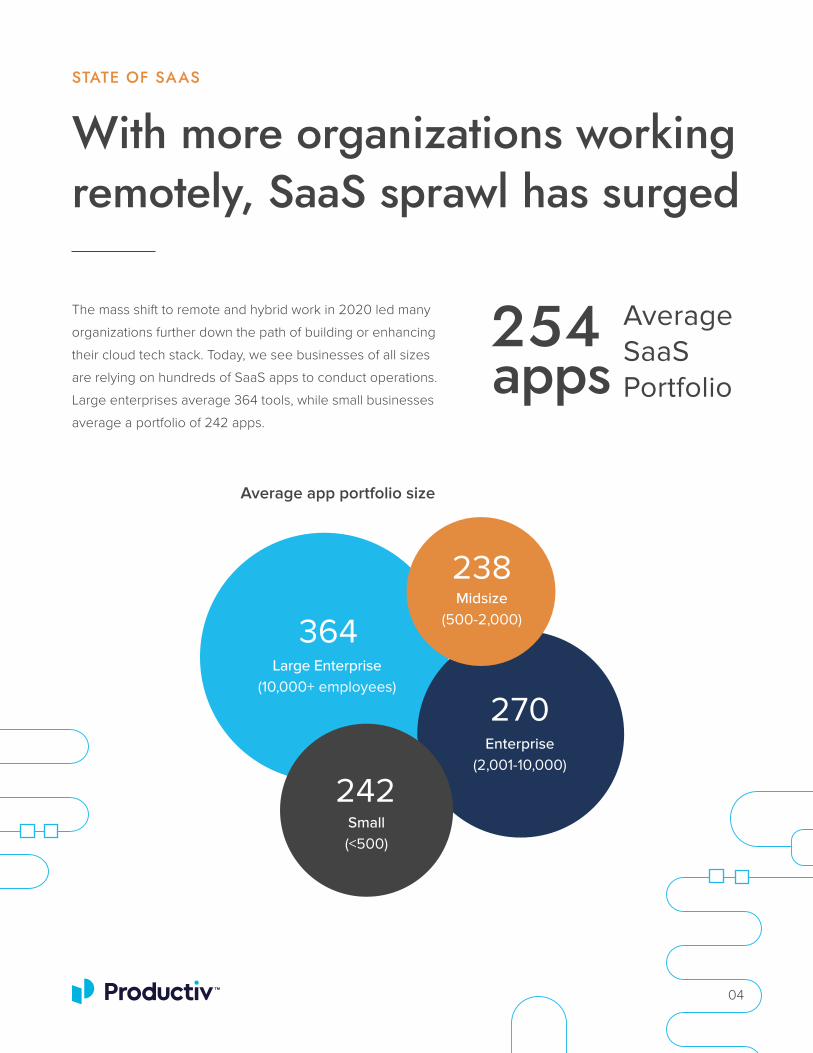
With more organizations working remotely, SaaS sprawl has surged
STATE OF SAAS
The mass shift to remote and hybrid work in 2020 led many
organizations further down the path of building or enhancing
their cloud tech stack. Today, we see businesses of all sizes
are relying on hundreds of SaaS apps to conduct operations.
Large enterprises average 364 tools, while small businesses
average a portfolio of 242 apps.
Average app portfolio size
appsAverage SaaS Portfolio
254
364Large Enterprise
(10,000+ employees)
270Enterprise
(2,001-10,000)
242Small (<500)
238Midsize
(500-2,000)
STATE OF SAAS
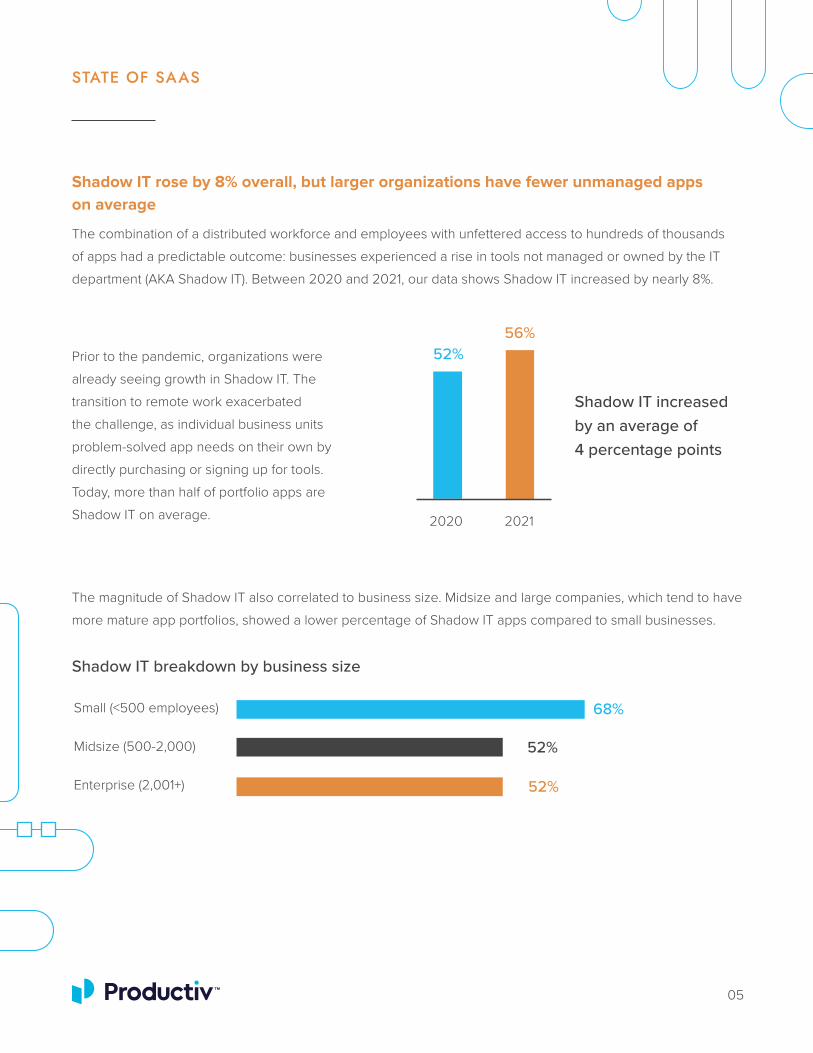
68%
52%
52%
Shadow IT breakdown by business size
Small (<500 employees)
Midsize (500-2,000)
Enterprise (2,001+)
Shadow IT increased by an average of 4 percentage points
Shadow IT rose by 8% overall, but larger organizations have fewer unmanaged apps
on average
The combination of a distributed workforce and employees with unfettered access to hundreds of thousands
of apps had a predictable outcome: businesses experienced a rise in tools not managed or owned by the IT
department (AKA Shadow IT). Between 2020 and 2021, our data shows Shadow IT increased by nearly 8%.
The magnitude of Shadow IT also correlated to business size. Midsize and large companies, which tend to have
more mature app portfolios, showed a lower percentage of Shadow IT apps compared to small businesses.
Prior to the pandemic, organizations were
already seeing growth in Shadow IT. The
transition to remote work exacerbated
the challenge, as individual business units
problem-solved app needs on their own by
directly purchasing or signing up for tools.
Today, more than half of portfolio apps are
Shadow IT on average.
05
2020 2021
52%56%

06
APP CATEGORIES
Having too many apps may hinder productivity
SaaS sprawl is not confined to specific types of apps, either — it’s occurring across the organization. We
analyzed 107 categories of apps and found that organizations typically had 17 categories with 5 or more tools.
Our data shows on average businesses have 5 or more apps in critical categories like project management,
sharing & storage, and messaging. These numbers are concerning, as having too many apps with similar
functionality can create fragmentation and be detrimental to employee productivity. For example, the average
number of project management tools is 8.9. As a result, project oversight efforts may be too scattered for those
apps to deliver on their potential value. Furthermore, this trend is likely to keep rising as business units and
individuals purchase more apps independent of IT.
Security & Compliance
Bottom QuartileRank & Category Top QuartileAverage # of Apps
Learning Apps
Meeting & Organizing
Sharing & Storage
1
3
6
8
Project Management
Recruitment
Spreadsheet & Presentation
Customer Experience
Messaging
Identity & Access Management
2
5
4
7
9
10
Top 10 categories with the highest average number of apps
5 22
4 118.9
2.5 9.58.5
2 97.2
4 87.1
2 86.2
3 65.8
5.83 8
3 65
53
15.5

07
APP ENGAGEMENT
Despite growing app portfolios, engagement remains low
But are employees actually leveraging all of the tools at their fingertips? The data tells us otherwise. We measured
how employees were engaging with apps by evaluating feature-level usage on a monthly basis (across all tools, for
every employee with a license).
Our analysis puts average app engagement at 45%. In other words, less than half of the app licenses in an
organization’s portfolio are being utilized on a regular basis. This means many companies are facing issues around
license forecasting or tool adoption.
What’s particularly interesting is that tools purchased outside of IT have a higher average percentage of
engagement, at 54%. The data indicates employees are finding more value in tools purchased by their business unit
compared to apps managed and provisioned by IT.
App engagement: Managed vs Shadow IT
All Apps Shadow IT All Managed Apps (Owned by IT)
45% 54% 40%

APP ENGAGEMENT
08
Larger businesses have lower app engagement on average
Looking at app engagement by business size, we discovered that larger organizations typically have lower app
usage compared to midsize and small organizations. As we saw earlier, small businesses tend to have lighter
SaaS portfolios and a higher percentage of Shadow IT. These factors help explain why small organizations have
a higher average engagement rate.
However, a more detailed look at app engagement
among enterprises shows an interesting contrast
between Managed Apps and Shadow IT. Through
this lens, we again find that Shadow IT apps have
a significantly higher engagement rate on average
compared to tools owned and managed by IT. Use
of Shadow IT apps is 14 percentage points higher
than those of Managed Apps.
49%
43%
39%
App engagement by business size
Small (<500 employees)
Midsize (500-2,000)
Enterprise (2,001+)
Enterprise app engagement 14 percentage points higher among Shadow IT
Managed Apps
Shadow IT
34%
48%

09
SAAS USE BY TEAM
Teams are using dozens of apps on average
How is SaaS sprawl distributed across different departments? Our findings show that the majority of teams have
between 40 and 60 apps, with a few outliers.
The top three departments with the highest number of tools were 1) Security, 2) Engineering, and 3) IT. In
the case of Security and IT, these departments often have a high number of lower-touch tools that run in the
background. Organizations of all sizes are prioritizing data protection and minimizing security risks, and many
tools in this category are built for a very specific purpose.
Departments like HR and Marketing tend to use software suites with multiple modules such as Workday and
Marketo. Therefore, it makes sense to see those teams at the lower end of the spectrum. The low averages
for Finance and Legal departments may be due to smaller department sizes. Alternatively, that type of work is
sometimes subcontracted out to a third party, which could also explain their position in the ranking.
Average Number of Apps
78
39
Se
curi
ty
77
En
gin
ee
rin
g
61
IT
58
Pro
du
ct M
an
ag
me
nt
58
Sa
les
56
Pro
du
ct
52
Cu
sto
me
r S
ucc
ess
52
Sa
les
Op
era
tio
ns
49
Pro
du
ct M
ark
eti
ng
48
Acc
ou
nti
ng
44
HR
44
Ma
rke
tin
g
44
Op
era
tio
ns
40
Fin
an
ce
Leg
al

10
FUNCTION-SPECIFIC APPS
Key cross-functional apps dominate
Although most teams now have access to dozens of apps, a few tools stand out as the most popular
cross-functional apps. Unsurprisingly, these include the two largest general business suites with email clients
(Microsoft Office 365 and Google Workspace) as well as leading collaboration tools Slack and Zoom.
The presence of Salesforce and Okta suggests those tools have also become top-tier choices in their
respective markets.
What’s interesting is the breakdown of top function-specific apps across individual departments. We looked at
15 departments and saw the same tools being used in multiple teams. For example, Zendesk appeared as a
top app for 4 departments: Security, Engineering, IT, and Customer Success.
The data shows us that teams are purchasing more tools than ever before, and yet the list of most popular
function-specific apps shows significant overlap. These tools are likely essential for cross-department
collaboration. If departments used different tools in these instances, organizations would experience greater
fragmentation and employees would be less productive.
MOST POPULAR CROSS-FUNCTIONAL APPS

FUNCTION-SPECIFIC APPS
11
Security
KEY FUNCTION-SPECIFIC APPS
Engineering
IT
Product Mgmt
Sales
Product
Customer Success
Sales Operations
Product Mktg
Accounting
HR
Marketing
Operations
Finance
Legal
DEPARTMENT

COMPLIANCE
Differences in compliance rates reveal mixed app security frameworks
12
Percentage of compliance certifications
12%
17%
17%
16%
14%
12%
5%
8%
0
1
2
3
4
5
6
7
Num
ber o
f cer
tifica
tions
So you likely have hundreds of apps in your portfolio, and Shadow IT is
flourishing. How does that affect your security risk surface? To find out,
we analyzed compliance across 7 certifications:
Of the apps we looked at, 83% had 3 or fewer security and compliance certificates. IT leaders may be making
security and compliance a key priority as data grows more distributed, but our analysis reveals that many apps
still may not meet industry compliance standards.
12% of apps have no certifications, and FISMA has the lowest compliance of all
certifications
In addition to discovering the vast majority of apps had a maximum of 3 certifications, we were also surprised to find
that 12% of tools had zero compliance certifications published. The most common number of certifications was 1 or 2,
with 17% of apps compliant with those quantities of certifications.
• CCPA
• FedRAMP
• FISMA
• GDPR
of apps3 or fewer certifications
83%• ISO27001
• SOC2
• Swiss-US
Privacy Shield
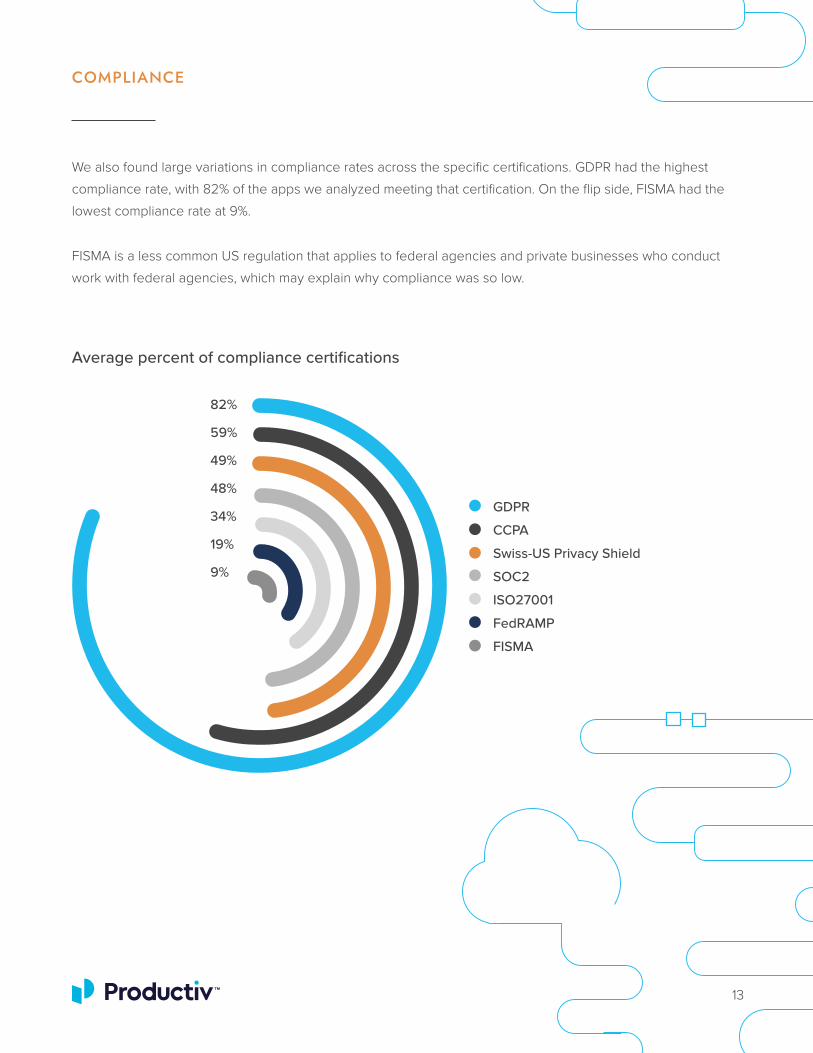
We also found large variations in compliance rates across the specific certifications. GDPR had the highest
compliance rate, with 82% of the apps we analyzed meeting that certification. On the flip side, FISMA had the
lowest compliance rate at 9%.
FISMA is a less common US regulation that applies to federal agencies and private businesses who conduct
work with federal agencies, which may explain why compliance was so low.
Average percent of compliance certifications
COMPLIANCE
13
82%
59%
49%
48%
34%
19%
9%
GDPR
CCPA
Swiss-US Privacy Shield
SOC2
ISO27001
FedRAMP
FISMA
14
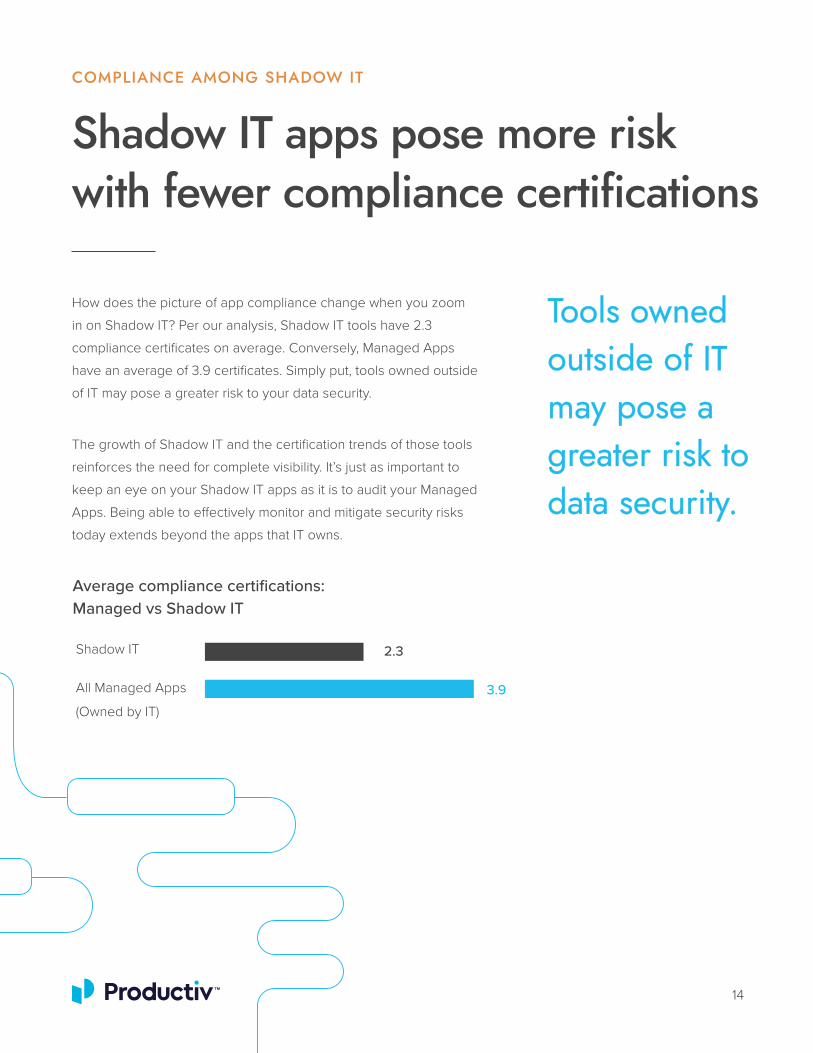
Shadow IT apps pose more risk with fewer compliance certifications
COMPLIANCE AMONG SHADOW IT
How does the picture of app compliance change when you zoom
in on Shadow IT? Per our analysis, Shadow IT tools have 2.3
compliance certificates on average. Conversely, Managed Apps
have an average of 3.9 certificates. Simply put, tools owned outside
of IT may pose a greater risk to your data security.
The growth of Shadow IT and the certification trends of those tools
reinforces the need for complete visibility. It’s just as important to
keep an eye on your Shadow IT apps as it is to audit your Managed
Apps. Being able to effectively monitor and mitigate security risks
today extends beyond the apps that IT owns.
3.9
2.3
Average compliance certifications: Managed vs Shadow IT
Shadow IT
All Managed Apps
(Owned by IT)
Tools owned Tools owned outside of IT outside of IT may pose a may pose a greater risk to greater risk to data security.data security.

COMPLIANCE AMONG SHADOW IT
15
Small business tools are more compliant on average
Despite typically using more Shadow IT, smaller organizations have a higher average of compliance
certifications across Shadow IT and Managed Apps. Small businesses may be leveraging younger, forward-
thinking tools with higher numbers of certifications, whereas large companies may have more established app
suites that can be slower to adopt industry trends.
However, overall the difference in number of certifications is relatively minimal across businesses of all sizes.
Across both Shadow IT and Managed Apps, tools used by small businesses have 3 compliance certifications on
average compared to 2.6 certifications among large enterprises.
Small (<500 employees)
Midsize (500-2,000)
Enterprise (2001-10,000)
Large Enterprise (10,000+)
Average compliance certifications by company size
All Apps Shadow IT Managed Apps
3.0 2.5 4.2
3.1 2.3 4.0
3.0 2.1 3.7
2.6 2.0 3.9

SSO use more prevalent among enterprises
SSO COVERAGE
Compliance certifications are one indicator for evaluating
security and compliance risks in your SaaS portfolio, but we
wanted a more comprehensive view. To get there, we also
looked at how companies use SSO across their apps. SSO
allows IT teams to better secure and control who has access to
critical business apps.
The caveat here is that companies tend to use SSO for
Managed Apps, or tools that IT owns and manages. (Since IT
doesn’t generally own or manage Shadow IT apps, that makes
it difficult to identify such tools as candidates to put behind
SSO.) For the purposes of this analysis, we only examined data
pertaining to Managed Apps.
Although SSO has grown increasingly popular, we found that
almost one-third of Managed Apps were not behind SSO.
Many organizations appear to have integrated SSO throughout
the majority of their Managed Apps but may face logistical
or financial challenges with the remaining ungated
Managed Apps.
SSO use also varies significantly by business size. Enterprise
organizations have the highest usage, with 75% of Managed
Apps behind SSO on average. Smaller businesses are lagging
behind with less than 60% of Managed Apps currently behind
SSO. The lower percentage for small companies may be in
part due to resource constraints and more lax security policies.
% of Managed Apps behind SSO by company size
Small (<500 employees)
Midsize (500-2,000)
Enterprise (2,001+)
59%
68%
75%
16
Managed Apps behind SSO
68%

17
How can you apply these findings to your organization?
CONCLUSION
As our report reveals, businesses are shifting further away from centralized management of their SaaS apps.
The reality of remote work and Shadow IT makes it all the more difficult for you to achieve complete visibility of
your entire app portfolio. We recommend taking the following actions to improve oversight of your SaaS tools:
You can also leverage Productiv’s SaaS Intelligence Platform to simplify and easily manage your complex SaaS
portfolio. We do it all — help you track all of your apps, tell you how employees are using them, enable you to
compare tools with similar functionality, and monitor app compliance.
Take inventory of all SaaS apps currently in use
Conduct regular audits of your SaaS tools. That can involve monitoring your network for
unknown apps, surveying employees, partnering with Finance to identify expensed app
purchases, and more. Or you can use Productiv, which automates many of these actions to give
you complete real-time visibility of your SaaS app portfolio — no manual audit necessary.
Understand how employees are using the tools available to them
Take steps to find out what users are doing beyond whether they’re logging in: which
features are they using, who are they collaborating with, which devices are they accessing
from, and more. Request user reports from your SaaS vendors or ask for feedback from
employees. This information can help you determine whether you’re getting value out of the
apps you’re paying for — and if not, help you take action to increase user engagement.
Look for opportunities to consolidate duplicate apps
You likely have multiple apps with overlapping functionality, such as different project management
tools for different teams. Duplicate apps can cost you more money, create data silos, increase
your security risk surface, and cause fragmentation among your workforce. You can categorize
apps to pinpoint where you might have multiple tools serving the same purpose.
Track app compliance and leverage SSO
To track compliance, we recommend you start by focusing on your critical business apps
and reviewing their websites for compliance certifications. If you have an SSO provider, look
at which tools aren’t behind SSO yet and figure out what obstacles are preventing that from
happening. If you don’t use SSO, you may want to consider a provider like Okta.
1
2
3
4

METHODOLOGY
About the report
The findings in this report are based on analysis of anonymized data from businesses using Productiv.
We looked at hundreds of active instances of the Productiv platform, which included data on more than
30,000 applications.
Productiv tracks Shadow IT, or what we refer to within our platform as Discovered Apps, by aggregating
data from HR systems, finance and expense management software, contract management tools and
files, and SSO and CASB providers. For the purposes of this report, we categorized apps as Shadow IT
based on non-managed applications with a data source from 1) an expense or finance system, 2) network
monitoring tools, or 3) Google single sign-on (SSO).
The Productiv SaaS Intelligence Platform uses proprietary app integrations that provide rich insights
into feature-level usage. Our integrations go beyond login data to standardize the measurement of user
engagement across all apps. For this report, we based all engagement data on a 60-day period of usage
and calculated engagement using the number of purchased licenses for each app across every instance.
18

Productiv is the comprehensive SaaS Intelligence Platform that automates
critical workflows, increases visibility and security of your SaaS portfolio,
and helps you understand exactly how employees use your apps. We
help leading enterprise organizations like Uber, Zoom, and Square solve
their complex SaaS challenges.
Want to see why we’re the trusted provider of SaaS
management for enterprises?
Schedule your demo.