Embed Size (px)
Citation preview
1
February 2012
The State of the
Canadian Geothermal Heat Pump Industry 2011 Industry Survey and Market Analysis
The State of the Canadian Geothermal Heat Pump Industry 2011
© 2012 Canadian GeoExchange Coalition
1
Acknowledgements
The CGC is grateful to the installers, designers,
contractors and other Canadian industry stakeholders
who participated in the many consultations and
surveys conducted by the CGC in the past five years.
They have clearly demonstrated their desire to
contribute to the national efforts deployed by the CGC
to better understand the nature of our industry and
provide government, utilities and other stakeholders
with the best neutral market information available.
The statistics presented in this report have been
gathered from different sources over a period of more
than five years. Sources include three CGC annual
industry surveys and market data collected directly
from close to 500 installation companies through the
CGC Company Qualification Market Survey. It also
includes the CGC certification database, which
includes technical information on over 16,000
residential systems installed by more than 800
companies. Additional information was taken from
selected companies’ annual reports as well as from
documents published by government agencies. The
CGC Research Unit, comprised of two economists, an
engineer, a geographer, an MBA and co-op students
from the University of Sherbrooke with, a combined
experience of over 50 years in market research,
analysed the information and prepared this report.
Special thanks go to Maxime Leroux, a co-op student
in Economics from the University of Sherbrooke, for
his rigorous work in gathering and computing the
most recent set of data during the fall of 2011.
Denis Tanguay
President & CEO
Canadian GeoExchange Coalition
The State of the Canadian Geothermal Heat Pump Industry 2011
© 2012 Canadian GeoExchange Coalition
2
Highlights
� After many years of sustained growth, the Canadian geothermal heat pump industry experienced a
significant set-back in 2010 with an estimated decline of roughly 28%. Early estimates tend to show
that the markets re-bounded and stabilized in 2011 for Canada as a whole.
� Together, Ontario, Québec and British Columbia represented about 87% of the GHP market in 2010
compared to 76% in 2007.
� Manitoba is the only Canadian province which experienced annual market decline in each of 2007,
2008, 2009 and 2010. In fact, the market for GHP crashed by 64% between 2007 and 2010, by far the
worst performance of all Canadian provinces.
� Ontario, Saskatchewan and New Brunswick lead in terms of units installed per capita. Boasting the
highest number of units per capita in 2007, Manitoba dropped to fourth place the year after, a position
held by the province since, now followed very closely by British Columbia, Prince Edward Island and
Québec.
� Looking at the industry average over 2008-2010, 56.4% of residential systems had a horizontal ground
heat exchanger (GHX) and 24.2% had a vertical GHX. Open loop systems follow with 13% of residential
applications while pond and lake loops account for 6.4%.
� In Canada, thousands of GHP systems have been installed in existing homes since 2007. For the years
2008 to 2010 taken together, these systems replaced heating oil and electricity in nearly equal
proportions of 39.2% and 39.1% respectively. Propane displacement follows with 10.1%, natural gas
with 7.2% and a combination of wood, wood pellets, heating oil and electricity and fuel oil and wood in
4.5% of cases.
� In 2010 for example, the average vertical GHP system sold for $7886 per ton in Canada compared to
$6116 per ton for a GHP system with a horizontal GHX. The total average price for a 4-ton system is
$31,544 for a GHP system with a vertical GHX and $24,464 for a system with a horizontal GHX.
� About 80% of all GHP systems sold in Canada are equipped with an auxiliary heating unit.
� One important heat pump brand lost significant market share between 2008 and 2010. This major
decline in a growing market benefited smaller suppliers while the other top brands maintained their
positions or slightly improved.
� In Canada, 20% of all the residential GHP installations are done by 9 companies and 50% of all
installations by 47 companies.
� In recent years, the Canadian GHP industry became generally more competitive as manufacturing and
distribution capacity improved in a fast-growing market environment.
The State of the Canadian Geothermal Heat Pump Industry 2011
© 2012 Canadian GeoExchange Coalition
3
General Industry Trends
1.0 Overall Trends1
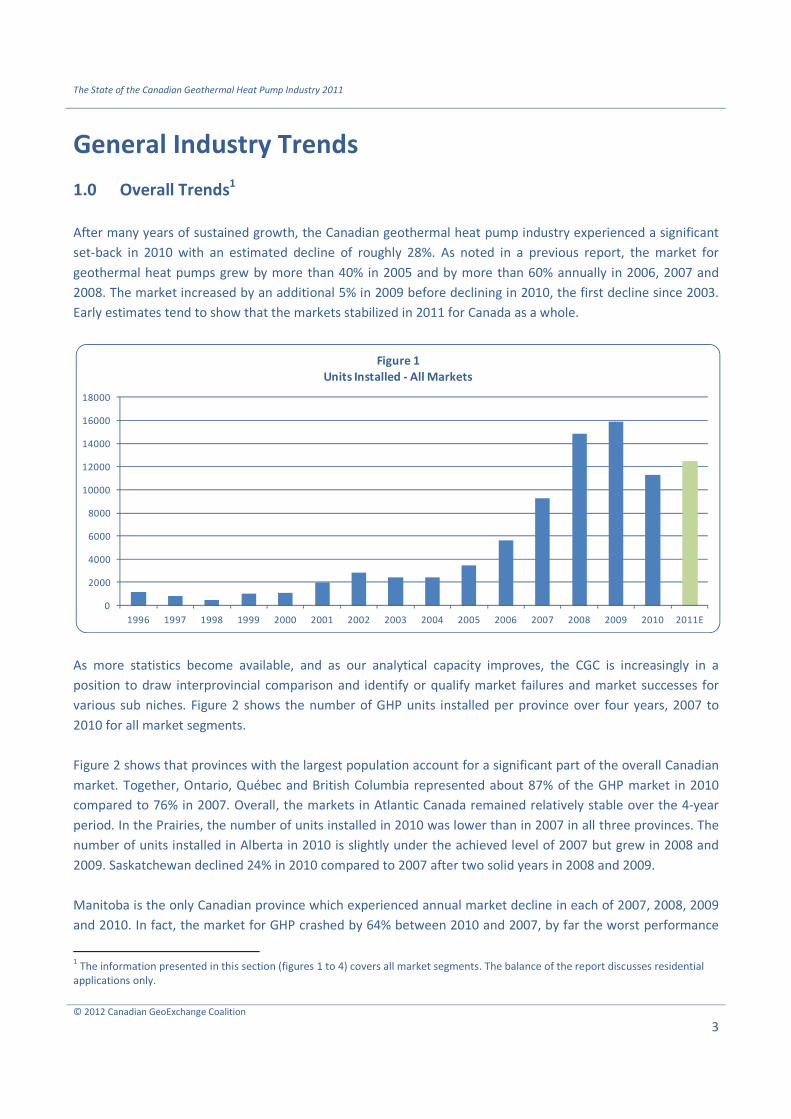
After many years of sustained growth, the Canadian geothermal heat pump industry experienced a significant
set-back in 2010 with an estimated decline of roughly 28%. As noted in a previous report, the market for
geothermal heat pumps grew by more than 40% in 2005 and by more than 60% annually in 2006, 2007 and
2008. The market increased by an additional 5% in 2009 before declining in 2010, the first decline since 2003.
Early estimates tend to show that the markets stabilized in 2011 for Canada as a whole.
As more statistics become available, and as our analytical capacity improves, the CGC is increasingly in a
position to draw interprovincial comparison and identify or qualify market failures and market successes for
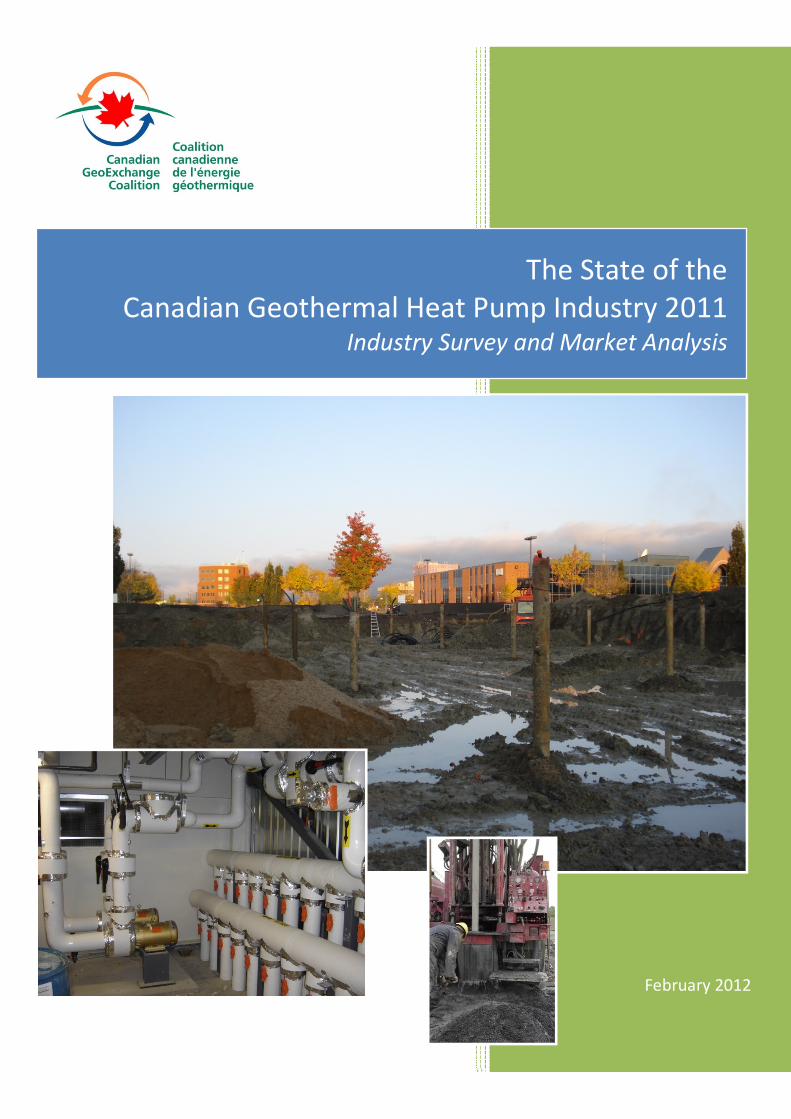
various sub niches. Figure 2 shows the number of GHP units installed per province over four years, 2007 to
2010 for all market segments.
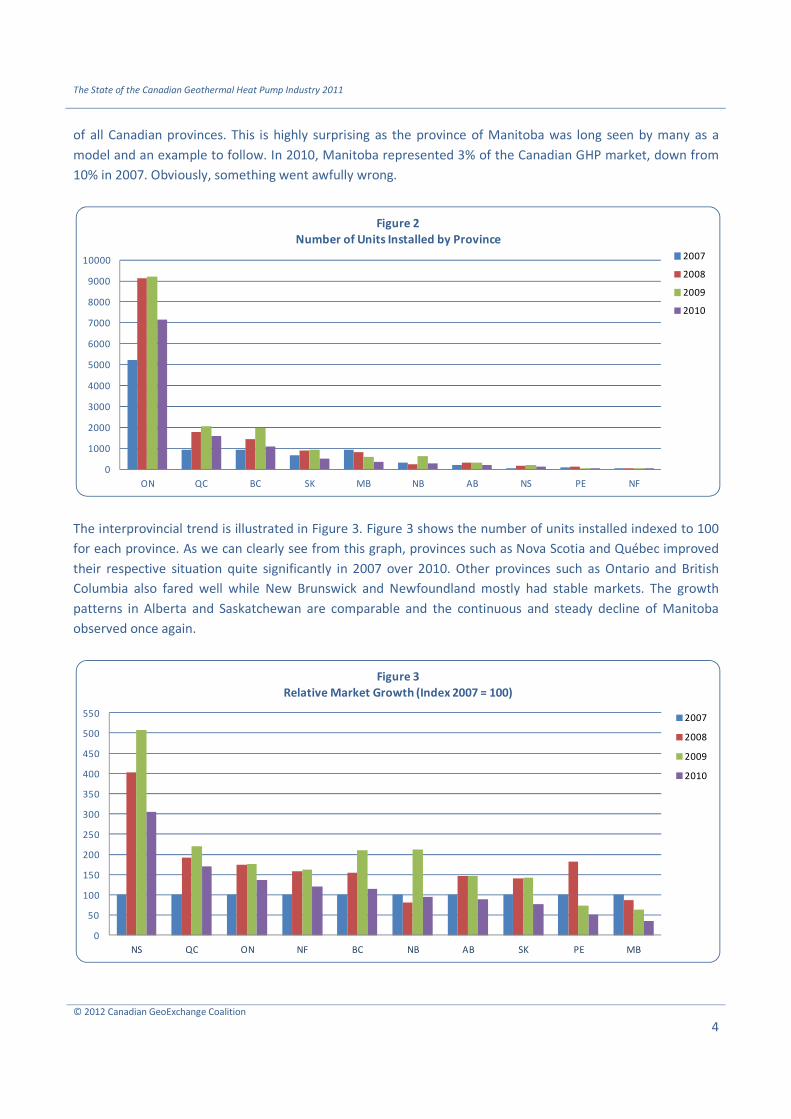
Figure 2 shows that provinces with the largest population account for a significant part of the overall Canadian
market. Together, Ontario, Québec and British Columbia represented about 87% of the GHP market in 2010
compared to 76% in 2007. Overall, the markets in Atlantic Canada remained relatively stable over the 4-year
period. In the Prairies, the number of units installed in 2010 was lower than in 2007 in all three provinces. The
number of units installed in Alberta in 2010 is slightly under the achieved level of 2007 but grew in 2008 and
2009. Saskatchewan declined 24% in 2010 compared to 2007 after two solid years in 2008 and 2009.
Manitoba is the only Canadian province which experienced annual market decline in each of 2007, 2008, 2009
and 2010. In fact, the market for GHP crashed by 64% between 2010 and 2007, by far the worst performance
1 The information presented in this section (figures 1 to 4) covers all market segments. The balance of the report discusses residential
applications only.
0
2000
4000
6000
8000
10000
12000
14000
16000
18000
1996 1997 1998 1999 2000 2001 2002 2003 2004 2005 2006 2007 2008 2009 2010 2011E
Figure 1
Units Installed - All Markets
The State of the Canadian Geothermal Heat Pump Industry 2011
© 2012 Canadian GeoExchange Coalition
4
of all Canadian provinces. This is highly surprising as the province of Manitoba was long seen by many as a
model and an example to follow. In 2010, Manitoba represented 3% of the Canadian GHP market, down from
10% in 2007. Obviously, something went awfully wrong.
The interprovincial trend is illustrated in Figure 3. Figure 3 shows the number of units installed indexed to 100
for each province. As we can clearly see from this graph, provinces such as Nova Scotia and Québec improved
their respective situation quite significantly in 2007 over 2010. Other provinces such as Ontario and British
Columbia also fared well while New Brunswick and Newfoundland mostly had stable markets. The growth
patterns in Alberta and Saskatchewan are comparable and the continuous and steady decline of Manitoba
observed once again.
0
1000
2000
3000
4000
5000
6000
7000
8000
9000
10000
ON QC BC SK MB NB AB NS PE NF
Figure 2
Number of Units Installed by Province
2007
2008
2009
2010
0
50
100
150
200
250
300
350
400
450
500
550
NS QC ON NF BC NB AB SK PE MB
Figure 3
Relative Market Growth (Index 2007 = 100)
2007
2008
2009
2010
The State of the Canadian Geothermal Heat Pump Industry 2011
© 2012 Canadian GeoExchange Coalition
5
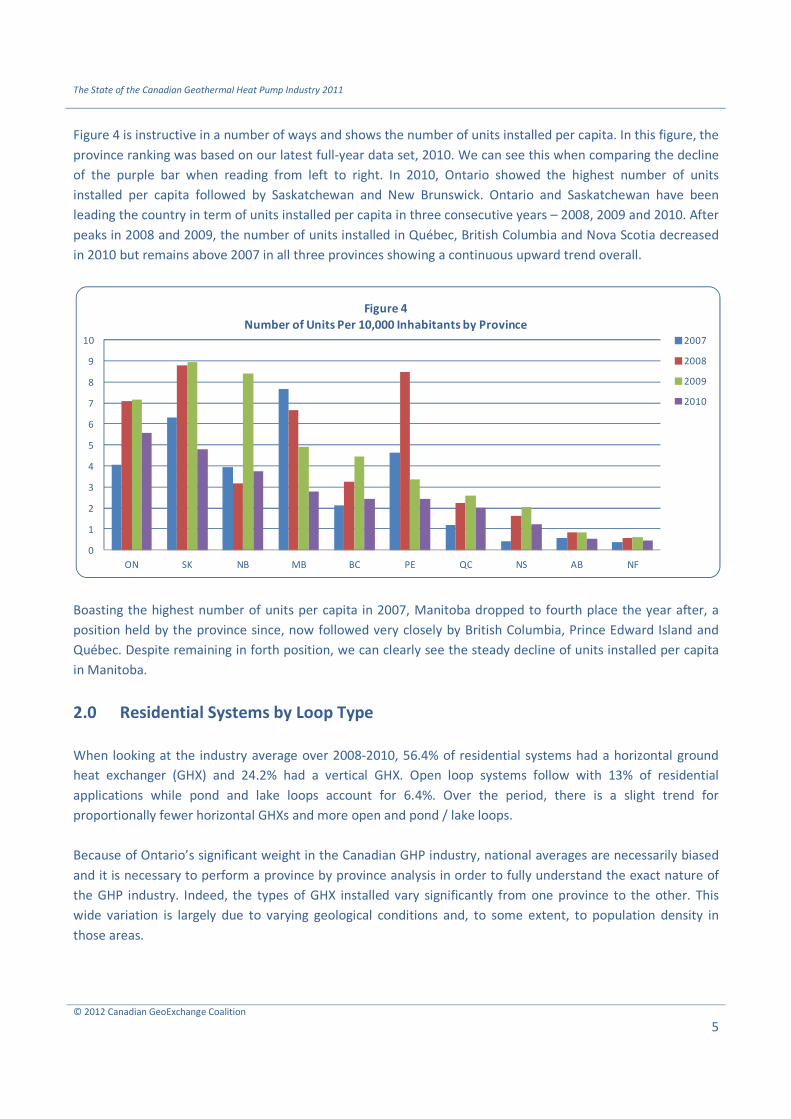
Figure 4 is instructive in a number of ways and shows the number of units installed per capita. In this figure, the
province ranking was based on our latest full-year data set, 2010. We can see this when comparing the decline
of the purple bar when reading from left to right. In 2010, Ontario showed the highest number of units
installed per capita followed by Saskatchewan and New Brunswick. Ontario and Saskatchewan have been
leading the country in term of units installed per capita in three consecutive years – 2008, 2009 and 2010. After
peaks in 2008 and 2009, the number of units installed in Québec, British Columbia and Nova Scotia decreased
in 2010 but remains above 2007 in all three provinces showing a continuous upward trend overall.
Boasting the highest number of units per capita in 2007, Manitoba dropped to fourth place the year after, a
position held by the province since, now followed very closely by British Columbia, Prince Edward Island and
Québec. Despite remaining in forth position, we can clearly see the steady decline of units installed per capita
in Manitoba.
2.0 Residential Systems by Loop Type
When looking at the industry average over 2008-2010, 56.4% of residential systems had a horizontal ground
heat exchanger (GHX) and 24.2% had a vertical GHX. Open loop systems follow with 13% of residential
applications while pond and lake loops account for 6.4%. Over the period, there is a slight trend for
proportionally fewer horizontal GHXs and more open and pond / lake loops.
Because of Ontario’s significant weight in the Canadian GHP industry, national averages are necessarily biased
and it is necessary to perform a province by province analysis in order to fully understand the exact nature of
the GHP industry. Indeed, the types of GHX installed vary significantly from one province to the other. This
wide variation is largely due to varying geological conditions and, to some extent, to population density in
those areas.
0
1
2
3
4
5
6
7
8
9
10
ON SK NB MB BC PE QC NS AB NF
Figure 4
Number of Units Per 10,000 Inhabitants by Province
2007
2008
2009
2010

The State of the Canadian Geothermal Heat Pump Industry 2011
© 2012 Canadian GeoExchange Coalition
6
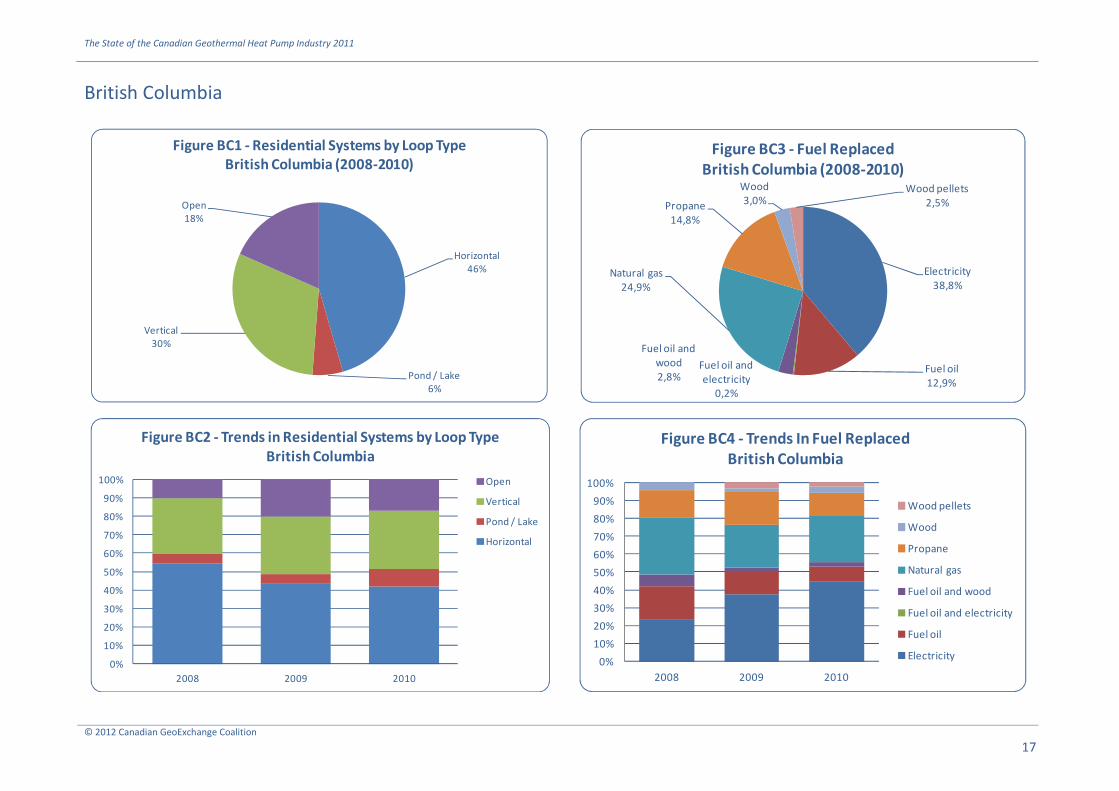
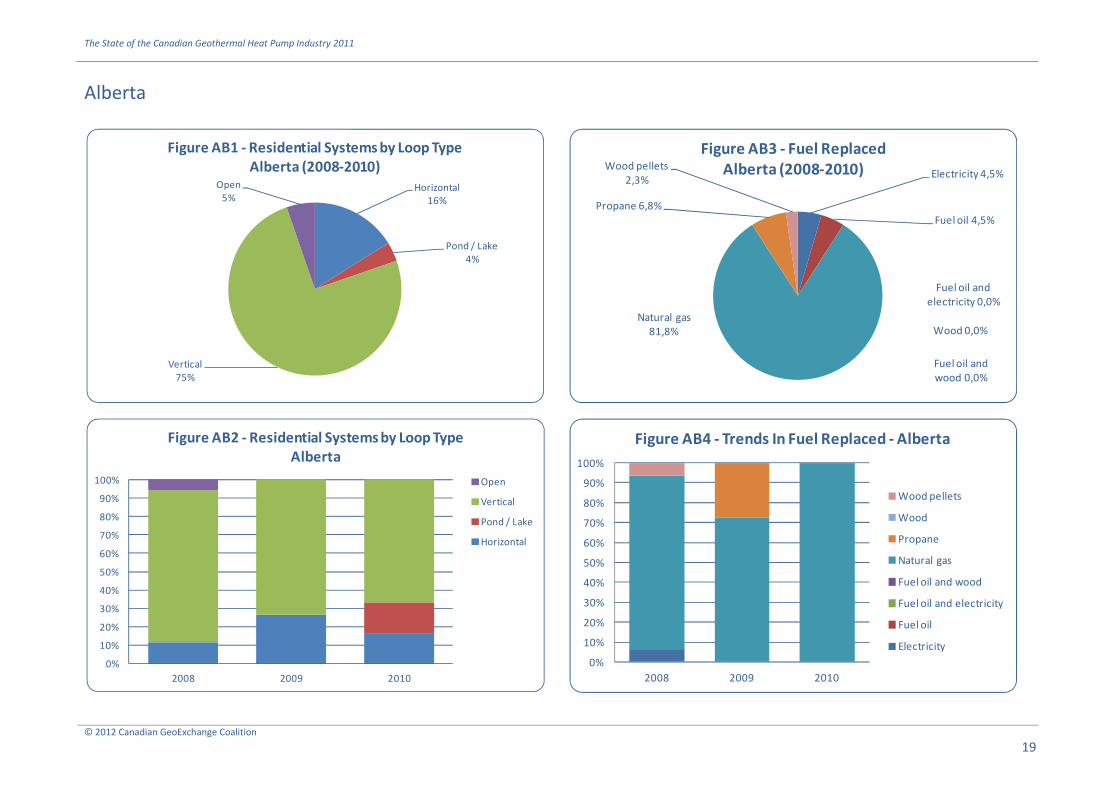
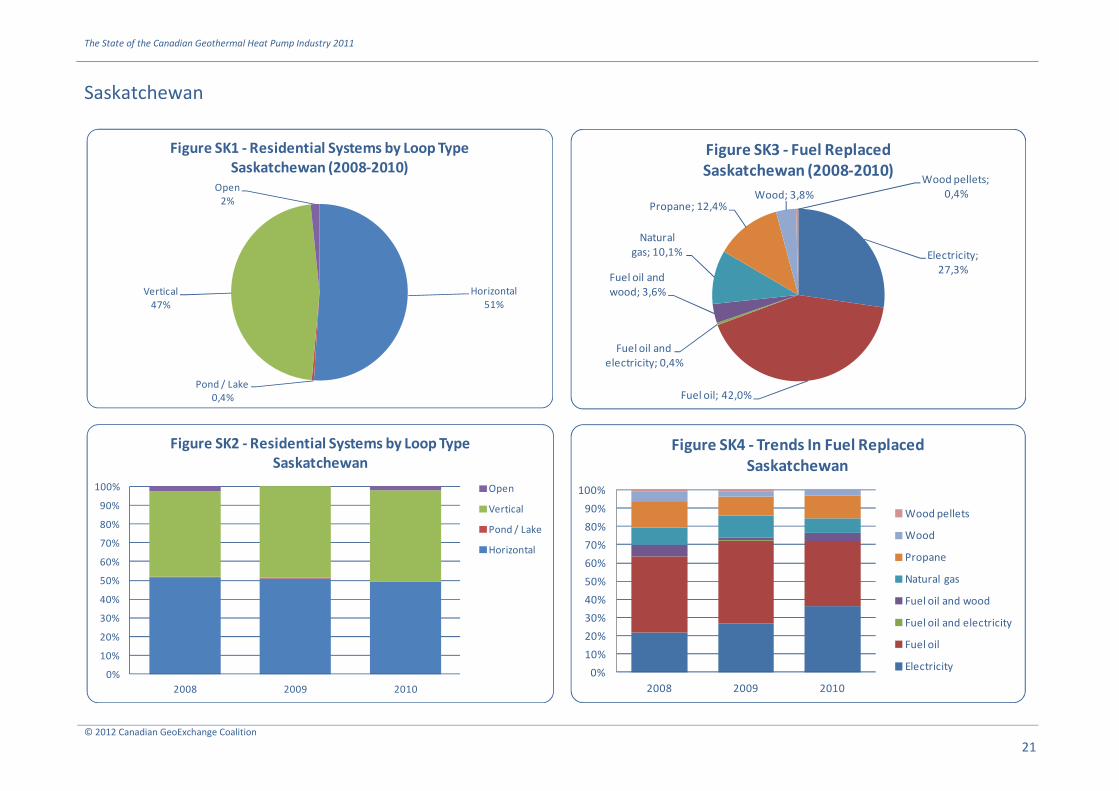
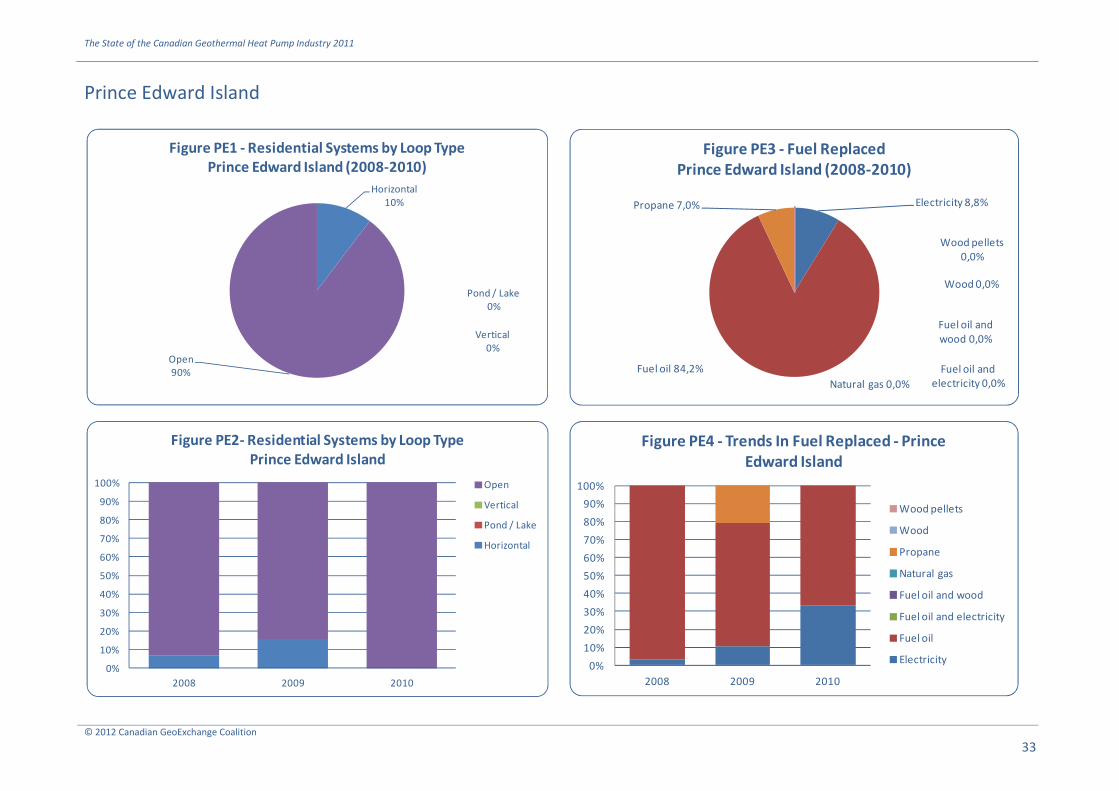
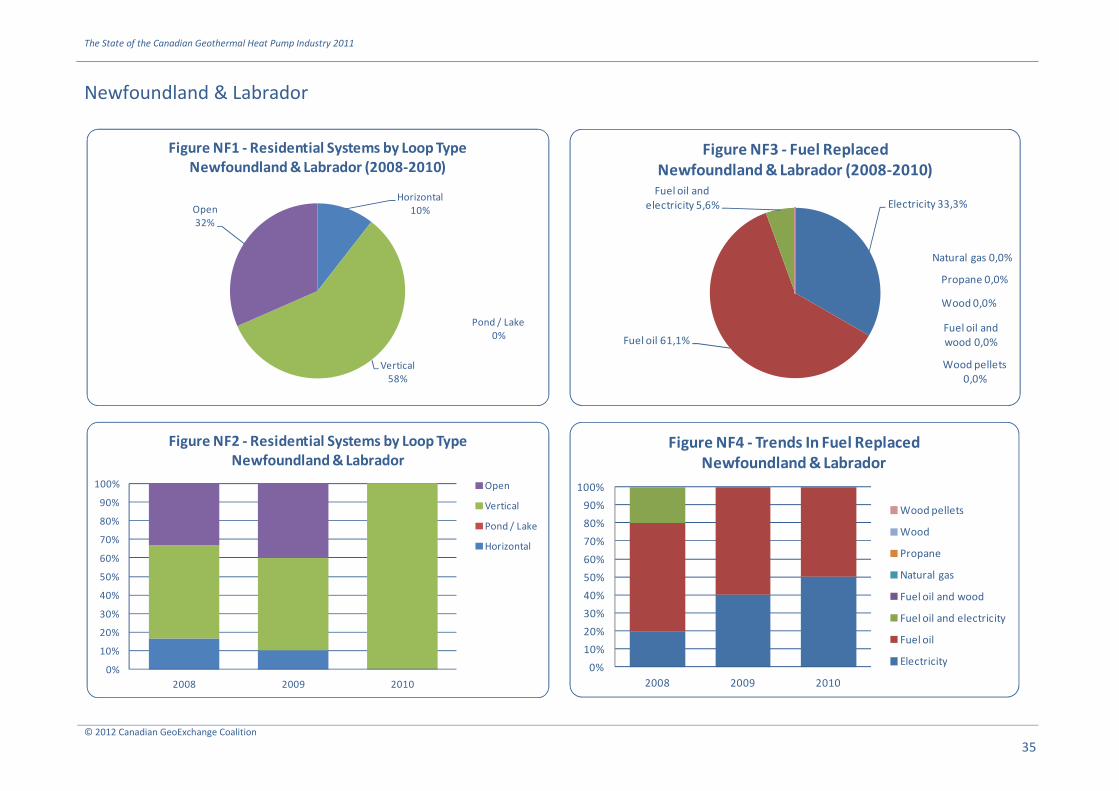
Provincial distinctions are extremely important
from a market perspective – particularly in
terms of industry components used in various
parts of the country – but also from a policy and
a regulatory perspective. For example, in Prince
Edward Island, New Brunswick and
Newfoundland, open loops in the residential
sector account for 89.7%, 47.1% and 31.6%
respectively of all installations. In comparison,
open loops account for only 1.6% of the
installations in Saskatchewan, 5.3% in Alberta
and 7.3% in Québec.
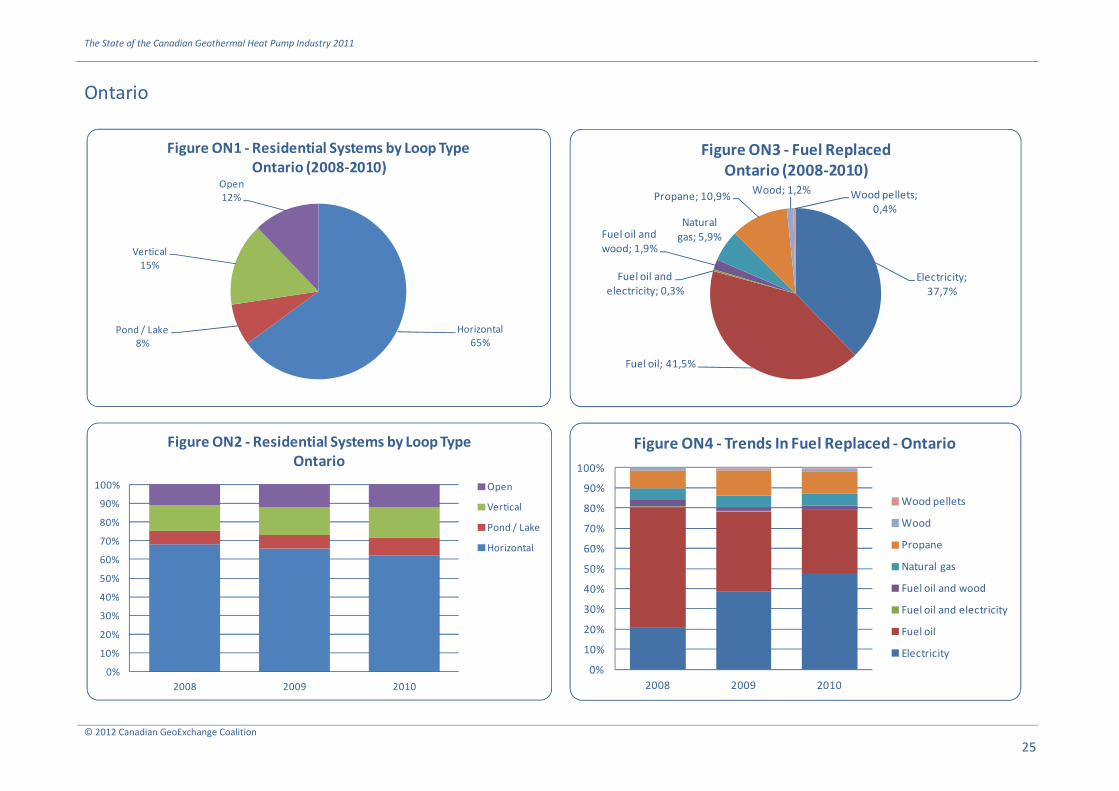
If we exclude Prince Edward Island, the province
of Ontario has Canada’s lowest penetration rate
for vertical GHX at only 15.3% of all systems
installed. This is also reflected in the fact that
64.9% of the systems installed in Ontario have
horizontal GHX. Looking at the province next
door, the opposite situation prevails. Québec
has the largest proportion of vertical GHX of all
Canadian provinces with a penetration rate of
82.9% and only 8.0% horizontal GHX.
When comparing data for 2008, 2009 and 2010, we found no significant change in loop types used within each
province. Although we do observe some movements here and there – largely due to sample size variation – we
can safely say that the three year average and annual splits do reflect the current state of the markets in most
provinces.
We generally found more consistent patterns across Canada for commercial GHP systems. According to our
surveys and market observations, the vast majority of commercial GHP systems have vertical GHX. Other types
of heat exchangers are also encountered – open loops for example – but much less frequently. More details
will be available in the future as the CGC refines its survey methods and data collection strategies.
3.0 Fuel Replaced – Residential Retrofits
GHP systems are often referred to as renewable energy systems. On the other hand, the notion of moving heat
around from the ground to a building and putting heat back from the building into the ground (or a body of
water) invites us to treat GHP systems as building technologies, conservation technology or simply energy
efficiency technology.
Horizontal
56,4%
Pond / Lake
6,4%
Vertical
24,2%
Open
13,0%
Figure 5 - Residential Systems by Loop Type
Canada (2008-2010)
0%
10%
20%
30%
40%
50%
60%
70%
80%
90%
100%
2008 2009 2010
Figure 6 - Residential Systems by Loop Type
Canada
Open
Vertical
Pond / Lake
Horizontal
The State of the Canadian Geothermal Heat Pump Industry 2011
© 2012 Canadian GeoExchange Coalition
7
Regardless of the definition however there are some simple undeniable facts common to all GHP systems: (1)
they save energy and, (2) they displace or replace other energy sources for heating and cooling purposes. As
such, GHP systems help home and building owners save energy and can radically reduce green house gases
emissions. In addition, they play a role in the overall energy supply environment by displacing or replacing
other forms of energy and on the demand side by reducing global energy use and moderating peaks and
valleys.
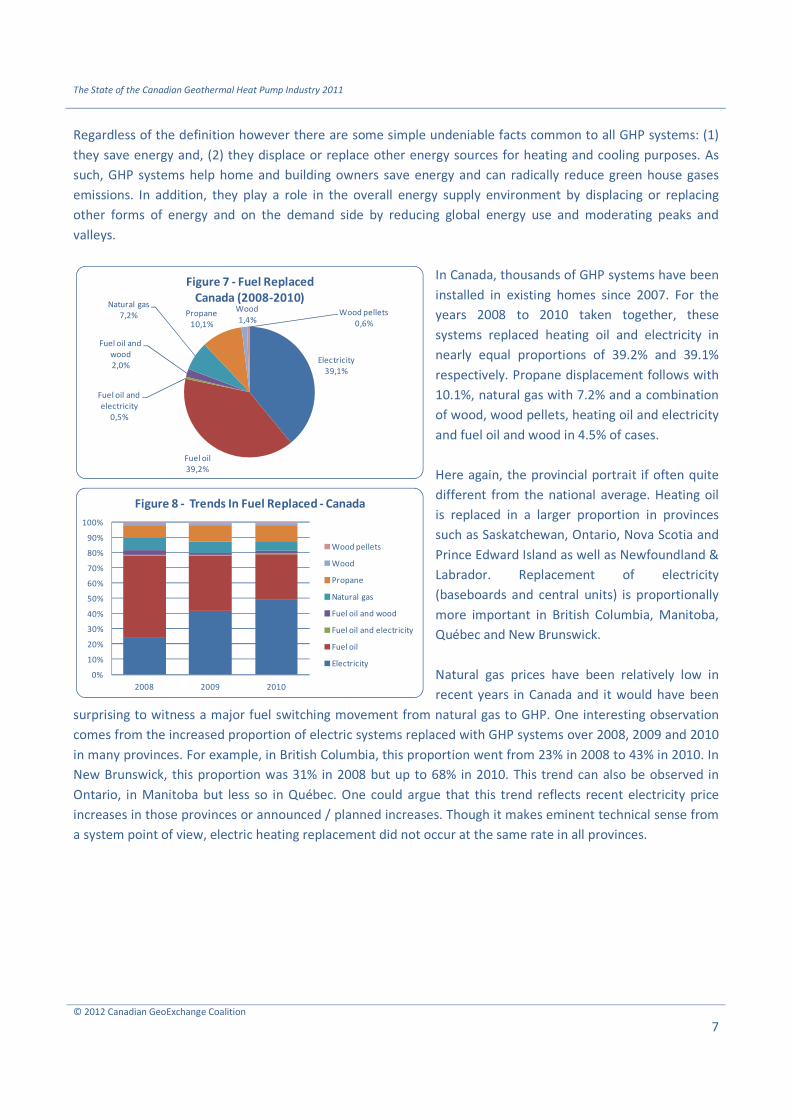
In Canada, thousands of GHP systems have been
installed in existing homes since 2007. For the
years 2008 to 2010 taken together, these
systems replaced heating oil and electricity in
nearly equal proportions of 39.2% and 39.1%
respectively. Propane displacement follows with
10.1%, natural gas with 7.2% and a combination
of wood, wood pellets, heating oil and electricity
and fuel oil and wood in 4.5% of cases.
Here again, the provincial portrait if often quite
different from the national average. Heating oil
is replaced in a larger proportion in provinces
such as Saskatchewan, Ontario, Nova Scotia and
Prince Edward Island as well as Newfoundland &
Labrador. Replacement of electricity
(baseboards and central units) is proportionally
more important in British Columbia, Manitoba,
Québec and New Brunswick.
Natural gas prices have been relatively low in
recent years in Canada and it would have been
surprising to witness a major fuel switching movement from natural gas to GHP. One interesting observation
comes from the increased proportion of electric systems replaced with GHP systems over 2008, 2009 and 2010
in many provinces. For example, in British Columbia, this proportion went from 23% in 2008 to 43% in 2010. In
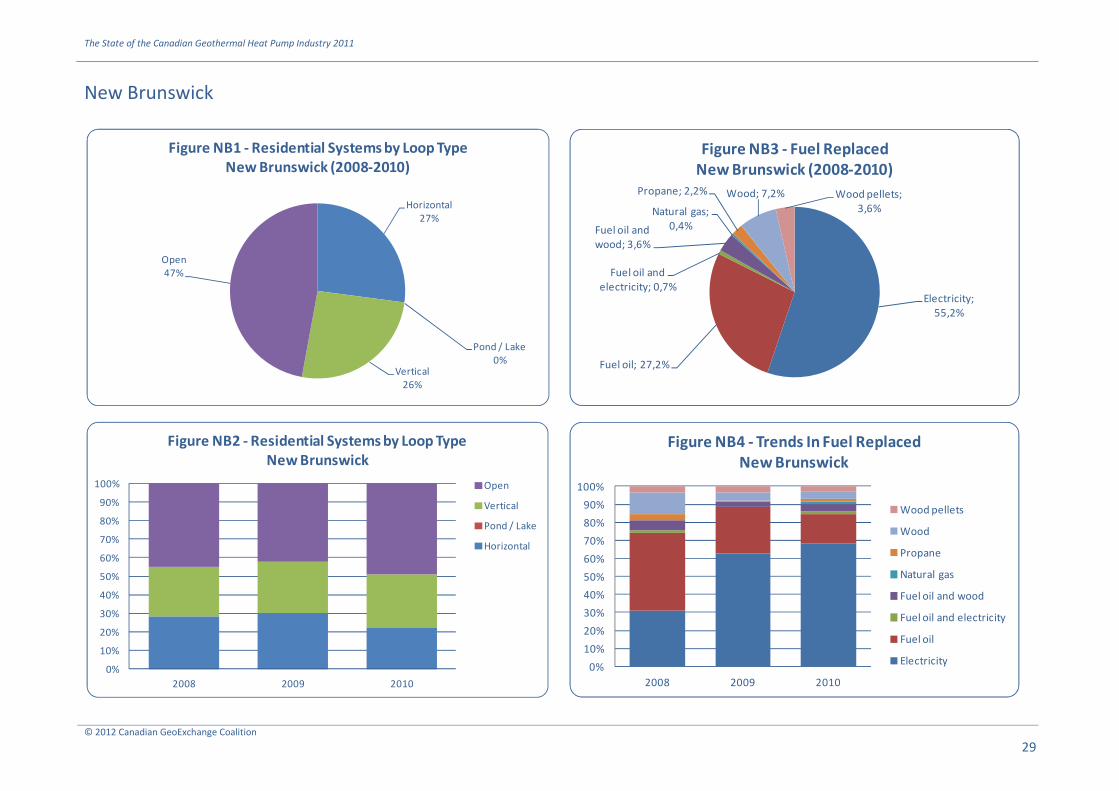
New Brunswick, this proportion was 31% in 2008 but up to 68% in 2010. This trend can also be observed in
Ontario, in Manitoba but less so in Québec. One could argue that this trend reflects recent electricity price
increases in those provinces or announced / planned increases. Though it makes eminent technical sense from
a system point of view, electric heating replacement did not occur at the same rate in all provinces.
Electricity
39,1%
Fuel oil
39,2%
Fuel oil and
electricity
0,5%
Fuel oil and
wood
2,0%
Natural gas
7,2% Propane
10,1%
Wood
1,4%Wood pellets
0,6%
Figure 7 - Fuel Replaced
Canada (2008-2010)
0%
10%
20%
30%
40%
50%
60%
70%
80%
90%
100%
2008 2009 2010
Figure 8 - Trends In Fuel Replaced - Canada
Wood pellets
Wood
Propane
Natural gas
Fuel oil and wood
Fuel oil and electricity
Fuel oil
Electricity
The State of the Canadian Geothermal Heat Pump Industry 2011
© 2012 Canadian GeoExchange Coalition
8
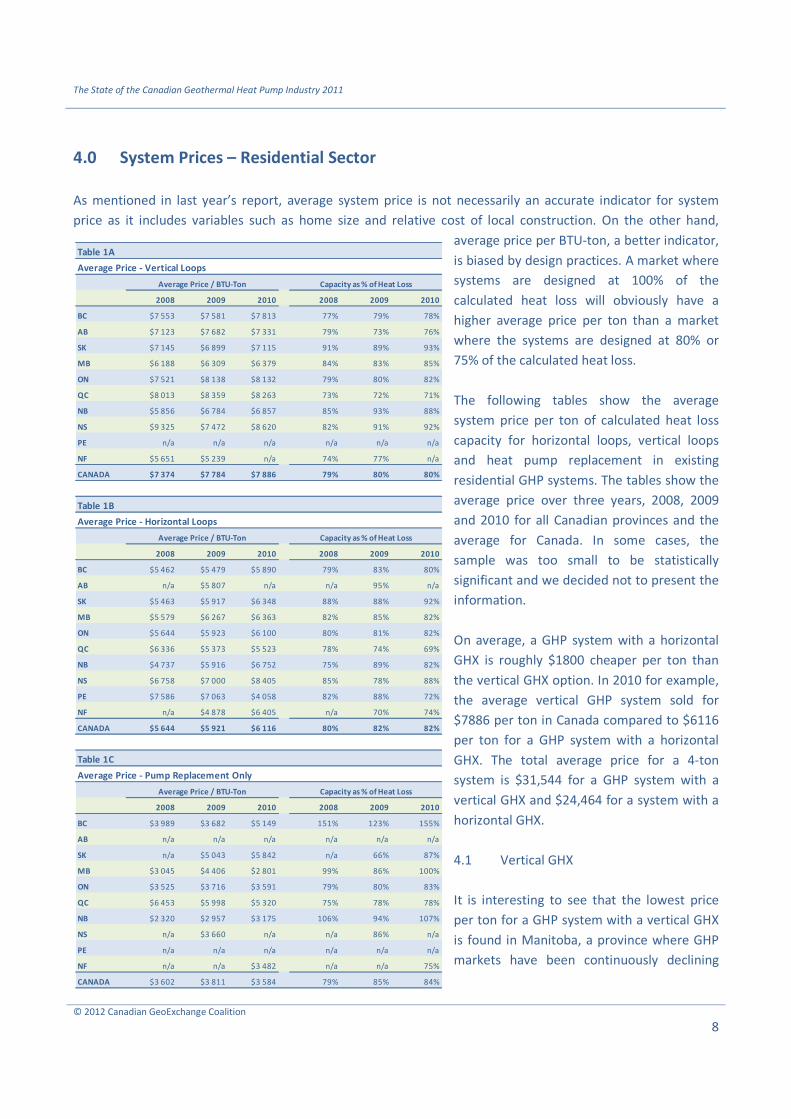
4.0 System Prices – Residential Sector
As mentioned in last year’s report, average system price is not necessarily an accurate indicator for system
price as it includes variables such as home size and relative cost of local construction. On the other hand,
average price per BTU-ton, a better indicator,
is biased by design practices. A market where
systems are designed at 100% of the
calculated heat loss will obviously have a
higher average price per ton than a market
where the systems are designed at 80% or
75% of the calculated heat loss.
The following tables show the average
system price per ton of calculated heat loss
capacity for horizontal loops, vertical loops
and heat pump replacement in existing
residential GHP systems. The tables show the
average price over three years, 2008, 2009
and 2010 for all Canadian provinces and the
average for Canada. In some cases, the
sample was too small to be statistically
significant and we decided not to present the
information.
On average, a GHP system with a horizontal
GHX is roughly $1800 cheaper per ton than
the vertical GHX option. In 2010 for example,
the average vertical GHP system sold for
$7886 per ton in Canada compared to $6116
per ton for a GHP system with a horizontal
GHX. The total average price for a 4-ton
system is $31,544 for a GHP system with a
vertical GHX and $24,464 for a system with a
horizontal GHX.
4.1 Vertical GHX
It is interesting to see that the lowest price
per ton for a GHP system with a vertical GHX
is found in Manitoba, a province where GHP
markets have been continuously declining
Table 1A
Average Price - Vertical Loops
2008 2009 2010 2008 2009 2010
BC $7 553 $7 581 $7 813 77% 79% 78%
AB $7 123 $7 682 $7 331 79% 73% 76%
SK $7 145 $6 899 $7 115 91% 89% 93%
MB $6 188 $6 309 $6 379 84% 83% 85%
ON $7 521 $8 138 $8 132 79% 80% 82%
QC $8 013 $8 359 $8 263 73% 72% 71%
NB $5 856 $6 784 $6 857 85% 93% 88%
NS $9 325 $7 472 $8 620 82% 91% 92%
PE n/a n/a n/a n/a n/a n/a
NF $5 651 $5 239 n/a 74% 77% n/a
CANADA $7 374 $7 784 $7 886 79% 80% 80%
Table 1B
Average Price - Horizontal Loops
2008 2009 2010 2008 2009 2010
BC $5 462 $5 479 $5 890 79% 83% 80%
AB n/a $5 807 n/a n/a 95% n/a
SK $5 463 $5 917 $6 348 88% 88% 92%
MB $5 579 $6 267 $6 363 82% 85% 82%
ON $5 644 $5 923 $6 100 80% 81% 82%
QC $6 336 $5 373 $5 523 78% 74% 69%
NB $4 737 $5 916 $6 752 75% 89% 82%
NS $6 758 $7 000 $8 405 85% 78% 88%
PE $7 586 $7 063 $4 058 82% 88% 72%
NF n/a $4 878 $6 405 n/a 70% 74%
CANADA $5 644 $5 921 $6 116 80% 82% 82%
Table 1C
Average Price - Pump Replacement Only
2008 2009 2010 2008 2009 2010
BC $3 989 $3 682 $5 149 151% 123% 155%
AB n/a n/a n/a n/a n/a n/a
SK n/a $5 043 $5 842 n/a 66% 87%
MB $3 045 $4 406 $2 801 99% 86% 100%
ON $3 525 $3 716 $3 591 79% 80% 83%
QC $6 453 $5 998 $5 320 75% 78% 78%
NB $2 320 $2 957 $3 175 106% 94% 107%
NS n/a $3 660 n/a n/a 86% n/a
PE n/a n/a n/a n/a n/a n/a
NF n/a n/a $3 482 n/a n/a 75%
CANADA $3 602 $3 811 $3 584 79% 85% 84%
Average Price / BTU-Ton Capacity as % of Heat Loss
Average Price / BTU-Ton Capacity as % of Heat Loss
Average Price / BTU-Ton Capacity as % of Heat Loss
The State of the Canadian Geothermal Heat Pump Industry 2011
© 2012 Canadian GeoExchange Coalition
9
since 2007. The average price per ton for such a system was $6379 in 2010 slightly up from $6188 in 2008. At
the other end of the spectrum, the same system cost $8263 in Québec in 2010, up from $8013 in 2008 but
down by about $100 from the average price in 2009. This difference could be explained by drilling practices. In
Manitoba, it is relatively common to drill only in overburden which will result in a bore field with 5, 10 or even
20 boreholes with a depth of 30 m each. In contrast, drilling for GHP systems in Québec will often be mostly in
solid rock at depths of 125-150 m with one or two boreholes only, depending on the system’s capacity.
In addition to being more expensive on a per-ton basis, GHP systems with vertical GHX are usually designed in
Québec at a much lower percentage of the calculated heat loss. In fact, Québec shows the lowest design ratio
of all provinces with system size averaging 73%, 72% and 71% of total heat loss in 2008, 2009 and 2010. This
means that the ratio of energy produced by the GHP system with a vertical GHX to system price is the lowest of
all provinces. On average, for a comparable unit cost, Québec customers are getting less energy services for
their system than in other provinces. The situation is the opposite in Saskatchewan where the average system
price per ton is much lower than the Canadian average and where the capacity as percentage of heat loss is
among the highest in Canada.
In general, we note that year-over-year price increases have remained relatively modest at 1 or 2 percentage
points above inflation in most provinces. The notable exception is New Brunswick where average prices for a
GHP system with a vertical GHX increased by 17% between 2008 and 2010 compared to the Canadian average
of 6.9%. Despite this increase, it should be noted that New Brunswick still has the second lowest average price
per ton in the country. For Canada, the average price increased by 5.6% in 2009 over 2008 and by 1.3% in 2010
over 2009. Likely, this has much to do with provincial relative energy prices, and CGC Research Unit may pursue
this analysis in the next update of this report.
4.2 Horizontal GHX
Intuitively, we believe GHP systems with horizontal GHX should be less expensive that vertical GHX. Although
the horizontal GHX may require more piping, there are significant savings made on trenching versus drilling. As
we saw earlier, horizontal systems are roughly 25% less expensive per ton, than the vertical option.
If we exclude provinces where sample size is relatively small, surprisingly, Québec is the province showing the
lowest average price for GHP systems with a horizontal GHX. As for vertical GHX, the average Québec system
capacity as a percentage of the calculated heat loss is also the lowest amongst the provinces. British Columbia
also shows a relatively low per ton price at $5890. On the other hand, Nova Scotia has the highest average
price of all provinces at $8405 per ton or about 40% above the Canadian average.
Year-over-year price increases for GHP systems with a horizontal GHX were of a comparable magnitude to the
vertical GHX. Horizontal GHX prices increased by 4.9% in 2009 over 2008 and by 3.4% in 2010 over 2009. From
2008 to 2010, the largest price increases were observed in New Brunswick (43%), Saskatchewan (16%) and
Manitoba (14%).
The State of the Canadian Geothermal Heat Pump Industry 2011
© 2012 Canadian GeoExchange Coalition
10
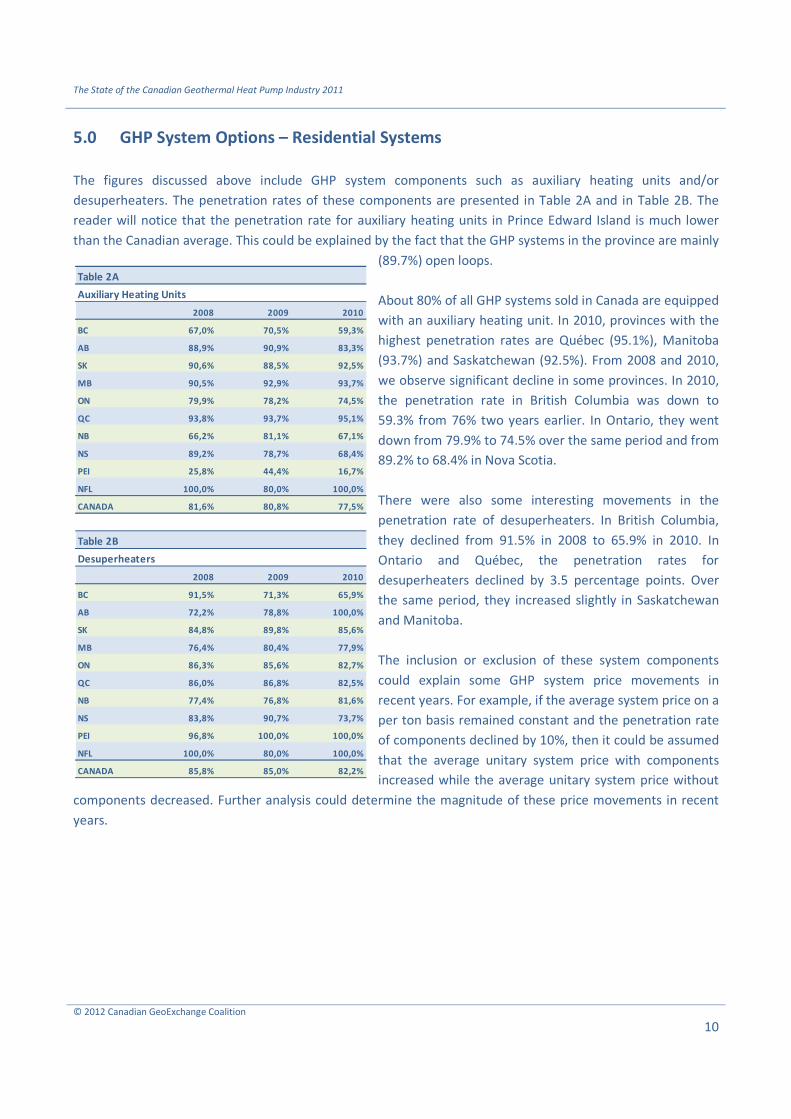
5.0 GHP System Options – Residential Systems
The figures discussed above include GHP system components such as auxiliary heating units and/or
desuperheaters. The penetration rates of these components are presented in Table 2A and in Table 2B. The
reader will notice that the penetration rate for auxiliary heating units in Prince Edward Island is much lower
than the Canadian average. This could be explained by the fact that the GHP systems in the province are mainly
(89.7%) open loops.
About 80% of all GHP systems sold in Canada are equipped
with an auxiliary heating unit. In 2010, provinces with the
highest penetration rates are Québec (95.1%), Manitoba
(93.7%) and Saskatchewan (92.5%). From 2008 and 2010,
we observe significant decline in some provinces. In 2010,
the penetration rate in British Columbia was down to
59.3% from 76% two years earlier. In Ontario, they went
down from 79.9% to 74.5% over the same period and from
89.2% to 68.4% in Nova Scotia.
There were also some interesting movements in the
penetration rate of desuperheaters. In British Columbia,
they declined from 91.5% in 2008 to 65.9% in 2010. In
Ontario and Québec, the penetration rates for
desuperheaters declined by 3.5 percentage points. Over
the same period, they increased slightly in Saskatchewan
and Manitoba.
The inclusion or exclusion of these system components
could explain some GHP system price movements in
recent years. For example, if the average system price on a
per ton basis remained constant and the penetration rate
of components declined by 10%, then it could be assumed
that the average unitary system price with components
increased while the average unitary system price without
components decreased. Further analysis could determine the magnitude of these price movements in recent
years.
Table 2A
Auxiliary Heating Units
2008 2009 2010
BC 67,0% 70,5% 59,3%
AB 88,9% 90,9% 83,3%
SK 90,6% 88,5% 92,5%
MB 90,5% 92,9% 93,7%
ON 79,9% 78,2% 74,5%
QC 93,8% 93,7% 95,1%
NB 66,2% 81,1% 67,1%
NS 89,2% 78,7% 68,4%
PEI 25,8% 44,4% 16,7%
NFL 100,0% 80,0% 100,0%
CANADA 81,6% 80,8% 77,5%
Table 2B
Desuperheaters
2008 2009 2010
BC 91,5% 71,3% 65,9%
AB 72,2% 78,8% 100,0%
SK 84,8% 89,8% 85,6%
MB 76,4% 80,4% 77,9%
ON 86,3% 85,6% 82,7%
QC 86,0% 86,8% 82,5%
NB 77,4% 76,8% 81,6%
NS 83,8% 90,7% 73,7%
PEI 96,8% 100,0% 100,0%
NFL 100,0% 80,0% 100,0%
CANADA 85,8% 85,0% 82,2%
The State of the Canadian Geothermal Heat Pump Industry 2011
© 2012 Canadian GeoExchange Coalition
11
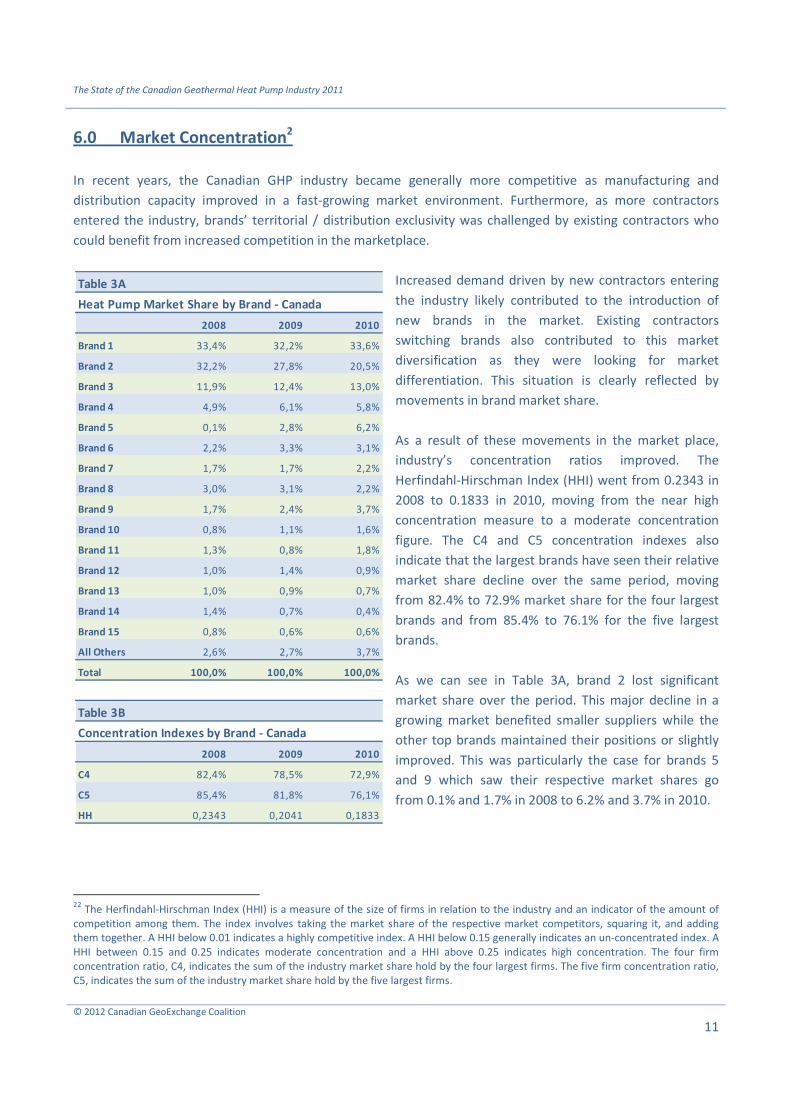
6.0 Market Concentration2
In recent years, the Canadian GHP industry became generally more competitive as manufacturing and
distribution capacity improved in a fast-growing market environment. Furthermore, as more contractors
entered the industry, brands’ territorial / distribution exclusivity was challenged by existing contractors who
could benefit from increased competition in the marketplace.
Increased demand driven by new contractors entering
the industry likely contributed to the introduction of
new brands in the market. Existing contractors
switching brands also contributed to this market
diversification as they were looking for market
differentiation. This situation is clearly reflected by
movements in brand market share.
As a result of these movements in the market place,
industry’s concentration ratios improved. The
Herfindahl-Hirschman Index (HHI) went from 0.2343 in
2008 to 0.1833 in 2010, moving from the near high
concentration measure to a moderate concentration
figure. The C4 and C5 concentration indexes also
indicate that the largest brands have seen their relative
market share decline over the same period, moving
from 82.4% to 72.9% market share for the four largest
brands and from 85.4% to 76.1% for the five largest
brands.
As we can see in Table 3A, brand 2 lost significant
market share over the period. This major decline in a
growing market benefited smaller suppliers while the
other top brands maintained their positions or slightly
improved. This was particularly the case for brands 5
and 9 which saw their respective market shares go
from 0.1% and 1.7% in 2008 to 6.2% and 3.7% in 2010.
22
The Herfindahl-Hirschman Index (HHI) is a measure of the size of firms in relation to the industry and an indicator of the amount of
competition among them. The index involves taking the market share of the respective market competitors, squaring it, and adding
them together. A HHI below 0.01 indicates a highly competitive index. A HHI below 0.15 generally indicates an un-concentrated index. A
HHI between 0.15 and 0.25 indicates moderate concentration and a HHI above 0.25 indicates high concentration. The four firm
concentration ratio, C4, indicates the sum of the industry market share hold by the four largest firms. The five firm concentration ratio,
C5, indicates the sum of the industry market share hold by the five largest firms.
Table 3A
Heat Pump Market Share by Brand - Canada
2008 2009 2010
Brand 1 33,4% 32,2% 33,6%
Brand 2 32,2% 27,8% 20,5%
Brand 3 11,9% 12,4% 13,0%
Brand 4 4,9% 6,1% 5,8%
Brand 5 0,1% 2,8% 6,2%
Brand 6 2,2% 3,3% 3,1%
Brand 7 1,7% 1,7% 2,2%
Brand 8 3,0% 3,1% 2,2%
Brand 9 1,7% 2,4% 3,7%
Brand 10 0,8% 1,1% 1,6%
Brand 11 1,3% 0,8% 1,8%
Brand 12 1,0% 1,4% 0,9%
Brand 13 1,0% 0,9% 0,7%
Brand 14 1,4% 0,7% 0,4%
Brand 15 0,8% 0,6% 0,6%
All Others 2,6% 2,7% 3,7%
Total 100,0% 100,0% 100,0%
Table 3B
Concentration Indexes by Brand - Canada
2008 2009 2010
C4 82,4% 78,5% 72,9%
C5 85,4% 81,8% 76,1%
HH 0,2343 0,2041 0,1833

The State of the Canadian Geothermal Heat Pump Industry 2011
© 2012 Canadian GeoExchange Coalition
12
The market diversification is also reflected in the market share held by brands outside of the top 15 which saw
their share go from 2.6% to 3.7% from 2008 to 2010. Although these figures related to small volumes it
indicates an increasingly healthy industry.
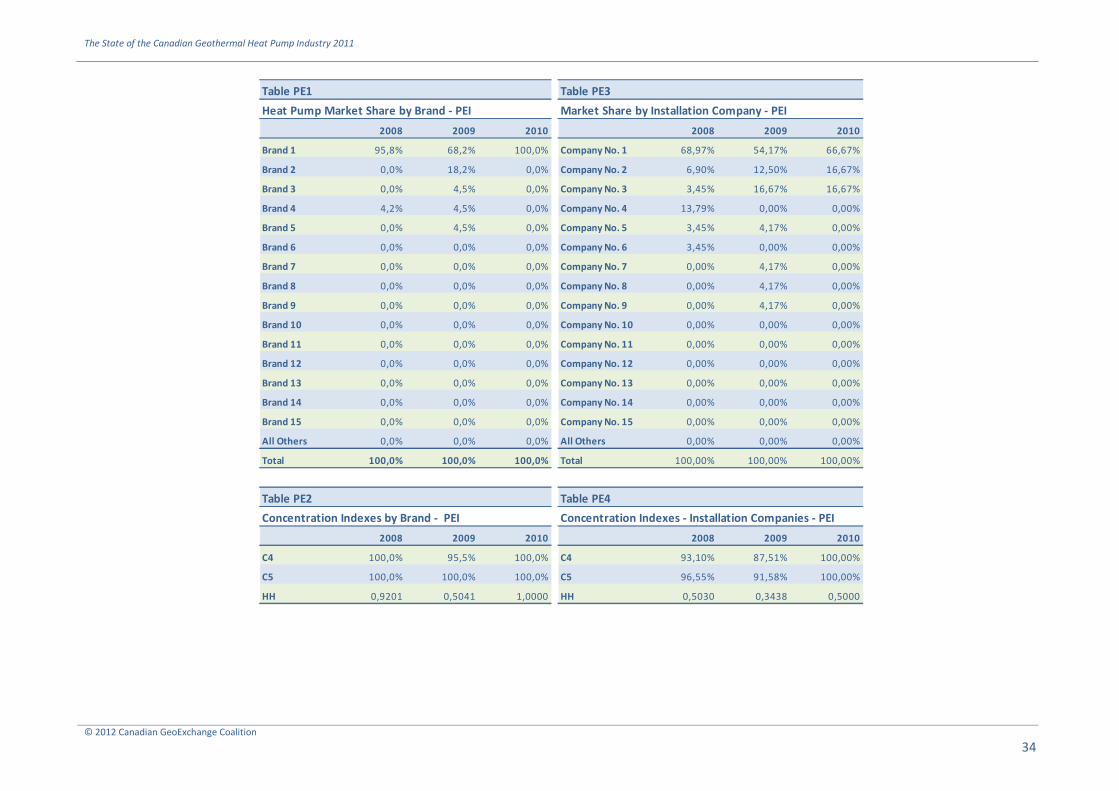
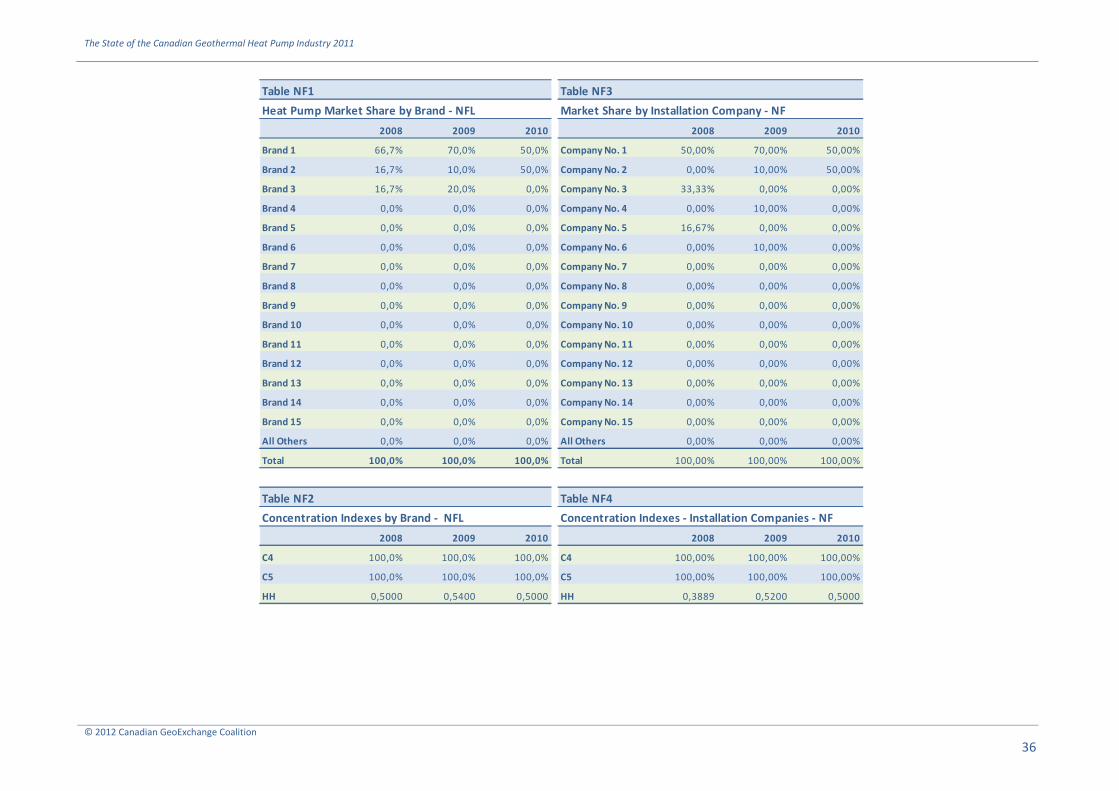
Market share by brand in individual provincial markets is also very interesting to observe3. The provincial
annexes at the end of this report provide extensive detail on market share by brands for each province.
Individual provincial markets go from very highly concentrated (Alberta, Prince Edward Island, Saskatchewan,
New Brunswick, Nova Scotia, Newfoundland & Labrador) to moderately concentrated (British Columbia,
Manitoba, Ontario, Québec).
But provincial data may not reflect the whole story behind concentration indexes. A more detailed and refined
analysis using geo-referencing software contrasting brands as well as installation companies allow us to assess
regional and sometimes local brand market
shares. Here’s an example. Considering that
installation companies normally operate within a
limited radius around their head office, a single
contractor representing a large proportion of a
particular brand sales within the province will
influence the overall concentration ratios of the
province although in reality, the market could be
heavily concentrated only in one local market
while the rest of the province shows moderate to
competitive concentration ratios.
Alternatively, we could take the hypothetical case
of another province which shows a lower
concentration index for the province as a whole
but where we find highly concentrated regional
and local markets for different brands. This could
be a sign of collusion between a small group of
contractors who informally (or formally) divided
the territory between themselves even if they do
not sell the same heat pump brand. Some
preliminary analysis performed by the CGC
Research Unit, indicate that this situation is likely
happening in at least one province. Such
limitation of competition in the market would
necessarily have an impact on market penetration
and growth.
3 Note that the brands ranking in each province reflects the local situation. This means that Brand 1 in Canada is not necessarily Brand 1
in Québec or Brand 3 in New Brunswick not necessarily the same as Brand 3 in Manitoba. In fact, some brands are at the top of the
ranking in some provinces but totally out of sight of the top 15 brands in other provinces.
Table 4A
Market Share by Installation Company - Canada
2008 2009 2010
Company No. 1 2,39% 1,88% 2,97%
Company No. 2 2,84% 3,26% 2,74%
Company No. 3 2,42% 2,61% 2,54%
Company No. 4 1,91% 2,76% 2,46%
Company No. 5 0,06% 0,08% 2,20%
Company No. 6 3,51% 3,13% 1,86%
Company No. 7 2,42% 1,66% 1,83%
Company No. 8 0,08% 0,61% 1,77%
Company No. 9 1,66% 1,46% 1,71%
Company No. 10 1,49% 1,85% 1,68%
Company No. 11 0,17% 0,82% 1,57%
Company No. 12 1,07% 0,98% 1,11%
Company No. 13 0,81% 0,98% 1,08%
Company No. 14 2,11% 1,53% 1,06%
Company No. 15 0,81% 1,02% 1,00%
All Others 76,26% 75,38% 72,42%
Total 100,00% 100,00% 100,00%
Table 4B
Concentration Indexes - Installation Companies - Canada
2008 2009 2010
C4 11,16% 11,76% 10,71%
C5 13,58% 13,64% 12,90%
HH 0,0053 0,0053 0,0056
The State of the Canadian Geothermal Heat Pump Industry 2011
© 2012 Canadian GeoExchange Coalition
13
At the Canadian level, it is no surprise that company concentration ratios by installation companies show a
highly competitive market. However, because of the local nature of the GHP industry, the national
concentration ratios are not necessarily meaningful in understanding the market dynamic. From Table 4A and
Table 4B, we see that the relative ranking of the top 15 installation companies varies a lot more than the
relative ranking of the top 15 brands. Normally, this would illustrate a competitive environment.
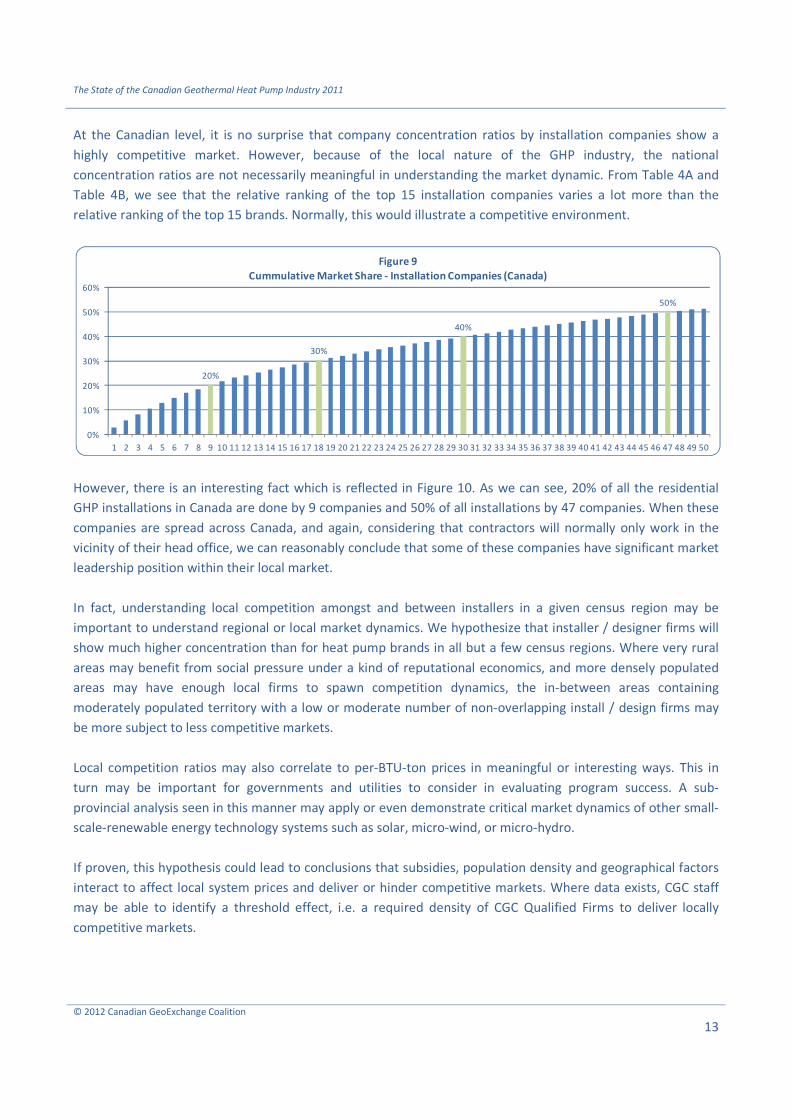
However, there is an interesting fact which is reflected in Figure 10. As we can see, 20% of all the residential
GHP installations in Canada are done by 9 companies and 50% of all installations by 47 companies. When these
companies are spread across Canada, and again, considering that contractors will normally only work in the
vicinity of their head office, we can reasonably conclude that some of these companies have significant market
leadership position within their local market.
In fact, understanding local competition amongst and between installers in a given census region may be
important to understand regional or local market dynamics. We hypothesize that installer / designer firms will
show much higher concentration than for heat pump brands in all but a few census regions. Where very rural
areas may benefit from social pressure under a kind of reputational economics, and more densely populated
areas may have enough local firms to spawn competition dynamics, the in-between areas containing
moderately populated territory with a low or moderate number of non-overlapping install / design firms may
be more subject to less competitive markets.
Local competition ratios may also correlate to per-BTU-ton prices in meaningful or interesting ways. This in
turn may be important for governments and utilities to consider in evaluating program success. A sub-
provincial analysis seen in this manner may apply or even demonstrate critical market dynamics of other small-
scale-renewable energy technology systems such as solar, micro-wind, or micro-hydro.
If proven, this hypothesis could lead to conclusions that subsidies, population density and geographical factors
interact to affect local system prices and deliver or hinder competitive markets. Where data exists, CGC staff
may be able to identify a threshold effect, i.e. a required density of CGC Qualified Firms to deliver locally
competitive markets.
20%
30%
40%
50%
0%
10%
20%
30%
40%
50%
60%
1 2 3 4 5 6 7 8 9 10 11 12 13 14 15 16 17 18 19 20 21 22 23 24 25 26 27 28 29 30 31 32 33 34 35 36 37 38 39 40 41 42 43 44 45 46 47 48 49 50
Figure 9
Cummulative Market Share - Installation Companies (Canada)

The State of the Canadian Geothermal Heat Pump Industry 2011
© 2012 Canadian GeoExchange Coalition
14
If various government assistance programs aim to create or introduce fully competitive GHP markets in all
provinces, the importance of this dynamic is self-evident. Select provinces’ poor program performance over
recent years may therefore have to do with the density of installer-designers in given areas as well as policies
which favor or hinder business activity.
The State of the Canadian Geothermal Heat Pump Industry 2011
© 2012 Canadian GeoExchange Coalition
15
Conclusion
This report has demonstrated an at-times dramatic growth, and a convincing overall upward trend in the
installation of geothermal heat pump systems in Canada, over 2005 to 2011. Geothermal heat pump systems
have displaced a significant amount of fossil fuel and therefore significantly improved many provinces’
greenhouse gas emissions profiles.
Generally, Canada’s manufacturers have improved their relative market position in a generally growing market.
This diversification trend is an extremely positive signal and a symbol of Canadian industry’s continually
growing health, professionalism and maturity.
Provincial sales leadership has also shifted, at times dramatically, over 2008-2010 in particular. Several
provincial dynamics have been discussed, but a detailed economic impact analysis is not part of the present
document.
CGC will elaborate on the results shown here with further analysis using completed 2011 data, publishing an
updated report in late 2012.
Detailed research questions or suggestions are welcomed via email to [email protected].

The State of the Canadian Geothermal Heat Pump Industry 2011
© 2012 Canadian GeoExchange Coalition
16
PROVINCIAL GRAPHS AND TABLES
The State of the Canadian Geothermal Heat Pump Industry 2011
© 2012 Canadian GeoExchange Coalition
17
British Columbia
Horizontal
46%
Pond / Lake
6%
Vertical
30%
Open
18%
Figure BC1 - Residential Systems by Loop Type
British Columbia (2008-2010)
Electricity
38,8%
Fuel oil
12,9%
Fuel oil and
electricity
0,2%
Fuel oil and
wood
2,8%
Natural gas
24,9%
Propane
14,8%
Wood
3,0%Wood pellets
2,5%
Figure BC3 - Fuel Replaced
British Columbia (2008-2010)
0%
10%
20%
30%
40%
50%
60%
70%
80%
90%
100%
2008 2009 2010
Figure BC2 - Trends in Residential Systems by Loop Type
British Columbia
Open
Vertical
Pond / Lake
Horizontal
0%
10%
20%
30%
40%
50%
60%
70%
80%
90%
100%
2008 2009 2010
Figure BC4 - Trends In Fuel Replaced
British Columbia
Wood pellets
Wood
Propane
Natural gas
Fuel oil and wood
Fuel oil and electricity
Fuel oil
Electricity

The State of the Canadian Geothermal Heat Pump Industry 2011
© 2012 Canadian GeoExchange Coalition
18
Table BC1
Heat Pump Market Share by Brand - BC
2008 2009 2010
Brand 1 38,3% 40,5% 31,9%
Brand 2 12,1% 12,2% 23,1%
Brand 3 11,2% 10,7% 14,3%
Brand 4 2,8% 8,0% 7,7%
Brand 5 17,8% 8,0% 2,2%
Brand 6 0,9% 3,8% 2,2%
Brand 7 0,0% 3,1% 1,1%
Brand 8 2,8% 3,1% 3,3%
Brand 9 1,9% 2,7% 1,1%
Brand 10 6,5% 1,9% 1,1%
Brand 11 0,9% 1,5% 0,0%
Brand 12 0,0% 1,5% 4,4%
Brand 13 0,0% 1,1% 2,2%
Brand 14 0,0% 0,8% 3,3%
Brand 15 0,9% 0,4% 0,0%
All Others 3,7% 0,8% 2,2%
Total 100,0% 100,0% 100,0%
Table BC2
Concentration Indexes by Brand - BC
2008 2009 2010
C4 79,4% 71,4% 76,9%
C5 85,9% 79,4% 79,1%
HH 0,2136 0,2080 0,1878
Table BC3
Market Share by Installation Company - BC
2008 2009 2010
Company No. 1 0,00% 11,11% 7,69%
Company No. 2 7,69% 3,70% 6,59%
Company No. 3 0,00% 6,17% 6,59%
Company No. 4 3,85% 2,06% 6,59%
Company No. 5 10,58% 8,64% 4,40%
Company No. 6 2,88% 4,12% 4,40%
Company No. 7 2,88% 3,29% 4,40%
Company No. 8 0,00% 0,82% 4,40%
Company No. 9 10,58% 9,88% 3,30%
Company No. 10 6,73% 1,65% 3,30%
Company No. 11 1,92% 0,00% 3,30%
Company No. 12 0,00% 0,00% 3,30%
Company No. 13 4,81% 2,88% 2,20%
Company No. 14 4,81% 0,00% 2,20%
Company No. 15 0,00% 2,06% 2,20%
All Others 43,27% 43,62% 35,16%
Total 100,00% 100,00% 100,00%
Table BC4
Concentration Indexes - Installation Companies - BC
2008 2009 2010
C4 35,58% 35,79% 27,47%
C5 40,39% 39,91% 31,87%
HH 0,0410 0,0395 0,0325
The State of the Canadian Geothermal Heat Pump Industry 2011
© 2012 Canadian GeoExchange Coalition
19
Alberta
Horizontal
16%
Pond / Lake
4%
Vertical
75%
Open
5%
Figure AB1 - Residential Systems by Loop Type
Alberta (2008-2010)Electricity 4,5%
Fuel oil 4,5%
Fuel oil and
electricity 0,0%
Fuel oil and
wood 0,0%
Natural gas
81,8%
Propane 6,8%
Wood 0,0%
Wood pellets
2,3%
Figure AB3 - Fuel Replaced
Alberta (2008-2010)
0%
10%
20%
30%
40%
50%
60%
70%
80%
90%
100%
2008 2009 2010
Figure AB2 - Residential Systems by Loop Type
Alberta
Open
Vertical
Pond / Lake
Horizontal
0%
10%
20%
30%
40%
50%
60%
70%
80%
90%
100%
2008 2009 2010
Figure AB4 - Trends In Fuel Replaced - Alberta
Wood pellets
Wood
Propane
Natural gas
Fuel oil and wood
Fuel oil and electricity
Fuel oil
Electricity

The State of the Canadian Geothermal Heat Pump Industry 2011
© 2012 Canadian GeoExchange Coalition
20
Table AB1
Heat Pump Market Share by Brand - AB
2008 2009 2010
Brand 1 21,1% 24,2% 33,3%
Brand 2 21,1% 24,2% 33,3%
Brand 3 15,8% 33,3% 16,7%
Brand 4 0,0% 0,0% 16,7%
Brand 5 0,0% 9,1% 0,0%
Brand 6 0,0% 0,0% 0,0%
Brand 7 5,3% 3,0% 0,0%
Brand 8 26,3% 3,0% 0,0%
Brand 9 0,0% 3,0% 0,0%
Brand 10 0,0% 0,0% 0,0%
Brand 11 10,5% 0,0% 0,0%
Brand 12 0,0% 0,0% 0,0%
Brand 13 0,0% 0,0% 0,0%
Brand 14 0,0% 0,0% 0,0%
Brand 15 0,0% 0,0% 0,0%
All Others 0,0% 0,0% 0,0%
Total 100,0% 100,0% 100,0%
Table AB2
Concentration Indexes by Brand - AB
2008 2009 2010
C4 84,3% 90,8% 100,0%
C5 94,8% 93,8% 100,0%
HH 0,1967 0,2397 0,2778
Table AB3
Market Share by Installation Company - AB
2008 2009 2010
Company No. 1 11,76% 0,00% 33,33%
Company No. 2 17,65% 39,29% 16,67%
Company No. 3 17,65% 14,29% 16,67%
Company No. 4 0,00% 0,00% 16,67%
Company No. 5 0,00% 0,00% 16,67%
Company No. 6 0,00% 17,86% 0,00%
Company No. 7 29,41% 0,00% 0,00%
Company No. 8 5,88% 10,71% 0,00%
Company No. 9 0,00% 3,57% 0,00%
Company No. 10 5,88% 0,00% 0,00%
Company No. 11 5,88% 0,00% 0,00%
Company No. 12 5,88% 0,00% 0,00%
Company No. 13 0,00% 0,00% 0,00%
Company No. 14 0,00% 0,00% 0,00%
Company No. 15 0,00% 3,57% 0,00%
All Others 0,00% 10,71% 0,00%
Total 100,00% 100,00% 100,00%
Table AB4
Concentration Indexes - Installation Companies - AB
2008 2009 2010
C4 76,47% 82,15% 83,33%
C5 82,35% 85,72% 100,00%
HH 0,1765 0,2207 0,2222
The State of the Canadian Geothermal Heat Pump Industry 2011
© 2012 Canadian GeoExchange Coalition
21
Saskatchewan
Horizontal
51%
Pond / Lake
0,4%
Vertical
47%
Open
2%
Figure SK1 - Residential Systems by Loop Type
Saskatchewan (2008-2010)
Electricity;
27,3%
Fuel oil; 42,0%
Fuel oil and
electricity; 0,4%
Fuel oil and
wood; 3,6%
Natural
gas; 10,1%
Propane; 12,4%Wood; 3,8%
Wood pellets;
0,4%
Figure SK3 - Fuel Replaced
Saskatchewan (2008-2010)
0%
10%
20%
30%
40%
50%
60%
70%
80%
90%
100%
2008 2009 2010
Figure SK2 - Residential Systems by Loop Type
Saskatchewan
Open
Vertical
Pond / Lake
Horizontal
0%
10%
20%
30%
40%
50%
60%
70%
80%
90%
100%
2008 2009 2010
Figure SK4 - Trends In Fuel Replaced
Saskatchewan
Wood pellets
Wood
Propane
Natural gas
Fuel oil and wood
Fuel oil and electricity
Fuel oil
Electricity

The State of the Canadian Geothermal Heat Pump Industry 2011
© 2012 Canadian GeoExchange Coalition
22
Table SK1
Heat Pump Market Share by Brand - SK
2008 2009 2010
Brand 1 44,4% 46,3% 50,0%
Brand 2 26,3% 18,6% 15,1%
Brand 3 12,3% 11,8% 11,6%
Brand 4 7,0% 3,6% 8,9%
Brand 5 1,8% 0,8% 3,4%
Brand 6 0,0% 1,1% 2,7%
Brand 7 3,5% 1,1% 2,7%
Brand 8 1,8% 3,0% 2,1%
Brand 9 0,0% 0,0% 2,1%
Brand 10 0,0% 0,0% 0,7%
Brand 11 0,0% 0,0% 0,7%
Brand 12 0,0% 10,4% 0,0%
Brand 13 0,0% 1,4% 0,0%
Brand 14 1,2% 0,8% 0,0%
Brand 15 0,0% 0,8% 0,0%
All Others 1,8% 0,3% 0,0%
Total 100,0% 100,0% 100,0%
Table SK2
Concentration Indexes by Brand - SK
2008 2009 2010
C4 90,0% 87,1% 85,6%
C5 93,5% 90,7% 89,0%
HH 0,2891 0,2766 0,2978
Table SK3
Market Share by Installation Company - SK
2008 2009 2010
Company No. 1 34,32% 29,78% 41,10%
Company No. 2 8,88% 13,79% 8,90%
Company No. 3 14,20% 10,66% 7,53%
Company No. 4 0,59% 4,70% 4,79%
Company No. 5 3,55% 1,25% 2,74%
Company No. 6 1,78% 3,45% 2,74%
Company No. 7 0,00% 0,94% 2,74%
Company No. 8 0,59% 0,63% 2,74%
Company No. 9 0,00% 3,45% 2,05%
Company No. 10 3,55% 0,63% 2,05%
Company No. 11 1,18% 1,57% 2,05%
Company No. 12 0,00% 0,31% 2,05%
Company No. 13 0,00% 0,00% 2,05%
Company No. 14 1,78% 2,51% 1,37%
Company No. 15 2,37% 0,94% 1,37%
All Others 0,00% 25,39% 13,70%
Total 72,78% 100,00% 100,00%
Table SK4
Concentration Indexes - Installation Companies - SK
2008 2009 2010
C4 60,95% 58,93% 62,33%
C5 64,50% 62,38% 65,07%
HH 0,1497 0,1250 0,1903

The State of the Canadian Geothermal Heat Pump Industry 2011
© 2012 Canadian GeoExchange Coalition
23
Manitoba
Horizontal
29%
Pond / Lake
1%
Vertical
52%
Open
18%
Figure MB1 - Residential Systems by Loop Type
Manitoba (2008-2010)
Electricity;
56,5%
Fuel oil; 9,1%
Fuel oil and
electricity; 0,0%
Fuel oil and
wood; 0,7%
Natural gas;
22,4%
Propane; 8,9%
Wood; 1,1%Wood pellets;
1,3%
Figure MB3 - Fuel Replaced
Manitoba (2008-2010)
0%
10%
20%
30%
40%
50%
60%
70%
80%
90%
100%
2008 2009 2010
Figure MB2 - Residential Systems by Loop Type
Manitoba
Open
Vertical
Pond / Lake
Horizontal
0%
10%
20%
30%
40%
50%
60%
70%
80%
90%
100%
2008 2009 2010
Figure MB4 - Trends In Fuel Replaced - Manitoba
Wood pellets
Wood
Propane
Natural gas
Fuel oil and wood
Fuel oil and electricity
Fuel oil
Electricity

The State of the Canadian Geothermal Heat Pump Industry 2011
© 2012 Canadian GeoExchange Coalition
24
Table MB1
Heat Pump Market Share by Brand - MB
2008 2009 2010
Brand 1 32,2% 33,1% 27,1%
Brand 2 15,4% 13,1% 15,6%
Brand 3 10,7% 18,3% 13,5%
Brand 4 5,4% 5,4% 12,5%
Brand 5 8,7% 11,0% 9,4%
Brand 6 2,7% 3,5% 9,4%
Brand 7 0,0% 3,5% 4,2%
Brand 8 2,7% 3,1% 4,2%
Brand 9 16,8% 4,5% 2,1%
Brand 10 0,0% 0,7% 1,0%
Brand 11 1,3% 0,5% 1,0%
Brand 12 0,0% 0,0% 0,0%
Brand 13 0,7% 1,4% 0,0%
Brand 14 0,0% 0,7% 0,0%
Brand 15 2,0% 0,7% 0,0%
All Others 1,3% 0,5% 0,0%
Total 100,0% 100,0% 100,0%
Table MB2
Concentration Indexes by Brand - MB
2008 2009 2010
C4 75,1% 75,5% 68,8%
C5 83,8% 80,9% 78,1%
HH 0,1802 0,1812 0,1534
Table MB3
Market Share by Installation Company - MB
2008 2009 2010
Company No. 1 12,41% 14,95% 10,53%
Company No. 2 0,00% 2,84% 8,42%
Company No. 3 6,21% 7,73% 6,32%
Company No. 4 1,38% 2,84% 6,32%
Company No. 5 2,07% 2,32% 5,26%
Company No. 6 9,66% 5,15% 4,21%
Company No. 7 2,07% 7,22% 4,21%
Company No. 8 3,45% 3,09% 4,21%
Company No. 9 1,38% 3,35% 4,21%
Company No. 10 2,07% 2,58% 4,21%
Company No. 11 2,07% 2,32% 4,21%
Company No. 12 7,59% 2,84% 3,16%
Company No. 13 2,76% 4,38% 3,16%
Company No. 14 7,59% 1,03% 3,16%
Company No. 15 2,07% 2,58% 3,16%
All Others 37,24% 34,79% 25,26%
Total 100,00% 100,00% 100,00%
Table MB4
Concentration Indexes - Installation Companies - MB
2008 2009 2010
C4 37,25% 35,05% 31,58%
C5 43,46% 39,43% 36,84%
HH 0,0446 0,0451 0,0435
The State of the Canadian Geothermal Heat Pump Industry 2011
© 2012 Canadian GeoExchange Coalition
25
Ontario
Horizontal
65%
Pond / Lake
8%
Vertical
15%
Open
12%
Figure ON1 - Residential Systems by Loop Type
Ontario (2008-2010)
Electricity;
37,7%
Fuel oil; 41,5%
Fuel oil and
electricity; 0,3%
Fuel oil and
wood; 1,9%
Natural
gas; 5,9%
Propane; 10,9%Wood; 1,2% Wood pellets;
0,4%
Figure ON3 - Fuel Replaced
Ontario (2008-2010)
0%
10%
20%
30%
40%
50%
60%
70%
80%
90%
100%
2008 2009 2010
Figure ON2 - Residential Systems by Loop Type
Ontario
Open
Vertical
Pond / Lake
Horizontal
0%
10%
20%
30%
40%
50%
60%
70%
80%
90%
100%
2008 2009 2010
Figure ON4 - Trends In Fuel Replaced - Ontario
Wood pellets
Wood
Propane
Natural gas
Fuel oil and wood
Fuel oil and electricity
Fuel oil
Electricity
The State of the Canadian Geothermal Heat Pump Industry 2011
© 2012 Canadian GeoExchange Coalition
26
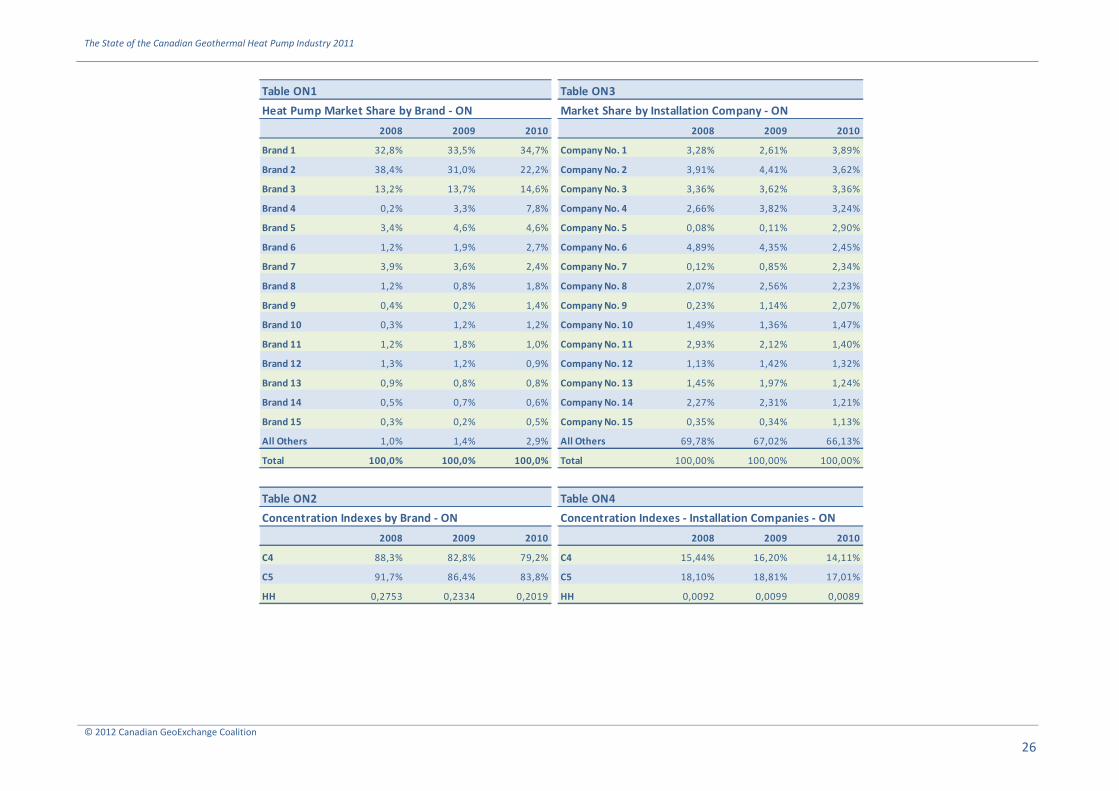
Table ON1
Heat Pump Market Share by Brand - ON
2008 2009 2010
Brand 1 32,8% 33,5% 34,7%
Brand 2 38,4% 31,0% 22,2%
Brand 3 13,2% 13,7% 14,6%
Brand 4 0,2% 3,3% 7,8%
Brand 5 3,4% 4,6% 4,6%
Brand 6 1,2% 1,9% 2,7%
Brand 7 3,9% 3,6% 2,4%
Brand 8 1,2% 0,8% 1,8%
Brand 9 0,4% 0,2% 1,4%
Brand 10 0,3% 1,2% 1,2%
Brand 11 1,2% 1,8% 1,0%
Brand 12 1,3% 1,2% 0,9%
Brand 13 0,9% 0,8% 0,8%
Brand 14 0,5% 0,7% 0,6%
Brand 15 0,3% 0,2% 0,5%
All Others 1,0% 1,4% 2,9%
Total 100,0% 100,0% 100,0%
Table ON2
Concentration Indexes by Brand - ON
2008 2009 2010
C4 88,3% 82,8% 79,2%
C5 91,7% 86,4% 83,8%
HH 0,2753 0,2334 0,2019
Table ON3
Market Share by Installation Company - ON
2008 2009 2010
Company No. 1 3,28% 2,61% 3,89%
Company No. 2 3,91% 4,41% 3,62%
Company No. 3 3,36% 3,62% 3,36%
Company No. 4 2,66% 3,82% 3,24%
Company No. 5 0,08% 0,11% 2,90%
Company No. 6 4,89% 4,35% 2,45%
Company No. 7 0,12% 0,85% 2,34%
Company No. 8 2,07% 2,56% 2,23%
Company No. 9 0,23% 1,14% 2,07%
Company No. 10 1,49% 1,36% 1,47%
Company No. 11 2,93% 2,12% 1,40%
Company No. 12 1,13% 1,42% 1,32%
Company No. 13 1,45% 1,97% 1,24%
Company No. 14 2,27% 2,31% 1,21%
Company No. 15 0,35% 0,34% 1,13%
All Others 69,78% 67,02% 66,13%
Total 100,00% 100,00% 100,00%
Table ON4
Concentration Indexes - Installation Companies - ON
2008 2009 2010
C4 15,44% 16,20% 14,11%
C5 18,10% 18,81% 17,01%
HH 0,0092 0,0099 0,0089

The State of the Canadian Geothermal Heat Pump Industry 2011
© 2012 Canadian GeoExchange Coalition
27
Québec
Horizontal
8%
Pond / Lake
2%
Vertical
83%
Open
7%
Figure QC1 - Residential Systems by Loop Type
Québec (2008-2010)
Electricity;
65,2%
Fuel oil; 27,8%
Fuel oil and
electricity; 2,2%
Fuel oil and
wood; 0,9%
Natural gas;
1,6% Propane; 2,0%
Wood; 0,3%
Wood pellets;
0,0%
Figure QC3 - Fuel Replaced
Québec (2008-2010)
0%
10%
20%
30%
40%
50%
60%
70%
80%
90%
100%
2008 2009 2010
Figure QC2 - Residential Systems by Loop Type
Québec
Open
Vertical
Pond / Lake
Horizontal
0%
10%
20%
30%
40%
50%
60%
70%
80%
90%
100%
2008 2009 2010
Figure QC4 - Trends In Fuel Replaced - Québec
Wood pellets
Wood
Propane
Natural gas
Fuel oil and wood
Fuel oil and electricity
Fuel oil
Electricity

The State of the Canadian Geothermal Heat Pump Industry 2011
© 2012 Canadian GeoExchange Coalition
28
Table QC1
Heat Pump Market Share by Brand - QC
2008 2009 2010
Brand 1 54,5% 47,5% 43,1%
Brand 2 5,9% 7,6% 12,1%
Brand 3 5,3% 5,9% 10,1%
Brand 4 5,0% 10,0% 9,1%
Brand 5 5,3% 6,4% 6,2%
Brand 6 1,6% 4,1% 4,7%
Brand 7 6,9% 6,2% 3,9%
Brand 8 3,2% 3,2% 3,2%
Brand 9 0,9% 0,3% 2,7%
Brand 10 0,2% 0,3% 2,0%
Brand 11 5,5% 4,8% 1,5%
Brand 12 1,1% 1,1% 0,7%
Brand 13 3,0% 0,8% 0,2%
Brand 14 0,2% 0,3% 0,2%
Brand 15 0,5% 0,3% 0,0%
All Others 0,9% 1,1% 0,2%
Total 100,0% 100,0% 100,0%
Table QC2
Concentration Indexes by Brand - QC
2008 2009 2010
C4 72,8% 71,5% 74,4%
C5 78,1% 77,7% 80,5%
HH 0,3185 0,2585 0,2288
Table QC3
Market Share by Installation Company - QC
2008 2009 2010
Company No. 1 20,00% 17,75% 15,76%
Company No. 2 6,74% 10,42% 9,36%
Company No. 3 3,49% 4,72% 6,16%
Company No. 4 13,26% 6,35% 4,93%
Company No. 5 1,40% 1,30% 4,93%
Company No. 6 3,95% 5,70% 4,43%
Company No. 7 0,47% 0,65% 3,20%
Company No. 8 5,12% 2,93% 2,96%
Company No. 9 3,02% 3,42% 2,96%
Company No. 10 1,63% 2,12% 2,71%
Company No. 11 0,93% 1,30% 2,71%
Company No. 12 0,00% 3,26% 2,22%
Company No. 13 0,00% 0,98% 1,97%
Company No. 14 1,40% 0,81% 1,97%
Company No. 15 3,02% 1,79% 1,72%
All Others 35,58% 36,48% 32,02%
Total 100,00% 100,00% 100,00%
Table QC4
Concentration Indexes - Installation Companies - QC
2008 2009 2010
C4 45,12% 40,22% 36,21%
C5 49,07% 44,94% 41,13%
HH 0,0701 0,0563 0,0500
The State of the Canadian Geothermal Heat Pump Industry 2011
© 2012 Canadian GeoExchange Coalition
29
New Brunswick
Horizontal
27%
Pond / Lake
0%Vertical
26%
Open
47%
Figure NB1 - Residential Systems by Loop Type
New Brunswick (2008-2010)
Electricity;
55,2%
Fuel oil; 27,2%
Fuel oil and
electricity; 0,7%
Fuel oil and
wood; 3,6%
Natural gas;
0,4%
Propane; 2,2% Wood; 7,2% Wood pellets;
3,6%
Figure NB3 - Fuel Replaced
New Brunswick (2008-2010)
0%
10%
20%
30%
40%
50%
60%
70%
80%
90%
100%
2008 2009 2010
Figure NB2 - Residential Systems by Loop Type
New Brunswick
Open
Vertical
Pond / Lake
Horizontal
0%
10%
20%
30%
40%
50%
60%
70%
80%
90%
100%
2008 2009 2010
Figure NB4 - Trends In Fuel Replaced
New Brunswick
Wood pellets
Wood
Propane
Natural gas
Fuel oil and wood
Fuel oil and electricity
Fuel oil
Electricity
The State of the Canadian Geothermal Heat Pump Industry 2011
© 2012 Canadian GeoExchange Coalition
30
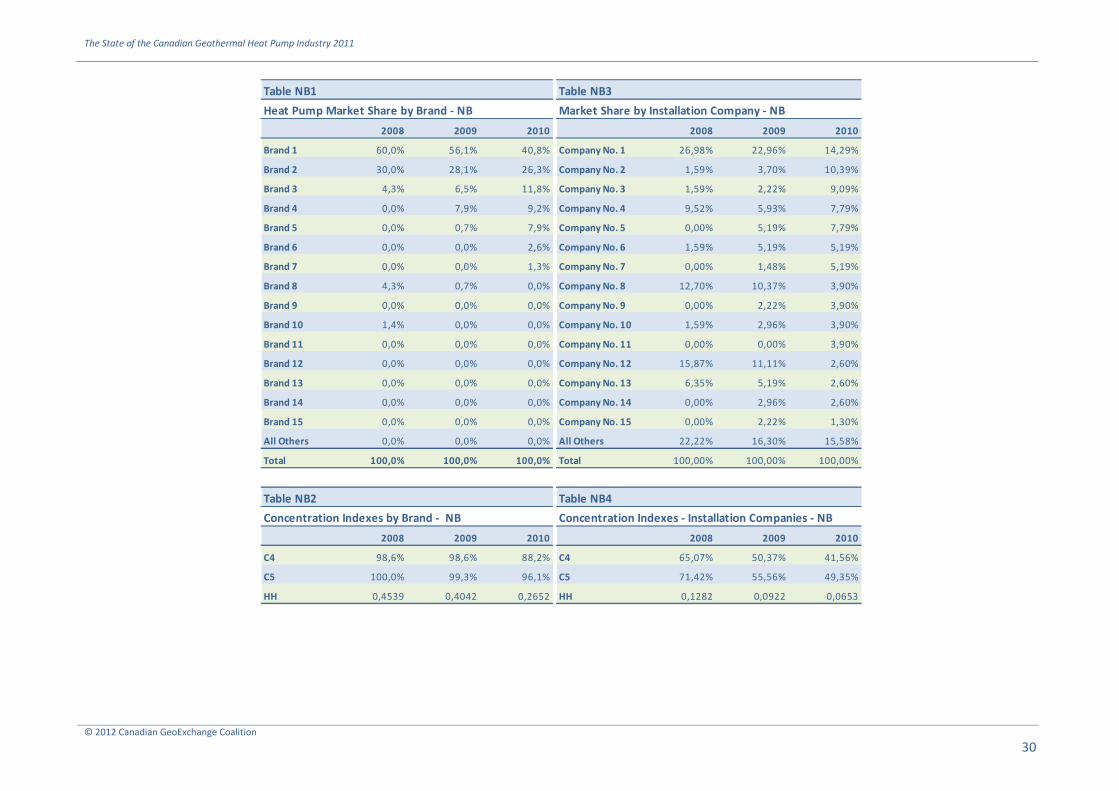
Table NB1
Heat Pump Market Share by Brand - NB
2008 2009 2010
Brand 1 60,0% 56,1% 40,8%
Brand 2 30,0% 28,1% 26,3%
Brand 3 4,3% 6,5% 11,8%
Brand 4 0,0% 7,9% 9,2%
Brand 5 0,0% 0,7% 7,9%
Brand 6 0,0% 0,0% 2,6%
Brand 7 0,0% 0,0% 1,3%
Brand 8 4,3% 0,7% 0,0%
Brand 9 0,0% 0,0% 0,0%
Brand 10 1,4% 0,0% 0,0%
Brand 11 0,0% 0,0% 0,0%
Brand 12 0,0% 0,0% 0,0%
Brand 13 0,0% 0,0% 0,0%
Brand 14 0,0% 0,0% 0,0%
Brand 15 0,0% 0,0% 0,0%
All Others 0,0% 0,0% 0,0%
Total 100,0% 100,0% 100,0%
Table NB2
Concentration Indexes by Brand - NB
2008 2009 2010
C4 98,6% 98,6% 88,2%
C5 100,0% 99,3% 96,1%
HH 0,4539 0,4042 0,2652
Table NB3
Market Share by Installation Company - NB
2008 2009 2010
Company No. 1 26,98% 22,96% 14,29%
Company No. 2 1,59% 3,70% 10,39%
Company No. 3 1,59% 2,22% 9,09%
Company No. 4 9,52% 5,93% 7,79%
Company No. 5 0,00% 5,19% 7,79%
Company No. 6 1,59% 5,19% 5,19%
Company No. 7 0,00% 1,48% 5,19%
Company No. 8 12,70% 10,37% 3,90%
Company No. 9 0,00% 2,22% 3,90%
Company No. 10 1,59% 2,96% 3,90%
Company No. 11 0,00% 0,00% 3,90%
Company No. 12 15,87% 11,11% 2,60%
Company No. 13 6,35% 5,19% 2,60%
Company No. 14 0,00% 2,96% 2,60%
Company No. 15 0,00% 2,22% 1,30%
All Others 22,22% 16,30% 15,58%
Total 100,00% 100,00% 100,00%
Table NB4
Concentration Indexes - Installation Companies - NB
2008 2009 2010
C4 65,07% 50,37% 41,56%
C5 71,42% 55,56% 49,35%
HH 0,1282 0,0922 0,0653
The State of the Canadian Geothermal Heat Pump Industry 2011
© 2012 Canadian GeoExchange Coalition
31
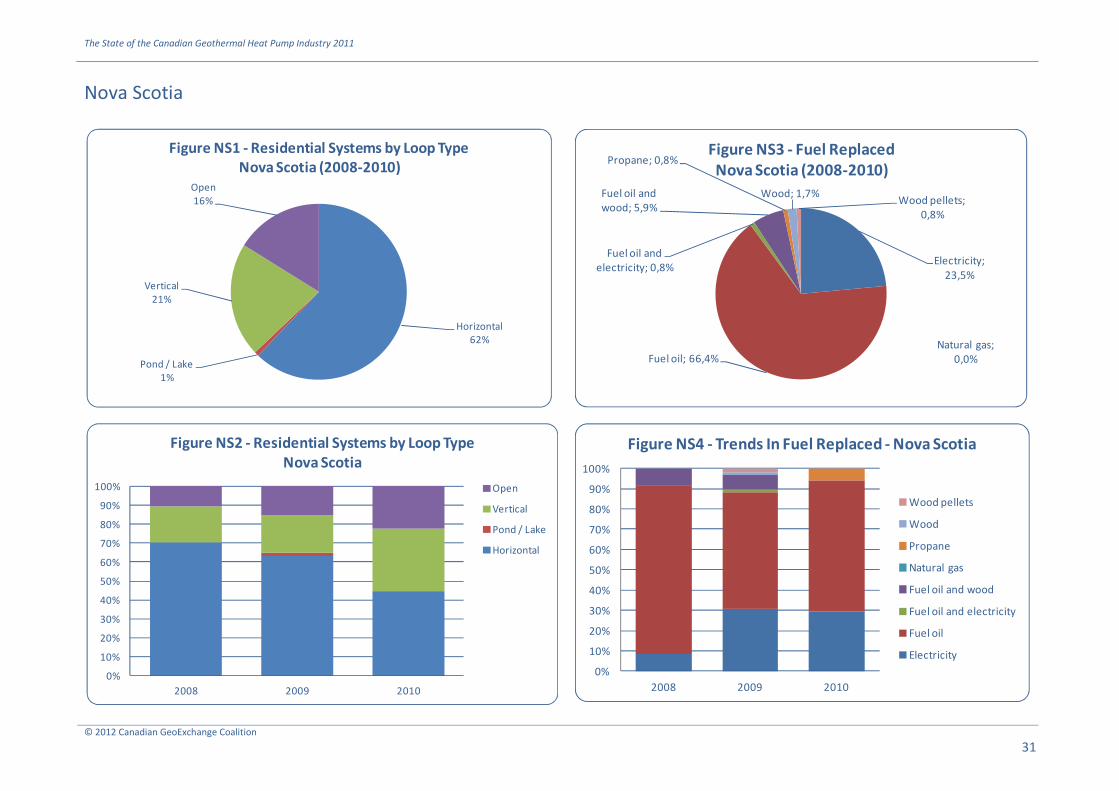
Nova Scotia
Horizontal
62%
Pond / Lake
1%
Vertical
21%
Open
16%
Figure NS1 - Residential Systems by Loop Type
Nova Scotia (2008-2010)
Electricity;
23,5%
Fuel oil; 66,4%
Fuel oil and
electricity; 0,8%
Fuel oil and
wood; 5,9%
Natural gas;
0,0%
Propane; 0,8%
Wood; 1,7%Wood pellets;
0,8%
Figure NS3 - Fuel Replaced
Nova Scotia (2008-2010)
0%
10%
20%
30%
40%
50%
60%
70%
80%
90%
100%
2008 2009 2010
Figure NS2 - Residential Systems by Loop Type
Nova Scotia
Open
Vertical
Pond / Lake
Horizontal
0%
10%
20%
30%
40%
50%
60%
70%
80%
90%
100%
2008 2009 2010
Figure NS4 - Trends In Fuel Replaced - Nova Scotia
Wood pellets
Wood
Propane
Natural gas
Fuel oil and wood
Fuel oil and electricity
Fuel oil
Electricity

The State of the Canadian Geothermal Heat Pump Industry 2011
© 2012 Canadian GeoExchange Coalition
32
Table NS1
Heat Pump Market Share by Brand - NS
2008 2009 2010
Brand 1 21,6% 29,7% 42,1%
Brand 2 45,9% 37,8% 36,8%
Brand 3 10,8% 4,1% 10,5%
Brand 4 16,2% 12,2% 5,3%
Brand 5 0,0% 4,1% 5,3%
Brand 6 2,7% 8,1% 0,0%
Brand 7 0,0% 1,4% 0,0%
Brand 8 0,0% 1,4% 0,0%
Brand 9 2,7% 1,4% 0,0%
Brand 10 0,0% 0,0% 0,0%
Brand 11 0,0% 0,0% 0,0%
Brand 12 0,0% 0,0% 0,0%
Brand 13 0,0% 0,0% 0,0%
Brand 14 0,0% 0,0% 0,0%
Brand 15 0,0% 0,0% 0,0%
All Others 0,0% 0,0% 0,0%
Total 100,0% 100,0% 100,0%
Table NS2
Concentration Indexes by Brand - NS
2008 2009 2010
C4 94,5% 87,8% 94,7%
C5 97,2% 91,9% 100,0%
HH 0,2973 0,2568 0,3296
Table NS3
Market Share by Installation Company - NS
2008 2009 2010
Company No. 1 5,56% 18,06% 21,05%
Company No. 2 13,89% 15,28% 21,05%
Company No. 3 13,89% 9,72% 10,53%
Company No. 4 5,56% 4,17% 10,53%
Company No. 5 22,22% 11,11% 5,26%
Company No. 6 2,78% 13,89% 5,26%
Company No. 7 13,89% 5,56% 5,26%
Company No. 8 2,78% 2,78% 5,26%
Company No. 9 0,00% 1,39% 5,26%
Company No. 10 0,00% 1,39% 5,26%
Company No. 11 0,00% 0,00% 5,26%
Company No. 12 11,11% 9,72% 0,00%
Company No. 13 5,56% 1,39% 0,00%
Company No. 14 0,00% 0,00% 0,00%
Company No. 15 0,00% 1,39% 0,00%
All Others 2,78% 4,17% 0,00%
Total 100,00% 100,00% 100,00%
Table NS4
Concentration Indexes - Installation Companies - NS
2008 2009 2010
C4 63,89% 58,34% 63,16%
C5 75,00% 68,06% 68,42%
HH 0,1304 0,1128 0,1302
The State of the Canadian Geothermal Heat Pump Industry 2011
© 2012 Canadian GeoExchange Coalition
33
Prince Edward Island
Horizontal
10%
Pond / Lake
0%
Vertical
0%Open
90%
Figure PE1 - Residential Systems by Loop Type
Prince Edward Island (2008-2010)
Electricity 8,8%
Fuel oil 84,2% Fuel oil and
electricity 0,0%
Fuel oil and
wood 0,0%
Natural gas 0,0%
Propane 7,0%
Wood 0,0%
Wood pellets
0,0%
Figure PE3 - Fuel Replaced
Prince Edward Island (2008-2010)
0%
10%
20%
30%
40%
50%
60%
70%
80%
90%
100%
2008 2009 2010
Figure PE2- Residential Systems by Loop Type
Prince Edward Island
Open
Vertical
Pond / Lake
Horizontal
0%
10%
20%
30%
40%
50%
60%
70%
80%
90%
100%
2008 2009 2010
Figure PE4 - Trends In Fuel Replaced - Prince
Edward Island
Wood pellets
Wood
Propane
Natural gas
Fuel oil and wood
Fuel oil and electricity
Fuel oil
Electricity
The State of the Canadian Geothermal Heat Pump Industry 2011
© 2012 Canadian GeoExchange Coalition
34
Table PE1
Heat Pump Market Share by Brand - PEI
2008 2009 2010
Brand 1 95,8% 68,2% 100,0%
Brand 2 0,0% 18,2% 0,0%
Brand 3 0,0% 4,5% 0,0%
Brand 4 4,2% 4,5% 0,0%
Brand 5 0,0% 4,5% 0,0%
Brand 6 0,0% 0,0% 0,0%
Brand 7 0,0% 0,0% 0,0%
Brand 8 0,0% 0,0% 0,0%
Brand 9 0,0% 0,0% 0,0%
Brand 10 0,0% 0,0% 0,0%
Brand 11 0,0% 0,0% 0,0%
Brand 12 0,0% 0,0% 0,0%
Brand 13 0,0% 0,0% 0,0%
Brand 14 0,0% 0,0% 0,0%
Brand 15 0,0% 0,0% 0,0%
All Others 0,0% 0,0% 0,0%
Total 100,0% 100,0% 100,0%
Table PE2
Concentration Indexes by Brand - PEI
2008 2009 2010
C4 100,0% 95,5% 100,0%
C5 100,0% 100,0% 100,0%
HH 0,9201 0,5041 1,0000
Table PE3
Market Share by Installation Company - PEI
2008 2009 2010
Company No. 1 68,97% 54,17% 66,67%
Company No. 2 6,90% 12,50% 16,67%
Company No. 3 3,45% 16,67% 16,67%
Company No. 4 13,79% 0,00% 0,00%
Company No. 5 3,45% 4,17% 0,00%
Company No. 6 3,45% 0,00% 0,00%
Company No. 7 0,00% 4,17% 0,00%
Company No. 8 0,00% 4,17% 0,00%
Company No. 9 0,00% 4,17% 0,00%
Company No. 10 0,00% 0,00% 0,00%
Company No. 11 0,00% 0,00% 0,00%
Company No. 12 0,00% 0,00% 0,00%
Company No. 13 0,00% 0,00% 0,00%
Company No. 14 0,00% 0,00% 0,00%
Company No. 15 0,00% 0,00% 0,00%
All Others 0,00% 0,00% 0,00%
Total 100,00% 100,00% 100,00%
Table PE4
Concentration Indexes - Installation Companies - PEI
2008 2009 2010
C4 93,10% 87,51% 100,00%
C5 96,55% 91,58% 100,00%
HH 0,5030 0,3438 0,5000
The State of the Canadian Geothermal Heat Pump Industry 2011
© 2012 Canadian GeoExchange Coalition
35
Newfoundland & Labrador
Horizontal
10%
Pond / Lake
0%
Vertical
58%
Open
32%
Figure NF1 - Residential Systems by Loop Type
Newfoundland & Labrador (2008-2010)
Electricity 33,3%
Fuel oil 61,1%
Fuel oil and
electricity 5,6%
Fuel oil and
wood 0,0%
Natural gas 0,0%
Propane 0,0%
Wood 0,0%
Wood pellets
0,0%
Figure NF3 - Fuel Replaced
Newfoundland & Labrador (2008-2010)
0%
10%
20%
30%
40%
50%
60%
70%
80%
90%
100%
2008 2009 2010
Figure NF2 - Residential Systems by Loop Type
Newfoundland & Labrador
Open
Vertical
Pond / Lake
Horizontal
0%
10%
20%
30%
40%
50%
60%
70%
80%
90%
100%
2008 2009 2010
Figure NF4 - Trends In Fuel Replaced
Newfoundland & Labrador
Wood pellets
Wood
Propane
Natural gas
Fuel oil and wood
Fuel oil and electricity
Fuel oil
Electricity
The State of the Canadian Geothermal Heat Pump Industry 2011
© 2012 Canadian GeoExchange Coalition
36
Table NF1
Heat Pump Market Share by Brand - NFL
2008 2009 2010
Brand 1 66,7% 70,0% 50,0%
Brand 2 16,7% 10,0% 50,0%
Brand 3 16,7% 20,0% 0,0%
Brand 4 0,0% 0,0% 0,0%
Brand 5 0,0% 0,0% 0,0%
Brand 6 0,0% 0,0% 0,0%
Brand 7 0,0% 0,0% 0,0%
Brand 8 0,0% 0,0% 0,0%
Brand 9 0,0% 0,0% 0,0%
Brand 10 0,0% 0,0% 0,0%
Brand 11 0,0% 0,0% 0,0%
Brand 12 0,0% 0,0% 0,0%
Brand 13 0,0% 0,0% 0,0%
Brand 14 0,0% 0,0% 0,0%
Brand 15 0,0% 0,0% 0,0%
All Others 0,0% 0,0% 0,0%
Total 100,0% 100,0% 100,0%
Table NF2
Concentration Indexes by Brand - NFL
2008 2009 2010
C4 100,0% 100,0% 100,0%
C5 100,0% 100,0% 100,0%
HH 0,5000 0,5400 0,5000
Table NF3
Market Share by Installation Company - NF
2008 2009 2010
Company No. 1 50,00% 70,00% 50,00%
Company No. 2 0,00% 10,00% 50,00%
Company No. 3 33,33% 0,00% 0,00%
Company No. 4 0,00% 10,00% 0,00%
Company No. 5 16,67% 0,00% 0,00%
Company No. 6 0,00% 10,00% 0,00%
Company No. 7 0,00% 0,00% 0,00%
Company No. 8 0,00% 0,00% 0,00%
Company No. 9 0,00% 0,00% 0,00%
Company No. 10 0,00% 0,00% 0,00%
Company No. 11 0,00% 0,00% 0,00%
Company No. 12 0,00% 0,00% 0,00%
Company No. 13 0,00% 0,00% 0,00%
Company No. 14 0,00% 0,00% 0,00%
Company No. 15 0,00% 0,00% 0,00%
All Others 0,00% 0,00% 0,00%
Total 100,00% 100,00% 100,00%
Table NF4
Concentration Indexes - Installation Companies - NF
2008 2009 2010
C4 100,00% 100,00% 100,00%
C5 100,00% 100,00% 100,00%
HH 0,3889 0,5200 0,5000

CGC RESEARCH UNIT
Industry Information Paper
CGC-RU-IIP-2012/01E