Embed Size (px)
Citation preview
7/27/2019 The State of the Internet Report FIRST QUARTER, 2013
http://slidepdf.com/reader/full/the-state-of-the-internet-report-first-quarter-2013 1/3
The State of the Internet ReportAMERICAS HIGHLIGHTS – FIRST QUARTER, 2013
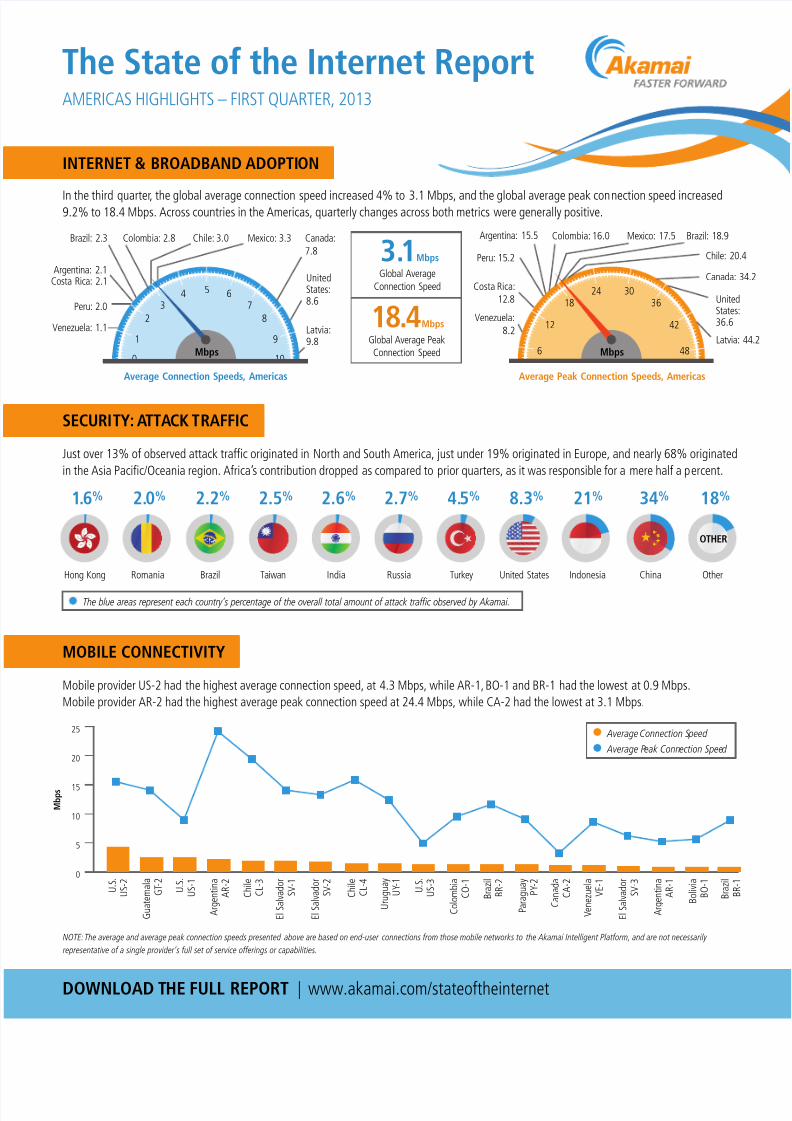
In the third quarter, the global average connection speed increased 4% to 3.1 Mbps, and the global average peak connection speed increased9.2% to 18.4 Mbps. Across countries in the Americas, quarterly changes across both metrics were generally positive.
Just over 13% of observed attack traffic originated in North and South America, just under 19% originated in Europe, and nearly 68% originated
in the Asia Pacific/Oceania region. Africa’s contribution dropped as compared to prior quarters, as it was responsible for a mere half a percent.
Mobile provider US-2 had the highest average connection speed, at 4.3 Mbps, while AR-1, BO-1 and BR-1 had the lowest at 0.9 Mbps.
Mobile provider AR-2 had the highest average peak connection speed at 24.4 Mbps, while CA-2 had the lowest at 3.1 Mbps.
SECURITY: ATTACK TRAFFIC
INTERNET & BROADBAND ADOPTION
MOBILE CONNECTIVITY
2.6%
India
2.0%
Romania
2.2%
Brazil
4.5%
Turkey
2.5%
Taiwan
2.7%
Russia
8.3%
United States
34%
China
18%
Other
OTHER
21%
Indonesia
1.6%
Hong Kong
The blue areas represent each country’s percentage of the overall total amount of attack traffic observed by Akamai.
Average Connection Speed
Average Peak Connection Speed
6 48
12 42
18 3624 30
Mbps
Average Peak Connection Speeds, Americas
UnitedStates:36.6
Brazil: 18.9
Peru: 15.2
Mexico: 17.5Colombia: 16.0
Venezuela:
8.2
Canada: 3
Latvia:
Costa Rica:12.8
Chile: 20.
Argentina: 15.5
1 9
0 10
82
7364 5
Mbps
Average Connection Speeds, Americas
UnitedStates:8.6
Latvia:9.8
Argentina: 2.1
Peru: 2.0
Colombia: 2.8 Mexico: 3.3Chile: 3.0
Costa Rica: 2.1
Canada:
7.8
Brazil: 2.3
Venezuela: 1.1
Global Average
Connection Speed
Global Average PeakConnection Speed
3.1Mbps
18.4Mbps
DOWNLOAD THE FULL REPORT | www.akamai.com/stateoftheinternet
NOTE: The average and average peak connection speeds presented above are based on end-user connections from those mobile networks to the Akamai Intelligent Platform, and are not necessarily
representative of a single provider’s full set of service offerings or capabilities.
0
5
10
15
20
25
A r g e n t i n a
A R - 2
U . S .
U S - 1
C h i l e
C L - 3
E l S a l v a d o r
S V - 2
E l S a l v a d o r
S V - 1
C h i l e
C L - 4
U . S .
U S - 2
G u a t e m a l a
G T - 2
U . S .
U S - 3
C o l o m b i a
C O - 1
B r a z i l
B R - 2
P a r a g u a y
P Y - 2
C a n a d a
C A - 2
V e n e z u e l a
V E - 1
E l S a l v a d o r
S V - 3
A r g e n t i n a
A R - 1
B o l i v i a
B O - 1
B r a z i l
B R - 1
U r u g u a y
U Y - 1
M b p s

7/27/2019 The State of the Internet Report FIRST QUARTER, 2013
http://slidepdf.com/reader/full/the-state-of-the-internet-report-first-quarter-2013 2/3
The State of the Internet ReportEMEA HIGHLIGHTS – FIRST QUARTER, 2013
In the third quarter, the global average connection speed increased 4% to 3.1 Mbps, and the global average peak connection speed increased9.2% to 18.4 Mbps. Across countries in EMEA, quarterly changes across both metrics were generally positive.
Just over 13% of observed attack traffic originated in North and South America, just under 19% originated in Europe, and nearly 68% originated
in the Asia Pacific/Oceania region. Africa’s contribution dropped as compared to prior quarters, as it was responsible for a mere half a percent.
SECURITY: ATTACK TRAFFIC
INTERNET & BROADBAND ADOPTION
MOBILE CONNECTIVITY
18%
Other
OTHER
2.6%
India
2.0%
Romania
2.2%
Brazil
4.5%
Turkey
2.5%
Taiwan
2.7%
Russia
8.3%
United States
34%
China
21%
Indonesia
1.6%
Hong Kong
The blue areas represent each country’s percentage of the overall total amount of attack traffic observed by Akamai.
15 50
20 45
25 4030 35
Mbps
Average Peak Connection Speeds, EMEA
11
10
98
7654
3
2
1
0Mbps
Average Connection Speeds, EMEA
Italy: 4.4
Global AverageConnection Speed
Global Average Peak
Connection Speed
3.1Mbps
18.4Mbps
DOWNLOAD THE FULL REPORT | www.akamai.com/stateoftheinternet
NOTE: The average and average peak connection speeds presented above are based on end-user connections from those mobile networks to the Akamai Intelligent Platform, and are not necessarily
representative of a single provider’s full set of service offerings or capabilities.
Mobile providers AT-2 had the highest average connection speed, at 7.6 Mbps, while RO-1 had the lowest at 1.1 Mbps. Mobile provider DE-2
had the highest average peak connection speed at 32.8 Mbps, while RO-1 had the lowest at 7.4 Mbps.
Average Connection Speed
Average Peak Connection Speed
0
10
20
30
40
50
5.77.6
32.4
France: 5.2
Spain: 5.2
Portugal: 5.3
Germany: 6.9
Israel: 7
Ireland: 7.3
Belgium: 7.4
Norway: 7.4
Romania: 7.5
Finland: 7.7
Austria: 7.9
United Kingdom: 7.9
Denmark: 8.2
Sweden: 8.9
Latvia: 9.8
Netherlands: 9.9
Switzerland: 10.1
Norway: 44.2Belgium: 21.8
Germany: 23.5
Finland: 28.7
Spain: 29.5
Italy: 30.6 Ireland: 30.9
Israel: 30.8 Denmark: 31.3
Austria: 34.5Sweden: 34.9
Switzerland: 35.9Netherlands: 36.3
France: 38Romania: 38.2
Latvia: 40.3
United Kingdom: 47.9
A u s t r i a
A T - 2
G e r m a n y
D E - 2
A u s t r i a
A T - 1
N o r w a y
N O - 1
S p a i n
E S - 1
I t a l y
I T - 3
U n i t e d K i n g d o m
U K - 2
I r e l a n d
I E - 1
I t a l y
I T - 2
U n i t e d K i n g d o m
U K - 3
F r a n c e
F R - 2
U n i t e d K i n g d o m
U K - 1
I r e l a n d
I E - 3
N e t h e r l a n d s
N L - 1
I t a l y
I T - 4
B e l g i u m
B E - 2
I r e l a n d
I E - 2
N e t h e r l a n d s
N L - 2
B e l g i u m
B E - 3
I s r a e l
I L - 1
G e r m a n y
D E - 1
R o m a n i a
R O - 1
4.8 4.6 4.1 3.7 3.5 3.3 3 2.8 2.7 2.5 2.3 2.2 2.1 2 2.7 1.9 1.7 1.7 1.3 1.1
32.8
22.3
29.2 28
19.617.5 18.5 19.3
17.3
11.1
23.219.2
6.1
17.4
6.8
20.2
6.711.6
9.16.2 7.4

7/27/2019 The State of the Internet Report FIRST QUARTER, 2013
http://slidepdf.com/reader/full/the-state-of-the-internet-report-first-quarter-2013 3/3
The State of the Internet ReportASIA-PACIFIC – FIRST QUARTER, 2013
In the third quarter, the global average connection speed increased 4% to 3.1 Mbps, and the global average peak connection speed increased9.2% to 18.4 Mbps. Across countries in Asia-Pacific, quarterly changes across both metrics were generally positive.
Just over 13% of observed attack traffic originated in North and South America, just under 19% originated in Europe, and nearly 68% originated
in the Asia Pacific/Oceania region. Africa’s contribution dropped as compared to prior quarters, as it was responsible for a mere half a percent.
SECURITY: ATTACK TRAFFIC
INTERNET & BROADBAND ADOPTION
MOBILE CONNECTIVITY
18%
Other
OTHER
2.6%
India
2.0%
Romania
2.2%
Brazil
4.5%
Turkey
2.5%
Taiwan
2.7%
Russia
8.3%
United States
34%
China
21%
Indonesia
1.6%
Hong Kong
The blue areas represent each country’s percentage of the overall total amount of attack traffic observed by Akamai.
0 70
10 60
20 5030 40
Mbps
Average Peak Connection Speeds, Asia-Pacific
SouthKorea:
63.6
0
2
4
6 8 10
12
14
16Mbps
Average Connection Speeds, Asia-Pacific
SouthKorea:14.2
Global Average
Connection Speed
Global Average Peak
Connection Speed
3.1Mbps
18.4Mbps
DOWNLOAD THE FULL REPORT | www.akamai.com/stateoftheinternet
NOTE: The average and average peak connection speeds presented above are based on end-user connections from those mobile networks to the Akamai Intelligent Platform, and
are not necessarily representative of a single provider’s full set of service offerings or capabilities.
Mobile providers HK-1 and HK-2 had the highest average connection speed, at 2.9 Mbps, while NC-1 and MY-1 had the lowest at 0.7 Mbps.
Mobile provider HK-1 had the highest average peak connection speed at 45.6 Mbps, while NC-1 had the lowest at 5.7 Mbps.
Average Connection Speed
Average Peak Connection Speed
0
10
20
30
40
50
A u s t r a
l i a
A U - 3
H o n g K o n g
H K - 2
H o n g K o n g
H K - 1
M a
l a y s i a
M Y - 2
C h i n a
C N - 1
S i n g a p o r e
S G - 3
N e w Z e a
l a n
d
N Z - 2
T a i w a n
T W - 1
M a
l a y s i a
M Y - 3
P a
k i s t a n
P K - 1
S a u
d i A r a
b i a
S A - 1
T a i w a n
T W - 2
K u w a i t
K W - 1
Q a t a r
Q A - 1
S r i L a n
k a
L K - 1
T h a i l a n
d
T H - 1
I n d o n e s i a
I D - 1
N e w C a
l e d o n i a
N C - 1
M a
l a y s i a
M Y - 1
M b p s
2.4
15.9
India: 1.3hilippines: 1.4
China: 1.7
Indonesia: 1.5
Vietnam: 1.5
Malaysia: 2.7
Taiwan: 4.3New Zealand: 4.4
Thailand: 4.4
Australia: 4.7
Singapore: 6.9 Hong Kong: 10.9
Japan: 11.7
India: 8.3Philippines: 10.6
Indonesia: 11.6Vietnam: 12.8
China: 13.9
Malaysia: 20.2
Taiwan: 23.6New Zealand: 26.3 Thailand: 30.1
Australia: 31.3Singapore: 41.1
Hong Kong: 44.8Japan: 50
2.9 2.9 2.4 2.2 2.2 2 1.7 1.6 1.5 1.5 1.5 1.4 1.4 1.4 1.1 0.8 0.7 0.7
17.1
45.6
22.3
6.5
12 13.4 12.410.6 10.3
12.6 12.8 12.2 12.3
13.7
26.9
11.9
5.7 6.3