Embed Size (px)
Citation preview

THE STATE OF UGANDA’SBIODIVERSITY 2017
National Biodiversity Data Bank
Department of Environment Management, College of Agricultural and Environmental Sciences,
Makerere UniversityDerek Pomeroy, Herbert Tushabe and Jonathan Loh
Photographs by Achilles Byaruhanga
June 2017
NatureUganda
Verreaux's Eagle-owl Lappet-faced Vulture
Swallow-tail Butter�y
Zebras
Red Colobus Monkeys
Defassa Waterbucks
NATIONAL BIODIVERSITY DATA BANK
Printed byPress Graphics
Creative Designing / Offset, Digital & Large format Printing / Promotional Items Kalobwa House, Plot 21, Nkurumah Road.
Tel: +256 759 802 863 / +256 712 802 863Email: [email protected]

An elephant on Kazinga Channel, Queen Elizabeth National Park
Suggested Citation: Pomeroy, D. Tushabe, H. and Loh, J. 2017. The State of Uganda’s Biodiversity 2017. Makerere University. Kampala
ISBN: 978-9970-9690-0-5
Suggested Citation:
Pomeroy, D. Tushabe, H. and Loh, J. 2017. The State of Uganda’s Biodiversity 2017. National Biodiversity Data Bank. Makerere University. Kampala
ISBN: 978-9970-9690-0-5

i
FOREWORD Article 7 of the Convention on Biological Diversity (Identification and Monitoring) urges Contracting Parties, of which Uganda is one, to identify and monitor components of the country’s biodiversity, and to maintain and organise data related to the biodiversity components. The National Biodiversity Data Bank at the College of Agriculture and Environmental Sciences, Makerere University, has spearheaded monitoring activities through the production of the State of Uganda’s Biodiversity reports since 1999. This latest report, which focuses on important biodiversity indicators for the country, is one of them. Biodiversity sustainability is very important for national development. The value of biodiversity is well recognised in national planning processes such as Uganda Vision 2040 of the National Planning Authority and the National Biodiversity Strategy and Action Plan of the National Environmental Management Authority. Increased efforts to conserve biodiversity and maintain its sustainable use are targets in both. These targets cannot be achieved unless the status of biodiversity components is known. Development of national biodiversity indicators and their continuous monitoring are important tools for achieving these national goals. Makerere University, and other universities in Uganda, recognise the importance of science in conservation, and for example, Makerere University has courses in Conservation Biology. It is our hope that the scientists being trained by these institutions will continue to work towards improving conservation. Many of them already work for national agencies such as the Uganda Wildlife Authority, National Forest Authority and National Environment Management Authority. A number are working for consultancies involving biodiversity conservation and assessment of development impacts. We hope that this report will be useful, both to the Government of Uganda, and to others, in informing policy formulation and implementation.

ii
Dragonfly in L Opeta Wetland
Forest butterflis (Charaxes sp) and some bees feeding on the forest floor, Bwindi Impenetrable Forest National Park

ii
Dragonfly in L Opeta Wetland
Forest butterflis (Charaxes sp) and some bees feeding on the forest floor, Bwindi Impenetrable Forest National Park
iii
EXECUTIVE SUMMARY Uganda is famous around the world for its biodiversity, which is especially enjoyed because so much of it is set in very fine scenery. But, in common with most of the world, some of this richness is being lost. All countries that are signatories to the Convention on Biological Diversity (CBD) – and this includes Uganda - are committed to reducing and eventually reversing the rate of loss, whilst at the same time managing the biodiversity for the benefit of all Ugandans, including the sustainable use of natural resources. This process is being supported by Uganda’s National Biodiversity Strategy and Action Plan (NBSAP) (NEMA 2017). This report aims to throw light on how well Uganda is doing, and where more action is going to be needed. Recent trends in the various indicators are intended for this purpose. Biodiversity can be considered at three levels – genetic, species and ecosystem. At the genetic level, the most important change in recent decades has been the loss of well over a hundred cichlid fish species from Lake Victoria, following the introduction in late colonial days of the Nile Perch. A few other species, such as the Oryx and Lammergeier, have also been lost. Losses in the remaining species has mainly been in their numbers, and that in turn has been driven by loss of habitats – forests, woodlands and wetlands being the most prominent. Thus the most significant requirement for Uganda to meet its CBD obligations is to reduce and eventually halt deforestation, woodland loss, and swamp conversion. It should be noted that large mammals, that key part of our wildlife, are recovering well from the slaughter of recent decades, and the National Bird, the Grey Crowned Crane, seems to be holding its own after a major decline. The biodiversity of agricultural lands is doing surprisingly well, and those of us who live in cities have much wildlife to enjoy, with birds playing a major part.

iv
TABLE OF CONTENTS FOREWORD ........................................................................................................................................................ i EXECUTIVE SUMMARY ............................................................................................................................... iii TABLE OF CONTENTS ................................................................................................................................. iv
INTRODUCTION .............................................................................................................................................. 1
Other Targets .............................................................................................................................................. 1
CLIMATE CHANGE ......................................................................................................................................... 2
METHODS .......................................................................................................................................................... 5
Data sources ................................................................................................................................................ 5
Constructing trend lines ......................................................................................................................... 5
Weighting ..................................................................................................................................................... 6
INDICATOR 1: AGRICULTURAL and PASTORAL AREAS ................................................................. 8
INDICATOR 2: TOURISM ........................................................................................................................... 10
INDICATOR 3: FORESTS ............................................................................................................................ 12
INDICATOR 4: WETLANDS and OPEN WATERS .............................................................................. 16
Wetlands – their area and biodiversity .......................................................................................... 17
Grey-crowned Crane .............................................................................................................................. 18
INDICATOR 5: WILDLIFE .......................................................................................................................... 20
QENP CA and MFNP CA ......................................................................................................................... 21
INDICATOR 6: BIODIVERSITY CAPITAL ............................................................................................. 24
Genetic Biodiversity Capital ................................................................................................................ 25
Ecosystems Biodiversity Capital ....................................................................................................... 26
INDICATOR 7: ALBERTINE RIFT............................................................................................................ 28
INDICATOR 8: URBAN AREAS ................................................................................................................. 32
INDICATOR 9: THE LIVING PLANET INDEX ..................................................................................... 34
SOME GENERAL POINTS ........................................................................................................................... 36
REFERENCES ................................................................................................................................................. 38
ACKNOWLEDGEMENTS ............................................................................................................................ 39

1
INTRODUCTION We estimate that between 1975 and 1995, Uganda lost about half of its overall biodiversity value (see Indicator 9). Although losses since then have stabilised overall, they are still high in some sectors, notably forests, woodlands and wetlands. Of course, it is not all bad news. Most large mammal species are increasing within National Parks and Wildlife Reserves, to the delight of tourists, Marabou Storks nesting in Kampala are now the largest known breeding colony in Africa (and therefore in the world), where they play a big role in removing unhealthy rubbish from the city. Surprisingly, our limited data from agricultural and pastoral areas (see Indicator 1) suggest that wildlife (other than large mammals) is flourishing in the countryside. For example, a report on The State of Uganda’s birds (NatureUganda 2015) shows that many bird species are doing well. Many organisations are concerned about the rate at which Uganda’s once amazing biodiversity is being lost. An important contributor is the National Biodiversity Strategy and Action Plan (NBSAP), which includes a series of targets to be achieved by the year 2020. The targets in the Action Plan are arranged under a series of Strategic Objectives, of which the first three are particularly relevant to this report The first Strategic Objectives (NBSAP p83) is to ‘strengthen stakeholder co-ordination and framework for biodiversity management’. We believe that this report will contribute to that. Equally important are Strategic Objectives 2 and 3: Two aims to ‘facilitate and build capacity for research, knowledge and information and exchange on biodiversity’. It is encouraging to see that Makerere University features prominently, although it would be good to include some other institutions, particularly the government universities and leading non-governmental organisations. Objective 3 is ‘to reduce and manage negative impacts while enhancing positive impacts on biodiversity’. This will obviously be hard to achieve, but is, of course, highly desirable. For this report, nine Indicators, have been devised, each of which is aimed at a particular sector of government (such as Agriculture or Tourism), or a key element of Uganda’s biodiversity (for example the Albertine Rift Area of Endemism). Relevant targets from the NBSAP are quoted against their most appropriate indicators.
Other Targets Under each target, the NBSAP has strategies, output indicators and partners (to NEMA). Thus it will be possible in 2020, the year by which most targets are to be met, to see in detail what actions have been taken and, most importantly, what has been achieved. And the national targets also cover most of the 20 Aichi targets, on which countries report to the CBD Conferences of Parties. Our purpose in producing this report is to show how various sectors are performing in relation to biodiversity, and to encourage more discussion on the acquisition, analysis and uses of biodiversity data. Comments and criticisms are therefore welcomed by the Manager of the National Biodiversity Data Bank – Herbert Tushabe ([email protected]; [email protected]).

2
CLIMATE CHANGE As any farmer will tell you, the climate in Uganda is already changing. The snowfields on the Rwenzori Mountains have been declining for many years, as seen in the first graph, and rainfall patterns are also beginning to change. The second graph shows that, in Kampala, the wetter months are becoming less wet, whilst the drier months are becoming less dry; in other words, seasonality is becoming less marked. Interestingly, at Budongo Forest in the mid-north, the opposite is happening – wetter months are getting wetter and vice-versa (A Plumptre, pers comm). Apart from the importance of these changes to farmers, biodiversity will be affected in many ways. Less well-marked rainier seasons in the south will disrupt breeding patterns of the many bird species whose breeding seasons are determined by rainfall (Brown and Britton 1980).
Plot of changes in glacial areal extent on Rwenzori Mountains since 1906. Data from 1906, 1955 and 1990
derive from Kaser and Osmaston (2002). Remaining observations derive from NDSI classification of Landsat 5 (TM) and Landsat 7 (ETM+) scene. From Taylor et al, 2006.
Monthly rainfall data for Kampala from seven decades to the 1960s (Atlas of Uganda 1967) compared to average rainfall from 2003-2014 (R Nakileeza, pers comm)
0
50
100
150
200
250
Jan Feb Mar Apr May Jun Jul Aug Sep Oct Nov Dec
atlas
recent
1900 1920 1940 1960 1980 2000 20200
1
2
3
4
5
6
7
Rw
enzo
ri gl
acia
l are
al e
xten
t (km
2 )
0.57km2 per decade ( 2 =0.999)

3
Many of the species of plants and animals that are endemic to the Albertine Rift Area are found at higher altitudes. As the climate warms, they will either have to adapt (but there is insufficient time for that) or move up-slope. But as the altitude increases, the area of habitat decreases. For instance, in the Bwindi forest, the area of forest between 2000 and 2500m altitude is 160 km2, but only 1 km2 above 2500m (Howard, 1991), so species that are thriving below 2500m will have almost nowhere to go.
Converted wetlands for agriculture in Kisoro

4
BIODIVERSITY 2017 INDICATORS
Learning about biodiversity, here measuring a bird which will later be released

5
METHODS Data sources Data come from many sources. Large amounts are from the Uganda Wildlife Authority, using their extensive data sets of large mammal counts, and many more are from a variety of activities of the National Biodiversity Data Bank. Other important contributors were the Wildlife Conservation Society and NatureUganda. Some data came from published journals or theses, whilst some came directly from individual researchers. Currently we have 298 lines of time-series data, covering a period between 1960 and 2016, with most lines having data from at least two years, and those years separated by at least three years from each other, so that trends can be detected (but for 15 of these lines, there are as yet only data for one year, since further data are expected). Data can consist of numbers of plants or animals, or other repeatable numbers such as number of tree stems per hectare, numbers of moth species or areas of land that are forested. Taxonomically, the current data set is heavily biased towards birds and mammals. There are only seven data sets for plants – and all of those are trees – whilst invertebrates are represented only by ten sets of butterfly and moth counts. There is one line for fish (estimated species numbers in Lake Victoria), one for reptiles (Nile Crocodiles in Murchison Falls NP), but 104 for birds and 161 for mammals. And there are 18 data lines for habitat extents. Trend analysis is complicated by the fact that, when several data lines are combined – for example to see how species numbers are doing in tourist areas – data for different species are in different years.
Constructing trend lines Each index discussed below shows the average population trend across a group of species. The method for calculating the average population trend is based on the Living Planet Index chain method, which is described in Loh et al (2005) and Collen et al (2009). Firstly, a population trend is calculated for each species individually. Where more than one time-series dataset exists for a single species, for example, there is one time-series for the Mountain Gorilla from Bwindi National Park and another from the Virungas an average trend was calculated for that species. Where a species has only a single time-series, such as Nile Crocodile or Grey Crowned Crane, this step was not necessary. The average of multiple species trends was then calculated to produce an index, which was arbitrarily given a value of 1.0 in 1970. For the agricultural, urban and biodiversity capital indices, average abundance trends were calculated not for each species individually, but for groups of species such as birds of agriculture, butterflies, or raptors. Similarly, average trends in change of area were calculated for ecosystems such as moist savannas or wetlands. These trends were then averaged to calculate the indices.

6
Weighting It is easy to make a case for weighting different data sets – one could, for example, argue that one Elephant is worth more than one Oribi, or that a Grey Crowned Crane is worth more than a Marabou. But there are no generally accepted bases for weighting, and we have therefore treated all data lines as being equal.
Bird watching at Mabamba wetland

7
Tourists in K
ibale Forest National Park
Tourists in Mabam
ba Bay

8
INDICATOR 1: AGRICULTURAL and PASTORAL AREAS
The Southern Masked Weaver may or may not be the farmers’ friend; it can eat seeds, but some of the insects
with which it feeds its young are pests

8
INDICATOR 1: AGRICULTURAL and PASTORAL AREAS
The Southern Masked Weaver may or may not be the farmers’ friend; it can eat seeds, but some of the insects
with which it feeds its young are pests
9
National Target 3.6 (NBSAP p108, Aichi target 7) states that ‘by 2020, management plans are in place for areas under agriculture, aquaculture and forestry to ensure sustainable biodiversity conservation’.
Species in agricultural areas indicator, based upon counts of moths, bats and many bird species, including grey Crowned Cranes, weavers, breeding colonies of egrets and herons, and birds of prey. The index, which is
set at a value of 1 in 1985, measures the average trend in abundance for all individual species as well as some unspecified species groups such as “species of agroecosystems”, “raptors” and “vultures”.
About half of the land area of Uganda is given over to agriculture, mostly small-holder farms growing food crops, as well as cash crops. Subsitence agricultute is the most practiced, but there are several areas of large-scale farmland as well. Together, they cover 89,600 km2 (National Forestry Authority, 2009). Of the rest of the country, some 48,000 km2 is protected as Forest Reserves, Wildlife Reserves and National Parks. There are many unprotected seasonal wetlands and several Community Wildlife Areas, some of which are occupied by pastoralists, seasonally or, in a few places, more permanently. It is interesting to see that this indicator has risen sharply in recent years, partly driven by a large increase in Cattle Egret numbers (which implies a big increase in the grasshoppers on which they mainly feed). Very few pesticides are used by farmers, and it therefore seems that agro-biodiversity – as represented mainly by birds – is healthy. A few of the birds are pests (notably species of Quelea which feed on seeds such as wheat and rice heads) but most feed on insects and are beneficial to farmers. Thus the relevant target is being achieved
10
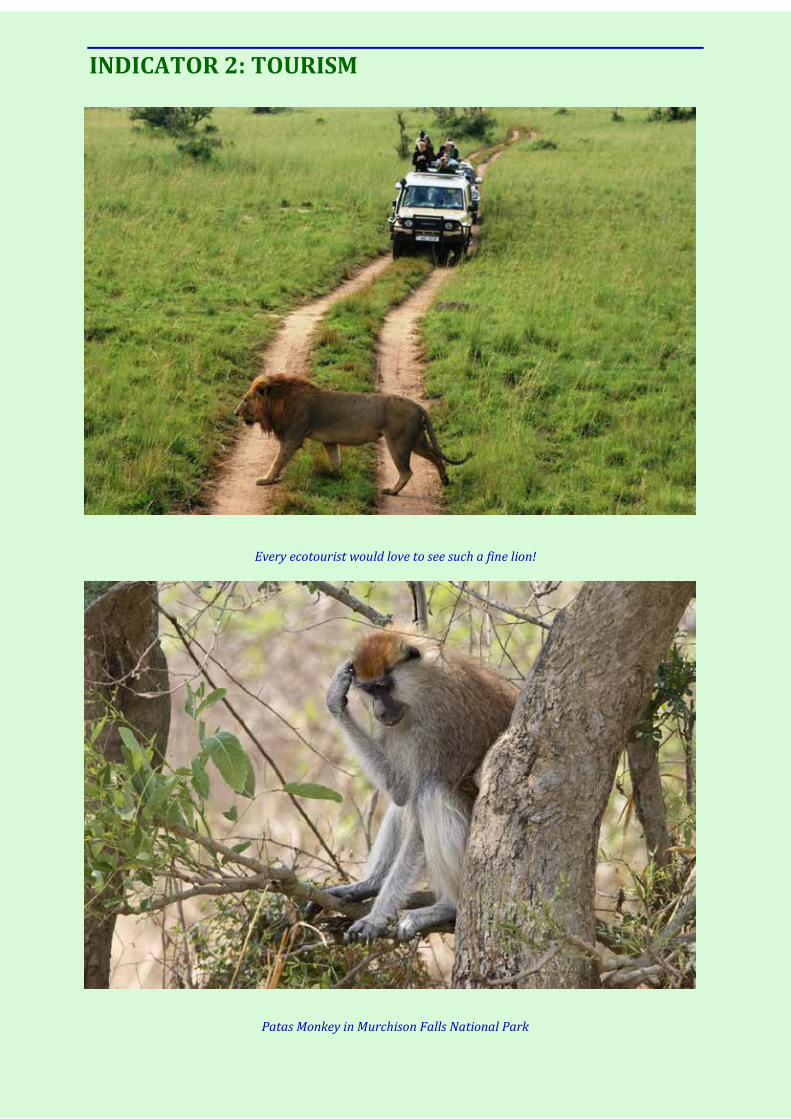
INDICATOR 2: TOURISM
Every ecotourist would love to see such a fine lion!
Patas Monkey in Murchison Falls National Park

10
INDICATOR 2: TOURISM
Every ecotourist would love to see such a fine lion!
Patas Monkey in Murchison Falls National Park
11
Tourism, and particularly nature tourism (sometimes called ecotourism) is important to Uganda’s economy, employing many thousands of people.
There are many components to tourists’ enjoyment of a visit to Uganda (and most apply also to the increasing numbers of Ugandans touring their own country). Hospitality, scenery and wildlife are all important. . During the 1970s, Uganda’s National Parks were invaded by soldiers and other criminals who slaughtered animals, to such an extent that most species of large animals were reduced to very low numbers – they were literally decimated. But as law and order were restored, and peace returned to the country, since the 1990s, wildlife numbers have gradually increased. Nevertheless, as the graph implies, they are still at about half of the numbers to be seen in 1970.
The graph shows an index, given a value of 1 in 1970, based on average trends in populations of a number of species that tourists like to see, namely Nile Crocodiles, Grey Crowned Cranes, pelicans and other large
waterbirds as seen on launch trips, eagles and other large birds of prey, Banded Mongooses (much enjoyed at Mweya), Black-and-white Colobus Monkeys, and the large plains animals – antelopes, lions, elephants and others. Populations declined by 60% on average from 1970 to 2000 but recovered to about half their 1970
level by 2012.
Tourism is an important contributor to Uganda’s GDP. For example, in 2013, travel and tourism’s total contribution to GDP was US $ 2.1 billion, of which 0.9 billion was direct contribution (Ministry of Tourism, Wildlife and Antiquities, 2014) Poaching is now under control, and we can therefore expect numbers to increase in future years and tourist satisfaction should thus increase too.
0
0.2
0.4
0.6
0.8
1
1.2
1970 1975 1980 1985 1990 1995 2000 2005 2010 2015

12
INDICATOR 3: FORESTS
Bwindi Impenetrable National Park, almost all of which is forest
Kasyoha-Kitomi Forest Reserve

13
The National Target 3.1 (NBSAP, p97, Aichi target 15) is that ‘by 2020, the rate of loss of all natural habitats, including forests, is at least halved and where feasible brought close to zero, and degradation and fragmentation are significantly reduced’.
And National Target 3.2 (NBSAP p99, Aichi target 15) is that ‘by 2020, ecosystem resilience and the contribution of biodiversity to carbon stocks has been enhanced, through conservation and restoration of at least 15% of degraded ecosystems, thereby contributing to climate change mitigation and adaptation and to combating desertification’
This indicator is based on one time-series data for forest areas
(data sources: Langdale-Brown et al, 1964 and analyses by WCS for forests condition for 2010)
Forests – their area and biodiversity
It is no secret that deforestation in Uganda is rampant. But getting generally-agreed figures for the extent of forest in Uganda is difficult. There are two main reasons for this. Some authorities include woodlands as forest; these were once very extensive across much of the centre and north of Uganda, but are rapidly being turned into charcoal. Secondly, as forests are being degraded and cleared, when do they cease to be forests? But forests are not only trees, they support a wide variety of other plants and animals, some of which are included in this indicator, so that forest loss is a massive loss of biodiversity, not to mention carbon sequestration. The trend line shows a fairly consistent rate of loss of forest biodiversity, at just over 1% per year, and suggests that by about 2020, there will be only half of the forest cover of 1970. Forest loss from the six forested National Parks has been small (and forest cover

14
has probably increased in Kibale NP), so that the big losses have been from Forest Reserves, particularly in western Uganda, and from forests on private land. In contrast, some re-afforestation efforts are happening, particularly in western Uganda, For example, several organisations, including Ecotrust, WWF and Fauna and Flora International, are working with local communities in deforested areas within the ranges of Chimpanzees, in an effort to re-establish corridors connecting the remaining forests. There are many tree-planting programmes all over Uganda, but most of the trees being planted are exotic, which, when in plantations, support far fewer birds than the degraded natural forest or farmland that they replace (Pomeroy and Dranzoa 1998), although they do help to meet the need for timber. Furthermore, woodlands of various kinds, which were once extensive and important part of Uganda’s vegetation (Langdale-Brown et al 1964), are also disappearing. But whist it is all too obvious that many are being lost to charcoal burners, we lack accurate information on the extent of this degradation; except to say that it is considerable. Deforestation and the degradation of woodlands are of major concern, not only for their biodiversity but for the many benefits that they can provide to people. But these benefits are declining at the same rate, so that the National Target of sustainability is of obvious importance. Unfortunately, current trends show that it is very unlikely to be met

15
Edge encroachment around Echuya Forest R
eserve Pit saw
ing, some of it carried out illegally in Forest R
eserves, is a threat to forests

16
INDICATOR 4: WETLANDS and OPEN WATERS
The Grey Crowned Crane is Uganda’s National Bird. They depend upon seasonal wetlands for nesting, and the decline in cranes is largely a result of declining wetlands
A Wattled Crane was first recorded in Uganda in 2014 [check]; it is much larger than the resident Grey Crowned Cranes
This striking bird is a Shoebill, which uses its large bill to catch fish in papyrus swamps – tourists love it but fishermen do not
17
The targets for forests (Indicator 3) are equally relevant to wetlands. In addition, National Target 3.10 (NBSAP p115, Aichi target 6) states that ‘by 2020, all fish and invertebrate stocks are managed and harvested sustainably, legally and applying ecosystem-based approaches…’
Further, National Target 3.7 (NBSAP p 110, Aichi target 8) states that ‘by 2020, pollution, including from excess nutrients, has been brought to levels that are not detrimental to ecosystem function and biodiversity’.
And National Target 3.9 (NBSAP p113, Aichi target 6) states that ‘by 2020, the impact of fisheries activities on stocks, species and ecosystems are within safe ecological limits’.
Wetlands – their area and biodiversity
This indicator is based upon the areas of wetlands in Uganda (data source: WCS)
Wetlands, particularly seasonal wetlands, are rapidly being converted into rice fields, other forms of agriculture, or for seasonal grazing by livestock. Near urban areas, they are considered prime sites for factories. The total area of open waters cannot, of course, change significantly. However, there is a great deal of evidence that fish stocks are rapidly declining (tilapias in Lake Albert, for example, are now rarely more than 15 cm in length, threatening the breeding stocks). Since fish, be they herbivorous or carnivorous, are parts of food chains, it follows that the decline in fish numbers must be affecting the whole ecosystem. But as is so often the case, there are some winners. For reasons that are not yet understood, both Pied Kingfishers and African Fish Eagles, both of which feed on fish, have been increasing in numbers – the kingfisher spectacularly so – since records began in the early 1990s (NatureUganda, 2015, pp51-52). The increases have been greatest in National Parks, but have also happened in unprotected areas.
Grey Crowned Cranes in a seasonal wetland, which is their most important habitat. The huge Wattled Crane in the
centre is a rare visitor to Uganda

18
Grey-crowned Crane
The numbers of cranes are now less than half of those found in the 1970s, although in recent years there may
have been a small increase (the dotted line shows the trend in abundance prior to the 1990s which was based on only two populations and therefore may not be representative of the entire country)
There is an Action Plan for cranes, which proposes that more effort be made to reduce or even prevent illegal draining or conversion of the seasonal swamps which they need for nesting. However, at present there little action to achieve this, and the stability of numbers in recent years is probably only temporary.
Wetlands are important to many people in many ways, not least because of their rich biodiversity that includes fish, craft materials and much else. Whilst the national policy is for wetlands to be conserved, implementation is weak and there is very little chance of the various National Targets being approached, let alone met
Inde
x
0
20
40
60
80
100
120
1970 1975 1980 1985 1990 1995 2000 2005 2010 2015 2020
1970 -1990
1990 -2015

19
Lake Opeta W
etland M
abamba B
ay Wetland

20
INDICATOR 5: WILDLIFE
Two Uganda Kob males fight for territorial dominance. This most attractive antelope is found in several National Parks and Wildlife Reserves. Rothschild’s Giraffes, until recently, occurred only in Kidepo Valley and Murchison Falls National Parks, but a few have now been introduced to Lake Mburo National Park

20
INDICATOR 5: WILDLIFE
Two Uganda Kob males fight for territorial dominance. This most attractive antelope is found in several National Parks and Wildlife Reserves. Rothschild’s Giraffes, until recently, occurred only in Kidepo Valley and Murchison Falls National Parks, but a few have now been introduced to Lake Mburo National Park 21
The National Target 3.1 (NBSAP, p97, Aichi target 11) is that ‘by 2020, The National Target 1 (NBSAP, p84) is that ‘by 2020, at least 17% of terrestrial and inland water ecosystems in Uganda are conserved through effectively and equitably managed, ecologically representative and well-connected systems of protected areas for socio-economic benefit of the population’
Currently, 20% of Uganda’s land surface is covered by National Parks and Forest and Wildlife Reserves. A further smaller percentage is covered by barely-protected Communal Wildlife Areas, and only about 1% of inland waters are within any Protected Area. Whilst ‘wildlife’ covers all living things, its most conspicuous components are large mammals and birds, and these are increasingly confined to Protected Areas. Their status, and much other information, can be found in the Uganda Wildlife Authority Annual Report 2014-2015 (UWA 2016). Following the extensive slaughter of large mammals in the 1970s and 1980s, numbers of most species have recovered well and, as the two graphs suggest, from 1990 onwards the trend has generally been positive, particularly in the Murchison Falls Conservation Area (which, as well as the National Park, includes two contiguous Wildlife Reserves). Recent studies in both areas have shown that although poaching still occurs, and is in fact widespread, it would appear that the large mammals can tolerate the present levels. It would be impossible to eliminate poaching entirely, but current management practices apparently keep it at an acceptably low level.
QENP CA and MFNP CA
This indicator consists of data for large mammals extracted from (UWA, 2016), together with Nile Crocodile counts from the River Nile in Murchison Falls National Park, and censuses of Banded Mongoose at Mweya,
Queen Elizabeth National Park, provided by researchers
0
0.5
1
1.5
2
2.5
3
3.5
4
1970 1975 1980 1985 1990 1995 2000 2005 2010 2015
Inde
x Val
ue 1
970
= 1.
0
Uganda QENP/CA and MFNP/CA Index
Queen Elizatbeth
Murchison Falls

22
Most of the data for large mammals come from aerial counts, made periodically, and subject to a number of limitations. However, the general trends are clear, although a few unlikely figures have been omitted. There are no data at the moment for large mammals outside Protected Areas, but it is safe to assume that they are few, although Vervet Monkeys and Olive Baboons survive quite widely. The current area of parks and reserves in Uganda is 20 %, therefore this target has been met. As the graphs indicate, for at least two National Parks (and by extension, most other Protected Areas) are doing well

23
Buffaloes in M
urchison Falls National Park
Waterbuck and Eland in Lake M
buro National Park

24
INDICATOR 6: BIODIVERSITY CAPITAL
Wetlands are important to people, as well as to wildlife
Fishermen hats on Islands of Lake Opeta

24
INDICATOR 6: BIODIVERSITY CAPITAL
Wetlands are important to people, as well as to wildlife
Fishermen hats on Islands of Lake Opeta
25
National target 1 (NBSAP, p84, Aichi Target 2) states that ‘by 2020, biodiversity values will have been integrated into the National Development Plan, Budget Framework papers, Ministerial Policy/strategies and District Development Plans’
And National Target 3.3 (NBSAP p102, Aichi target 12) states that ‘by 2020, the extinction of known threatened species has been prevented and their conservation status, particularly of vulnerable species, has been improved and sustained’
These targets cover various aspects of the national biodiversity capital. But here we sub-divide the biodiversity capital of Uganda under two heads – genetic and ecosystems. Also see Indicator 9, The Living Planet Index.
Genetic Biodiversity Capital National Target 2.2 (NBSAP, p92, Aichi target 19), states that ‘by 2020, basic taxonomic information is packaged in user-friendly formats and widely disseminated, including use of school systems’.
Also National Target 3.5 (NBSAP p106, Aichi Targets 5 and 14): ‘By 2020, the rate of loss of all natural habitats, including forests, is at least halved and where feasible brought close to zero, and degradation and fragmentation are significantly reduced” The first of these targets implies that we have better knowledge of all the species of plants and animals in Uganda, including at school level. At present, species are being lost, as shown in the graph, since as each species disappears from Uganda, that represents a loss of genetic biodiversity. By far the biggest loss has been that of fish in Lake Victoria, but we also know of several species of birds and mammals that are no longer here, and it is very likely that lots of beetles, butterflies, frogs, lizards and other animals, as well as plants, have gone too.
This indicator is based upon numbers of species, each species contributing to Uganda’s genetic biodiversity. Three large groups are the birds and mammals of Uganda, together with the fish of Lake Victoria. Other species lists are
of trees and butterflies

26
Ecosystems Biodiversity Capital National Target 3.3 states that ‘by 2020, the rate of loss of all natural habitats, including forests, is at least halved and where feasible brought close to zero, and degradation and fragmentation is significantly reduced’.
Four categories of natural habitats are combined in this indicator which is shows the average trend in the extent of forests, moist and dry savannas, and wetlands in Uganda as a whole:
Critically Endangered species need Action Plans, which in turn need to be acted upon. Those which already have Action Plans, notably Grey Crowned Crane and Shoebill, also need Action. Uganda’s only endemic bird species, Fox’s Weaver, has not been seen for several years; surveys to see if it survives (and if so, appropriate conservation actions) are urgently needed. As described under Indicator 3, the rate of loss of natural forests and of wetlands, especially seasonal wetlands, calls for major actions at government level; the policies are there but implementation is very poor., There is increasing interest in this area, as shown by the formation of a Uganda Natural Capital Forum and COMBO (Conservation, Impact Mitigation and Biodiversity Offsets in Africa), both with close links to NEMA and with commerce and industry. COMBO is also involved in the promotion of NNL/NG – No net loss/net gain of biodiversity. Further, the National Council of Science and Technology has an advisory committee on biodiversity in relation to the energy sector. If the National Targets are to be met, two main types of action will be needed. Firstly, on genetic resources, several things could be done – existing Action Plans for Endangered Species could be more fully implemented, and new Plans drawn up for the many other Endangered Species. Secondly, many species are not adequately known. For example, the only endemic bird in Uganda, Fox’s Weaver, has not been seen for several years, despite two expeditions looking for it. Is it extinct, if not, how can that be prevented?
0
0.2
0.4
0.6
0.8
1
1.2
1970 1975 1980 1985 1990 1995 2000 2005 2010 2015
Inde
x Val
ue 1
970
= 1.
0Uganda Biodiversity Capital Index (ecosystem)
27
Mixed banana plantation in B
ushenyi Terracing agriculture in K
abale

27
Mixed banana plantation in B
ushenyi Terracing agriculture in K
abale

28
INDICATOR 7: ALBERTINE RIFT
Giant Lobelia on Rwenzori Mountains Ranges
Scarlet-tufted Malachite Sunbird in Rwenzori Mountains National Park (male, top; female, below)

29
There is no specific target for the Albertine Rift, but it, and especially the forests that flank its sides, have long been recognised as having high importance for all biodiversity. The Rift has numerous crests and troughs, that have contributed to its tourism significance
We have many data from the Albertine Rift Area: Nile Crocodiles, 22 species of mammals, ranging from Banded Mongoose in QENP to Mountain Gorillas in BINP and MGNP, with such species as Warthog and
Elephant in between. Finally there are counts of Grey Crowned Cranes in south-west Uganda, and nightjars in MFNP.
There are many data from the Albertine Rift Area of Endemism, which includes the flanking forests such as Bwindi and Budongo
Almost all the data used for this indicator are from Protected Areas, where some primates and most large herbivores in Queen Elizabeth and Murchison Falls National Parks are increasing. The area contains large numbers of endemic plants and animals, survivors of an arid period in the geologically recent past, when some forest survived in an otherwise relatively arid landscape. Globally, it has been recognised as a BIODIVERSITY HOTSPOT (Myers et al, 2000), and its flora and fauna are well described by Plumptre et al, (2003). Recently, WCS has produced a Conservation Action Plan for the Albertine Rift (Plumptre et al 2016). As a result of this importance, the Albertine Rift area within Uganda has a series of Protected Areas, some adjoining neighbouring country reserves to create cross-boundary areas of significant size. Thus the area has also become a major tourist attraction, particularly for those people who consider themselves to be ecotourists. The WCS Action Plan divides the Albertine Rift into six Landscape Areas, two of which are partly in Uganda. The Murchison-Semliki landscape (Plumptre et al 2016, pages 14-21), lists six objectives, briefly summarised as –

30
1. To improve natural resource governance, such as better communications 2. Support restoration of degraded habitats on public and private lands 3. Support integrated and co-ordinated resource management and sustainable
livelihoods, with more community involvement 4. Reduce illegal activities impacting on natural resources, helped by an improved
enabling environment 5. Improved management of risks, involving off-setting and involvement of investors 6. Climate change adaptation, mitigation and monitoring.
Parts of the Greater Virunga Landscape lie within Uganda and again there are a series of objectives, along similar – but not identical – lines to those above (pages 22-31) A key element in the future of the Albertine Rift area is integrated planning, so that both development and conservation are given equal consideration. Only then will all parties benefit. This area is subject to many pressures, with its rapidly growing human population and many industrial activities, particularly those related to oil and gas. Although the current value of the index is around 0.8, the current trend is positive.
Green-breasted Pitta in Kibale Forest National Park
31 G
reat Blue Turaco in B
igodi Swam
p M
any-coloured Bush Shrike in B
windi Im
penetrable National Park

31 G
reat Blue Turaco in B
igodi Swam
p M
any-coloured Bush Shrike in B
windi Im
penetrable National Park

32
Marabous in Kampala City
INDICATOR 8: URBAN AREAS

32
Marabous in Kampala City
INDICATOR 8: URBAN AREAS
33
There are no specific targets for urban areas, but we include them because they are where an ever-increasing proportion of us live and work
The Abundance indicator shows average trends in the abundance of scavenging birds, such as Marabou Storks, and weaver birds which nest and feed within the city boundaries, as well as the fruit bats which
formerly spent their days roosting in Bat Valley, although they are now dispersed in several much smaller roosts.
The species richness indicator shows average trends in the numbers of bird species – annual records of all species on Makerere hill, together with the numbers of raptor species in Kampala
Most urban areas in Uganda retain some public open spaces, where trees are often an important feature.
0
0.2
0.4
0.6
0.8
1
1.2
1.4
1.6
1970 1975 1980 1985 1990 1995 2000 2005 2010 2015
Inde
x val
ue 1
970
= 1.
0Titl
eUganda Urban Areas Biodiversity Index
Urban Areas Abundance Index
Urban Areas Species Richness Index

34
INDICATOR 9: THE LIVING PLANET INDEX
Wandering Glider – a common dragonfly
Cattle Egret

34
INDICATOR 9: THE LIVING PLANET INDEX
Wandering Glider – a common dragonfly
Cattle Egret
35
The National Target 3.2 (NBSAP, p99, Aichi target 15) is that ‘by 2020, ‘ecosystem resilience and the contribution of biodiversity to carbon stocks has been enhanced, through conservation and restoration of at least 15% of degraded ecosystems, thereby contributing to climate change mitigation and adaptation and to combating desertification’.
This indicator is an overview of Uganda’s terrestrial biodiversity and is here compared to the global biodiversity outlook.
Uganda Terrestrial Living Planet Index in comparison with WWF’s Global Living Planet Index
WWF’s Global Living Planet Index is based on population trend data for 1,692 terrestrial vertebrate species and from many parts of the world. Starting from 1970, when it was set at 1.0, it has gradually declined until it is now only just above 0.6 (McRae et al. 2016). The world is losing this element of biodiversity at a rate of nearly 1% per year which, if it continues, implies no terrestrial biodiversity at all by about the year 2070. In contrast, and despite the very serious losses of natural habitats that are still continuing in Uganda, the fact that the Protected Areas – and particularly the National Parks – are doing so well, provides a reason for some optimism.
0.00
0.20
0.40
0.60
0.80
1.00
1.20
1975 1980 1985 1990 1995 2000 2005 2010 2015
Global Living Planet Index
Terrestrial Living Planet Index

36
SOME GENERAL POINTS National Target 2.1 (NBSAP, p90, Aichi target 19) states that ‘by 2020, knowledge, research and the science base relating to biodiversity have been significantly improved, and relevant technologies have been improved, shared and applied’.
It is our hope that this report will contribute to this target, and it is encouraging that many other activities are also contributing to it, for example, the monitoring programmes of the Wildlife Conservation Society, the National Biodiversity Data Bank and NatureUganda as well as those of UWA. And Target 3.8 (NBSAP p151, Aichi target 7, 11, 14, 15) states that ‘by 2017, Uganda’s biodiversity is reasonably protected from natural disasters’
National Target 3.8 (NBSAP p112, Aichi target 9) states that ‘by 2020, invasive species and pathways are identified and prioritized, priority species are controlled or eradicated, and measures are in place to manage pathways to prevent their introduction and establishment’.
These are manly to be achieved by better preparedness and appropriate management strategies. Together, the various National Targets cover all aspects of the conservation of biodiversity, and are consistent with the philosophy of ‘no net loss or net gain’, which is being promoted through WCS’s COMBO project. However, a number of the targets are very ambitious; for example, it seems highly unlikely that the loss of natural forests and wetlands can be halted, let alone reversed, by 2020, nor do we see restoration of degraded ecosystems being undertaken (with the possible exception of UWA’s efforts at controlling invasive species). For these targets to be seriously considered, both UWA and the NFA would need far greater resources – both money and people – than they have at present. One other national target, not dealt with in this report, is 3.4, dealing with livestock and cultivated plants, since here we are only concerned with native biodiversity.
You will have seen how much can be learnt from the 283 data lines in the National Biodiversity Data Bank that have been used in this report. But, as we mentioned in the Introduction, these are heavily biased towards birds and mammals, so in future we need to try to obtain more data from other taxa, as well as continuously updating the lines that we do have. It should be noted that the report contributes information to other national and multilateral intentional frameworks for example, all biodiversity related conventions. So let us conclude on a positive note. More of our indicators are showing positive trends than negative, and as Indicator 9 shows, Uganda’s overall trend, whilst a little below that for the world as a whole, is upwards, whereas for the rest of the world it is still declining.
37
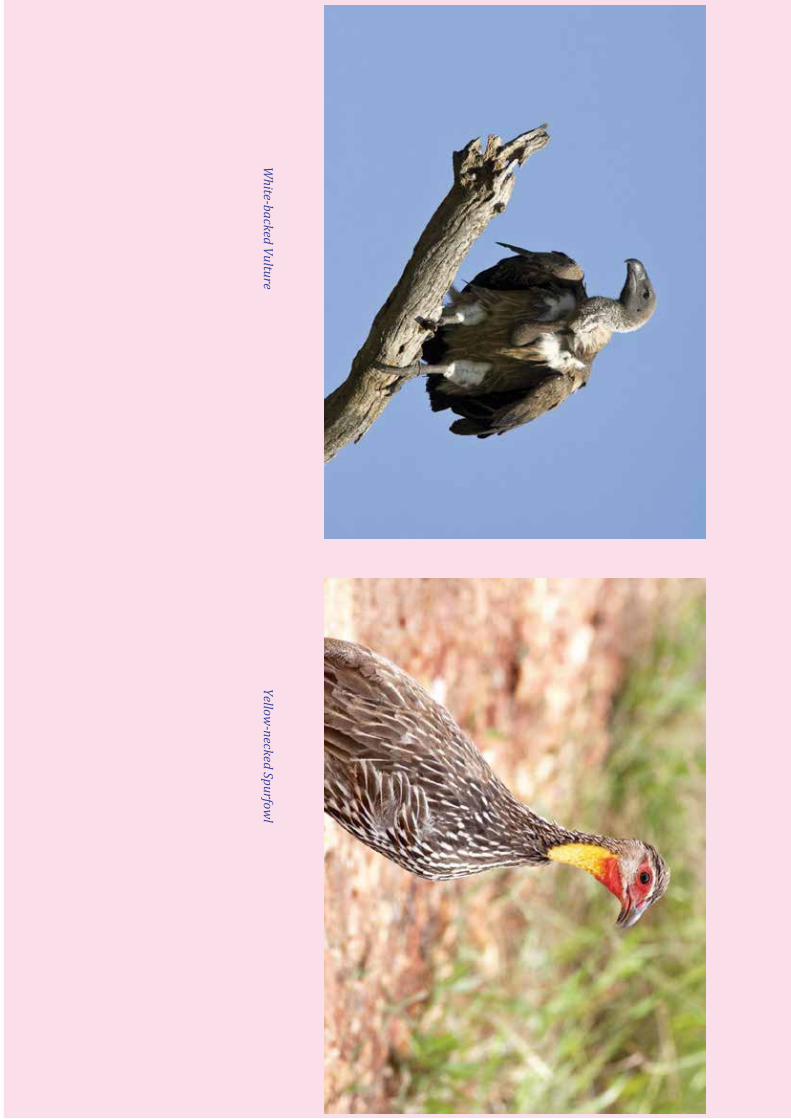
White-backed Vulture
Yellow-necked Spurfow
l

38
REFERENCES Atlas of Uganda, 1967. Government of Uganda, Entebbe. Brown, LH and Britton, PL. 1980. The breeding seasons of East African birds. East Africa
Natural History Society, Nairobi. Carswell, M, Pomeroy, D, Reynolds, J and Tushabe, H. 2005. The bird atlas of Uganda.
British Ornithologists’ Club, London. Chamberlain, D, Kibuule, M, Skeen, R and Pomeroy, D. in press. Trends in bird species
richness, abundance and biomass along a tropical urbanization gradient. Urban Ecosystems
Collen, B, Loh, J, Whitmee, S, McRae, L, Amin, R and Baillie, EM. 2008. Monitoring change in vertebrate abundance: the Living Planet Index. Conservation Biology 23, 317-327.
Howard, PC. 1991. Nature conservation in Uganda’s tropical forest reserves. WWF and IUCN, Kampala, Uganda
Langdale-Brown, I, Osmaston, HA and Wilson, JG. 1964. The vegetation of Uganda and its bearing on land-use. Government of Uganda, Entebbe.
Loh, J, Green, RE, Ricketts, T, Lamoreux, J, Jenkins, M, Kapos, V and Randres, J. 2005. The Living Planet Index: using species population time series to track trends in biodiversity. Proceedings of the Royal Society B 360, 289-295.
McRae L, Freeman R & Marconi V (2016) 'The Living Planet Index' in: Living Planet Report 2016: Risk and resilience in a new era (ed. Oerlemans N). WWF International, Gland, Switzerland.
Myers, N, Mittermeier, RA, Mittermeier, CG, da Fonseca, GAB and Kent, J. 2000. Biodiversity hotspots for conservation priorities. Nature 403, 853-858.
Ministry of Tourism, Wildlife and Antiquities. 2014. Sector Statistical Abstract, 2014. Kampala, Uganda National Forestry Authority 2005. National Biomass Study. Technical Report 2005.
Kampala, Uganda NatureUganda 2015. The State of Uganda’s birds 2014: indicators of our changing
environment. NatureUganda, Kampala. Plumptre, AJ, Behangana, M, Davenport, TRB, Kahindo, C, Kityo, R, Ndomba, E, Nkuutu, D,
Segawa, P and Eilu, G. 2003. The biodiversity of the Albertine Rift. Wildlife Conservation Society, Kampala, Uganda
Plumptre, AJ, Ayebale, S, Segan, D, Watson, J and Kujirakwinja, D. 2016. Conservation Action Plan for the Albertine Rift Unpubl Report for Wildlife Conservation Society and its partners.
Kaser, G and Osmaston, H 2002. Tropical glaciers. Cambridge University Press

39
Pomeroy, D and Dranzoa, C. 1998. Do tropical plantations of exotic trees in Uganda and Kenya have conservation value for birds? Bird Populations 4, 21-36.
Taylor, RG, Mileham, L, Tindimugaya, C, Majugu, A, Muwanga, A, and Nakileza, B 2006. Recent glacial recession in the Rwenzori Mountains of East Africa due to rising air temperature. Geophysical Research Letters 33(10) doi:10.1029/2006GL025962
Uganda Wildlife Authority 2016. Annual report 2014-2015. UWA, Kampala. WWF 2016. Living Planet Report 2016, WWF International, Gland, Switzerland
ACKNOWLEDGEMENTS We appreciate the contribution of all our data providers. We appreciate,
The Living Planet team for the trend analyses which are core to the graphs. They include Jonathan Loh, co-author of this report
The Uganda Wildlife Authority for continued support and encouragement of research in National Parks
The Wildlife Conservation Society for various datasets and funding the production of this report
NatureUganda for contribution to the data The Department of Environmental Management and the College of Agricultural
and Environmental Sciences for hosting the National Biodiversity Data Bank and continued support
Finally and not the least, Betty Lutaaya, the Secretary at the NBDB who makes all data entries and documentation go the right way, every time.
Partners, Outside MakererePartners, Outside Makerere

THE STATE OF UGANDA’SBIODIVERSITY 2017
National Biodiversity Data Bank
Department of Environment Management, College of Agricultural and Environmental Sciences,
Makerere UniversityDerek Pomeroy, Herbert Tushabe and Jonathan Loh
Photographs by Achilles Byaruhanga
June 2017
NatureUganda
Verreaux's Eagle-owl Lappet-faced Vulture
Swallow-tail Butter�y
Zebras
Red Colobus Monkeys
Defassa Waterbucks
NATIONAL BIODIVERSITY DATA BANK
Printed byPress Graphics
Creative Designing / Offset, Digital & Large format Printing / Promotional Items Kalobwa House, Plot 21, Nkurumah Road.
Tel: +256 759 802 863 / +256 712 802 863Email: [email protected]
ISBN 978-9970-9690-0-5