Embed Size (px)
Citation preview

7/28/2019 The State of World Fisheries and Aquaculture_2012
http://slidepdf.com/reader/full/the-state-of-world-fisheries-and-aquaculture2012 1/230
ISSN 1020-5489
THE STATE OF
WORLD FISHERIES
AND AQUACULTURE
2012

7/28/2019 The State of World Fisheries and Aquaculture_2012
http://slidepdf.com/reader/full/the-state-of-world-fisheries-and-aquaculture2012 2/230
Copies of FAO publications can be requested from:
SALES AND MARKETING GROUP
Publishing Policy and Support BranchOffice of Knowledge Exchange, Research and ExtensionFAO, Viale delle Terme di Caracalla00153 Rome, Italy
E-mail: [email protected]: (+39) 06 57053360Web site: www.fao.org/icatalog/inter-e.htm
Cover photographs courtesy of FAO, O. Barbaroux, G. Bizzarri, M.R. Hasan, L. Miuccio,
J. Saha, J. Sanders, J. Spaull and J. Van Acker; sidebar photograph courtesy of F. Maimone.

7/28/2019 The State of World Fisheries and Aquaculture_2012
http://slidepdf.com/reader/full/the-state-of-world-fisheries-and-aquaculture2012 3/230
FOOD AND AGRICULTURE ORGANIZATION OF THE UNITED NATIONS
Rome, 2012
FAO Fisheries and Aquaculture Department
THE STATE OF
WORLD FISHERIES
AND AQUACULTURE
20122012

7/28/2019 The State of World Fisheries and Aquaculture_2012
http://slidepdf.com/reader/full/the-state-of-world-fisheries-and-aquaculture2012 4/230
The designations employed and the presentation of material in this
information product do not imply the expression of any opinion whatsoeveron the part of the Food and Agriculture Organization of the United Nations(FAO) concerning the legal or development status of any country, territory, city
or area or of its authorities, or concerning the delimitation of its frontiers orboundaries. The mention of specific companies or products of manufacturers,
whether or not these have been patented, does not imply that these havebeen endorsed or recommended by FAO in preference to others of a similar
nature that are not mentioned.
The views expressed in this information product are those of the author(s) and
do not necessarily reflect the views of FAO.
The designations employed and the presentation of material in the map(s)do not imply the expression of any opinion whatsoever on the part of FAO
concerning the legal or constitutional status of any country, territory or seaarea, or concerning the delimitation of frontiers.
ISBN 978-92-5-107225-7
All rights reserved. FAO encourages reproduction and dissemination ofmaterial in this information product. Non-commercial uses will be authorized
free of charge, upon request. Reproduction for resale or other commercialpurposes, including educational purposes, may incur fees. Applications for
permission to reproduce or disseminate FAO copyright materials, and allqueries concerning rights and licences, should be addressed by e-mail to
[email protected] or to the Chief, Publishing Policy and Support Branch,Office of Knowledge Exchange, Research and Extension, FAO,
Viale delle Terme di Caracalla, 00153 Rome, Italy.
© FAO 2012

7/28/2019 The State of World Fisheries and Aquaculture_2012
http://slidepdf.com/reader/full/the-state-of-world-fisheries-and-aquaculture2012 5/230
Foreword
Today, the global community aces multiple and interlined challenges rangingrom the impacts o the ongoing inancial and economic crisis to greaterclimate change vulnerabilities and etreme weather events. At the sametime, it must also reconcile meeting the pressing ood and nutrition needs oa growing population with inite natural resources. This edition o The State
o World Fisheries and Aquaculture shows how these issues aect isheriesand auaculture sector and how the sector is attempting to address them in asustainable manner.
Fisheries and auaculture mae crucial contributions to the world’s well-being and prosperity. In the last ive decades, world ish ood supply hasoutpaced global population growth, and today ish constitutes an important
source o nutritious ood and animal protein or much o the world’s population.In addition, the sector provides livelihoods and income, both directly andindirectly, or a signiicant share o the world’s population.
Fish and ishery products are among the most traded ood commoditiesworldwide, with trade volumes and values reaching new highs in 2011 andepected to carry on rising, with developing countries continuing to account orthe bul o world eports. While capture isheries production remains stable,auaculture production eeps on epanding. Auaculture is set to remain one othe astest-growing animal ood-producing sectors and, in the net decade, totalproduction rom both capture and auaculture will eceed that o bee, por orpoultry.
However, in a world in which almost a billion people still suer rom hunger,
it is the poor, especially those in rural areas, who are most vulnerable to thecombination o threats outlined above. In many areas o sub-Saharan Arica andSouth Asia, their ish consumption levels remain too low and they are ailing tobeneit rom the contributions that isheries and auaculture are increasinglymaing elsewhere in terms o sustainable ood security and income.
The vital contributions rom isheries and auaculture to global ood securityand economic growth remain constrained by an array o problems. These includepoor governance, wea isheries management regimes, conlicts over the use onatural resources, the persistent use o poor ishery and auaculture practices, aailure to incorporate the priorities and rights o small-scale ishing communities,and injustices relating to gender discrimination and child labour.
The recent United Nations Conerence on Sustainable Development, nownas Rio+20, discussed these governance-related issues and served as a platorm
to renew political commitment or sustainable development, assess progressand gaps in the implementation o eisting commitments, and address newchallenges. Two themes underpinning Rio+20 – the institutional ramewor orsustainable development and the support o a green economy – were relectedin FAO’s main message that improved management and eiciencies throughoutthe ood value chain can increase ood security while using ewer naturalresources, i.e. achieve more with less. A special ocus on oceans and coasts atRio+20 enabled FAO to voice its recommendations on uestions ranging romimproving the sustainable use o marine and coastal resources through topoverty eradication, small-scale isheries and auaculture operations, as well asthe potential contribution o small island developing States.
Promoting sustainable ishing and ish arming can provide incentives or
wider ecosystem stewardship. The greening o isheries and auaculture reuiresrecognition o their wider societal roles within a comprehensive governanceramewor. There are several mechanisms to acilitate this transition, including

7/28/2019 The State of World Fisheries and Aquaculture_2012
http://slidepdf.com/reader/full/the-state-of-world-fisheries-and-aquaculture2012 6/230
7/28/2019 The State of World Fisheries and Aquaculture_2012
http://slidepdf.com/reader/full/the-state-of-world-fisheries-and-aquaculture2012 7/230
Contents
F iiiAcgm xiAbbiai a acm xii
P A R T 1WORLD REVIEW OF FISHERIES AND AqUACULTURE
sau a 3Overview 3Capture isheries production 19Auaculture 24
Fishers and ish armers 41The status o the ishing leet 47The status o ishery resources 52Fish utilization and processing 63Fish trade and commodities 67Fish consumption 82Governance and policy 89
n 100
P A R T 2SELECTED ISSUES IN FISHERIES AND AqUACULTURE
Maiamig g i fihi a aquacuu:fm cgii ai 107
The issue 107Possible solutions 111Recent actions 113Outloo 113
Imp ppa f a ffci p iai fihi a aquacuu 114
The issue 114Possible solutions 117Recent actions 120Outloo 121
Maagig caia fihi a hi pm 121The issue 121Possible solutions 123Recent actions 125Outloo 125
Bai achiig -impac fu-ffici fihig 126The issue 126Possible solutions 127Recent actions 133Outloo 134
Puig i pacic h cm appach fihia aquacuu 135
The issue 135Possible solutions 135Recent actions 140Outloo 141
n 142

7/28/2019 The State of World Fisheries and Aquaculture_2012
http://slidepdf.com/reader/full/the-state-of-world-fisheries-and-aquaculture2012 8/230
i
P A R T 3HIGHLIGHTS OF SPECIAL STUDIES
effc f fihi maagm pici fihig af 151Methods 151Results 153Discussion 155Conclusions and ollow-up 157
F af mai a ciica cmp f f a uii cui 157Introduction 157Development o ood saety and uality systems 158Ris analysis 159Eample o ris analysis leading to development o seaoodsaety standards 159Seaood uality 160Saety management systems 160The regulatory ramewor 161
Climate change and ood saety 162Impact on developing countries 162
Mai pc aa: a f h cm appach fihi 164Introduction 164Bacground 165Planning and implementation: lessons learned 168The way orward 171
dma a upp f aquaf a f igi f fam fiha cuaca: a fuu ppc 172
Introduction 172Auaculture growth and auaeed 172Auaeed production and use 173
Feed ingredient production and availability 174Current eed ingredient usage and constraints 176Conclusion 180Issues to be addressed 181
Gba guii cabig a cificai i capu fihia aquacuu 181
Introduction 181The Marine Guidelines 182The Inland Guidelines 183The Auaculture Guidelines 184Evaluation ramewor 185Remaining issues 186
th oeCd–FAo Agicuua ou: chap fih 186
The model 186Projections 2012–2021 188
n 194
P A R T 4OUTLOOk
th f capu fihi i a gba uaiab f pucim: ppuii a chag 199
Contet 199The prospects or sustainable increased production 199Capture isheries as targets o eorts to reduce resource use
and greenhouse gas emissions 204Minimizing waste 205Improving governance 205
n 207

7/28/2019 The State of World Fisheries and Aquaculture_2012
http://slidepdf.com/reader/full/the-state-of-world-fisheries-and-aquaculture2012 9/230
ii
TABLES
tab 1World isheries and auaculture production and utilization 3
tab 2Countries or territories with no adeuate 2009 catch data submission 20
tab 3Inland capture isheries production by continent and major producer 23
tab 4Number o species items with statistics in the FAO capture database 24
tab 5Auaculture production by region: uantity and percentageo world total production 27
tab 6Top ten regional and world auaculture producers in 2010 28
tab 7World ishers and ish armers by region 41
tab 8Number ishers and ish armers in selected countries and territories 43
tab 9Fishery production per isher or ish armer by region in 2010 46
tab 10Proportion in terms o length o motorized vessels in ishing leets romselected nations in dierent regions 50
tab 11Motorized ishing leets in selected countries, 2000–2010 51
tab 12Top ten eporters and importers o ish and ishery products 71
tab 13
Total and per capita ood ish supply by continent and economicgrouping in 2009 84tab 14
Study hypotheses 152tab 15
Comparison o accident rates in French scallop isheries 154tab 16
Reduction in ishmeal inclusion in compound auaeedo dierent ish species and species groups 178
tab 17Feed ingredient usage or major auaculture species and species groups 179

7/28/2019 The State of World Fisheries and Aquaculture_2012
http://slidepdf.com/reader/full/the-state-of-world-fisheries-and-aquaculture2012 10/230
iii
FIGURES
Figu 1World capture isheries and auaculture production 4
Figu 2World ish utilization and supply 4
Figu 3World capture isheries production 5
Figu 4Recent capture isheries production by three major components 19
Figu 5Catch trend or Argentine red shrimp 22
Figu 6Catch trends or marine bivalve species groups 22
Figu 7World auaculture production o non-ed and ed species 34
Figu 8
World auaculture production and relative share by culture environment 34Figu 9
World auaculture production composition by culture environment 35Figu 10
Production o major species or species group rom auaculture in 2010 38Figu 11
World production o armed auatic plant (algae) by major speciesor species group 40
Figu 12Employment in the isheries sector or the period 1990–2010 42
Figu 13Proportion o ishing vessels in marine and inland waters by region
in 2010 48Figu 14Proportion o marine ishing vessels with and without engineby region in 2010 48
Figu 15Distribution o motorized ishing vessels by region in 2010 48
Figu 16Size distribution o ishing vessels by region in 2010 49
Figu 17Capture isheries production in marine areas 54
Figu 18Global trends in the state o world marine ish stocs since 1974 56
Figu 19
Utilization o world isheries production (breadown by uantity),1962–2010 63
Figu 20Utilization o world isheries production (breadown by uantity),2010 65
Figu 21World isheries production and uantities destined or eport 68
Figu 22Average ish prices in real terms (2005) 69
Figu 23Net eports o selected agricultural commodities by developing countries 72
Figu 24
Trade lows by continent (total imports in US$ millions, c.i..; averages or2008–2010) 74

7/28/2019 The State of World Fisheries and Aquaculture_2012
http://slidepdf.com/reader/full/the-state-of-world-fisheries-and-aquaculture2012 11/230
ix
Figu 25Imports and eports o ish and ishery products or dierent regions,indicating net deicit or surplus 76
Figu 26Shrimp prices in Japan 78
Figu 27Groundish prices in the United States o America 78
Figu 28Sipjac tuna prices in Arica and Thailand 79
Figu 29Octopus prices in Japan 80
Figu 30Fishmeal and soybean meal prices in Germany and the Netherlands 81
Figu 31Fish oil and soybean oil prices in the Netherlands 81
Figu 32Total protein supply by continent and major ood group
(average 2007–2009) 82Figu 33
Contribution o ish to animal protein supply (average 2007–2009) 83Figu 34
Fish as ood: per capita supply (average 2007–2009) 83Figu 35
Relative contribution o auaculture and capture isheriesto ood ish consumption 86
Figu 36Natural disasters reported worldwide, 1900–2010 115
Figu 37The disaster ris management cycle 118
Figu 38A new semi-pelagic low-impact and selective trawl gear(CRIPS-trawl) that is under development in Norway 128
Figu 39Smart trawling: reduced seabed damage o bottom trawling 130
Figu 40A loating pot 131
Figu 41The EAF/EAA planning ramewor 137
Figu 42Global consumption o ishmeal and ish oil by major auaculturespecies groups in 2008 176
Figu 43
Actual and predicted reduction in ishmeal use relative to the globalproduction o compound auaeed 177
Figu 44Meat and ishery production, dressed weight or eviscerated basis 188
Figu 45Fishmeal production in product weight 189
Figu 46General growth in ish prices or high eed costs and strongdemand, nominal terms 190
Figu 47Per capita ish consumption 191
Figu 48
Fishery production in live weight euivalent 192

7/28/2019 The State of World Fisheries and Aquaculture_2012
http://slidepdf.com/reader/full/the-state-of-world-fisheries-and-aquaculture2012 12/230
x
BOxES
Bx 1Improvements in China’s ishery and auaculture statistics 6
Bx 2Fish culture in rice ields 30
Bx 3Child labour – an important issue also in isheries and auaculture 44
Bx 4Developing an assessment strategy or inland ishery resources 60
Bx 5The wor o the Code Alimentarius Commission 64
Bx 6An update on the 2009 Port State Measures Agreement 96
Bx 7A gender baseline in the isheries and auaculture sector 108
Bx 8
The contribution o women in the auaculture sector 109Bx 9
Dierences in power lead to dierent opportunities 110Bx 10
quantiying ineualities 111Bx 11
Disaster management and climate change adaptation: ey deinitions 117Bx 12
Fishing vessels and uel consumption 126Bx 13
The need or an ecosystem approach in inland waters 136Bx 14
Interactions between isheries and auaculture 138Bx 15The Hazard Analysis and Critical Control Point system and prereuisiteprogrammes 160
Bx 16An Indian success story 163
Bx 17Marine protected areas, isheries and the Code 165
Bx 18Freshwater protected areas 166
Bx 19Dierent national deinitions o marine protected area 167
Bx 20
Eamples o national institutional MPA arrangements 169Bx 21
Tools or analysis and prioritization 171Bx 22
Fed ish and non-ed ish 173Bx 23
Reconciling sustainable inland isheries with the needs o other sectors 202
Notes: Unless otherwise stated, the source o data or the gures and tables is FAO. Data or China do not include:
Taiwan Province o China; China, Hong kong Special Administrative Region; and China, Macao Special Administrative
Region.

7/28/2019 The State of World Fisheries and Aquaculture_2012
http://slidepdf.com/reader/full/the-state-of-world-fisheries-and-aquaculture2012 13/230
xi
ACknowledGeMents
The State o World Fisheries and Aquaculture 2012 was prepared by FAOFisheries and Auaculture Department sta, under the coordination o a teamcomprising R. Grainger and T. Farmer, assisted by U. Wijström (consultant).General direction was provided by the Department’s Inormation Managementand Communications Committee in consultation with senior management sta:Á.M. Mathiesen, k. Cochrane (retired), L. Ababouch and J. Jiansan.
The preparation o Part 1, World review o isheries and auaculture, wasthe overall editorial responsibility o R. Grainger, who wrote the overviewand coordinated the contributions made by L. Garibaldi (production, captureisheries), x. Zhou (production, auaculture), S. Vannuccini, (utilization,
trade, commodities, consumption), I. karunasagar (utilization), G. Laurenti(consumption), F. Jara (ishers, ishing leets), G. Bianchi and Y. Ye (marineresources), D. Bartley and J. Jorgensen (inland resources), and A. Lem (trade,commodities). In the Governance section, contributions were provided byR. Willmann and C. Fuentevilla (Rio+20), R. Willmann and L. Westlund (small-scale isheries), G. Lugten (RFBs), D. Doulman and L. Antonini (IUU ishing), andN. Hishamunda (auaculture governance). S. Montanaro and contributors oselected sections prepared most o the igures and tables.
Main contributors to Part 2, Selected issues in isheries and auaculture,were: R. Metzner, M. Reantaso, k. Holvoet, S. Siar and T. Farmer (mainstreaminggender); D. Brown, F. Poulain and J. Campbell (disaster preparedness andresponse); D. Bartley, R. van Anrooy, P. Mannini and D. Soto (managing
recreational isheries); P. Suuronen, F. Chopin and J. Fitzpatric (barriers tolow-impact uel-eicient ishing); G. Bianchi, D. Soto, D. Bartley, N. Franz andG. Metzner (ecosystem approach to isheries and auaculture).
For Part 3, Highlights o special studies, contributors included:A. Gudmundsson and J. Lincoln (eects o isheries management policies onishing saety); J. Ryder, L. Ababouch and I. karunasagar (ood saety in oodand nutrition security); J. Sanders (marine protected areas); M. Hasan (auaeedand eed ingredients or armed ish and crustaceans); D. Bartley, W. Emerson,L. Ababouch and R. Subasinghe (guidelines on ecolabelling and certiication);and S. Vannuccini and A. Lem (OECD–FAO Agricultural Outloo: ish).
Part 4, Outloo, was prepared by U. Wijström, D. Bartley and J. Muir.Elements o this chapter drew upon the United kingdom Government Oiceor Sciences Foresight Project on Global Food and Farming Futures under the
leadership o Sir John Beddington.The FAO Fisheries and Auaculture Department, under the overall
supervision o T. Farmer and with assistance rom J. Plummer, coordinated theediting, design and production o The State o World Fisheries and Aquaculture 2012.

7/28/2019 The State of World Fisheries and Aquaculture_2012
http://slidepdf.com/reader/full/the-state-of-world-fisheries-and-aquaculture2012 14/230
XII
AbbrevIAtIons And Acronyms
CAC
Codex Alimentarius Commission
CACFish
Central Asian and Caucasus Regional Fisheries and Aquaculture Commission
CBD
Convention on Biological Diversity
CCA
climate change adaptation
CCAMLR
Commission for the Conservation of Antarctic Marine Living Resources
CCsBT
Commission for the Conservation of Southern Bluefin Tuna
CDs
catch documentation scheme
CECAF
Fishery Committee for the Eastern Central Atlantic
CiFAA
Committee for Inland Fisheries and Aquaculture of Africa
CiTEs
Convention on International Trade in Endangered Species of Wild Fauna
and Flora
CoDE
Code of Conduct for Responsible Fisheries
CoFi
FAO Committee on Fisheries
CoP
Code of Practice
CoREP
Regional Fisheries Committee for the Gulf of Guinea
CPUE
catch per unit of effort
DRM
disaster risk management
7/28/2019 The State of World Fisheries and Aquaculture_2012
http://slidepdf.com/reader/full/the-state-of-world-fisheries-and-aquaculture2012 15/230
xiii
DRR
disaster ris reduction
EAA
ecosystem approach to auaculture
EAF
ecosystem approach to isheries
EC
European Commission
ECosoC
United Nations Economic and Social Council
EEZ
eclusive economic zone
EiFAAC
European Inland Fisheries and Auaculture Advisory Commission
EiFAC
European Inland Fishery Advisory Commission
FCR
eed conversion ratio
FCWC
Fishery Committee or the West Central Gul o Guinea
GFCM
General Fisheries Commission or the Mediterranean
GhG
greenhouse gas
hACCP
Hazard Analysis and Critical Control Point (system)
hFA
Hyogo Framewor or Action
hUFA
highly unsaturated atty acid
iATTC
Inter-American Tropical Tuna Commission
iCCAT
International Commission or the Conservation o Atlantic Tunas
iMo
International Maritime Organization

7/28/2019 The State of World Fisheries and Aquaculture_2012
http://slidepdf.com/reader/full/the-state-of-world-fisheries-and-aquaculture2012 16/230
xi
ioTC
Indian Ocean Tuna Commission
iso
International Organization or Standardization
iTQ
individual transerable uota
iUU
illegal, unreported and unregulated ishing
LDC
least-developed country
LiFDC
low-income ood-deicit country
LiFE
low-impact uel-eicient
LoA
length overall
MDG
Millennium Development Goal
MPA
marine protected area
NAFo
Northwest Atlantic Fisheries Organization
NAsCo
North Atlantic Salmon Conservation Organization
NEAFC
North East Atlantic Fisheries Commission
NEi
not elsewhere included
NGo
non-governmental organization
NoAA
National Oceanic and Atmospheric Administration (the United States oAmerica)
NPAFC
North Paciic Anadromous Fish Commission
oECD
Organisation or Economic Co-operation and Development
7/28/2019 The State of World Fisheries and Aquaculture_2012
http://slidepdf.com/reader/full/the-state-of-world-fisheries-and-aquaculture2012 17/230
x
osPEsCA
Organization o Fishing and Auaculture in Central America
PERsGA
Regional Organization or the Conservation o the Environment o the RedSea and Gul o Aden
RFB
regional ishery body
RFMo
regional isheries management organization
R&D
research and development
sAR
search and rescue
sEAFo
South East Atlantic Fisheries Organisation
sioFA
Southern Indian Ocean Fisheries Agreement
sPRFMo
South Paciic Regional Fisheries Management Organisation
sPs AGREEMENT
Agreement on the Application o Sanitary and Phytosanitary Measures
sWioFC
Southwest Indian Ocean Fisheries Commission
TBT AGREEMENT
Agreement on Technical Barriers to Trade
UNGA
United Nations General Assembly
WCPFC
Western and Central Paciic Fisheries Commission
Who
World Health Organization
WTo
World Trade Organization

7/28/2019 The State of World Fisheries and Aquaculture_2012
http://slidepdf.com/reader/full/the-state-of-world-fisheries-and-aquaculture2012 18/230

7/28/2019 The State of World Fisheries and Aquaculture_2012
http://slidepdf.com/reader/full/the-state-of-world-fisheries-and-aquaculture2012 19/230
PART 1
world revIew oF FIsHerIes
And AQUACUltUre

7/28/2019 The State of World Fisheries and Aquaculture_2012
http://slidepdf.com/reader/full/the-state-of-world-fisheries-and-aquaculture2012 20/230

7/28/2019 The State of World Fisheries and Aquaculture_2012
http://slidepdf.com/reader/full/the-state-of-world-fisheries-and-aquaculture2012 21/230
3
world revIew oF FIsHerIes And
AQUACUltUre
sau a
overvIew
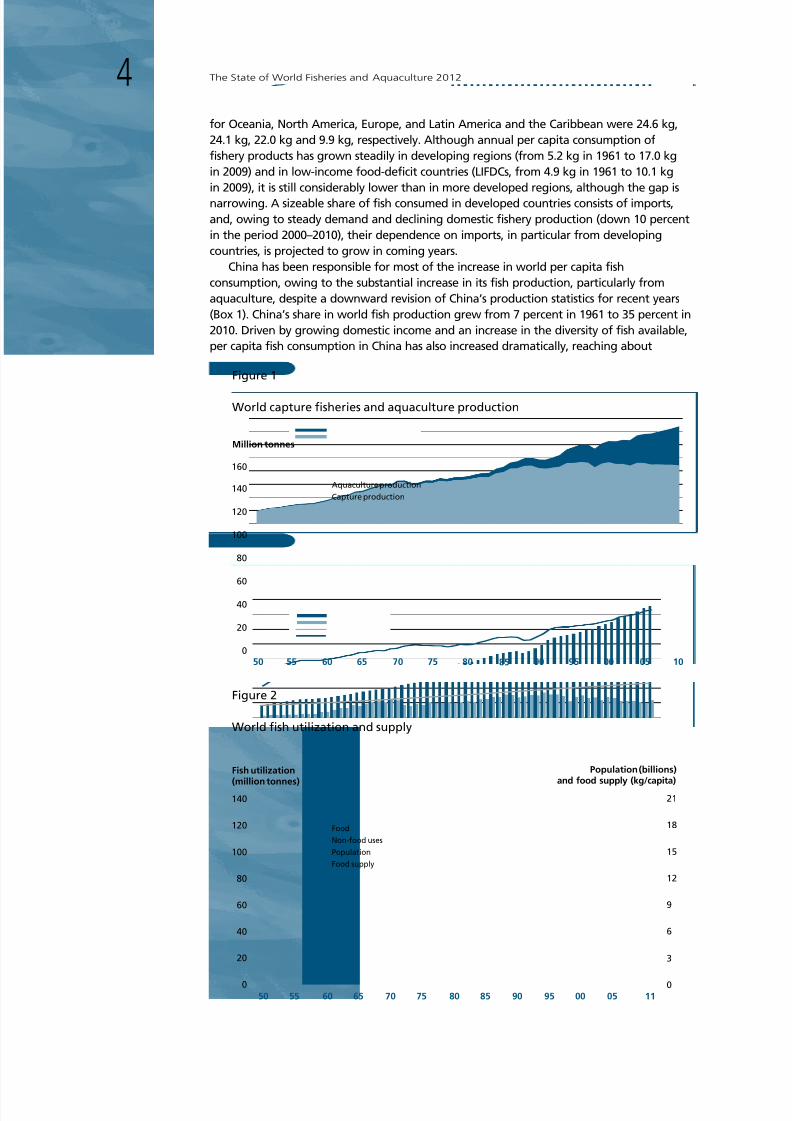
Capture isheries and auaculture supplied the world with about 148 million tonnes o
ish in 2010 (with a total value o US$217.5 billion), o which about 128 million tonnes wasutilized as ood or people, and preliminary data or 2011 indicate increased production o154 million tonnes, o which 131 million tonnes was destined as ood (Table 1 and Figure 1,all data presented are subject to rounding). With sustained growth in ish production andimproved distribution channels, world ish ood supply has grown dramatically in the lastive decades, with an average growth rate o 3.2 percent per year in the period 1961–2009,outpacing the increase o 1.7 percent per year in the world’s population. World per capitaood ish supply increased rom an average o 9.9 g (live weight euivalent) in the 1960sto 18.4 g in 2009, and preliminary estimates or 2010 point to a urther increase in ishconsumption to 18.6 g1 (Table 1 and Figure 2). O the 126 million tonnes available orhuman consumption in 2009, ish consumption was lowest in Arica (9.1 million tonnes,with 9.1 g per capita), while Asia accounted or two-thirds o total consumption, with
85.4 million tonnes (20.7 g per capita), o which 42.8 million tonnes was consumedoutside China (15.4 g per capita). The corresponding per capita ish consumption igures
Table 1World isheries and auaculture production and utilization
2006 2007 2008 2009 2010 2011
(Million tonnes)
ProdUCtIon
Capu
Inland 9.8 10.0 10.2 10.4 11.2 11.5
Marine 80.2 80.4 79.5 79.2 77.4 78.9
ta capu 90.0 90.3 89.7 89.6 88.6 90.4
Aquacuu
Inland 31.3 33.4 36.0 38.1 41.7 44.3
Marine 16.0 16.6 16.9 17.6 18.1 19.3
ta aquacuu 47.3 49.9 52.9 55.7 59.9 63.6
totAl world FIsHerIes 137.3 140.2 142.6 145.3 148.5 154.0
UtIlIZAtIon
Human consumption 114.3 117.3 119.7 123.6 128.3 130.8
Non-ood uses 23.0 23.0 22.9 21.8 20.2 23.2
Population (billions) 6.6 6.7 6.7 6.8 6.9 7.0
Per capita ood ish supply (kg) 17.4 17.6 17.8 18.1 18.6 18.8
Notes: Ecluding auatic plants. Totals may not match due to rounding. Data or 2011 are provisional estimates.
7/28/2019 The State of World Fisheries and Aquaculture_2012
http://slidepdf.com/reader/full/the-state-of-world-fisheries-and-aquaculture2012 22/230
The State o World Fisheries and Aquaculture 20124
or Oceania, North America, Europe, and Latin America and the Caribbean were 24.6 g,24.1 g, 22.0 g and 9.9 g, respectively. Although annual per capita consumption oishery products has grown steadily in developing regions (rom 5.2 g in 1961 to 17.0 gin 2009) and in low-income ood-deicit countries (LIFDCs, rom 4.9 g in 1961 to 10.1 gin 2009), it is still considerably lower than in more developed regions, although the gap isnarrowing. A sizeable share o ish consumed in developed countries consists o imports,and, owing to steady demand and declining domestic ishery production (down 10 percentin the period 2000–2010), their dependence on imports, in particular rom developingcountries, is projected to grow in coming years.
China has been responsible or most o the increase in world per capita ishconsumption, owing to the substantial increase in its ish production, particularly romauaculture, despite a downward revision o China’s production statistics or recent years(Bo 1). China’s share in world ish production grew rom 7 percent in 1961 to 35 percent in2010. Driven by growing domestic income and an increase in the diversity o ish available,per capita ish consumption in China has also increased dramatically, reaching about
0
20
40
60
80
100
120
140
50 55 60 65 70 75 80 85 90 95 00 05 110
3
6
9
12
15
18
21
Figure 2
World fish utilization and supply
Fish utilization
(million tonnes)
Population (billions)and food supply (kg/capita)
Food
Non-food uses
Population
Food supply
0
20
40
60
80
100
120
140
160
50 55 60 65 70 75 80 85 90 95 00 05 10
Figure 1
World capture fisheries and aquaculture production
Million tonnes
Aquaculture production
Capture production

7/28/2019 The State of World Fisheries and Aquaculture_2012
http://slidepdf.com/reader/full/the-state-of-world-fisheries-and-aquaculture2012 23/230
World review o fsheries and aquaculture 5
31.9 g in 2009, with an average annual rate o 6.0 percent in the period 1990–2009. IChina is ecluded, annual ish supply to the rest o the world in 2009 was about 15.4 gper person, higher than the average values o the 1960s (11.5 g), 1970s (13.5 g), 1980s(14.1 g) and 1990s (13.5 g).
Fish and ishery products represent a very valuable source o protein and essentialmicronutrients or balanced nutrition and good health. In 2009, ish accounted or16.6 percent o the world population’s intae o animal protein and 6.5 percent o allprotein consumed. Globally, ish provides about 3.0 billion people with almost 20 percento their intae o animal protein, and 4.3 billion people with about 15 percent o suchprotein. Dierences among developed and developing countries are apparent in thecontribution o ish to animal protein intae. Despite the relatively lower levels o ishconsumption in developing countries, the share contributed by ish was signiicant atabout 19.2 percent, and or LIFDCs it was 24.0 percent. However, in both developing anddeveloped countries, this share has declined slightly in recent years as consumption oother animal proteins has grown more rapidly.
0
3
6
9
12
50 55 60 65 70 75 80 85 90 95 00 05 10
0
30
60
90
50 55 60 65 70 75 80 85 90 95 00 05 10
Figure 3
World capture fisheries production
Million tonnes
Million tonnes
MARINE WATERS
INLAND WATERS

7/28/2019 The State of World Fisheries and Aquaculture_2012
http://slidepdf.com/reader/full/the-state-of-world-fisheries-and-aquaculture2012 24/230
The State o World Fisheries and Aquaculture 20126
Bo 1
Improvements in China’s ishery and auaculture statistics
As stated in previous issues o The State o World Fisheries and
Aquaculture, China revised its production statistics or capture
isheries and auaculture or 2006 onwards using a revised statistical
methodology based on the outcome o China’s 2006 National
Agricultural Census, which contained uestions on ish production or
the irst time, as well as on results rom various pilot sample surveys.
FAO subseuently estimated revisions or its historical statistics or
China or 1997–2005.
Sample surveys have been increasingly adopted in China as an
eicient means o collecting data, with the possibility o tailoring
them to collect more detailed inormation reuired speciically
or the local situation in which they are conducted. Prior to theimplementation o more systematic sample surveys, pilot surveys were
undertaen to test their utility in a variety o very dierent situations.
In addition to some undertaen independently by Chinese authorities,
the ollowing pilot sample surveys were conducted jointly by China
and FAO:
• marine capture isheries in xiangshan County, Zhejiang Province
(2002–03);
• marine capture isheries in Putuo District, Zhoushan (China’s
largest ishing port), Zhejiang Province, and in Haimen City,
Jiangsu Province (2004–05);
• marine capture isheries in Laizhou City, Shandong Province
(2008–09);• inland capture isheries at Lae Liangzi, Hubei Province (2008–09);
• inland capture isheries at Lae Taihu, Jiangsu Province (2009–2010).
Recognizing the importance o its statistics on isheries and
auaculture as a basis or its sectoral policy-maing and management,
as well as their major implications or global statistics, it is notable
that China has continued to implement improvements to many
aspects o its statistical systems, including the urther use o sample-
based surveys. Further improvements are in progress, including the
disaggregation o primary-sector employment statistics between
isheries and auaculture. Since 2009, improvement o statistics has
been a priority or national isheries and auaculture development
Overall global capture isheries production continues to remain stable at about90 million tonnes (Table 1) although there have been some mared changes in catchtrends by country, ishing area and species. In the last seven years (2004–2010),landings o all marine species ecept anchoveta only ranged between 72.1 millionand 73.3 million tonnes. In contrast, the most dramatic changes, as usual, havebeen or anchoveta catches in the Southeast Paciic, which decreased rom10.7 million tonnes in 2004 to 4.2 million tonnes in 2010. A mared decrease inanchoveta catches by Peru in 2010 was largely a result o management measures
(e.g. ishing closures) applied to protect the high number o juveniles present as aconseuence o the La Niña event (cold water). This action paid dividends in 2011
7/28/2019 The State of World Fisheries and Aquaculture_2012
http://slidepdf.com/reader/full/the-state-of-world-fisheries-and-aquaculture2012 25/230
World review o fsheries and aquaculture 7
and management, and additional unds have been allocated
annually to strengthen the national and local capacity in collecting
data and improving data uality through the ollowing activities:
• training o enumerators and statistical oicers rom county to
provincial levels;
• establishment o a ualiication system or enumerators
and a national database and communication networ or
enumerators and statistical oicers overseen by an advisory
epert panel;
• establishment o an Internet-based data reporting and
validation system;
• development o ield manuals or enumerators.In addition to annual data collection and reporting, China has
established monthly and mid-year data collection and reporting
systems or important statistical indicators. Specialized institutes
have been commissioned to use geographic inormation system (GIS)
technologies to veriy inland ishery and auaculture areas. Parallel
to the national data collection system, networs involving research
institutions and isheries authorities o ey producing areas in the
country have been established under the Chinese Academy o Fisheries
Sciences to monitor auaculture production o “staple species”.
The current data collection system in China covers capture
production (by species, ishing area and ishing gear), ishing
vessels, auaculture production (by species, arming system andmethod), auaculture areas, auaculture seed production, ishery
products processing, damage and losses in capture and auaculture,
employment and the ishery-dependent population, and ishery
household-level economic indicators. China also collects and reports
weely wholesale ish prices or major mareting centres in all the
provinces.
In recent years, communication between the Chinese reporting
oice and FAO has improved, resulting in more inormation
becoming available on ish utilization, more detailed and accurate
ishing leet statistics, and disaggregation o primary-sector
employment statistics between isheries and auaculture.
when anchoveta catches eceeded their 2009 level. Inland water capture productioncontinued to grow continuously, with an overall increase o 2.6 million tonnes inthe period 2004–2010 (Figure 3).
The Northwest Paciic is still by ar the most productive ishing area. Catch peasin the Northwest Atlantic, Northeast Atlantic and Northeast Paciic temperate ishingareas were reached many years ago, and total production had declined continuouslyrom the early and mid-2000s, but in 2010 this trend was reversed in all three areas.As or mainly tropical areas, total catches grew in the Western and Eastern Indian
Ocean and in the Western Central Paciic. In contrast, the 2010 production in theWestern Central Atlantic decreased, with a reduction in United States catches by about

7/28/2019 The State of World Fisheries and Aquaculture_2012
http://slidepdf.com/reader/full/the-state-of-world-fisheries-and-aquaculture2012 26/230
The State o World Fisheries and Aquaculture 20128
100 000 tonnes, probably mostly attributable to the oil spill in the Gul o Meico.Since 1978, the Eastern Central Paciic has shown a series o luctuations in captureproduction with a cycle o about 5–9 years. The latest pea was in 2009, and a decliningphase may have started in 2010. Both the Mediterranean–Blac Sea and the SouthwestAtlantic have seen declining catches, with decreases o 15 and 30 percent, respectively,since 2007. In the Southeast Paciic (ecluding anchoveta) and the Southeast Atlantic,both areas where upwelling phenomena occur with strongly varied intensity eachyear, historical catch trends have been downward in both areas. In the Eastern CentralAtlantic, production has increased in the last three years, but there are some reportinginconsistencies or this area.
Chilean jac macerel catches have declined or this transboundary resource witha very wide distribution in the South Paciic, ranging rom the national eclusiveeconomic zones (EEZs) to the high seas. Ater having peaed at about 5 million tonnesin the mid-1990s, catches were about 2 million tonnes in the mid-2000s but have sincedeclined abruptly, and the 2010 catches were 0.7 million tonnes, the lowest level since1976. In contrast, Atlantic cod catches have increased by almost 200 000 tonnes inthe last two years. In act, in 2010, the whole group o gadiorm species (cods, haes,
haddocs, etc.) reversed the negative trend o the previous three years in which ithad declined by 2 million tonnes. Preliminary data or this group also report growingcatches or 2011. Capture production o other important commercial species groupssuch as tunas and shrimps remained stable in 2010. The highly variable catches ocephalopods resumed growth ater a decrease in 2009 o about 0.8 million tonnes. Inthe Antarctic areas, interest in ishing or rill resumed, and a catch increase o morethan 70 percent was registered in 2010.
Total global capture production in inland waters has increased dramatically sincethe mid-2000s with reported and estimated total production at 11.2 million tonnes in2010, an increase o 30 percent since 2004. Despite this growth, it may be that captureproduction in inland waters is seriously underestimated in some regions. Nevertheless,inland waters are considered as being overished in many parts o the world, and
human pressure and changes in the environmental conditions have seriously degradedimportant bodies o reshwater (e.g. the Aral Sea and Lae Chad). Moreover, in severalcountries that are important in terms o inland waters ishing (e.g. China), a goodportion o inland catches comes rom waterbodies that are artiicially restoced.It is not clear to what etent improvements in the statistical coverage and stocenhancement activities may be contributing to the apparent increase in inland isheryproduction. Growth in the global inland water catch is wholly attributable to Asiancountries. With the remarable increases reported or 2010 production by India, Chinaand Myanmar, Asia’s share is approaching 70 percent o global production. Inlandwater capture production in the other continents shows dierent trends. Ugandaand the United Republic o Tanzania, ishing mostly in the Arican Great Laes, andNigeria and Egypt, with river isheries, remain the main producers in Arica. Catches inseveral South and North American countries have been reported as shrining. Increased
European production between 2004 and 2010 is all attributable to a rise o almost50 percent in catches o the Russian Federation. Inland ishery production is marginal incountries in Oceania.
In the last three decades (1980–2010), world ood ish production o auaculturehas epanded by almost 12 times, at an average annual rate o 8.8 percent. Globalauaculture production has continued to grow, albeit more slowly than in the 1980sand 1990s. World auaculture production attained another all-time high in 2010, at60 million tonnes (ecluding auatic plants and non-ood products), with an estimatedtotal value o US$119 billion. When armed auatic plants and non-ood productsare included, world auaculture production in 2010 was 79 million tonnes, worthUS$125 billion. About 600 auatic species are raised in captivity in about 190 countriesor production in arming systems o varying input intensities and technological
sophistication. These include hatcheries producing seeds or stocing to the wild,particularly in inland waters.

7/28/2019 The State of World Fisheries and Aquaculture_2012
http://slidepdf.com/reader/full/the-state-of-world-fisheries-and-aquaculture2012 27/230
World review o fsheries and aquaculture 9
In 2010, global production o armed ood ish was 59.9 million tonnes, up by7.5 percent rom 55.7 million tonnes in 2009 (32.4 million tonnes in 2000). Farmedood ish include inishes, crustaceans, molluscs, amphibians (rogs), auatic reptiles(ecept crocodiles) and other auatic animals (such as sea cucumbers, sea urchins, seasuirts and jellyishes), which are indicated as ish throughout this document. Thereported grow-out production rom auaculture is almost entirely destined or humanconsumption. The total armgate value o ood ish production rom auaculture isestimated at US$119.4 billion or 2010.
Auaculture production is vulnerable to adverse impacts o disease andenvironmental conditions. Disease outbreas in recent years have aected armedAtlantic salmon in Chile, oysters in Europe, and marine shrimp arming in severalcountries in Asia, South America and Arica, resulting in partial or sometimes totalloss o production. In 2010, auaculture in China suered production losses o1.7 million tonnes caused by natural disasters, diseases and pollution. Disease outbreasvirtually wiped out marine shrimp arming production in Mozambiue in 2011.
The global distribution o auaculture production across the regions and countrieso dierent economic development levels remains imbalanced. In 2010, the top ten
producing countries accounted or 87.6 percent by uantity and 81.9 percent by valueo the world’s armed ood ish. Asia accounted or 89 percent o world auacultureproduction by volume in 2010, and this was dominated by the contribution o China,which accounted or more than 60 percent o global auaculture production volumein 2010. Other major producers in Asia are India, Viet Nam, Indonesia, Bangladesh,Thailand, Myanmar, the Philippines and Japan. In Asia, the share o reshwaterauaculture has been gradually increasing, up to 65.6 percent in 2010 rom around60 percent in the 1990s. In terms o volume, Asian auaculture is dominated byinishes (64.6 percent), ollowed by molluscs (24.2 percent), crustaceans (9.7 percent)and miscellaneous species (1.5 percent). The share o non-ed species armed in Asiawas 35 percent (18.6 million tonnes) in 2010 compared with 50 percent in 1980.
In North America, auaculture has ceased epanding in recent years, but in South
America it has shown strong and continuous growth, particularly in Brazil and Peru.In terms o volume, auaculture in North and South America is dominated by inishes(57.9 percent), crustaceans (21.7 percent) and molluscs (20.4 percent). In Europe, theshare o production rom bracish and marine waters increased rom 55.6 percentin 1990 to 81.5 percent in 2010, driven by marine cage culture o Atlantic salmonand other species. Several important producers in Europe have recently ceasedepanding or have even contracted, particularly in the marine bivalve sector. In 2010,inishes accounted or three-uarters o all European auaculture production, andmolluscs one-uarter. Arica has increased its contribution to global production rom1.2 percent to 2.2 percent in the past ten years, mainly as a result o rapid developmentin reshwater ish arming in sub-Saharan Arica. Arican auaculture productionis overwhelmingly dominated by inishes, with only a small raction rom marineshrimps and marine molluscs. Oceania accounts or a minor share o global auaculture
production and this consists mainly o marine molluscs and inishes, with the latterincreasing owing mainly to the development o arming o Atlantic salmon in Australiaand chinoo salmon in New Zealand.
The least-developed countries (LDCs), mostly in sub-Saharan Arica and in Asia,remain minor in terms o their share o world auaculture production (4.1 percentby uantity and 3.6 percent by value) with the main producers including Bangladesh,Myanmar, Uganda, the Lao People’s Democratic Republic and Cambodia. However,some developing countries in Asia and the Paciic (Myanmar and Papua New Guinea),sub-Saharan Arica (Nigeria, Uganda, kenya, Zambia and Ghana) and South America(Ecuador, Peru and Brazil) have made rapid progress to become signiicant or majorauaculture producers in their regions. In contrast, in 2010, developed industrializedcountries produced collectively 6.9 percent (4.1 million tonnes) by uantity and
14 percent (US$16.6 billion) by value o the world’s armed ood ish production,compared with 21.9 percent and 32.4 percent, respectively, in 1990. Auaculture

7/28/2019 The State of World Fisheries and Aquaculture_2012
http://slidepdf.com/reader/full/the-state-of-world-fisheries-and-aquaculture2012 28/230
The State o World Fisheries and Aquaculture 201210
production has contracted or stagnated in Japan, the United States o America andseveral European countries. An eception is Norway, where, thans to the arming oAtlantic salmon in marine cages, auaculture production grew rom 151 000 tonnes in1990 to more than one million tonnes in 2010.
Freshwater ishes dominate global auaculture production (56.4 percent,33.7 million tonnes), ollowed by molluscs (23.6 percent, 14.2 million tonnes),crustaceans (9.6 percent, 5.7 million tonnes), diadromous ishes (6.0 percent,3.6 million tonnes), marine ishes (3.1 percent, 1.8 million tonnes) and other auaticanimals (1.4 percent, 814 300 tonnes). While eed is generally perceived to be a majorconstraint to auaculture development, one-third o all armed ood ish production(20 million tonnes) is currently achieved without artiicial eeding, as is the case orbivalves and ilter-eeding carps. However, the percentage o non-ed species in worldproduction has declined gradually rom more than 50 percent in 1980 to the presentlevel o 33.3 percent, relecting the relatively aster body-growth rates achieved in theculture o ed species and increasing consumer demand or higher trophic-level specieso ishes and crustaceans.
Fisheries and auaculture provided livelihoods and income or an estimated
54.8 million people engaged in the primary sector o ish production in 2010, o whoman estimated 7 million were occasional ishers and ish armers. Asia accounts or morethan 87 percent o the world total with China alone having almost 14 million people(26 percent o the world total) engaged as ishers and ish armers. Asia is ollowedby Arica (more than 7 percent), and Latin America and the Caribbean (3.6 percent).About 16.6 million people (about 30 percent o the world total) were engaged in isharming, and they were even more concentrated in Asia (97 percent), ollowed by LatinAmerica and the Caribbean (1.5 percent), and Arica (about 1 percent). Employmentin the isheries and auaculture primary sector has continued to grow aster thanemployment in agriculture, so that by 2010 it represented 4.2 percent o the 1.3 billionpeople economically active in the broad agriculture sector worldwide, comparedwith 2.7 percent in 1990. In the last ive years, the number o people engaged in ish
arming has increased by 5.5 percent per year compared with only 0.8 percent per yearor those in capture isheries, although capture isheries still accounted or 70 percento the combined total in 2010. It is apparent that, in the most important ishingnations, the share o employment in capture isheries is stagnating or decreasing whileauaculture is providing increased opportunities. Europe eperienced the largestdecrease in the number o people engaged in capture ishing, with a 2 percent averageannual decline between 2000 and 2010, and almost no increase in people employedin ish arming. In contrast, Arica showed the highest annual increase (5.9 percent) inthe number o people engaged in ish arming in the same period, ollowed by Asia(4.8 percent), and Latin America and the Caribbean (2.6 percent). Overall, productionper person is lower in capture isheries than in auaculture, with global outputs o2.3 and 3.6 tonnes per person per year respectively, relecting the huge numbers oishers engaged in small-scale isheries.
Apart rom the primary production sector, isheries and auaculture providenumerous jobs in ancillary activities such as processing, pacaging, mareting anddistribution, manuacturing o ish-processing euipment, net and gear maing,ice production and supply, boat construction and maintenance, research andadministration. All o this employment, together with dependants, is estimated tosupport the livelihoods o 660–820 million people, or about 10–12 percent o theworld’s population.
The total number o ishing vessels in the world in 2010 is estimated at about4.36 million, which is similar to previous estimates. O these, 3.23 million vessels(74 percent) are considered to operate in marine waters, with the remaining1.13 million vessels operating in inland waters. Overall, Asia has the largest leet,comprising 3.18 million vessels and accounting or 73 percent o the world total,
ollowed by Arica (11 percent), Latin America and the Caribbean (8 percent), NorthAmerica (3 percent) and Europe (3 percent). Globally, 60 percent o ishing vessels

7/28/2019 The State of World Fisheries and Aquaculture_2012
http://slidepdf.com/reader/full/the-state-of-world-fisheries-and-aquaculture2012 29/230
World review o fsheries and aquaculture 11
were engine-powered in 2010, but although 69 percent o vessels operating in marinewaters were motorized, the igure was only 36 percent or inland waters. For the leetoperating in marine waters, there were also large variations among regions, with non-motorized vessels accounting or less than 7 percent o the total in Europe and theNear East, but up to 61 percent in Arica.
Over 85 percent o the motorized ishing vessels in the world are less than 12 m inlength overall (LOA). Such vessels dominate in all regions, but maredly so in the NearEast, and Latin America and the Caribbean. About 2 percent o all motorized ishingvessels corresponded to industrialized ishing vessels o 24 m and larger (with a grosstonnage [GT] o roughly more than 100 GT) and that raction was larger in the Paciicand Oceania region, Europe, and North America.
Data rom some countries indicate a recent epansion in their leets. For eample,the motorized ishing leets in Malaysia, Cambodia and Indonesia increased by 26,19 and 11 percent, respectively, between 2007 and 2009, and Viet Nam reported a10 percent increase in oshore ishing vessels (those with engines o more than 90 hp)between 2008 and 2010. The case o Sri Lana illustrates potential overshoot in eortsto re-establish a ishing leet, o which 44 percent o the motorized vessels were
destroyed by the tsunami that swept the region at the end o 2004, with the result thatby 2010 there were 11 percent more motorized vessels than beore the tsunami.
Many countries have policies to reduce overcapacity in their ishing leets. China’smarine ishing vessel reduction plan or 2003–2010 did achieve a reduction by 2008close to the target, but since then both the number o vessels and total combinedpower have started to increase again. Japan implemented various schemes thatresulted in a net reduction o 9 percent in the number o vessels, but a net increase o5 percent in combined power between 2005 and 2009. The evolution in the combinednumber, tonnage, and power o European Union ishing vessels indicates a downwardtendency in the last decade and the combined EU-15 motorized ishing leet achieveda net reduction o 8 percent in the number o vessels and o 11 percent in powerbetween 2005 and 2010. Other important ishing nations that achieved a net reduction
in leet size in the period 2005–2010 include Iceland, Norway and the Republic okorea.The world’s marine isheries increased maredly rom 16.8 million tonnes in
1950 to a pea o 86.4 million tonnes in 1996, and then declined beore stabilizingat about 80 million tonnes. Global recorded production was 77.4 million tonnes in2010. The Northwest Paciic had the highest production with 20.9 million tonnes(27 percent o the global marine catch) in 2010, ollowed by the Western CentralPaciic with 11.7 million tonnes (15 percent), the Northeast Atlantic with 8.7 milliontonnes (11 percent), and the Southeast Paciic, with a total catch o 7.8 million tonnes(10 percent). The proportion o non-ully eploited stocs has decreased graduallysince 1974 when the irst FAO assessment was completed. In contrast, the percentageo overeploited stocs has increased, especially in the late 1970s and 1980s, rom10 percent in 1974 to 26 percent in 1989. Ater 1990, the number o overeploited
stocs continued to increase, albeit at a slower rate. Increases in production rom theseovereploited stocs may be possible i eective rebuilding plans are put in place. Theraction o ully eploited stocs, which produce catches that are very close to theirmaimum sustainable production and have no room or urther epansion and reuireeective management to avoid decline, has shown the smallest change over time, withits percentage stable at about 50 percent rom 1974 to 1985, then alling to 43 percentin 1989 beore gradually increasing to 57 percent in 2009. About 29.9 percent ostocs are overeploited, producing lower yields than their biological and ecologicalpotential and in need o strict management plans to restore their ull and sustainableproductivity in accordance with the Johannesburg Plan o Implementation thatresulted rom the World Summit on Sustainable Development (Johannesburg, 2002),which demands that all overeploited stocs be restored to the level that can produce
maimum sustainable yield by 2015, a target that seems unliely to be met. Theremaining 12.7 percent o stocs were non-ully eploited in 2009, and these are under

7/28/2019 The State of World Fisheries and Aquaculture_2012
http://slidepdf.com/reader/full/the-state-of-world-fisheries-and-aquaculture2012 30/230
The State o World Fisheries and Aquaculture 201212
relatively low ishing pressure and have some potential to increase their productionalthough they oten do not have a high production potential and reuire propermanagement plans to ensure that any increase in the eploitation rate does not resultin urther overishing.
Most o the stocs o the top ten species, which account in total or about30 percent o world marine capture isheries production, are ully eploited and,thereore, have no potential or increases in production, while some stocs areovereploited and increases in their production may be possible i eective rebuildingplans are put in place. The two main stocs o anchoveta in the Southeast Paciic,Alasa polloc in the North Paciic and blue whiting in the Atlantic are ully eploited.Atlantic herring stocs are ully eploited in both the Northeast and NorthwestAtlantic. Japanese anchovy in the Northwest Paciic and Chilean jac macerel in theSoutheast Paciic are considered to be overeploited. Chub macerel stocs are ullyeploited in the Eastern Paciic and the Northwest Paciic. The largehead hairtail wasestimated in 2009 to be overeploited in the main ishing area in the Northwest Paciic.
Among the seven principal tuna species, one-third were estimated to beovereploited, 37.5 percent were ully eploited, and 29 percent non-ully eploited
in 2009. Although sipjac tuna continued its increasing trend up to 2009, urtherepansion should be closely monitored, as it may negatively aect bigeye andyellowin tunas (multispecies isheries). In the long term, the status o tuna stocs(and conseuently catches) may urther deteriorate unless there are signiicantimprovements in their management. This is because o the substantial demand or tunaand the signiicant overcapacity o tuna ishing leets. Concern about the poor statuso some bluein stocs and the inability o some tuna management organizations tomanage these stocs eectively led to a proposal in 2010 to ban the international tradein Atlantic bluein tuna under the Convention on International Trade in EndangeredSpecies o Wild Fauna and Flora (CITES) and, although the proposal was ultimatelyrejected, the concern remains.
The overall situation when summarized by FAO statistical areas shows three main
patterns in catch trends. Areas that have demonstrated oscillations in total catch arethe Eastern Central Atlantic (Area 34), Northeast Paciic (Area 67), Eastern CentralPaciic (Area 77), Southwest Atlantic (Area 41), Southeast Paciic (Area 87), andNorthwest Paciic (Area 61). These areas have provided about 52 percent o the world’stotal marine catch on average in the last ive years. Several o these areas includeupwelling regions that are characterized by high natural variability. The second groupconsists o areas that have demonstrated a decreasing trend in catch since reaching apea at some time in the past. This group has contributed 20 percent o global marinecatch on average in the last ive years, and includes the Northeast Atlantic (Area 27),Northwest Atlantic (Area 21), Western Central Atlantic (Area 31), Mediterranean andBlac Sea (Area 37), Southwest Paciic (Area 81), and Southeast Atlantic (Area 47).It should be noted that lower catches in some cases relect isheries managementmeasures that are precautionary or aim at rebuilding stocs, and this situation should,
thereore, not necessarily be interpreted as negative. The third group comprises theFAO areas that have shown continuously increasing trends in catch since 1950 andincludes the Western Central Paciic (Area 71), Eastern (Area 57) and Western (Area 51)Indian Ocean. They have together contributed 28 percent o the total marine catch onaverage over the last ive years. However, in some regions, there is still high uncertaintyabout the actual catches owing to the poor uality o statistical reporting systems incoastal countries.
The declining global marine catch over the last ew years together with theincreased percentage o overeploited ish stocs and the decreased proportion onon-ully eploited species around the world convey the strong message that thestate o world marine isheries is worsening and has had a negative impact on isheryproduction. Overeploitation not only causes negative ecological conseuences, but
it also reduces ish production, which urther leads to negative social and economicconseuences. To increase the contribution o marine isheries to the ood security,

7/28/2019 The State of World Fisheries and Aquaculture_2012
http://slidepdf.com/reader/full/the-state-of-world-fisheries-and-aquaculture2012 31/230
World review o fsheries and aquaculture 13
economies and well-being o the coastal communities, eective management plansmust be put in place to rebuild overeploited stocs. The situation seems more criticalor some highly migratory, straddling and other ishery resources that are eploitedsolely or partially in the high seas. The United Nations Fish Stocs Agreement thatentered into orce in 2001 should be used as a legal basis or management measures othe high seas isheries.
In spite o the worrisome global situation o marine capture isheries, good progressis being made in reducing eploitation rates and restoring overeploited ish stocs andmarine ecosystems through eective management actions in some areas. In the UnitedStates o America, 67 percent o all stocs are now being sustainably harvested, whileonly 17 percent are still overeploited. In New Zealand, 69 percent o stocs are abovemanagement targets, relecting mandatory rebuilding plans or all isheries that arestill below target thresholds. Similarly, Australia reports overishing or only 12 percento stocs in 2009. Since the 1990s, the Newoundland–Labrador Shel, the NortheastUnited States Shel, the Southern Australian Shel, and Caliornia Current ecosystemshave shown substantial declines in ishing pressure such that they are now at or belowthe modelled eploitation rate that gives the multispecies maimum sustainable yield
o the ecosystem. These and other successes can serve as eamples to assist in moreeective management o other isheries.
The inormation summarizing the state o the major marine ish stocs is impossibleto duplicate or the state o most o the world’s inland isheries, or which theeploitation rate is oten not the main driver aecting the state o the stocs. Otherdrivers such as habitat uantity and uality, auaculture in the orm o stocingand competition or reshwater, inluence the state o the majority o inland isheryresources much more than eploitation rates do. Water abstraction and diversion,hydroelectric development, draining wetlands, and siltation and erosion rom land-use patterns can negatively aect inland ishery resources regardless o the rate oeploitation. Conversely, stoc enhancement rom auaculture acilities, which iswidely practised in inland waters, can eep catch rates high in the ace o increased
ishing and in spite o an ecosystem that is not capable o producing that level o catchthrough natural processes. Overeploitation also aects inland ishery resources, butthe result is generally a change in species composition and not necessarily a reducedoverall catch. Catches are oten higher where smaller and shorter-lived species becomethe main component o the catch; however, the smaller ish may be much less valuable.Another issue complicating the assessment o inland ishery resources is the deinitiono a “stoc”. Very ew inland isheries have stocs that are deined precisely or aredeined at the level o species. There are notable eceptions such as the Lae VictoriaNile perch and Tonle Sap dai isheries, but many inland ishery resources are deined bywatershed or river and comprise numerous species. Taing all o these considerationsinto account, FAO is leading eorts to improve data collection and develop newassessment methodologies or inland ishery resources that are so important butoten underestimated in terms o their economic, social and nutritional beneits
and contribution to livelihoods and ood security. The intention is to utilize the newmethodology to provide a more robust and inormative summary o the state o theworld’s inland capture ishery resources in the uture.
Concerning utilization o the world’s ish production, 40.5 percent (60.2 milliontonnes) was mareted in live, resh or chilled orms, 45.9 percent (68.1 milliontonnes) was processed in rozen, cured or otherwise prepared orms or direct humanconsumption, and 13.6 percent destined or non-ood uses in 2010. Since the early1990s, there has been an increasing trend in the proportion o isheries productionused or direct human consumption rather than or other purposes. Whereas in the1980s about 68 percent o the ish produced was destined or human consumption,this share increased to more than 86 percent in 2010, eualling 128.3 million tonnes.In 2010, 20.2 million tonnes was destined to non-ood purposes, o which 75 percent
(15 million tonnes) was reduced to ishmeal and ish oil; the remaining 5.1 milliontonnes was largely utilized as ish or ornamental purposes, or culture (ingerlings,

7/28/2019 The State of World Fisheries and Aquaculture_2012
http://slidepdf.com/reader/full/the-state-of-world-fisheries-and-aquaculture2012 32/230
The State o World Fisheries and Aquaculture 201214
ry, etc.), or bait, or pharmaceutical uses as well as or direct eeding in auaculture,or livestoc and or ur animals. O the ish destined or direct human consumption, themost important product orm was live, resh or chilled ish, with a share o 46.9 percentin 2010, ollowed by rozen ish (29.3 percent), prepared or preserved ish (14.0 percent)and cured ish (9.8 percent). Freezing represents the main method o processing ish orhuman consumption, and it accounted or 55.2 percent o total processed ish or humanconsumption and 25.3 percent o total ish production in 2010.
The proportion o rozen ish grew rom 33.2 percent o total production orhuman consumption in 1970 to reach a record high o 52.1 percent in 2010. The shareo prepared and preserved orms remained rather stable during the same period, andit was 26.9 percent in 2010. Developing countries have eperienced a growth in theshare o rozen products (24.1 percent o the total ish or human consumption in 2010,up rom 18.9 percent in 2000) and o prepared or preserved orms (11.0 percent in2010, compared with 7.8 percent in 2000). Owing to deiciencies in inrastructure andprocessing acilities, together with well-established consumer habits, ish in developingcountries is commercialized mainly in live or resh orm (representing 56.0 percento ish destined or human consumption in 2010) soon ater landing or harvesting.
Cured orms (dried, smoed or ermented) still remain a traditional method to retailand consume ish in developing countries, although their share in total ish or humanconsumption is declining (10.9 percent in 2000 compared with 8.9 percent in 2010).In developed countries, the bul o production destined or human consumption iscommercialized rozen or in prepared or preserved orms.
Fishmeal is produced rom whole ish or ish remains resulting rom processing.Small pelagic species, in particular anchoveta, are the main contributors or reduction,and the volume o ishmeal and ish oil produced worldwide luctuates annuallyaccording to the luctuations in the catches o these species, which are stronglyinluenced by the El Niño phenomenon. Fishmeal production peaed in 1994 at30.2 million tonnes (live weight euivalent) and has ollowed a luctuating trend sincethen. In 2010, it dropped to 15.0 million tonnes owing to reduced catches o anchoveta,
representing a decrease o 12.9 percent compared with 2009, o 18.2 percent comparedwith 2008, and o 42.8 percent with respect to 2000. Waste rom commercial ishspecies used or human consumption is increasingly used in eed marets, and agrowing percentage o ishmeal is being obtained rom trimmings and other residuesrom the preparation o ish illets. About 36 percent o world ishmeal production wasobtained rom oal in 2010.
Technological development in ood processing and pacaging is progressing rapidly.Processors o traditional products have been losing maret share as a result o long-term shits in consumer preerences as well as in processing and in the general isheriesindustry. Processing is becoming more intensive, geographically concentrated, verticallyintegrated and lined with global supply chains. These changes relect the increasingglobalization o the isheries value chain, with large retailers controlling the growth ointernational distribution channels. The increasing practice o outsourcing processing at
the regional and world levels is very signiicant, but urther outsourcing o productionto developing countries might be restricted by sanitary and hygiene reuirements thatare diicult to meet as well as by growing labour costs. At the same time, processorsare reuently becoming more integrated with producers, especially or groundish,where large processors in Asia, in part, rely on their own leet o ishing vessels. Inauaculture, large producers o armed salmon, catish and shrimp have establishedadvanced centralized processing plants. Processors that operate without the purchasingor sourcing power o strong brands are also eperiencing increasing problems lined tothe scarcity o domestic raw material, and they are being orced to import ish or theirbusiness.
Fish and ishery products continue to be among the most traded ood commoditiesworldwide, accounting or about 10 percent o total agricultural eports and 1 percent
o world merchandise trade in value terms. The share o total ishery productioneported in the orm o various ood and eed items increased rom 25 percent in 1976

7/28/2019 The State of World Fisheries and Aquaculture_2012
http://slidepdf.com/reader/full/the-state-of-world-fisheries-and-aquaculture2012 33/230
World review o fsheries and aquaculture 15
to about 38 percent (57 million tonnes) in 2010. In the same period, world trade in ishand ishery products grew signiicantly also in value terms, rising rom US$8 billionto US$102 billion. Sustained demand, trade liberalization policies, globalization oood systems and technological innovations have urthered the overall increase ininternational ish trade. In 2009, relecting the general economic contraction aectingconsumer conidence in major marets, trade dropped by 6 percent comparedwith 2008 in value terms as a conseuence o alling prices and margins, whereastraded volumes, epressed in live weight euivalent, increased by 1 percent to55.7 million tonnes. In 2010, trade rebounded strongly, reaching about US$109 billion,with an increase o 13 percent in value terms and 2 percent in volume compared with2009. The dierence between the growth in value and volume relects the higherish prices eperienced in 2010 as well as a decrease in the production o and trade inishmeal. In 2011, despite the economic instability eperienced in many o the world’sleading economies, increasing prices and strong demand in developing countriespushed trade volumes and values to the highest level ever reported and, despite somesotening in the second hal o the year, preliminary estimates indicate that eportseceeded US$125 billion.
Since late 2011 and early 2012, the world economy has entered a diicult phasecharacterized by signiicant downside riss and ragility, and ey marets or isheriestrade have slowed sharply. Among the actors that might inluence the sustainabilityand growth o ishery trade are the evolution o production and transportation costsand the prices o ishery products and alternative commodities, including meat andeeds. In the last ew decades, the growth in auaculture production has contributedsigniicantly to increased consumption and commercialization o species that were onceprimarily wild-caught, with a conseuent price decrease, particularly in the 1990s andearly 2000, with average unit values o auaculture production and trade declining inreal terms. Subseuently, owing to increased costs and continuous high demand, priceshave started to rise again. In the net decade, with auaculture accounting or a muchlarger share o total ish supply, the price swings o auaculture products could have
a signiicant impact on price ormation in the sector overall, possibly leading to morevolatility.As or trade, ish prices also contracted in 2009 but have since rebounded. The FAO
Fish Price Inde (base year 2002–04 = 100) indicates that average prices in 2009 declinedby 7 percent compared with 2008, then increased by 9 percent in 2010 and by morethan 12 percent in 2011. Prices or species rom capture isheries increased by morethan those or armed species because o the larger impact rom higher energy priceson ishing vessel operations than on armed species.
Since 2002, China has been by ar the leading ish eporter, contributing almost12 percent o 2010 world eports o ish and ishery products, or about US$13.3 billion,and increasing urther to US$17.1 billion in 2011. A growing share o ishery eportsconsists o reprocessed imported raw material. Thailand has established itsel as aprocessing centre o ecellence largely dependent on imported raw material, while
Viet Nam has a growing domestic resource base and imports only limited, albeitgrowing, volumes o raw material. Viet Nam has eperienced signiicant growth in itseports o ish and ish products, up rom US$1.5 billion in 2000 to US$5.1 billion in2010, when it became the ourth-largest eporter in the world. In 2011, its eports roseurther to US$6.2 billion, lined mainly to its lourishing auaculture industry. In 2010,developing countries conirmed their undamental importance as suppliers to worldmarets with more than 50 percent o all ishery eports in value terms and more than60 percent in uantity (live weight). For many developing nations, ish trade representsa signiicant source o oreign currency earnings in addition to the sector’s importantrole as a generator o income, source o employment, and provider o ood securityand nutrition. The ishery industries o developing countries rely heavily on developedcountries, not only as outlets or their eports, but also as suppliers o their imports or
local consumption or or their processing industries. In 2010, in value terms, 67 percento the ishery eports o developing countries were directed to developed countries. A

7/28/2019 The State of World Fisheries and Aquaculture_2012
http://slidepdf.com/reader/full/the-state-of-world-fisheries-and-aquaculture2012 34/230
The State o World Fisheries and Aquaculture 201216
growing share o these eports consisted o processed ishery products prepared romimports o raw ish to be used or urther processing and re-eport. In 2010, in valueterms, 39 percent o the imports o ish and ishery products by developing countriesoriginated rom developed countries. For LIFDCs, net eport revenues amounted toUS$4.7 billion in 2010, compared with US$2.0 billion in 1990.
World imports2 o ish and ish products set a new record at US$111.8 billion in2010, up 12 percent on the previous year and up 86 percent with respect to 2000.Preliminary data or 2011 point to urther growth, with a 15 percent increase. TheUnited States o America and Japan are the major importers o ish and isheryproducts and are highly dependent on imports or about 60 percent and 54 percent,respectively, o their ishery consumption. China, the world’s largest ish producer andeporter, has signiicantly increased its ishery imports, partly a result o outsourcing,as Chinese processors import raw material rom all major regions, including Southand North America and Europe, or re-processing and eport. Imports are also beinguelled by robust domestic demand or species not available rom local sources, and,in 2011, China became the third-largest importer in the world. The European Unionis by ar the largest single maret or imported ish and ishery products owing to
its growing domestic consumption. However, it is etremely heterogeneous, withmaredly dierent conditions rom country to country. European Union ishery importsreached US$44.6 billion in 2010, up 10 percent rom 2009, and representing 40 percento total world imports. However, i intraregional trade is ecluded, the EuropeanUnion imported ish and ishery products worth US$23.7 billion rom suppliersoutside the European Union, an increase o 11 percent rom 2009. In addition to themajor importing countries, a number o emerging marets have become o growingimportance to the world’s eporters. Prominent among these there are Brazil, Meico,the Russian Federation, Egypt, Asia and the Near East in general. In 2010, developedcountries were responsible or 76 percent o the total import value o ish and isheryproducts, a decline compared with the 86 percent o 1990 and 83 percent o 2000.In terms o volume (live weight euivalent), the share o developed countries is
signiicantly less, 58 percent, relecting the higher unit value o products imported bydeveloped countries.Owing to the high perishability o ish and ishery products, 90 percent o trade in
ish and ishery products in uantity terms (live weight euivalent) consists o processedproducts. Fish are increasingly traded as rozen ood (39 percent o the total uantityin 2010, compared with 25 percent in 1980). In the last our decades, prepared andpreserved ish have nearly doubled their share in total uantity, going rom 9 percentin 1980 to 16 percent in 2010. However, trade in live, resh and chilled ish represented10 percent o world ish trade in 2010, up rom 7 percent in 1980, relecting improvedlogistics and increased demand or unprocessed ish. Trade in live ish also includesornamental ish, which is high in value terms but almost negligible in terms o uantitytraded. In 2010, 71 percent o the uantity o ish and ishery products eportedconsisted o products destined or human consumption. The US$109 billion eports o
ish and ishery products in 2010 do not include an additional US$1.3 billion or auaticplants (62 percent), inedible ish waste (31 percent) and sponges and corals (7 percent).In the last two decades, trade in auatic plants has increased signiicantly, rising romUS$0.2 billion in 1990 to US$0.5 billion in 2000 and to US$0.8 billion in 2010, with Chinaas the major eporter and Japan as the leading importer.
A recent major event related to governance o isheries and auaculture hasbeen the UN Conerence on Sustainable Development, nown as Rio+20, to renewpolitical commitment or sustainable development, assess progress and gaps in theimplementation o eisting commitments, and address new challenges. The two themeso the conerence were the institutional ramewor or sustainable development andthe support o a green economy. As a concept, the green economy aims to ensure thatresource eploitation contributes to sustainability, inclusive social development and
economic growth, while seeing to counter the notion that sustainability and growthare mutually eclusive.

7/28/2019 The State of World Fisheries and Aquaculture_2012
http://slidepdf.com/reader/full/the-state-of-world-fisheries-and-aquaculture2012 35/230
World review o fsheries and aquaculture 17
At Rio+20, FAO promoted the message that there will be no green economywithout sustainable growth in agriculture (including isheries) and that improvedmanagement and eiciencies throughout the ood value chain can increase oodsecurity while using ewer natural resources. The message calls or policies that createincentives to adopt sustainable practices and behaviour and promotes the wideapplication o ecosystem approaches. FAO also contributed to interagency submissionsto Rio+20 concerning the sustainable management o the world’s oceans with a ocuson the green economy as it relates to marine and coastal resources, sustainable use andpoverty eradication, small-scale isheries and auaculture operations, and the potentialcontribution o small island developing States.
The dependence o the isheries and auaculture sectors on ecosystem servicesmeans that supporting sustainable ishing and ish arming can provide incentivesor wider ecosystem stewardship. The greening o isheries and auaculture reuiresrecognition o their wider societal roles within a comprehensive governanceramewor. There are several mechanisms to acilitate this transition, includingadopting an ecosystem approach to isheries and auaculture with air and responsibletenure systems to turn resource users into resource stewards.
Small-scale isheries employ more than 90 percent o the world’s capture ishers,and their importance to ood security, poverty alleviation and poverty prevention isbecoming increasingly appreciated. However, the lac o institutional capacity and theailure to include the sector in national and regional development policies hampertheir potential contribution. Since 2003, the FAO Committee on Fisheries (COFI)has promoted eorts to improve the proile o, and understand the challenges andopportunities acing, small-scale ishing communities in inland and marine waters.It has also recommended the development o international voluntary guidelines tocomplement the Code o Conduct or Responsible Fisheries (the Code) as well as otherinternational instruments with similar purposes. The preparation o the guidelinesis epected to contribute to policy development and have considerable impacton securing small-scale isheries and creating beneits, especially in terms o ood
security and poverty reduction. The guidelines promote good governance, includingtransparency and accountability, participation and inclusiveness, social responsibilityand solidarity, a human rights approach to development, gender euality, and respectand involvement o all staeholders.
Regional ishery bodies (RFBs) are the primary organizational mechanism throughwhich States wor together to ensure the long-term sustainability o shared isheryresources. The term RFB also embraces regional isheries management organizations(RFMOs), which have the competence to establish binding conservation andmanagement measures. As intergovernmental organizations, RFBs depend on thepolitical will o their member Governments to implement agreed measures andundertae reorm. Most RFBs are eperiencing diiculties in ulilling their mandates(many o which are outdated). However, important progress in etending the globalcoverage o RFBs is being made through new, strengthened and emerging bodies.
In addition, numerous RFBs have been undergoing independent reviews o theirperormance. The 2010 United Nations Review Conerence described the modernizingo RFMOs as a priority and noted that progress had been made in developing bestpractices or RFMOs and in reviewing their perormance against emerging standards.Ten RFBs have so ar undergone perormance reviews. The Review Conerence observedthat perormance reviews were generally recognized as being useul, particularly whenthey led to the adoption o new management measures.
Illegal, unreported and unregulated (IUU) ishing and related activities (otenencouraged by corrupt practices) threaten eorts to secure long-term sustainableisheries and promote healthier and more robust ecosystems. The internationalcommunity continues to epress its grave concern at the etent and eects o IUUishing. Developing countries, oten with limited technical capacity, bear the brunt o
this IUU ishing, which undermines their limited eorts to manage isheries, deniesthem revenue and adversely aects their attempts to promote ood security, eradicate

7/28/2019 The State of World Fisheries and Aquaculture_2012
http://slidepdf.com/reader/full/the-state-of-world-fisheries-and-aquaculture2012 36/230
The State o World Fisheries and Aquaculture 201218
poverty and achieve sustainable livelihoods. However, there are indications that IUUishing is moderating in some areas (e.g. the Northeast Atlantic Ocean) as policies andmeasures tae eect.
Nonetheless, the international community is deeply rustrated by the ailure omany lag States to meet their primary responsibilities under international law, whichare to eercise eective control over their ishing vessels and ensure compliance withconservation and management measures. O particular concern are those vessels lyinglags o “non-compliance”, which are lags belonging to States that are either unableor unwilling to eercise eective control over their vessels. As a result, the burden ocontrolling these rogue vessels is gradually alling on coastal States, port States, RFBsand others. This has led FAO Members to reuest that a Technical Consultation onFlag State Perormance be convened. It is anticipated that the outcome will be a set ovoluntary criteria or assessing the perormance o lag States together with a list opossible actions to be taen against vessels lying the lags o States not meeting suchcriteria and possibly an agreed procedure or assessing compliance.
Although their achievements in terms o limiting IUU ishing vary widely, most RFBspromote and implement measures to combat IUU ishing. The measures range rom
more passive activities such as awareness building and dissemination o inormation(mainly RFBs without isheries management unctions) to aggressive port, air andsurace surveillance programmes (RFMOs).
Beyond national boundaries, there is increasing need or international cooperationto improve global isheries management o shared marine resources and to preservethe associated employment and other economic beneits o sustainable isheries.Recognizing this, the European Union and the United States o America, as leadersin the global ish trade, undertoo (in 2011) to cooperate bilaterally to combat IUUishing by eeping illegally caught ish out o the world maret. Strengthening isheriesmanagement capacity is undamental in developing countries in order to acilitatesustainable isheries and to reduce the impacts o IUU ishing. Capacity development isespecially important to support the ull and eective implementation o eisting and
new global instruments such as the 2009 Port State Measures Agreement to combatIUU ishing.Governance o auaculture has become increasingly important and has made
remarable progress. To improve planning and policy development in auaculture,many Governments utilize the Code as well as FAO guidelines and manuals on armingtechniues promoted by industry organizations and development agencies. Severalcountries have adeuate national auaculture development policies, strategies, plansand laws, and use “best management practices”. The insert: 2011 FAO TechnicalGuidelines on Auaculture Certiication constitute an additional important tool orgood governance o the sector. By setting minimum substantive criteria or developingauaculture certiication standards, these guidelines provide direction or thedevelopment, organization and implementation o credible auaculture certiicationschemes towards orderly and sustainable development o the sector. Long-term
prosperity reuires technological soundness, economic viability, environmental integrityand social licence, which, in combination, also ensure that ecological well-being iscompatible with human well-being.
An important component o human well-being is employment, which inauaculture has grown rapidly in the last three decades. More than 100 millionpeople now depend on the sector or a living, either as employees in the producingand support sectors or as their dependants. In many places, these employmentopportunities have enabled young people to stay in their communities and havestrengthened the economic viability o isolated areas, oten enhancing the status owomen in developing countries, where more than 80 percent o auaculture outputoccurs. Auaculture has been heavily promoted in several countries with iscal andmonetary incentives and this has improved accessibility to ood or many households
and increased auaculture’s contribution towards the Millennium DevelopmentGoals (MDGs). However, the sector has developed at a time o growing scrutiny rom

7/28/2019 The State of World Fisheries and Aquaculture_2012
http://slidepdf.com/reader/full/the-state-of-world-fisheries-and-aquaculture2012 37/230

7/28/2019 The State of World Fisheries and Aquaculture_2012
http://slidepdf.com/reader/full/the-state-of-world-fisheries-and-aquaculture2012 38/230
The State o World Fisheries and Aquaculture 201220
which detailed catch statistics are available, absolute variations in comparison with theprevious year o total marine catches ecluding anchoveta never eceeded 1.2 percent,ranging between 72.1 and 73.3 million tonnes. However, anchoveta catches decreasedrom 10.7 million tonnes in 2004 to 4.2 million tonnes in 2010, and the variation onthe previous year eceeded 30 percent in two cases. In the same period, inland watercapture production grew continuously, with an overall increase o 2.6 million tonnes(see below).
A mared decrease in anchoveta catches by Peru in 2010 was mostly due tomanagement measures (e.g. ishing closures) that were applied in the inal uarter toprotect the high number o juveniles present in the anchoveta stoc as a conseuenceo the La Niña event (cold water), which had avoured spawning and generated a goodrecruitment. Thans to this precautionary management decision, the 2011 anchovetacatches eceeded their 2009 level. Other preliminary reports rom important ishingcountries (e.g. the Russian Federation) show that 2011 should have been a year oincreased catches. However, Japanese ishery production will probably have droppedsigniicantly as the ive preectures hit by the earthuae and tsunami o 11 March2011 accounted or about 21 percent o Japan’s total marine isheries and auaculture
production. Overall, preliminary inormation suggests that the total 2011 global catchshould eceed 90 million tonnes, maring a return to 2006–07 levels (Table 1).
Notwithstanding the protracted global economic downturn, which has reducedthe unds available to national administrations, the submission rates o 2009 and 2010catch data to FAO have remained reasonably stable. However, it is well nown that theuality o ishery data is very uneven among countries. An evaluation3 o data ualityin capture statistics submitted to FAO ound that more than hal o the countriesreported inadeuately. This percentage was greater or developing countries, but alsoabout one-ourth o reports by developed countries were not satisactory. Countriesthat should improve their data collection and reporting systems are mainly ound inArica, Asia and among the island States in Oceania and the Caribbean (Table 2).
w mai capu fihi puciWith the great decrease in anchoveta catches, Peru is no longer second ater China inthe raning o the major marine producer countries in terms o uantity as it has beensurpassed by Indonesia and the United States o America. Some major Asian ishingcountries (i.e. China, India, Indonesia, Myanmar and Viet Nam) reported signiicantincreases in 2010, but also other countries (i.e. Norway, the Russian Federation and
Table 2Countries or territories with no adeuate 2009 catch data submission
Cui Cui ih aqua
ubmii
Pcag
(Number) (Number) (%)
Developed 54 13 24.1
Developing 164 100 61.0
Arica 54 33 61.1
North America 37 18 48.6
South America 14 5 35.7
Asia 51 31 60.8
Europe 39 8 20.5
Oceania 23 18 78.3
ta 218 113 51.8
Source: Garibaldi, L. 2012. The FAO global capture production database: a si-decade eort to catch the trend. Marine
Policy , 36(3): 760–768.

7/28/2019 The State of World Fisheries and Aquaculture_2012
http://slidepdf.com/reader/full/the-state-of-world-fisheries-and-aquaculture2012 39/230
World review o fsheries and aquaculture 21
Spain) ishing in other areas and with more robust data collection systems showedgrowing catches ater some years o sluggish production.
In particular, catches reported by the Russian Federation have grown by morethan one million tonnes since the low point o 2004. According to the authorities othe Russian Federation, the recent increase is also a conseuence o the managementdecision to remove ecessive ormalities on documentation o landing operations, asup until early 2010 landings by vessels o the Russian Federation in national ports weretreated as imports. Moreover, an oicial orecast o the Russian Federation indicatesurther catch increases to a level o 6 million tonnes in 2020, representing an increaseo more than 40 percent above present levels.
Besides decreased production by Peru and Chile as a conseuence o the dropin anchoveta catches, other major ishing countries with downward trends in totalmarine catches in 2009 and 2010 were: Japan, the Republic o korea, and Thailandin Asia; Argentina, Canada and Meico in the Americas; Iceland in Europe; and to alesser etent New Zealand. Despite variable trends, Morocco, South Arica and Senegalmaintained their positions as the three major marine producers in Arica.
The Northwest Paciic is still by ar the most productive ishing area. Catch peas
in the Northwest Atlantic, Northeast Atlantic and Northeast Paciic temperate ishingareas were reached many years ago (in 1968, 1976 and 1987, respectively) and totalproduction had declined continuously rom the early and mid-2000s, but in 2010 thistrend was reversed in all three areas.
As or mainly tropical areas, total catches grew in the Western and Eastern IndianOcean and in the Western Central Paciic, and, in the last two, 2010 mared a newmaimum. In contrast, the 2010 production in the Western Central Atlantic decreased,driven by the reduction in United States catches by about 100 000 tonnes, probablymostly attributable to the oil spill in the Gul o Meico. Since 1978, the Eastern CentralPaciic has shown a series o luctuations in capture production with a cycle o about5–9 years. The latest pea was in 2009, and a declining phase may have started in 2010.
Both the Mediterranean–Blac Sea and the Southwest Atlantic seem to be areas
where isheries are in trouble as, since 2007, total catches have decreased by 15 and30 percent, respectively. In the two areas along the southwest sides o America andArica, upwelling phenomena occur, although their intensity varies strongly each year.In 2010, catches in the Southeast Paciic (ecluding anchoveta) decreased whereas inthe Southeast Atlantic they grew, but eamination o historical trends rom an earlierperiod reveals clear downward trajectories in both areas.
Finally, in the Eastern Central Atlantic, production has increased in the last threeyears. However, in this area, total capture production is signiicantly inluenced bythe activities o distant-water leets and whether their catches are reported only bythe lag States or also complemented with inormation by some costal countries thatregister oreign leet catches in their EEZ but only mae these data available to FAOintermittently.
As noted above, annual catches by ishing area, country and in particular by species
very oten luctuate considerably, but all these variations combined seem to have acounterbalancing eect on the global total. A demonstration o this is that catches omore than 60 percent o the species varied by more than 10 percent in comparison with2009 but the global total (ecluding anchoveta) changed by only 1.2 percent.
It is well documented4 that ish populations show large luctuations in abundance,also in the absence o ishing. Although the causes are well nown or some species(e.g. anchoveta – driven by changing environmental regimes), they remain unnownor many others. Besides ishes, such variations also occur in other commercial groupso species. For eample, Argentina started industrial-level eploitation o Pleoticus
muelleri , a high-value shrimp, in the 1980s. However, this species showed a majordrop in 2005. Facing much reduced catches, the national authorities implementedmanagement plans to help the species to recover. Ater si years, catches had
rebounded tenold reaching a new maimum recorded level in 2011 (Figure 5).

7/28/2019 The State of World Fisheries and Aquaculture_2012
http://slidepdf.com/reader/full/the-state-of-world-fisheries-and-aquaculture2012 40/230
The State o World Fisheries and Aquaculture 201222
Despite the decreased 2010 catches, anchoveta is again the most-caught species.However, also in the presence o uture avourable environmental regimes, yearlycatches o this species should not attain the past peas as the Government o Peruhas introduced an annual uota or the whole country, subdivided by vessel, with thepurpose o stabilizing the capacity o both the leet and processing plants.
In the list o top ten species, the most evident change is the disappearance romthe list o the Chilean jac macerel (Trachurus murphyi ), which had been sith in 2008.This species is a transboundary resource with a very wide distribution in the South
Paciic, ranging rom the national EEZs to the high seas. Ater having peaed at about5 million tonnes in the mid-1990s, catches were about 2 million tonnes in the mid-2000s but have since declined abruptly, and the 2010 catches were 0.7 million tonnes,the lowest level since 1976. Atlantic cod (Gadus morhua) has returned to the list, witha total increase o almost 200 000 tonnes in the last two years to ran tenth in 2010, aposition not reached since 1998. In act, in 2010, the whole group o gadiorm species(cods, haes, haddocs, etc.) reversed the negative trend o the previous three years in
Figure 5
Catch trend for Argentine red shrimp
Thousand tonnes
0
20
10
50
90
80
40
30
70
60
80 82 84 86 88 90 92 94 96 98 00 02 04 06 08 10 11
Figure 6
Catch trends for marine bivalve species groups
Million tonnes
Clams, cockles, arkshells
Scallops, pectens
Mussels
Oysters
0
0.2
0.6
1.0
0.4
0.8
1.2
90 92 94 96 98 00 02 04 06 08 10

7/28/2019 The State of World Fisheries and Aquaculture_2012
http://slidepdf.com/reader/full/the-state-of-world-fisheries-and-aquaculture2012 41/230

7/28/2019 The State of World Fisheries and Aquaculture_2012
http://slidepdf.com/reader/full/the-state-of-world-fisheries-and-aquaculture2012 42/230
The State o World Fisheries and Aquaculture 201224
conseuences o a tendency to report continuously increasing catches or o changes inthe national data collection system.
For eample, until 2009, the calculation o inland catches by Bangladesh waslined to the population increase and, as a conseuence, total production grew by67 percent between 2004 and 2009. Production reported by Myanmar has uadrupledin the last decade, increasing at an average growth rate o almost 18 percent per year,gaining 11 positions in the global raning o major producer countries, and eceedingone million tonnes in 2010. The gathering o India’s catch statistics is comple as theMinistry o Agriculture has to receive and assemble data rom 28 states, which otenhave dierent systems o collecting and reporting data. It is very diicult to discernwhether the dramatic growth (179 percent) in inland catches between 2004 and2010 is ascribable to a real increase, to overestimation or to improvement in the datacollection system o some o these states.
Inland water capture production in the other continents shows dierent trends.Uganda and the United Republic o Tanzania, ishing mostly in the Arican GreatLaes, and Nigeria and Egypt, with river isheries, remain the main producers in Arica.Catches in several South American countries (e.g. Argentina, Colombia, Paraguay
and Venezuela [Bolivarian Republic o]) as well as in North American ones have beenreported as shrining. Increased European production between 2004 and 2010 is allattributable to a rise o almost 50 percent in catches o the Russian Federation. Inlandishery production is marginal in countries in Oceania.
More than hal o the global inland water capture production is still reported as“catches unidentiied by species”. However, in recent years, several countries havemade eorts to improve the uality o their inland catch statistics and collect data ata iner species breadown. In the last ten years, the increase in inland water specieswith statistics in the FAO database has been ive times that or marine species (Table 4).Moreover, the percentage o inland water species in total species has improved,reaching 12.3 percent in 2010 – a value very close to the share (12.7 percent) o inlandwater catches in global catches in that year.
AQUACUltUre
Global auaculture production has continued to grow in the new millennium,albeit more slowly than in the 1980s and 1990s. In the course o hal a century or so,auaculture has epanded rom being almost negligible to ully comparable withcapture production in terms o eeding people in the world (see below). Auaculturehas also evolved in terms o technological innovation and adaptation to meet changingreuirements.
World auaculture production attained another all-time high in 2010, at60 million tonnes (ecluding auatic plants and non-ood products), with an estimated
Table 4
Number o species items with statistics in the FAO capture database
2001 2010 vaiai 2001–2010
(Number) (Number) (Percentage)
Inland water ish, crustaceansand molluscs
113 190 68.1
Marine and diadromous ish, crustaceansand molluscs
1 194 1 356 13.6
ta pci im 1 307 1 546 18.3
Share o inland water species on total
species
8.6% 12.3%

7/28/2019 The State of World Fisheries and Aquaculture_2012
http://slidepdf.com/reader/full/the-state-of-world-fisheries-and-aquaculture2012 43/230

7/28/2019 The State of World Fisheries and Aquaculture_2012
http://slidepdf.com/reader/full/the-state-of-world-fisheries-and-aquaculture2012 44/230
The State o World Fisheries and Aquaculture 201226
Since the mid-1990s, auaculture has been the engine driving growth in total ishproduction as global capture production has levelled o. Its contribution to worldtotal ish production climbed steadily rom 20.9 percent in 1995 to 32.4 percent in 2005and 40.3 percent in 2010. Its contribution to world ood ish production or humanconsumption was 47 percent in 2010 compared with only 9 percent in 1980.
The growth rate in armed ood ish production rom 1980 to 2010 ar outpacedthat or the world population (1.5 percent), resulting in average annual per capitaconsumption o armed ish rising by almost seven times, rom 1.1 g in 1980 to 8.7 gin 2010, at an average rate o 7.1 percent per year.
The total armgate value o ood ish production rom auaculture is estimated atUS$119.4 billion or 2010. This might be overstated considering that some countriesreported values other than irst-sale prices (e.g. using retail, eport or processedproduct prices).
World auaculture production is vulnerable to adverse impacts o natural, socio-economic, environmental and technological conditions. For eample, marine cageculture o Atlantic salmon in Chile, oyster arming in Europe (notably France), andmarine shrimp arming in several countries in Asia, South America and Arica have
eperienced high mortality caused by disease outbreas in recent years, resulting inpartial or sometimes total loss o production. Countries prone to natural disasterssuer seriously rom production damage or losses caused by loods, droughts,tropical storms and, less reuently, earthuaes. Water pollution has increasinglythreatened production in some newly industrialized and rapidly urbanizing areas.In 2010, auaculture in China suered production losses o 1.7 million tonnes(worth US$3.3 billion) caused by diseases (295 000 tonnes), natural disasters(1.2 million tonnes), pollution (123 000 tonnes), etc. Disease outbreas virtually wipedout marine shrimp arming production in Mozambiue in 2011.
Production among regions
Asia accounted or 89 percent o world auaculture production by volume in 2010,
up rom 87.7 percent in 2000 (Table 5). The contribution o reshwater auaculturehas gradually increased, up to 65.6 percent in 2010 rom around 60 percent during1990s. In terms o volume, Asian auaculture is dominated by inishes (64.6 percent),ollowed by molluscs (24.2 percent), crustaceans (9.7 percent) and miscellaneousspecies (1.5 percent). The share o non-ed species armed in Asia was 35 percent(18.6 million tonnes) in 2010 (compared with 50 percent in 1980). The contribution oChina to world auaculture production volume in 2010 declined to 61.4 percent romits highest level o about 66 percent in the period 1996–2000. Other major producers inAsia (India, Viet Nam, Indonesia, Bangladesh, Thailand, Myanmar, the Philippines andJapan) are among the world’s top producers.
In the Americas, the share o reshwater auaculture in total production declinedrom 54.8 percent in 1990 to 37.9 percent in 2010. In North America, auaculturehas ceased epanding in recent years, but in South America it has shown strong and
continuous growth, particularly in Brazil and Peru. In terms o volume, auaculturein North and South America is dominated by inishes (57.9 percent), crustaceans(21.7 percent) and molluscs (20.4 percent). Bivalve production luctuated between14 and 21 percent o total auaculture production in the 1990s and 2000s, aterdropping rapidly in the 1980s rom 48.5 percent.
In Europe, the share o production rom bracish and marine waters increased rom55.6 percent in 1990 to 81.5 percent in 2010, driven by marine cage culture o Atlanticsalmon and other species. Several important producers in Europe have recently ceasedepanding or have even contracted, particularly in the marine bivalve sector. In 2010,inishes accounted or three-uarters o all European auaculture production, andmolluscs one-uarter. The share o bivalves in total production decreased continuouslyrom 61 percent in 1980 to 26.2 percent in 2010.
Arica has increased its contribution to global production rom 1.2 percent to2.2 percent in the past ten years, albeit rom a very low base. The share o reshwater

7/28/2019 The State of World Fisheries and Aquaculture_2012
http://slidepdf.com/reader/full/the-state-of-world-fisheries-and-aquaculture2012 45/230
World review o fsheries and aquaculture 27
auaculture in the region ell rom 55.2 percent to 21.8 percent in the 1990s, largelyrelecting the strong growth in bracish-water culture in Egypt, but it recovered in the2000s, reaching 39.5 percent in 2010 as a result o rapid development in reshwaterish arming in sub-Saharan Arica, most notably in Nigeria, Uganda, Zambia, Ghanaand kenya. Arican auaculture production is overwhelmingly dominated by inishes(99.3 percent by volume), with only a small raction rom marine shrimps (0.5 percent)and marine molluscs (0.2 percent). In spite o some limited successes, the potential orbivalve production in marine waters remains almost completely uneplored.
Oceania is o relatively marginal importance in global auaculture production.Production rom this region consists mainly o marine molluscs (63.5 percent) andinishes (31.9 percent), while crustaceans (3.7 percent, mostly marine shrimps) andother species (0.9 percent) constitute less than 5 percent o its total production. Marinebivalves accounted or about 95 percent o the total produced in the irst hal o 1980sbut, relecting the development o the inish culture sector (especially Atlantic salmonin Australia and chinoo salmon in New Zealand), they currently account or less than65 percent o the region’s total production. Freshwater auaculture accounts or lessthan 5 percent o the region’s production.
Table 5Auaculture production by region: uantity and percentage o world total production
sc gup
a cui1970 1980 1990 2000 2009 2010
Afica() 10 271 26 202 81 015 399 676 991 183 1 288 320
(percentage) 0.40 0.60 0.60 1.20 1.80 2.20
Sub-Saharan Arica(tonnes) 4 243 7 048 17 184 55 690 276 906 359 790
(percentage) 0.20 0.10 0.10 0.20 0.50 0.60
North Arica(tonnes) 6 028 19 154 63 831 343 986 714 277 928 530
(percentage) 0.20 0.40 0.50 1.10 1.30 1.60
Amica() 173 491 198 850 548 479 1 423 433 2 512 829 2 576 428(percentage) 6.80 4.20 4.20 4.40 4.50 4.30
Caribbean(tonnes) 350 2 329 12 169 39 704 42 514 36 871
(percentage) 0.00 0.00 0.10 0.10 0.10 0.10
Latin America(tonnes) 869 24 590 179 367 799 234 1 835 888 1 883 134
(percentage) 0.00 0.50 1.40 2.50 3.30 3.10
North America(tonnes) 172 272 171 931 356 943 584 495 634 427 656 423
(percentage) 6.70 3.70 2.70 1.80 1.10 1.10
Aia() 1 799 101 3 552 382 10 801 356 28 422 189 49 538 019 53 301 157
(percentage) 70.10 75.50 82.60 87.70 88.90 89.00
Asia (ecluding Chinaand Near East)
(tonnes) 1 034 703 2 222 670 4 278 355 6 843 429 14 522 862 16 288 881
(percentage) 40.30 47.20 32.70 21.10 26.10 27.20
China(tonnes) 764 380 1 316 278 6 482 402 21 522 095 34 779 870 36 734 215
(percentage) 29.80 28.00 49.60 66.40 62.40 61.40
Near East(tonnes) 18 13 434 40 599 56 665 235 286 278 061
(percentage) 0.00 0.30 0.30 0.20 0.40 0.50
eup() 575 598 916 183 1 601 524 2 050 958 2 499 042 2 523 179
(percentage) 22.40 19.50 12.20 6.30 4.50 4.20
European Union (27)(tonnes) 471 282 720 215 1 033 982 1 395 669 1 275 833 1 261 592
(percentage) 18.40 15.30 7.90 4.30 2.30 2.10
Non-European-Unioncountries
(tonnes) 26 616 38 594 567 667 657 167 1 226 625 1 265 703
(percentage) 1.00 0.80 4.30 2.00 2.20 2.10
ocaia() 8 421 12 224 42 005 121 482 173 283 183 516
(percentage) 0.30 0.30 0.30 0.40 0.30 0.30
w () 2 566 882 4 705 841 13 074 379 32 417 738 55 714 357 59 872 600
Notes: Data eclude auatic plants and non-ood products. Data or 2010 or some countries are provisional and subjectto revisions. Production values or 1980 or Europe include the ormer Soviet Union.

7/28/2019 The State of World Fisheries and Aquaculture_2012
http://slidepdf.com/reader/full/the-state-of-world-fisheries-and-aquaculture2012 46/230
The State o World Fisheries and Aquaculture 201228
The global distribution o auaculture production across the regions and countrieso dierent economic development levels remains imbalanced. In 2010, the top tenproducing countries accounted or 87.6 percent by uantity and 81.9 percent by valueo the world’s armed ood ish. At the regional level, production is also concentratedin a ew major producers (Table 6).
The LDCs, mostly in sub-Saharan Arica and in Asia, and home to 20 percent o theworld’s population (1.4 billion people), remain very small in terms o their share oworld auaculture production (4.1 percent by uantity and 3.6 percent by value). Themajor producers in the LDCs in 2010 include Bangladesh, Myanmar, Uganda, the Lao
Table 6Top ten regional and world auaculture producers in 2010
Afica t Pcag Amica t Pcag Aia t Pcag
Egypt 919 585 71.38 Chile 701 062 27.21 China 36 734 215 68.92
Nigeria 200 535 15.57 UnitedStates oAmerica
495 499 19.23 India 4 648 851 8.72
Uganda 95 000 7.37 Brazil 479 399 18.61 Viet Nam 2 671 800 5.01
kenya 12 154 0.94 Ecuador 271 919 10.55 Indonesia 2 304 828 4.32
Zambia 10 290 0.80 Canada 160 924 6.25 Bangladesh 1 308 515 2.45
Ghana 10 200 0.79 Meico 126 240 4.90 Thailand 1 286 122 2.41
Madagascar 6 886 0.53 Peru 89 021 3.46 Myanmar 850 697 1.60
Tunisia 5 424 0.42 Colombia 80 367 3.12 Philippines 744 695 1.40
Malawi 3 163 0.25 Cuba 31 422 1.22 Japan 718 284 1.35
SouthArica
3 133 0.24 Honduras 27 509 1.07 Republico korea
475 561 0.89
Other 21 950 1.70 Other 113 067 4.39 Other 1 557 588 2.92
ta 1 288 320 100 ta 2 576 428 100 ta 53 301 157 100
eup t Pcag ocaia t Pcag w t Pcag
Norway 1 008 010 39.95 NewZealand
110 592 60.26 China 36 734 215 61.35
Spain 252 351 10.00 Australia 69 581 37.92 India 4 648 851 7.76
France 224 400 8.89 Papua NewGuinea
1 588 0.87 Viet Nam 2 671 800 4.46
Unitedkingdom
201 091 7.97 NewCaledonia
1 220 0.66 Indonesia 2 304 828 3.85
Italy 153 486 6.08 Fiji 208 0.11 Bangladesh 1 308 515 2.19
RussianFederation
120 384 4.77 Guam 129 0.07 Thailand 1 286 122 2.15
Greece 113 486 4.50 Vanuatu 105 0.06 Norway 1 008 010 1.68
Netherlands 66 945 2.65 FrenchPolynesia
39 0.02 Egypt 919 585 1.54
FaroeIslands
47 575 1.89 NorthernMarianaIslands
24 0.01 Myanmar 850 697 1.42
Ireland 46 187 1.83 Palau 12 0.01 Philippines 744 695 1.24
Other 289 264 11.46 Other 19 0.01 Other 7 395 281 12.35
ta 2 523 179 100 ta 183 516 100 ta 59 872 600 100
Note: Data eclude auatic plants and non-ood products. Data or 2010 or some countries are provisional andsubject to revisions.

7/28/2019 The State of World Fisheries and Aquaculture_2012
http://slidepdf.com/reader/full/the-state-of-world-fisheries-and-aquaculture2012 47/230
World review o fsheries and aquaculture 29
People’s Democratic Republic (82 100 tonnes), Cambodia (60 000 tonnes) and Nepal(28 200 tonnes).
While auaculture production has shown strong growth in developing countries,particularly in Asia, annual growth rates in developed industrialized countriesaveraged only 2.1 percent and 1.5 percent in the 1990s and 2000s, respectively.In 2010, they produced collectively 6.9 percent (4.1 million tonnes) by uantity and14 percent (US$16.6 billion) by value o world armed ood ish production, comparedwith 21.9 percent and 32.4 percent in 1990. Auaculture production has contracted orstagnated in Japan, the United States o America, Spain, France, the United kingdomo Great Britain and Northern Ireland, Canada and Italy. An eception is Norway,where, thans to the arming o Atlantic salmon in marine cages, auacultureproduction grew rom 151 000 tonnes in 1990 to more than one million tonnesin 2010, at an average growth rate o 12.6 percent in the 1990s and 7.5 percentin the 2000s.
In the recent past, some developing countries in Asia and the Paciic (Myanmarand Papua New Guinea), sub-Saharan Arica (Nigeria, Uganda, kenya, Zambia andGhana) and South America (Ecuador, Peru and Brazil) have made rapid progress to
become signiicant or major auaculture producers in their regions.Immediately ater their independence more than two decades ago, countries in
the ormer Soviet Union were producing an annual total o almost 350 000 tonneso ood ish rom auaculture. However, production capacity in all these countriesdeteriorated rapidly in the 1990s to about one-third o its original level. In spite ostarting to recover in the 2000s, their combined total production in 2010 amountedto only 59 percent o that in 1988. The lost capacity, especially in hatchery andnursery output, has also had a negative impact on inland culture-based captureisheries. While Armenia, Belarus, Estonia and Republic o Moldova have eceededtheir 1988 production levels, and output in Lithuania and the Russian Federation is atmore than 80 percent o its original 1998 level, other countries remain at one-thirdor less o their 1988 production levels. In 2010, armed ish production in kazahstan
and Turmenistan was less than 5 percent o that beore independence.
Production with and without eed
While eed is generally perceived to be a major constraint to auaculturedevelopment, one-third o all armed ood ish production, 20 million tonnes, iscurrently achieved without artiicial eeding (Figure 7). Oysters, mussels, clams,scallops and other bivalve species are grown with ood materials that occur naturallyin their culture environment in the sea and lagoons. Silver carp and bighead carpeed on plantons prolierated through intentional ertilization and the wastes andletover eed materials o ed species grown in the same multispecies polyculturesystems. Rice–ish arming has long been a common practice, particularly in Asia(Bo 2).
However, the percentage o non-ed species in world production has declined
gradually rom more than 50 percent in 1980 to the present level o 33.3 percent,strongly dominated by changing practices in Asia. This relects the relatively astergrowth in the ed-species culture subsector supported by, among others, thedevelopment and improved availability o ormulated auaculture eeds or inishesand crustaceans.
Some ed species grow on a miture o natural ood prolierated rom ertilizationand supplementary eeds. I the non-ed portion in their total production wereconsidered, the non-ed portion o world production o all armed ood ish wouldbe higher than the aoresaid 33.3 percent. Owing to the unavailability o inormationand data needed or the calculation, the said percentage does not include: (i) thenon-ed portion o production o some ed species (such as milish that growpartially on algal aggregates nown as “lab-lab” prolierated through ertilization in
culture ponds); and (ii) the non-ed ilter eeding carps reported by some producers inaggregation with other species and treated wholly as ed species.

7/28/2019 The State of World Fisheries and Aquaculture_2012
http://slidepdf.com/reader/full/the-state-of-world-fisheries-and-aquaculture2012 48/230
The State o World Fisheries and Aquaculture 201230
Bo 2 Fish culture in rice ields
History and traditionThe capture and culture o auatic organisms rom rice ields has a
long history and tradition especially in Asia, where the availability
o rice and ish has been associated with prosperity and ood
security. Designs o rice ields with ish on ancient Chinese pottery
rom tombs o the Han Dynasty (206 BC–225 AD), inscriptions rom
a thirteenth century ing o Thailand, and traditional sayings,
such as one rom Viet Nam – “rice and ish are lie mother and
children”, are all testament that the combination o rice and ish has
traditionally been regarded as an indicator o wealth and stability.
StatusThe cultivation o almost 90 percent o the world’s rice crops in
irrigated, rained and deep-water systems euivalent to about
134 million hectares oers a suitable environment or ish and
other auatic organisms. Rice-based ecosystems provide habitats
or a wide range o auatic organisms etensively used by local
people. They also oer opportunities or the enhancement and
culture o auatic organisms. The dierent integrations o rice
and ish arming – either on the same plot, on adjacent plots
where by-products o one system are used as inputs on the other,
or consecutively – are all variations o production systems that
aim to increase the productivity o water, land and associated
resources while contributing to increased ish production. Theintegration can be more or less complete depending on the
general layout o the irrigated rice plots and ishponds. There
are many options or enhancing ood production rom ish in
managed auatic systems, which are ingeniously realized by
armers all over the world.1
As regards the general scale o rice–ish culture, China is the
main producer with an area o about 1.3 million hectares o
rice ields with dierent orms o ish culture, which produced
1.2 million tonnes o ish and other auatic animals in 2010.2
Other countries reporting their rice–ish production to FAO include
Indonesia (92 000 tonnes in 2010), Egypt (29 000 tonnes in 2010),
Thailand (21 000 tonnes in 2008), the Philippines (150 tonnes in
2010) and Nepal (45 tonnes in 2010). Trends observed in China showthat ish production rom rice ields has increased thirteenold in
the last two decades, and rice–ish culture is now one o the most
important auaculture systems in China, maing a signiicant
contribution to rural livelihoods and ood security. A broad range o
auatic species including dierent carps, tilapias, catish and breams
are being armed in rice ields. Maret prices and preerences may
provide important opportunities to armers or a more diversiied
use o species, especially targeting eels, loaches and various
crustaceans, and the sale and mareting o higher-valued organic
products.3 Also in India the practice cuts across dierent ecosystems
rom terraced rice ields in the hilly terrain to coastal lands and

7/28/2019 The State of World Fisheries and Aquaculture_2012
http://slidepdf.com/reader/full/the-state-of-world-fisheries-and-aquaculture2012 49/230
World review o fsheries and aquaculture 31
deep-water rice ields, and reportedly covered an area o two million
hectares in the 1990s. Rice–ish arming is being tried and practised in other
countries and continents although to a lesser etent. Apart rom Asia,
activities have been reported rom, among others, Brazil, Egypt, Guyana,
Haiti, Hungary, Iran (Islamic Republic o), Italy, Madagascar, Malawi, Nigeria,
Panama, Peru, Senegal, Suriname, the United States o America, Zambia, and
several countries in the Central Asia and Caucasus region.1
Beneits, issues and challengesRice–ish arming provides additional ood and income by diversiying arm
activities and increasing yields o both the rice and ish crops. Evidence
shows that although rice yields are similar, the integrated rice–ish systemuses 68 percent less pesticide than rice monoculture.4 Fish eed on rice
pests, thus reducing pest pressure. Together with the act that most broad-
spectrum insecticides are a direct threat to auatic organisms and healthy
ish culture, nowledgeable armers are much less motivated to spray
pesticides. Thereore, it has been suggested that ish arming in rice and
the integrated management o pests in rice production are complementary
activities.5 Similarly, complementary use o nitrogen between rice and ish
resulted in 24 percent less chemical ertilizer application and low nitrogen
release into the environment, suggesting positive interactions in the use
o resources.4 Fertilizers and eeds used in the integrated system are more
eiciently utilized and converted into ood production, and nutrient
discharge to the natural environment is minimized. Rice–ish armingreduces the emission o methane by almost 30 percent compared with
traditional rice arming.6
The challenges related to rice–ish arming are not dierent rom those
related to general auaculture development. They include availability o and
access to seed, eed and capital as well as natural riss associated with water
control, disease and predation. Freshwater is rapidly becoming one o the
scarcest natural resources, and competition or reshwater is among the most
critical challenges acing developing countries. Suicient and good-uality
water is a ey resource in rice–ish arming, which increases the productivity
per unit o water used. Rice–ish arming and other orms o auaculture in
rice-based arming are one component o integrated water management
approaches that produce ood o high nutritional uality and, oten, high
economic value. Proits vary depending on production characteristics butincome increases o up to 400 percent compared with rice monoculture have
been reported and these may be even greater where high-value auatic
species are armed.3
The use o auatic genetic resources in rice is part o the wor o the
FAO Fisheries and Auaculture Department with the Commission on Genetic
Resources or Food and Agriculture as part o the preparation or The State o
the World on Aquatic Genetic Resources. In addition, the rice–ish system has
been included as one o the Globally Important Agricultural Heritage Systems
under an FAO initiative supported by the Global Environment Facility.
It is the combination o eicient production and use o resources coupled
with environmental beneits that has prompted recent international

7/28/2019 The State of World Fisheries and Aquaculture_2012
http://slidepdf.com/reader/full/the-state-of-world-fisheries-and-aquaculture2012 50/230
The State o World Fisheries and Aquaculture 201232
gatherings o the International Rice Commission, the Convention o
Biological Diversity, and the Ramsar Convention to recommend that rice-
producing countries promote the urther development o integrated rice
and ish systems as a means o enhancing ood security and sustainable rural
development. In addition, some countries with a long tradition in integrated
rice–ish systems are giving renewed attention to the comple rice ecosystem
with a ocus on its role in biodiversity conservation, as in the Japanese
satoyama landscape initiative.
The way orwardAn increase in integrated arming o rice and ish is possible and would
beneit armers, consumers and the environment worldwide. Severalorganizations, active in global policies or ood production and/or
environmental sustainability, have become aware o this, and ey policy-
maers have ormulated and disseminated relevant recommendations
to governments, institutions and staeholders. This is encouraging and,
given the beneits o rice–ish arming, it is important to give priority to its
continued promotion.
Taing China, the main producer, as an eample, with currently
15 percent o the suitable rice area under integrated rice–ish cultivation,
there is considerable scope or epansion.3 The same is true or many
rice-producing countries around the globe. Similarly, there is much room
or intensiication o eisting systems. Capacity building with increased
nowledge and improved management techniues will be criticallyimportant, in particular ocusing on all arming household members, both
men and women, as well as etension agents. In recent decades, ecellent
progress has been achieved by applying a “armer ield school” (FFS)
approach. This is a discovery-based learning approach where small groups
o armers meet regularly, acilitated by a specially trained technician, to
eplore new methods, through simple eperimentation and group discussion
and analysis, over the course o a growing season. This approach allows
armers to modiy and adapt newly introduced methods to local contets
and nowledge, ultimately providing a higher lielihood o appropriate
adaptation and adoption o improved technologies. It is only relatively
recently that auaculture has been integrated into an FFS-style curriculum in
Guyana and Suriname.7
In terms o ood security, producers in Asia, especially China, Viet Nam, India,Indonesia and Bangladesh, have beneited rom the development o culture o low-trophic-level species, such as carps and barbs, tilapias and Pangasius catish, in easingdependence on high-protein eeds, and thus reduced the vulnerability o their sectorsto eternalities. Grass carp, the world’s most-produced inish species rom auaculture,is grown partially with cultivated and wild-collected “pastures”, instead o usingormulated eeds only.
The production o 253 000 tonnes o highly carnivorous Mandarin ish (Siniperca
chuatsi ), which eeds on live prey only, was achieved by eeding them with low-trophic-level carp ingerlings grown with low-protein eeds plus pond ertilization.
Bo 2 (cont.)

7/28/2019 The State of World Fisheries and Aquaculture_2012
http://slidepdf.com/reader/full/the-state-of-world-fisheries-and-aquaculture2012 51/230
World review o fsheries and aquaculture 33
The approach to validate and disseminate integrated rice–ish arming
systems through FFS has been pioneered in Latin America. It is currently
being tested in ield activities in Mali, with testing also scheduled or Burina
Faso, where considerable potential or the integration o irrigated rice and
auaculture eists.8 Strong interest has been noted rom several other sub-
Saharan countries such as the Democratic Republic o the Congo, Senegal,
the United Republic o Tanzania, and Zambia.9
1 Halwart, M. and Gupta, M.V., eds. 2004. Culture o fsh in rice felds. Rome, FAO, andPenang, Malaysia, The WorldFish Center. 83 pp. (also available at www.ao.org/docrep/015/
a0823e/a0823e00.htm). (English, French and Spanish language versions)2 Bureau o Fisheries. 2011. 2010 China Fishery Statistical Yearbook . Beijing.3 Miao, W.M. 2010. Recent developments in rice–sh culture in China: a holistic approach orlivelihood improvement in rural areas. In S.S. de Silva and F.B. Davy, eds. Success stories in
Asian aquaculture , pp. 15–42. London, Springer. (also available at http://web.idrc.ca/en/ev-147117-201-1-DO_TOPIC.html).4 xie, J., Hu, L.L ., Tang, J.J., Wu, x., Li, N.N., Yuan, Y.G., Yang, H.S., Zhang, J., Luo, S.M. andChen, x. 2011. Ecological mechanisms underlying the sustainability o the agriculturalheritage rice–sh coculture system. Proceedings o the National Academy o Sciences o the
United States o America, 108(50): E1381–E1387 [online]. [Cited 19 April 2012]. www.pnas.org/content/108/50/E1381.ull5 Halwart, M. 1994. Fish as biocontrol agents in rice: the potential o common carp Cyprinuscarpio and Nile tilapia Oreochromis niloticus. Weiersheim, Germany, Margra Verlag.169 pp.6 Lu, J. and Li, x. 2006. Review o rice–sh-arming systems in China – one o the GloballyImportant Ingenious Agricultural Heritage Systems (GIAHS). Aquaculture , 260(1-4): 106–113.7
Halwart, M. and Settle, W., eds. 2008. Participatory training and curriculum development or Farmer Field Schools in Guyana and Suriname. A feld guide on Integrated Pest
Management and aquaculture in rice. Rome, FAO. 122 pp. (also available at www.ao.org/ docrep/012/al356e/al356e.pd).8 Peterson, J. and kalende, M. 2006. The potential or integrated irrigation-auaculture inMali. In M. Halwart and A.A. van Dam, eds. Integrated irrigation and aquaculture in West
Arica: concepts , practices and potential , pp. 79–94. Rome, FAO. 181 pp. (also available atwww.ao.org/docrep/009/a0444e/a0444e00.htm). (English, French and Spanish languageversions) 9 Yamamoto, k., Halwart, M. and Hishamunda, N. 2011. Supporting Arican rice armers intheir diversication eorts through auaculture. FAO Aquaculture Newsletter , 48: 42–43.
Comparable in uantity with the total production o armed rainbow trout in Europe(257 200 tonnes), or the combined world production o gilthead seabream and Europeanseabass (265 100 tonnes), Mandarin ish production has been assumed to be dependenton ishmeal and ish oil or eed, and this now needs reconsideration. As discussed above,part o its production could be treated as the non-ed portion o ed species production.
In sub-Saharan Arica, the carnivorous North Arican catish (Clarias gariepinus) hasreplaced tilapia as the most-produced ish in auaculture since 2004. The progressivedominance o catish species in auaculture is particularly pronounced in Nigeria and
Uganda. Being the largest producer o catish in Arica, Nigeria even imports catisheeds rom as ar away as Northern Europe.

7/28/2019 The State of World Fisheries and Aquaculture_2012
http://slidepdf.com/reader/full/the-state-of-world-fisheries-and-aquaculture2012 52/230
The State o World Fisheries and Aquaculture 201234
Production by culture environment
Auaculture production uses reshwater, bracish water and ull-strength marine wateras culture media. Data available at FAO show that, in terms o uantity, the percentageo production rom reshwater rose rom less than 50 percent beore the 1980s toalmost 62 percent in 2010 (Figure 8), with the share o marine auaculture productiondeclining rom more than 40 percent to just above 30 percent. In 2010, reshwaterauaculture was the source o 58.1 percent o global production by value. Bracish-water auaculture yielded only 7.9 percent o world production in terms o uantitybut accounted or 12.8 percent o total value because o the relatively high-valuedmarine shrimps cultured in bracish-water ponds. Marine water auaculture accountedor about 29.2 percent o world auaculture production by value.
The average annual growth rate or reshwater auaculture production rom2000 to 2010 was 7.2 percent, compared with 4.4 percent or marine auaculture
production. Freshwater ish arming has been a relatively easy entry point orpractising auaculture in developing countries, particularly or small-scale producers.
0
10
20
30
40
60
50
0
10
20
30
40
60
50
80 85 90 95 00 05 10
Figure 7
World aquaculture production of non-fed and fed species
Million tonnes Percentage
Percentage of non-fed species
Fed – other species
Fed – crustaceans
Fed – diadromous & marine finfishes
Fed – freshwater finfishes
Non-fed – silver & bighead carp
Non-fed – bivalves & others
Figure 8
World aquaculture production and relative share by culture environment
Million tonnes Percentage
80 85 90 95 00 05 10
Marine water
Brackish water
Freshwater
Marine water (%)
Brackish water (%)
Freshwater (%)
0
10
20
30
40
60
70
50
0
10
20
30
40
60
70
50

7/28/2019 The State of World Fisheries and Aquaculture_2012
http://slidepdf.com/reader/full/the-state-of-world-fisheries-and-aquaculture2012 53/230
World review o fsheries and aquaculture 35
As such, reshwater auaculture is epected to contribute urther to total auaculture
production in the 2010s.The share o bracish-water auaculture production has been stable, ranging
between 6 and 8 percent, or most o the time. An eception was in the 1980s andearly 1990s when accelerated development o bracish-water culture o marine shrimpspecies, particularly in coastal regions o Asia and South America, led to bracish-waterauaculture reaching 8–10 percent o total production. However, in the period 1994–2000, world marine shrimp arming was hit by disease outbreas in Asia and SouthAmerica, and the share o bracish-water production ell to 6 percent.
At the global level, the composition and types o armed species dier greatlyamong the three culture environments, and they have also undergone changes withinenvironments over the years (Figure 9).
Freshwater auaculture production (36.9 million tonnes) was overwhelmingly
dominated by inishes (91.7 percent, 33.9 million tonnes) in 2010, as in the past.Crustaceans accounted or 6.4 percent, and all other types o species contributed only
Figure 9
World aquaculture production composition by culture environment
FRESHWATER
BRACKISH WATER
MARINE WATER
Freshwater fishes
Crustaceans
Diadromous fishes
Other species
Crustaceans
Freshwater fishes
Diadromous fishes
Marine fishes
Molluscs
Molluscs
Diadromous fishes
Marine fishes
Crustaceans
Miscellaneousanimals
1990 2000 2010
1990 2000 2010
1990 2000 2010

7/28/2019 The State of World Fisheries and Aquaculture_2012
http://slidepdf.com/reader/full/the-state-of-world-fisheries-and-aquaculture2012 54/230
The State o World Fisheries and Aquaculture 201236
1.9 percent. The development o reshwater arming o crustaceans and other species(such as sot-shell turtles and rogs) in the past two decades has slightly eroded thedominance o inish in production. The share o diadromous ishes, including rainbowtrout and other salmonids, eels and sturgeons, shran rom 6.3 percent in 1990 to2.5 percent in 2010.
Bracish-water auaculture production (4.7 million tonnes) consisted o crustaceans(57.2 percent, 2.7 million tonnes), reshwater ishes (18.7 percent), diadromous ishes(15.4 percent), marine ishes (6.5 percent) and marine molluscs (2.1 percent) in 2010.More the 99 percent o the crustaceans were marine shrimps. The share o reshwaterishes has increased dramatically in the past two decades, driven largely by rapiddevelopment in Nile tilapia and other species in Egypt. Milish and barramundi remainimportant but their combined share has dropped signiicantly. Salmonids and eels arealso cultured in bracish-water in small uantities.
Marine-water auaculture production (18.3 million tonnes) consists o marinemolluscs (75.5 percent, 13.9 million tonnes), inishes (18.7 percent, 3.4 million tonnes),marine crustaceans (3.8 percent) and other auatic animals (2.1 percent), e.g. seacucumbers, and sea urchins. The share o molluscs (mostly bivalves, e.g. oysters,
mussels, clams, cocles, arshells and scallops) declined rom 84.6 percent in 1990 to75.5 percent in 2010, relecting the rapid growth in inish culture in marine water,which grew at an average annual rate o 9.3 percent rom 1990 to 2010 (seven timesaster than the rate or molluscs). Salmonid production, particularly Atlantic salmon,increased dramatically rom 299 000 tonnes in 1990 to 1.9 million tonnes in 2010, at anaverage annual rate eceeding 9.5 percent. Other inish species also increased rapidly,rom 278 000 tonnes in 1990 to 1.5 million tonnes in 2010, at an average annualrate eceeding 8.6 percent. Other inish species cultured in marine water includeamberjacs, seabreams, seabasses, croaers, grouper, drums, mullets, turbot and otherlatishes, snappers, cobia, pompano, cods, puers and tunas.
Species produced in aquaculture
In 2010, the composition o world auaculture production was: reshwater ishes(56.4 percent, 33.7 million tonnes), molluscs (23.6 percent, 14.2 million tonnes),crustaceans (9.6 percent, 5.7 million tonnes), diadromous ishes (6.0 percent,3.6 million tonnes), marine ishes (3.1 percent, 1.8 million tonnes) and other auaticanimals (1.4 percent, 814 300 tonnes). Figure 10 summarizes the production volumeso the major categories. Auaculture production eceeds capture production or manyo the staple species or auaculture. For eample, the wild catch accounts or lessthan 1 percent o Atlantic salmon production, and armed marine shrimps contribute55 percent to the total global production.
Production o reshwater ishe s has always been dominated by carps (71.9 percent,24.2 million tonnes, in 2010). Among carps, 27.7 percent are non-ed ilter-eedersand the rest are ed with low-protein eeds. Production o tilapias has a widedistribution, and 72 percent are raised in Asia (particularly in China and Southeast
Asia), 19 percent in Arica, and 9 percent in America. Viet Nam dominates productiono omnivorous Pangasius catishes although there are other producers, such asIndonesia and Bangladesh. World production o Pangasius catish may be understatedbecause booming production in India has yet to be relected in statistics. In 2010, Asiaaccounted or 73.7 percent o the production o other catish species, America tooits share to 13.5 percent (with channel catish production), leaving 12.3 percent oproduction in Arica (dominated by North Arican catish). Carnivorous species such asperches, basses and snaeheads accounted or only 2.6 percent o all reshwater ishproduced in 2010.
Since the beginning o 1990s, more than hal o the world production odiadromous ishes has come rom salmonids, and the share peaed at 70.4 percent in2001 beore declining slightly in the ace o increased milish production in Asia. The
production o Japanese and European eels, mostly raised in East Asia and to a muchlesser etent in Europe, has remained at about 270 000 tonnes in recent years. Limited

7/28/2019 The State of World Fisheries and Aquaculture_2012
http://slidepdf.com/reader/full/the-state-of-world-fisheries-and-aquaculture2012 55/230
World review o fsheries and aquaculture 37
by the supply o seeds, the chances o a signiicant increase in coming years appearremote. Other eel species have been tested with wild-collected seeds with only limitedsuccess. Culture o sturgeons, or meat and or caviar, has risen steadily in Asia, Europeand America although production is still small. An increased number o arming systemswith sophisticated euipment reuiring high investment have been set up to targetcaviar production in some countries.
World production o marine ishes is more evenly distributed across the culturedspecies. However, almost hal a million tonnes, or one-uarter o global production, arereported without identiying the species, particularly by a ew top producers rom Asia.There is evidence that production o European seabass and gilthead seabream has beensigniicantly under-reported in some areas in the Mediterranean.
World auaculture production o crustaceans in 2010 consisted o reshwaterspecies (29.4 percent) and marine species (70.6 percent). The production o marinespecies is dominated by white leg shrimp (Penaeus vannamei ), including substantialproduction in reshwater. In sharp contrast, the giant tiger prawn has lost importancein the last decade. Major reshwater species include red swamp crayish, Chinese mittencrab, oriental shrimp and giant river prawn.
Regarding molluscs, auaculture production o clams and cocles has increasedmuch aster than that o other species groups. In 1990, clam and cocle production washal that o oysters, but by 2008 it eceeded oysters and became the most-producedspecies group o molluscs. Among other auatic animals, production o sea cucumbersand sot-shell turtles has increased rapidly.
Use o aquatic species in aquaculture production
The number o species recorded in FAO auaculture production statistics increased to541 species and species groups in 2010, including 327 inishes (5 hybrids), 102 molluscs,62 crustaceans, 6 amphibians and reptiles, 9 auatic invertebrates and 35 algae. Theincrease relects improvements in data collection and reporting at the internationaland national levels, as well as the arming o new species, including hybrids. In view o
the high degree o species aggregation reported by many countries, it is estimated thatauaculture production worldwide uses about 600 auatic ood ish and algae species.Eotic auatic species have been widely introduced and used or mass production
in auaculture, and their use is particularly common and important in Asian countries.Successul internationally introduced species or inishes include tilapias rom Arica(especially Nile tilapia), Chinese carps (silver carp, bighead carp and grass carp), Atlanticsalmon (Salmo salar ), Pangasius catishes (Pangasius spp.), largemouth blac bass(Micropterus salmoides), turbot (Scophthalmus maximus), piarapatinga (Piaractus
brachypomus), pacu (Piaractus mesopotamicus), and rainbow trout (Oncorhynchus mykiss).Measured by production, white leg shrimp is the most successul internationally
introduced marine crustacean species or auaculture. In 2010, it accounted or71.8 percent o world production o all armed marine shrimp species, o which77.9 percent was produced in Asia (with the rest in its native home in America). Some
shrimp-arming countries maintain bans on the arming o this eotic species, andBangladeshi shrimp growers and seaood eporters have recently reuested a liting othe ban. Red swamp crayish (Procambarus clarkii ) rom North America and giant riverprawn (Macrobrachium rosenbergii ) rom South and Southeast Asia have also becomeimportant or reshwater culture in countries oreign to these species.
A signiicant part o the global production o marine molluscs, particularly inEurope and America, relies on the widely introduced Japanese carpet shell (Ruditapes
philippinarum, also nown as Manila clam) and Paciic cupped oyster (Crassostrea
gigas). China now produces large uantities o Atlantic bay scallop ( Argopecten
irradians) and Yesso scallop (Patinopecten yessoensis).A considerable number o hybrids, most notably o inish, are used in auaculture,
especially in countries with a relatively high level o development in auaculture
technologies. Commercially armed hybrids include: sturgeons (such as beluga Husohuso starlet sturgeon Acipenser ruthenus nown as “bester”) in Asia and Europe;

7/28/2019 The State of World Fisheries and Aquaculture_2012
http://slidepdf.com/reader/full/the-state-of-world-fisheries-and-aquaculture2012 56/230
The State o World Fisheries and Aquaculture 201238
0 21 3 5 74 6 8
0 100 300200 400 500
0.0 0.4 0.8 1.2 1.6
Figure 10
Production of major species or species group from aquaculture in 2010
Atlantic salmon
Marine fishes unidentified
Jacks, pompanos & mackerels
Drums and croakers
Gilthead seabream
Other seabreams
Mullets
European seabass
Japanese seabass
Groupers
Other flat fishes
Turbot
Cobia
Various marine fishes
Milkfish
Rainbow trout
Eels
Coho (silver) salmon
Other salmonids
Barramundi (Asian sea bass)
Sturgeons
Other diadromous fishes
Other freshwater fishes
Characins
Snakeheads
Perches & basses
Pangasius catfishes
Other catfishes
Other cyprinids
Goldfish & crucian carp
Common carp
Tilapias & other cichlids
Grass carp
Indian major carps
Silver & bighead carps
Million tonnes
Thousand tonnes
Million tonnes
FRESHWATER FISHES
DIADROMOUS FISHES
MARINE FISHES

7/28/2019 The State of World Fisheries and Aquaculture_2012
http://slidepdf.com/reader/full/the-state-of-world-fisheries-and-aquaculture2012 57/230
World review o fsheries and aquaculture 39
0.0 1.00.5 1.5 2.52.0 3.0
0 1 2 3 4 5
0 50 150 200100 250 300
Figure 10 (cont.)
Production of major species or species group from aquaculture in 2010
White leg shrimp
Giant tiger prawn
Other marine shrimps
Mud crabs
Other marine crabs
Lobsters
Crayfishes
Chinese mitten crab
Freshwater shrimps
Clams, cockles, arkshells
Scallops, pectens
Other marine molluscs
Abalones, winkles, conchs
Freshwater molluscs
Invertebrates unidentified
Sea urchins
Sea squirts
Other freshwater turtles
Jellyfishes
Frogs
Sea cucumbers
Soft-shell turtle
Million tonnes
CRUSTACEANS
OTHER AQUATIC ANIMALS
MOLLUSCS
Million tonnes
Thousand tonnes
Oysters
Mussels

7/28/2019 The State of World Fisheries and Aquaculture_2012
http://slidepdf.com/reader/full/the-state-of-world-fisheries-and-aquaculture2012 58/230
The State o World Fisheries and Aquaculture 201240
Carassius spp., snaeheads and groupers in China; characins in South America; andreshwater catishes (Clarias gariepinus Heterobrachus longiilis) in Arica and Europe.The culture o hybrid tilapias is particularly common around the world. The hybrido Oreochrom aureus O. niloticus (with a high percentage o male ospring) isarmed in China, and the saline-resistant hybrid o O. niloticus O. mossambicus in thePhilippines.
Five inish hybrids have been recorded with national production statistics andFAO estimates, indicating world production levels in 2010 o 333 300 tonnes o blueand Nile tilapia hybrid (Oreochrom aureus O. niloticus, in China and in Panama),116 900 tonnes o Clarias catish hybrid (Clarias gariepinus C. macrocephalus,in Thailand), 21 600 tonnes o “tambacu” hybrid (Piaractus mesopotamicus Colossoma macropomum, in Brazil), 4 900 tonnes o “tambatinga” hybrid (Colossoma
macropomum Piaractus brachypomus, in Brazil) and 4 200 tonnes o striped basshybrid (Morone chrysops M. saxatilis, in the United States o America, Italy and Israel).
Aquaic pa (aga) puciTo date, only auatic algae have been recorded globally in armed auatic plant
production statistics. Global production has been dominated by marine macroalgae, orseaweeds, grown in both marine and bracish waters.
Auatic algae production by volume increased at average annual rates o9.5 percent in the 1990s and 7.4 percent in the 2000s – comparable with rates orarmed auatic animals – with production increasing rom 3.8 million tonnes in 1990 to19 million tonnes in 2010. Cultivation has overshadowed production o algae collectedrom the wild, which accounted or only 4.5 percent o total algae production in 2010.
Following downward adjustments by FAO o the estimated value o several majorspecies rom a ew major producers with incomplete reported data, the estimated totalvalue o armed algae worldwide has been reduced or a number o years in the timeseries. The total value o armed auatic algae in 2010 is estimated at US$5.7 billion,while that or 2008 is now re-estimated at US$4.4 billion.
As shown in Figure 11, a ew species dominate algae culture, with 98.9 percent oworld production in 2010 coming rom Japanese elp (Saccharina/Laminaria japonica)(mainly in the coastal waters o China), Eucheuma seaweeds (a miture o Kappaphycus
alvarezii , ormerly nown as Eucheuma cottonii , and Eucheuma spp.), Gracilaria spp.,nori/laver (Porphyra spp.), waame (Undaria pinnatiida) and unidentiied marinemacroalgae species (3.1 million tonnes, mostly rom China). The remainder consists o
Figure 11
World production of farmed aquatic plant (algae) by major species
or species group
Million tonnes
1990 1995 2000 2005 2010
Japanese kelp
Kappaphycus alvarezii and
Eucheuma spp.
Marine macroalgae unidentified
Wakame
Gracilaria seaweeds
Nori/laver
Other species
6
5
4
3
2
1
0

7/28/2019 The State of World Fisheries and Aquaculture_2012
http://slidepdf.com/reader/full/the-state-of-world-fisheries-and-aquaculture2012 59/230
World review o fsheries and aquaculture 41
marine macroalgae species armed in small uantities (such as Fusiorm sargassum andCaulerpa spp.) and microalgae cultivated in reshwater (mostly Spirulina spp., plus asmall raction o Haematococcus pluvialis). The production increase is most obvious inthe arming o Eucheuma seaweeds. The 2000 production value or unidentiied marinemacroalgae shown in Figure 11 contains a signiicant portion o waame, which wasnot separately reported by the main producer.
In sharp contrast to ish auaculture, the cultivation o auatic algae is practisedin ar ewer countries. Only 31 countries and territories are recorded with algaearming production in 2010, and 99.6 percent o global cultivated algae productioncomes rom just eight countries: China (58.4 percent, 11.1 million tonnes), Indonesia(20.6 percent, 3.9 million tonnes), the Philippines (9.5 percent, 1.8 million tonnes),the Republic o korea (4.7 percent, 901 700 tonnes), Democratic People’s Republic okorea (2.3 percent, 444 300 tonnes), Japan (2.3 percent, 432 800 tonnes), Malaysia(1.1 percent, 207 900 tonnes) and the United Republic o Tanzania (0.7 percent,132 000 tonnes).
FIsHers And FIsH FArMers
Millions o people around the world ind a source o income and livelihood in theisheries sector. The most recent estimates (Table 7) indicate that in 2010 there were54.8 million people engaged in the primary sector o capture isheries and auaculture.O these, an estimated 7 million people were occasional ishers and ish armers (owhom 2.5 million in India, 1.4 million in China, 0.9 million in Myanmar, and 0.4 millioneach in Bangladesh and Indonesia).
More than 87 percent o all people employed in the isheries sector in 2010were in Asia, ollowed by Arica (more than 7 percent), and Latin America and theCaribbean (3.6 percent). Approimately 16.6 million (about 30 percent o all peopleemployed in the isheries sector) were engaged in ish arming, and they were evenmore concentrated in Asia (97 percent), ollowed by Latin America and the Caribbean(1.5 percent), and Arica (about 1 percent).
In the period 2005–2010, employment in the isheries sector continued to growaster (at 2.1 percent per year) than the world’s population (at 1.2 percent per year)
Table 7World ishers and ish armers by region
1990 1995 2000 2005 2010
(Thousands)
Arica 1 917 2 184 3 899 3 844 3 955
Asia 26 765 31 328 36 752 42 937 47 857
Europe 645 529 752 678 634
Latin America and the Caribbean 1 169 1 201 1 407 1 626 1 974
North America 385 376 343 342 342Oceania 67 69 74 74 76
w 30 948 35 687 43 227 49 502 54 838
O which ish armers1
Arica 2 61 84 124 150
Asia 3 772 7 050 10 036 12 228 16 078
Europe 32 57 84 83 85
Latin America and the Caribbean 69 90 191 218 248
North America … … … 4 4
Oceania 2 4 5 5 6
w 3 877 7 261 10 400 12 661 16 570
Note: ... = data not available.1 Estimates or 1990 and, partly, or 1995 were based on data available or a smaller number o countries and, thereore,may not be ully comparable with those or later years.

7/28/2019 The State of World Fisheries and Aquaculture_2012
http://slidepdf.com/reader/full/the-state-of-world-fisheries-and-aquaculture2012 60/230
The State o World Fisheries and Aquaculture 201242
and than employment in the traditional agriculture sector (at 0.5 percent per year). The54.8 million ishers and ish armers in 2010 represented 4.2 percent o the 1.3 billionpeople economically active in the broad agriculture sector worldwide, compared with2.7 percent in 1990.
However, the relative proportion o those engaged in capture isheries withinthe sector actually decreased rom 87 percent in 1990 to 70 percent in 2010, whilethe proportion o those engaged in ish arming increased rom 13 to 30 percent(Figure 12). In act, in the last ive years or which data are available, the number opeople engaged in ish arming has increased at 5.5 percent per year compared witha mere 0.8 percent per year or those engaged in capture isheries. It is apparent that,in the most important ishing nations, the share o employment in capture isheriesis stagnating or decreasing while auaculture is providing increased opportunities.Moreover, as many countries still do not report employment data separately or thecapture and arming sectors, the relative importance o employment in auaculturemay be underestimated.
The trends in employment vary according to the regions. Europe eperienced thelargest decrease in the number o people engaged in capture ishing with a 2 percent
average annual decline between 2000 and 2010, and almost no increase in peopleemployed in ish arming in the same period. In contrast, Arica showed the highestannual increase (5.9 percent) in the number o people engaged in ish arming inthe last decade, ollowed by Asia (4.8 percent), and Latin America and the Caribbean(2.6 percent).
Table 8 presents the employment statistics or selected countries, including China,where almost 14 million people (26 percent o the world total) are engaged as ishersand ish armers. In general, employment in ishing has been decreasing in capital-intensive economies, in particular in most European countries, North America, andJapan. For eample, in the period 1990–2010, the number o people employed inmarine ishing decreased by 53 percent in the United kingdom o Great Britain andNorthern Ireland, by 45 percent in Japan, by 40 percent in Norway, and by 28 percent
in Iceland. Several actors may account or this, including the application o policiesto reduce overcapacity and less reliance on human power owing to technologicaldevelopments.
Table 9 compares per capita annual productivity in the capture isheries andauaculture primary sector or each region. Overall, average annual production perperson is consistently lower in capture isheries than in auaculture, with globaloutputs o 2.3 and 3.6 tonnes per person per year, respectively.
0
10
20
30
40
50
60
Figure 12
Employment in the fisheries sector for the period 1990–2010
Millions
1990 1995 2000 2005 2010
World total
Capture fishers
Fish farmers

7/28/2019 The State of World Fisheries and Aquaculture_2012
http://slidepdf.com/reader/full/the-state-of-world-fisheries-and-aquaculture2012 61/230
World review o fsheries and aquaculture 43
Table 8
Number fishers and fish farmers in selected countries and territories
Fishery 1990 1995 2000 2005 2010
WORLD FI + AQ (number) 30 948 446 35 687 357 43 227 132 49 502 314 54 838 257
(index) 72 83 100 115 127
FI (number) 27 071 570 28 426 245 32 826 719 36 841 044 38 268 197
(index) 82 87 100 112 117
AQ (number) 3 876 876 7 261 112 10 400 413 12 661 270 16 570 060
(index) 37 70 100 122 159
China FI + AQ (number) 11 173 463 11 428 655 12 935 689 12 902 777 13 992 142
(index) 86 88 100 100 108
FI (number) 9 432 464 8 759 162 9 213 340 8 389 161 9 013 173
(index) 102 95 100 91 98
AQ (number) 1 740 999 2 669 493 3 722 349 4 513 616 4 978 969
(index) 47 72 100 121 134
Taiwan
Province of
China
FI + AQ (number) 325 902 302 161 314 099 351 703 330 181
(index) 104 96 100 112 105
FI (number) 232 921 204 149 216 501 246 580 246 659
(index) 108 94 100 114 114
AQ (number) 92 981 98 012 97 598 105 123 83 522
(index) 95 100 100 108 86
Iceland FI (number) 6 951 7 000 6 100 5 100 5 000
(index) 114 115 100 84 82
Indonesia FI + AQ (number) 3 617 586 4 568 059 5 247 620 5 096 978 5 971 725
(index) 69 87 100 97 114
FI (number) 1 995 290 2 463 237 3 104 861 2 590 364 2 620 277
(index) 64 79 100 83 84
AQ (number) 1 622 296 2 104 822 2 142 759 2 506 614 3 351 448
(index) 76 98 100 117 156
Japan FI (number) 370 600 301 440 260 200 222 160 202 880
(index) 142 116 100 85 78
Mexico FI + AQ (number) 242 804 249 541 262 401 279 049 271 608
(index) 93 95 100 106 104
FI (number) 242 804 249 541 244 131 255 527 240 855
(index) 99 102 100 105 99
AQ (number) ... ... 18 270 23 522 30 753
(index) ... ... 100 129 168
Morocco FI (number) 56 000 99 885 106 096 105 701 107 296
(index) 53 94 100 100 101
Norway FI + AQ (number) 24 979 21 776 18 589 18 776 17 667
(index) 134 117 100 101 95
FI (number) 20 475 17 160 14 262 14 554 12 280 (index) 144 120 100 102 86 AQ (number) 4 504 4 616 4 327 4 222 5 387 (index) 104 107 100 98 124
Peru1 FI + AQ (number) 43 750 62 930 93 789 95 426 99 000 (index) 47 67 100 102 106 FI (number) 43 750 60 030 87 524 86 755 90 000 (index) 50 69 100 99 103 AQ (number) ... 2 900 6 265 8 671 9 000 (index) ... 46 100 138 144
United
Kingdom
FI (number) 21 582 19 986 15 649 12 647 10 129
(index) 138 128 100 81 65
Note: FI = fishing, AQ = aquaculture; index: 2000 = 100; ... = data not available.1 Data for 2010 are FAO estimates.

7/28/2019 The State of World Fisheries and Aquaculture_2012
http://slidepdf.com/reader/full/the-state-of-world-fisheries-and-aquaculture2012 62/230
The State o World Fisheries and Aquaculture 201244
Bo 3
Child labour – an important issue also in isheries and auaculture
Child labour is a great concern in many parts o the world. In 2008, some
60 percent o the 215 million boys and girls estimated to be child labourers
worldwide were engaged in the agriculture sector, including in isheries,
auaculture, livestoc and orestry.1 In addition to wor interering with
schooling and harming personal development in other ways, many o these
children wor in hazardous occupations or activities that threaten their
health and sometimes their lives. They do wor that they should not do
according to international conventions and/or national legislation, and this
situation endangers not only the children themselves but also eorts at
poverty alleviation and sustainable development in a larger sense or their
amilies and communities.
However, tacling child labour is no easy tas. The occurrence o childlabour is entwined in poverty and social injustices and cannot be addressed
in isolation. Moreover, some types o wor are not harmul but can even
be beneicial or children. While it may be relatively easy to identiy and
agree to eliminate the “worst orms o child labour”, the distinction
between “acceptable wor” and “harmul labour” is not always clear and
assessments can be muddled by local and traditional practices and belies.
There is a need to eercise due care in analysing eisting situations, in
applying eisting conventions, legislation and guidelines, and in raising the
awareness and understanding o child labour issues in order to ensure that
they are directly addressed as well as integrated into broader policies and
programmes. Improvements have proved possible and the overall number
o child labourers in the world has declined since 2000.Inormation on child labour in isheries and auaculture is limited,
and data on agriculture child labour are not generally disaggregated by
subsector. Nevertheless, case studies and speciic surveys indicate that the
numbers are important. Child labour is particularly common in the small-
scale inormal sector, and children wor in a large variety o activities, as
part o amily enterprises, as unpaid amily worers or employed by others.
They are ound, or eample, woring on board ishing vessels, preparing
nets and baits, eeding and harvesting ish in auaculture ponds, and
sorting, processing and selling ish.
A number o actors inluence whether a tas should be considered
acceptable wor, child labour or “worst orm o child labour”. With the
support o initiatives such as the global International Partnership or
Cooperation on Child Labour in Agriculture, launched by ey internationalagricultural organizations in 2007,2 the nowledge base and guidance on
how to classiy and tacle child labour in agriculture have improved in the
last decade. However, there is still an urgent need to learn more about
child labour also in isheries and auaculture and to address the speciic
situations.
In April 2010, FAO, in cooperation with the International Labour
Organization (ILO), organized a worshop3 to generate inputs and
guidance to the contents and process o developing guidance materials
on policy and practice in tacling child labour in isheries and auaculture.
In order to promote awareness on and eective implementation o the

7/28/2019 The State of World Fisheries and Aquaculture_2012
http://slidepdf.com/reader/full/the-state-of-world-fisheries-and-aquaculture2012 63/230
World review o fsheries and aquaculture 45
relevant UN and ILO conventions on child labour and the rights o the child,
the worshop participants:
• reviewed the nature, incidence and causes o child labour in isheries,
ish processing and auaculture;
• eamined the dierent orms and types o child labour in large-scale,
small-scale and artisanal ishing operations, shellish gathering,
auaculture, seaood processing, and wor onboard ishing vessels
and ishing platorms;
• eamined the health and saety hazards o ishing and auaculture,
including the use o hazardous technologies and relevant
alternatives;
• shared eamples o good practice in the progressive elimination ochild labour drawn rom various sectors and regions.
The worshop participants agreed on a series o recommendations
relating to legal and enorcement measures, policy interventions and
practical actions, including ris assessments, to address child labour issues
in isheries and auaculture. FAO and ILO were called upon or priority
actions to assist governments in withdrawing traiced children and to
eectively prohibit slavery and orced labour. The worshop participants
also prioritized awareness raising among all staeholders and the
preparation o guidance materials. In addition, they stressed the need
to consider gender issues in all actions and to address adeuately issues
relating to discrimination and eclusion o ishing communities, castes,
tribal and indigenous peoples, and ethnic minorities in isheries andauaculture.
FAO and ILO are collaborating in helping to assess and address child
labour issues in countries such as Cambodia and Malawi. They have also
produced a preliminary version o a good practice guide or addressing
child labour in isheries and auaculture.4
1 International Labour Organization. 2010. Facts on child labour 2010 [online]. Geneva,Switzerland. [Cited 31 March 2012]. www.ilo.org/wcmsp5/groups/public/@dgreports/@dcomm/ documents/publication/wcms_126685.pd2
In addition to FAO, other current members o the International Partnership or Cooperationon Child Labour in Agriculture are the International Labour Organization (ILO), InternationalFund or Agricultural Development, International Food Policy Research Institute o theConsultative Group on International Agricultural Research, International Federation oAgricultural Producers (representing armers/employers and their organizations), andInternational Union o Food, Agricultural, Hotel, Restaurant, Catering, Tobacco and AlliedWorers’ Associations (representing worers and their organizations). Further inormation isavailable on the ILO’s Web page on the International Programme on the Elimination o ChildLabour (IPEC) at www.ilo.org/ipec/lang--en/inde.htm#a1.3 FAO. 2010. FAO workshop on child labour in fsheries and aquaculture in cooperation with
ILO [online]. Rome. [Cited 31 March 2012]. www.ao.org/leadmin/user_upload/newsroom/ docs/Final_recommendationsB.pd4 FAO and International Labour Organization. 2011. FAO–ILO good practice guide or
addressing child labour in fsheries and aquaculture: policy and practice [online]. [Cited31 March 2012]. tp://tp.ao.org/FI/DOCUMENT/child_labour_FAO-ILO/child_labour_FAO-ILO.pd

7/28/2019 The State of World Fisheries and Aquaculture_2012
http://slidepdf.com/reader/full/the-state-of-world-fisheries-and-aquaculture2012 64/230
The State o World Fisheries and Aquaculture 201246
Although 87.3 percent o the world’s ishers and ish armers were in Asia,the region accounted or only 68.7 percent o global production with an averageo 2.1 tonnes per person per year in 2010, compared with 25.7 tonnes in Europe,18.0 tonnes in North America, and 6.9 tonnes in Latin America and the Caribbean. Thehigh productivity o Oceania relects the contributions mainly o New Zealand andAustralia and could be caused by the incomplete statistics provided by many othercountries in the region. Production per person is considered to relect a certain degreeo industrialization o ishing activities as well as the relative importance o small-scaleoperators, especially in Arica and Asia.
The contrast is even more evident or auaculture production. In 2010, ish armers
in Norway had an average annual production o 187 tonnes per person, while inChile the corresponding igure was 35 tonnes, in China about 7 tonnes, in India about4 tonnes, and in Indonesia only about 1 tonne.
As a general global trend, while productivity has dropped slightly rom 2.8 to2.3 tonnes per person in capture production, auaculture has increased its productivityrom 3.1 to 3.6 tonnes per person in the last decade.
Although the inormation available to FAO does not allow detailed analyses bygender, it is estimated that, overall, women accounted or at least 15 percent o allpeople directly engaged in the isheries primary sector in 2010. The proportion owomen is considered to be somewhat higher, at least 19 percent, in inland waterishing, and ar more important, as high as 90 percent, in secondary activities, such asprocessing.
As in other sectors, child labour is a cause or concern in the isheries and
auaculture sector. Thereore, together with other organizations, FAO is woring toaddress this issue (Bo 3).
The isheries and auaculture sector provides numerous jobs in ancillary activitiesin addition to ishers and ish armers, such as processing, pacaging, mareting anddistribution, manuacturing o ish processing euipment, net and gear maing, iceproduction and supply, boat construction and maintenance. Other people are involvedin research, development and administration lined with the isheries sector. Assumingthat or each person directly engaged in isheries production in 2010 about three toour related jobs were generated in secondary activities, and urther assuming that,on average, each jobholder provided or three dependants or amily members, thenishers, ish armers and those supplying services and goods to them would haveassured the livelihoods o about 660–820 million people, or about 10–12 percent o the
world’s population.
Table 9Fishery production per isher or ish armer by region in 2010
Puci1 p p
rgi Capu Aquacuu Capu + aquacuu
(Tonnes/year)
Arica 2.0 8.6 2.3
Asia 1.5 3.3 2.1
Europe 25.1 29.6 25.7
Latin Americaand the Caribbean
6.8 7.8 6.9
North America 16.3 183.2 18.0
Oceania 17.0 33.3 18.2
w 2.3 3.6 2.7
1
Production ecludes auatic plants.

7/28/2019 The State of World Fisheries and Aquaculture_2012
http://slidepdf.com/reader/full/the-state-of-world-fisheries-and-aquaculture2012 65/230
World review o fsheries and aquaculture 47
tHe stAtUs oF tHe FIsHInG Fleet
Cag a quai f aaIn 2011, FAO obtained data on national ishing leets rom 138 countries, accountingor 67 percent o the countries involved in capture isheries. When consideringthe catch amount together with corresponding leet size, it is estimated that thereported inormation accounts or 96 percent o the global ishing leet. While FAOhas estimated the leet size or another 49 countries or the analysis in this section,no estimation has been made or the remaining 18 countries or which data havenever been reported or estimated and whose contribution to the global ishing leetis considered to be negligible.
Depending on countries, national reports on leet status may be based on nationalishing vessel registers and administrative records that relect the physical eistenceo vessels and oten include vessels not actually engaged in ishing operations ina certain year. Even or the countries whose statistics correspond to active ishingvessels, there is no inormation about the etent o their engagement in ishingactivities, e.g. ull-time, part-time, or occasional. This means that the “leet size”reerred to in this section is only a rough estimate and should not be considered as an
indicator or either global ishing capacity or global ishing eort, which in principleshould be substantially smaller than those indicated here.
At the same time, data uality varies widely by country rom well-maintained,long time series o consistent data to very ragmented records. In general, the dataavailable or marine ishing leets are o better uality and detail than that availableor vessels deployed in inland waters. Moreover, small boats are oten not wellcovered as reuently they are not subject to compulsory registration, especially thoseused in inland waters.
This year, or the irst time, an attempt has been made to separate, to the etentpossible, the marine ishing leet rom the leet operating in inland waters.
eima f gba f a i gia iibui
The total number o ishing vessels in the world was estimated to be about4.36 million vessels in 2010, a value similar to the previous estimates. The leet inAsia was the largest, consisting o 3.18 million vessels accounting or 73 percent othe global leet, ollowed by Arica (11 percent), Latin America and the Caribbean(8 percent), North America (3 percent) and Europe (3 percent).
Among the global leet, 3.23 million vessels (74 percent) were considered tooperate in marine waters, with the remaining 1.13 million vessels operating ininland waters. The separation between inland and marine ishing leets was madebased on: (i) national reported statistics with suicient details (e.g. China, Indonesia,and Japan); and (ii) allocation o whole leets o landloced countries to inlandwaters (e.g. Burina Faso, Burundi, Chad, kazahstan, Malawi, Mali, Niger, Uganda,Uzbeistan and Zambia).
This preliminary analysis indicated that the inland leet represents about
26 percent o the global leet, but the proportion o vessels operating in inlandwaters varies substantially depending on the regions (Figure 13), the highest beingin Arica (42 percent), ollowed by Asia (26 percent) and Latin America and theCaribbean (21 percent). Although preliminary, this resolves past conusion as towhether the inland-water operating component was included or ecluded in theoverall leet analysis. Further wor would be needed to disaggregate componentsoperating speciically in the Arican Great Laes.
Globally, 60 percent o ishing vessels were engine-powered in 2010. While69 percent o vessels operating in marine waters were motorized, the correspondingvalue or those operating in inland waters was only 36 percent. For the leetoperating in marine waters, there were also large variations among regions, withnon-motorized vessels accounting or less than 7 percent o the total in Europe and
the Near East, but up to 61 percent in Arica (Figure 14). Although North America has

7/28/2019 The State of World Fisheries and Aquaculture_2012
http://slidepdf.com/reader/full/the-state-of-world-fisheries-and-aquaculture2012 66/230
The State o World Fisheries and Aquaculture 201248
Figure 14
Proportion of marine fishing vessels with and without engine by region in 2010
Europe
Pacificand Oceania
Asia
Latin Americaand the Caribbean
North America
Near East
Africa
World
No engine Motorized
Percentage
0 10 20 30 40 50 60 70 80 90 100
Figure 13
Proportion of fishing vessels in marine and inland waters by region in 2010
AsiaAfrica North America
Europe
Near East
Pacific and Oceania
Latin Americaand the Caribbean
Inland Marine
Figure 15
Distribution of motorized fishing vessels by region in 2010
Pacific and Oceania 1%
Near East 3%
North America 4%
Europe 4%
Africa 7%
Latin America
and the Caribbean 9%
Asia 72%

7/28/2019 The State of World Fisheries and Aquaculture_2012
http://slidepdf.com/reader/full/the-state-of-world-fisheries-and-aquaculture2012 67/230
World review o fsheries and aquaculture 49
no report o non-motorized vessels, this could be a relection o the data collectionsystems in use there.
Globally, the motorized ishing leet is distributed unevenly among regions. The vastmajority o motorized vessels (72 percent) were reported rom Asia (Figure 15), withthe rest rom Latin America and the Caribbean (9 percent), Arica (7 percent), NorthAmerica (4 percent), and Europe (4 percent).
siz iibui a h impac f ma baIn 2010, more than 85 percent o the motorized ishing vessels in the world wereless than 12 m LOA. Such vessels dominated in all regions, particularly the Near East,and Latin America and the Caribbean (Figure 16). About 2 percent o all motorizedishing vessels corresponded to industrialized ishing vessels o 24 m and larger (witha GT o roughly more than 100 GT) and that raction was larger in the Paciic andOceania region, Europe, and North America. A segment o the industrialized ishingleet mentioned above is registered with uniue identiication numbers providedby the International Maritime Organization (IMO), whose list included more than22 000 active ishing vessels by the end o 2010.
While the bul o the global ishing leet is composed o small-sized vessels (lessthan 12 m LOA), this is the component or which reliable inormation is least available.Such is particularly the case in Arica, parts o Asia and the Americas. In many cases,vessels smaller than a certain size are not subject to national registration or are onlysubject to local registries that might not be relected in national statistics. In addition,ishing leets operating in inland waters usually consist mostly o vessels o less than12 m LOA, which are commonly not subject to either national or local registries andare oten omitted rom most analyses, particularly in developing countries. Thereore,estimations o the relative importance o the small-scale and industrial componentso isheries or social, economic, and ood security purposes are then liely to besewed owing to inadeuate appraisal o the small-scale segment. In Arica, and inLatin America and the Caribbean, small vessels constitute a vast sector o artisanal and
subsistence isheries on which the livelihoods o a great number o isher householdsdepend.Table 10 illustrates some eamples o the relevance o small motorized vessels or
selected countries in dierent regions. The proportion o vessels o less than 12 mLOA eceeds 90 percent in most cases. In addition, an estimated 98 percent o non-motorized ishing vessels would be less than 12 m LOA.
Figure 16
Size distribution of fishing vessels by region in 2010
Europe
Pacificand Oceania
Asia
Latin Americaand the Caribbean
North America
Near East
Africa
World
0–11.9 m 12–23.9 m ≥ 24 m
Percentage
0 10 20 30 40 50 60 70 80 90 100

7/28/2019 The State of World Fisheries and Aquaculture_2012
http://slidepdf.com/reader/full/the-state-of-world-fisheries-and-aquaculture2012 68/230
The State o World Fisheries and Aquaculture 201250
Continuous eorts are being made in Arica (in collaboration with regional and
subregional isheries organizations such as the Fishery Committee or the EasternCentral Atlantic [CECAF], Regional Fisheries Committee or the Gul o Guinea,Fishery Committee or the West Central Gul o Guinea, and Southwest Indian OceanFisheries Commission [SWIOFC]) as well as in Central America (in collaboration withthe Organization o Fishing and Auaculture in Central America) to establish vesselregisters as part o ishery resources management plans and policies. Frame surveys andisheries censuses have already yielded invaluable inormation, but it may reuire sometime beore relect the results o these eorts are relected in the oicial statistics.
effc f ff uc capaci i fihig fIn response to the International Plan o Action or the Management o FishingCapacity, several countries have tried establishing targets or the reduction o
national overcapacity o ishing leets. While the numbers o ishing vessels have beendecreasing in some parts o the world in recent years, they have being increasingelsewhere.
Table 10Proportion in terms o length o motorized vessels in ishing leets rom selectednations in dierent regions
Fag
da f
aa
P
v gh cag
0–11.9 m 12–23.9 m ≥ 24 m
(Number) (Percentage)
Angola1 2009 7 767 95.00 4.70 0.30
Cameroon1 2009 8 669 82.90 16.50 0.60
Mauritius1 2010 1 474 98.20 1.20 0.60
Morocco1 2010 19 207 89.70 8.80 1.50
Tunisia1 2010 5 705 75.20 20.00 4.80
suba f c cui i Afica 42 822 87.90 9.00 3.10
Bahrain1 2010 2 727 90.40 9.60 0.00
Oman1 2010 15 349 96.50 3.20 0.30
Syrian Arab Republic1
2010 1 663 95.60 4.00 0.40suba f c cui i na ea 19 739 95.60 4.10 0.30
Bangladesh1 2010 21 097 99.20 0.20 0.70
China
China (marine)2 2010 204 456 68.60 20.60 10.80
China (inland)2 2010 226 535 88.50 11.10 0.40
Taiwan Province o China1 2009 20 654 67.00 24.00 8.90
Myanmar1 2010 15 865 88.10 8.40 3.60
Republic o korea1 2010 74 669 90.40 7.60 2.00
suba f c cui i Aia 563 276 81.10 14.10 4.80
eU-27, c cui i eup3 2010 78 138 82.20 13.70 4.10
Fiji1 2010 2 185 96.90 1.40 1.60
French Polynesia1 2010 3 429 98.20 1.70 0.10
New Caledonia1 2010 318 93.40 4.70 1.90
New Zealand1 2010 1 401 61.20 32.20 6.60
Tonga1 2010 951 98.30 1.30 0.40
suba f c cui i ocaia 8 284 91.50 6.80 1.70
1 Response to FAO uestionnaires.2 Bureau o Fisheries, Ministry o Agriculture. 2011. China Fishery Statistical Yearbook 2011. Beijing.3 European Commission. 2012. Fleet Register On the NeT. In: Europa [online]. [Cited 13 April 2012].http://ec.europa.eu/isheries/leet/inde.cm?method=Download.menu

7/28/2019 The State of World Fisheries and Aquaculture_2012
http://slidepdf.com/reader/full/the-state-of-world-fisheries-and-aquaculture2012 69/230
World review o fsheries and aquaculture 51
Table 11Motorized ishing leets in selected countries, 2000–20101
2000 2005 2007 2008 2009 2010
CHInA
A fihi 2
number 487 297 513 913 576 996 630 619 672 633 675 170
tonnage GT 6 849 326 7 139 746 7 806 935 8 284 092 8 595 260 8 801 975
power W3 14 257 891 15 861 838 17 648 120 19 507 314 20 567 968 20 742 025
Mai fihig
number – – 207 353 199 949 206 923 204 456
tonnage GT – – 5 527 675 5 776 472 5 838 599 6 010 919
power W – – 12 394 224 12 950 657 13 058 326 13 040 623
Ia fihig
number – – 172 836 216 571 223 912 226 535
tonnage GT – – 835 625 936 774 1 027 500 1 044 890
power W – – 1 940 601 2 908 697 3 382 505 3 473 648JAPAn
Mai fihig
number 337 600 308 810 296 576 289 456 281 742 –
tonnage GT 1 447 960 1 269 130 1 195 171 1 167 906 1 112 127 –
power W 11 450 612 12 271 130 12 662 088 12 861 317 12 945 101 –
Ia fihig
number 9 542 8 522 8 199 8 422 8 156 –
tonnage GT 9 785 8 623 8 007 8 261 7 978 –
power W 180 930 209 257 198 098 220 690 219 443 –
eU-154
number 86 660 77 186 74 597 72 528 72 011 71 295
tonnage GT 2 019 329 1 832 362 1 750 433 1 694 280 1 654 283 1 585 288power W 7 632 554 6 812 255 6 557 295 6 343 379 6 243 802 6 093 335
ICelAnd
number 1 993 1 752 1 642 1 529 1 582 1 625
tonnage GT 180 150 181 530 169 279 159 627 158 253 152 401
power W 522 876 520 242 502 289 471 199 472 052 466 691
norwAy
number 13 017 7 722 7 038 6 785 6 510 6 310
tonnage GT 392 316 373 282 354 833 363 169 367 688 366 126
power W 1 321 624 1 272 965 1 249 173 1 240 450 1 252 813 1 254 129
rePUBlIC oF koreA
number 89 294 87 554 82 796 78 280 75 247 74 669
tonnage GT 917 963 697 956 661 519 619 098 592 446 598 367
power W 10 139 415 9 656 408 10 702 733 9 755 438 9 955 334 9 953 809
1 Some vessels may not be measured according to the 1969 International Convention on Tonnage Measurement o Ships.2 Includes all vessels involved in the isheries sector, such as capture, auaculture, support and surveillance, in both inlandand marine waters.3 All power units standardized to W.4 Combined leets rom Belgium, Denmar, Finland, France, Germany, Greece, Ireland, Italy, Netherlands, Portugal, Spain,Sweden and United kingdom.Sources: China: Bureau o Fisheries, Ministry o Agriculture. 2011. China Fishery Statistical Yearbook 2011. Beijing.Japan: Fisheries Agency, Government o Japan. 2009. Statistical Tables o Fishing Vessels. General Report No. 62.EU-15: European Commission. 2012. Fleet Register On the NeT. In: Europa [online]. [Cited 13 April 2012]. http://ec.europa.eu/isheries/leet/inde.cm?method=Download.menu; and European Commission. 2012. Main tables. In: Eurostat [online].[Cited 13 April 2012]. http://epp.eurostat.ec.europa.eu/portal/page/portal/isheries/data/main_tablesIceland: Response to FAO uestionnaires; European Commission. 2012. Main tables. In: Eurostat [online]. [Cited 13 April
2012]. http://epp.eurostat.ec.europa.eu/portal/page/portal/isheries/data/main_tables; and Statistics Iceland. 2012. Fishingvessels. In: Statistics Iceland [online]. [Cited 13 April 2012]. www.statice.is/Statistics/Fisheries-and-agriculture/Fishing-vesselsNorway: Response to FAO uestionnaires; European Commission. 2012. Main tables. In: Eurostat [online].[Cited 13 April 2012]. http://epp.eurostat.ec.europa.eu/portal/page/portal/isheries/data/main_tables; and StatisticsNorway. 2012. Fisheries. In: Statistics Norway [online]. [Cited 13 April 2012]. http://statban.ssb.no/statistibanen/ Deault_FR.asp?PxSid=0&nvl=true&PLanguage=1&tilside=selecttable/hovedtabellHjem.asp&kortnavnWeb=iseriRepublic o korea: Response to FAO uestionnaires, national authorities.

7/28/2019 The State of World Fisheries and Aquaculture_2012
http://slidepdf.com/reader/full/the-state-of-world-fisheries-and-aquaculture2012 70/230

7/28/2019 The State of World Fisheries and Aquaculture_2012
http://slidepdf.com/reader/full/the-state-of-world-fisheries-and-aquaculture2012 71/230
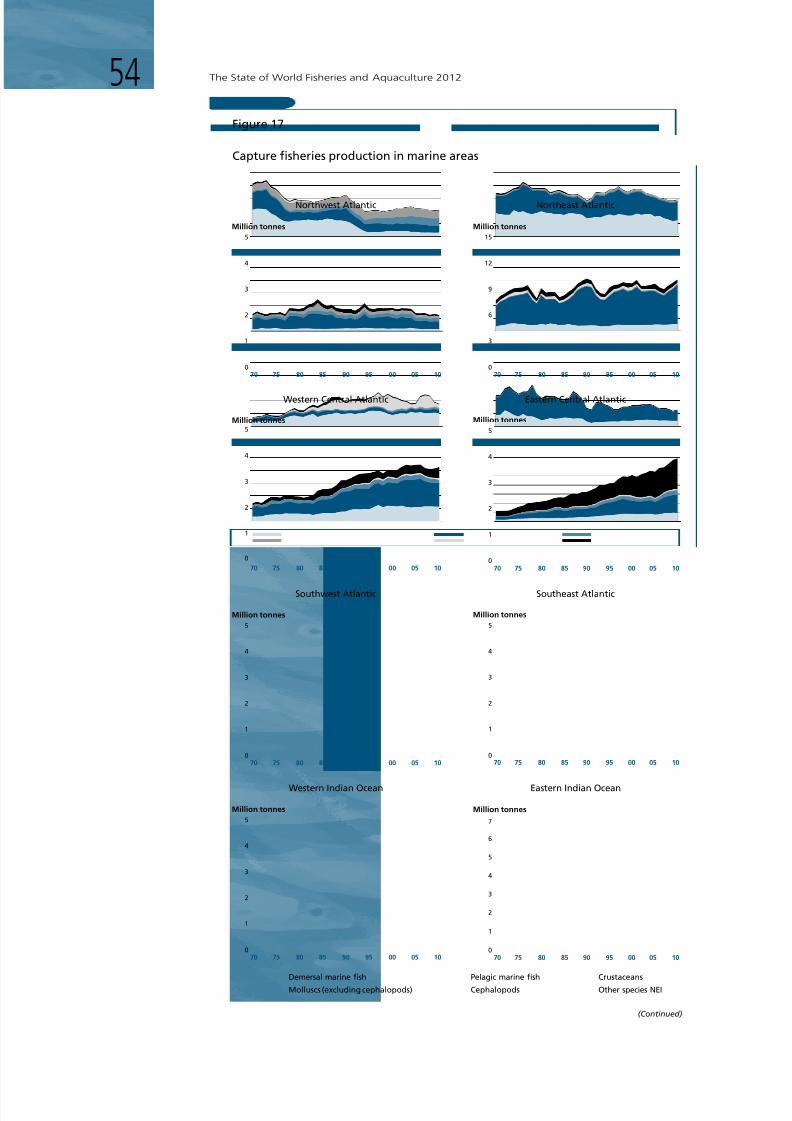
7/28/2019 The State of World Fisheries and Aquaculture_2012
http://slidepdf.com/reader/full/the-state-of-world-fisheries-and-aquaculture2012 72/230
The State o World Fisheries and Aquaculture 201254
0
1
2
3
4
5
70 75 80 85 90 95 00 05 10
70 75 80 85 90 95 00 05 10
70 75 80 85 90 95 00 05 10
70 75 80 85 90 95 00 05 10
70 75 80 85 90 95 00 05 10
70 75 80 85 90 95 00 05 10
70 75 80 85 90 95 00 05 10
70 75 80 85 90 95 00 05 10
0
3
6
9
12
15
0
1
2
3
4
5
0
1
2
3
4
5
0
1
2
3
4
5
6
7
0
1
2
3
4
5
0
1
2
3
4
5
0
1
2
3
4
5
Figure 17
Capture fisheries production in marine areas
Million tonnes
Million tonnes
Million tonnes
Million tonnes
Million tonnes
Million tonnes
Million tonnes
Northwest Atlantic Northeast Atlantic
Western Central Atlantic Eastern Central Atlantic
Southwest Atlantic Southeast Atlantic
Western Indian Ocean Eastern Indian Ocean
Demersal marine fish
Molluscs (excluding cephalopods)
Pelagic marine fish
Cephalopods
Crustaceans
(Continued)
Other species NEI
Million tonnes
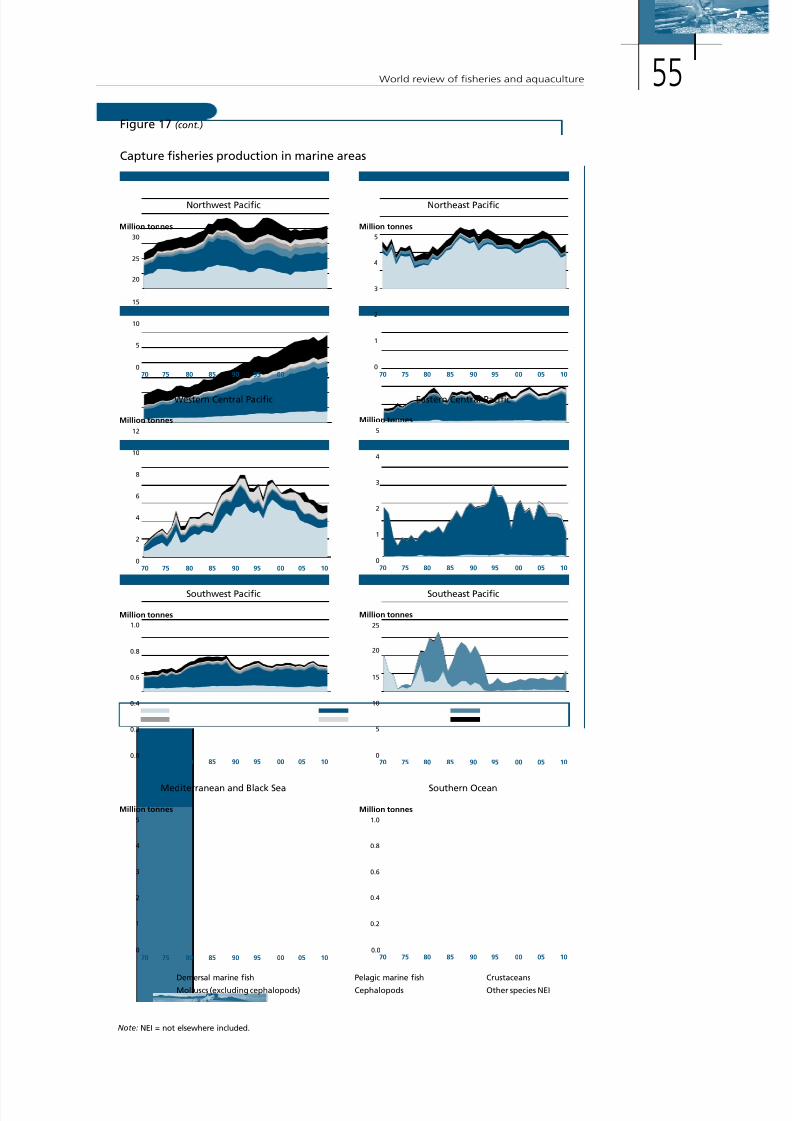
7/28/2019 The State of World Fisheries and Aquaculture_2012
http://slidepdf.com/reader/full/the-state-of-world-fisheries-and-aquaculture2012 73/230
World review o fsheries and aquaculture 55
0
1
2
3
4
5
0
5
10
15
20
25
0.0
0.2
0.4
0.6
0.8
1.0
0
1
2
3
4
5
0
1
2
3
4
5
0.0
0.2
0.4
0.6
0.8
1.0
0
2
4
6
8
10
12
0
5
10
15
20
25
30
Note: NEI = not elsewhere included.
70 75 80 85 90 95 00 05 10
70 75 80 85 90 95 00 05 10
70 75 80 85 90 95 00 05 10
70 75 80 85 90 95 00 05 10
70 75 80 85 90 95 00 05 10
70 75 80 85 90 95 00 05 10
70 75 80 85 90 95 00 05 10
70 75 80 85 90 95 00 05 10
Figure 17 (cont.)
Capture fisheries production in marine areas
Million tonnes Million tonnes
Million tonnes
Million tonnes
Million tonnes
Million tonnes
Million tonnes
Million tonnes
Northwest Pacific Northeast Pacific
Western Central Pacific Eastern Central Pacific
Southwest Pacific Southeast Pacific
Mediterranean and Black Sea Southern Ocean
Demersal marine fish
Molluscs (excluding cephalopods)
Pelagic marine fish
Cephalopods
Crustaceans
Other species NEI

7/28/2019 The State of World Fisheries and Aquaculture_2012
http://slidepdf.com/reader/full/the-state-of-world-fisheries-and-aquaculture2012 74/230
The State o World Fisheries and Aquaculture 201256
stocs (and conseuently catches) may urther deteriorate unless there are signiicantimprovements in their management. This is because o the substantial demand or tunaand the signiicant overcapacity o tuna ishing leets.
The concern about the poor status o some bluein stocs and the inability osome tuna management organizations to manage these stocs eectively led to aproposal by Monaco in 2010 to ban the international trade in Atlantic bluein tunaunder CITES. Although it was hardly disputed that the stoc status o this high-valueood ish met the biological criteria or listing on CITES Appendi I, the proposal wasultimately rejected. Many parties that opposed the listing stated that in their viewthe International Commission or the Conservation o Atlantic Tunas (ICCAT) wasthe appropriate body or management o such an important commercially eploitedauatic species.
World marine isheries have gone through signiicant changes since the 1950s.Accordingly, the eploitation level o ish resources and their landings have also variedover time. The temporal pattern o landings diers rom area to area depending onthe level o urban development and changes that countries surrounding that area haveeperienced. In general, they can be divided into three groups, i.e. one characterized
by oscillations in the catches, another by an overall declining trend ollowing historicalpeas, and a third with increasing catch trends.
The irst group includes those FAO areas that have demonstrated oscillations intotal catch (Figure 17), i.e. the Eastern Central Atlantic (Area 34), Northeast Paciic(Area 67), Eastern Central Paciic (Area 77), Southwest Atlantic (Area 41), SoutheastPaciic (Area 87), and Northwest Paciic (Area 61). These areas have provided about52 percent o the world’s total marine catch on average in the last ive years. Several othese areas include upwelling regions that are characterized by high natural variability.
The second group consists o areas that have demonstrated a decreasing trendin catch since reaching a pea at some time in the past. This group has contributed20 percent o global marine catch on average in the last ive years, and includes theNortheast Atlantic (Area 27), Northwest Atlantic (Area 21), Western Central Atlantic
(Area 31), Mediterranean and Blac Sea (Area 37), Southwest Paciic (Area 81), andSoutheast Atlantic (Area 47). It should be noted that lower catches in some cases relectisheries management measures that are precautionary or aim at rebuilding stocs, andthis situation should, thereore, not necessarily be interpreted as negative.
The third group comprises the FAO areas that have shown continuously increasingtrends in catch since 1950. There are only three areas in this group: Western Central
0
10
20
30
40
50
60
Figure 18
Global trends in the state of world marine fish stocks since 1974
Percentage of stocks assessed
Non-fully exploited
Fully exploited
Overexploited
74 79 84 89 94 99 04 09
7/28/2019 The State of World Fisheries and Aquaculture_2012
http://slidepdf.com/reader/full/the-state-of-world-fisheries-and-aquaculture2012 75/230
World review o fsheries and aquaculture 57
Paciic (Area 71), Eastern (Area 57) and Western Indian Ocean (Area 51). They havecontributed 28 percent o the total marine catch on average over the last ive years.However, in some regions, there is still high uncertainty about the actual catches owingto the poor uality o statistical reporting systems in coastal countries.
The Northwest Paciic has the highest production among the FAO statistical areas.Its total catch luctuated between about 17 and 24 million tonnes in the 1980s and1990s, and was about 21 million tonnes in 2010. Small pelagics are the most abundantcategory in this area, with the Japanese anchovy providing 1.9 million tonnes in2003 but having since declined to about 1.1 million tonnes in 2009 and 2010. Otherimportant contributors to the total catch in the area are the largehead hairtail,considered overeploited, and the Alasa polloc and chub macerel, both consideredully eploited. Suids, cuttleish and octopuses are important species, yielding1.3 million tonnes in 2010.
The Eastern Central Paciic has shown a typical oscillating pattern in its total catchsince 1980 and produced about 2 million tonnes in 2010. The Southeast Paciic has hada large interannual variation with a generally declining trend since 1993. There havebeen no major changes in the state o eploitation o stocs in these two areas, which
are characterized by a large proportion o small pelagic species and great luctuationsin catches. The most abundant species in the Southeast Paciic are the anchoveta, theChilean jac macerel and the South American pilchard or sardine (Sardinops sagax ),accounting or more than 80 percent o the current and historical catches, while in theEastern Central Paciic the most abundant species are Caliornia pilchard and Paciicanchoveta. A moderate El Niño developed in 2009 and continued throughout theeuatorial Paciic in the irst ew months o 2010. Deep tropical convection remainedenhanced across central and eastern parts o the tropical Paciic with relatively mildimpacts reported on the state o stocs and isheries in the eastern Paciic.
For the Eastern Central Atlantic, total catches, which have luctuated since the1970s, were about 4 million tonnes in 2010, about the same as the 2001 pea. Thesmall pelagic species constitute almost 50 percent o the landings, ollowed by
“miscellaneous coastal ishes”. The single most important species in terms o landingsis sardine (Sardina pilchardus) with landings in the range o 600 000–900 000 tonnesin the last ten years. The sardine in Zone C (Cape Bojador and southwards to Senegal)is still considered non-ully eploited; otherwise, most o the pelagic stocs areconsidered ully eploited or overeploited, such as the sardinella stocs in NorthwestArica and in the Gul o Guinea. The demersal ish resources are to a large etentully eploited to overeploited in most o the area, and the white grouper stoc(Epinephelus aenus) in Senegal and Mauritania remains in a severe condition. Thestatus o some o the deepwater shrimp stocs seems to have improved and they arenow considered ully eploited, whereas the other shrimp stocs in the region rangebetween ully eploited and overeploited. The commercially important octopus(Octopus vulgaris) and cuttleish (Sepia spp.) stocs remain overeploited. Overall, theEastern Central Atlantic has 43 percent o its assessed stocs ully eploited, 53 percent
overeploited and 4 percent non-ully eploited, a situation warranting attention orimprovement in management.
In the Southwest Atlantic, total catches have luctuated around 2 million tonnesater a period o increasing catches ended in the mid-1980s. Major species suchas Argentina hae and Brazilian sardinella are still estimated to be overeploited,although there seem to be some signs o recovery or the latter. The catch o Argentinashortin suid was only one-ourth o its pea level in 2009 and considered ullyeploited to overeploited. In this area, 50 percent o the monitored ish stocs wereovereploited, 41 percent ully eploited and the remaining 9 percent considered non-ully eploited.
The Northeast Paciic produced 2.4 million tonnes o ish in 2010, similar to theproduction level in the early 1970s, although more than 3 million tonnes was seen
in the late 1980s. Cods, haes and haddocs are the largest contributors to its catch.

7/28/2019 The State of World Fisheries and Aquaculture_2012
http://slidepdf.com/reader/full/the-state-of-world-fisheries-and-aquaculture2012 76/230
The State o World Fisheries and Aquaculture 201258
In this area, only 10 percent o ish stocs were estimated to be overeploited, with80 percent ully eploited, and another 10 percent non-ully eploited.
In the Northeast Atlantic, total catch appeared to have a decreasing trend ater1975, with a recovery in the 1990s, and was 8.7 million tonnes in 2010. The blue whitingstoc decreased rapidly rom the pea o 2.4 million tonnes in 2004 to only 0.6 milliontonnes in 2009. Fishing mortality has been reduced in cod, sole and plaice, withrecovery plans in place or the major stocs o these species. The Arctic cod spawningstoc was particularly large in 2008, having recovered rom the low levels observed inthe 1960s–1980s. Similarly, the Arctic saithe and haddoc stocs have increased to highlevels, although stocs elsewhere remain ully eploited or overeploited. The largestsand eel and capelin stocs remain overeploited. Concern remains or redishes anddeep-water species or which data are limited and which are liely to be vulnerableto overishing. Northern shrimp and Norway lobster are generally in good condition,but there are indications that some stocs are being overeploited. Recently, maimumsustainable yield has been adopted as the standard basis or reerence points. Overall,62 percent o assessed stocs are ully eploited, 31 percent overeploited, and7 percent non-ully eploited.
Although ishery resources in the Northwest Atlantic continue to be under stressrom previous and/or current eploitation, some stocs have recently shown signso renewal in response to an improved management regime in the last decade (e.g.Greenland halibut, yellowtail lounder, Atlantic halibut, haddoc, spiny dogish).However, some historical isheries such as cod, witch lounder and redish still evidencelac o recovery, or limited recovery, which may be the result o unavourableoceanographic conditions and the high natural morality caused by increasing numberso seals, macerel and herring. These actors appear to have aected ish growth,reproduction and survival. Conversely, invertebrates remain at near record levels oabundance. The Northwest Atlantic has 77 percent o stocs ully eploited, 17 percentovereploited and 6 percent non-ully eploited.
The Southeast Atlantic is a typical eample o the group o areas that has
demonstrated a generally decreasing trend in catches since the early 1970s. This areaproduced 3.3 million tonnes in the late 1970, but only 1.2 million tonnes were recordedin 2009. The important hae resources remain ully eploited to overeploited althoughthere are signs o some recovery in the deepwater hae stoc (Merluccius paradoxus)o South Arica and o the shallow-water Cape hae (Merluccius capensis) o Namibia,as a conseuence o good recruitment years and o the strict management measuresintroduced since 2006. A signiicant change concerns the Southern Arican pilchard,which was at a very high biomass and estimated to be ully eploited in 2004, butwhich now, under unavourable environmental conditions, has declined considerablyin abundance and is now ully eploited or overeploited. In contrast, Southern Aricananchovy has continued to improve and its status was estimated to be ully eploitedin 2009. Whitehead’s round herring has not been ully eploited. The condition oCunene horse macerel has deteriorated, particularly o Namibia and Angola, and it
was overeploited in 2009. The condition o the perlemoen abalone stoc continues tobe worrying, eploited heavily by illegal ishing, and it is currently overeploited andprobably depleted.
The Mediterranean has maintained an overall stable catch in a diicult situation inrecent years. All hae (Merluccius merluccius) and red mullet (Mullus barbatus) stocsare considered overeploited, as are probably also the main stocs o sole and mostseabreams. The main stocs o small pelagic ish (sardine and anchovy) are assessedas either ully eploited or overeploited. A newly identiied threat is the increasingpenetration o eotic Red Sea species, which in some cases seem to be replacingnative species, especially in the Eastern Mediterranean. In the Blac Sea, the situationo small pelagic ish (mainly sprat and anchovy) has recovered somewhat rom thedrastic decline suered in the 1990s, probably as a conseuence o unavourable
oceanographic conditions, but they are still considered ully eploited to overeploited,an assessment shared with turbot, while most other stocs are probably ully eploited

7/28/2019 The State of World Fisheries and Aquaculture_2012
http://slidepdf.com/reader/full/the-state-of-world-fisheries-and-aquaculture2012 77/230
World review o fsheries and aquaculture 59
to overeploited. In general, the Mediterranean and Blac Sea had 33 percent oassessed stocs ully eploited, 50 percent overeploited, and the remaining 17 percentnon-ully eploited in 2009.
Total production in the Western Central Paciic grew continuously to a maimumo 11.7 million tonnes in 2010. This area contributes about 14 percent o the globalmarine production. Despite this catch trend, there are reasons or concern as regards thestate o the resources, with most stocs being either ully eploited or overeploited,particularly in the western part o the South China Sea. The high catches have probablybeen maintained through epansion o the isheries to new areas and possible doublecounting in the transshipment o catches between ishing areas, which leads to bias inestimates o production, potentially masing negative trends in stoc status.
The Eastern Indian Ocean (Fishing Area 57) is still eperiencing a high growthrate in catches, with a 17 percent increase rom 2007 to 2010, and now totalling7 million tonnes. The Bay o Bengal and Andaman Sea regions have seen total catchesincrease steadily and there are no signs o the catch levelling o. However, a veryhigh percentage (about 42 percent) o the catches in this area are attributed to thecategory “marine ishes not identiied”, which is a cause o concern as regards the
need or monitoring stoc status and trends. Increased catches may in act be due tothe epansion o ishing to new areas or species. Declining catches in the isherieswithin Australia’s EEZ can be partly eplained by a reduction in eort and in catchesollowing a structural adjustment and a ministerial direction in 2005 aimed at ceasingoverishing and allowing overished stocs to rebuild. The economics o ishing in thisarea are epected to improve in the medium and long term, but higher proits can alsobe epected or individual ishers in the short term because ewer vessels are operating.
In the Western Indian Ocean, total landings reached a pea o 4.5 million tonnes in2006, but have declined slightly since, and 4.3 million tonnes were reported in 2010. Arecent assessment has shown that narrow-barred Spanish macerel (Scomberomerus
commerson), a migratory species ound in the Red Sea, Arabian Sea, Gul o Oman,Persian Gul, and o the coast along Paistan and India, is overeploited. Catch data
in this area are oten not detailed enough or stoc assessment purposes. However,the Southwest Indian Ocean Fisheries Commission conducted stoc assessments or140 species in its mandatory area in 2010 based on best-available data and inormation.Overall, 65 percent o ish stocs were estimated to be ully eploited, 29 percentovereploited, and 6 percent non-ully eploited in 2009.
The declining global catch over the last ew years together with the increasedpercentage o overeploited ish stocs and the decreased proportion o non-ullyeploited species around the world convey a strong message – the state o worldmarine isheries is worsening and has had a negative impact on ishery production.Overeploitation not only causes negative ecological conseuences, but it also reducesish production, which urther leads to negative social and economic conseuences. Toincrease the contribution o marine isheries to the ood security, economies and well-being o the coastal communities, eective management plans must be put in place to
rebuild overeploited stocs. The situation seems more critical or some highly migratory,straddling and other ishery resources that are eploited solely or partially in the highseas. The United Nations Fish Stocs Agreement that entered into orce in 2001 should beused as a legal basis or management measures o the high seas isheries.
In spite o the worrisome global situation o marine capture isheries, good progressis being made in reducing eploitation rates and restoring overeploited ish stocsand marine ecosystems through eective management actions in some areas. In theUnited States o America, the Magnuson–Stevens Act and subseuent amendmentshave created a mandate to put overished stocs into restoration; 67 percent o allstocs are now being sustainably harvested, while only 17 percent are still beingovereploited. In New Zealand, 69 percent o stocs are above management targets,relecting mandatory rebuilding plans or all isheries that are still below target
thresholds. Similarly, Australia reports overishing or only 12 percent o stocs in2009.9 Since the 1990s, the Newoundland–Labrador Shel, the Northeast United

7/28/2019 The State of World Fisheries and Aquaculture_2012
http://slidepdf.com/reader/full/the-state-of-world-fisheries-and-aquaculture2012 78/230
The State o World Fisheries and Aquaculture 201260
Bo 4
Developing an assessment strategy or inland ishery resources
An accurate assessment o inland ishery resources must tae into account
the numerous aspects and drivers that inluence the health o inland
auatic ecosystems and the status o inland ishery resources. Given the
multiple uses o reshwater, it is recognized that an assessment o inland
ishery resources should be based on more than just the amount o
catch and the eort applied. The assessment should determine whether
or not the management goals or the ishery or waterbody are being
met. In general, the goals o responsible inland isheries include an
environmental component, e.g. production and protection o biodiversity,
and a social and economic component, e.g. poverty reduction, income
generation, and cultural heritage. Thus, rather than a single dimensional
plot o status o eploitation rate, inland isheries could be plotted onmultidimensional aes that eamine environmental and production
parameters in the light o social and economic parameters. In the
accompanying igure, speciic inland capture isheries ( ) are assigned
to a given uadrant (A, B, C or D) depending on how they perorm
according to environmental and production parameters (y-ais) and
social and economic parameters (-ais). Fisheries in uadrant B would be
perorming well on both environmental/production and social/economic
criteria, whereas isheries in uadrant C would be perorming poorly.
Individual isheries could be traced over time to determine how the
state o the ishery was changing and whether changes to management
are indicated. For eample, a highly productive ishery that provided very
little economic value would be placed in uadrant A; a very lucrativerecreational ishery that ocused on a ew high-value species that were
stoced rom auaculture acilities would be placed in D.
A B
C D
Social and economic index
E n v i r o n m e n t a l a n d p r o d
u c t i o n i n d e x
Conceptual diagram of assessment of the status of inland capture fisheries

7/28/2019 The State of World Fisheries and Aquaculture_2012
http://slidepdf.com/reader/full/the-state-of-world-fisheries-and-aquaculture2012 79/230
World review o fsheries and aquaculture 61
For such an assessment, it will be necessary to develop appropriate
indicators (i.e. data reuirements) in order to create indices that can be
epressed in a simple and eective graph. The objective would be to
eamine the services provided by inland isheries over time to assess whether
or not the ishery was perorming as desired. The services provided by
inland isheries are similar to the ecosystem services provided by inland
water ecosystems (see accompanying table). Speciic services provided by
inland capture isheries could also be seen as management objectives. It is
not epected that indices would be developed to encompass the complete
range o services provided by inland capture isheries. Additional wor will
be needed to prioritize data reuirements and develop indicators that are
inormative, practical and cost-eective.
ecm ic pi b ia capu fihi
ecm ic p spcific ic pi b ia capu fihi
Piiig Food provision – etraction o auatic organisms orhuman consumption and nutritionLivelihood provision – contribution to employment andincome, including recreational and ornamental isheriesAuaculture seed provision – inputs to auaculture orgrow-out
Cuua a ciific Cultural heritage and identity – value associated withreshwater isheries themselvesRecreational isheries – the non-commercial perspectiveCognitive values – education and research resultingrom the isheriesCatch composition and species as bio-indicators ohealth o ecosystem
rguai Regulation o ood web dynamicsNutrient transport and cyclingControl o pest organisms
supp Maintenance o genetic, species and ecosystembiodiversity
Resilience and resistance – lie support by thereshwater environment and its response to pressures,including maintenance o ecosystem balance
The speciic data reuirements, indicators and indices or this assessment
have not yet been established. However, together with partners and resource
managers, FAO will wor on reining the model and test its applicability in
selected inland isheries around the world.

7/28/2019 The State of World Fisheries and Aquaculture_2012
http://slidepdf.com/reader/full/the-state-of-world-fisheries-and-aquaculture2012 80/230
The State o World Fisheries and Aquaculture 201262
States Shel, the Southern Australian Shel, and Caliornia Current ecosystems haveshown substantial declines in ishing pressure such that they are now at or below themodelled eploitation rate that gives the multispecies maimum sustainable yield othe ecosystem.10 It is critically important to understand the ey elements o these andother successes and apply them well to other isheries.
Ia fihiThe diiculty in assessing the state o inland capture isheries has been noted in pasteditions o The State o World Fisheries and Auaculture as well as by those woringon the active management and development o inland ishery resources.11 Reasons orthe lac o adeuate assessments include:• the diuse nature o the sector, with numerous landing sites and methods o
ishing;• the large number o people involved and the seasonality o ishing eort;• the subsistence nature o many small-scale inland isheries;• the act that catch is oten consumed or traded locally without entering the ormal
maret chain;
• a lac o capacity and resources to collect adeuate data;• activities not associated with inland ishing can greatly inluence the abundance
o inland ishery resources, e.g. stocing rom auaculture, water diversion oragriculture and hydroelectric development.The inormative and widely cited data summarizing the state o the major marine
ish stocs are virtually impossible to duplicate or the state o the world’s inlandisheries. The primary reason or this is that whereas eploitation rate is the maindriver aecting the state o the major marine stocs that comprise the igure, otherdrivers aect the status o inland ishery resources to a much greater etent. 12 Driversassociated with habitat uantity and uality, including auaculture in the ormo stocing and competition or reshwater, inluence the state o the majority oinland ishery resources much more than eploitation rates do. Water abstraction and
diversion, hydroelectric development, draining wetlands, and siltation and erosionrom land-use patterns can negatively aect inland ishery resources regardless othe rate o eploitation. Conversely, stoc enhancement rom auaculture acilities,which is widely practised in inland waters, can eep catch rates high in the ace oincreased ishing and in spite o an ecosystem that is not capable o producing thatlevel o catch through natural processes. Overeploitation can also aect inlandishery resources, but the result is generally a change in species composition andnot necessarily a reduced overall catch. Catches are oten higher where smaller andshorter-lived species become the main component o the catch; however, the smallerish may be much less valuable.
Another issue complicating the assessment o inland ishery resources is thedeinition o a “stoc”. The major marine ish stocs are well deined biologicallyand geographically, and comprise management units. Very ew inland isheries have
stocs that are deined as precisely or are deined at the level o species. There arenotable eceptions, e.g. Lae Victoria Nile perch and Tonle Sap dai isheries, butmany inland ishery stocs are deined by watershed or river and comprise numerousspecies.
Nonetheless, it is vitally important that an accurate assessment be made o thoseinland ishery resources that are o major importance. The Twenty-eighth Session oCOFI observed that data and statistics on small-scale isheries, especially in inlandwaters, were not always comprehensive, resulting in underestimating their economic,social and nutritional beneits and contribution to livelihoods and ood security.13 FAO convened a worshop in late 2011 to develop a strategy to undertae such anassessment14 (Bo 4). The intention is to utilize the new methodology to provide amore robust and inormative summary o the state o the world’s inland capture
ishery resources or uture editions o The State o World Fisheries and Aquaculture.

7/28/2019 The State of World Fisheries and Aquaculture_2012
http://slidepdf.com/reader/full/the-state-of-world-fisheries-and-aquaculture2012 81/230

7/28/2019 The State of World Fisheries and Aquaculture_2012
http://slidepdf.com/reader/full/the-state-of-world-fisheries-and-aquaculture2012 82/230
The State o World Fisheries and Aquaculture 201264
canned orms represents more than two-thirds o ish used or human consumption.Arica has a higher proportion o cured ish (14 percent o total production) than theworld average. In Arica, but also signiicantly in Asia, a large amount o productionis commercialized in live or resh orms. Live ish is particularly appreciated in Asia
(especially by the Chinese population) and in niche marets in other countries, mainlyamong immigrant Asian communities. Commercialization o live ish has grownin recent years as a result o technological developments, improved logistics andincreased demand. An elaborate networ o handling, transport, distribution, displayand holding acilities has been developed to support the mareting o live ish. Newtechnological systems include specially designed or modiied tans and containers,as well as trucs and other transport vehicles euipped with aeration or oygenationacilities to eep ish alive during transportation or holding and display. Nevertheless,mareting and transportation o live ish can be challenging as they are oten subjectto stringent health regulations and uality standards. In some parts o Southeast Asia,their commercialization and trade are not ormally regulated but based on tradition.However, in marets such as the European Union, live ish have to comply withreuirements, inter alia, concerning animal welare during transportation.
Not only live ish, but, as mentioned above, ish and ishery products must behandled and transported by highly eicient distribution channels that can ensurethat the integrity o the produce is maintained. Improvements in pacaging helpin preserving the uality o products. In the last ew decades, major innovations inrerigeration, ice-maing and transportation have also allowed the distribution o ishin resh and other orms. As a result, developing countries have eperienced a growthin the share o rozen products (24.1 percent o the total ish or human consumptionin 2010, up rom 18.9 percent in 2000) and o prepared or preserved orms(11.0 percent in 2010, compared with 7.8 percent in 2000). However, notwithstandingthe technical advances and innovations, many countries, especially less-developedeconomies, still lac adeuate inrastructure and services including hygienic landingcentres, electric power supply, potable water, roads, ice, ice plants, cold rooms and
rerigerated transport. These actors, associated with tropical temperatures, result ina high proportion o post-harvest losses and uality deterioration, with subseuent
Bo 5
The wor o the Code Alimentarius Commission
The Code Alimentarius Commission (CAC) develops Standards, Codes o
Practice, and Guidelines in the area o ood saety and air practices in
trade. The Standards speciy the characteristics o ood products, while
the Codes o Practice identiy the procedures that national competent
authorities and operators in the ood chain need to ollow in order to
reach those Standards. The Guidelines identiy steps that need to be
taen to protect consumers’ health rom certain speciic ood hazards.
Standards, Codes o Practice and Guidelines are continuously updated,
and new sections are added as reuired.
Recent wor by the CAC has led to: (i) adoption o Standards or
live and raw bivalve molluscs and ish sauce; (ii) updating o the Code
o Practice or Fish and Fishery Products with sections on live and rawbivalve molluscs and smoed ish; and (iii) adoption o Guidelines on
the Application o General Principles o Food Hygiene to the Control o
Pathogenic Vibrio Species in Seaood.

7/28/2019 The State of World Fisheries and Aquaculture_2012
http://slidepdf.com/reader/full/the-state-of-world-fisheries-and-aquaculture2012 83/230
World review o fsheries and aquaculture 65
ris to the health o consumers. In addition, mareting o ish is also more diicultowing to oten limited and congested maret inrastructure and acilities. Owing tothese deiciencies, together with well-established consumer habits, ish in developingcountries is commercialized mainly in live or resh orm (representing 56.0 percento ish destined or human consumption in 2010) soon ater landing or harvesting.Cured orms (dried, smoed or ermented) still remain a traditional method to retailand consume ish in developing countries, even i their share in total ish or humanconsumption is declining (10.9 percent in 2000 compared with 8.9 percent in 2010).In developed countries, the bul o production destined to human consumption iscommercialized rozen or in prepared or preserved orms. The proportion o rozenish has been growing in the last our decades: it represented 33.2 percent o totalproduction or human consumption in 1970, increased to 44.8 percent in 1990, to49.8 percent in 2000, and reached a record high at 52.1 percent in 2010. The share oprepared and preserved orms remained rather stable during the same period and itwas 26.9 percent in 2010 (Figure 20).
Fishmeal is the crude lour obtained ater milling and drying ish or ish parts,and it is produced rom whole ish, ish remains or other ish by-products resulting
rom processing. Many dierent species are used or ishmeal and ish-oil production.However, small pelagics, in particular anchoveta, are the main groups o species usedor reduction, and the volume o ishmeal and ish oil produced worldwide annuallyluctuates according to the luctuations in the catches o these species. The El Niñophenomenon has considerable eects on catches o anchoveta, which has eperienceda series o peas and drastic drops in the last ew decades, going rom 12.5 milliontonnes in 1994 to 4.2 million tonnes in 2010. Fishmeal production peaed in 1994 at30.2 million tonnes (live weight euivalent) and has ollowed a luctuating trend sincethen. In 2010, it dropped to 15.0 million tonnes owing to reduced catches o anchoveta,representing a 12.9 percent decrease compared with 2009, o 18.2 percent comparedwith 2008 and o 42.8 percent with respect to 2000. Another important source o rawmaterial or the production o ishmeal is the processing waste rom commercial ish
species used or human consumption. Growing value addition in ishery products orhuman consumption leads to more residues, which in the past very oten were simplydiscarded. Nowadays, more and more waste is used in eed marets, and a growingpercentage o ishmeal is being obtained rom trimmings and other residues rom thepreparation o ish illets. According to recent estimates, about 36 percent o worldishmeal production was obtained rom oal in 2010.
0 10 20 30 40 50 60 70
Developed countries
Developing countries
Figure 20
Utilization of world fisheries production (breakdown by quantity), 2010
Live, fresh or chilled
Frozen
Prepared or preserved
Cured
Non-food purposes
Million tonnes (live weight)

7/28/2019 The State of World Fisheries and Aquaculture_2012
http://slidepdf.com/reader/full/the-state-of-world-fisheries-and-aquaculture2012 84/230
The State o World Fisheries and Aquaculture 201266
In the past, ishery by-products, including waste, were considered to be o lowvalue, or as a problem to be disposed o in the most convenient way or discarded. Inthe last two decades, there has been a global trend o growing awareness about theeconomic, social and environmental aspects o optimal use o ishery by-products,and o the importance o reducing discards and losses in post-harvesting phases(storage, processing and distribution). The utilization o ish by-products has becomean important industry in various countries, with a growing ocus on handling by-products in a controlled, sae and hygienic way. Improved processing technologieshave also helped in their utilization. In addition to the ishmeal industry, isheriesby-products are also utilized or a wide range o other purposes, including theproduction o cosmetics and pharmaceuticals, other industrial processes, as directeeding or auaculture and livestoc, incorporation into pet eed or eed oranimals ept or ur production, ensiling, ertilizer and landill. Technologies suchas microencapsulation and nanoencapsulation are acilitating incorporation oimportant nutrients such as ish oils into various other oods. These technologiesenable the etension o shel-lie, and provide a taste proile barrier eliminatingish-oil taste and odour while improving the nutritional availability. Chitin and
chitosan obtained rom shrimp and crab shells have a variety o uses, such as inwater treatments, cosmetics and toiletries, ood and beverages, agrochemicalsand pharmaceuticals. From crustacean wastes, also the pigments carotenoids andastaanthins can be etracted or use in the pharmaceutical industry, and collagencan be etracted rom ish sin, ins and other processing discards. Fish silage and ishprotein hydrolysates obtained rom ish viscera are inding applications in the pet-eed and ish-eed industries. Calcium carbonate or industrial use can be obtainedrom mussel shells. In some countries, oyster shells are used as a raw material inthe construction o buildings and or the production o uiclime (calcium oide).Small ish bones, with a minimum amount o meat, are also consumed as snacsin some Asian countries. A number o anticancer agents have been discoveredollowing research on marine sponges, bryozoans and cnidarians. However, ollowing
their discovery, or reasons o conservation, these agents are not etracted rommarine organisms directly but are chemically synthesized. Another approach beingresearched is auaculture o some sponge species. Fish sin, in particular o largerish, is eploited to obtain gelatin as well as leather to be used in clothing, shoes,handbags, wallets, belts and other items. Species commonly used or leather includeshar, salmon, ling, cod, hagish, tilapia, Nile perch, carp and seabass. Shar cartilageis utilized in many pharmaceutical preparations and reduced in powder, creamsand capsules, as are other parts o shars, e.g. ovaries, brain, sin and stomach. Inaddition, shar teeth are used in handicrats; similarly, the shells o scallops andmussels can be used in handicrats and jewellery, and or maing buttons. Proceduresor the industrial preparation o biouel rom ish waste as well as rom seaweeds arebeing developed.
Great technological development in ood processing and pacaging is in progress,
with increases in eicient, eective and lucrative utilization o raw materials, andinnovation in product dierentiation or human consumption as well as or theproduction o ishmeal and ish oil. Processors o traditional products have beenlosing maret share as a result o long-term shits in consumer preerences as wellas in processing and in the general isheries industry. The ish industry is dynamic bynature and, in the last two decades, the utilization and processing o ish productionhave diversiied signiicantly, uelled by changing consumer tastes and advances intechnology, pacaging, logistics and transport. In developed countries, innovation invalue addition is converging on convenience oods and a wider range o high-value-added products, mainly in resh, rozen, breaded, smoed or canned orms to bemareted as ready and/or portion-controlled, uniorm-uality meals. These reuiresophisticated production euipment and methods and, hence, access to capital.
Supported by cheaper labour, in developing countries, processing is still done throughless sophisticated methods o transormation, such as illeting, salting, canning, drying

7/28/2019 The State of World Fisheries and Aquaculture_2012
http://slidepdf.com/reader/full/the-state-of-world-fisheries-and-aquaculture2012 85/230
World review o fsheries and aquaculture 67
and ermentation. These traditional labour-intensive, ish-processing methods providelivelihood support to large numbers o people in coastal areas in many developingcountries, and they will probably remain important components in rural economiesstructured to promote rural development and poverty alleviation. However, in thelast decade, ish processing has been evolving also in many developing countries,with increased ish processing. This may range rom simple gutting, heading or slicingto more advanced value addition, such as breading, cooing and individual uic-reezing, depending on the commodity and maret value. Some o these developmentsare driven by demand in the domestic retail industry, by a shit in cultured species,by outsourcing o processing and by the act that producers in developing countriesare increasingly being lined with, and coordinated by, irms located abroad.Supermaret chains and large retailers are also emerging as important players insetting reuirements or the products they buy. Processing is becoming more intensive,geographically concentrated, vertically integrated and lined with global supplychains. These changes relect the increasing globalization o the isheries value chain,with large retailers controlling the growth o international distribution channels. Theincreasing practice o outsourcing processing at the regional and world levels is very
signiicant, its etent depending on the species, product orm, and cost o labour andtransportation. For eample, in Europe, smoed and marinated products, or whichshel-lie and transportation time are important, are being processed in Central andEastern Europe, in particular in Poland and in the Baltic States. Whole rozen ish romEuropean and North American marets are sent to Asia (China in particular, but alsoIndia and Viet Nam) or illeting and pacaging, and then re-imported. The urtheroutsourcing o production to developing countries might be restricted by sanitary andhygiene reuirements that are diicult to meet as well as by growing labour costs.
At the same time, processors are reuently becoming more integrated with producers,especially or groundish, where large processors in Asia, in part, rely on their own leeto ishing vessels. In auaculture, large producers o armed salmon, catish and shrimphave established advanced centralized processing plants to enhance the product mi,
obtain better yields and respond to evolving uality and saety reuirements in importingcountries. Processors that operate without the purchasing or sourcing power o strongbrands are also eperiencing increasing problems lined to the scarcity o domestic rawmaterial, and they are being orced to import ish or their business.
FIsH trAde And CoMModItIes
Fish and ishery products are among the most traded ood commodities worldwide.Trade plays a major role in the ishery industry as a creator o employment, oodsupplier, income generator, and contributor to economic growth and development. Formany countries and or numerous coastal, riverine, insular and inland regions, isheryeports are essential to the economy. For eample, in 2010 they accounted or morethan hal o the total value o traded commodities in Greenland, Seychelles, FaeroeIslands and Vanuatu. In the same year, ishery trade represented about 10 percent
o total agricultural eports (ecluding orest products) and 1 percent o worldmerchandise trade in value terms.
A signiicant share o total ishery production is eported in the orm o variousood and eed items. This share increased rom 25 percent in 1976 to about 38 percent(57 million tonnes in 2010 (Figure 21), relecting the sector’s growing degree oopenness to, and integration in, international trade. Sustained demand, tradeliberalization policies, globalization o ood systems and technological innovations haveurthered the overall increase in international ish trade. Improvements in processing,pacaging and transportation as well as changes in distribution and mareting havesigniicantly changed the way ishery products are prepared, mareted and deliveredto consumers. All these actors have acilitated and increased the movement oproduction in relative terms rom local consumption to international marets. The
ishery supply chain is comple as goods might cross national boundaries severaltimes beore inal consumption, also owing to increasing outsourcing o processing to

7/28/2019 The State of World Fisheries and Aquaculture_2012
http://slidepdf.com/reader/full/the-state-of-world-fisheries-and-aquaculture2012 86/230
The State o World Fisheries and Aquaculture 201268
countries where comparatively low wages and production costs provide a competitiveadvantage, as indicated above in the Fish Utilization and Processing section.
In the period 1976–2008, world trade in ish and ishery products grew signiicantlyalso in value terms, rising rom US$8 billion to US$102 billion, with annual growthrates o 8.3 percent in nominal terms and o 3.9 percent in real terms. In 2009, as aconseuence o the general economic contraction aecting consumer conidence inmajor marets, trade dropped by 6 percent compared with 2008. The decline was onlyin value terms as a conseuence o alling prices and margins, whereas traded volumes,epressed in live weight euivalent, increased by 1 percent to 55.7 million tonnes. Thedecrease was not uniorm and, in particular, many developing countries eperiencedrising demand and imports even during a diicult 2009. In 2010, trade reboundedstrongly, reaching about US$109 billion, with an increase o 13 percent in value termsand 2 percent in volume compared with 2009. The dierence between the growth invalue and volume relects the higher ish prices eperienced during 2010 as well as adecrease in the production o and trade in ishmeal.
In 2011, despite the economic instability eperienced in many o the world’s leadingeconomies, increasing prices and strong demand in developing countries pushed trade
volumes and values to the highest level ever reported and, despite some soteningin the second hal o the year, preliminary estimates indicate that eports eceededUS$125 billion. It is worth noting that currency luctuations inluence not only sales andmarets, but also trade statistics; or statistics stated in US dollars, a weaening dollarwill inlate both import and eport igures.
Fishery trade is closely tied to the overall economic situation. In the last ew years,world trade has been hit by a series o economic, inancial and ood crises. Ater the12 percent drop eperienced in 2009, world trade recovered strongly in 2010 and,according to the World Trade Organization (WTO), merchandise eports increasedby 14.5 percent, sustained by a 3.6 percent growth in global output as measured bygross domestic product.15 In 2010, economic conditions rebounded in both developedand developing economies, but the resurgence o both trade and output was slower
in developed countries. The World Ban estimates that the volume o global trade(merchandise and services) increased by a urther 6.6 percent in 2011.16 However,perormance across the year was not uniorm. Since late 2011 and early 2012, theworld economy has entered a diicult phase characterized by signiicant downsideriss and ragility, with great uncertainty on how marets will evolve in the medium
0
30
60
90
120
150
8076 78 82 84 86 88 90 92 94 96 98 00 02 04 06 08 10
Figure 21
World fisheries production and quantities destined for export
Million tonnes (live weight)
Production
Export

7/28/2019 The State of World Fisheries and Aquaculture_2012
http://slidepdf.com/reader/full/the-state-of-world-fisheries-and-aquaculture2012 87/230
World review o fsheries and aquaculture 69
term. The inancial turmoil generated by the intensiication o the iscal crisis in Europehas epanded to both developing and high-income countries. As a result, and despiterelatively strong activity in the United States o America and Japan, ey marets orisheries trade, global growth and world trade have slowed sharply. In addition, amongother riss, there is the possibility that geopolitical and domestic political tensionscould disrupt oil supplies, which could have an impact on increasing costs o captureisheries as well. Thereore, according to the World Ban, the global economy is nowepected to epand by 2.5 percent in 2012 and by 3.1 percent in 2013. The growth rateor high-income countries should be 1.4 percent in 2012 and 2.0 percent in 2013, whilegrowth or developing countries is projected at 5.4 percent and 6.0 percent in 2012and 2013, respectively. Relecting this slowdown, world trade is epected to epand by4.7 percent in 2012, beore strengthening to 6.8 percent in 2013. Despite the renewedeconomic instability, ish trade has epanded in ey marets in the irst ew months o2012, and the long-term trend or ish trade remains positive, with a growing share oish production entering international marets.
Among the actors that might inluence the sustainability and growth o ishery tradeare the evolution o production and transportation costs and the prices o ishery products
and alternative commodities, including meat and eeds. As is the case or other products,ish prices are inluenced by demand and supply actors. At the same time, the veryheterogeneous nature o the sector, with hundreds o species and thousands o productsentering international trade, maes it challenging to estimate price developments orthe sector as a whole. In the last ew decades, the growth in auaculture production hascontributed signiicantly to increased consumption and commercialization o species thatwere once primarily wild-caught, with a conseuent price decrease. This was particularlyevident in the 1990s and early 2000 (Figure 22), with average unit values o auacultureproduction and trade in real terms regularly declining. Subseuently, owing to increasedcosts and continuous high demand, prices have started to rise again. In the net decade,with auaculture accounting or a much larger share o total ish supply, the price swingso auaculture products could have a signiicant impact on price ormation in the sector
overall, possibly leading to more volatility.Similar to trade, also ish prices contracted in 2009 but have since rebounded.Fish prices rose strongly in the irst part o 2011, declining slightly towards the endo the year and into early 2012, but remaining higher than levels o earlier years.Rising energy and eed costs will probably eep ish prices high in 2012, especially
0
1
2
3
Figure 22
Average fish prices in real terms (2005)
US$/kg
90 92 94 96 98 00 02 04 06 08 10
Trade
Aquaculture
Fishmeal
Fish oil

7/28/2019 The State of World Fisheries and Aquaculture_2012
http://slidepdf.com/reader/full/the-state-of-world-fisheries-and-aquaculture2012 88/230
The State o World Fisheries and Aquaculture 201270
as alternative protein sources such as meat are inluenced by the same actors. Since2009, FAO has been woring on the construction and enhancement o a ish priceinde to illustrate both relative and absolute price movements. The inde is beingdeveloped in cooperation with the University o Stavanger and with data support romthe Norwegian Seaood Council. The FAO Fish Price Inde (base year 2002–04 = 100)indicates that average prices in 2009 declined by 7 percent compared with 2008, thenincreased by 9 percent in 2010 and by more than 12 percent in 2011. The absolutepea in the inde was reached in August 2011 at 158.3 (14 percent more than inAugust 2010). Prices or species rom capture isheries increased by more than those orarmed species because o the larger impact rom higher energy prices on ishing vesseloperations than on armed species.
Trade in ish and ishery products is characterized by a wide range o producttypes and participants. In 2010, 197 countries reported eports o ish and isheryproducts. The role o ishery trade varies among countries and is important or manyeconomies, in particular or developing nations. Table 12 shows the top ten eportersand importers o ish and ishery products in 2000 and 2010. Since 2002, China hasbeen by ar the leading ish eporter, contributing almost 12 percent o 2010 world
eports o ish and ishery products, or about US$13.3 billion, and increasing urtherto US$17.1 billion in 2011. China’s ishery eports have grown considerably since the1990s, although at present they represent only 1 percent o its total merchandiseeports. A growing share o ishery eports consists o reprocessed imported rawmaterial. Thailand has established itsel as a processing centre o ecellence largelydependent on imported raw material, while Viet Nam has a growing domestic resourcebase and imports only limited, albeit growing, volumes o raw material. Viet Namhas eperienced signiicant growth in its eports o ish and ish products, up romUS$1.5 billion in 2000 to US$5.1 billion in 2010, when it became the ourth-largesteporter in the world. In 2011, its eports rose urther to US$6.2 billion. Its risingeports are lined to its lourishing auaculture industry, in particular to the productiono Pangasius and o both marine and reshwater shrimps and prawns.
In addition to China, Thailand and Viet Nam, many other developing countriesplay a major role in global isheries. In 2010, developing countries conirmed theirundamental importance as suppliers to world marets with more than 50 percent o allishery eports in value terms and o more than 60 percent in uantity (live weight). Formany developing nations, ish trade represents a signiicant source o oreign currencyearnings in addition to the sector’s important role as a generator o income, sourceo employment, and provider o ood security and nutrition. The ishery industries odeveloping countries rely heavily on developed countries, not only as outlets or theireports, but also as suppliers o their imports or local consumption (mainly low-pricedsmall pelagics as well as high-value ishery species or emerging economies) or ortheir processing industries. In 2010, in value terms, 67 percent o the ishery eports odeveloping countries were directed to developed countries. A growing share o theseeports consisted o processed ishery products prepared rom imports o raw ish to
be used or urther processing and re-eport. In 2010, in value terms, 39 percent o theimports o ish and ishery products by developing countries originated rom developedcountries. Developing countries cover an important segment o world eports onon-ood ish eports (74 percent in 2010 in terms o uantity). Fishmeal represents asigniicant share o their eports (35 percent by uantity, but only 5 percent by valuein 2010). However, developing countries have also considerably increased their share othe uantity o world ish eports destined or human consumption, rom 32 percentin 1980 to 47 percent in 2000 and to 56 percent in 2010. Net eports o ish and ishproducts (i.e. the total value o ish eports less the total value o ish imports) areparticularly important or developing countries, being higher than those o severalother agricultural commodities such as rice, meat, sugar, coee and tobacco (Figure 23).They have grown signiicantly in recent decades, rising rom US$3.7 billion in 1980 to
US$10.2 billion in 1990, to US$18.3 billion in 2000, and reaching US$27.7 billion in 2010.For LIFDCs, net eport revenues amounted to US$4.7 billion in 2010, compared with

7/28/2019 The State of World Fisheries and Aquaculture_2012
http://slidepdf.com/reader/full/the-state-of-world-fisheries-and-aquaculture2012 89/230
World review o fsheries and aquaculture 71
US$2.0 billion in 1990.17 In 2010, their ishery eports (US$8.2 billion) accounted or8 percent o world eports in value terms.
World imports18 o ish and ish products set a new record at US$111.8 billion in2010, up 12 percent on the previous year and up 86 percent with respect to 2000.Preliminary data or 2011 point to urther growth, with a 15 percent increase. TheUnited States o America and Japan are the major importers o ish and isheryproducts and are highly dependent on imports or about 60 percent and 54 percent,respectively, o their ishery consumption. With a growing population and a positivelong-term trend in seaood consumption, United States imports reached US$15.5 billionin 2010, 12 percent more than in 2009, and urther increased in 2011 to US$17.5 billion.Ater the decline o 11 percent eperienced in 2009 as compared with 2008, Japaneseimports o ish and ishery products increased by 13 percent in 2010. In 2011, they grewby a urther 16 percent, reaching US$17.4 billion, also as a conseuence o the tsunamithat struc Japan in early 2011, which had an impact on the country’s productioncapacity in the aected area, with damage to the leet, auaculture acilities,processing plants and port inrastructure. China, the world’s largest ish producer andeporter, has signiicantly increased its ishery imports, partly a result o outsourcing,
as Chinese processors import raw material rom all major regions, including South and
Table 12Top ten eporters and importers o ish and ishery products
2000 2010 APr
(US$ millions) (Percentage)
eXPorters
China 3 603 13 268 13.9
Norway 3 533 8 817 9.6
Thailand 4 367 7 128 5.0
Viet Nam 1 481 5 109 13.2
United States o America 3 055 4 661 4.3
Denmar 2 756 4 147 4.2
Canada 2 818 3 843 3.1
Netherlands 1 344 3 558 10.2
Spain 1 597 3 396 7.8
Chile 1 794 3 394 6.6
TOP TEN SUBTOTAL 26 349 57 321 8.1
REST OF WORLD TOTAL 29 401 51 242 5.7
world totAl 55 750 108 562 6.9
IMPorters
United States o America 10 451 15 496 4.0Japan 15 513 14 973 –0.4
Spain 3 352 6 637 7.1
China 1 796 6 162 13.1
France 2 984 5 983 7.2
Italy 2 535 5 449 8.0
Germany 2 262 5 037 8.3
United kingdom 2 184 3 702 5.4
Sweden 709 3 316 16.7
Republic o korea 1 385 3 193 8.7
TOP TEN SUBTOTAL 26 349 69 949 10.3
REST OF WORLD TOTAL 33 740 41 837 2.2
world totAl 60 089 111 786 6.4
Note: APR reers to the average annual percentage growth rate or 2000–2010.

7/28/2019 The State of World Fisheries and Aquaculture_2012
http://slidepdf.com/reader/full/the-state-of-world-fisheries-and-aquaculture2012 90/230

7/28/2019 The State of World Fisheries and Aquaculture_2012
http://slidepdf.com/reader/full/the-state-of-world-fisheries-and-aquaculture2012 91/230
World review o fsheries and aquaculture 73
In 2010, developed countries were responsible or 76 percent o the total importvalue o ish and ishery products, a decline compared with the 86 percent o 1990and 83 percent o 2000. In volume (live weight euivalent), the share o developedcountries is signiicantly less, 58 percent, relecting the higher unit value o productsimported by developed countries. Owing to stagnating domestic ishery production,developed countries have to rely on imports and/or on domestic auaculture tocover their increasing domestic consumption o ish and ishery products. This maybe one reason or low import taris on ish in developed countries, albeit with a eweceptions, i.e. or some value-added products. As a conseuence, in the last ewdecades, developing countries have increasingly been able to supply ishery productsto marets o developed countries without acing prohibitive custom duties. In 2010,48 percent o the import value o developed countries originated rom developingcountries.
In recent decades, there has been a tendency towards increased ishery tradewithin regions. Most developed countries trade more with other developed countries.In 2010, in value terms, 79 percent o ishery eports rom developed countries weredestined to other developed countries, and about 52 percent o ishery imports o
developed countries originated rom other developed countries. In the same year,ishery trade between developing countries represented only 33 percent o thevalue o their eports o ish and ishery products. Over time, ishery trade betweendeveloping countries will probably increase in the wae o rising disposable incomesin emerging economies, gradual trade liberalization and a reduction in the highimport taris ollowing the epanding membership o the WTO, and the entry intoorce o a number o bilateral trade agreements with strong relevance to the tradein ish. The maps in Figure 24 summarize the average trade lows o ish and isheryproducts by continent or the period 2008–2010. The overall picture presented bythese maps is not ehaustive as trade data are not ully available or all countries,in particular or several Arican countries. However, the uantity o data at handis suicient to establish general trends, with no major changes taing in place
compared with the past ew years. The Latin America and the Caribbean regioncontinues to maintain a solid positive net ishery eporter role, as is the case or theOceania region and the developing countries o Asia. By value, Arica has been a neteporter since 1985, but it is a net importer in uantity terms, relecting the lowerunit value o imports (mainly or small pelagics). Europe and North America arecharacterized by a ishery trade deicit (Figure 25).
Some o the major issues in the past biennium that continue to aect isheryinternational trade are:• the volatility o commodity prices in general and their inluence on producers as
well as on consumers;• the impact on the domestic isheries sector o the rising imports o armed
products;• the role o the small-scale sector in uture ish production and trade;• the relationship between isheries management design, allocation o rights and
the economic sustainability o the sector;• the introduction o private standards, including or environmental and social
purposes, and their endorsement by major retailers;• the multilateral trade negotiations within the WTO, including the ocus on
isheries subsidies;• climate change, carbon emissions and their impacts on the isheries sector;• the growing concern o the general public and the retail sector about
overeploitation o certain ish stocs;• the need to ensure that internationally traded ishery products rom capture
isheries have been produced legally;• the need or competitiveness versus other ood products;
• the perceived and real riss and beneits o ish consumption.

7/28/2019 The State of World Fisheries and Aquaculture_2012
http://slidepdf.com/reader/full/the-state-of-world-fisheries-and-aquaculture2012 92/230
The State o World Fisheries and Aquaculture 201274
Intraregional trade
North and Central America
Africa
Figure 24
Trade flows by continent (total imports in US$ millions, c.i.f.; averages for 2008–2010)
(Continued)
South America
169.9
226.5
920.8
821.2
52.4
744.5
2 375.9
1 473.4
351.2
9 091.6
120.9
4 506.8
302.3
67.6
37.3
172.7
20.51 299.8
Note: The maps indicate the borders of the Republic of the Sudan for the period specified. The final boundary
between the Republic of the Sudan and the Republic of South Sudan has not yet been determined.

7/28/2019 The State of World Fisheries and Aquaculture_2012
http://slidepdf.com/reader/full/the-state-of-world-fisheries-and-aquaculture2012 93/230
World review o fsheries and aquaculture 75
59.816 266.2
28 373.1
905.3
5 968.4
3 620.5
3 919.2
1 586.0
266.3
7 846.7
3 919.9
4 156.5
73.2
68.2
46.6
83.7
820.0
217.9
3 043.8
Intraregional trade
Europe
Asia
Figure 24 (cont.)
Trade flows by continent (total imports in US$ millions, c.i.f.; averages for 2008–2010)
Oceania
Note: The maps indicate the borders of the Republic of the Sudan for the period specified. The final boundary
between the Republic of the Sudan and the Republic of South Sudan has not yet been determined.

7/28/2019 The State of World Fisheries and Aquaculture_2012
http://slidepdf.com/reader/full/the-state-of-world-fisheries-and-aquaculture2012 94/230
The State o World Fisheries and Aquaculture 201276
0
2
4
6
8
10
0
1
2
3
4
0
10
20
30
40
50
60
0
10
20
30
40
50
0
4
8
12
16
20
0
4
8
12
16
76 80 85 90 95 00 05 10 76 80 85 90 95 00 05 10
76 80 85 90 95 00 05 10
76 80 85 90 95 00 05 10
76 80 85 90 95 00 05 10
76 80 85 90 95 00 05 10
76 80 85 90 95 00 05 10
Figure 25
Imports and exports of fish and fishery products for different regions,
indicating net deficit or surplus
US$ billions
Surplus
US$ billions
Africa
Europe
US$ billions
US$ billions
Asia excluding China
China
US$ billions US$ billions
Canada and the United States of America Latin America and the Caribbean
US$ billions
Oceania
Export value (free on board)
Import value (cost, insurance, freight)
DeficitDeficit
Surplus
Surplus
Surplus
Deficit
0
4
8
12
16
20

7/28/2019 The State of World Fisheries and Aquaculture_2012
http://slidepdf.com/reader/full/the-state-of-world-fisheries-and-aquaculture2012 95/230
World review o fsheries and aquaculture 77
CmmiiThe ishery maret is very dynamic and it is changing rapidly. It is becoming much morecomple and stratiied, with greater diversiication among species and product orms.High-value species such as shrimp, prawns, salmon, tuna, groundish, latish, seabassand seabream are highly traded, in particular towards more prosperous marets.Low-value species such as small pelagics are also traded in large uantities, mainlybeing eported to eed low-income consumers in developing countries. In the last twodecades, auaculture has contributed to a growing share o the international tradein ishery commodities, with species such as shrimp, prawns, salmon, molluscs, tilapia,catish (including Pangasius), seabass and seabream. Auaculture is epanding in allcontinents in terms o new areas and species, as well as intensiying and diversiyingthe product range in species and product orms to respond to consumer needs. Manyo the species that have registered the highest eport growth rates in the last ew yearsare produced by auaculture. However, it is diicult to determine the etent o thistrade because the classiication used internationally to record trade statistics or ishdoes not distinguish between products o wild and armed origin. Hence, the eactbreadown between products o capture isheries and auaculture in international
trade is open to interpretation.Owing to the high perishability o ish and ishery products, 90 percent o trade in
ish and ishery products in uantity terms (live weight euivalent) consists o processedproducts (i.e. ecluding live and resh whole ish). Fish are increasingly traded as rozenood (39 percent o the total uantity in 2010, compared with 25 percent in 1980). Inthe last our decades, prepared and preserved ish have nearly doubled their share intotal uantity, going rom 9 percent in 1980 to 16 percent in 2010. Notwithstandingtheir perishability, trade in live, resh and chilled ish represented 10 percent oworld ish trade in 2010, up rom 7 percent in 1980, relecting improved logistics andincreased demand or unprocessed ish. Trade in live ish also includes ornamentalish, which is high in value terms but almost negligible in terms o uantity traded.In 2010, 71 percent o the uantity o ish and ishery products eported consisted
o products destined or human consumption. The US$109 billion eports o ish andishery products in 2010 do not include an additional US$1.3 billion or auatic plants(62 percent), inedible ish waste (31 percent) and sponges and corals (7 percent). Inthe last two decades, trade in auatic plants has increased signiicantly, going romUS$0.2 billion in 1990 to US$0.5 billion in 2000 and to US$0.8 billion in 2010, withChina as the major eporter and Japan as the leading importer. Trade in inedible ishwaste has also grown remarably in this period, owing to the increasing productiono ishmeal and other products deriving rom ishery residues rom processing (see theFish Utilization and Processing section above). From just US$61 million in 1990, eportso inedible ish rose to US$0.2 billion in 2000 and reached US$0.4 billion in 2010.
Shrimp
Shrimp continues to be the largest single commodity in value terms, accounting or
about 15 percent o the total value o internationally traded ishery products in 2010.In 2010, the shrimp maret recovered, ater the decline o 2009, characterized bystable volumes, but by substantially decreases o prices. In 2011, notwithstanding acontraction in world production o armed shrimp, the maret perormed well. Despitethe scepticism and concern over the economic situation, both the United States oAmerica and the European Union imported more shrimp than the year beore. TheJapanese maret moved away rom basic raw shrimp to value-added and processedshrimp, thus paying more or imports. Many domestic and regional marets in Asiaand Latin America consumed more shrimp, which also ept their prices relativelyhigh and stable throughout 2011 (Figure 26). In 2012, the shrimp maret began withpositive notes in demand and price trends in various marets. In value terms, the majoreporting countries are Thailand, China and Viet Nam. The United States o America
continues to be the main shrimp importer, ollowed by Japan.

7/28/2019 The State of World Fisheries and Aquaculture_2012
http://slidepdf.com/reader/full/the-state-of-world-fisheries-and-aquaculture2012 96/230

7/28/2019 The State of World Fisheries and Aquaculture_2012
http://slidepdf.com/reader/full/the-state-of-world-fisheries-and-aquaculture2012 97/230
World review o fsheries and aquaculture 79
in most marets and it is epanding geographically, in particular or armed Atlanticsalmon, also through new varieties o processed products. Norway remains thedominant producer and eporter o Atlantic salmon, but Chile is rapidly ramping up itsproduction towards levels prior to the crisis eperienced in 2010. Wild Paciic salmonalso plays an important part in world salmon marets with wild salmon representing
about 30 percent o the total maret or salmonids.
Groundish
Groundish species represented about 10 percent o total ish eports by value in 2010.Their prices went down in 2010 and 2011 as a result o good supply rom captureisheries and strong competition rom armed species such as Pangasius and tilapiaon the maret (Figure 27). General demand or groundish species is increasing, andincreased supply will come rom good management practices o the wild stocs.Emerging countries will provide new opportunities. For eample, Brazil has becomea growing destination or Norwegian cod, helping to ease somewhat the concernso Norwegian eporters that their sales in southern Europe were being aected bythe economic crisis, particularly in Portugal, which is the largest single importer oNorwegian cod.
Tuna
The share o tuna in total ish eports in 2010 was about 8 percent. In the last threeyears, tuna marets have been unstable owing to large luctuations in catch levels.The major issues aecting the global tuna sector in 2011 were lower catches in majorishing areas, growing restrictions on longline and purse-seine ishing in the pursuito more sustainable resource management, other moves towards sustainability andthe introduction o ecolabels. These actors have had an impact on the tuna maretor sashimi and as raw material or canning, with conseuent increases in tuna prices(Figure 28). Japan continues to be the main maret or sashimi-grade tuna, while theEuropean Union and the United States o America represent the major importers andThailand the main eporter o canned tuna.
200
400
600
800
1 000
1 200
1 400
1 600
1 800
2 000
2 200
Figure 28
Skipjack tuna prices in Africa and Thailand
US$/tonne
Jan
88
Jan
86
Jan
90
Jan
92
Jan
94
Jan
96
Jan
98
Jan
00
Jan
02
Jan
04
Jan
06
Jan
08
Jan
10
Jan
12
Note: Data refer to c&f (cost and freight) prices for 4.5–7.0 pounds of fish.For Africa: ex-vessel Abidjan, Côte d’Ivoire.
Thailand
Africa
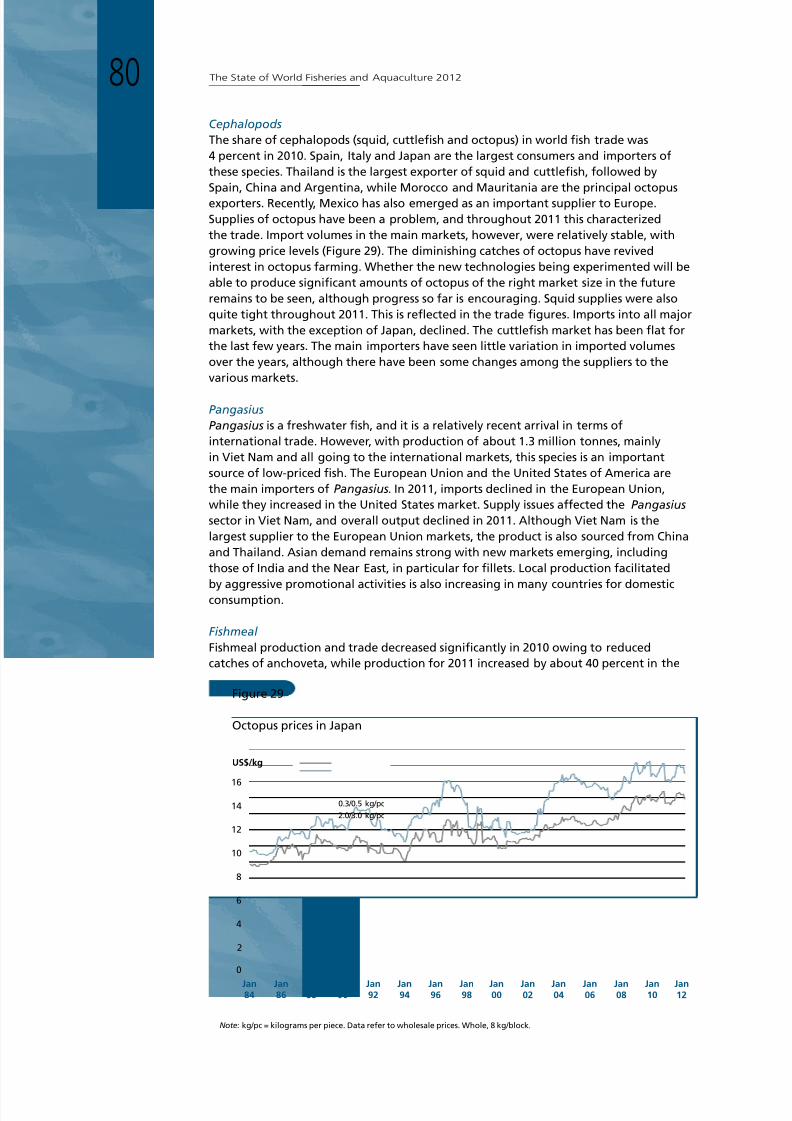
7/28/2019 The State of World Fisheries and Aquaculture_2012
http://slidepdf.com/reader/full/the-state-of-world-fisheries-and-aquaculture2012 98/230
The State o World Fisheries and Aquaculture 201280
Cephalopods
The share o cephalopods (suid, cuttleish and octopus) in world ish trade was4 percent in 2010. Spain, Italy and Japan are the largest consumers and importers othese species. Thailand is the largest eporter o suid and cuttleish, ollowed bySpain, China and Argentina, while Morocco and Mauritania are the principal octopuseporters. Recently, Meico has also emerged as an important supplier to Europe.Supplies o octopus have been a problem, and throughout 2011 this characterizedthe trade. Import volumes in the main marets, however, were relatively stable, withgrowing price levels (Figure 29). The diminishing catches o octopus have revivedinterest in octopus arming. Whether the new technologies being eperimented will beable to produce signiicant amounts o octopus o the right maret size in the utureremains to be seen, although progress so ar is encouraging. Suid supplies were alsouite tight throughout 2011. This is relected in the trade igures. Imports into all majormarets, with the eception o Japan, declined. The cuttleish maret has been lat orthe last ew years. The main importers have seen little variation in imported volumesover the years, although there have been some changes among the suppliers to thevarious marets.
Pangasius
Pangasius is a reshwater ish, and it is a relatively recent arrival in terms ointernational trade. However, with production o about 1.3 million tonnes, mainlyin Viet Nam and all going to the international marets, this species is an importantsource o low-priced ish. The European Union and the United States o America arethe main importers o Pangasius. In 2011, imports declined in the European Union,while they increased in the United States maret. Supply issues aected the Pangasius sector in Viet Nam, and overall output declined in 2011. Although Viet Nam is thelargest supplier to the European Union marets, the product is also sourced rom Chinaand Thailand. Asian demand remains strong with new marets emerging, includingthose o India and the Near East, in particular or illets. Local production acilitated
by aggressive promotional activities is also increasing in many countries or domesticconsumption.
Fishmeal
Fishmeal production and trade decreased signiicantly in 2010 owing to reducedcatches o anchoveta, while production or 2011 increased by about 40 percent in the
0
2
4
6
8
10
12
14
16
Figure 29
Octopus prices in Japan
US$/kg
0.3/0.5 kg/pc
2.0/3.0 kg/pc
Jan84
Jan86
Jan88
Jan90
Jan92
Jan94
Jan96
Jan98
Jan00
Jan02
Jan04
Jan06
Jan08
Jan10
Jan12
Note: kg/pc = kilograms per piece. Data refer to wholesale prices. Whole, 8 kg/block.

7/28/2019 The State of World Fisheries and Aquaculture_2012
http://slidepdf.com/reader/full/the-state-of-world-fisheries-and-aquaculture2012 99/230
World review o fsheries and aquaculture 81
major producing countries. Demand or ishmeal was strong in 2010 and 2011, leadingto sharply higher ishmeal prices (Figure 30). Despite some recent sotening in late 2011and early 2012, prices remain at airly high levels. China remains the main maret orishmeal, importing more than 30 percent o the ishmeal uantity, while Peru andChile are the major eporters.
Fish oil
Improved landings and access to raw material contributed to a rise in ish-oilproduction in 2011, ater the decline in 2010. Notwithstanding some luctuations, ish-
0
300
600
900
1 200
1 500
1 800
2 100
Figure 30
Fishmeal and soybean meal prices in Germany and the Netherlands
US$/tonne
Fishmeal
Soybean meal
Jan
86
Jan
88
Jan
90
Jan
92
Jan
94
Jan
96
Jan
98
Jan
00
Jan
02
Jan
04
Jan
06
Jan
08
Jan
10
Jan
12
Note: Data refer to c.i.f. prices.Fishmeal: all origins, 64–65 percent, Hamburg, Germany.Soybean meal: 44 percent, Rotterdam, Netherlands.
Source: Oil World; FAO GLOBEFISH.
0
300
600
900
1 200
1 500
1 800
2 100
Figure 31
Fish oil and soybean oil prices in the Netherlands
US$/tonne
Fish oil
Soybean oil
Jan
86
Jan
88
Jan
90
Jan
92
Jan
94
Jan
96
Jan
98
Jan
00
Jan
02
Jan
04
Jan
06
Jan
08
Jan
12
Jan
10
Note: Data refer to c.i.f. prices.Origin: South America; Rotterdam, Netherlands.
Source: Oil World; FAO GLOBEFISH.

7/28/2019 The State of World Fisheries and Aquaculture_2012
http://slidepdf.com/reader/full/the-state-of-world-fisheries-and-aquaculture2012 100/230
The State o World Fisheries and Aquaculture 201282
oil prices continued to be at high levels in 2011 and early 2012 (Figure 31). Demandrom the auaculture and health supplement sectors will continue to tae most o thevolumes oered. The share going to auaculture is used as an ingredient in ish andshrimp eeds. In 2011, a large increase in salmonoid production in Chile boosted oildemand rom Chile and Peru while producers in Europe were able to increase supply,despite high prices o macerel and herring or direct human consumption.
FIsH ConsUMPtIon19
Fish and ishery products represent a valuable source o nutrients o undamentalimportance or diversiied and healthy diets. With a ew eceptions or selectedspecies, ish is usually low in saturated ats, carbohydrates and cholesterol. Fishprovides not only high-value protein, but also a wide range o essential micronutrients,including various vitamins (D, A and B), minerals (including calcium, iodine, zinc, ironand selenium) and polyunsaturated omega-3 atty acids (docosaheaenoic acid andeicosapentaenoic acid). While average per capita ish consumption may be low, evensmall uantities o ish can have a signiicant positive nutritional impact by providingessential amino acids, ats and micronutrients that are scarce in vegetable-based diets.
There is evidence o beneicial eects o ish consumption20 in relation to coronaryheart disease,21 stroe, age-related macular degeneration and mental health.22 There isalso convincing evidence o beneits in terms o growth and development, in particularor women and children during gestation and inancy or optimal brain developmento children.23
On average, ish provides only about 33 calories per capita per day. However, it caneceed 150 calories per capita per day in countries where there is a lac o alternativeprotein ood and where a preerence or ish has been developed and maintained(e.g. Iceland, Japan and several small island States). The dietary contribution o ishis more signiicant in terms o animal proteins, as a portion o 150 g o ish providesabout 50–60 percent o the daily protein reuirements or an adult. Fish proteinscan represent a crucial component in some densely populated countries where total
protein intae levels may be low. In act, many populations, more those in developingcountries than developed ones, depend on ish as part o their daily diet. For them, ishand ishery products oten represent an aordable source o animal protein that maynot only be cheaper than other animal protein sources, but preerred and part o localand traditional recipes. For eample, ish contributes to, or eceeds, 50 percent o totalanimal protein intae in some small island developing States, as well as in Bangladesh,
0
20
40
60
80
100
120
140
Figure 32
Total protein supply by continent and major food group (average 2007–2009)
Meat and offal
Milk/dairy products
Fish
Eggs
World Africa NorthAmerica
Latin Americaand the
Caribbean
Asia Europe Oceania
Total proteins
Vegetable proteins
Animal proteins
g/capita per day

7/28/2019 The State of World Fisheries and Aquaculture_2012
http://slidepdf.com/reader/full/the-state-of-world-fisheries-and-aquaculture2012 101/230
World review o fsheries and aquaculture 83
Figure 34
Fish as food: per capita supply (average 2007–2009)
Average per capita fish supply(in live weight equivalent)
Figure 33
Contribution of fish to animal protein supply (average 2007–2009)
Fish proteins
(per capita per day)
Contribution of fish
to animal protein supply
0–2 kg/year
2–5 kg/year
5–10 kg/year
10–20 kg/year
20–30 kg/year
30–60 kg/year
> 60 kg/year
< 2 g
2–4 g
> 20%
4–6 g
6–10 g
> 10 g
Note: The map indicates the borders of the Republic of the Sudan for the period specified. The final boundary between the
Republic of the Sudan and the Republic of South Sudan has not yet been determined.
Note: The map indicates the borders of the Republic of the Sudan for the period specified. The final boundary between the
Republic of the Sudan and the Republic of South Sudan has not yet been determined.

7/28/2019 The State of World Fisheries and Aquaculture_2012
http://slidepdf.com/reader/full/the-state-of-world-fisheries-and-aquaculture2012 102/230
The State o World Fisheries and Aquaculture 201284
Cambodia, Ghana, the Gambia, Indonesia, Sierra Leone and Sri Lana. In 2009, ish24 accounted or 16.6 percent o the global population’s intae o animal protein and6.5 percent o all protein consumed (Figure 32). Globally, ish provides about 3.0 billionpeople with almost 20 percent o their average per capita intae o animal protein, and4.3 billion people with about 15 percent o such protein (Figure 33).
Lined to the strong epansion o ish production and o modern distributionchannels, world ish ood supply grew at an average rate o 3.2 percent per year inthe period 1961–2009, outpacing the increase o 1.7 percent per year in the world’spopulation; hence, average per capita availability has risen. World per capita ishconsumption increased rom an average o 9.9 g in the 1960s to 11.5 g in the 1970s,12.6 g in the 1980s, 14.4 g in the 1990s, 17.0 g in the 2000s and reached 18.4 g in2009. Preliminary estimates or 2010 point towards a urther increase in per capita ishconsumption to 18.6 g. It should be noted that igures or 2000 are higher than thosereported in previous editions o The State o World Fisheries and Aquaculture, as FAOhas revised downwards the non-ood estimates or China’s apparent consumption,starting rom 2000 data, to relect improved national inormation on the sector. As aconseuence, per capita ish consumption igures or China as well as or the world
have increased in comparison with previous assessments.Notwithstanding the strong increase in the availability o ish to most consumers,
the growth in ish consumption diers considerably among countries and withincountries and regions in terms o uantity and variety consumed per head. Foreample, per capita ish consumption has remained static or decreased in somecountries in sub-Saharan Arica (e.g. the Congo, South Arica, Gabon, Malawi andLiberia) and in Japan in the last two decades, while the most substantial increases inannual per capita ish consumption have occurred in East Asia (rom 10.6 g in 1961to 34.5 g in 2009), Southeast Asia (rom 12.8 g in 1961 to 32.0 g in 2009) andNorth Arica (rom 2.8 g in 1961 to 10.6 g in 2009). China has been responsible ormost o the increase in world per capita ish consumption, owing to the substantialincrease in its ish production, in particular rom auaculture. China’s share in world
ish production grew rom 7 percent in 1961 to 34 percent in 2009. Per capita ishconsumption in China has also increased dramatically, reaching about 31.9 g in 2009,with an average annual growth rate o 4.3 percent in the period 1961–2009 and o6.0 percent in the period 1990–2009. In the last ew years, uelled by growing domesticincome and wealth, consumers in China have eperienced a diversiication o the types
Table 13Total and per capita ood ish supply by continent and economic grouping in 20091
ta f upp P capia f upp
(million tonnes live weight equivalent) (kg/year)
w 125.6 18.4World (ecluding China) 83.0 15.1
Arica 9.1 9.1
North America 8.2 24.1
Latin America and the Caribbean 5.7 9.9
Asia 85.4 20.7
Europe 16.2 22.0
Oceania 0.9 24.6
Industrialized countries 27.6 28.7
Other developed countries 5.5 13.5
Least-developed countries 9.0 11.1
Other developing countries 83.5 18.0
LIFDCs2 28.3 10.1
1 Preliminary data.2 Low-income ood-deicit countries.

7/28/2019 The State of World Fisheries and Aquaculture_2012
http://slidepdf.com/reader/full/the-state-of-world-fisheries-and-aquaculture2012 103/230
World review o fsheries and aquaculture 85
o ish available owing to a diversion o some ishery eports towards the domesticmaret as well as an increase in ishery imports. I China is ecluded, annual per capitaish supply to the rest o the world was about 15.4 g in 2009, higher than the averagevalues o the 1960s (11.5 g), 1970s (13.5 g), 1980s (14.1 g) and 1990s (13.5 g). Itshould be noted that during the 1990s, world per capita ish supply, ecluding China,was relatively stable at 13.1–13.5 g and lower than in the 1980s as population grewmore rapidly than ood ish supply (at annual rates o 1.6 and 0.9 percent, respectively).Since the early 2000s, there has been an inversion o this trend, with ood ish supplygrowth outpacing population growth (at annual rates o 2.6 percent and 1.6 percent,respectively).
Table 13 summarizes per capita ish consumption by continent and majoreconomic group. The total amount o ish consumed and the species composition othe ood ish supply vary according to regions and countries, relecting the dierentlevels o availability o ish and other oods, including the accessibility o isheryresources in adjacent waters as well as the interaction o several socio-economic andcultural actors. These actors include ood traditions, tastes, demand, income levels,seasons, prices, health inrastructure and communication acilities. Annual per capita
apparent ish consumption can vary rom less than 1 g in one country to more than100 g in another (Figure 34). Dierences may also be signiicant within countries,with consumption usually higher in coastal, riverine and inland water areas. O the126 million tonnes available or human consumption in 2009, ish consumption waslowest in Arica (9.1 million tonnes, with 9.1 g per capita), while Asia accountedor two-thirds o total consumption, with 85.4 million tonnes (20.7 g per capita),o which 42.8 million tonnes was consumed outside China (15.4 g per capita). Thecorresponding per capita ish consumption igures or Oceania, North America, Europe,and Latin America and the Caribbean were 24.6 g, 24.1 g, 22.0 g and 9.9 g,respectively.
Dierences in ish consumption eist between the more-developed and the less-developed countries. Although annual per capita consumption o ishery products has
grown steadily in developing regions (rom 5.2 g in 1961 to 17.0 g in 2009) and inLIFDCs (rom 4.9 g in 1961 to 10.1 g in 2009), it is still considerably lower than that omore developed regions, even though the gap is narrowing. The actual values may behigher than indicated by oicial statistics in view o the under-recorded contributiono subsistence isheries and some small-scale isheries. In 2009, apparent per capitaish consumption in industrialized countries was 28.7 g, while or all developedcountries it was estimated at 24.2 g. A sizeable share o ish consumed in developedcountries consists o imports, and owing to steady demand and declining domesticishery production (down 10 percent in the period 2000–2010), their dependence onimports, in particular rom developing countries, is projected to grow. In developingcountries, ish consumption tends to be based on locally and seasonally availableproducts, and the ish chain is driven by supply rather than demand. However, inemerging economies, imports o ishery products not available locally have recently
been growing.Disparities among developed and developing countries eist also with reerence
to the contribution o ish to animal protein intae. Despite their relatively low levelso ish consumption, this share was signiicant at about 19.2 percent or developingcountries and 24.0 percent or LIFDCs. However, this share has declined slightly inrecent years owing to the growing consumption o other animal proteins. In developedcountries, the share o ish in animal protein intae, ater consistent growth up to1989, declined rom 13.9 percent in 1984 to 12.4 percent in 2009, while consumption oother animal proteins continued to increase.
The seaood sector remains very ragmented, in particular or marets oresh seaood, but it is in a phase o consolidation and globalization. Fish is veryheterogeneous and dierences may be based on species, production area, method
o ishing or arming, handling practice and hygiene. Raw ish can be processed into

7/28/2019 The State of World Fisheries and Aquaculture_2012
http://slidepdf.com/reader/full/the-state-of-world-fisheries-and-aquaculture2012 104/230
The State o World Fisheries and Aquaculture 201286
an even wider range o products to meet consumer demands that dier according tomarets, leibility in supply volumes, physical proimity, suppliers’ trustworthiness,ability to adapt to dierent portion-size speciications, etc. In the last two decades,the consumption o ish and ishery products has also been inluenced considerablyby globalization in ood systems and by innovations and improvements in processing,transportation, distribution, mareting and ood science and technology. These actorshave led to signiicant enhancements in eiciency, lower costs, wider choice and saerand improved products. Owing to the perishability o ish, developments in long-distance rerigerated transport and large-scale and aster shipments have acilitatedthe trade and consumption o an epanded variety o species and product orms,including live and resh ish. Consumers can beneit rom increased choice, with importsboosting the availability o ish and ishery products in the domestic marets.
Growing interest rom local consumers has also underpinned auaculturedevelopment in many regions in Asia and, increasingly, in Arica and in LatinAmerica. Since the mid-1980s, and in particular in the last decade, the contributiono auaculture to ish consumption has shown dramatic growth, as capture isheriesproduction has stagnated or even declined in some countries. In 2010, auaculture
contributed about 47 percent o the ishery output or human consumption –impressive growth compared with its 5 percent in 1960, 9 percent in 1980 and34 percent in 2000 (Figure 35), with an average annual growth rate o 4.7 percentin the period 1990–2010. However, i China is ecluded, the average contributiono auaculture is signiicantly lower at 17 percent in 2000 and 29 percent in 2010,corresponding to an average annual growth rate o 5.4 percent. Auaculture haspushed the demand or, and consumption o, species that have shited rom beingprimarily wild-caught to being primarily auaculture-produced, with a decrease in theirprices and a strong increase in their commercialization, such as or shrimps, salmon,bivalves, tilapia, catish and Pangasius. Auaculture also plays a role in ood securitythrough the signiicant production o some low-value reshwater species, which aremainly destined or domestic production, also through integrated arming.
The surging contribution o auaculture can also be noted by observing ishconsumption by major groups. Owing to the increasing production o shrimps, prawnsand molluscs rom auaculture and the relative decline in their price, annual percapita availability o crustaceans grew substantially rom 0.4 g in 1961 to 1.7 g in2009, and that o molluscs (including cephalopods) rose rom 0.8 g to 2.8 g in the
0
5
10
15
20
25
30
35
40
70 80 90 00 10 70 80 90 00 1070 80 90 00 10
Figure 35
Relative contribution of aquaculture and capture fisheries to food fish consumption
Fishery food supply (kg/capita)
WORLD CHINA WORLD EXCLUDING CHINA
AquacultureCapture
7/28/2019 The State of World Fisheries and Aquaculture_2012
http://slidepdf.com/reader/full/the-state-of-world-fisheries-and-aquaculture2012 105/230
7/28/2019 The State of World Fisheries and Aquaculture_2012
http://slidepdf.com/reader/full/the-state-of-world-fisheries-and-aquaculture2012 106/230
7/28/2019 The State of World Fisheries and Aquaculture_2012
http://slidepdf.com/reader/full/the-state-of-world-fisheries-and-aquaculture2012 107/230
World review o fsheries and aquaculture 89
demand or ish products is epected to continue to rise in the coming decades.However, uture increases in per capita ish consumption will depend on theavailability o ishery products. With capture isheries production stagnating,major increases in ish ood production are orecast to come rom auaculture (seep. 188). However, uture demand will be determined by a comple interaction oseveral actors and elements. The global ood sectors, including the ishery sector,will have to ace several challenges stemming rom demographic, dietary, climateand economic changes, including reduced reliance on ossil energy and increasingconstraints on other natural resources. In particular, the uture supply and demando ood commodities, including isheries, will be aected by population dynamicsand the location and rate o economic growth. World population growth is epectedto slow in the net decade, in all regions and continents, with developing countriescontinuing to eperience the most rapid population increases. The global populationis set to increase rom about 7 billion in 2011 to 7.3 billion in 2015 and to 7.7 billionin 2020 and 9.3 billion in 2050, with the bul o the increase occurring in developingcountries, according to the medium-variant projections prepared by the UnitedNations.27 Much o this increase is projected to come rom the high-ertility countries
and it is epected to occur in urban areas (see above).
GovernAnCe And PolICy
ri+20The United Nations Conerence on Sustainable Development was held in June2012 to mar the twentieth anniversary o the 1992 United Nations Conerenceon Environment and Development, in Rio de Janeiro, and the tenth anniversaryo the 2002 World Summit on Sustainable Development in Johannesburg. knownas Rio+20, the objective o the conerence – envisioned as a gathering at thehighest level possible – aimed to “secure renewed political commitment orsustainable development, assess the progress to date and the remaining gaps in theimplementation o the outcomes o the major summits on sustainable development,
and address new and emerging challenges”.28
The two themes o the conerencewere the institutional ramewor or sustainable development and the support o agreen economy in the contet o sustainable development and poverty eradication.
While the green economy has no precise deinition, it is viewed as a holistic,euitable and ar-sighted approach to sustainability that sees to eliminate thenotion that sustainability and growth are mutually eclusive. The hope is that atransition to a green economy will result in resource eploitation that contributes tosustainability, inclusive social development and economic growth.
The conerence prioritized seven thematic areas including green jobs and socialinclusion, energy, sustainable cities, ood security and sustainable agriculture,water, sustainable use o oceans and coasts, and disaster ris reduction and buildingresilience.
There are several ongoing international initiatives that see to integrate isheries
and auaculture into the Rio+20 agenda and ramewor and continue the processesestablished by Agenda 21 and the Rio Declaration.
FAO’s corporate message to Rio+20 – and beyond – is that hunger eradication isessential or sustainable development, and sustainable consumption and productionsystems are essential to eradicate hunger and protect ecosystems. Underpinning thismessage it the need to increase ood security – in terms o availability, access, stabilityand utilization – while using ewer natural resources, through improved managementand eiciencies throughout the ood value chain. This reuires policies that createincentives or producers and consumers to adopt sustainable practices and behaviour.It is also necessary to promote the wide application o ecosystem approaches thatencourage producers to participate in managing land, water, isheries and waterresources and help in internalizing environmental costs and beneits and rewarding
environmental service provision.

7/28/2019 The State of World Fisheries and Aquaculture_2012
http://slidepdf.com/reader/full/the-state-of-world-fisheries-and-aquaculture2012 108/230

7/28/2019 The State of World Fisheries and Aquaculture_2012
http://slidepdf.com/reader/full/the-state-of-world-fisheries-and-aquaculture2012 109/230
World review o fsheries and aquaculture 91
are oten poorly represented and euipped to contribute to intersectoral planning andpolicy-maing.33
sma-ca fihiThe importance o small-scale isheries to ood security, poverty alleviation andpoverty prevention in the developing world is becoming increasingly understoodand appreciated. However, a lac o institutional capacity and a ailure to includethe sector into national and regional development policies continue to hamper thepotential contributions o small-scale isheries to economic growth, poverty alleviationand rural development. According to the latest igures, the livelihoods o about357 million people are directly aected by small-scale isheries, and they employ morethan 90 percent o the world’s capture ishers.
Since 2003, COFI has promoted eorts to improve the proile o, and understandthe challenges and opportunities acing, small-scale ishing communities in inlandand marine waters. Prompted by COFI, in 2008, the FAO Fisheries and AuacultureDepartment embared on a broad-based consultative process that included a globalconerence34 and a series o regional worshops or Asia and the Paciic, Arica,
and Latin America and Caribbean35 to eamine the need and various options or aninternational instrument on small-scale isheries and a global assistance programme orthe sector.
Throughout this process, strong support was epressed or the creation o aninternational instrument as well as or the delivery o an assistance programme.Subseuently, COFI agreed to these suggestions and recommended that this instrumentshould tae the orm o international voluntary guidelines and complement the Codeas well as other international instruments with similar purposes, in particular thoserelated to human rights, sustainable development and responsible isheries.
The preparation o the guidelines is epected to contribute to policy developmentat the national and regional levels. In addition, both the process and the inal productare epected to have considerable impact on securing small-scale isheries and creating
beneits, especially in terms o ood security and poverty reduction. The process itselhas been designed to be highly participatory and collaborative, with the inclusion ocross-sectoral, national and international consultative worshops.36 The guidelinesshould be a document that is agreed by governments, regional organizations and civil-society organizations. In addition, the document should be one that small-scale ishers,ishworers and their communities across the world eel ownership o and can relateto, thus contributing to the process o turning resource users into resource stewards.
A set o basic principles underlie the development process o the guidelines.They promote good governance, including transparency and accountability as wellas participation and inclusiveness. Social responsibility and solidarity are supported,as the guidelines tae a human rights approach to development (which recognizesthat everyone has legally mandated rights and that these rights carry with themresponsibilities). These principles include euitable development based on gender
euality, non-discrimination, and respect and involvement o all staeholders, includingindigenous people.
The consultative process also aims at identiying good practices, in particular withregard to governance and resource management through the implementation o anecosystem approach to isheries (EAF), and by reducing vulnerability and improvinglivelihoods’ resilience through DRM and CCA.
The guidelines promote holistic and integrated approaches that combine natural-resource and ecosystem management with social and economic development. Eualconsideration should be given to the environment, social and economic developmentneeds, and community rights.37 Sustainability is a ey concept that is valid or bothbioecological aspects and human dimensions. Actions should be guided by theprecautionary approach and ris management to guard against undesirable outcomes,
including not only overeploitation o ishery resources and negative environmentalimpacts but also unacceptable social and economic conseuences.

7/28/2019 The State of World Fisheries and Aquaculture_2012
http://slidepdf.com/reader/full/the-state-of-world-fisheries-and-aquaculture2012 110/230
The State of World Fisheries and Aquaculture 201292
The development of the guidelines serves as both process and objective, and intends to:
• provide a comprehensive framework that enhances the understanding of the
actions needed to support the governance and sustainable development of small-
scale fisheries;
• establish principles and criteria for the elaboration and implementation of national
policies and strategies for the enhancement of small-scale fisheries governance and
development, and provide practical guidance for implementation of these policies
and strategies;
• serve as a reference tool for governments, their development partners and other
stakeholders in the area of small-scale fisheries governance and development with a
view to assisting in the formulation and implementation of relevant actions and the
establishment or improvement of required institutional structures and processes;
• facilitate cooperation in support of small-scale fisheries governance and
development;
• promote further research and the advancement of the knowledge on small-scale
fisheries governance and development.
Ultimately, it is expected that policies and practices will be developed and adopted,
and capacities strengthened for securing sustainable small-scale fisheries at thenational and regional levels.
Regional fishery bodies
The RFBs are the primary organizational mechanism through which States work
together to ensure the long-term sustainability of shared fishery resources.
Throughout the twentieth and twenty-first centuries, the number and diversity of
RFBs have expanded so that today the term “RFBs” can apply to fishery bodies with a
mandate in a particular region, for a particular species, for marine or inland fisheries
and/or for aquaculture bodies. The term RFB also embraces RFMOs, which are those
RFBs that have the competence to establish binding conservation and management
measures.
The 2010 United Nations Review Conference (the Review Conference) encouragedall States to become parties to RFBs, as these bodies rely upon State cooperation.38
However, despite this significant endorsement of regional bodies, it is apparent that
most RFBs are experiencing difficulties in fulfilling their mandates, and that many of
these mandates are outdated as they do not provide appropriate frameworks within
which RFBs can address current critical fisheries management issues. The situation
is reflected in “alarming statistics” on global fish stocks “highlighting the need to
strengthen the regulatory regime for regional fisheries management organizations and
arrangements with a view to making them more accountable, transparent and open.”39
The RFBs are intergovernmental organizations and as such they depend on the political
will of their member Governments to implement agreed measures or to undertake
much needed reform.40
New regional fishery bodies
Since publication of The State of World Fisheries and Aquaculture 2010, new RFBs
have been established, existing RFBs have been modernized, and other RFBs are in
the planning or development stage. These new, strengthened and emerging bodies
represent an important step forwards in extending the global coverage of RFBs.
The Central Asian and Caucasus Regional Fisheries and Aquaculture Commission
(CACFish) was approved by the Hundred and Thirty-seventh Session of the FAO Council
in October 2009.41 It deals with fisheries management and aquaculture in inland
waters within the territorial boundaries of the States of Central Asia (Kazakhstan,
Kyrgyzstan, Tajikistan, Turkmenistan and Uzbekistan) and of the Caucasus (Armenia,
Azerbaijan, Georgia and Turkey). The agreement to establish CACFish came into effect
on 3 December 2010.
The Southern Indian Ocean Fisheries Agreement (SIOFA)42 aims to ensure the long-term conservation and sustainable use of Southern Indian Ocean fishery resources

7/28/2019 The State of World Fisheries and Aquaculture_2012
http://slidepdf.com/reader/full/the-state-of-world-fisheries-and-aquaculture2012 111/230

7/28/2019 The State of World Fisheries and Aquaculture_2012
http://slidepdf.com/reader/full/the-state-of-world-fisheries-and-aquaculture2012 112/230

7/28/2019 The State of World Fisheries and Aquaculture_2012
http://slidepdf.com/reader/full/the-state-of-world-fisheries-and-aquaculture2012 113/230
World review o fsheries and aquaculture 95
The issue o IUU ishing was covered in the 2010 Secretary General’s report to theUNGA.56 In UNGA Resolution 65/38,57 IUU ishing was dealt with at length in Section IV.The emphasis given to IUU ishing in the resolution underscored the threat that thispractice poses to isheries and their ecosystem, and the need to intensiy isheriesmonitoring, control and surveillance, and to implement international instrumentsand catch documentation schemes (CDSs) and traceability schemes. In addition,the resolution encouraged international cooperation on IUU ishing among States,including through RFBs.
Shortly ater the UNGA, the Twenty-ninth Session o the FAO Committee onFisheries (COFI) addressed IUU ishing.58 Discussion ocused principally on FAO’s worand activities to promote and enhance international action against IUU ishing.Subseuently, the 2011 meeting o the UN Open-ended Inormal Consultative Processon Oceans and the Law o the Sea59 also drew attention to IUU ishing, largely inthe contet o discussions relating to the implementation o global instruments andproblems associated with unregulated ishing activities in EEZs.
The international community is deeply rustrated by the ailure o many lag Statesto meet their primary responsibilities under international law, which are to eercise
eective control over their ishing vessels and, at the same time, ensure compliancewith conservation and management measures. O particular concern are those vesselsthat ly lags o “non-compliance”. These are lags belonging to States that sell themto raise revenue. Such States are either unable or unwilling to eercise eective controlover their vessels. Many o the vessels carrying these lags engage in IUU ishing inareas beyond the national jurisdiction o the lag State (i.e. on the high seas or inareas under the sovereignty or jurisdiction o other States). As a result, the burden ocontrolling these rogue vessels is gradually alling on coastal States, port States, RFBsand others. Thus, these States and RFBs need to train sta, and to obtain and developcompliance tools and mechanisms reuired to combat IUU ishing. This shit in burden,which is costly, has important ramiications or developing countries.
The international community’s irritation with IUU ishing by vessels carrying lags o
“non-compliance” led FAO Members to reuest that a Technical Consultation on FlagState Perormance be convened. Following etensive preparatory wor, the irst sessiono the Technical Consultation was held in May 2011 and a resumed session in March2012. It is anticipated that the outcome o the Technical Consultation will be a set ovoluntary criteria or assessing the perormance o lag States. In addition, a list opossible actions to be taen against vessels lying the lags o States not meeting suchcriteria is liely to be developed.60 An agreed procedure or assessing compliance wouldbe an important part o the criteria.
The RFBs are grappling with IUU ishing and its eects on the resources theyare attempting to manage. Many o them have diiculty in estimating the volumeand value o IUU catches. Their achievements in terms o limiting IUU ishing varywidely, depending on actors that are either internal or eternal to their respectiveorganizations and isheries. Nonetheless, in one way or another, RFBs promote and
implement measures to combat IUU ishing. Depending on the particular circumstances,the measures range rom more passive activities such as awareness building anddissemination o inormation (mainly RFBs without isheries management unctions) toaggressive port, air and surace programmes (RFMOs).
Some recent eamples o RFBs’ activities in relation to their wor on IUU ishing are:• In 2010, the SEAFO underscored the importance o regional training. Measures to
develop capacity were noted as critical tools to speed up the implementation omeasures to combat IUU ishing.61
• In 2010, the CCAMLR epressed concern as estimates o IUU catches in theconvention area had risen since 2009 and concluded that, despite progress in thecontrol o nationals and the implementation o CDSs, IUU ishing did not appearto be declining signiicantly. Importantly, several Members epressed the view that
the CCAMLR appeared to be unable to improve its control o IUU ishing and was,

7/28/2019 The State of World Fisheries and Aquaculture_2012
http://slidepdf.com/reader/full/the-state-of-world-fisheries-and-aquaculture2012 114/230

7/28/2019 The State of World Fisheries and Aquaculture_2012
http://slidepdf.com/reader/full/the-state-of-world-fisheries-and-aquaculture2012 115/230
World review o fsheries and aquaculture 97
management o shared marine resources and to preserve the associated employmentand other economic beneits o sustainable isheries. In September 2011, recognizingthis and in line with their commitment to the ight against IUU ishing, the EuropeanUnion and the United States o America undertoo to cooperate bilaterally to combatIUU ishing eectively. As leaders in global ish trade, the United States o Americaand European Union Members recognize their obligation to eep illegal ish out o theworld maret. The agreement commits the two signatories to wor together to adopteective tools to combat IUU ishing.65
Strengthening isheries management capacity is undamental in developingcountries in order to acilitate sustainable isheries and to reduce and mitigate theimpacts o IUU ishing. Capacity development is especially important to support theull and eective implementation o eisting and new global instruments (e.g. the2009 Port State Measures Agreement [Bo 6]) and other isheries initiatives as tools tocombat IUU ishing.
Aquacuu gacWith the recent dramatic growth in auaculture, governance o this sector has become
increasingly important and has made remarable progress. Many governmentsworldwide utilize the the Code, in particular its Article 9. They also use FAO publishedguidelines or reducing administrative burdens and or improving planning andpolicy development in auaculture. In addition, several countries have adeuatenational auaculture development policies, strategies, plans and laws, and use “bestmanagement practices” and manuals on arming techniues that have been promotedby industry organizations and development agencies. The FAO Technical Guidelines onAuaculture Certiication, which were approved by the Twenty-ninth Session o COFIheld in Rome rom 31 January to 4 February 2011, constitute an additional importanttool or good governance o the sector. By setting minimum substantive criteria ordeveloping auaculture certiication standards, including animal health and welare,ood saety, environmental integrity and socio-economic aspects, these guidelines
provide direction or the development, organization and implementation o credibleauaculture certiication schemes. The ultimate aim is to ensure orderly and sustainabledevelopment o the sector.
Many governments have now recognized sustainability as the principal goal oauaculture governance because it enables auaculture to prosper or a long period.Long-term prosperity is predicated on ulilling the our prereuisites or sustainableauaculture development: technological soundness, economic viability, environmentalintegrity and social licence. Meeting these prereuisites also ensures that ecologicalwell-being is compatible with human well-being.
An important component o human well-being is employment. In the last threedecades, employment in the primary isheries and auaculture sector has grownaster than the world’s population and employment in traditional agriculture (seeEmployment section in Part 1, p. 41). Including employment in the primary auaculture
producing sector and in the secondary services and support sector together withhousehold dependants, more than 100 million people depend on the auaculturesector or a living; the industry has provided, and continues to create, a good numbero jobs, particularly non-seasonal jobs.
In many places, these employment opportunities have enabled young people to stayin their communities and have strengthened the economic viability o isolated areas.By generating incomes or emale worers, especially in ish processing and mareting,employment in auaculture has enhanced the economic and social status o womenin many places in developing countries, where more than 80 percent o auacultureoutput occurs. Through incomes rom these jobs and various multipliers, employmentin auaculture has also improved the accessibility to ood or many households and hasincreased auaculture’s contribution to the Millennium Development Goals. For these
reasons, auaculture has been heavily promoted in several countries with iscal andmonetary incentives.

7/28/2019 The State of World Fisheries and Aquaculture_2012
http://slidepdf.com/reader/full/the-state-of-world-fisheries-and-aquaculture2012 116/230

7/28/2019 The State of World Fisheries and Aquaculture_2012
http://slidepdf.com/reader/full/the-state-of-world-fisheries-and-aquaculture2012 117/230
World review o fsheries and aquaculture 99
rights. In reality, however, labour legislation will strie a balance between concern orsocial justice and control measures that discourage investment. Overly cumbersomeregulations can mae an otherwise viable business economically unproitable.
At a minimum, research on the governance o auaculture employment should leadto inormation on:• eisting labour legislation (monitoring, enorcement and compliance);• types o labour contracts; employment characteristics such as the nature o
employment (ull time or part time);• worers’ educational bacground, age and gender;• remuneration schemes including possible wage discrimination, salary levels and
competitiveness and minimum wages;• woring conditions such as hours o wor, occupational saety and job security;• miscellaneous beneits including bonuses, training opportunities, maternity leave,
health beneits (employer-provided insurance) and education grants.Improved governance o auaculture based on such improved nowledge will
beneit the development o auaculture in the long term.

7/28/2019 The State of World Fisheries and Aquaculture_2012
http://slidepdf.com/reader/full/the-state-of-world-fisheries-and-aquaculture2012 118/230
The State o World Fisheries and Aquaculture 2012100
notes
1 Figures or 2000 are higher than those reported in previous editions o The State o
World Fisheries and Aquaculture as FAO has revised downwards the non-ood useestimates or China rom 2000 onwards to relect improved national inormationon the sector. As a conseuence, per capita ish consumption or China, as well asor the world, has increased in comparison with previous assessments.
2 Fish import igures dier rom eport igures because the ormer are usuallyreported in c.i.. (cost, insurance and reight), whereas eports are reported at.o.b. (ree on board) values.
3 Garibaldi, L. 2012. The FAO global capture production database: a si-decade eortto catch the trend. Marine Policy , 36(3): 760–768.
4 Gulland, J.A. 1982. Why do ish numbers vary? Journal o Theoretical Biology ,97(1): 69–75.Hilborn, R. 1997. The reuency and severity o ish stoc declines and increases.In D.A. Hancoc, D.C. Smith, A. Grant and J.P. Beumer, eds. Developing and
sustaining world isheries resources. Proceedings o the 2nd World Fisheries
Congress, pp. 36–38. Collingwood, Australia, CSIRO Publishing.Soutar, A. and Isaacs, J.D. 1974. Abundance o pelagic ish during the 19th and20th centuries as recorded in anaerobic sediment o the Caliornias. Fishery
Bulletin, 72(2): 257–275.5 Coates, D. 2002. Inland capture ishery statistics o Southeast Asia: current status
and inormation needs. RAP Publication No. 2002/11. Bango, FAO RegionalOice or Asia and the Paciic, Asia-Paciic Fishery Commission. 114 pp. De Graa, G.J. and Oori-Danson, P.k. 1997. Catch and ish stock assessment in
Stratum VII o Lake Volta. Integrated Development o Artisanal Fisheries (IDAF)
(GHA/93/008). IDAF/Technical Report/97/I. Rome, FAO. 96 pp.kolding, J. and van Zwieten, P.A.M. 2006. Improving productivity in tropical lakes
and reservoirs. Challenge Program on Water and Food – Auatic Ecosystems and
Fisheries Review Series 1, Theme 3 o CPWF. Cairo, WorldFish Center. 139 pp.6 Allan, J.D., Abell, R.A., Hogan, Z., Revenga, C., Taylor, B.W., Welcomme, R.L. andWinemiller, k. 2005. Overishing o inland waters. BioScience, 55(12): 1041–1051.
7 FAO now uses three categories o stoc status as opposed to the si used inprevious assessments. The three categories are not new but are simply the resulto aggregating overeploited, recovering and depleted into the one categoryovereploited, and the categories o moderately eploited and undereploitedinto the single group non-ully eploited. Details o the classiication are providedin: FAO. 2011. Review o the state o world marine ishery resources. FAO Fisheriesand Auaculture Technical Paper No. 569. Rome. 334 pp.
8 Paragraph 31a in: United Nations. 2004. Johannesburg Plan o Implementation.IV. Protecting and managing the natural resource base o economic and socialdevelopment. In: UN Department o Economic and Social Aairs, Division or
Sustainable Development [online]. [Cited 16 April 2012]. www.un.org/esa/sustdev/ documents/WSSD_POI_PD/English/POIChapter4.htm
9 Wilson, D.T., Curtotti, R. and Begg, G.A., eds. 2010. Fishery status reports 2009:
status o ish stocks and isheries managed by the Australian Government .Canberra, Australian Bureau o Agricultural and Resource Economics – Bureau oRural Sciences. 535 pp.
10 Worm, B., Hilborn, R., Baum, J.k., Branch, T.A., Collie, J.S., Costello, C.,Fogarty, M.J., Fulton, E.A., Hutchings, J.A., Jennings, S., Jensen, O.P., Lotze, H.k.,Mace, P.M., McClanahan, T.R., Minto, C., Palumbi, S.R., Parma, A.M., Ricard, D.,Rosenberg, A.A., Watson, R. and Zeller, D. 2009. Rebuilding global isheries.Science, 325(5940): 578–585.
11 World Ban, FAO and WorldFish Center. 2010. The hidden harvests: the global
contribution o capture isheries. Washington, DC, World Ban.

7/28/2019 The State of World Fisheries and Aquaculture_2012
http://slidepdf.com/reader/full/the-state-of-world-fisheries-and-aquaculture2012 119/230
World review o fsheries and aquaculture 101
12 FAO. (orthcoming). Report o the Workshop to Develop an FAO Strategy or
Assessing the State o Inland Capture Fishery Resources, Rome, Italy, 7–9 December
2011. FAO Fisheries and Auaculture Report. Rome.13 FAO. 2009. Securing sustainable small-scale isheries: bringing together responsible
isheries and social development [online]. Committee on Fisheries. Twenty-eighthSession, Rome, Italy, 2–6 March 2009. COFI/2009/7. [Cited 16 April 2012]. tp://tp.ao.org/docrep/ao/meeting/015/3984e.pd
14 Op. cit., see note 12.15 World Trade Organization. 2011. World Trade Report 2011. The WTO and
preerential trade agreements: rom co-existence to coherence. Geneva,Switzerland. 251 pp. (also available at www.wto.org/english/res_e/boosp_e/ anrep_e/world_trade_report11_e.pd).
16 The International Ban or Reconstruction and Development / TheWorld Ban. 2012. Global Economic Prospects: Uncertainties and
Vulnerabilities. Volume 4, January 2012. Washington, DC. 160 pp.(also available at http://siteresources.worldban.org/INTPROSPECTS/ Resources/334934-1322593305595/8287139-1326374900917/GEP_January_2012a_
FullReport_FINAL.pd).17 Compared with previous editions o The State o World Fisheries and Aquaculture,
the share uoted or low-income ood-deicit countries (LIFDCs) diers signiicantlyas a conseuence o the change in the composition o LIFDCs. The new list o theLIFDCs stands at 70 countries, seven ewer than in the 2009 LIFDC list. The sevencountries no longer on the list are: Angola, Armenia, Azerbaijan, China, EuatorialGuinea, Morocco and Swaziland. All seven have graduated rom the list havingcompleted the “transitional phase”, eceeding the World Ban income thresholdor three consecutive years.
18 See note 2.19 Statistics reported in this section are based on data rom the Food Balance
Sheets published in FAO yearbook. Fishery and Aquaculture Statistics. 2010 (FAO,
2012). Consumption data or 2009 should be considered as preliminary. Somediscrepancies may occur with other sections that uote data made available toFAO more recently. Food Balance Sheet data calculated by FAO reer to “averageood available or consumption”, which, or a number o reasons (or eample,waste at the household level), is not eual to average ood intae or average oodconsumption. It should be noted that the production rom subsistence isheries aswell as border trade between some developing countries could be incompletelyrecorded and might thereore lead to an underestimation o consumption.
20 FAO/WHO. 2011. Report o the Joint FAO/WHO Expert Consultation on the Risks
and Beneits o Fish Consumption, Rome, 25–29 January 2010. FAO Fisheries andAuaculture Report No. 978. Rome, FAO. 50 pp.
21 Mozaarian, D. and Rimm, E.B. 2006. Fish intae, contaminants, and humanhealth: evaluating the riss and the beneits. JAMA, 296(15): 1885–1899.
22 Peet, M. and Stoes, C. 2005. Omega-3 atty acids in the treatment o psychiatricdisorders. Drugs, 65(8): 1051–1059.Young, G. and Conuer, J. 2005. Omega-3 atty acids and neuropsychiatricdisorders. Reproduction Nutrition Development , 45(1): 1–28.
23 Op. cit., see note 20.24 In this section, the term “ish” indicates ish, crustaceans, molluscs and other
auatic invertebrates, but ecludes auatic mammals and auatic plants.25 FAO. 2011. The State o Food Insecurity in the World 2011. Rome. 62 pp.26 United Nations, Department o Economic and Social Aairs, Population Division.
2012. World Urbanization Prospects: The 2011 Revision. CD–ROM edition – data indigital orm.
27 United Nations, Department o Economic and Social Aairs, Population Division.
2011. World Population Prospects: The 2010 Revision, Highlights and Advanced Tables [online]. New Yor, USA. [15 May 2012]. http://esa.un.org/unpd/wpp/ Documentation/pd/WPP2010_Highlights.pd

7/28/2019 The State of World Fisheries and Aquaculture_2012
http://slidepdf.com/reader/full/the-state-of-world-fisheries-and-aquaculture2012 120/230
The State o World Fisheries and Aquaculture 2012102
28 The Web site or Rio+20 is www.uncsd2012.org/rio20/ 29 IOC/UNESCO, IMO, FAO, UNDP. 2011. A blueprint or ocean and coastal sustainability
[online]. Paris, IOC/UNESCO. [Cited 10 May 2012]. www.unesco.org/new/ileadmin/ MULTIMEDIA/Hq/SC/pd/interagency_blue_paper_ocean_rioPlus20.pd
30 Staeholder Forum. 2011. Monaco message [online]. [Cited 10 May 2012]. www.staeholderorum.org/ileadmin/iles/Monaco%20Message.pd
31 UNEP, FAO, IMO, UNDP, IUCN, World Fish Center and GRIDArendal. 2012. Green
economy in a blue world [online]. [Cited 10 May 2012]. www.unep.org/pd/green_economy_blue.pd
32 Allison, E.H., Bell, J.D., Franz, N., Fuentevilla, C., McConney, P., Robinson, J.,Westlund, L. and Willmann, R. 2012. Blending green and blue economics:sustainability transitions in the isheries and auaculture sector o small islanddeveloping States.
33 FAO. 2011. Global sustainable isheries management and biodiversity conservation
in the areas beyond national jurisdiction (ABNJ) [online]. [Cited 30 May 2012]. tp:// tp.ao.org/FI/brochure/GEF-ABNJ/GEF-ABNJ.pd
34 FAO. 2009. Report o the Global Conerence on Small-scale Fisheries – Securing
Sustainable Small-scale Fisheries: Bringing Together Responsible Fisheries and Social Development, Bangkok, Thailand, 13–17 October 2008 . FAO Fisheries andAuaculture Report No. 911. Rome. 189 pp.
35 FAO. 2010. Report o the APFIC/FAO Regional Consultative Workshop – Securing
Sustainable Small-Scale Fisheries: Bringing Together Responsible Fisheries and
Social Development, Windsor Suites Hotel, Bangkok, Thailand, 6–8 October 2010.RAP Publication 2010/19. Bango. 56 pp.FAO. 2011. Report o the Arican Regional Consultative Workshop on Securing
Sustainable Small-Scale Fisheries: Bringing Together Responsible Fisheries and
Social Development, Maputo. Mozambique, 12–14 October 2010. FAO Fisheriesand Auaculture Report No. 963. Rome. 68 pp.FAO. 2011. Report o the Latin America and Caribbean Regional Consultative
Workshop on Securing Sustainable Small-Scale Fisheries: Bringing Together Responsible Fisheries and Social Development, San José, Costa Rica, 20–22 October
2010. FAO Fisheries and Auaculture Report No. 964. Rome. 77 pp.36 FAO. 2011. Discussion document: towards voluntary guidelines on securing
sustainable small-scale isheries. In: FAO Fisheries and Aquaculture Department
[online]. Rome. [Cited 24 November 2011]. www.ao.org/ishery/topic/18241/en37 kurien, J. and Willmann, R. 2009. Special considerations or small-scale isheries
management in developing countries. In Cochrane, k. and Garcia, S., eds. A ishery
manager’s guidebook , pp. 404–424. Second edition. Chichester, Uk, FAO and Wiley-Blacwell. 536 pp.
38 Reer to paragraph 32 o: United Nations General Assembly. 2010. Report o the
resumed Review Conerence on the Agreement or the Implementation o the
Provisions o the United Nations Convention on the Law o the Sea o 10 December
1982 relating to the Conservation and Management o Straddling Fish Stocks and
Highly Migratory Fish Stocks [online]. [Cited 28 November 2011]. http://daccess-dds-ny.un.org/doc/UNDOC/GEN/N10/465/87/PDF/N1046587.pd?OpenElement
39 Paragraph 38 in: United Nations General Assembly. 2011. Report on the work
o the United Nations Open-ended Inormal Consultative Process on Oceans
and the Law o the Sea at its twelth meeting [online]. [Cited 28 November2011]. http://daccess-dds-ny.un.org/doc/UNDOC/GEN/N11/431/39/PDF/N1143139.pd?OpenElement
40 Op. cit., see note 38, paragraph 75.41 FAO. 2011. Central Asian and Caucasus Regional Fisheries and Auaculture
Commission (CACFish). In: FAO Fisheries and Aquaculture Department [online].Rome. [Cited 28 November 2011]. www.ao.org/ishery/rb/cacish/en
42 FAO. 2011. Southern Indian Ocean Fisheries Agreement. In: FAO Legal Oice [online]. Rome. [Cited 28 November 2011]. www.ao.org/Legal/treaties/035s-e.htm

7/28/2019 The State of World Fisheries and Aquaculture_2012
http://slidepdf.com/reader/full/the-state-of-world-fisheries-and-aquaculture2012 121/230
World review o fsheries and aquaculture 103
43 Inter-American Tropical Tuna Commission. 2011. Antigua Convention [online].[Cited 28 November 2011]. www.iattc.org/IATTCdocumentationENG.htm
44 South Paciic Regional Fisheries Management Organisation. 2011. South Paciic
Regional Fisheries Management Organisation [online]. [Cited 28 November 2011].www.southpaciicrmo.org/
45 North Atlantic Salmon Conservation Organization. 2011. Report o the ‘Next Steps’
or NASCO Review Group [online]. [Cited 28 November 2011]. www.nasco.int/ pd/2011%20papers/CNL(11)12.pd
46 North East Atlantic Fisheries Commission. 2011. NEAFC Perormance Review.In: North East Atlantic Fisheries Commission [online]. [Cited 28 November 2011].www.neac.org/news/579
47 Indian Ocean Tuna Commission. 2009. Report o the IOTC Perormance Review
Panel: January 2009 [online]. [Cited 28 November 2011]. www.iotc.org/iles/misc/ perormance%20review/IOTC-2009-PRP-R[E].pd
48 Commission or the Conservation o Antarctic Marine Living Resources. 2008.Report o the CCAMLR Perormance Review Panel. In: CCAMLR [online].[Cited 28 November 2011]. www.ccamlr.org/pu/E/revpanrep.htm
49 South East Atlantic Fisheries Organisation. 2010. Report o the Perormance ReviewPanel. In: South East Atlantic Fisheries Organisation [online]. [Cited 28 November2011]. www.seao.org/PerormanceReview.html
50 General Fisheries Commission or the Mediterranean. 2011. Perormance Review
o the General Fisheries Commission or the Mediterranean and Black Sea [online].[Cited 28 November 2011]. http://151.1.154.86/GcmWebSite/GFCM/35/CAF_II_2011_In.5_COC_V_In.4_GFCM_xxxV_2011_In.8.pd
51 Northwest Atlantic Fisheries Organization. 2011. About NAFO. In: Northwest
Atlantic Fisheries Organization [online]. [Cited 28 November 2011]. www.nao.int/ about/rames/about.html
52 Op. cit., see note 39, paragraph 38.53 Op. cit., see note 38, paragraph 77.
54 Op. cit., see note 38, paragraph 76.55 Damanai, M. 2011. U.S. and Europe join orces to stop pirate ishing.In: Europa [online]. Brussels. [Cited 28 November 2011]. http://ec.europa.eu/ commission_2010-2014/damanai/headlines/press-releases/2011/09/20110907_2_en.htm
56 United Nations General Assembly. 2011. Oceans and the law o the sea. Report o
the Secretary-General. Addendum [online]. A/66/70/Add.1. New Yor, USA.[Cited 29 November 2011]. http://daccess-dds-ny.un.org/doc/UNDOC/GEN/ N11/296/00/PDF/N1129600.pd?OpenElement
57 United Nations General Assembly. 2011. Resolution adopted by the General
Assembly. Sustainable isheries, including through the 1995 Agreement or the
Implementation o the provisions o the United Nations Convention on the Law
o the Sea o 10 December 1982 relating to the Conservation and Management o
Straddling Fish Stocks and Highly Migratory Fish Stocks, and related instruments
[online]. A/RES/65/38. New Yor, USA. [Cited 29 November 2011]. http://daccess-dds-ny.un.org/doc/UNDOC/GEN/N10/514/82/PDF/N1051482.pd?OpenElement
58 FAO. 2011. Report o the twenty-ninth session o the Committee on Fisheries.
Fisheries and Auaculture Report No. 973. FAO. Rome. 59 pp.IUU ishing is a standing COFI agenda item.
59 United Nations General Assembly. 2011. Report on the work o the United Nations
Open-ended Inormal Consultative Process on Oceans and the Law o the Sea
at its twelth meeting [online]. A/66/186. New Yor, USA. [Cited 29 November2011]. http://daccess-dds-ny.un.org/doc/UNDOC/GEN/N11/431/39/PDF/N1143139.pd?OpenElement
60 Op. cit., see note 59.61 South East Atlantic Fisheries Organisation. 2010. Report o the Seventh Annual
Meeting o the Commission, 2010 Report. [online]. [Cited 29 November 2011].www.seao.org/TheCommission/Reports/2010%20Commission%20Report%20inale.pd

7/28/2019 The State of World Fisheries and Aquaculture_2012
http://slidepdf.com/reader/full/the-state-of-world-fisheries-and-aquaculture2012 122/230
The State o World Fisheries and Aquaculture 2012104
62 Commission or the Conservation and Management o Antarctic Marine LivingResources. 2011. Report o the twenty-ninth meeting o the Commission, Hobart,
Australia, 25 October – 5 November 2010, Item 9, paras: 9.3–9.4. [online]. Hobart,Australia. [Cited 29 November 2011]. www.ccamlr.org/pu/E/e_pubs/cr/10/all.pd
63 North East Atlantic Fisheries Commission. 2010. Inormation on eperience gainedon combating IUU ishing in the NEAFC Area. A report prepared by the NEAFCSecretariat or the CBD COP 10, Nagoya, October 2010. In: North East Atlantic
Fisheries Commission [online]. London. [Cited 29 November 2011]. www.neac.org/ international/3539
64 European Commission. 2008. Council Regulation (EC) No 1005/2008 o 29September 2008 establishing a Community system to prevent, deter and eliminateillegal ishing, amending Regulations (EEC) No 2847/93, (EC) No 1936/2001 and (EC)No 601/2004 and repealing Regulations (EC) No 1447/1999. In: EUR-Lex [online].Brussels. [Cited 29 November 2011]. http://eur-le.europa.eu/LeUriServ/LeUriServ.do?uri=CELEx:32008R1005:EN:NOT
65 European Commission. 2011. Joint statement between the European Commission
and the United States Government on eorts to combat illegal, unreported
and unregulated (IUU) ishing [online]. [Cited 29 November 2011]. Washington,DC. http://ec.europa.eu/commission_2010-2014/damanai/headlines/press-releases/2011/09/20110907_jointstatement_eu-us_iuu_en.pd
66 World Wildlie Fund. 2012. Auaculture: shrimp. In: WWF [online]. Washington,DC. [Cited 13 April 2012]. www.worldwildlie.org/what/globalmarets/auaculture/ dialogues-shrimp.htmlSeaoodSource. 2010. NGO taes aim at armed salmon critics. In: SeaoodSource.
com [online]. [Cited 13 April 2012]. www.seaoodsource.com/newsarticledetail.asp?id=4294990320
67 Arengo, E., Ridler, N. and Hersoug, B. 2010. State o inormation on social impacts
o salmon arming. A report by the Technical Working Group o the Salmon
Aquaculture Dialogue [online]. [Cited 13 April 2012]. www.worldwildlie.org/what/
globalmarets/auaculture/WWFBinaryitem16115.pd68 FAO. 2010. Report o the FAO Workshop on Child Labour in Fisheries and
Aquaculture in cooperation with ILO, Rome, 14–16 April 2010. FAO Fisheries andAuaculture Report No. 944. Rome. 24 pp.Halim, U. 2010. Child labour in ishery and aquaculture: need or a perspective [online]. Paper presented at the Epert Consultation on Child Labour inFisheries organized by FAO and ILO. [Cited 13 April 2012]. www.ao-ilo.org/ileadmin/user_upload/ao_ilo/pd/WorshopFisheries2010/WFPapers/ UjjainiHalimWFFChildLabourFishery_Auaculture.pdHalim, U. 2003. Political ecology o shrimp aquaculture in India: a case study in
Orissa. Saarbruecen, Germany, Verlag uer Entwiclungspoliti. 286 pp.

7/28/2019 The State of World Fisheries and Aquaculture_2012
http://slidepdf.com/reader/full/the-state-of-world-fisheries-and-aquaculture2012 123/230
PART 2
seleCted IssUes
In FIsHerIes And
AQUACUltUre

7/28/2019 The State of World Fisheries and Aquaculture_2012
http://slidepdf.com/reader/full/the-state-of-world-fisheries-and-aquaculture2012 124/230

7/28/2019 The State of World Fisheries and Aquaculture_2012
http://slidepdf.com/reader/full/the-state-of-world-fisheries-and-aquaculture2012 125/230
107
seleCted IssUes In FIsHerIes And
AQUACUltUre
Maiamig g i fihi a aquacuu:fm cgii ai
tHe IssUe
“Gender mainstreaming is not only a uestion o social justice but is necessary orensuring euitable and sustainable human development. The long-term outcomeo gender mainstreaming will be the achievement o greater and more sustainablehuman development or all.”1
In 1997, the United Nations Economic and Social Council (ECOSOC) adopted gendermainstreaming as the methodology by which the entire UN system would wor towardsthe advancement o women and gender euality goals, noting that: “Mainstreaminga gender perspective is the process o assessing the implications or women and meno any planned action, including legislation, policies or programmes, in all areas and atall levels. It is a strategy or maing women’s as well as men’s concerns and eperiencesan integral dimension o the design, implementation, monitoring and evaluation o
policies and programmes in all political, economic and societal spheres so that womenand men beneit eually and ineuality is not perpetuated. The ultimate goal omainstreaming is to achieve gender euality”.2
In 2000, all 193 UN Member States and more than 23 international organizationsagreed to the Millennium Development Goals (MDGs), and the issue o promotinggender euality and empowering women (MDG 3) was again highlighted on theinternational agenda. The objective was one o ensuring that, in whatever sectorthey may be woring, men and women should have eual rights to participate in thedevelopment process, and their interests and needs should be protected.
Despite this, women tend to be marginalized in a variety o ways – and this is verymuch true or women in the isheries and auaculture sector. Thus, more than 30 yearsater the 1979 Convention on the Elimination o All Forms o Discrimination AgainstWomen, some 15 years ater the ECOSOC decision and more than a decade ater the
Millennium Declaration, and with only 3 years to go beore the goal o achieving theMDGs by 2015, the issue at hand is how to ensure genuine and active mainstreaming ogender and the many acets o gender considerations in the isheries and auaculturesector.
Indeed, until recently, gender analysis in ishing communities ocused mainly onthe dierent occupational roles o men and women, i.e. that men usually do theactual ishing and women are to a large etent involved in post-harvest and maretingactivities. While the role o women in the management and utilization o naturalresources is generally acnowledged, their role does not carry the same weight asthat o men. Given that production goals have tended to be the ocus o research andpolicy, the predominantly male catching sector has remained the centre o attention.3
However, with the shit to a multidimensional and more holistic deinition o
poverty and the increased ocus on reducing vulnerability, gender has become morecentral to isheries policy and development practice. Fisheries resource management

7/28/2019 The State of World Fisheries and Aquaculture_2012
http://slidepdf.com/reader/full/the-state-of-world-fisheries-and-aquaculture2012 126/230

7/28/2019 The State of World Fisheries and Aquaculture_2012
http://slidepdf.com/reader/full/the-state-of-world-fisheries-and-aquaculture2012 127/230
109Selected issues in fsheries and aquaculture
and academic interest in the comple sociology and anthropology o ishingcommunities and practices.
However, it is nown that there are vital dierences in the power positions o menand women (Bo 9); as a result, women generally have less control over the value chain,their activities are less proitable, and they have access to ish o poorer uality. Women
Bo 8 The contribution o women in the auaculture sector
FAO’s National Auaculture Sector Overview1 provides insights into the roles
and contributions o women in the auaculture sector in countries around
the globe:
• In Bangladesh, women’s non-governmental organizations and other
entrepreneurs have encouraged women to participate in auaculture
activities.• In Belize, most worers involved in processing are women rom rural
communities where unemployment levels are high and poverty is
greatest.
• In Cuba, emale worers constitute 27 percent o the auaculture
wororce (19 percent are intermediate and higher education
technicians; 11 percent have attended higher education institutions).
• In Estonia, the gender ratio o the auaculture wororce is 1:1.
• In Israel, the wororce is a silled one because o the highly technical
nature o auaculture in the country. In a sector where women mae
up about 95 percent o the wororce, most worers have a high
school diploma while a high percentage have a degree (Bachelor o
Science or Master o Science).• In Jamaica, about 8–11 percent o ish armers are women who own
and operate ish arms; and in processing plants, women dominate
the wororce.
• In Malaysia, women account or about 10 percent o the total
auaculture wororce, and they are mostly involved in reshwater
auaculture and hatchery operations or marine ish, shrimp and
reshwater ish.
• In Panama, 80 percent o the wororce in processing plants are
women, but in the production sector only 7 percent o worers are
women.
• In Sri Lana, women constitute 5 percent o the wororce in shrimp
auaculture and 30 percent o those engaged in the production and
breeding o ornamental ish.Inormation such as this provides a starting point or learning about the
dierences between men and women in these situations and about whether
there are similar opportunities, wages and beneits – or whether there are
policy, governance and operational gaps that need to be addressed in order
to really mainstream gender in the sector.
1 FAO. 2012. National Auaculture Sector Overview. NASO Fact Sheets. In: FAO Fisheries and
Aquaculture Department [online]. Rome. [Cited 20 March 2012]. www.ao.org/shery/naso/ search/en

7/28/2019 The State of World Fisheries and Aquaculture_2012
http://slidepdf.com/reader/full/the-state-of-world-fisheries-and-aquaculture2012 128/230
The State o World Fisheries and Aquaculture 2012110
tend to be ecluded rom the most proitable marets and enterprises, and romhighly paid posts in ish-processing actories even though they mae up the majority oworers in the post-harvest sector. Compared with men, they are oten greater losersrom increasing maret globalization, and they are more vulnerable to poor servicesand catch declines.
The most signiicant role played by women in both artisanal and industrial isheriesis at the processing and mareting stages. Active in all regions o the world, in somecountries, women have become signiicant entrepreneurs in ish processing. In act,most ish processing is perormed by women, either in their own household-levelindustries or as wage labourers in the large-scale processing industry. For eample, inWest Arica, women play a major role – they usually own capital and are directly and
vigorously involved in the coordination o the isheries chain, rom production to thesale o ish.
Some o the actors that weaen women’s capabilities in terms o participation indecision-maing are:
• lower literacy and education levels;• time burdens and constraints;• mobility burdens and constraints;• participation in less-ormal organizations that are, as a result, weaer
organizations;• ewer or reduced organizational sills in the sense that women reuently
associate in less-ormal organizations and, where part o ormal organizations,reuently do not hold leadership roles such as president and secretary
because o poor literacy sills.
Bo 9 Dierences in power lead to dierent opportunities
Artisanal isherwomen’s relatively insecure access to ish resources and,
hence, to ish leads to dierent opportunities or women and men.
When ish business activities are being upscaled in response to increasing
globalization, local women ris being orced out o the business and,
thereore, not beneiting rom development and maret opportunities in
the sector in which they were previously etensively involved. Eamples
are:
• In India in the early 1980s, shrimp mareting was initially largely in
the hands o women. However, when shrimp became a higher-priced
commodity, male traders arrived on bicycles and later in motorized
transport, eventually orcing the isherwomen out o this trade (Bay
o Bengal Programme).• In Cotonou, Benin, urban-based male and emale traders entered the
ish trade, orcing women rom the ishing villages out o business
and maing their access to ish more diicult (Programme or the
Integrated Development o Artisanal Fisheries in West Arica).
• In Senegal, as ishermen change gear and the ocus o their eort in
response to changing proit opportunities in their ishery (e.g. shiting
rom harvesting pelagic ish to cephalopods) and switch rom selling
into local to eport marets, the local post-harvest sector can suer
(Networ on Fishery Policies in West Arica).

7/28/2019 The State of World Fisheries and Aquaculture_2012
http://slidepdf.com/reader/full/the-state-of-world-fisheries-and-aquaculture2012 129/230
111Selected issues in fsheries and aquaculture
Very importantly, the absence o women rom most post-harvest statistics meansthat it is etremely diicult to uantiy the number o women and the etent othe value addition and contribution their wor maes to economies. Nonetheless,ineualities are beginning to be uantiied and publicized.
PossIBle solUtIons
Women’s participation as eual and productive partners in the isheries andauaculture sector has signiicant impacts on households’ nutrition and livingstandards. I isheries and auaculture projects generate the data or and, potentially,include analyses o, all gender aspects (livelihood actors, relationships, actions andresults), they can contribute to gender euality and promote women’s participation asactive agents or change in the sector (Bo 10).
daa uiComprehensive and accurate se-disaggregated statistics are lacing, and this gap must beilled as one o the irst steps in gender mainstreaming at the policy level. quantitative andualitative gender-sensitive indicators can be ormulated with ishing communities to see
how well policies and associated development projects satisy the practical and strategicneeds o men and women, and to help reduce eisting gender gaps.
At the more macro level, statistical censuses should ocus more attention on areasin which women are relatively more active. They should collect se-disaggregated dataon ownership o, access to and control over productive resources such as land, water,euipment, inputs, inormation and credit.
Mac- pic uiAs in other sectors, women’s empowerment in isheries reuires eamination othe means o production, gender relationships, and how to create eualities. Newinstitutional arrangements are being created in response to climate change, resourcedepletion, auaculture development and global trade. All these actors are increasingly
aecting the sector, and it is vital that gender considerations are built into the new
Bo 10 quantiying ineualities
A study conducted or the United States Agency or International
Development on the Bangladesh shrimp value chain1 revealed dierences
in earnings between women and men (see table), a inding that created a
starting point or addressing gender-related discrepancies.
Acii Pcag
Catching, sorting ry 64
Repairing ponds, undertaing casual agricultural labour 82
Processing plants – pacing section 72
Processing plants – cooing/breading section 60
rai aig f m cmpa ih h f ma cupa
1 Development & Training Services, Inc. 2006. A pro-poor analysis o the shrimp sector in
Bangladesh [online]. USAID. [Cited 21 May 2012]. www.usaid.gov/our_wor/cross-cutting_programs/wid/pubs/Bangladesh_Shrimp_Value_Chain_Feb_2006.pd

7/28/2019 The State of World Fisheries and Aquaculture_2012
http://slidepdf.com/reader/full/the-state-of-world-fisheries-and-aquaculture2012 130/230
The State o World Fisheries and Aquaculture 2012112
arrangements. Increasingly, practical manuals or gender mainstreaming and genderanalysis are being produced to acilitate just such changes.7
Responsible governance o tenure and tenure security, especially o access to naturalresources, are issues where mainstreaming gender can have a mared eect. Providingpolicies that create the opportunities or ensuring euitable resource access rights,access to marets, beneits rom auaculture and codes o conduct or the industry –especially or the most marginalized and poorest categories o men and women – canempower people to become more eual staeholders. However, where governance andpolicies are developed without a strategic assessment o the relative roles o the menand women involved, the eect can be to disempower staeholders.
ruc c a accIn addition to the responsible governance o tenure, the broader issue o women’saccess to and control over resources is an important gender consideration. For womento have a real impact on their economic situation and their position in society, itis essential that they have access to and control over auatic resources as well asappropriate inormation that enables them to use such resources wisely.8
dpm aa uiGendered value-chain approaches can be used to recognize and value women’s rolesand contributions to agriculture and isheries. To mainstream gender euality indevelopment cooperation programmes and related activities, a number o steps areessential:9
• Reuire that programmes and related activities generate or obtain se-disaggregated statistics (not only at the level o project and/or programmebeneiciary, but also at both middle and macro levels o policy andgovernance) and ualitative inormation on the situation o women and menor the population in uestion. This inormation is reuired.
• Conduct a gender analysis with regard to: the gendered division o labour;
access to and control over material and non-material resources; the legal basisor gender euality/ineuality; political commitments with respect to gendereuality; and the culture, attitudes and stereotypes that aect all precedingissues. Gender analyses should be conducted at the micro, meso and macrolevels.
• Conduct a gender analysis o a programme or project concept to revealwhether gender euality objectives are articulated in the initial idea, whetheror not the planned activity will contribute to or challenge eisting ineualities,and whether there are any gender issues that have not been addressed.
• During the identiication and ormulation phases, ensure that the genderanalysis contributes to the identiication o entry points or actions that willbe needed in order to meet gender euality objectives.
• Strengthen the participatory and organizational capacity o staeholders at
various levels so that they are better able to translate gender concerns intoactions. This includes strengthening emale umbrella organizations that canparticipate in debates and in project and programme processes.
• Put in place a gender-sensitive monitoring and evaluation system rom thedesign phase onwards, including the establishment o indicators to measurethe etent to which gender euality objectives are met and changes in genderrelations are achieved.
o h gu – cig h gap i cia capiaBuilding women’s social capital can be an eective way to improve inormationechange and resource distribution, to pool riss and to ensure that women’s voicesare heard in decision-maing at all levels. This includes strengthening women’s
organizational abilities and roles and developing the capacity o women to tae onleadership positions and engage with decision-maers and other staeholders.

7/28/2019 The State of World Fisheries and Aquaculture_2012
http://slidepdf.com/reader/full/the-state-of-world-fisheries-and-aquaculture2012 131/230
113Selected issues in fsheries and aquaculture
Functioning as production cooperatives, savings associations and mareting groups,women’s groups can promote production and help women maintain control over theadditional income they earn, as has been demonstrated by a project based aroundpolyculture ish production in Bangladesh. As the project proved successul in providingadditional incomes, the position o women within the household and community wasalso strengthened.10 Indeed, in communities with a high level o gender segregation,single-se groups may lead to more desirable outcomes or women.11
However, ecluding men can sometimes generate unnecessary obstacles. A projectto introducing the new livelihood strategy o mud-crab production to supply hotels onUnguja Island, United Republic o Tanzania, ecluded men. The resultant anger amongthe men added transaction and input costs as women had to rely on a small number omale ishers or seedstoc and eedstus.12
The clear message here is that interventions within the local sociocultural dynamicsshould base their interventions on the speciic contet – including the gendersegregation within a community – and the underlying problem.
reCent ACtIons
The issues o women, gender and isheries have been highlighted in a series ointernational and now global symposiums and other related initiatives:13
• The Global Conerence on Auaculture 2010 delivered the Phuet Consensusand responded to the recommendations o Epert Panel VI.3 (SustainableAuaculture by Developing Human Capacity and Enhancing Opportunitiesor Women Development) by including a recommended action to: “Supportgender sensitive policies and implement programmes in line with globallyaccepted principles o gender euality and women’s empowerment.”
• The 2011 Special Worshop on Future Directions or Gender in Auacultureand Fisheries Action, Research and Development (Shanghai, China)14 prepareda woring drat o a woring vision statement or mainstreaming genderin the auaculture and isheries sectors: “To promote and achieve gender
euity in the auaculture and isheries sector in support o responsible andsustainable use o resources and services or ood and nutrition security,uality o lie o all staeholders, primarily women, children, vulnerable andmarginalized groups/communities.”
Other ongoing initiatives that have contributed to increasing attention on genderissues in isheries and auaculture include:
• the triennial symposia on women and gender in isheries and auacultureorganized by the Asian Fisheries Society;
• the Women in Fisheries publications o the Secretariat o the Paciic Community,and Yemaya (published by the International Collective in Support o Fishworers);
• the Asia−Europe Meeting Auaculture Platorm (AASEM09) project wor onEmpowering Vulnerable Staeholder Groups.
oUtlook
No single blueprint eists or closing the gender gap as yet, but some basic principlesare universal,15 and its seems plausible that governments, the international communityand civil society will wor together to:
• eliminate discrimination under the law, improving women’s endowments,opportunities and agency to help shape more positive outcomes or the netgeneration;
• promote eual access to resources and opportunities, reducing barriers tomore eicient allocation o women’s sills and talents and helping to generatelarge (and growing) productivity gains;
• ensure that policies and programmes are gender-aware, increasing women’sindividual and collective agency to produce better outcomes, institutions and
policy choices;• mae women’s voices heard as eual partners or sustainable development.16

7/28/2019 The State of World Fisheries and Aquaculture_2012
http://slidepdf.com/reader/full/the-state-of-world-fisheries-and-aquaculture2012 132/230
The State o World Fisheries and Aquaculture 2012114
In addition to helping to achieve the MDG o promoting gender euality andempowering women, mainstreaming gender is an essential component o alleviatingpoverty, achieving greater ood and nutrition security, and enabling sustainabledevelopment o isheries and auaculture resources.
Gender considerations should be irmly placed on all isheries and auaculturepolicy agendas at all geographical and institutional scales. Attention to gender isneeded in order to help improve women’s productivity and enhance human justice.Increasing awareness on gender and being gender-sensitive are no longer suicient.A coalition o gender champions, inormed researchers, epert networs and policyadvocates will be necessary.17
A ppui aia p a u ga f a uii cuiWomen who are oered and provided with the best circumstances to enhance theirsocio-economic empowerment will also be able to contribute meaningully to oodsecurity, poverty alleviation and improved well-being or themselves, their amiliesand their communities. In short, they will help to create a world in which responsibleand sustainable use o isheries and auaculture resources can mae an appreciable
contribution to human well-being, ood security and poverty alleviation.
A ppui f cmic mpmEconomic empowerment should be the end goal o a road map on gender in isheriesand auaculture. Economic empowerment is not narrowly ocused on the inancialcomponent but rather on having the ability to recognize and eploit opportunitiesto mae wealth and to mae the right decisions, which means having the capacityor analytical thining – and this boils down to having a good education (ormal orinormal) and appropriate human capacity development.
A ppui cibu fuBy mainstreaming gender in the isheries and auaculture sector, women will be given
a chance to recognize and appropriately eploit opportunities to generate wealth andto mae the right decisions in terms o more responsible isheries and auaculturepractices and sustainable development.
Imp ppa f a ffci p ia ifihi a aquacuu
tHe IssUe
Fishers, ish armers and their communities around the world tend to be particularlyvulnerable to disasters. This is because o their location, the characteristics o theirlivelihood activities, and their overall high levels o eposure to natural hazards,
livelihood shocs and climate change impacts. Eposure and vulnerability to thesehazards is increasing. For eample, in the past century, there has been an increasingtrend in the number o natural disasters reported around the world (Figure 36).
The social, economic and environmental impact o these disasters is signiicant,with disproportionate eects in developing countries and on vulnerable groups.Between 2000 and 2004, o the 262 million people aected annually by disastersrelated to weather and climate, more than 98 percent lived in developing countriesand the vast majority were dependent mainly on agriculture and isheries or theirlivelihoods.18 Loss o lie rom such events is more prevalent in developing countries –rom 1970 to 2008, more than 95 percent o deaths rom natural disasters were indeveloping countries.19 In 2010 alone, a total o 385 natural disasters illed more than297 000 people worldwide, aected more than 217 million others and caused almost
US$124 billion o economic damages.20 It is acnowledged that the poor will be mostaected by such hazards in the uture and that this is liely to undermine progress

7/28/2019 The State of World Fisheries and Aquaculture_2012
http://slidepdf.com/reader/full/the-state-of-world-fisheries-and-aquaculture2012 133/230
115Selected issues in fsheries and aquaculture
toward poverty reduction.21 While total economic damage rom disasters tends to behigher in developed countries, as a percentage o gross domestic product it is higher indeveloping countries.22
The types o disasters that aect the isheries and auaculture sector includenatural disasters such as storms, cyclones/hurricanes with associated looding and tidalsurges, tsunamis, earthuaes, droughts, loods and landslides. Disasters o humanorigin aecting the sector have included oil and chemical spills and nuclear/radiologicalmaterial. Food and nutrition security, post-conlict and protracted crises, HIV/AIDS andsector-speciic hazards (e.g. transboundary auatic animal diseases and pest outbreas)can also have signiicant impacts on auaculture production and isheries. In additionto the tragic loss o lie, the eects o disasters on the sector can include the loss olivelihood assets such as boats, gear, cages, auaculture ponds and broodstoc, post-harvest and processing acilities, and landing sites. In the longer term, the impact othe eects o disasters can be considerably mitigated by the eectiveness o responseactivities. However, damage caused by disasters can have social and economic impactsthroughout and well beyond the sector (such as in terms o reduced employment andood availability). Other longer-term disasters such as ish disease outbreas can build
up over time and signiicantly aect production.The vulnerability o countries and communities to these hazards is determined,
on the one hand, by their eposure to such hazards and, on the other, by their abilityto withstand (sensitivity), respond to and recover rom (adaptive capacity) the eectso such hazards. Thus, susceptibility is directly aected by underlying issues such asood and nutrition insecurity, wea institutions, conlict and poor access to marets.However, the way each o these issues aects people varies considerably. Men andwomen, the old and the young, the rich and the poor, and small-scale and large-scaleundertaings are all aected dierently and have dierent ways o responding tohazards that aect them. Dierent people can also have uite distinctly dierentneeds in the ace o an emergency, ace dierent threats and have dierent sills andaspirations.23
For coastal ishers, ish armers and their communities, the relationship betweenthem and the ecosystems that they depend on is comple.24 This compleity is changingas the interace between ishers and ish armers and the ecosystem is being aectedby both slow- and rapid-onset hazards. The eposed nature o the livelihoods o ishers
Figure 36
Natural disasters reported worldwide, 1900–2010
Number of disasters reported
Source: EM-DAT. 2012. EM-DAT: The OFDA/CRED International Disaster Database [online]. Université Catholique de Louvain,
Brussels. [Cited 22 March 2012]. www.emdat.be
0
50
100
150
200
250
300
350
400
450
500
550
1900 1910 1920 1930 1940 1950 1960 1970 1980 1990 2000 2010

7/28/2019 The State of World Fisheries and Aquaculture_2012
http://slidepdf.com/reader/full/the-state-of-world-fisheries-and-aquaculture2012 134/230
The State o World Fisheries and Aquaculture 2012116
and ish armers, and the location o their communities, means that hazards otenbecome disasters.
The etent o the impact o such disasters is also aected by people’s social andeconomic conditions, which oten include poverty and marginalization, especially indeveloping countries. Given the important role o the isheries and auaculture sectorin ood and nutrition security at both the local and national levels, disasters that aectthese communities will also have multiplier eects on the wider economy. Fishers, isharmers and their communities have been particularly aected by recent major eventssuch as the Asian tsunami o 2004, Cyclone Nargis (which aected Myanmar in 2008), therecent loods in Bangladesh, Paistan and Viet Nam, and the 2011 tsunami in Japan.
The eect o these hazards on ishing communities is increasing or a numbero reasons. Etreme weather events are becoming more reuent, oten associatedwith increasing climate variability and change. The impacts o disasters on coastalcommunities are particularly pronounced in the case o subsea events resulting intsunamis (geological), storm surges and coastal looding (hydrological), and coastaland laeshore storms (meteorological). Droughts and loods can also aect river lows,wetland areas, and lacustrine and riparian communities. More indirectly, droughts
and other catastrophic events can cause mass migration o people into areas normallyoccupied by ishing and ish-arming communities, so increasing competition orresources such as water.
Fishers, ish armers and their communities are also oten eposed to moreprolonged hazards such as the spread o ish disease, the increase in invasiveundesirable alien species, pollution rom land and auatic sources, and auaticecosystem degradation rom arming, mining, industry and urbanization. Moreover,ishers, ish armers and their communities oten live in locations where tenureover land and other resources is contested, leading to disputes and more compleemergencies.
The land–water interace is being particularly aected by inward migration andthe unsustainable use o resources. The result can be a depletion o the ecosystem
services that these resources provide, particularly protection rom coastal hazardssuch as storms and cyclones, and a reduction in support or productive livelihoods.Deorestation is leading to increased sedimentation and land erosion in coastal,laeshore and delta regions, and this can adversely aect marine habitats (especiallyrees). In addition, the eects o population increases in ishing and ish-armingcommunities are compounded by the lac o alternative livelihood options and weamaret linages.
The susceptibility o ishers, ish armers and their communities to rapid-onsetdisasters is also being aected by climate change.25 Seasonal weather patterns are lielyto change, with some areas eperiencing greater periods o drought and others moreloods. Etreme weather events, such as storms, are liely to increase in reuency andaect ishing operations, and coastal and wetland looding is liely to become morereuent. Increased precipitation in some areas will lead to the erosion o riparian lands
and to greater sedimentation in coastal areas, aecting seagrass and ree production.Sea-level rise is liely to increase coastal looding, and the incursion o saltwater intocoastal areas will aect agricultural production and ish arming. Species distributionsare also being changed, and increased temperatures are liely to aect coral reesadversely, with higher incidences o coral bleaching occurring. Temperature changeswill also aect ish physiology, with implications or both capture isheries and isharming. Increased ambient air temperatures could have very signiicant eects on thetypes o ish that can be cultured.
Changes in weather patterns will aect traditional ish processing methods,especially where ish is sun-dried. In some locations, this may be o beneit orprocessors. However, in other locations, poor weather in glut ish landing seasons willaect drying rates, with the potential or substantial losses. There are also liely to
be changes in terms o road access to marets where unusual looding or heavy rainsoccur.

7/28/2019 The State of World Fisheries and Aquaculture_2012
http://slidepdf.com/reader/full/the-state-of-world-fisheries-and-aquaculture2012 135/230
117Selected issues in fsheries and aquaculture
Badly managed isheries and auaculture arms may cause increased stress in ish,reduce water uality, and mae isheries and auaculture more eposed to climatechange threats such as changes in water temperature and salinity.
Changing weather patterns will also aect non-isheries livelihood strategies andwill increase pressure on people to join a ishery where other opportunities havedecreased. Eorts to redirect ishing to alternative livelihoods are also being aectedby climate change eects on livelihood options and opportunities in the widereconomy.
PossIBle solUtIons
Reducing the eects o disasters on the isheries and auaculture sectors can beachieved through measures or prevention, mitigation,26 and preparedness (disasterris reduction [DRR]; Bo 11). In the isheries and auaculture sector, this includespreparedness to respond rapidly and eectively i disasters occur, and early warningto provide inormation beore potentially disastrous events occur. Managing theeects o hazards and disasters (disaster ris management [DRM]) goes beyond DRRto incorporate emergency response, recovery and rehabilitation within a management
ramewor. Thus, as shown in Figure 37, DRM involves three distinct phases:(i) reducing vulnerability; (ii) responding to emergencies when they arise; and(iii) rehabilitating communities ater the emergency has passed.
Bo 11 Disaster management and climate change adaptation: ey deinitions
Disaster ris reduction (DRR) is the concept and practice o reducing disaster
riss through systematic eorts to analyse and manage the causal actors
o disasters, including through reduced eposure to hazards, lessenedvulnerability o people and property, wise management o land and the
environment, and improved preparedness or adverse events.1
Disaster ris management (DRM) goes beyond preparedness, prevention
and mitigation, which orm the core o DRR, to incorporate emergency
response, recovery and rehabilitation within a management ramewor.2
Climate change adaptation (CCA) reers to adjustments in ecological,
social or economic systems in response to actual or epected climate stimuli
and their eects or impacts. This term reers to changes in processes,
practices and structures to moderate or oset potential damages or to tae
advantage o opportunities associated with changes in climate. It involves
adjustments to reduce the vulnerability o communities, regions and
activities to climate change and variability. Adaptation is important in the
climate change issue in two ways: one relating to the assessment o impactsand vulnerabilities; and the other to the development and evaluation o
response options.3
1 United Nations International Strategy or Disaster Reduction. 2009. Terminology. In: UNISDR [online]. [Cited 20 April 2012].2 Baas, S., Ramasamy, S., Dey DePryc, J. and Battista, F. 2008. Disaster risk management systems
analysis: a guide book [online]. Rome, FAO. [Cited 19 March 2012]. tp://tp.ao.org/docrep/ ao/010/ai504e/ai504e00.pd3 Intergovernmental Panel on Climate Change. 2001. Climate Change 2001: Impacts,
Adaptation, and Vulnerability . Contribution o Woring Group II to the Third AssessmentReport o the Intergovernmental Panel on Climate Change. Cambridge, Uk, CambridgeUniversity Press. 1042 pp.

7/28/2019 The State of World Fisheries and Aquaculture_2012
http://slidepdf.com/reader/full/the-state-of-world-fisheries-and-aquaculture2012 136/230
The State o World Fisheries and Aquaculture 2012118
key actions in the DRM cycle may include:• assessment o damage and need (with respect to isheries and auaculture);• rehabilitation o livelihoods (to reduce dependence on ood aid);• longer-term development and planning and preparedness;• relie or emergency response to address immediate humanitarian needs and
to protect livelihoods ollowing a disaster;• rehabilitation to initialize the restoration and rebuilding o livelihoods;• reconstruction or replacing destroyed inrastructure;• sustainable recovery or longer-term re-establishment and enhancement o
livelihoods and livelihood support structures.During emergency response, advocacy is reuired in order to ensure that recovery
eorts comply with international instruments (including the Code o Conduct orResponsible Fisheries [the Code] and the MDGs) and are guided by international bestpractice, national policies and agreed recovery plans. This can include the promotiono:
• sustainable rehabilitation o ishing and ish arming;• ish preservation and processing practices compatible with the state o ishery
resources;• rehabilitation and conservation o the environment and isheries resources;• strengthened governance and community-based planning;• strengthening and diversiication o sustainable livelihoods o traditional
ishing and ish-arming communities.
Normal development growth
Major disaster
Emergency response
Recovery
Disaster risk reduction
Clearing rubble/debris, detailed damage
and needs assessment
Monitoring and evaluation
Psychosocial support and community health
and well-being recovery
Restoration of Infrastructural services
Temporary accommodation and repair/rebuilding of houses
and other buildings
Management, coordination and information sharing
Provision of targeted early recovery assistance
Re-establishment of sustainable
livelihoods
Ideally, in the recovery
stage, the community
is able to ‘build back
better’
Early warning / evacuation / registration
Search and rescue / burying the dead
Managing and re-establishing logistical routes
Management, coordination, leadership
and information sharing
Provision of humanitarian assistance
Initial damage and needs assessment
NORMAL/RISK REDUCTION STAGE RECOVERY STAGEEMERGENCY
RESPONSE
STAGE
Figure 37
The disaster risk management cycle1
1 This mainly applies to a relatively quick-onset disaster (e.g. cyclone, flood, earthquake, tsunami, bushfire),
rather than a slow-onset one such as famine (due to drought/war).
Source: Adapted from: Piper, C./TorqAid. 2011. DRMC version XVI [online]. [Cited 22 March 2012].www.torqaid.com/images/stories/latestDRMC.pdf

7/28/2019 The State of World Fisheries and Aquaculture_2012
http://slidepdf.com/reader/full/the-state-of-world-fisheries-and-aquaculture2012 137/230
7/28/2019 The State of World Fisheries and Aquaculture_2012
http://slidepdf.com/reader/full/the-state-of-world-fisheries-and-aquaculture2012 138/230
The State o World Fisheries and Aquaculture 2012120
reCent ACtIons
A World Conerence on Disaster Reduction was convened by the United NationsGeneral Assembly (UNGA) in Hyogo, Japan, in 2005 just a ew wees ater the IndianOcean tsunami. The conerence, which was attended by representatives o 168 States,agreed on a strategic and systematic approach to reducing vulnerabilities and riss tohazards. The need or building resilience o nations and communities was stressed, andthe conerence adopted ive priorities or action:
• Ensure that DRR is a national and a local priority with a strong institutionalbasis or implementation.
• Identiy, assess and monitor disaster riss and enhance early warning.• Use nowledge, innovation and education to build a culture o saety and
resilience at all levels.• Reduce the underlying ris actors.• Strengthen disaster preparedness or eective response at all levels.
The Hyogo Framewor or Action (HFA) 2005–2015: Building the Resilience oNations and Communities to Disasters was endorsed by the UNGA in Resolution 60/195.The ten-year plan o the HFA relects the intention to tae a holistic approach in
identiying and putting into action comple multidisciplinary DRR measures. The HFAsupports a stronger recognition o climate change concerns in DRR strategies and seesto establish a multidisciplinary, orward-looing approach. It also calls on the UnitedNations International Strategy or Disaster Reduction to acilitate the coordination oeective and integrated action among the organizations o the UN System and amongother relevant international and regional entities, in accordance with their respectivemandates, to support the implementation o the HFA.
In line with the HFA, FAO has developed a Framewor Programme on DisasterRis Reduction/Management. The Framewor Programme strives to assist Members inimplementing the HFA ive priorities or action in the agriculture sector. The directionand content o the Framewor Programme respond to recent recommendations by FAOgoverning bodies, including priority areas as identiied by FAO Regional Conerences.
These “pillars” are: (i) institutional strengthening and good governance or DRRin the agriculture sector; (ii) inormation and early warning systems on ood andnutrition security and transboundary threats; (iii) preparedness or eective responseand recovery in agriculture, livestoc, isheries and orestry; and (iv) good practices,processes and technologies or mitigation and prevention in arming, isheries andorestry. Interventions under the Framewor Programme are tailored to the speciicstrengths and needs o a country or region and delivered in a demand- and modular-responsive manner.
The isheries and auaculture sector must be considered in a dierent way to othersectors (such as agriculture) in emergencies in view o the many uniue challengesrelated to management and the comple range o activities undertaen by ishers andish armers. Speciically, within the isheries and ish-arming sector, FAO has initiateda programme o consultation with partners at the global level, where the synergies
between managing climate change and DRR were eplored.34 At the regional level, inBango, Maputo and San José, consultations with partners addressed regional issues,35 where the integration o isheries and auaculture with DRM–CCA was discussed indetail and options or taing this integration orward were outlined. The need orthis integration was urther endorsed at the 29th Session o the FAO Committee onFisheries (COFI) in 2011. The dierent initiatives at the regional and international levelconstitute important opportunities or ensuring that concerted eorts are made totacle the issues relevant to DRM and CCA. However, challenges remain with regardto integrating CCA and DRM suiciently in isheries and auaculture governanceand development planning and implementation and, vice versa, integrating isheriesand auaculture into CCA and DRM, and taing the characteristics and special needso ishers, ish armers and their communities into account in DRM and CCA policies
and actions. To this etent, FAO is actively involved in identiying climate-relatedvulnerabilities and adaptation strategies, including DRR/DRM, speciic to isheries and

7/28/2019 The State of World Fisheries and Aquaculture_2012
http://slidepdf.com/reader/full/the-state-of-world-fisheries-and-aquaculture2012 139/230
121Selected issues in fsheries and aquaculture
auaculture in order to inorm more ully isheries and climate-change decision-maers.The wor o the FAO Fisheries and Auaculture Department is aligned to prioritiesepressed in international, regional and national policies and agreements, such asnational adaptation programmes o action or least-developed countries and regionalstrategies/agreements or disaster reduction and related programme o action. It is alsoaligned with the FAO Framewor Programme on Climate Change Adaptation (nownas FAO-Adapt).
Furthermore, the FAO Fisheries and Auaculture Department continues to providesupport to FAO Members and partners in responding to emergencies aecting theisheries and auaculture sector. Since 2005, it has supported emergency responsesthrough 135 projects in 25 countries. The overall objective o this support has been tostrengthen ood and nutrition security through the sustainable rehabilitation and long-term recovery o the isheries and auaculture sector and the livelihoods that dependon it. In particular, eorts have ocused on targeting women and other marginalizedgroups. The technical advice provided aims to ensure that these eorts are aligned tonational policies, regional strategies and international best practice and guidance orthe sector, in particular the Code.
oUtlook
In view o the in-depth and ongoing consultation with partners and staeholders romthe DRM, CCA and isheries and ish-arming sectors, it seems liely that that the eyareas or action in the coming years will include:
• strengthening policy coherence and institutional structures to ensure eplicitand adeuate consideration o isheries and auaculture activities in disasterpreparedness and CCA strategies;
• integrating an understanding o the increasing vulnerability o ishers, isharmers and their communities both to etreme events and to climate change,and developing and incorporating comprehensive preparedness and responsestrategies into isheries and ish-arming sector plans and wider development
ramewors;• building an increased understanding o the vulnerability o ishers, ish
armers and their communities into wider social, economic and environmentaldevelopment plans;
• woring with communities, governments and civil society to help build theirproductive, coping and adaptive capacity and to ensure that the adaptive,coping and livelihood strategies o ishers, ish armers and their communitiesare incorporated into wider disaster preparedness and response strategies;
• developing shared tools, guidance and approaches that combine DRMand CCA at a practical level and that lin into isheries and ish-armingdevelopment strategies to increase the resilience o communities and that oauatic systems on which they depend;
• building partnerships at the global, regional, national and subnational levels
among international agencies, national agencies, local government, civilsociety and communities to learn lessons about, prepare or and respond toslow- and rapid-onset hazards in an integrated and inormed way.
Maagig caia fihi a hi pm
tHe IssUe
Recreational ishing is well established in most developed countries and epanding astelsewhere. It involves a large number o individuals, and there is growing awarenessthat recreational ishing is a considerable industry in terms o numbers o practitioners,
catch and social and economic relevance. However, in many recreational isheries,this awareness has not been accompanied by enhanced management practices, and

7/28/2019 The State of World Fisheries and Aquaculture_2012
http://slidepdf.com/reader/full/the-state-of-world-fisheries-and-aquaculture2012 140/230
The State o World Fisheries and Aquaculture 2012122
concerns are spreading about the inluence o recreational ishing on the livelihoodopportunities o ull-time ishers, on the environment and on auatic biodiversity.
Recreational ishing is ishing o auatic animals that do not constitute theindividual’s primary resource to meet nutritional needs and are not generally soldor otherwise traded on eport, domestic or blac marets.36 While angling is howmost people perceive recreational ishing, the activity also includes gathering,trapping, spearing, bow ishing and netting auatic organisms. Recreational ishingcurrently constitutes the dominant use o wild ish stocs in reshwater environmentso industrialized countries. The increased aordability o high-eiciency ishingeuipment (including navigational devices, ish inders and improved boats) andongoing urbanization in coastal zones have resulted in a continuing epansion orecreational isheries in coastal and marine environments.
Although estimates are diicult, the total annual catch by recreational isherswas estimated at 47 billion ish in 2004, or at about 12 percent o the total worldcatch.37 Tentative estimates indicate that about 10 percent o the populationin developed countries practise recreational ishing, and recreational ishersprobably number more than 140 million worldwide.38 One study,39 summarizing
ecosystem-based marine recreation valuation results, estimated the total numbero marine recreational ishers or 2003 at 58 million. Several million jobs dependon recreational isheries as associated spending may add up to billions o dollarsannually. In the United States o America and in Europe, where angling is the best-documented orm o recreational ishing, it has been estimated in recent years thatthere are at least 60 million and 25 million recreational anglers, respectively;40 andit has been estimated that there are 8–10 million recreational saltwater ishers inEurope.41 Similarly, it was estimated in 2009 that some 10 percent o the populationin Central Asia were involved in recreational isheries in inland waters o thatregion.42
The contribution that recreational ishing can mae to local economies isconsiderable, including in less-developed countries. In some areas, the income and
employment generated by the spending o recreational ishers is higher than thatgenerated by commercial isheries or auaculture. Improved valuation o naturalhabitats and clean waters have been additional beneits o recreational ishing.43
Recreational ishing has shown itsel able to provide value as an educationalactivity, promoting the concept o responsibility or ish stocs and the environmentthey inhabit and upon which all people depend. Recreational ishers oten have astrong sense o responsibility or the environment in which they ish, as is, or eample,recognized by the Bern Convention o the Council or Europe in the European Charteron Recreational Fishing and Biodiversity (2010).44
In some cases, auaculture escapees have come under the control o sports ishers.In southern Chile, recreational isheries that used to be based only on rainbow troutand brown trout now include escaped Atlantic salmon (Salmo salar ) and chinoosalmon (Oncorhynchus tshawytscha). In Chile and Argentina, where chinoo salmon
have migrated successully in the ocean, sel-sustained populations o chinoo salmonhave generated much enthusiasm among recreational ishers and concerns amongconservationists.45
However, at times, recreational ishers also interact negatively with proessionalsmall-scale and artisanal ishers in open-access areas and at common ishing grounds.There are records o controversial and anecdotal observations o the detrimentaleects o recreational isheries, such as spear ishing on individual species o groupersalong the coasts o the Mediterranean and Australia46 and in the eastern RedSea.47 Moreover, recreational diving or species such as Caribbean spiny lobster48 incombination with commercial isheries and other pressures (e.g. pollution) has causedsigniicant declines in certain stocs.
Nevertheless, recreational ishers have the potential to enhance ish conservation
and maintain or rehabilitate important habitat.49 As staeholders, they can beinstrumental in successul isheries conservation through participation in managementand conservation endeavours.

7/28/2019 The State of World Fisheries and Aquaculture_2012
http://slidepdf.com/reader/full/the-state-of-world-fisheries-and-aquaculture2012 141/230
123Selected issues in fsheries and aquaculture
Increasingly, recreational ishers are capable o reaching oshore ishing groundsand use technologies – including ish-locating devices – that can mae them euivalentto commercial ishers in term o ishing capacity and capability. Recreational isherieshave developed or species historically only eploited by the commercial ishery,in some cases causing conlict between the sectors.50 Fishing similar locations andusing the same types o ishing gear and acilities, such as moorings, can also putrecreational ishers in competition with coastal small-scale commercial ishers. Otherspecialized recreational isheries target highly iconic species such as salmon, marlins,sailish and swordish, oten in particular areas and seasons, contributing signiicantlyto the total catch. However, it should be noted that most game ishing associationsactively promote catch-and-release practices and that the ish caught in game ishingtournaments are generally released unless the ish caught is a record ish.
Many recreational isheries tend to be highly selective. Oten, recreational isheriestarget larger individuals in the population. However, removal o larger individuals olong-lived species may have important eects on the reproductive potential o thepopulation.51 Larger emales are more ecund, spawn over prolonged periods (thusproviding more resilience to changing environmental conditions), and can produce
larvae with higher survival rates. Seuential hermaphroditic species may have largeindividuals o the same se and their sustained removal can aect spawning success.Age- or size-truncated populations may suer rom changes in density or rombehaviourally mediated indirect interactions, and cause signiicant eects in ood webs,also altering the ecosystem structure and productivity.52 All this would assume evenmore relevance in the case o those stocs concurrently eploited by both commercialand recreational isheries.
PossIBle solUtIons
dpmSustainable development o the recreational isheries sector will depend on theacceptance o its multidisciplinary nature and whether recreational ishery staeholders
will be allowed to acilitate successul conservation and management. There is anurgent need to integrate biological and social sciences in order to provide insightsinto the dynamics o the entire social and ecological system o the recreational ishingindustry.53
The sustainability o recreational isheries – including the conservation o auaticanimal biodiversity in areas ished – in combination with commercial isheriesreuires recognition by those responsible or this sector. Policy-maers and managersresponsible or recreational isheries need to obtain inormation about the sector,as well as nowledge o possible actors that aect the sector negatively (includingcoastal development, ish habitat modiication, pollution and etreme climate events).In addition, recreational ishing has a signiicant social component, and the beneits othe activity need to be weighed against investment in resource protection.54
Appraisal o the perormance o recreational isheries and o their potentialities
needs to be a multidimensional and multidisciplinary eercise in order to capture thesocietal, economic, environmental and educational components o the sector, andimportantly, to ensure eective participation o staeholders.55 One recent study56 has made an eort in this respect by recommending “methodologies assessing socio-economic beneits o European inland recreational isheries”, which may be o use notonly in Europe but also elsewhere.
MaagmManagement o recreational isheries needs to reconcile conlicting demands or accessto the wild ish while ensuring both sustained eploitation o the marine auna andconservation o the marine ecosystem o which the auna are a part.
To do this, management o recreational isheries needs to ollow a process
that is similar to that used by most isheries managers; it involves: (i) deining theresource to be managed, the state o the system and constraints; (ii) setting goalsand objectives; (iii) evaluating management options; (iv) choosing appropriate

7/28/2019 The State of World Fisheries and Aquaculture_2012
http://slidepdf.com/reader/full/the-state-of-world-fisheries-and-aquaculture2012 142/230
The State o World Fisheries and Aquaculture 2012124
actions to achieve management objectives; (v) implementing such actions andmonitoring outcomes; and (vi) evaluating the success o management, and adjustingmanagement in the light o learning.57 The choice o tools is wide in reshwaterrecreational isheries. Management tools include: stocing, biomanipulation, preyenhancement, suppression o detrimental ishes, selective removal, renovation, andmanagement o auatic plants.
However, at the same time, isheries managers need to recognize that reshwaterrecreational isheries dier rom commercial isheries and auaculture and that,thereore, they need to be dealt with in a way that relects this dierence. The maindierences relate to species introduction, stocing o waterbodies, catch-and-releasepractices, the potential or selective overeploitation, and the role o recreationalishers in habitat and biodiversity conservation.
Managers also need to be aware that or many isheries there eists a perceptionthat the catch o the individual recreational isher will have only a minimal andlocalized impact on resources, and that recreational ishing has had little inluenceon reported stoc declines worldwide. However, this perspective oten changesdramatically when the size and activity o the recreational isher population is
considered.There is an open-access scenario characterizing many recreational isheries,
particularly marine ones, that has conseuences or the sustainability o the resourcesand the isheries. In contrast, many inland and coastal recreational ishing areas,especially in Europe, North America and Oceania, do not apply open-access regimesand sometimes have etremely restrictive access reuirements instead.
However, traditional management objectives such as maimizing yield may notbe the most appropriate goal or a recreational ishery – enjoyment o the ishingeperience is the primary objective o recreational ishing, and this reuires dierentmanagement strategies and tools.58
An integrated monitoring system in support o the management o recreationalisheries should entail all the relevant components o the recreational ishery. It could
include, inter alia, representatives o: recreational ishers and their associations,euipment suppliers, commercial ishers and their organizations, public authorities, civilsociety, universities, research institutes, and the tourism industry.
The limited reliable data and scientiic inormation available call or precautionarymanagement. As in any other ishery, management o recreational isheries reuiresclear identiication o goals and measurable operational objectives. Simple and easy-to-obtain multidisciplinary indicators, and their reerence points, should be used tomeasure the state o recreational ishery systems in terms o pressure eerted on theresources and generation o added value. Such indicators can be used to comparerecreational isheries with commercial isheries.59 Adeuate unding and supportshould be available to manage recreational ishing within the wider contet o isheriesand environmental management strategies. The recreational ishers may be reuestedto contribute to the cost o managing recreational ishing; “user-pay, user-beneit”
systems could be used in some cases. The need to estimate total harvest, eort andimpact has to be addressed in order to be able to manage a resource responsibly.Recreational isheries registration and licensing can play a major role in this respect;registration being a means to uantiy and identiy participation, and licensing beinga means to do the same and generate income. Issues to consider when establishinglicensing schemes are the costs o their establishment and operation, and how toensure that the licence revenues collected low bac into the sector.
Management that ocuses on preserving larger specimens o a population mayinvolve the creation o appropriate conservation areas (reugia, marine protected areasor areas closed to ishing) or guidance and/or regulations on catch and release.
Some recreational isheries target individuals belonging to stocs o transboundaryor migratory ish species that are eploited by recreational and commercial isheries o
more than one country. Moreover, some target species o marine recreational isheries(e.g. tuna and marlin) migrate between high seas areas and areas under national

7/28/2019 The State of World Fisheries and Aquaculture_2012
http://slidepdf.com/reader/full/the-state-of-world-fisheries-and-aquaculture2012 143/230
7/28/2019 The State of World Fisheries and Aquaculture_2012
http://slidepdf.com/reader/full/the-state-of-world-fisheries-and-aquaculture2012 144/230

7/28/2019 The State of World Fisheries and Aquaculture_2012
http://slidepdf.com/reader/full/the-state-of-world-fisheries-and-aquaculture2012 145/230

7/28/2019 The State of World Fisheries and Aquaculture_2012
http://slidepdf.com/reader/full/the-state-of-world-fisheries-and-aquaculture2012 146/230
The State o World Fisheries and Aquaculture 2012128
species.64 Fuel savings o 25–45 percent and gear-drag reductions o 20–35 percent havebeen reported.
However, in general, urther wor is needed to improve the construction odierent components o trawl gear in order to minimize riction on the bottomand to reduce overall gear drag. In this regard, there is urther potential to developtechnologies in which the orce o trawl doors and ground gear on the sea bed isautomatically measured and adjusted by instrumentation (Figures 38 and 39). In thecase o beam trawls, progress has been made in recent years by developing alternative
Figure 38
A new semi-pelagic low-impact and selective trawl gear (CRIPS-trawl) that is underdevelopment in Norway
Active selectivityReal-time camera observationsof size and species compositionand active mechanism torelease unwanted catch
Monitoring fish and gearReal-time observationssystems for informeddecision by skipper
Sound beam
Notes: The new trawl design (CRIPS-trawl) has a reduced bottom contact and less drag compared with a conventional bottom trawl.The trawl doors and the footrope of the trawl are lifted off the bottom. The front panels of the trawl are replaced by herding ropes,and the aft parts are made of square-mesh netting. This will reduce the drag of the trawl while still maintaining the stimulation forherding the fish into the codend. The extension piece and the codend are made of four panels and include a net camera and variousselection devices to release unwanted fish from the trawl. The four-panel design improves the stability of the trawl and the selection
devices. The net camera gives real-time information of the fish species and sizes entering the codend, and allows the skipper to makeinformed decisions regarding how to continue the fishing process. The trawl may also be fitted with an active mechanism to releaseunwanted catch (based on image analysis). The trawl concept also includes a cable connection from the vessel to the trawl headline.The cable will carry the video signal from the net camera and acoustic sensors, and it will also increase the vertical opening of thetrawl. The concept will later also include an independent system to adjust the distance of the doors from the sea bed.

7/28/2019 The State of World Fisheries and Aquaculture_2012
http://slidepdf.com/reader/full/the-state-of-world-fisheries-and-aquaculture2012 147/230
129Selected issues in fsheries and aquaculture
gear designs. In essence, the objectives are to reduce the amount o ticler chains,avoid ecess weight in the beams, and use other stimuli (e.g. electric pulses) as analternative to chains to scare the target ish o the bottom and into the net. The use oacoustics, light or any other additional stimuli to enhance encounters by target specieswithin the catching zone o trawl nets is worth eploring.
The use o improved location and targeting o ish with the help o electronic sea-bed mapping tools and integrated global navigation satellite systems has resulted inavoidance o sensitive bottom habitats and helped to minimize ishing eort and uel
Low-impact fishing gearNo bottom contact, reducedenergy consumption
Source: Valdemarsen, J.W., Øvredal, J.T. and Åsen, A., 2011. Ny semipelagisk trålkonstruksjon (CRIPS-trålen).
Innledende forsøk i august-september 2011 om bord i M/S “Fangst”. Rapport fra Havforskningen nr. 18. Bergen, Norway,Institute of Marine Research. 17 pp.

7/28/2019 The State of World Fisheries and Aquaculture_2012
http://slidepdf.com/reader/full/the-state-of-world-fisheries-and-aquaculture2012 148/230
The State o World Fisheries and Aquaculture 2012130
consumption. Multibeam acoustic technology, widely used in sea-bed eploration, hasbeen successully applied, or eample, to mapping scallop beds o the east coast oCanada, thereby substantially reducing the time reuired to locate the grounds and theactual ishing time.
Bottom seining
Bottom seining (Danish, Scottish and pair seining) is generally considered to be a moreenvironmentally riendly and uel-eicient ishing method than bottom otter trawling.The gear is lighter in construction and the area swept is smaller than in bottomtrawling. Moreover, because there are no trawl doors or heavy ground gear, there isless orce on the sea bed. The light gear and low hauling speed mean that uel usagecan be signiicantly lower than or a comparable trawling operation. Bottom seine netsare generally also regarded as having low impact on benthic invertebrates. However,the high bycatch o both undersized individuals o the target species and individuals onon-target species can be a problem in some seine isheries.
Trap-net
Trap-nets are passive ishing gear that are usually set on traditional sites in the patho migrating ish in relatively shallow coastal waters. Leader-netting herds and guidesish into a holding chamber or pound where they are entrapped. The pontoon trapis a more recent innovation and oers various advantages compared with traditionaltrap-nets such as being easy to transport, handle and haul, adjustable in termso size, target species and capture depth, as well as being predator-sae. Futuredevelopments may include large-scale, ocean-based ish traps together with thetechnology to attract ish. Modern trap-net isheries can be energy eicient, leible,selective and habitat-riendly, providing catches o high uality as the catch is usuallyalive when brought aboard the vessel. Live capture provides the operator with agreater number o options to add value to the catch. However, designs and practicesneed to be developed to prevent the entangling o non-ish species in netting and
mooring ropes o the trap.
Figure 39
Smart trawling: reduced seabed damage of bottom trawling
Note: In “smart trawling technology”, the distance of trawl doors and ground gear from the sea bed is constantly andautomatically measured and adjusted by special instrumentation. The use of ballast elements or dropper chainssuspended from the footrope to hold the trawl near to, but not in contact with, the bottom offers potential in somefisheries to reduce sea bed contact while maintaining catching efficiency.
Source: Modified from Valdermarsen, J.W. and Suuronen, P. 2003. Modifying fishing gear to achieve ecosystemobjectives. In M. Sinclair and G. Valdimarsson, eds. Responsible fisheries in the marine ecosystem, pp. 321–341. Rome,Italy, and Wallingford, UK, FAO and CABI International Publishing.
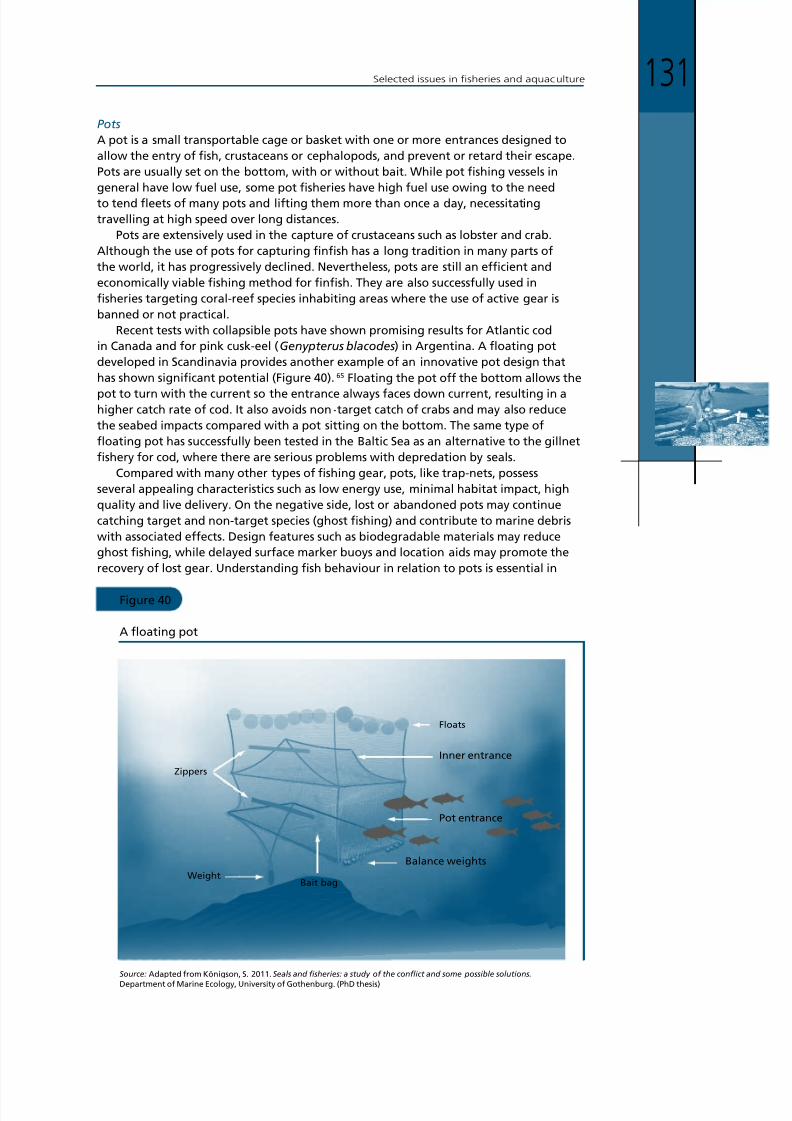
7/28/2019 The State of World Fisheries and Aquaculture_2012
http://slidepdf.com/reader/full/the-state-of-world-fisheries-and-aquaculture2012 149/230
131Selected issues in fsheries and aquaculture
Pots
A pot is a small transportable cage or baset with one or more entrances designed toallow the entry o ish, crustaceans or cephalopods, and prevent or retard their escape.Pots are usually set on the bottom, with or without bait. While pot ishing vessels ingeneral have low uel use, some pot isheries have high uel use owing to the needto tend leets o many pots and liting them more than once a day, necessitatingtravelling at high speed over long distances.
Pots are etensively used in the capture o crustaceans such as lobster and crab.Although the use o pots or capturing inish has a long tradition in many parts othe world, it has progressively declined. Nevertheless, pots are still an eicient andeconomically viable ishing method or inish. They are also successully used inisheries targeting coral-ree species inhabiting areas where the use o active gear isbanned or not practical.
Recent tests with collapsible pots have shown promising results or Atlantic codin Canada and or pin cus-eel (Genypterus blacodes) in Argentina. A loating potdeveloped in Scandinavia provides another eample o an innovative pot design thathas shown signiicant potential (Figure 40).65 Floating the pot o the bottom allows the
pot to turn with the current so the entrance always aces down current, resulting in ahigher catch rate o cod. It also avoids non‐target catch o crabs and may also reducethe seabed impacts compared with a pot sitting on the bottom. The same type oloating pot has successully been tested in the Baltic Sea as an alternative to the gillnetishery or cod, where there are serious problems with depredation by seals.
Compared with many other types o ishing gear, pots, lie trap-nets, possessseveral appealing characteristics such as low energy use, minimal habitat impact, highuality and live delivery. On the negative side, lost or abandoned pots may continuecatching target and non-target species (ghost ishing) and contribute to marine debriswith associated eects. Design eatures such as biodegradable materials may reduceghost ishing, while delayed surace marer buoys and location aids may promote therecovery o lost gear. Understanding ish behaviour in relation to pots is essential in
Figure 40
A floating pot
Floats
Zippers
WeightBait bag
Pot entrance
Balance weights
Inner entrance
Source: Adapted from Königson, S. 2011. Seals and fisheries: a study of the conflict and some possible solutions.
Department of Marine Ecology, University of Gothenburg. (PhD thesis)

7/28/2019 The State of World Fisheries and Aquaculture_2012
http://slidepdf.com/reader/full/the-state-of-world-fisheries-and-aquaculture2012 150/230
The State o World Fisheries and Aquaculture 2012132
order to increase eiciency or those species that are currently not captured by pots incommercially viable uantities.66
Hook and line
Hoo and line reers to gear to which ish, suid or other species are attracted bynatural or artiicial bait or lures placed on a hoo, on which they are caught. Widevariations in hoo and line coniguration and their mode o operation have madethem an eective gear type or a wide variety o species. It is a versatile ishingmethod, employed by a wide range o vessels rom artisanal boats to large mechanizedlongliners. Hoo and line ishing is generally considered an environmentally riendlybut labour-intensive ishing method that catches ish o high uality. Fuel consumptionin these isheries is comparatively low although it can increase signiicantly dependingon the distances vessels have to travel to and rom the ishing ground (e.g. coastalhoo and line isheries versus high seas tuna longlining). Longline ishing may causethe incidental mortality o seabirds, sea turtles and shars, many o which are eitherprotected or endangered. The lines can be set with a streamer67 in order to deterseabirds rom seizing the baited hoos – this system is reported to have led not only
to a reduced mortality level o sea birds but also to higher catch rates o the targetspecies. There are several other mitigation measures capable o reducing the lielihoodo incidental bycatch o seabirds68 and sea turtles,69 such as the new “circle hoo” and“wea hoo”. While bottom-set longlines may snag and damage benthic epiauna andirregular objects on the bottom, longline isheries do oer the potential to conductishing without severe habitat damage and to do so in a relatively energy-consciousmanner.
Gillnetting
Bottom-set gillnets, entangling nets and trammelnets are widely used, and improvedmaterials and techniues have allowed the epansion o such gear to rougher grounds(including wrecs and rees) and deeper waters. Gillnetting is a very versatile and
leible ishing method but can also be labour-intensive. Ecept with trammelnets,the size selectivity or inish is generally good, but species selectivity can be poor. Inaddition, ish are oten injured and die during capture; accordingly, catch uality istypically not as good as with pots, traps and longlines, although gillnets may also givecatch o good uality when the time the net is let in the water to ish is short.
Gillnet ishing operations in general can damage benthic epiauna during retrievalo the gear, at which time the nets and leadlines are more liely to snag bottomstructures. Although the capture o seabirds, sea turtles and marine mammals bygillnets has received increased attention in recent years, more development wor isreuired to develop mitigation measures urther.
The impacts o ghost ishing by abandoned, lost or otherwise discarded gillnetsare o concern as such nets may continue to ish or long periods depending on theirconstruction, the depth, and prevailing environmental conditions. This problem can
be addressed by increasing eorts to avoid losing gillnets and by acilitating the uicrecovery o lost nets. Abandoned gillnets have been identiied as a particular problemin deeper waters and where long lengths o gear are deployed.70
Bai chagThere are many barriers to the transition to low-impact and less uel-intensive practicesand gear.71 In summary, the most important seem to be:
• lac o amiliarity with cost-eective and practical alternatives;• limited availability o suitable technologies, especially in developing countries;• incompatibility o vessels with alternative gear;• ris o losing maretable catch;• additional wor at sea;
• concerns with saety at sea related to using unamiliar gear or strategies;• high investment costs;

7/28/2019 The State of World Fisheries and Aquaculture_2012
http://slidepdf.com/reader/full/the-state-of-world-fisheries-and-aquaculture2012 151/230
133Selected issues in fsheries and aquaculture
• lac o capital or restricted access to capital;• ineective technology inrastructure support;• inleible isheries management systems that include too rigid regulatory
regimes.With regard to inleible management systems, regulatory regimes that are too
rigid can create a new set o problems to be solved and deny ishers the leibilityreuired to innovate and adopt new technologies. In this regard, staeholders shouldbe an integral part o the management process, particularly as and when amendmentsto legislation are under consideration. Changes rom high-energy high-impact ishingmethods or practices to ones with lower energy consumption and lower ecosystemimpacts oer opportunities or conserving uel, preserving ecosystems and improvingood security. However, the transition rom one gear type to another is seldom easyor practical. First, the size and design o eisting ishing vessels and their machineryand euipment oten limit the possibilities o changing the ishing method. Second,ishing gear, ishing vessels, operations and practices have evolved around speciicishing grounds and the behaviour o target ish species over a considerable period.Accordingly, the evolved ishing gear and practices are “tailor-made” to catch speciic
target species or species groups in a manner that is oten perceived to be optimizedto the best technical and economic scenarios that will be encountered during ishing.Moreover, where ishing practices are rooted in tradition there is a strong resistance tochange.
Nevertheless, uel consumption and ecosystem impacts can oten be reducedthrough simple modiications in operational techniues and gear design withoutdrastic changes in the gear and operational practices. This approach has shownpromising results in many cases and is oten preerred by the ishing industryover transitioning to a completely new gear type and ishing practice, which is analternative that has many more uncertainties and higher economic riss.
reCent ACtIons
eimInternational conventions include timetables or compliance regarding emissionso nitrogen oides rom diesel engines o over 130 W and new ishing vessels arereuired to comply. Morevoer, as a conseuence o research and development (R&D)on energy-saving technologies carried out by designers o machinery and ishingvessels and gear, there are signs that the ishing industry has begun to improve itsuel eiciency. Nevertheless, uel continues to be the major cost o operation incapture isheries and urther reinements to uel uality, such as lowering the contento sulphur oides and particulate matter, could well lead to even higher uel andlubricating-oil costs. This may have an even greater impact on the ishing industry indeveloping countries where mechanization continues to increase, although it will alsostrengthen the drive or uel eiciency.
Bcach a icaThe seriousness o the impacts related to bycatch and discards has been recognizedby the international community and in particular through the endorsement o theInternational Guidelines on Bycatch Management and Reduction o Discards at theTwenty-ninth Session o the FAO Committee on Fisheries in 2011. There is a range otools to manage bycatch and reduce discards, including technological measures toimprove the selectivity o ishing gear. The declines in the bycatches and discards inmany isheries have mainly been the result o introducing eective gear modiicationsand bycatch reduction devices.72 However, there remains concern about the impacts ounaccounted ishing mortalities such as ghost ishing by abandoned, lost or otherwisediscarded ishing gear and the act that such gear may also cause environmentaldamage.
Furthermore, at the sity-second session o the Marine Environment ProtectionCommittee o the International Maritime Organization (IMO) in July 2011, Anne V

7/28/2019 The State of World Fisheries and Aquaculture_2012
http://slidepdf.com/reader/full/the-state-of-world-fisheries-and-aquaculture2012 152/230
The State o World Fisheries and Aquaculture 2012134
o the International Convention or the Prevention o Pollution rom Ships 1973/78(MARPOL) was amended to provide a regulation or the loss o ishing gear that maybe a substantial threat to the environment or the saety o navigation to be reportedto the lag State, and, where the loss occurs in waters under the jurisdiction o anothercoastal State, to that State. This regulation is supported within guidelines or theapplication o Anne V currently under revision.
oUtlook
With continued eposure to rising uel prices and little or no signiicant price increasesat the point o irst sale or catches, capture isheries will probably continue to suerdeclining proitability. Moreover, i resource abundance remains static, some bottomtrawl and dredge isheries may become uneconomic (although passive gear and seinenet isheries may be less aected). As demersal trawl ishing accounts or a signiicantpart o the total catch destined or direct human use, there could be an adverse aecton global ish supply and ood security, at least in the short term.
With medium-term orecasts indicating a high lielihood o urther and steadyincreases in uel prices, as indicated by the International Energy Agency, the uture o
the ishing industry is challenging. An increase in sulphur-oide-emission control areas(the most recent being adopted by the IMO in 2011) would add to the cost o uel orvessels operating in such zones.
The ishing sector will no doubt strive to lower its uel consumption, reduce itscarbon ootprint, and decrease ecosystem impacts. Although the continuation orepansion o uel subsidies would reduce immediate costs, this is less acceptable. Tohelp the isheries sector achieve signiicant and permanent reductions, governmentswill most probably strengthen their isheries sector energy policy and create anenabling environment in which ishing industries can rapidly and comprehensivelyadopt low-impact uel-eicient (LIFE) ishing technologies and practices. Thedevelopment and adoption o such ishing techniues oer scope or maintaining thelong-term proitability and sustainability o capture isheries worldwide.
With ossil uels remaining the dominant energy source, pursuing energyeiciency in capture isheries may generate beneits by reducing operating costs,controlling GHG emissions and minimizing environmental impacts within theauatic environment. However, the success o this transition will depend heavily onthe response o governments to the implementation o international conventionstogether with a positive reaction rom the engine manuacturing sector, uel-oil andlubricating-oil producers and the ishing industry (including the manuacturers oishing gear). This could lead to the development and application o suitable andacceptable measures to conventional isheries and create an appropriate catalystor change in the behaviour o ishers. O eual importance are initiatives suchas pursuing the modiication o eisting gear types and the development o low-resistance towed ishing gear with minimal impact within the auatic environment. Insome cases, it may be necessary to switch to completely new gear types or practices in
order to enable LIFE ishing.However, to be eective, this would reuire global R&D priorities to be established
and wor undertaen in support o the development and uptae o LIFE ishing.73 These include:
• promoting and unding studies o cost-eective gear designs and ishingoperations, including the establishment o technology incubators andother public–private sector initiatives to commercialize economically viable,practical and sae alternatives to conventional ishing methods;
• analysis and review o best practice operations across isheries;• improvement o technical ability among ishers;• establishment o appropriate incentives;• industry compliance with international conventions;
• eecution o robust but leible ishery policies that support the transition toalternative technologies.

7/28/2019 The State of World Fisheries and Aquaculture_2012
http://slidepdf.com/reader/full/the-state-of-world-fisheries-and-aquaculture2012 153/230
135Selected issues in fsheries and aquaculture
Finally, close cooperation between the ishing industry, scientists, isheries managersand other staeholders will be undamental to the development, introduction andacceptance o LIFE ishing technologies.
Puig i pacic h cm appach fihi aaquacuu
tHe IssUe
The ecosystem approach to isheries (EAF) represents a move away rom managementsystems that ocus only on the sustainable harvest o target species to a system thatalso considers the major components in an ecosystem, and the social and economicbeneits that can be derived rom their utilization.
An ecosystem approach to auaculture (EAA) ollows similar considerations and ithas been deined as: “a strategy or the integration o the activity within the widerecosystem such that it promotes sustainable development, euity and resilience o
interlined social-ecological systems.”74
While the term “ecosystem approach” oten evoes the idea that the approach ismainly a natural-science undertaing, the approach adopted by FAO75 eplicitly statesthe importance o taing into account all the essential components o sustainability(ecological, social and economic), i.e. taing a genuinely systemic approach byconsidering isheries and auaculture as systems whose sustainability depends on alltheir parts.
In addition to sector-based approaches, the need or developing adeuateinstitutional ramewors to address multisectoral management is also recognized (e.g.ecosystem-based management), and EAF/EAA will then be nested within these broaderramewors.
Despite general acceptance o the principles o EAF and EAA, a widespread
perception has eisted o their being too comple and impossible to implement inpractice because they reuire human and inancial resources that are usually notavailable, particularly in developing countries.
PossIBle solUtIons
Despite the perceived compleity o implementing an ecosystem approach, there isgood evidence that progress is being made at various levels, rom ormally adoptiono the ramewor by regional and national institutions, to actually starting withimplementation.
There are eamples o concrete steps being taen towards an ecosystem approach,both in sectoral isheries management (e.g. EAF and EAA) and at the multisectorallevel (such as ecosystem-based management), the latter being necessary where morethan one sector aects a given area or region. Management approaches that integrate
across sectors become particularly relevant in inland waters (Bo 13), where majorimpacts on ishery resources and ecosystems are oten not caused by ishing activitiesbut by water use and habitat modiication. Moreover, as the once-separate sectorso “isheries” and “auaculture” increasingly overlap and integrate an ecosystemapproach may well acilitate sustainable resource management (Bo 14).
Practical implementation o EAF/EAA entails eamining eisting or developingisheries or auaculture activities so as to identiy ey priority issues to be dealtwith by management in order to achieve sustainable outcomes within a ris-based management ramewor. An eample o a ramewor or planning andimplementation is presented in Figure 41. The ramewor acilitates the developingo the EAF/EAA management/development plans, which are the bacbone o anyecosystem approach strategy.
The ey eatures o the strategy proposed or implementing an ecosystem approachto isheries and to auaculture can be summarized as:

7/28/2019 The State of World Fisheries and Aquaculture_2012
http://slidepdf.com/reader/full/the-state-of-world-fisheries-and-aquaculture2012 154/230
The State o World Fisheries and Aquaculture 2012136
• adopting participatory approaches at all levels o the planning andimplementation steps;
• ensuring that all the ey components o the ishery/auaculture system areconsidered, including those related to the ecological, social, economic andgovernance dimensions, while also taing into account eternal drivers (e.g.changes in the supply o and demand or inputs and outputs; climate change;and environmental disturbances);
• encouraging the use o the “best available nowledge” in decision-maing,
including both scientiic and traditional nowledge, while promoting risassessment and management and the notion that decision-maing shouldtae place also in cases where detailed scientiic nowledge is lacing;
Bo 13 The need or an ecosystem approach in inland waters
Inland waters are characterized by strong competition or reshwater
resources rom sectors outside the isheries and auaculture sector.
Demands on reshwater are epected to double by 2050 as the world
population reaches 9 billion people. O the available 3 800 m 3 o
reshwater in the world, agriculture currently uses 70 percent, industry
etracts another 20 percent, and 10 percent is or domestic use.1 These
sectors are etremely important in national economies, but they rarely
consider ishery resources, although reshwater isheries are a non-
consumptive user o water. Implementing an ecosystem approach
to managing reshwater resources or isheries and auaculture will
necessitate involving these competing sectors and appreciating the value o
multiple uses o reshwater resources.In 2008, capture ishery production rom inland waters was 10.2 million
tonnes and was worth about US$5.5 billion, while the corresponding
igures or inland auaculture were 33.8 million tonnes and US$61.1 billion,
respectively. However, these igures are much lower than the value derived
rom other uses o reshwater. On a global scale, the value o industrial and
agricultural products produced with reshwater as a necessary actor o
production is several magnitudes larger. However, at the regional or local
level, there may be little industrial use or reshwater, and ish can be an
essential contributor o animal protein and micronutrients in local diets.
In such locations, using an ecosystem approach to the development and
management o natural resource should ensure a place also or reshwater
isheries.The continued use o reshwater as a locale or ish production, as
industries and agriculture grow, can be promoted through technological
change. There are encouraging signs o this, such as the development o
improved ish passes that allow riverine ish to migrate past hydroelectric
acilities and improvements in irrigation systems that increase their
eiciency.2 However, many countries still lac the institutional capacity to
deal eectively with multisectoral issues.
1 Comprehensive Assessment o Water Management in Agriculture. 2007. Water or ood,
water or lie: a comprehensive assessment o water management in agriculture. Summary.London, Earthscan, and Colombo, International Water Management Institute. 40 pp.2 FAO. 2003. Unlocking the water potential o agriculture . Rome. 70 pp. (also available at www.
ao.org/DOCREP/006/Y4525E/Y4525E00.HTM).

7/28/2019 The State of World Fisheries and Aquaculture_2012
http://slidepdf.com/reader/full/the-state-of-world-fisheries-and-aquaculture2012 155/230
137Selected issues in fsheries and aquaculture
• promoting the adoption o adaptive management systems, includingmonitoring perormance and creating eedbac mechanisms lined toperormance, at dierent time scales, to permit the adjusting o the tacticaland strategic aspects o the management/development plans;
• building on eisting institutions and practices.The methodology proposed has aspects that are common to any other sector
utilizing renewable natural resources. The methodology is recommended by theISO 14000 that deals speciically with the management o renewable resources.76
The methodology builds on the accumulated eperience o the management oisheries and auaculture but also embraces recent insights about what maes socio-ecological systems sustainable. These insights lead to an approach that:
Figure 41
The EAF/EAA planning framework
HIGH-LEVEL
POLICY GOALS
COHERENT
AND UPDATED
MANAGEMENT
PLANS
Establish scope
(context review)
Set broadobjectives
Identify and
prioritize issues
Select management
response
Conduct cost–benefit
analysis
Ecological
well-being
Social and economic
well-being
Ability
to achieve
Issue
identification
Risk
analysis
Issue
prioritizaton
FISHERY/AQUACULTURE SYSTEM
Source: Modified from: FAO. 2003. Fisheries management 2. The ecosystem approach to fisheries. FAO Technical Guidelinesfor Responsible Fisheries No. 4, Suppl. 2. Rome. 112 pp.; and FAO. 2005. Putting into practice the ecosystem approachto fisheries. Rome. 76 pp.

7/28/2019 The State of World Fisheries and Aquaculture_2012
http://slidepdf.com/reader/full/the-state-of-world-fisheries-and-aquaculture2012 156/230
The State o World Fisheries and Aquaculture 2012138
Bo 14 Interactions between isheries and auaculture
Increasingly – by design or by accident – isheries and auaculture occur in the
same ecosystem. Auaculture-based isheries (stoc enhancement programmes)
and capture-based auaculture are becoming more common and resulting in a
growing interdependence o isheries and auaculture. Fish that escape rom ish
arms may aect not only local isheries but have a wider interaction in the marine
environment. Fisheries and auaculture interact with increasing intensity as ishers
shit rom ishing to auaculture and by competing in the same marets with similar
products. The need to integrate planning and management o the two sectors seems
vital to their uture development and sustainability.
The implementation o the ecosystem approach to auaculture and the
ecosystem approach to isheries should help to overcome the sectoral and
intergovernmental ragmentation o resource management eorts and to developinstitutional mechanisms and private-sector arrangements or eective coordination
among the various sectors and subsectors active in ecosystems in which auaculture
and isheries operate and between the various levels o government. Ecosystem-
based management involves a transition rom traditional sectoral planning and
decision-maing to the application o a more holistic approach to integrated natural
resource management in an adaptive manner.
In the long run, all signiicant commercial seaood supplies and non-ood ish
will come rom one o three sources: (i) ish arms/auaculture; (ii) auaculture-
enhanced isheries; and (iii) isheries that adopt eicient management systems.
The irst two pose a challenge to auaculture and reuire an emphasizing
o the synergies and complementarities between isheries and auaculture
including institutional, social, economic, environmental and biotechnologicalaspects. Acnowledgement o these interactions oers opportunities or sectoral
development, or increasing ood security, reducing poverty and improving rural
livelihoods. The two subsectors need to orm partnerships as both are strongly
lined (see accompanying igure), both depend on healthy auatic environments,
and both are aected by other development activities. For eample, in the coming
decades, culture-based isheries will probably play a much greater role in sustaining
and increasing capture isheries yields or an ultimate public good including
conservation objectives. Thereore, it is important to analyse the present status o
culture-based isheries culture-based isheries and stoc enhancement, to assess
comprehensively the impacts o the activities, and to identiy constraints and ways
to improve the ecological, economic and socio-economic beneits by implementing
an ecosystem approach to overall ish production. It is also necessary to improve
understanding on the potential and actual environmental impacts o stocing andescapees worldwide.
• is contet-speciic – it describes a process whose result depends on culturalcontet and needs;
• emphasizes staeholder participation – the approach advocates participationo staeholders in the planning and implementation processes, andencourages various orms o comanagement that will in turn be shaped by
contet and type o isheries;• is systemic – by taing a “systemic” approach, it tries to ensure that all
“system” components move towards the same and agreed direction;

7/28/2019 The State of World Fisheries and Aquaculture_2012
http://slidepdf.com/reader/full/the-state-of-world-fisheries-and-aquaculture2012 157/230

7/28/2019 The State of World Fisheries and Aquaculture_2012
http://slidepdf.com/reader/full/the-state-of-world-fisheries-and-aquaculture2012 158/230
The State o World Fisheries and Aquaculture 2012140
mining, tourism, coastal development, isheries and auaculture) relying on the useo natural resources within a given region/ecosystem should adopt an ecosystemapproach.
reCent ACtIons
The ecosystem approach was irst deined by the CBD in 1993 as a strategy orthe integrated management o land, water and living resources that promotesconservation and sustainable use in an euitable way.
Since 1993, countries have taen several steps to promote the use o the ecosystemapproach, including speciically in isheries. The Code o Conduct or ResponsibleFisheries (the Code) was adopted in 1995 by FAO Members. The Reyjavi Declarationon Responsible Fisheries in the Marine Ecosystem (adopted in 2001) encouragedcountries and ishing entities to achieve sustainable isheries in the marine ecosystem.Guidelines or an EAF were produced by FAO in 2003. Auaculture has also developeda ramewor or the adoption o the ecosystem approach.77 At present, FAO isdeveloping voluntary guidelines on securing small-scale isheries. These guidelines willrecognize the ecosystem approach as an important guiding principle.
Approaches are being developed to coordinate multiple uses o natural resources,such as marine spatial planning78 and integrated watershed management. These aremethodologies that complement the sectoral-based approaches to management thatremain the basic pillars o sustainable development and its governance.
In some ways, the ecosystem approach has been practised in traditionalmanagement regimes or a long time. An eample is the tenure system in marineisheries as practised in Paciic island States.
More recently, many countries have made important strides towards the applicationo several o the principles contained in the EAF/EAA. Some are partly implementingthe approach without necessarily recognizing this.79 In some cases, progress has alsobeen made in the development o multisectoral management.
In Australia, ollowing the outcomes o the 1992 United Nations Convention
on Environment and Development, a national strategy or ecologically sustainabledevelopment was endorsed in the same year.80 Since then, signiicant progress hasbeen made in implementing an ecosystem approach within the management o mostindividual isheries and, and there has also been more recent progress in adoptingmore coordinated regional level management or this sector.81
In the European Union, substantial eorts are being made to integrate theobjectives o its Marine Strategy Framewor Directive within the new EuropeanUnion Common Fisheries Policy, as part o an ecosystem-based managementapproach. As a result o the project Maing the European Fisheries Ecosystem PlanOperational (unded by the European Union), isheries ecosystem plans have beendeveloped or three major European marine regions (North Sea, North WesternWaters and South Western Waters).82 Eorts are also being made at the nationallevel. For eample, in Norway, an integrated management plan or the Barents Sea–
Looten area has been developed to resolve conlicts between petroleum activities,isheries activities and to address conservation concerns.83 Implementation o theplan is ensured through multisectoral coordinating groups headed by a steeringgroup that is in turn coordinated by the Ministry o Environment. Representativesrom the Norwegian Petroleum Directorate and the Directorate o Fisheries havewored together to revise laws and regulations covering seismic activities in order toreduce conlicts. A central concept o the plan is that it is based on science and taesa precautionary approach. A similar plan has also been developed or the NorwegianSea, and the idea is to cover all the Norwegian Eclusive Economic Zone (EEZ).84
Ongoing eorts in the adoption o ecosystem-based approaches at both the sectoraland multisectoral level are being pursued in various large marine ecosystems includingin the Caribbean,85 the Canary Current,86 the Benguela Current87 and the Bay o
Bengal.88 However, in most o these large marine ecosystems, eorts are concentrated
7/28/2019 The State of World Fisheries and Aquaculture_2012
http://slidepdf.com/reader/full/the-state-of-world-fisheries-and-aquaculture2012 159/230
141Selected issues in fsheries and aquaculture
on planning or an ecosystem-based approach – its ull-scale implementation remainsto be realized.
In addition, FAO has speciically addressed EAF by developing guidance89 or itsimplementation and by providing etrabudgetary unding or regional and/or nationalcase studies, dedicated worshops and training courses.
Collaborations with universities in Arica, i.e. University o Ghana (Ghana), RhodesUniversity (South Arica) and Ibn Zohr University (Morocco), have allowed a largenumber o isheries proessionals to be trained in the ecosystem approach, and it ishoped that the approach will be absorbed by universities in developing countries aspart o eisting curricula in isheries science and management. These eorts haveresulted in increased understanding o the approach and its “demystiication”.
oUtlook
A dramatic shit in attitudes as regards the relevance and applicability o the ecosystemapproach has taen place, including an increasing appreciation o how this approachcan help in addressing the challenges lined to sustaining socio-ecological systemssuch as isheries, both within the sector and across sectors aecting a given ecosystem.
Pragmatic ways are being adopted to improve conventional isheries and auaculturemanagement by incorporating ecosystem considerations and by dealing with the socialdimension more properly.
However, important challenges still eist beyond the technical aspects o practicalday-to-day implementation. The challenges are not only those related to controllingthe direct drivers o marine ecosystem change such as isheries and auaculture.Probably the greatest challenges come rom indirect drivers such as changes in humanpopulation coupled with a widespread aspiration or improved standards o living.At the national level, economic policies and social and economic conditions are otenin conlict with sustainability objectives. Climate change will most probably emergeas a major driver o change in auatic ecosystems and will in turn aect coastalcommunities. In this situation, modiying governance towards more holistic approaches
(such as the ecosystem approach), both horizontally (across sectors and institutions) andvertically (rom local to global), may tae on increased urgency.

7/28/2019 The State of World Fisheries and Aquaculture_2012
http://slidepdf.com/reader/full/the-state-of-world-fisheries-and-aquaculture2012 160/230
The State o World Fisheries and Aquaculture 2012142
notes
1 Arenas, M.C. and Lentisco, A. 2011. Mainstreaming gender into project cycle
management in the isheries sector. Bango, FAO. 92 pp. (also available at www.rlp.org/mainstreaming_gender/Mainstreaming_gender_handboo.pd).
2 United Nations. 1997. The Report o the Economic and Social Council or 1997 [online]. A/52/3. [Cited 20 March 2012]. www.un.org/documents/ga/docs/52/ plenary/a52-3.htm
3 Bennett, E., Valette, H.R., Mäiga, k.Y. and Medard, M., eds. 2004. Room to
manoeuvre: gender and coping strategies in the isheries sector . Portsmouth, Uk,IDDRA. 154 pp.
4 The FAO Fisheries and Auaculture Department regularly collects employmentstatistics in isheries and auaculture related to the primary sector only. Thereore,the data eclude post-harvest activities.
5 Williams, M.J., Agbayani, R., Bhujel, R., Bondad-Reantaso, M.G., Brugère, C.,Choo, P.S., Dhont, J., Galmiche-Tejeda, A., Ghulam, k., kusaabe, k., Little, D.,Nandeesha, M.C., Sorgeloos, P., Weeratunge, N., Williams, S. and xu, P.
2012. Sustaining auaculture by developing human capacity and enhancingopportunities or women. In R.P. Subasinghe, J.R. Arthur, D.M. Bartley, S.S. De Silva,M. Halwart, N. Hishamunda, C.V. Mohan and P. Sorgeloos, eds. Farming the Waters
or People and Food. Proceedings o the Global Conerence on Aquaculture 2010,
Phuket, Thailand, 22–25 September 2010, pp. 785–822. Rome, FAO, and, Bango,NACA. 896 pp.
6 Weeratunge, N. and Snyder, k. 2009. Gleaner, isher, trader, processor:understanding gendered employment in the isheries and auaculturesector. Paper presented at the FAO–IFAD–ILO Worshop on gaps, trends andcurrent research in gender dimensions o agricultural and rural employment:dierentiated pathways out o poverty, Rome, 31 March – 2 April 2009. 32 pp.
7 Two eamples directly related to the isheries and auaculture sectors are: Ministry
o Agriculture, Forestry and Fisheries, Fisheries Administration. 2010. Trainingmanual on gender awareness and gender mainstreaming in isheries sector. Phnom Penh. 44 pp. (also available at www.rlp.org/sites/deault/iles/Training%20manual%20on%20gender%20awareness%20or%20Fisherieis.pd), and Op. cit.,see note 1.More generally, toolits such as the FAO Agri-Gender Statistics Toolit (www.ao.org/gender/agrigender/en/) and Web sites such as FAO’s Sharing our resources –participation (www.ao.org/Participation/) are also becoming available.
8 The wor o Chen with low-income women in Bangladesh and India enabledthe identiication o our pathways by which women eperience change; andhaving access to and control o auatic resources can also acilitate changes inthe above pathways. The pathways include: (i) material change in access to andcontrol over material resources, in level o income and in satisaction o basic
needs; (ii) cognitive change, change in level o nowledge, sills and awarenesso wider environment; (iii) perceptual change, change in individual perceptionso own individuality, interested and value; and (iv) relational change, change incontractual agreements, in bargaining power and in ability to resist eploitation.
Source: Chen, M.A. 1997. A guide or assessing the impact o microenterprise
services at the individual level . AIMS Project Report, USAID/G/EG/MD. Washington,DC, Management Systems International.
9 Op. cit., see note 1, p. 12.10 Naved, R.T. 2000. Intrahousehold impact o the transer o modern agricultural
technology: a gender perspective [online]. FCND Discussion Paper No. 85. IFPRI.[Cited 19 March 2012]. http://impact.cgiar.org/pd/278.pd
11 Pandolelli, L., Meinzen-Dic, R. and Dohrn, S. 2008. Gender and collective action:
motivations, eectiveness and impact. Journal o International Development , 20: 1–11.

7/28/2019 The State of World Fisheries and Aquaculture_2012
http://slidepdf.com/reader/full/the-state-of-world-fisheries-and-aquaculture2012 161/230
143Selected issues in fsheries and aquaculture
12 Coles, C. and Mitchell, J. 2010. Gender and agricultural value chains – a review o
current knowledge and practice and their policy implications [online]. ESA WoringPaper No. 11-05. FAO. [Cited 19 March 2012]. www.ao.org/docrep/013/am310e/ am310e00.pd
13 Initiated by the Asian Fisheries Society and its partners, these have included the1998 International Symposium on Women in Asian Fisheries held in Chiang Mai,Thailand; the 2001 Global Symposium on Women in Fisheries held in kaohsiung,Taiwan Province o China; the 2004 First Global Symposium on Gender andFisheries (GAF) held in Penang, Malaysia; GAF2 2007 held in kochi, lndia; and GAF32011 held in Shanghai, China.
14 FAO. (orthcoming). Report o FAO Workshop on Future Directions or Gender in
Aquaculture and Fisheries Action, Research and Development, Shanghai, China,
23–24 April 2011. FAO Fisheries and Auaculture Report No. 998. Rome, FAO.15 FAO. 2011. The State o Food and Agriculture 2010-11. Women in agriculture:
closing the gender gap or development. Rome. 160 pp. (also available at www.ao.org/docrep/013/i2050e/i2050e.pd).
16 World Ban. 2011. World Development Report 2012: Gender Equality and
Development. Washington, DC. 47 pp. (also available athttp://siteresources.worldban.org/INTWDR2012/ Resources/7778105-1299699968583/7786210-1315936222006/Complete-Report.pd).
17 Op. cit., see note 5.18 FAO. 2008. Options or decision makers [online]. Epert Meeting on Climate
Change and Disaster Ris Management, FAO Headuarters, Rome, 28-29 February2008. [Cited 19 March 2012]. www.ao.org/ileadmin/user_upload/oodclimate/ presentations/disaster/OptionsEM4.pd
19 Intergovernmental Panel on Climate Change. 2011. IPCC special report on
managing the risks o extreme events and disasters to advance climate change
adaptation: act sheet [online]. [Cited 19 March 2012]. www.ipcc.ch/news_and_events/docs/sre/SREx_act_sheet.pd
20 Guha-Sapir, D., Vos, F., Below, R. with Ponserre, S. 2011. Annual Disaster Statistical Review 2010: the numbers and trends. Brussels, Centre or Research on theEpidemiology o Disasters (CRED). 42 pp.
21 Organisation or Economic Co-operation and Development. 2002. Poverty and
climate change: reducing the vulnerability o the poor through adaptation. Paris.14 pp.
22 Op. cit., see note 19.23 Inter-Agency Standing Committee. 2006. Gender handbook in humanitarian action:
women, girls, boys and men dierent needs – equal opportunities [online]. [Cited19 March 2012]. www.humanitarianino.org/iasc/documents/subsidi/t_gender/ IASC%20Gender%20Handboo%20(Feb%202007).pd
24 IMM, CFDO and CBNRM LI. 2005. Understanding the actors that support or inhibit
livelihood diversiication in coastal Cambodia. An output rom DFID-unded
research in Cambodia. Eeter, Uk, IMM Ltd.25 Cochrane, k., De Young, C., Soto, D. and Bahri, T., eds. 2009. Climate change
implications or isheries and aquaculture: overview o current scientiic
knowledge. FAO Fisheries and Auaculture Technical Paper No. 530. Rome, FAO.212 pp.
26 The United Nations International Strategy or Disaster Reduction deinesmitigation as: the lessening or limitation o the adverse impacts o hazards andrelated disasters.
27 Sperling, F. and Szeely, F. 2005. Disaster risk management in a changing climate [online]. Discussion Paper prepared or the World Conerence on DisasterReduction on behal o the Vulnerability and Adaptation Resource Group (VARG).Reprint with Addendum on Conerence outcomes. Washington, DC. [Cited
19 March 2012]. www.preventionweb.net/iles/7788_DRMinachangingclimate1.pd

7/28/2019 The State of World Fisheries and Aquaculture_2012
http://slidepdf.com/reader/full/the-state-of-world-fisheries-and-aquaculture2012 162/230
The State o World Fisheries and Aquaculture 2012144
28 FAO. 2008. Climate change and disaster risk management [online]. Technicalbacground document rom the epert consultation held on 28 to 29 February2008. Climate change, energy and ood: high-level conerence on ood security:the challenges o climate change and bioenergy. Rome. [Cited 19 March 2012].tp://tp.ao.org/docrep/ao/meeting/013/ai786e.pd
29 Op. cit., see note 27.30 Op. cit., see note 25.31 Op. cit., see note 19.32 European Union. 2006. Linking climate change adaptation and disaster risk
management or sustainable poverty reduction [online]. Synthesis Report,Framewor Contract AMS/451 Lot No 6 November 2006. Brussels. [Cited 19 March2012]. http://ec.europa.eu/development/icenter/repository/env_cc_varg_adaptation_en.pd
33 Op. cit., see note 27.34 FAO. 2010. Reduced vulnerability o ishing and ish arming communities
to natural disasters. In FAO. Report o the Inception Workshop o the FAO
Extrabudgetary Programme on Fisheries and Aquaculture or Poverty Alleviation
and Food Security, Rome, 27–30 October 2009, pp. 57–65. FAO Fisheries andAuaculture Report No. 930. Rome. 68 pp.
35 FAO. 2010. Securing sustainable small-scale isheries: bringing together responsible
isheries and social development, Windsor Suites Hotel, Bangkok, Thailand,
6–8 October 2010. RAP Publication 2010/19. Bango, FAO Regional Oice or Asiaand the Paciic. 56 pp.FAO. 2011. Report o the Arica Regional Consultative Meeting on Securing
Sustainable Small-scale Fisheries: Bringing together Responsible Fisheries and Social
Development, Maputo, Mozambique, 12–14 October 2010. Rapport de l’atelier
consultati régional aricain sur les pêches artisanales pour une pêche artisanale
durable: associer la pêche responsable au développement social, Maputo,
Mozambique, 12-14 octobre 2010. FAO Fisheries and Auaculture Report/FAO,
Rapport sur les pêches et l’auaculture No. 963. Rome. 68 pp.FAO. 2011. Inorme de la reunión consultiva regional de América Latina y el Caribe
sobre Proteger la pesca sostenible en pequeña escala: uniicación de la pesca
responsable y el desarrollo social, San José, Costa Rica, 20-22 de octubre de 2010.
Report o the Latin America and Caribbean Regional Consultative Meeting on
Securing Sustainable Small-scale Fisheries: Bringing Together Responsible Fisheries
and Social Development. San José, Costa Rica, 20–22 October 2010. FAO Fisheriesand Auaculture Report/FAO Inorme de pesca y acuicultura No. 964. Rome. 77 pp.
36 FAO European Inland Fisheries Advisory Commission. 2008. EIFAC Code o Practice
or Recreational Fisheries. EIFAC Occasional Paper No. 42. Rome, FAO. 45 pp.37 Cooe, S.J. and Cow, I.G. 2004. The role o recreational ishing in global ish crises.
BioScience, 54(9): 857–859.38 Arlinghaus, R. and Cooe, S.J. 2009. Recreational ishing: socio-economic
importance, conservation and management. In W.M. Adams, B. Dicson andJ.M. Hutton, eds. Recreational hunting, conservation and rural livelihoods: science
and practice, pp. 39–58. Oord, Uk, Blacwell Publishing.39 Cisneros-Montemayor, A.M. and Sumaila, U.R. 2010. A global estimate o beneits
rom ecosystem-based marine recreation: potential impacts and implications ormanagement. Journal o Bioeconomics, 12(3): 245–268.
40 European Anglers Alliance. 2003. Number o anglers in Europe. In: EAA [online].[Cited 29 November 2011]. www.eaa-europe.org/inde.php?id=14
41 Council o Europe. 2011. European Charter on Recreational Fishing and
Biodiversity [online]. Convention on the Conservation o European Wildlieand Natural Habitats, Standing Committee, 30th meeting, Strasbourg,6–9 December 2010. [Cited 1 December 2011]. https://wcd.coe.int/com.instranet.
InstraServlet?command=com.instranet.CmdBlobGet&InstranetImage=1979230&SecMode=1&DocId=1617470&Usage=2

7/28/2019 The State of World Fisheries and Aquaculture_2012
http://slidepdf.com/reader/full/the-state-of-world-fisheries-and-aquaculture2012 163/230
145Selected issues in fsheries and aquaculture
42 Van Anrooy, R., Hicely, P., Sipponen, M. and Miola, H., eds. 2010. Report o the
Regional Workshop on Recreational Fisheries in Central Asia, Issyk Kul, Kyrgyzstan,
14–16 September 2009. FAO Fisheries and Auaculture Report No. 926. Anara,FAO. 113 pp.
43 Arismendi, I. and Nahuelhual, L. 2007. Non-native salmon and trout recreationalishing in Lae Llanuihue, southern Chile: economic beneits and managementimplications. Reviews in Fisheries Science, 15(4): 311–325.
44 Op. cit., see note 41.45 Soto, D., Arismendi, I., Di Prinzio, C. and Jara, F. 2007. Recent establishment o
Chinoo salmon (Oncorhynchus tshawytscha) in Paciic catchments o southernSouth America and its potential ecosystem implications. Revista Chilena de Historia
Natural , 80: 81–98.46 Pollard, D. and Scott, T.D. 1966. River and ree. In A.J. Marshall, ed. The Great
Extermination, pp. 95–115. London, Heinemann.47 Oaley, S.G. 1984. The eects o spearishing pressure on grouper (Serranidae)
populations in the eastern Red Sea. In M.A.H. Saad, ed. Proceedings o the
Symposium on the Coral Ree Environment o the Red Sea, pp. 341–359. Jeddah,
Saudi Arabia, king Abdulaziz University.48 Eggleston, D.B., Johnson, E.G., kellison, G.T. and Nadeau, D.A. 2003. Intense
removal and non-saturating unctional responses by recreational divers on spinylobster Panulirus argu. Marine Ecology Series, 257: 197–207.
49 Arlinghaus, R. 2006. Overcoming human obstacles to conservation o recreationalishery resources, with emphasis on central Europe. Environmental Conservation,33: 46–59.Soto, D., Arismendi, I., González, J., Guzman, E., Sanzana, J., Jara, F., Jara, C. andLara, A. 2006. Southern Chile, trout and salmon country: invasion patterns andthreats or native species. Revista Chilena de Historia Natural , 79: 97–117.
50 Griiths, S.P., Polloc, k.H., Lyle, P., Julian G., Tons, M. and Sawyno, W. 2010.Following the chain to elusive anglers. Fish and Fisheries, 11: 220–228.
51 Bireland, C. and Dayton, P. 2005. The importance in ishery management oleaving the big ones. Trends in Ecology and Evolution, 20(7): 356–358.52 Bereley, S.A., Hion, M.A., Larson, R.J. and Love, M.S. 2004. Fisheries sustainability
via protection o age structure and spatial distribution o ish populations.Fisheries, 29(8): 23–32.
53 Op. cit., see note 38.54 Morales-Nin, B., Moranta, J., García, C., Tugores, M.P., Grau, A.M., Riera, F.
and Cerdà, M. 2005. The recreational ishery o Majorca Island (westernMediterranean): some implications or coastal resource management. ICES Journal
o Marine Science, 62: 727–739.55 Arlinghaus, R., Cooe, S.J. and Cow, I.G. 2010. Providing contet or the global
code o practice or recreational isheries. Fisheries Management and Ecology , 17:146–156.
56 Parila, k., Arlinghaus, R., Artell, J., Gentner, B., Haider, W., Aas, Ø.,Barton, D., Roth, E. and Sipponen, M. 2010. Methodologies or assessing socio-
economic beneits o European inland recreational isheries. EIFAC OccasionalPaper No. 46. Anara, FAO. 112 pp.
57 FAO. 2011. Report o the Expert Consultation to Develop the FAO Technical
Guidelines or Responsible Fisheries: Recreational Fisheries, Berlin, Germany,
5–6 August 2011. FAO Fisheries and Auaculture Report No. 979, Anara. 136 pp.58 FAO will provide urther guidance on responsible recreational isheries
management and practices in line with the FAO Code o Conduct or ResponsibleFisheries in its Technical Guidelines or Responsible Fisheries No. 13: Recreational
Fisheries (to be published in 2012).59 Op. cit., see note 56.
60 Op. cit., see note 55.

7/28/2019 The State of World Fisheries and Aquaculture_2012
http://slidepdf.com/reader/full/the-state-of-world-fisheries-and-aquaculture2012 164/230
The State o World Fisheries and Aquaculture 2012146
61 Gaudin, C. and De Young, C. 2007. Recreational isheries in the Mediterranean
countries: a review o existing legal rameworks. Studies and Reviews. GeneralFisheries Commission or the Mediterranean No. 81. Rome, FAO. 85 pp.General Fisheries Commission or the Mediterranean. 2011. Report o the
Transversal Workshop on the monitoring o recreational isheries in the GFCM
area, Palma de Mallorca, Spain, 20–22 October 2010 [online]. General FisheriesCommission or the Mediterranean, Scientiic Advisory Committee (SAC),Thirteenth Session Marseilles, France, 7–11 February 2011. [Cited 30 November2011]. http://151.1.154.86/GcmWebSite/SAC/2010/Recreational_Fisheries/Report.pdOp. cit., see note 42.
62 Cooe, S.J. and Cow, I.G. 2006. Contrasting recreational and commercial ishing:searching or common issues to promote uniied conservation o isheries resourcesand auatic environments. Biological Conservation, 128: 93–108.
63 Suuronen, P., Chopin, F., Glass, C., Løeborg, S., Matsushita, Y., queirolo, D. andRihan, D. 2012. Low impact and uel eicient ishing—looing beyond the horizon.Fisheries Research, 119–120: 135–146.
64 Løeborg, S. 2005. Impacts o trawling and scallop dredging on benthic habitatsand communities. FAO Fisheries Technical Paper No. 472. Rome, FAO. 67 pp.Valdemarsen, J.W., Jørgensen, T. and Engås, A., 2007. Options to mitigate bottom
habitat impact o dragged gears. FAO Fisheries Technical Paper No. 506. Rome,FAO. 29 pp.Valdemarsen, J.W., Øvredal, J.T. and Åsen, A., 2011. Ny semipelagisk
trålkonstruksjon (CRIPS-trålen). Innledende orsøk i august-september 2011 om
bord i M/S “Fangst”. Rapport ra Havorsningen nr. 18. Bergen, Norway, Instituteo Marine Research. 17 pp.
65 Furevi, D.M., Humborstad, O.-B., Jørgensen, T. and Løeborg, S. 2008. Floatedish pot eliminates bycatch o red ing crab and maintains target catch o cod.Fisheries Research, 92(1): 23–27.
66 Thomsen, B., Humborstad, O.-B. and Furevi, D.M. 2010. Fish pots: ish behavior,capture processes and conservation issues. In P. He, ed. Behavior o marine ishes:
capture processes and conservation challenges, pp. 143–158. Blacwell Publishing.67 Streamers are plastic lagging tied to lines attached to the ishing vessel near
where the vessel places its ishing line in the water and help righten birds awayrom the baited hoos.
68 Løeborg, S. 2011. Best practices to mitigate seabird bycatch in longline, trawland gillnet isheries – eiciency and practical applicability. Marine Ecology Progress
Series, 435: 285–303.69 FAO. 2010. Guidelines to reduce sea turtle mortality in ishing operations. Rome.
128 pp.70 Macadyen, G., Huntington, T. and Cappell, R. 2009. Abandoned, lost or otherwise
discarded ishing gear. UNEP Regional Seas Reports and Studies No. 185 and FAO
Fisheries and Auaculture Technical Paper No. 523. Rome, FAO and UNEP. 115 pp.71 Op. cit., see note 63.
Gascoigne, J. and Willsteed, E. 2009. Moving towards low impact isheries in
Europe: policy hurdles & actions. Brussels, Seas At Ris. 103 pp.72 Op. cit., see note 63.73 Op. cit., see note 63.74 FAO. 2010. Aquaculture development. 4. Ecosystem approach to aquaculture. FAO
Technical Guidelines or Responsible Fisheries. No. 5, Suppl. 4. Rome. 53 pp.75 FAO. 2003. Fisheries management 2. The ecosystem approach to isheries. FAO
Technical Guidelines or Responsible Fisheries No. 4, Suppl. 2. Rome. 112 pp.FAO. 2012. EAF-Net. About the EAF Toolbo. In: FAO Fisheries and Aquaculture
Department [online]. Rome. [Cited 26 March 2012]. www.ao.org/ishery/ea-net/
topic/166272/en76 The Web page or ISO 14000 is www.iso.org/iso/iso_14000_essentials

7/28/2019 The State of World Fisheries and Aquaculture_2012
http://slidepdf.com/reader/full/the-state-of-world-fisheries-and-aquaculture2012 165/230
147Selected issues in fsheries and aquaculture
77 Op. cit., see note 74.78 Ehler, C. and Douvere, F. 2009. Marine spatial planning: a step-by-step approach
toward ecosystem-based management. Intergovernmental OceanographicCommission and Man and the Biosphere Programme. IOC Manual and GuidesNo. 53, ICAM Dossier No. 6. Paris, UNESCO.
79 There is an urgent need to document the progress that is taing place in bothdeveloping and developed countries. Apart rom the epected positive andencouraging eect on isheries managers, documenting progress will also oeran opportunity or active sharing o eperiences in good isheries and auaculturemanagement.
80 Council o Australian Governments. 1992. National Strategy or Ecologically
Sustainable Development. Canberra, AGPS.81 Fletcher, W.J. 2008. Implementing an ecosystem approach to isheries management:
lessons learned rom applying a practical EAFM ramewor in Australia and thePaciic. In G. Bianchi and H.R. Soldal, eds. The ecosystem approach to isheries,pp. 112–124. Rome, FAO and CABI.Fletcher, W.J., Shaw, J., Metcal, S.J. and Gaughan, D.J. 2010. An ecosystem based
isheries management ramewor: the eicient, regional-level planning tool ormanagement agencies. Marine Policy , 34: 1226–1238.
82 The Web homepage o this project is hosted on the Web site o the University oLiverpool at www.liv.ac.u/meepo/
83 This plan is detailed in a press release rom the Oice o the Prime Minister,available at www.regjeringen.no/mobil/en/dep/sm/press-center/Press-releases/2011/updated-version-o-the-integrated-manage.html?id=635620
84 A description o the integrated management plans are available on a Web pageo Norway’s oicial site or inormation about seaood saety, isheries andauaculture management at www.isheries.no/resource_management/Area_management/Integrated_management_plans/
85 The Web page or the Caribbean Large Marine Ecosystem Project is hosted at www.
cavehill.uwi.edu/cermes/clme.html86 The Web site or the Canary Current Large Marine Ecosystem is at www.canarycurrent.org/
87 The Web site or the Benguela Current Commission is at www.benguelacc.org/ 88 The Web site or the Bay o Bengal Large Marine Ecosystem Project is at www.
boblme.org/ 89 Op. cit., see note 75.
Carocci, F., Bianchi, G., Eastwood, P. and Meaden, G. Geographic inormation
systems to support the ecosystem approach to isheries: status opportunities and
challenges. FAO Fisheries and AuacultureTechnical Paper No. 532. Rome, FAO.101 pp.FAO. 2005. Putting into practice the ecosystem approach to isheries. Rome. 76 pp.FAO. 2008. Fisheries management. 2. The ecosystem approach to isheries. 2.1 Best
practices in ecosystem modelling or inorming an ecosystem approach to isheries. FAO Technical Guidelines or Responsible Fisheries No. 4, Suppl. 2, Add. 1. Rome.78 pp.

7/28/2019 The State of World Fisheries and Aquaculture_2012
http://slidepdf.com/reader/full/the-state-of-world-fisheries-and-aquaculture2012 166/230

7/28/2019 The State of World Fisheries and Aquaculture_2012
http://slidepdf.com/reader/full/the-state-of-world-fisheries-and-aquaculture2012 167/230
PART 3
HIGHlIGHts
oF sPeCIAl stUdIes

7/28/2019 The State of World Fisheries and Aquaculture_2012
http://slidepdf.com/reader/full/the-state-of-world-fisheries-and-aquaculture2012 168/230

7/28/2019 The State of World Fisheries and Aquaculture_2012
http://slidepdf.com/reader/full/the-state-of-world-fisheries-and-aquaculture2012 169/230
151
HIGHlIGHts oF sPeCIAl stUdIes
effc f fihi maagm pici fihig af
Commercial ishing has always been a dangerous occupation. Although it is inherentlydangerous, many would argue that the degree o danger is a unction o ishers’choices about the riss they tae, such as the weather they ish in, the boats theyuse, the rest they obtain, and the saety gear they carry. Multiple studies suggest that
although isheries management policies are not meant to regulate saety at sea, theydo sometimes contribute to saety problems.1 For eample, ollowing interviews with22 eperienced boat owners, captains and crew in the ishing community o NewBedord, the United States o America, about their attitudes on saety at sea andisheries management, one study reported:“Approimately two-thirds rated isheriesmanagement regulations as an important actor that aected saety at sea. In act, orover hal o the ishermen, isheries management was believed to be among the mostimportant issues that impact saety at sea. Fishermen reported several problems inwhich increased dangers at sea were attributed to management regulations designedto protect various isheries.”2
Despite a variety o evidence that isheries management aects saety, there hasbeen relatively little systematic analysis o how management policies aect saety or
the etent to which changes in management can aect saety.In order to understand more ully the relationship between isheries managementpolicies and ishing saety, FAO and the United States National Institute orOccupational Saety and Health developed a study with the purpose to documentglobally the relationship between saety at sea and isheries management policies andto provide practical guidelines or isheries managers and saety proessionals on howthey can wor together to mae commercial ishing saer.3
MetHods
FAO contracted researchers to prepare country-speciic case studies on isheriesmanagement and saety in 16 countries and regions. Each case study was reviewed toidentiy evidence supporting, or reuting, one or more o our hypotheses regardingpotential eects o isheries management policies on ishing saety.
Hphi 1: Fihi maagm pici ha i-agig iic ffc fihig af. Although isheries management policies are enacted primarily to achieveresource management and social and economic goals, they may aect ishing saetyindirectly by aecting ishers’ options (how, when and where they may ish), creatingincentives or ishers to mae risy choices.
Hphi 2: Qua-ba fih maagm m a af ha cmpiifih maagm m. In competitive ishery management systems, isherscompete with one another or the available ish. In uota-based ishery managementsystems, managers limit how much individual ishers may catch. Under the latter, ishersmay have less incentive to tae riss such as ishing without adeuate rest or ishingin bad weather. quota-based ishery management may also result in the use o newer,saer vessels and gear, and more proessional and better-trained crew.
Hphi 3: Fihi maagm pici ha a uuccfu i pciguc imiig h umb f fih cmpig f imi uc ma affcaf. I the resources are not managed well, ishers are aced with trade-os betweensaety and the income they can earn rom ishing. Fishers may venture arther oshore

7/28/2019 The State of World Fisheries and Aquaculture_2012
http://slidepdf.com/reader/full/the-state-of-world-fisheries-and-aquaculture2012 170/230
The State o World Fisheries and Aquaculture 2012152
and tae greater riss. Similarly, i total catches are limited, more ishers participatingin a ishery will result in less opportunity or each isher to earn income. I the numbero ishers competing or resources is not limited, then ishers’ average incomes maydecline, causing them to tae greater riss.
Hphi 4: Fihi maagm ca cibu af fihi ic bigaig af pici ih fih maagm pici. Fisheries managementagencies may reuire saety euipment, saety training, and/or inspections as a conditionor participating in a given ishery. Fisheries developed in remote locations or identiied asbeing particularly hazardous could have additional reuirements placed on participants.
Where evidence was ound or a hypothesis, the strength o evidence was thenevaluated:
Table 14Study hypotheses
Cu/gi
Hphi 1 Hphi 2 Hphi 3 Hphi 4
Indirect effects of
fishery management
on safety
Effects of quota-
based management
on safety
Effects of unsuccessful
management on
safety
Integration of
safety policies with
management
Argentina Empirical and anecdotal
Chile Empirical
European Union Hypothesized
France Empirical
Ghana
Hypothesized and
anecdotal
Hypothesized
Iceland Hypothesized AnecdotalEmpirical and
hypothesized
Japan Implicit
MalawiHypothesized and
anecdotal Hypothesized effects Hypothesized effects
New ZealandEmpirical
and anecdotal
Pacific IslandsHypothesized and
anecdotal
Hypothesized and
anecdotal
PeruHypothesized and
anecdotal
PhilippinesHypothesized and
anecdotal
Hypothesized and
anecdotal
SpainHypothesized and
anecdotal
Hypothesized and
anecdotal
Sri LankaEmpirical and
hypothesized Hypothesized
Sweden Implicit
Thailand Anecdotal Anecdotal
Notes: Shaded cells indicate that the hypothesized potential eect is not relevant or the ishery. Blan cells indicate thatinsuicient inormation was provided in the study to draw any inerences about potential eects.

7/28/2019 The State of World Fisheries and Aquaculture_2012
http://slidepdf.com/reader/full/the-state-of-world-fisheries-and-aquaculture2012 171/230
Highlights o special studies 153
• Empirical evidence was obtained by an analysis o uantitative data.• Anecdotal evidence was based on observations by ishers or managers.• Hypothesized evidence was based on reasoning by the study authors about
potential eects.• Implicit evidence was deducted rom inormation presented by study authors
that suggests potential eects that were not speciically identiied or discussedin the studies.
resUlts
Between May and August 2008, researchers rom 15 countries prepared 16 case studies.Each case study oered some level o evidence or one or more o the our hypotheses(Table 14).
CAse stUdy
Godelman, E. Argentine safety at sea and fisheries management. August 2008.
Carrasco, J .I. The Artisanal Regime of Extraction and its impact on the safety at sea. The case of a Chilean coastal pelagic
fishery as an artisanal fishery under transition. 2008.
Renault, C., Douliazel, F. & Pinon, H. Incidence of gross tonnage limitations under the European Common Fisheries Policy.
J une 2008.
Le Berre, N., Le Roy, Y. & Pinon, H. Safety incidence of the management of scallop fisheries in Brittany and Normandy
(France). J une 2008.
Bortey, A., Hutchful, G., Nunoo, F.K.E. & Bannerman, P.O. Safety and management practices in marine fisheries industry of
Ghana. J une 2008.
Petursdottir, G. & Hjorvar, T. Fisheries Management and Safety at Sea (Iceland). September 2008.
Matsuda, A. & Takahashi, H. Present status of the study of safety and management of fishery in J apan. November 2008.
Njaya, F. & Banda, M. Fishing safety and health and fisheries management practices: case of southern Lake Malawi fisheries.
J une 2008.
Wells, R. & Mace, J . Case study on the relationship between fisheries management and safety at sea. The New Zealand
albacore fishery. September 2008.
Gillett, R. Sea safety in the Pacific Islands: The relationship between tuna fishery management and sea safety. June 2008.
Cardenas, C.A. P roject artisanal fisheries and survival at sea in Peru. J uly 2008.
CBNRM Learning Center. Sea safety and fisheries management: tuna fishing industry in General Santos City,
Philippines. August 2008.
Seco, B.R. Study of the relationship between safety at sea and fisheries management in the competence of autonomous
regions and their influence on the safety of fishermen and fishing vessels and fisheries management in Spain. J uly 2008.
Hettiarachchi, A. The multi-day fisheries of Sri Lanka: management and safety at sea. J une 2008.
Roupe, U. Fisheries management and lobster fishery: a case study on risk and safety from Sweden. August 2008.
Chokesanguan, B., Rajruchithong, S., Taladon, P. & Loogon, A. Safety at sea of trawler and purse seiner in
Thailand. August 2008.

7/28/2019 The State of World Fisheries and Aquaculture_2012
http://slidepdf.com/reader/full/the-state-of-world-fisheries-and-aquaculture2012 172/230
The State o World Fisheries and Aquaculture 2012154
Hphi 1Ten case studies provided evidence supporting Hypothesis 1. One o the mostcompelling studies was a report discussing the hypothesized eects o isheriesmanagement on saety in Iceland, including the special line o dispensation and dayso eort. The special line o dispensation allows small vessels to ish with baited hoosand lines rather than nets to catch 16 percent more than their allocated individualtranserable uota (ITq) limit without incurring any penalty. However, the vesselis reuired to return to the same port rom which it sailed within 24 hours. Thisrestriction may result in the vessel not being able to go to the nearest port to avoiddangerous weather. Days o eort resulted in a potential saety problem because,when a vessel sailed rom port, one whole day was deducted rom the total allotment.This resulted in an incentive to stay out at sea i problems were encountered or indeteriorating weather. However, in 2003–04, this rule was changed and the hazard waseliminated by measuring eort by hours started.
Another report rom the European Union discussed the saety eects o restrictionson the gross tonnage o leets. Member States are obligated to reduce ishing capacityas measured by gross tonnage and engine power. The authors argue that gross
tonnage restrictions have important negative impacts on saety owing to the ageingleet and restrictions on new vessel construction. The physical characteristics o oldervessels may mae it almost impossible to install technological advances that protectworers, and constraints placed on new vessel construction do not allow modernconstruction methods to be used. Similarly, the Spanish authors suggest that the vessel-size limits imposed by the European Union result in vessels carrying euipment thatmaes them unstable in bad weather. The Spain case study also epresses concern overmultiple and overlapping jurisdiction resulting in an overly complicated system.
In addition to the above eamples, the case report rom New Zealand discussedriss that ishers tae in preparation or implementation o a uota-based isherymanagement system. When implementing a uota-based management system, sharesare sometimes based on ishers’ catches during a speciied period (the “catch history
years”). The inancial beneits o catching ish during this period are greatly multipliedby the right they may coner to catch more ish in the uture. The phenomenono “ishing or history” is widespread in isheries where there is a perception thatmanagers may impose uota management. The authors rom New Zealand epressedconcern over riss that ishers tae while “ishing or history”.
Hphi 2Four case studies provided insights about whether uota-based ishery managementsystems are saer than competitive ishery management systems. The case study romFrance supported this hypothesis. The study compared three scallop isheries where thelocal isheries committees have adopted dierent management regimes or controllingishing eort. Saety in scallop isheries is o particular concern – scallop isheriesaccount or less than 6 percent o ull-time euivalent ishers in France but account
or more than 15 percent o ishing atalities. In the Bay o St. Brieuc, managementregulations result in a 45-minute race to ish. In contrast, in and o the Bay o Seine, a
Table 15Comparison o accident rates in French scallop isheries
Fih
tp f
maagm
ta acci
2000–05
ya aag
acci
ya xpu
im
Fquc
a
(No.) (No.) (Hours) (F)*
Bay o St. Brieuc Competitive 80 13.3 108 900 122
Bay o Seine quota-based 227 37.8 638 600 59
O Bay o Seine quota-based 313 52.2 2 860 000 18
* F = (yearly average accidents/yearly eposure time) × 1 000 000.

7/28/2019 The State of World Fisheries and Aquaculture_2012
http://slidepdf.com/reader/full/the-state-of-world-fisheries-and-aquaculture2012 173/230
Highlights o special studies 155
daily uota system without time limits is enorced. The study reviewed the respectivescallop ishing leets including the vessel type, gear and isheries managementregulations. They also estimated the population at ris, reviewed accident data, andcalculated accident rates. The results show strong empirical evidence that daily catchuotas resulted in ewer occupational accidents than the competitive ishery becausethey provided ishers with the option to ish more saely.
Much higher accident rates were ound in the competitive scallop ishery than inthe two uota-based management isheries (Table 15). The authors concluded that themajor contributing actor to these dierences was the management regime.
The study rom Chile contrasted dierent strategies or using ishing uotas.During the irst period (2001–03), global uotas were established or both industrialand artisanal leets, and industrial ishing was banned rom the Artisanal FishingReserved Area. Increased resources in the artisanal sector led to substantial growthin the artisanal leet during these years, which encouraged a race or ish. During thesecond period (2004–07), the “Artisanal Regime o Etraction” was implemented;shares o the global artisanal uota were allocated to ad-hoc organizations o ishersbased on groups’ past participation and landings in the ishery. Compliance with the
global uota improved, which contributed to a lessening o the race or ish and vesseloverloading. The rates o atalities, injuries and search and rescue (SAR) incidents showthat saety problems increased during the irst period but decreased during the secondperiod.
Although the case report rom Iceland did not evaluate the ITq programmespeciically, the authors did note that the ITq system in Iceland “opened an opportunityor consolidation and modernization o older, less eicient and sae vessels” and thatit contributed to a signiicant decline in the numbers o vessels and ishers. Under theuota system, there has been a signiicant decline in total SAR and medical evacuationmissions and atalities.
Hphi 3
Four case studies (those or Ghana, Malawi, Paciic Islands, and Thailand) discussedsituations in which isheries management agencies laced the capacity to limiteectively catches and/or the number o ishers participating and provided evidenceor Hypothesis 3. In all o these reports, economic pressures on coastal populations,or whom ishing is an important traditional activity and employer o last resort, ledto increasing catches, which led to depletion o near-shore resources. This problemwas sometimes aggravated by uncontrolled catches by larger industrial vessels, bothdomestic and oreign, operating (oten illegally) in the same waters. As near-shoreresources were overished and declined, ishers ished increasingly arther oshore,where they aced greater riss.
Hphi 4Several case studies discussed Hypothesis 4 and listed the potential beneits or saety
i managers placed saety reuirements on ishery participants. A study that reviewedthe accident and atality data rom ishers between 1991 and 2007 made the strongestargument or this. The authors discussed three eatures o the Icelandic managementsystem. Most importantly, in Iceland, a ishing licence is only issued when minimumsaety euipment and crew training are achieved. The authors concluded thatmandatory reuirements or saety training, euipment and awareness have increasedsaety. From 1991 to 2007, SAR missions decreased by 50 percent. The Icelandicauthors state that: “the system contributed to the increased saety through placingreuirements on euipment and training, resulting in a lower accident rate.”
dIsCUssIon
The case studies provide evidence o how isheries management policies can aect
saety. Many case studies provided persuasive arguments or change. They add toa body o eisting literature that demonstrates that isheries management policies

7/28/2019 The State of World Fisheries and Aquaculture_2012
http://slidepdf.com/reader/full/the-state-of-world-fisheries-and-aquaculture2012 174/230
The State o World Fisheries and Aquaculture 2012156
have wide-ranging eects on ishing saety. The FAO Code o Conduct or ResponsibleFisheries (the Code) provides a necessary ramewor to ensure sustainable and saeishing.4 In FAO Fisheries Circular No. 966,5 the authors argue that: “saety at seashould be integrated into the general management o the isheries in each country.”They urther state that regulations should ensure “the saety and well-being o theishermen, as well as sustainable utilization o the ishstocs.”
Although isheries management policies may be enacted primarily to conserveresources and achieve economic and social goals, isheries managers need to be awareo how management aects saety. They need to consider whether managementpolicies that negatively aect saety are necessary, or whether conservation, economicand social goals can be achieved through regulations that allow and encourage ishersto ish more saely. Saety in the ishing industry cannot be separated rom isheriesmanagement. To improve ishing saety, isheries management personnel and ishingsaety proessionals should wor together to identiy solutions to meet all goals.Policies that result in ishers being orced to choose between ris-avoidant situationsand maimizing proits should be eamined. Most case studies (63 percent) providedsome evidence o how isheries policies aect saety (Hypothesis 1). Management
regulations that negatively aect saety need to be modiied to protect ishers.Four case studies reviewed how uota-based isheries managed policies aect saety
(Hypothesis 2). They reported mied results. One o the underlying goals o uota-based management systems is to improve saety. In theory, uota-based systems mayreduce ishers’ incentives to tae riss such as ishing without adeuate rest or ishingin bad weather. Thus, replacing a competitive derby ishery with an individual ishinguota may remove some incentives to tae ris.
However, this does not in itsel guarantee that such riss will not be taen. It isoverly simplistic to argue that uota-based ishery management systems are alwaysor necessarily saer than competitive ishery management systems. Thereore, it isnot uota-based management in itsel that maes a ishery saer or less sae. Rather,it is how uota-based management aects those who participate in the ishery, how
they participate, and the conditions and incentives under which they participate.These eects may vary widely across uota-based programmes depending on how theprogrammes are structured and on other actors aecting the ishery, ranging rom themarine environment to the maret.
It is clear that under certain conditions uota systems can reduce the riss in a givenishery. A report on the comparative analysis o regulatory regimes6 states: “Someisheries have eperienced signiicant improvements in health and saety ollowingthe implementation o Iq programs, including the Nova Scotia oshore ishery ..., theAlasan halibut and sableish isheries ... and the British Columbia geoduc ishery ...;others have maintained relatively high accident and atality rates under the Iq system,such as the sur clam and ocean uahog isheries o New England ... and the nationalisheries o Iceland ... and New Zealand”.
Case studies reviewing Hypothesis 3 ound evidence that i ishery resources are
depleted, or competition or limited resources becomes more intense, ishers will taegreater riss, such as ishing arther oshore, to see a living. The challenge aced bymanagers in addressing saety problems etends to balancing resource protection,economic development and social goals such as access to economic opportunities in anoccupation that, in many places, is one o last resort. It is clear rom these case studiesthat ishery managers in developing countries ace very serious challenges, and thatishers in these countries may ace much greater riss than those in most developedcountries. These riss are less liely to derive rom constraints imposed by isherymanagers than rom the inability o ishery managers to constrain harvests and accessto ishing by coastal residents willing to tae riss in pursuit o their livelihoods.
Hal o the case studies provided eamples and ideas about how isheriesmanagement can contribute to saer isheries directly by integrating saety
policies with ishery management policies (Hypothesis 4). Where practical, isheriesmanagement policies should incorporate strategies to reduce hazards and mae ishing

7/28/2019 The State of World Fisheries and Aquaculture_2012
http://slidepdf.com/reader/full/the-state-of-world-fisheries-and-aquaculture2012 175/230
Highlights o special studies 157
saer. A Canadian study7 concluded that: “I properly acilitated, many aspects o saetycan be enhanced through the isheries management deinition without compromisingother management objectives. Connecting licenses with competency, saety certiicatesand vessel seaworthiness may provide a good system o checs and balances or a long-standing problem. Incorporating saety oriented measures into other managementprocedures such as permitting variations on partnering and uota allocations, couldintroduce valuable saety practices that maes ishing in small vessels more practical.Beore proceeding with these ind o measures however, there would have to be aserious buy in by other players, including ishing industry representatives.”
Managers ind themselves in a position where they have to attempt to balancemultiple objectives under signiicant uncertainty, with limited resources. Managersshould tae practical steps and acnowledge that: “Saety at sea must be integratedinto the general management o isheries in all coastal states i saer woringconditions or ishermen are to become a reality.”8
ConClUsIons And Follow-UP
All o the case studies provided some level o evidence or one or more o the our
hypotheses. Although most case studies did not empirically measure saety eects,the anecdotal and persuasive arguments regarding the eects o policies on saetycannot be dismissed. Fisheries managers, saety proessionals and ishers need to wortogether in order to develop and coordinate strategies to improve saety and integratesaety into management policies that not only protect the ish but protect the ishers aswell.
While the riss associated with commercial ishing cannot be completely eliminatedthrough policy changes, there should not be a conlict between ollowing policiesand choosing to be sae. Fishing saety is a comple problem. The signiicance andpersistence o saety problems in isheries around the world suggests that there areno easy or obvious solutions. Fisheries management is not the only or most importantactor aecting ishing saety. However, the case studies reviewed add to the wide
range o evidence that isheries management can aect ishing saety in a variety oways. It is important to understand what these eects are, and to consider the ways inwhich isheries management policies, while continuing to meet ishery managementgoals, may also be used to mae ishing saer.
Future research should continue to: eamine relationships between isheriesmanagement policies and saety to identiy policies that create incentives or ishersto tae riss; identiy modiiable actors; and develop policy alternatives. This typeo research will help support changes in policy to incorporate saety assessments intoisheries management decisions. This synthesis provides evidence or the signiicantpotential or policies to contribute to improved saety in many isheries. There isevidence o potential policy changes in the United States o America. In 2011, theUnited States National Oceanic and Atmospheric Administration (NOAA) initiated anAdvanced Notice o Proposed Rulemaing to reuest public comment on potential
revisions to its National Standard 10 guidelines, which state: “Conservation andmanagement measures shall, to the etent practicable, promote the saety o humanlie at sea.”9 In any country and commercial ishery, continued monitoring o thechange in riss is warranted. Improved data collection and coding are necessary to tracadverse events by type o ishery or uture evaluation.
F af mai a ciica cmp f f auii cui
IntrodUCtIon
Today, ood saety remains a major concern acing the seaood industry and it is acritical component in ensuring ood and nutrition security worldwide. The production

7/28/2019 The State of World Fisheries and Aquaculture_2012
http://slidepdf.com/reader/full/the-state-of-world-fisheries-and-aquaculture2012 176/230
The State o World Fisheries and Aquaculture 2012158
and consumption o sae ood are central to any society and they have a wide rangeo economic, social and, in many cases, environmental conseuences. The issue oood saety is even more important in view o the growth in international ish trade,which has undergone tremendous epansion during the last three decades, increasingrom US$8 billion in 1976 to a record eport value o US$102.5 billion in 2010.Developing countries play a major role in international ish trade. In 2010, their eportsrepresented 49 percent (US$42.5 billion) o world ish eports in value and 59 percent(31.6 million tonnes live weight euivalent) in volume.
In 1994, FAO published Assurance o Seaood Quality 10 in response to the growingneed or guidance on the subject rom Members. A decade later, in 2004, FAOpublished an epanded and revised technical paper Assessment and Management o
Seaood Saety and Quality 11 that addressed new developments, especially with regardto ood saety and the adoption, internationally, o the Hazard Analysis and CriticalControl Point (HACCP) system and ris analysis concepts.
In response to the increasing importance o seaood trade and to the signiicantchanges in the regulatory environment in the last decade, a new and revised FAOtechnical paper12 has re-eamined the whole area o seaood saety and uality. The
study ocuses on:• developments in ood saety and uality management systems;• characterization o the ood saety hazards in seaoods and seaood uality;• implementation o management systems to ensure sae and high-uality
seaoods.The study also analyses:• the regulatory ramewor that all ood business operators (producers,
processors, distribution and retailers) must now operate within – at theinternational, regional and national levels;
• the probable impact o climate change on ood saety, ocusing on the mostimportant hazards – microbial pathogens and natural toins rom algalblooms;
•
the challenges acing developing countries.
develoPMent oF Food sAFety And QUAlIty systeMs
In the 1980s, ood trade epanded dramatically with more ood products crossingnational and continental borders. Eports rom developing countries increased. Atthe same time, several ood scares, caused by bacterial (e.g. Salmonella and Listeria)and chemical (e.g. mycotoins) contamination meant that ood saety was an issue omajor public concern. This concern was eacerbated during the 1990s by “mad cowdisease” and the “dioin crisis”, and these ood saety problems orced regulators torethin ood saety strategies, integrating the various components o the value chainand introducing traceability reuirements. In the new millennium, ood production anddistribution have become even more comple and maret choices or consumers evenwider. The media and consumers have developed a much greater interest in ood saety
issues ollowing a number o ood scares, such as:• In Germany, a new strain o E. coli lined to bean sprouts inected more than
3 500 people and illed 53.• In the United States o America, a Listeria outbrea resulted in 100 cases and
18 deaths, leading to recalls o about 5 000 reshly cut cantaloupes, while aSalmonella outbrea lined to peanut butter resulted in more than 500 casesin 43 states and led to recalls worth US$1 billion.
• In China, oicial igures indicate that 6 babies died and 294 000 were madesic rom intentional addition o melamine to various oodstus, mainly miland inant ormulas.
Epansion o the ood industry and ood distribution systems across borders andcontinents reuired the development o uality assurance systems to support business-
to-business contractual agreements and veriication o conormity o ood supplieswith the speciications. At the same time, the development o bilateral, regional and

7/28/2019 The State of World Fisheries and Aquaculture_2012
http://slidepdf.com/reader/full/the-state-of-world-fisheries-and-aquaculture2012 177/230

7/28/2019 The State of World Fisheries and Aquaculture_2012
http://slidepdf.com/reader/full/the-state-of-world-fisheries-and-aquaculture2012 178/230
The State o World Fisheries and Aquaculture 2012160
is technologically diicult, and the ris assessment showed that a criterion would beneeded or public health protection in ready-to-eat products, e.g. smoed ish, and thatthe ris depended on the ability o the product to support growth o the organism. Asa result o discussions by the eperts, the CAC set a standard o 100 cu/g in productsthat do not support the growth o this organism and a “zero tolerance” or productsthat can support growth.
seAFood QUAlIty
While the concepts o ris analysis are clearly developed to ensure ood saety, thesame approach and thining can be applied to cover, or eample, sensory uality,composition and labelling. National regulations, commercial speciications orinternational Code Standards set the speciications or uality.
Similar to the ris assessment process, biological, chemical and physical agentscapable o causing uality loss that may aect a particular seaood need to beidentiied. In addition, a ualitative and/or uantitative evaluation o uality loss needsto be characterized.
sAFety MAnAGeMent systeMsAs indicated above, there are many pathogens and spoilage agents that cancontaminate ish and seaood during handling, processing or distribution, either rom
Bo 15 The Hazard Analysis and Critical Control Point system and prereuisiteprogrammes
Hazard Analysis and Critical Control Point (HACCP) is a system that identiies,
evaluates and controls physical, chemical and biological hazards that aresigniicant or ood saety.1 It is a science-based and systematic tool that
assesses hazards and establishes control systems that ocus on prevention
rather than rely mainly on end-product testing. It not only has the advantage
o enhancing the saety o the product but, because o the means o
documentation and control, it provides a way o demonstrating competence
to customers and compliance with legislative reuirements to the ood
control authorities.
Prereuisite programmes are deined as:
• Procedures, including good manuacturing practices that address
operational conditions providing the oundation or the HACCP
system (National Advisory Committee on Microbiological Criteria or
Foods, 1998).
• Practice and conditions needed prior to and during theimplementation o HACCP and which are essential or ood saety
(World Health Organization, 1999).
• A programme that is reuired prior to the application o the HACCP
system to ensure that a ish and shellish processing acility is
operating according to the Code Principles o Food Hygiene, the
appropriate Code o Practice and appropriate ood saety legislation
(Code Alimentarius Commission, 2003).
1 Code Alimentarius Commission. 2003. Recommended International Code o Practice: General
Principles o Food Hygiene. CAC/RCP 1-1969, Rev. 4-2003. Rome, FAO/WHO. 31 pp.

7/28/2019 The State of World Fisheries and Aquaculture_2012
http://slidepdf.com/reader/full/the-state-of-world-fisheries-and-aquaculture2012 179/230
Highlights o special studies 161
handlers, euipment, surrounding environment or other sources, such as cleaningwater or ice.
The advent o the HACCP-based system (Bo 15) in recent decades has provided asingle system that has now been adopted by international bodies and trading countriesand regions to control ood saety. However, there are important oundations to beput in place beore implementing the HACCP system. International organizationshave deined the importance o so-called prereuisite programmes, and this clearlydierentiates the prereuisite programmes rom the HACCP system – something that isalways not ully appreciated by processors in many countries.
Moreover, various bodies have deined what is reuired in these “pre-HACCP”operations and, while there is overlap, they do dier. This lac o a universally agreedset o operations prior to implementing HACCP has possibly given rise to the laco consistency in documentation o these procedures when compared with the verystructured approach oered by the 12 steps o the HACCP system.
More recently, the International Organization or Standardization (ISO) hasdeveloped the ISO 22000 amily o standards (ISO 22000 – “Food saety managementsystems – reuirements or any organization in the ood chain”). It taes the approach
o ISO 9001 as a management system, and incorporates the hygiene measures oprereuisite programmes and the HACCP principles and criteria. In 2008, PAS 220:2008was developed to cover what were seen to be shortcomings in the prereuisite elemento ISO 22000 at the time.
tHe reGUlAtory FrAMework
The ramewors or ensuring ood saety in the international contet are providedby: (i) the World Trade Organization (WTO) under two binding agreements(the Agreement on the Application o Sanitary and Phytosanitary Measures[SPS Agreement], and the Agreement on Technical Barriers to Trade [TBT Agreement]);(ii) the Code Alimentarius Commission (CAC) through various instruments, oreample, the Code o Practice or Fish and Fishery Products and the basic tets on
Food Hygiene; and (iii) the FAO Code o Conduct or Responsible Fisheries (the Code),especially under Article 6 (General principles, provisions 6.7 and 6.14) and Article 11(Post-harvest practices and trade), both o which are o particular relevance to ishtrade, saety and uality.
For international ish trade, countries have enacted national and regionalregulations to control seaood entering or eiting their territories. As more than70 percent o seaood trade is destined or three main marets (the European Union,the United States o America, and Japan), these marets are important regulatoryreerence points.
The United States o America has a decentralized system or ood saety and ualityregulation. There are no ewer than 17 ederal government agencies involved in oodregulation. The two most important agencies are the Food and Drug Administration othe Department o Health and Human Services, which regulates all ood ecept meat
and poultry, and the Food Saety Inspection Service o the Department o Agriculture,which is primarily responsible or meat and poultry. The Environmental ProtectionAgency regulates the saety o water, while the Agricultural Mareting Service oersproduct uality and grading services or a ee to all ood commodity groups eceptseaood. Seaood uality and saety services or a ee are provided by the SeaoodInspection Program o NOAA Fisheries within the Department o Commerce. TheDepartment o Homeland Security is involved in ensuring that intentional productadulteration does not occur. The recent Food Saety Modernization Act (2011) is nowthe guiding legislation or improved ood saety in the United States o America.
In the European Union, as the result o a white paper on ood saety in 2000, theapproach taen in the legislation is to separate aspects o ood hygiene rom animalhealth and to harmonize ood control across the European Union member countries. A
ey aspect o the legislation is that all ood and eed business operators, rom armersand processors to retailers and caterers, have principal responsibility or ensuring that

7/28/2019 The State of World Fisheries and Aquaculture_2012
http://slidepdf.com/reader/full/the-state-of-world-fisheries-and-aquaculture2012 180/230
The State o World Fisheries and Aquaculture 2012162
ood placed on the European Union maret meets the reuired ood saety standards.The Regulations14 apply at every stage in the ood chain, including primary production(i.e. arming, ishing and auaculture) in line with the “arm to or” approach to oodsaety in the European Union. The Regulations also include provisions or guides to goodpractice to be developed by industry with support rom other staeholders.
In Japan, distrust o regulatory ood saety has been rising among the public.People’s growing concern has been triggered by various problems, including theoccurrence o bovine spongiorm encephalopathy, commonly nown as mad cowdisease, in 2001. Against this bacground, Japan has enacted the Food Saety BasicLaw, a comprehensive law to ensure ood saety to protect the health o the public.In the wae o the development o the basic law and other related laws, Japan hasintroduced a ris analysis approach (described above) to the national ood saetycontrol programme wor. The Food Saety Basic Law assigns responsibility or risassessment, and the Food Sanitation Law and other related laws identiy who areresponsible or ris management. The ris assessment is in practice conducted by theFood Saety Commission established under the Food Saety Basic Law.
ClIMAte CHAnGe And Food sAFetyThe earth’s climate is changing, and this may inluence the saety o ood harvestedrom marine and reshwater environments. There are two main areas that have thepotential or change: microbial pathogens, and harmul algal blooms.
Micbia pahgClimate change is epected to accelerate the water cycle with increased precipitationin the tropics and at high altitudes, drier conditions in subtropics and increasedreuencies o etreme droughts and loods. Events such as loods are liely to disruptsanitary inrastructure around ish harvesting and auaculture sites, aecting ishsaety. The presence o Salmonella in rivers and the marine environment has beenrelated to torrential rains and storm-generated lows, and the pathogen could thus
reach auaculture sites or contaminate ish in coastal waters. Outbreas o illnesscaused by Vibrio parahaemolyticus in shellish in Chile have been related to the arrivalo warm euatorial water during El Niño events.
Hamfu aga bmHarmul algal blooms are a completely natural phenomenon that have occurredthroughout recorded history in all parts o the globe. Whereas wild ish stocs areree to swim away rom problem areas, caged ish and shellish are trapped and, thus,can suer mortalities and/or become toic. O greatest concern to human society arealgal species that produce potent neurotoins that can ind their way through shellishand ish to consumers, where they cause a variety o gastrointestinal and neurologicalillnesses. Worldwide, almost 2 000 cases o ood poisoning rom consumption ocontaminated ish or shellish are reported each year. Some 15 percent o these cases
prove atal. In the past three decades, harmul algal blooms seem to have becomemore reuent, more intense and more widespread, in part ascribed to climatechanges. The seaood industry (capture and armed) must monitor or an increasingnumber o harmul algal species in the water column and or an increasing numbero algal toins in seaood products. Global climate change is adding a new level ouncertainty to many seaood saety monitoring programmes.
IMPACt on develoPInG CoUntrIes
While eorts in the major marets are ocusing on a regulatory ramewor to ensurethe saety o their consumers, several development agencies and donors have beeneploring ways and means, both inancial and technical, to assist developing eportingcountries build the necessary national and regional capacity to meet these international
saety and uality standards. Proper assessment o the etent o assistance needed isey in decision-maing. Thereore, costing the impact o substandard products, rom

7/28/2019 The State of World Fisheries and Aquaculture_2012
http://slidepdf.com/reader/full/the-state-of-world-fisheries-and-aquaculture2012 181/230
Highlights o special studies 163
both a uality and saety perspective, is o interest not only to producers, processors,uality control authorities and consumers, but also to governments, donors, publichealth authorities and development agencies. In addition to the economic lossesincurred because o ish spoilage, product rejections, detention and recalls, and theresulting adverse publicity to an industry and even to a country, ish-borne illnesses costvast amounts to the community because o adverse health eects, loss o productivityand medical epenses.
Fish and seaood are crucial income earners or many developing countries. Tradeliberalization has reduced tari barriers, which should have a positive impact ondeveloping countries’ access to developed country marets. However, it is increasinglyclear that the main barrier to increased eports is no longer import taris but thediiculties developing countries have in meeting import maret uality-related andsaety-related reuirements.
Developing countries have pointed to the challenge presented by national andregional saety and uality control regimes that vary rom one jurisdiction to the net.This multitude o approaches imposes signiicant costs on eporters in countries wherethere is limited capacity to develop comprehensive saety and uality management
systems and inrastructures, let alone several dierent systems to meet diverse importmaret reuirements. Although progress has been made in terms o harmonization, inparticular via the WTO and the CAC, it has been slow and more wor is reuired.
The concerns epressed by developing countries in relation to public regulationin importing countries are mirrored in their concerns related to private standardsor ood saety. The costs o compliance (including the duplication o eort reuiredto complete various levels o documentation), the need to respond to a multiplicityo dierent standards, the increasing speciicity o those standards, and the lac oharmonization among them are major concerns or developing countries. Much eorthas gone into meeting European Union and other importer reuirements in many
Bo 16 An Indian success story
Small armers with holdings o less than 2 ha account or 90 percent o
shrimp auaculture in India. The outbrea o white spot disease seriously
aected the shrimp auaculture industry in India in the mid-1990s and
the related losses in 1995–96 were estimated at about US$120 million.
Subseuently, the problem o antibiotic residues aected maret access or
shrimp in India. To address this, better management practices (BMPs) using a
cluster-based approach were started in one state. In 2001, this approach was
demonstrated in 10 ponds covering 7 ha and producing 4 tonnes o shrimp.
The BMPs contributed to improved production and reduced diseases withoutthe use o antibiotics. This initiative slowly epanded to 108 ponds covering
58 ha in 2003, and, by 2007–08, it had epanded to 5 states in India covering
an area o 6 826 ha. The BMPs included documentation o inputs, which
acilitated implementation o traceability in this sector o small armers. The
goal is to organize 75 000 armers into 1 500 societies by the end o 2012.
Source: Umesh, N.R., Mohan, A.B.C., Ravibabu, G., Padiyar, P.A., Phillips, M.J., Mohan, C.V.and Vishnu Bhat, B. 2010. Shrimp armers in India: empowering small-scale armers through acluster-based approach. In S.S. De Silva and F.B. Davy, eds. Success stories in Asian aquaculture,pp. 44–66. Dordrecht, Netherlands, Springer Science+Business Media B.V.
7/28/2019 The State of World Fisheries and Aquaculture_2012
http://slidepdf.com/reader/full/the-state-of-world-fisheries-and-aquaculture2012 182/230
The State o World Fisheries and Aquaculture 2012164
developing countries. Conseuently, more than 100 countries, most o them developingcountries, are approved eporters o ish products to the European Union because theyhave ood saety management systems euivalent to those o the European Union.However, or other developing countries, poor public inrastructure challenges theirabilities to meet either public or private overseas standards.
Furthermore, many developing countries have been unable to access the growingmaret or higher value-added products. Instead, their processing activities have beenlimited to less sophisticated types o processing (illeting and canning). Private-sectorcompanies appear unwilling to invest in more sophisticated production euipment indeveloping countries i their activities are not supported by the public inrastructure.Companies can and do relocate processing to developing countries – including totae advantage o lower labour costs – where they have conidence in the localadministrative systems (including saety and uality management regimes). Integratedsupply chains mean closer collaboration with import marets. This could also meanopportunities or transers o technology and epertise to developing countries.
Some countries have introduced state-mediated certiication procedures to certiytheir saety and environmental credentials, in particular in their auaculture industries.
This can be seen as a proactive strategy to respond to saety and uality demands romimport marets by promoting themselves as suppliers o sae and high uality ish andseaood, e.g. Thai quality Shrimp.
Organizing ishers and ish armers in developing countries, or eample, byencouraging armers/ishers associations or clusters (Bo 16), enables them to respondcollectively to the reuirements o both public and private standards, and ensures thatthey are able to tae advantage o available technical assistance.
For developing countries to tae advantage o the opportunities presented byprivate standards, they must irst be able to meet the reuirements o mandatoryregulatory reuirements in importing countries. Compliance with mandatoryreuirements is a prereuisite to any private-sector certiication, but the reverse isnot true. For eample, certiication to a private standard scheme will not allow access
to the European Union maret i the eporting country itsel (and its competentauthority) has not been given the green light to eport to the European Union.Hence, there is a need or continued technical assistance and dissemination o
relevant inormation to developing nations to help them meet the ever-increasing andmore comple challenges posed by international marets.
Mai pc aa: a f h cm appach fihi
IntrodUCtIon
As people have become more aware o their impact on the environment and the
possible conseuences thereo not only on their current well-being but also or uturegenerations, the recognition o the need or protection balanced with sustainableuse o the world’s natural resources has increased dramatically. There have been callsor integrated and holistic natural-resource management approaches, ocusing onecosystems rather than only on speciic species or ecosystem components. In response,various international ora have advocated adoption o more holistic approaches suchas the ecosystem approach, and the use o tools such as marine protected areas (MPAs)and MPA networs. One o the primary ora that irst brought MPAs to the oreronto discussions on global marine conservation was the Johannesburg Summit o 2002 –the World Summit on Sustainable Development. Its Plan o Implementation reueststhat nations promote the conservation and management o important and vulnerablemarine and coastal areas.
In act, spatial management measures, including MPAs, or ishing closures as amanagement tool have a long history in isheries (see Bo 17). With the current move

7/28/2019 The State of World Fisheries and Aquaculture_2012
http://slidepdf.com/reader/full/the-state-of-world-fisheries-and-aquaculture2012 183/230
Highlights o special studies 165
in isheries management towards the ecosystem approach to isheries (EAF) and similarmethods, their use may become even more prevalent.
Hence, a convergence o interests has come about as isheries managers emphasizehealthy ecosystems as a reuirement or sustainable isheries. Conservation groupshave also become increasingly aware o the necessity to include human needs andinterests in designing and implementing MPAs. However, there remains conusionregarding the establishment o MPAs with varying objectives, as well as the generalrole o MPAs meeting multiple objectives within isheries management systems. Viewson how and when to use MPAs and what they can achieve dier signiicantly amongdiverse political, social and proessional groups, and also among individuals.
Considering this conusion and the attention given to MPAs, the FAO Fisheries and
Auaculture Department has developed guidelines on MPAs and isheries 15 (hereater,the Guidelines) with a view to clariying the bioecological and socio economicconstraints and eects o MPAs in the contet o isheries. The Guidelines addressthe interace between isheries management and biodiversity conservation, and theyprovide guidance on implementing MPAs with multiple objectives where one o theprimary objectives is related to isheries management. They draw on eperiencesrom around the world and mae use o a number o national case studies conductedin order to gather inormation on governance regimes o spatial managementmeasures.
BACkGroUnd
th ii f mai pc aa
A stumbling bloc in many discussions on MPAs is the terminology; what is an MPA?The MPA concept is applied diversely around the world and with dierent names or
Bo 17 Marine protected areas, isheries and the Code
In isheries management, spatial management tools, including marine
protected areas, are not new – they have been used or centuries. Protection
o speciied areas through bans on types o gear and ishing activities has
long been part o the isheries management toolbo and practised by
communities employing traditional management arrangements around
the world. The FAO Code o Conduct or Responsible Fisheries (the
Code) mentions the use o spatial management measures, or eample,
in Article 6.8, which emphasizes the importance o protection and
rehabilitation or all critical habitats, and particularly protection against
human impacts such as pollution and degradation.1 In an eort to promote
its goal – sustainable isheries – the Code addresses protected area measures
in Article 7.6.9:“States should tae appropriate measures to minimize waste, discards,
catch by lost or abandoned gear, catch o non-target species, both ish
and non-ish species, and negative impacts on associated or dependent
species, in particular endangered species. Where appropriate, such measures
may include technical measures related to ish size, mesh size or gear,
discards, closed seasons and areas and zones reserved or selected isheries,
particularly artisanal isheries.”
1 FAO. 1995. Code o Conduct or Responsible Fisheries. Rome. 41 pp.

7/28/2019 The State of World Fisheries and Aquaculture_2012
http://slidepdf.com/reader/full/the-state-of-world-fisheries-and-aquaculture2012 184/230

7/28/2019 The State of World Fisheries and Aquaculture_2012
http://slidepdf.com/reader/full/the-state-of-world-fisheries-and-aquaculture2012 185/230
Highlights o special studies 167
Eperience shows that, when designed and managed appropriately, MPAs willprobably provide beneits or ishery resources inside the enclosure in terms oabundance (in number and biomass) and average individual size o populations. Theremay also be some beneits to the ishery in the areas close to the MPA as a result ospillover, but ewer studies are available on this eect. In general, conservation beneitsare liely to be greater or more sedentary species, and isheries beneits should begreater or species with intermediate mobility. Marine protected areas can also playan important role in the protection o habitats and critical lie stages, and in reducingbycatch.
Bo 19 Dierent national deinitions o marine protected area
In Brazil, there are two main categories o protected areas: areas under
total protection (no-tae zones); and areas or sustainable use. The maindierence between them relates to permission to etract natural resources
and to live inside their boundaries – orbidden in the ormer and allowed in
the latter. Within these two categories, there are dierent types o no-tae
and sustainable-use protected areas, each o them with speciic objectives.
In the Philippines, a wide range o terms is used or marine protected
areas (MPAs). Their use may vary depending on the legislation, designating
authority and type and uality o the resources and the intent. However, in
practice, a standardized terminology is emerging among policy-maers with
MPAs being deined as “any speciic marine area which has been reserved by
law or other eective means and is governed by speciic rules or guidelines
to manage activities and protect part or the entire enclosed coastal and
marine environment”.In Senegal, the concept o MPAs continues to be the subject o numerous
discussions with regard to their objectives, origin, legal status, relevant
institutions, and design and implementation approaches. In the legal
ramewor, the role o MPAs has been deined as “protection, on a scientiic
basis, or current and uture generations, o important natural and cultural
resources and ecosystems representative o the marine environment”. In
practice, MPAs in Senegal have two main characteristics. First, the purpose o
MPAs is to contribute to the conservation o marine and coastal biodiversity.
Second, an area o particular interest can be designated according to
bioecological, territorial or socio-economic considerations and given special
management measures or improving conservation, while taing the
livelihoods o the resource users into account.
Palau characterizes MPAs through two distinct categories: managementand use. The irst type ollows the si levels o the management guidelines
o the International Union or Conservation o Nature, while the second
includes traditional, local and national uses o protected areas. Many MPAs
in Palau encompass a range o levels or types o management.
Sources: Sanders, J.S., Gréboval, D. and Hjort, A., comps. 2011. Marine protected areas: country
case studies on policy, governance and institutional issues. FAO Fisheries and AuacultureTechnical Paper No. 556/1. Rome, FAO. 118 pp.Sanders, J.S., Gréboval, D. and Hjort, A., comps. (orthcoming). Marine protected areas: country
case studies on policy, governance and institutional issues. FAO Fisheries and AuacultureTechnical Paper No. 556/2. Rome, FAO.

7/28/2019 The State of World Fisheries and Aquaculture_2012
http://slidepdf.com/reader/full/the-state-of-world-fisheries-and-aquaculture2012 186/230

7/28/2019 The State of World Fisheries and Aquaculture_2012
http://slidepdf.com/reader/full/the-state-of-world-fisheries-and-aquaculture2012 187/230

7/28/2019 The State of World Fisheries and Aquaculture_2012
http://slidepdf.com/reader/full/the-state-of-world-fisheries-and-aquaculture2012 188/230
The State o World Fisheries and Aquaculture 2012170
The international worshop “Eploring the Role o MPAs in Reconciling FisheriesManagement with Conservation” (29–31 March 2011, Bergen, Norway) ocused onthe need or and role o MPAs with multiple objectives. It also discussed the need orinstitutional arrangements, noting that a coordinating interministerial or intersectoralinstitution may be needed at the national level to reconcile objectives (isheriesmanagement and biodiversity conservation, as well as those related to the interestso, or eample, local communities and the tourism sector). Such a body would needto mae strategic trade-os between sectors and balance dierent power structures.Moreover, vertical lins in the decision-maing processes rom the local level tothe national policy level are reuired, with appropriate representation o dierentinterests at each level.
The types o management arrangement and governance regime under which anMPA can be planned and implemented depend on the conditions provided by theoverall legal, institutional and policy ramewor. While centralized, state-controlled,command-and-control systems are still common, there has been a trend towardsincreasingly decentralized isheries management in recent decades. Various orms ocomanagement governance systems are applied in many parts o the world, based on
partnerships between governments and resource users with shared responsibility andauthority or isheries management. These governance systems are oten combinedwith rights-based approaches to isheries management.
Staeholder involvement in planning and implementation is crucial or thesuccess, in particular, o coastal MPAs. The socio-economic impacts o an MPA canbe positive and negative, direct and indirect, aecting sectors and staeholdersadjacent to and beyond the MPA site. Marine protected areas have distributionaleects, oten very signiicant ones, and dierent staeholder groups are aectedin dierent ways. People, individually and as a group, should be made to eelthat they have been part o the decision-maing process and have been able toparticipate in and inluence it. Without their involvement, it will be diicult toobtain support and compliance.
sig bjciWithin the contet o the deined overall isheries management and/or biodiversityconservation objectives, speciic goals and objectives should be set or the individualMPA or MPA networ. There should be both longer-term visionary goals andoperational objectives. The goals and objectives should be easy to understand andwidely communicated. Because MPAs will have multisectoral eects, multiple goalsshould be considered even where the original initiative to designate an MPA hasemerged rom one particular concern. For eample, when setting up an MPA orbiodiversity conservation, its harmonization with relevant isheries policies andlegislation, and its potential contribution to sustainable isheries should also beeplored. I the eects on isheries are internalized in the planning and design process,instead o being dealt with as an eternality, the outcomes are liely to be more
useul. Setting clear goals and objectives helps ensure more-eective managementand acilitates the monitoring o progress. When the speciic MPA objectives are set,decisions on the site, scale and other design aspects o the MPA should ollow. Thesedecisions should be goal- and objective-driven.
The Bergen MPA worshop also emphasized the need to establish clearly deinedgoals and objectives. The need or baseline assessments that will allow or monitoringwas also raised. The design and management o an MPA should be leible andadaptive, allowing or adjustment o management i monitoring shows that theobjectives are not being reached.
As in all management planning processes, early involvement o staeholders in theMPA planning process is important. This means that staeholders should be involvedin identiying the issues that the MPA is epected to address and resolve and in the
setting o MPA goals and objectives. The diversity and type o inormation broughtto bear on decisions depends on who has the right to participate in decision-maing

7/28/2019 The State of World Fisheries and Aquaculture_2012
http://slidepdf.com/reader/full/the-state-of-world-fisheries-and-aquaculture2012 189/230
Highlights o special studies 171
processes. Conseuently, participatory planning arrangements generally increase theamount o inormation integrated into MPA planning and implementation. Whentaing a holistic and integrated approach to MPA planning, the process o identiyingand agreeing on pertinent issues is liely to be comple. With a broad range ostaeholders and views on what aspects are important, prioritization becomes acritical element o the process. Several methods and approaches can help both in theidentiication o issues as well as when deining goals and objectives (Bo 21).
tHe wAy ForwArd
The current trend towards greater emphasis on MPAs as a isheries management andbiodiversity conservation tool will continue both within the ramewor o the EAF andin the contet o the international commitments made on conservation and sustainabledevelopment. In attempting to maimize the contribution o this spatial managementmeasure to achieving healthy marine ecosystems and sustainable isheries, and meetingbroader societal objectives – including poverty reduction and ood security – there areboth opportunities and challenges.
The Bergen MPA worshop recognized the increasing reconciliation between the
isheries management and biodiversity goals. However, it also ound that urtherinstitutional arrangements, such as legal ramewors, staeholder/communityparticipation and coordination among high-level agencies, have to be secured in orderto enhance reconciliation and realize both perspectives.
Current trends in the devolution o power to local levels o government andcommunities, or eample, through isheries and ecosystem comanagementarrangements, support staeholder involvement in MPA planning and implementation.This is an important development that MPAs can both beneit rom and contribute to –
Bo 21
Tools or analysis and prioritization
Various analytical ramewors can assist in the decision-maing and
prioritization process when selecting what issues a marine protected area
should address and what the goals and objectives should be:
• A hierarchical or problem tree is oten used as part o participatory
planning and helps deine root causes by clustering identiied
problems and issues.
• Analysis is used to determine the economic eiciency o various
options rom among which decision-maers must choose. Put
simply, uture costs and beneits are estimated or each option and
compared.
• Assessments are essentially used to determine whether the probabilityo a particular hazard or threat, combined with the magnitude o
its possible impact or cost, is considered acceptable or not when
compared with some standard or benchmar.
• Impact reviews eamine who will beneit or suer, the total costs and
beneits (as in cost–beneit analysis), and the temporal and spatial
distribution thereo.
Source: De Young, C., Charles, A. and Hjort, A. 2008. Human dimensions o the ecosystem
approach to fsheries: an overview o context, concepts, tools and methods. FAO FisheriesTechnical Paper No. 489. Rome, FAO. 152 pp.

7/28/2019 The State of World Fisheries and Aquaculture_2012
http://slidepdf.com/reader/full/the-state-of-world-fisheries-and-aquaculture2012 190/230
The State o World Fisheries and Aquaculture 2012172
eperiences rom MPA management can inorm policy on decentralization and sharedresponsibilities.
Marine protected areas, which need to be integrated into wider isheries andbiodiversity management ramewors, imply a long-term management undertaing,and both political commitment and sustainable resourcing are reuired. Adeuatesupport in terms o human and other resources must be planned rom the outset andcould include multiple unding sources. Considerable time, eort and perseverance willbe reuired to mae MPAs and MPA networs ulil their potential.
dma a upp f aquaf a f igi ffam fih a cuaca: a fuu ppc
IntrodUCtIon
The global population is increasing and, in order to maintain at least the currentlevel o per-capita consumption o auatic oods, the world will reuire an additional
23 million tonnes thereo by 2020. This additional supply will have to come romauaculture. Meeting the uture demand or ood rom auaculture will largelydepend on the availability o uality eeds in the reuisite uantities. Althoughthe discussion on the availability and use o auaeed ingredients oten ocuses onishmeal and ish-oil resources (including low-value ish17), considering the past trendsand current predictions, the sustainability o the auaculture sector will probably beclosely lined with the sustained supply o terrestrial animal and plant proteins, oilsand carbohydrates or auaeeds. Apart rom ensuring the sustained availability oeed ingredients to meet the growing demand o auaculture, several other importantareas and issues also reuire attention. FAO Fisheries and Auaculture Technical PaperNo. 56418 analyses the demand and supply o eed ingredients in auaculture, raisesseveral issues and uestions, and provides recommendations on how to meet the
challenge o increasing auaculture production. These aspects are reviewed below.
AQUACUltUre GrowtH And AQUAFeed
In 2008, global auaculture production totalled 68.8 million tonnes, made up o52.9 million tonnes o auatic animals and 15.9 million tonnes o auatic plants.19 Thevolume o arm-produced auatic animals represented 46.7 percent o the global oodish supply in that year. Considering the increasing global population and recognizingthat no additional supply rom marine capture isheries will only be obtained iovereploited stocs are brought bac to their ull potential, it has been estimatedthat, to maintain the current level o per-capita consumption, by 2030 the world willreuire at least another 23 million tonnes o auatic animal ood – which auaculturewill have to provide.
Although auatic plants and molluscs are produced under natural conditions
without any additional eed, other auatic animals reuires some orm o eed. Filter-eeding inishes (e.g. silver carp and bighead carp) receive their ood, primarily in theorm o phytoplanton and zooplanton, in the pond or other waterbody throughnatural productivity and/or through ertilization. These ishes do not reuire any otherorms o eeding, thus auaeeds are not used or their production.
Auaeeds (Bo 22) are generally used or eeding omnivorous ishes (e.g. tilapia,catish, common carp, and milish), carnivorous ishes (e.g. salmon, trout, eel, seabass,seabream and tuna) and crustacean species (marine and bracish-water shrimps,reshwater prawns, crabs and lobsters).
According to FAO estimates, in 2008, about 31.7 million tonnes (46.1 percent ototal global auaculture production including auatic plants) o ish and crustaceanswere eed-dependent, either as arm-made auaeeds20 or as industrially manuactured
compound auaeeds.21 In 2008, ed auaculture contributed to 81.2 percent o globalarmed ish and crustacean production o 38.8 million tonnes and 60.0 percent oglobal armed auatic animal production.

7/28/2019 The State of World Fisheries and Aquaculture_2012
http://slidepdf.com/reader/full/the-state-of-world-fisheries-and-aquaculture2012 191/230
Highlights o special studies 173
While more than 200 species o ish and crustaceans are currently believed to be edon eternally supplied eeds, just 8 species or species groups account or 62.2 percento the total eed used. These are: grass carp, common carp, Nile tilapia, Indian majorcarps (catla and rohu), whiteleg shrimp, crucian carp, Atlantic salmon, and pangasiidcatishes. More than 67.7 percent o armed ed ish production is contributedby reshwater ishes, including carps and other cyprinids, tilapias, catishes andmiscellaneous reshwater ishes.
AQUAFeed ProdUCtIon And Use
Some ed-auaculture arming systems use low-cost earthen ponds in semi-intensiveproduction systems or the mass production o reshwater omnivorous ishes destinedor local domestic consumption. However, they also range up to the use o more-intensive pond-, cage- or tan-based systems or the production o reshwater,diadromous and marine carnivorous ishes and crustaceans or eport or high-enddomestic marets.
The choice o eeding method depends upon a variety o actors (which mayvary rom country to country and rom armer to armer) and objectives (local/home
consumption or cash crop/eport). Important actors include the maret value o thecultured species, the inancial resources o the armer and the local availability oappropriate ertilizers and eeds.
The FAO technical paper highlighted here deals mainly with ish and crustaceansed through eogenous eed, particularly industrially produced auaeed (ascomprehensive inormation on other eed types is generally lacing). Compoundauaeeds are used or the production o both lower-value (in mareting terms) ood-ish species, such as non-ilter-eeding carps, tilapias, catishes and milish, as well ashigher-value species, such as marine inishes, salmonids, marine shrimps, reshwatereels, snaeheads and crustaceans.
Globally, 708 million tonnes o industrial compound animal eeds were producedin 2008, o which 29.2 million tonnes were auaeeds (4.1 percent o all animal eeds).
As animal production has increased, so has global industrial compound animal eedproduction – almost ourold rom 7.6 million tonnes in 1995 to 29.2 million tonnes
Bo 22 Fed ish and non-ed ish
Fish ed with auaeeds during culture practice are reerred to as “ed
ish”, while ish that do not receive any eed are generally reerred to as
“non-ed ish”. Auaculture practices that produce ed ish are called “ed
auaculture”,1 as opposed to “non-ed auaculture”.
As the same species o ish may be cultured as ed ish or non-ed ish indierent production systems, it is diicult to obtain precise production data
and inormation on the use o eed or several auaculture species, especially
some omnivorous species (e.g. common carp, and Indian major carps) and
herbivorous species (e.g. grass carp). For eample, in many auaculture
production systems, grass carp are ed eclusively on plant materials and/or
grasses, while in other systems this species is produced through eternally
supplied arm-made or commercial auaeed. This situation maes it diicult
to produce accurate estimates o eed use or many such species.
1 Fed auaculture is auaculture production that utilizes, or has the potential to utilize,auaeeds o any type; in contrast to the arming o lter-eeding invertebrates and auatic
plants, which relies eclusively on natural productivity.

7/28/2019 The State of World Fisheries and Aquaculture_2012
http://slidepdf.com/reader/full/the-state-of-world-fisheries-and-aquaculture2012 192/230
The State o World Fisheries and Aquaculture 2012174
in 2008, at an average rate o 11 percent per year. Production is epected to grow to51.0 million tonnes by 2015 and to 71.0 million tonnes by 2020.
By volume, industrial compound auaeeds used by major species and speciesgroups are estimated to have been as ollows in 2008: ed carps (9.1 million tonnes,31.3 percent o the total), marine shrimps (17.3 percent), tilapias (13.5 percent),catishes (10.1 percent), marine ishes (8.3 percent), salmons (7.0 percent), reshwatercrustaceans (4.5 percent), trouts (3.0 percent), milish (2.0 percent), eels (1.4 percent),and miscellaneous reshwater ishes (1.6 percent).
While there is no comprehensive inormation available on the global productiono arm-made auaeeds,22 the estimate is that it was between 18.7 million and30.7 million tonnes in 2006. Farm-made auaeeds play an important role in theproduction o low-value reshwater ish species. More than 97 percent o carp eedsused by Indian armers are arm-made auaeeds (7.5 million tonnes in 2006/07), andthey are the mainstay o eed inputs or low-value reshwater ishes in many otherAsian and sub-Saharan countries.
Although, again, accurate inormation is lacing, it has been estimated thatthe total use o low-value ish (i.e. as raw ingredients not reduced into ishmeal) in
auaculture was between 5.6 million and 8.8 million tonnes in 2006 and that, in 2008,Chinese auaculture alone used 6–8 million tonnes o low-value ish, including marineish, reshwater ish, and live ood ish.
Feed InGredIent ProdUCtIon And AvAIlABIlIty
Feed ingredients used or the production o auaeeds are broadly categorizedinto three types depending upon their origin: animal nutrient sources (includingboth auatic and terrestrial animals); plant nutrient sources; and microbial nutrientsources.
Aquaic aima pi ma a ipiThe major auatic animal protein meals and lipids used in auaeeds include: ish/shellish
meals and oils; ish/shellish by-product meals and oils; and zooplanton meals and oils.Fishmeal and ish oil derived rom wild-harvested whole ish and shellish includingbycatch currently constitute the major auatic protein and lipid sources available oranimal eed. World reduction isheries (marine capture ishery products converted toishmeal) were 18.2 million tonnes in 1976. This total rose progressively to 30.2 milliontonnes in 1994 but then declined steadily to 17.9 million tonnes in 2009.23 As a result,ishmeal and ish-oil production ehibited similar trends. Global ishmeal productionincreased rom 5.00 million tonnes in 1976 to 7.48 million tonnes in 1994 and thendecreased steadily thereater to 5.74 million tonnes in 2009. Similarly, global ish-oilproduction rose gradually rom 1.02 million tonnes in 1976 to 1.50 million tonnes in1994 (with the eception o production peas o 1.67 million and 1.64 million tonnesrecorded in 1986 and 1989, respectively) but then ell bac steadily to 1.07 milliontonnes in 2009. Hence, analysis o the data or the last 15 years (1994–2009) indicates
that global ishmeal and ish-oil production rom marine capture isheries have beendecreasing at annual average rates o 1.7 and 2.6 percent, respectively.
The amount o captured ish destined or non-ood uses increased rom 20.6 milliontonnes in 1976 to 34.2 million tonnes in 1994 (a proportionate increase rom 31.5 to37.1 percent o total catch). Since 1995, this amount has been decreasing both inabsolute terms and as a proportion o total catch. In 1995, 31.3 million tonnes o globalish and shellish landings were destined or non-ood uses (33.9 percent o total catch),and, out o this total, 27.2 million tonnes (29.5 percent o total catch) were reducedinto ishmeal and ish oil. In 2009, the corresponding igure was 22.8 million tonnes(25.7 percent o total). Out o this total, 17.9 million tonnes (20.2 percent o total catch)were reduced into ishmeal and ish oil. The amount o captured ish destined or non-ood uses will probably decrease urther in the near uture.
In recent years, increasing volumes o ishmeal and ish oil have originated romisheries by-products (capture isheries and auaculture). An estimated 6 million

7/28/2019 The State of World Fisheries and Aquaculture_2012
http://slidepdf.com/reader/full/the-state-of-world-fisheries-and-aquaculture2012 193/230
Highlights o special studies 175
tonnes o trimmings and rejects rom ood ish are currently used or ishmeal andish-oil production. The International Fishmeal and Fish Oil Organisation estimatesthat about 25 percent o ishmeal production (1.23 million tonnes in 2008) comesrom isheries by-products. This amount will grow as its processing becomesincreasingly viable. Accurate inormation on the proportion o by-product ishmealand ish oil produced rom auaculture processing waste is not available, but it isprobable that a signiicant volume o armed ish wastes is contributed.
Although some marine zooplantons have potential or use as eed ingredientsor auaculture, commercial operations only eist or Antarctic rill (Euphausia
superba), with total landings o 118 124 tonnes in 2007. Although rill meal andrill oil are available, inormation concerning their total global production andmaret availability is currently unavailable. While there are large biomasses o otherzooplanton species in the oceans, it is probably unliely that zooplanton meals willbecome a major protein ingredient in eed or armed ish in the on-growing phase.It is more reasonable to epect that relatively minor amounts o zooplanton mealmay be used as a bioactive ingredient, or attractant, in auaeed or in eed or ishlarvae.
tia aima pi ma a faThe major terrestrial animal protein meals and lipids commonly used in auaeedsare: (i) meat by-product meals and ats; (ii) poultry by-product meal, hydrolysedeather meal and poultry oil; and (iii) blood meals. Although accurate inormationis not available, it has been estimated that the global combined production levelso rendered animal protein meals and ats in 2008 were about 13.0 million and10.2 million tonnes, respectively.
Pa ui ucThe major plant dietary nutrient sources used in auaeeds include: cereals, includingby-product meals and oils; oilseed meals and oils; and pulses and protein concentrate
meals.Total global cereal production was 2 489 million tonnes in 2009, growing at anannual average rate o 2.2 percent since 1995, with maize totalling 817.1 million tonnes(32.8 percent o the total), ollowed by wheat, rice paddy, and barley.
In 2009, oilseed production was 415 million tonnes, with soybean being the largestand astest-growing oilseed crop and accounting or slightly more than 50 percent(210.9 million tonnes) o this total. About 151.6 million tonnes o soybean mealwere produced in 2008/09, and other major oilseed protein meals were: rapeseed(30.8 million tonnes), cottonseed (14.4 million tonnes), sunlower seed (12.6 milliontonnes), palm ernel (6.2 million tonnes), groundnut/peanut (6.0 million tonnes), andcopra/coconut (1.9 million tonnes).
Among the pulses, protein concentrate meals rom peas and lupins are commerciallyavailable or use within compounded animal eeds, including auaculture eeds.
The total global production igures or dry peas and lupins were 10.5 million and0.93 million tonnes, respectively, in 2009.
Micbia igi ucMicrobial-derived eed ingredient sources or auaeed include algae, yeasts, ungi,bacteria and/or mied bacterial/microbial single-cell protein sources. The only suchsources available in commercial uantities globally are yeast-derived products,including brewer’s yeast and etracted ermented yeast products, but with limitedinormation concerning their total global production and availability. Given therelatively low cost o some o these single-cell proteins, they are probably most relevantas a major protein ingredient in ish eed or may at least partially replace ishmealin eeds or some ish species. Although microbial and algal species are considered
innovative protein sources or auaeeds, production costs will be an issue with someo them.

7/28/2019 The State of World Fisheries and Aquaculture_2012
http://slidepdf.com/reader/full/the-state-of-world-fisheries-and-aquaculture2012 194/230
The State o World Fisheries and Aquaculture 2012176
CUrrent Feed InGredIent UsAGe And ConstrAInts
Fihma a fih i
Within the animal husbandry subsectors, auaculture is the largest user o ishmealand ish oil. Their use in auaeeds is more prevalent or higher-trophic-level inishesand crustaceans (with ishmeal inclusion levels o 17–65 percent and those or ish
Figure 42
Global consumption of fishmeal and fish oil by major aquaculture species groups in 2008
Milkfish 0.8%
Miscellaneous
freshwater fishes 3.9%
Trouts 5.9%
Eels 5.2%
Fed carps 7.4%
Salmons 13.7%
Marine fishes 18.8%
Marine shrimps 27.2%
Tilapias 5.3%
Catfishes 5.5%
Freshwater crustaceans 6.4%
FISHMEAL(percentage of total usage in compound aquafeed)
Catfishes 0.0%
Tilapias 0.0%
Eels 2.6%
Fed carps 0.0%
Marine shrimps 12.9%
Trouts 16.9%
Marine fishes 24.7%
Salmons 36.6%
Milkfish 0.7%
Freshwater crustaceans 2.6%
Miscellaneous freshwater
fishes 3.1%
FISH OIL
(percentage of total usage in compound aquafeed)
Source: Adapted from Tacon, A.G.J., Hasan, M.R. and Metian, M. 2011. Demand and supply of feed ingredients for farmed
fish and crustaceans: trends and prospects. FAO Fisheries and Aquaculture Technical Paper No. 564. Rome, FAO. 87 pp.

7/28/2019 The State of World Fisheries and Aquaculture_2012
http://slidepdf.com/reader/full/the-state-of-world-fisheries-and-aquaculture2012 195/230
Highlights o special studies 177
oil o 3–25 percent). However, low-trophic-level inish species/species groups (carps,tilapias, catishes, milish, etc.) are also ed ishmeal and ish oil in varying amounts intheir diets. The ishmeal use or these diets varies between 2 and 10 percent, with theeception o those or tilapias and catishes in a ew countries where up to 25 percentishmeal use has been reported.
There is a wide variation in ishmeal and ish-oil usage between major species andspecies groups, with shrimps, marine ishes and salmons being the largest combinedusers thereo (Figure 42).
Although global ishmeal and ish-oil supplies have luctuated between 4.57 millionand 7.48 million tonnes or the last 33 years and have now stabilized at about 5.0–6.0 million tonnes per year, the amounts o ishmeal and ish oil used in auaeeds havegrown – rising between 1995 and 2008 rom 1.87 million tonnes to 3.73 million tonnesand rom 0.46 million tonnes to 0.78 million tonnes, respectively. This has been possibleat the epense o the land-animal sector, particularly the pig and poultry sector, whichis continuously reducing its use o ishmeal. In 1988, 80 percent o world ishmealproduction was used in eed or pigs and poultry while only 10 percent went toauaculture eed. In 2008, auaculture used 60.8 percent o world ishmeal production
and 73.8 percent o ish-oil production.As mentioned above, low-value ish are also increasingly used as auaeeds or
carnivorous species, particularly in Asia. Increased use o ishmeal, ish oil and low-value ish in auaculture in the last 10–12 years has primarily been attributed to theworldwide increase in the production o carnivorous species, particularly marinecrustaceans, marine inish, salmonids and other diadromous ishes.24
Although the auaculture sector remains the largest user o ishmeal in the world,ishmeal use in auaeeds has gradually allen since 2006. Auaculture consumedabout 4.23 million tonnes (18.7 percent o total auaeeds by weight) o ishmeal in2005, but this igure was down to 3.72 million tonnes in 2008 (12.8 percent). It hasbeen predicted that, even with increasing auaculture production globally, the use oishmeal or auaeeds will decrease urther to 3.63 million tonnes by 2015 (7.1 percent
o total auaeeds or that year) and to 3.49 million tonnes by 2020 (4.9 percent)(Figure 43). Among the reasons or this reduction are: decreased supplies o industrially
0
2.5
2.0
1.5
1.0
0.5
3.0
3.5
4.0
4.5
5.0
1995 1996 1997 1998 1999 2000 2001 2002 2003 2004 2005 2006 2007 2008 2010 2015 2020
Figure 43
Actual and predicted reduction in fishmeal use relative to the global production
of compound aquafeed
Million tonnes Percentage
Total fishmeal use
Total aquafeed (%)
Source: Adapted from Tacon, A.G.J., Hasan, M.R. and Metian, M. 2011. Demand and supply of feed ingredients
for farmed fish and crustaceans: trends and prospects. FAO Fisheries and Aquaculture Technical Paper No. 564.Rome, FAO. 87 pp.
0
15
12
9
6
3
18
21
24
27
30

7/28/2019 The State of World Fisheries and Aquaculture_2012
http://slidepdf.com/reader/full/the-state-of-world-fisheries-and-aquaculture2012 196/230
The State o World Fisheries and Aquaculture 2012178
caught ish as a result o tighter uotas; additional controls on unregulated ishing;and increased use o more cost-eective dietary ishmeal replacers.
In recent decades, because o an increased awareness o the lielihood o ascarcity o ishmeal, research institutions and the auaculture eed industry haveconducted numerous studies to try to reduce dependence on ishmeal. These studieshave provided more detailed nowledge on the digestive processes and nutritionalreuirements o many armed species and on how to process raw materials to maethem more suitable or use in eed. Since 1995, this increased nowledge has led to animpressive reduction in the average inclusion o ishmeal in compound eeds or majorgroups o armed species as well as improved eed conversion ratios (FCRs), reducingthe amount o waste rom the industry.
In the last 13 years or which data are available (1995–2008), ishmeal inclusionin major ish diets declined considerably (Table 16). The FAO technical paper projectsthat, in the net 10–12 years, ishmeal inclusion in the diets o carnivorous ish andcrustacean species will be urther reduced by 10–22 percent, and by 2–5 percent oromnivorous ishes.
Moreover, with improved eed eiciency and management, the FCRs or many
auaculture species dependent on industrially manuactured compound auaeeds areprojected to decline. For eample, the FCR or ed carps is epected to all rom 1.8 in2008 to 1.6 in 2020, that or catishes to decline rom 1.5 to 1.3, and that or milishto drop rom 2.0 to 1.6. I these materialize, coupled with lower ishmeal inclusion inthe diets or the above species and species groups, the amount o ishmeal used willdecrease by about 6 percent in spite o the projected increases o 143 and 168 percentin estimated total auaeed and ed auaculture production, respectively.
Although it is projected that ish-oil inclusion in the diets or dierent carnivorousish and crustacean species will also be reduced by 0.5–7.0 percent over the net tenyears, the use o ish oil by the auaculture sector will probably increase in the longrun, albeit slowly. The total amount used will increase by more than 16 percent, rom782 000 tonnes (2.7 percent o total auaeeds by weight) in 2008 to 845 000 tonnes
by 2015 (1.7 percent) and to 908 000 tonnes by 2020 (1.3 percent). The reasons or thisincrease are the rapidly growing marine inish and crustacean auaculture sector andthe absence o cost-eective alternative sources o dietary lipids rich in long-chainhighly unsaturated atty acids (HUFAs), including eicosapentaenoic acid (20:5n-3) and
Table 16Reduction in ishmeal inclusion in compound auaeed o dierent ish speciesand species groups
spci/pci gupFihma icui i cmpu aquaf
1995 2008 2020*(Percentage)
Fed carp 10 3 1
Tilapias 10 5 1
Catfishes 5 7 2
Milkfish 15 5 2
Miscellaneous freshwater fishes 55 30 8
Salmons 45 25 12
Trouts 40 25 12
Eels 65 48 30
Marine fishes 50 29 12
Marine shrimps 28 20 8
Freshwater crustaceans 25 18 8
* Projected.
Source: Adapted rom Tacon, A.G.J., Hasan, M.R. and Metian, M. 2011. Demand and supply o eed ingredients or armed ish and crustaceans: trends and prospects. FAO Fisheries and Auaculture Technical Paper No. 564. Rome, FAO.87 pp.

7/28/2019 The State of World Fisheries and Aquaculture_2012
http://slidepdf.com/reader/full/the-state-of-world-fisheries-and-aquaculture2012 197/230
Highlights o special studies 179
docosaheaenoic acid (22:6n-3). There is also a growing demand or ish oil or directuse as human supplements and pharmaceutical medicines.
Alternatives to ish oil are being used in greater amounts. key alternative lipidsinclude vegetable oils (e.g. linseed, soybean, canola and palm) – those with a highomega-3 content are preerred – and poultry oil. The use o oil rom armed ish oal isalso a potential source o omega-3 or armed ish.
Although a reduction in the dietary inclusion level o ish oil in auaeed would nothave any deleterious eect on the health o the armed target species, there may bereduced health beneits rom the inal ish products because o lower HUFAs, includingeicosapentaenoic and docosaheaenoic acid levels. Thereore, intensive researchis reuired in order to ind alternatives to ish oil. Research is aiming to producelong-chain omega-3 atty acids rom hydrocarbons by yeast ermentation, throughetraction rom algal sources and/or through genetic modiication o plants.
In order to eep pace with ed auaculture production, global auaeed productionwill continue to grow, and it is epected to reach 71.0 million tonnes by 2020. TheFAO technical paper highlighted here also indicates that, although the availability oishmeal and probably ish oil over the net ten years may not be a major constraining
actor, other eed ingredient and input supplies will need to epand at a similar rate ithis growth is to be sustained, and these inputs will have to come rom other sources(e.g. soybean, corn, and rendered animal by-products).
tia aima ma a iIn non-European countries, the use o terrestrial animal protein meals and oils withincompound auaeeds is increasing or both high- and low-trophic-level species andspecies groups (e.g. salmons, trouts, marine inishes, marine shrimps, catishes, tilapias,carps and mullets), although the type and level vary depending upon species andspecies group. The inclusion level is generally: 2–30 percent or poultry by-productmeal; 5–20 percent or hydrolysed eather meal; 1–10 percent or blood meal;2–30 percent or meat meal; 5–30 percent or meat and bone meal; and 1–15 percent
Table 17Feed ingredient usage or major auaculture species and species groups
F igiIcui i cmpu aquaf
(Percentage)
Pa pi ma
Soybean meal 3–60
Wheat gluten meal 2–13
Corn gluten meal 2–40
Rapeseed/canola meal 2–40
Cottonseed meal 1–25
Groundnut/peanut meal ≈ 30
Mustard oil cake ≈ 10
Lupin kernel meal 5–30
Sunflower seed meal 5–9
Canola protein concentrate 10–15
Broad bean meal 5–8
Field pea meal 3–10
Pa i
Rapeseed/canola oil 5–15
Soybean oil 1–10
Source: Adapted rom Tacon, A.G.J., Hasan, M.R. and Metian, M. 2011. Demand and supply o eed ingredients or
armed ish and crustaceans: trends and prospects. FAO Fisheries and Auaculture Technical Paper No. 564. Rome, FAO.87 pp.

7/28/2019 The State of World Fisheries and Aquaculture_2012
http://slidepdf.com/reader/full/the-state-of-world-fisheries-and-aquaculture2012 198/230
The State o World Fisheries and Aquaculture 2012180
or poultry oil. Despite the apparent increasing trend, it is estimated that the totalusage o terrestrial animal by-product meals and oils within compound auaeedsranges between 0.15 million and 0.30 million tonnes, or less than 1 percent o totalglobal compound auaeed eed production. Thus, there is considerable room orepansion.
Pa pi ma a iPlant protein meals commonly used in auaeed include soybean meal, wheat glutenmeal, corn gluten meal, rapeseed/canola meal, cottonseed meal, sunlower seed meal,groundnut/peanut meal, mustard oil cae, lupin ernel meal, and broad bean meal; andplant oils include rapeseed/canola oil, soybean oil, and palm oil. Plant proteins representthe major dietary protein source used within eeds or lower-trophic-level ish speciesand the second major source o dietary protein and lipids (ater ishmeal and ish oil)or marine shrimps and European high-trophic-level ish species (e.g. salmons, trouts,marine ishes, and eels). Other species and species groups that use substantial amountso plant protein meals and oils include milish, mullets, reshwater prawns, cachamaand reshwater crayishes. The inclusion levels o plant protein meals and oils vary widely
depending upon species and species group (Table 17).Soybean meal is the most common source o plant protein used in compound
auaeeds and the most prominent protein ingredient substitute or ishmeal inauaculture eeds, with eeds or herbivorous and omnivorous ish species andcrustaceans usually containing 15–45 percent soybean meal, with a mean o 25 percentin 2008. In global terms, and based on a total compound auaeed production o29.3 million tonnes in 2008, it is estimated that the auaculture eed sector consumesabout 6.8 million tonnes o soybean meal (23.2 percent o total compound auaeedsby weight). Other plant proteins that are being increasingly used include corn products(e.g. corn gluten meal), pulses (e.g. lupins and peas), oilseed meals (rapeseed meal,cottonseed and sunlower), and protein rom other cereal products (e.g. wheat, riceand barley).
Currently, plant protein and/or oil choice and selection are based upon acombination o local maret availability and cost, as well as their nutritional proile(including antinutrient content and level). With the continued rise in the ishmeal price,plant protein concentrates (soybean protein concentrate, canola protein concentrate,pea protein concentrate and corn/wheat gluten meals) will gain increasing prominenceover regular plant protein meals within auaeeds or high-trophic-level culturedspecies and crustaceans. For eample, the demand or soybean protein concentrateswithin auaeeds is projected to eceed 2.8 million tonnes by 2020.
ConClUsIon
The discussion on the availability and use o auaeed ingredients oten ocuses onishmeal and ish-oil resources (including low-value ish). However, considering pasttrends and current predictions, the sustainability o the auaculture sector is more liely
to be closely lined to the sustained supply o terrestrial animal and plant proteins, oilsand carbohydrate sources or auaeeds. Thereore, the auaculture sector should striveto ensure sustainable supplies o terrestrial and plant eed ingredients.
Apart rom ensuring the sustained availability o eed ingredients (includingishmeal and ish oil) to meet the growing demand o auaculture, the other importantareas that need to be eplored are:
• developing coping strategies and armers’ resilience to increases andluctuations in raw material prices;
• addressing the supply o eed and eed ingredients to poor producers,particularly in sub-Saharan countries where armers and small-scale eedmanuacturers need assured access to eed and eed ingredients;
• ensuring national uality standards or eed raw materials, eed additives and eeds;
• acilitating the sae and appropriate use, and reliable uality, o auaeedsproduced by small-scale eed manuacturers;
• improving on-arm eeding and eed management practices and the transero associated technology at armer level;

7/28/2019 The State of World Fisheries and Aquaculture_2012
http://slidepdf.com/reader/full/the-state-of-world-fisheries-and-aquaculture2012 199/230
Highlights o special studies 181
• improving eed ormulation and production (e.g. arm-made eed, and semi-commercial eed) at the local level;
• improving the capacity, production technology and associated support serviceso small-scale eed manuacturers in Asia and sub-Saharan Arica.
IssUes to Be Addressed
Ciu mphai aai fihma a fih iAuaculturists should continue to search or alternative sources o aordable and high-uality plant- and animal-based eed ingredients to replace ishmeal in auaeeds.Much research has already been carried out on plant eed ingredients to enhance theirnutritional uality, with signiicant successes. Thereore, it is imperative that eualpriority be given to improving the uality o terrestrial products and/or by-products,considering that the total volume o terrestrial animal by-product meals and oilsused within compound auaeeds is less than 1 percent o the total volume o globalcompound auaeed eed production.
Continued research on ish-oil substitutes will be a priority. The objective shouldbe to maintain the uality o armed target species in respect o HUFAs in the inal
products, as it is projected that the overall total usage o ish oil in auaculture willincrease although the ish-oil inclusion level in various carnivorous ish and crustaceanspecies is epected to decrease.
rucig cu pc up imp f igi ucFeed manuactures in developing countries should be encouraged to reduce theiruse o imported eed ingredients and ertilizers by ostering, through outreach andtraining opportunities, the use o locally available eed ingredients.
spcia fcu ma-ca fam a aquaf pucThere is an urgent need to assist and train those resource-poor armers who usearm-made and semi-commercial auaeeds, not only to minimize the use o
unnecessary eed additives and chemicals (including antibiotics) but also to improveeed management techniues. Farm-made eeds need to be improved throughresearch and development (R&D) programmes ocusing on actors such as ingredientuality, seasonal variability, mareting and storage, and improvements in processingtechnology. These R&D eorts need to be supported by improved etension services.There is also a need or support services that can help improve and build theproduction processes and capacity o small-scale auaeed producers.
Miimizig h ima impac f f a fig gimAn eort to minimize the environmental impact o eeds and eeding regimes mayinclude: (i) the use o highly digestible eed ingredients; (ii) the selection o a mio species so that one or more species can beneit rom the nutrient waste streamsproduced by other species inhabiting the same auatic milieu; and (iii) culture o ish
under closed bioloc-based zero-water echange culture conditions.25
diificai f f a fiiz ucThere should be a greater eort to promote the diversiied utilization o eed andertilizer resources through research, etension and inormation on the nutritionalreuirements o armed species and the nutrient content o the available eed materials.
Gba guii cabig a cificai i capufihi a aquacuu
IntrodUCtIonEcolabelling and certiication schemes are increasingly being used in the globaltrade and mareting o ish and ish products. The visible signs o these schemes arelabels that those adhering to the schemes may place on the products they oer or

7/28/2019 The State of World Fisheries and Aquaculture_2012
http://slidepdf.com/reader/full/the-state-of-world-fisheries-and-aquaculture2012 200/230
The State o World Fisheries and Aquaculture 2012182
sale. The label guarantees that the product originates in capture isheries and/orauaculture enterprises that are sustainably managed and/or that adhere to criteriarelecting social and cultural values deemed important by the scheme’s originators. Inthis manner, consumers can promote sustainable resource use through the purchaseo labelled products; or, as this is sometimes epressed, ecolabels and certiicationschemes use maret orces to incentivize more responsible use o physical and humanresources.
Large-scale retailers and ood services now drive the demand or certiicationo both auaculture and capture ishery products in relation to ood saety anduality, sustainability and social criteria.26 The presence o an ecolabel, or eample,helps retailers and brand owners meet the growing consumer demand or productsoriginating rom sustainably managed isheries. In some marets, retailers loo orniche products that are certiied as organic ish, or or a degree o social responsibilityin the production systems and practices.
In addition, ecolabels and certiication help retailers by ensuring that the productsdelivered by a range o certiied international suppliers, at times operating in dierentcontinents, are standardized in terms o sustainability, ood saety, uality and
traceability depending on the speciic ecolabel or certiication.FAO Members irst discussed ecolabels in 1996 at a meeting o the FAO Committee
on Fisheries (COFI). Several Members epressed concerns at the emergence oecolabelling schemes and especially that they could become non-tari barriers to trade.In 1996, there was no consensus that FAO should become substantively involved.
However, in eeping with its mandate to monitor developments in world isheriesand auaculture, FAO continued to assemble inormation on ecolabelling andcertiication schemes. In particular, inormation was assembled regarding:
• environmental sustainability;• ood saety and uality;• human well-being;• animal welare.
Drawing on this inormation, FAO organized a irst Technical Consultation in 1998to investigate the possibility o developing guidelines on the ecolabelling o ish andish products. The Technical Consultation27 did not reach agreement on FAO’s role indeveloping such guidelines, ecept to concur that any uture guidelines should beconsistent with the FAO Code o Conduct or Responsible Fisheries (the Code), and thatFAO should not be directly involved in the actual implementation o any ecolabellingscheme. However, in the absence o global initiatives to standardize the developmento the use o ecolabelling and certiication schemes in isheries and auaculture, andwith a growing number o such schemes, COFI agreed in 2003 that FAO should developguidelines on ecolabelling.28
Since then, FAO has developed the ollowing guidelines:• Guidelines or the Ecolabelling o Fish and Fishery Products rom Marine
Capture Fisheries (Marine Guidelines), 2005/2009;29
• Guidelines or the Ecolabelling o Fish and Fishery Products rom InlandCapture Fisheries (Inland Guidelines), 2011;30
• Guidelines on Auaculture Certiication (Auaculture Guidelines), 2011.31
The FAO COFI Sub-Committee on Fish Trade has recently discussed a drat“Framewor or assessment o ecolabelling schemes in inland and marine captureisheries” (February 2012).
tHe MArIne GUIdelInes
The Marine Guidelines were adopted in 2005. Focusing on issues related to thesustainable use o isheries resources, they are o a voluntary nature and applicable toecolabelling schemes designed to certiy and promote labels or products rom well-managed marine capture isheries. They contain principles, general considerations,
terms and deinitions, minimum substantive reuirements and criteria, and proceduraland institutional aspects.

7/28/2019 The State of World Fisheries and Aquaculture_2012
http://slidepdf.com/reader/full/the-state-of-world-fisheries-and-aquaculture2012 201/230
Highlights o special studies 183
The principles reuire that any ecolabelling scheme should be consistent with relevantinternational law and agreements, including the 1982 United Nations Convention onthe Law o the Sea, the Code, and WTO rules and mechanisms. They also reuire thatecolabelling schemes should be maret-driven, transparent and non-discriminatory,including by recognizing the special conditions applying to developing countries.
The Marine Guidelines were revised in 2009 to tae into account a reuest by COFIthat FAO should review and provide more guidance on the general criteria in relationto “stoc under consideration” and to serious impacts o the ishery on the ecosystem.The revised guidelines call or the minimum substantive reuirements and criteria oecolabelling schemes to include the ollowing elements:
• The ishery is conducted under a management system that is based on goodpractice, including the collection o adeuate data on the current state andtrends o the stocs and based on the best scientiic evidence.
• The stoc under consideration is not overished.• The adverse impacts o the ishery on the ecosystem are properly assessed and
eectively addressed.Furthermore, the procedural and institutional aspects o ecolabelling schemes
should encompass:• the setting o certiication standards;• the accreditation o independent certiying bodies;• the certiication that a ishery and the chain o custody o its products are in
conormity with the reuired standards and procedures.In the light o improved capacity to arm marine ish and the need or increased
ood rom auatic ecosystems, stoc enhancement and the use o introducedspecies may become more common management interventions also in the marineenvironment. The Marine Stewardship Council has recently addressed speciesintroductions and enhancements in its ecolabelling scheme32 and developed policy onwhen such isheries would be within the scope thereo. Currently, without revising theMarine Guidelines, it would not be possible to assess whether the scheme operated
by the Marine Stewardship Council would comply with the Marine Guidelines whenassessing enhanced marine isheries or those marine isheries based on introducedspecies. Because FAO is developing benchmars to assess whether private schemescomply with these guidelines, consideration may need to be given to revising theMarine Guidelines in order to address eplicitly the issues o stoc enhancement andspecies introductions.
tHe InlAnd GUIdelInes
When adopting the Marine Guidelines in 2005, the Twenty-sith Session o COFIreuested that FAO also prepare guidelines on the ecolabelling o ish and isheryproducts rom inland capture isheries (Inland Guidelines). The Inland Guidelines aresimilar to the Marine Guidelines in all aspects ecept or some dierences in scope.
During development o the Inland Guidelines, it became clear that the use o
enhancement is common in inland isheries. However, there are several dierentorms o enhancement, and some may be more appropriately considered orms oauaculture than orms o capture isheries. It became evident that not all enhancedisheries could be subject to the Inland Guidelines.
Enhanced isheries are those “that are supported by activities aimed atsupplementing or sustaining the recruitment o one or more auatic organisms andraising the total production, or the production o selected elements o a ishery,beyond a level which is sustainable by natural processes. Enhancement may entailstocing with material originating rom auaculture installations, translocations romthe wild and habitat modiication.”33
Enhancement practices range rom minor interventions either in the low o waterand/or in a lora or auna, to highly controlled auaculture systems that release animals
into semi-natural environments. Thus, there is a need to deine careully the scope oisheries eligible or an ecolabel in regard to, inter alia, the relationship between the
7/28/2019 The State of World Fisheries and Aquaculture_2012
http://slidepdf.com/reader/full/the-state-of-world-fisheries-and-aquaculture2012 202/230
The State o World Fisheries and Aquaculture 2012184
type o enhancement activities or production system and the intent o managementwith respect to the “stoc under consideration”.
FAO declared that the characteristics and management o the “stoc underconsideration” would decide whether or not the enhanced isheries would all withinthe scope o the Inland Guidelines. It also declared that to be within the scope o theInland Guidelines, enhanced isheries must meet the ollowing criteria:
• The species are native to the ishery’s geographic area or were introducedar bac in time and have subseuently become established as part o the“natural” ecosystem.
• There are natural reproductive components o the “stoc underconsideration”.
• The growth during the post-release phase is based upon ood supply romthe natural environment, and the production system operates withoutsupplemental eeding.
Enhanced isheries may comprise naturally reproductive components andcomponents maintained by stocing. The overall enhanced ishery should be managedin such a way that the naturally reproductive components are managed in accordance
with the provisions o Article 7 o the Code. The management system o enhancedisheries should permit a veriication that proves that stocing material originatingrom auaculture acilities meets the provisions o Article 9 o the Code.
FAO concluded that culture-based isheries, speciically, those supported solelyby stocing (i.e. with no associated management intent to sustain the naturalreproduction components and capacity o the “stoc under consideration”), would notall within the scope o the Inland Guidelines.
In 2010, an FAO Epert Consultation34 recommended that guidelines on culture-based isheries could be developed either by using the auaculture certiicationguidelines or by establishing a separate set o certiication guidelines or this categoryo enhanced isheries.
Another dierence between the Marine Guidelines and Inland Guidelines regarding
scope is the approach to ecolabelling isheries based on introduced species. There arecircumstances where countries with depauperate inland auna or modiied auaticecosystems may wish to introduce new species to increase production and valuerom these systems. Although international guidelines and ris assessment eist tohelp mae responsible introductions, FAO elt that the application o guidelines,ris assessment and subseuent monitoring and enorcement were not suicientlyestablished to ensure adeuate protection o inland auatic ecosystems. Thereore,inland isheries based on new species introductions would all outside the scope o theInland Guidelines and only inland isheries on species introduced “historically” wouldbe eligible or ecolabelling.
tHe AQUACUltUre GUIdelInes
In 2011, the Twenty-ninth Session o COFI approved the FAO Technical Guidelines on
Auaculture Certiication (Auaculture Guidelines). While endorsing the guidelines, COFIrecognized the eisting standards and guidelines set by international organizations suchas the World Organisation or Animal Health or auatic animal health and welare, theCode Alimentarius Commission or ood saety, and the International Labour Organizationor socio-economic aspects. However, in the absence o a precise international reerenceramewor or the implementation o some o the speciic minimum criteria contained inthe Auaculture Guidelines, COFI recognized the importance o developing appropriatestandards in order to ensure that auaculture certiication systems do not becomeunnecessary barriers to trade. It noted the necessity or the certiication systems to remainconsistent with and to comply with the provisions contained in the SPS Agreement andthe TBT Agreement o the WTO. In addition, COFI also recommended that FAO develop anevaluation ramewor to assess the conormity o public and private certiication schemes
with the Auaculture Guidelines.

7/28/2019 The State of World Fisheries and Aquaculture_2012
http://slidepdf.com/reader/full/the-state-of-world-fisheries-and-aquaculture2012 203/230
Highlights o special studies 185
The Auaculture Guidelines provide guidance or the development, organizationand implementation o credible auaculture certiication schemes. Minimumsubstantive criteria or developing auaculture certiication standards are providedor: (i) animal health and welare; (ii) ood saety; (iii) environmental integrity; and (iv)socio-economic aspects. The etent to which a certiication scheme sees to addressthe issues depends on its objectives. Thereore, the scheme should eplicitly andtransparently state its objectives. The Auaculture Guidelines, which apply to voluntarycertiication schemes, are to be interpreted and applied in a manner consistent withtheir objectives, with national laws and regulations, and, where they eist, withinternational agreements.
The Auaculture Guidelines mae it clear that credible auaculture certiicationschemes have three main components: standards, accreditation and certiication.Thereore, the Auaculture Guidelines cover: (i) standard-setting processes, which areneeded to develop and review certiication standards; (ii) accreditation systems, which areneeded to provide ormal recognition to a ualiied body to carry out certiication; and (iii)certiication bodies, which are needed to veriy compliance with certiication standards.
The Auaculture Guidelines recognize the act that responsible development o
auaculture depends on social, economic and environmental sustainability, all owhich have to be addressed. They also recognize that there is an etensive nationaland international legal ramewor in place or various aspects o auaculture and itsvalue chain, covering issues such as auatic animal disease control, ood saety andconservation o biodiversity.
The Auaculture Guidelines recommend that developers o certiication schemesshould recognize that it is o vital importance that those who implement them are ableboth to measure the perormance o auaculture systems and practices and to assessconormity with certiication standards.
evAlUAtIon FrAMework
In 2009, COFI ased FAO to develop an evaluation ramewor to assess whether private
or public ecolabelling schemes were in conormity with the Marine Guidelines. Thisollowed earlier discussions in both COFI and the COFI Sub-Committee on Fish Traderegarding whether FAO could, or should, veriy the correctness o claims being madeby ecolabelling schemes that they complied with the Marine Guidelines. The advicerom COFI to FAO was not to monitor the compliance actively, but instead to developan evaluation ramewor or assessing whether private or public ecolabelling schemesor marine isheries were in conormity with the Marine Guidelines. Such a rameworwould provide a transparent tool that could allow national ecolabelling schemes tobe assessed against the Marine Guidelines. Schemes ound to be consistent with theMarine Guidelines could then be considered euivalent to any other scheme thatconorms to the Marine Guidelines.
In 2010, FAO convened an Epert Consultation that produced an evaluationramewor. The evaluation ramewor identiied indicators to permit an assessment
o conormity with the Marine Guidelines and the Inland Guidelines. A total o115 indicators were identiied, 6 o which only apply to inland isheries. At present, theassessment process enables the evaluator to determine whether a scheme conormswith the indicators identiied in the evaluation ramewor, but only on a pass or ailbasis. Complete conormity is possible only where all indicators have been included inthe scheme being assessed. The evaluation ramewor was submitted to the COFI Sub-Committee on Fish Trade in February 2012 or discussion and subseuent orwarding tothe Thirtieth Session o COFI (scheduled or July 2012).
Programmes to develop ecolabelling schemes have recently been initiated bya number o States, e.g. Iceland Responsible Fisheries (Iceland), and the CaliorniaSustainable Seaood Initiative and Alasa FAO-based Responsible FisheriesManagement Certiication (both in the United States o America). These initiatives have
been partially driven by concerns about the costs associated with private ecolabelling

7/28/2019 The State of World Fisheries and Aquaculture_2012
http://slidepdf.com/reader/full/the-state-of-world-fisheries-and-aquaculture2012 204/230
The State o World Fisheries and Aquaculture 2012186
schemes. However, public schemes may be perceived as sel-serving. Nationaladministrations could be seen as certiying themselves, running the ris o beingaccused o a conlict o interest. Nonetheless, those national ecolabelling schemesassessed as being in compliance in the evaluation ramewor would signiicantlyincrease their legitimacy and the lielihood o receiving national and internationalrecognition.
reMAInInG IssUes
Ecolabels and certiication schemes arose in response to concerns or environmentalsustainability and a perceived decline in the abundance o many o the world’s majorish stocs. Owing to heightened consumer awareness and interest in environmentalissues, it became clear that ecolabels and certiication schemes could improve access tocertain marets and provide a price premium or ish or ish products. It appears thatecolabelling and certiication schemes have resulted in increased maret share andprice or some isheries and suppliers. However, such a result is not guaranteed. Foreample, one study has shown that some certiied coee growers have become poorerin relation to conventional growers.35 More studies are needed to now when a ishery
should attempt to obtain an ecolabel or certiication in order to increase proitability.The eicacy o ecolabelling or certiication as tools or improving the status o
isheries, i.e. changing poorly managed isheries into well-managed ones, has notbeen well established. It is not clear how many o the concerned isheries were poorlymanaged prior to the introduction o ecolabelling. Moreover, the uestion is stillunanswered as to whether maret orces in practice help to conserve auatic resources.However, the onus is increasingly on suppliers to veriy that their products meet certainstandards, and certiication provides this “burden o proo” (or urther discussion othis issue, readers are reerred to the publication on which this article is based36).
th oeCd–FAo Agicuua ou: chap fih37
tHe Model
Outloo models are very valuable or obtaining a good understanding on perspectiveso developments in the sector they analyse. They are an important tool or providingorganizations such as FAO and the Organisation or Economic Co-operation andDevelopment (OECD), their Members and the international community with relevantinormation or developing strategic responses to emerging challenges. Internally,outloo studies can also help to highlight wor priorities and to develop an overviewo major challenges acing the organization.
Notwithstanding the importance o the ishery sector and its essential role in thelivelihoods o millions o people around the world as a source o ood, creator oemployment, and contributor to economic growth and development, until 2010 FAO
did not have a speciic outloo model or ish on a short-term, medium-term or long-term perspective. Thereore, FAO decided to develop such a model to analyse theoutloo o the isheries and auaculture sector in terms o uture production potential,projected demand or isheries products, consumption, prices and ey actors thatmight inluence uture supply and demand.
It was considered important not to develop an isolated ish model but instead oneintegrated in the overall structure o an already eisting and valid agricultural model,the OECD–FAO AGLINk–COSIMO Projection System, in view o the lins and interactionso the isheries and agriculture sectors. Fisheries, and in particular auaculture, interactin several ways with agriculture. One evident eample is in integrated arming,but more important is their impact on ecosystems, marets, products and prices,as well as on innovations and technology. Competition between the ishery sector
and agriculture and livestoc may arise over water and land resources, especially orirrigated agriculture, as well as in relation to the availability and relative eiciency o

7/28/2019 The State of World Fisheries and Aquaculture_2012
http://slidepdf.com/reader/full/the-state-of-world-fisheries-and-aquaculture2012 205/230
Highlights o special studies 187
the use o eeds between livestoc and armed ish. Capture isheries play an importantrole also in terms o the production o ishmeal and ish oil, which are used as eed inauaculture and in the diets o pigs, poultry, ruminants and companion animals. Withthe epansion o auaculture, supplies o ishmeal have been largely directed to thissector. The growth o the auaculture sector has also led to increasing demand oradditional or substitutive sources o eed. Raw materials rom agriculture and livestoc,used traditionally to eed livestoc, are being increasingly employed in the auaculturesector. Continued growth in demand or livestoc and ish has raised alarm over thesustainability o eed supplies, in particular or ishmeal, and the impacts o suchgrowth on the environment.
The OECD–FAO AGLINk–COSIMO Projection System is one o the mostcomprehensive partial euilibrium models or the analysis o international agricultureand ood marets. The model is used to generate medium-term projections on annualsupply, demand and prices or selected agricultural commodities. Non-agriculturalmarets, including ish, are not modelled and are treated eogenously within theprojection system. The overall design o the model ocuses in particular on thepotential inluence o agriculture and trade policies on agricultural marets in the
medium term. The model is one o the tools used in the generation o the baselineprojections underlying the OECD–FAO Agricultural Outlook publication presentingprojections and related maret analysis or some 15 agricultural products over aten-year horizon. The modelling ramewor was started by the OECD in the early1990s through the development o its AGLINk model, an economic model o worldagriculture with very detailed agriculture sector representation o OECD countriesas well as o Argentina, Brazil, China and the Russian Federation. Since 2004, thismodelling system has been greatly enhanced through the development by FAO o asimilar agricultural model – COSIMO – representing the agriculture sectors o a largenumber o developing countries. For many countries, agriculture policies are speciicallymodelled within AGLINk–COSIMO. This maes the model a powerul tool or orward-looing analysis o domestic and trade policies through the comparison o scenarios o
alternative policy settings against the benchmar o the baseline projections.38
In view o the importance and validity o the AGLINk–COSIMO modelling system,FAO, with the collaboration and agreement o the OECD and FAO Secretariats orAGLINk–COSIMO, decided to construct a satellite model on ish and ishery products,which has lins to, but is not integrated into, the AGLINk–COSIMO model used or theagriculture projections. Being a satellite, it has been built ollowing the same generalprinciples used to build the AGLINk–COSIMO modelling system in order to acilitate itseventual integration. Since their creation, the AGLINk and then the COSIMO modelshave increased their size and coverage. The inclusion o the ishery component mightrepresent an opportunity or the model to epand the coverage o ood consumption,including an alternative and competitive source o ood and protein, as well to epandthe coverage o the oil and eed marets in order to have a better picture o the oodand eed sectors.
The ish model is a dynamic, policy-speciic, partial-euilibrium one. It contains1 100 euations and covers the same 56 countries and regions as AGLINk–COSIMO with42 o these countries endogenous as well as 5 continents and a world total. There aretwo types o supply unctions: capture and auaculture. Supply o capture isheriescan be eogenous or endogenous, but only aected by El Niño events, or endogenousbut responding to price. For auaculture, 99 percent o the total world is endogenousand responding to the price o output and the price o eed. Supply o ishmeal andish oil consists o two components: rom crushed whole ish (reduction) and rom ishresidues. Demand is or aggregate isheries, but it is split according to three end uses:ood, processed into ishmeal and ish oil, and other uses (ept eogenous). Thereare three lins between the ishery and the agriculture marets: on the demand sidethrough the substitution between ish and other animal products, through the amount
o eed demanded by auaculture, and through the interaction between ishmeal andish oil and their respective oilseed substitutes.

7/28/2019 The State of World Fisheries and Aquaculture_2012
http://slidepdf.com/reader/full/the-state-of-world-fisheries-and-aquaculture2012 206/230

7/28/2019 The State of World Fisheries and Aquaculture_2012
http://slidepdf.com/reader/full/the-state-of-world-fisheries-and-aquaculture2012 207/230
Highlights o special studies 189
(Figure 44). Products derived rom auaculture will contribute to an increasing shareo global ishery production, growing rom 40 percent on average in 2009–2011 to46 percent in 2021. Auaculture production is epected to continue to epand onall continents, with variations across countries and regions in terms o the productrange o species and product orms. Asian countries will continue to dominateworld auaculture production, with a share o 89 percent in 2021, with China alonerepresenting 61 percent o total production.
The portion o capture isheries used to produce ishmeal will be about 17 percentby 2021,40 declining by 6 percent compared with the 2009–2011 average owing to thegrowing demand or ish or human consumption. In 2021, ishmeal production shouldbe 15 percent higher compared with the 2009–2011 average,41 but almost 87 percento the increase will derive rom improved use o ish waste, cuttings and trimmings.Growing income and urbanization will entail an increasing consumption o ish inillets or prepared and preserved orms, thus creating more residual production to beused in ishmeal manuacturing. Fishmeal produced rom ish waste should represent43 percent o world ishmeal production in 2021 (Figure 45).
The ish sector is epected to enter into a decade o higher prices, but also higher
production costs (Figure 46). The main drivers will be the underlying positive trendin demand, income and population growth, increasing meat prices, a generally weaUS dollar and limited growth o capture isheries production, as well as rising costsor some o the most important input actors such as energy, including crude oil andeed. In particular, as a conseuence o slightly declining capture isheries or reductionand a preerence or ishmeal and ish oil in the production o certain animals, pricesor ishmeal and ish oil are epected to grow by about 59 percent and 55 percent,respectively, in nominal terms during the projection period. Against the bacdrop ostagnant supplies, increasing demand is epected to lead to an increase in the priceratio o ish to oilseed meal and oil, especially in assumed years o El Niño events. Theimpact o the coarse grain price on the price o auaculture products will continue tobe relatively modest, although it is epected to increase somewhat over the period
2012–2021. The price ratio o auaculture compared with ishmeal will graduallystabilize over the period under review. Owing to the rising prices o ishmeal, ish oiland other eeds, the average price o armed species should increase by slightly more
Figure 45
Fishmeal production in product weight
Million tonnes
From fish residues
From whole fish
0
1
2
3
4
5
6
7
8
2000 2003 2006 2009 2012 2015 2018 2021
Sources: OECD and FAO Secretariats.

7/28/2019 The State of World Fisheries and Aquaculture_2012
http://slidepdf.com/reader/full/the-state-of-world-fisheries-and-aquaculture2012 208/230
The State o World Fisheries and Aquaculture 2012190
than that or capture isheries (ecluding ish or reduction), by 48 percent comparedwith 43 percent, in the net decade. Higher prices or substitutes, meat in particular,
will stimulate demand or ish and ishery products or human consumption. This inturn, will increase ish prices, which will encourage more auaculture production,in particular in developing countries, or eport as well as or local and regionalconsumption.
World per-capita apparent ish consumption is epected to reach 19.6 g in 2021,16 percent higher than the average level or 2009–2011. The average annual growthrate will be lower in the second hal o the projection period, when ish will start tobecome more epensive than red meats. Owing to high ish prices, ish consumptiongrowth is projected to slow to 0.3 percent per year over the projection period,compared with 1.7 percent per year in the previous decade. Per capita ish consumptionwill increase in all continents (Figure 47), ecept in Arica (owing to populationgrowing aster than supply), with Oceania showing the highest growth rate. Products
derived rom auaculture will contribute to an increasing share o global ishery supply
0
1 000
2 000
3 000
4 000
0
1 000
2 000
3 000
4 000
Figure 46
General growth in fish prices for high feed costs and strong demand, nominal terms
US$/tonne
US$/tonne
2000 2003 2006 2009 2012 2015 2018 2021
2000 2003 2006 2009 2012 2015 2018 2021
Trade
Aquaculture
Capture
Fishmeal
Fish oil
Sources: OECD and FAO Secretariats.

7/28/2019 The State of World Fisheries and Aquaculture_2012
http://slidepdf.com/reader/full/the-state-of-world-fisheries-and-aquaculture2012 209/230
Highlights o special studies 191
or human consumption. By 2018, armed ish is epected to eceed captured ish orhuman consumption or the irst time, and its share is projected at 52 percent in 2021(Figure 48).
Fisheries supply chains will continue to be globalized, with a signiicant share ototal ishery production being eported (39 percent, including intra-European Uniontrade). In uantity terms, world trade o ish or human consumption is epected to
epand by 25 percent in the period 2012–2021. However, the annual growth rate oeports will decline rom the 3.6 percent o the past decade to 1.9 percent over thenet ten years. The share o developed countries in world ish imports or humanconsumption will all rom 59 percent to 56 percent in net decade. This will mainly bebecause o the growing imports by developing countries or domestic consumption aswell as o unprocessed ish as raw material or their processing industries. Developingcountries will continue to account or about 67 percent o world eports. Eportswill be driven by Asian countries, which remain very competitive and are epectedto beneit rom growing investment in the auaculture sector. In 2021, 55 percent oworld ish eports or human consumption will originate rom Asia, with China as theworld’s leading eporter.
The main issues and uncertainties that might aect the ishery sector and, as aconseuence, the projections are summarized below.
The net decade is liely to see major changes in the macroeconomic environment,international trade rules and taris, maret characteristics, resources and socialconduct. Their eects may inluence ish marets in the medium term. Climatechange impacts may also bring increasing uncertainty in many ood sectors andmight represent a compounding threat to the sustainability o capture isheries andauaculture development. These possible events tae place in the contet o otherglobal social and economic pressures on natural resources and ecosystems, includingenvironmental degradation and increasing land and water scarcity. New climateadaptation approaches will probably have to be integrated into the processes oimproving isheries governance. Action may also be reuired to secure conservationo auatic ecosystems and saeguard stocs and productivity through technologicalinnovation, investment in research and development (R&D), and a more closely
controlled approach to isheries management. Moreover, increased riss o species
0
10
20
30
Sources: OECD and FAO Secretariats.
Figure 47
Per capita fish consumption
kg/capita
Africa LatinAmerica
NorthAmerica
Asia Europe Oceania World
2009–2011
2021

7/28/2019 The State of World Fisheries and Aquaculture_2012
http://slidepdf.com/reader/full/the-state-of-world-fisheries-and-aquaculture2012 210/230
The State o World Fisheries and Aquaculture 2012192
invasions and the spread o diseases raise additional concerns. Fish diseases could havemajor impacts on supply, demand and trade in domestic and international marets, asresulting trade restrictions might alter marets or etended periods.
Considerable beneits can accrue rom rebuilding isheries, an urgent tas that ishigh on the international policy agenda. The OECD Committee or Fisheries decided tocontribute to eorts by its Member States to rebuild their isheries, where needed, byproviding an analysis o the main policy issues. The ocus was on rebuilding isheries,which is a broader approach than rebuilding ish stocs, and too into consideration
the social, economic and environmental dimensions. The outcome o this project, thestudy The Economics o Rebuilding Fisheries, is a set o principles and guidelines thathelp policy-maers in their rebuilding eorts, taing into account the economic andinstitutional aspects.42 These practical and evidence-based principles and guidelinesaim to ensure that rebuilding plans are eamples o good governance, which impliesinclusiveness, empowerment, transparency, leibility and predictable sets o rules andprocesses. Rebuilding o isheries may imply a change in isheries management settingsand reorm towards the use o maret-based instruments. The principles and guidelineshave been adopted as an OECD Council Recommendation.
As production rom capture isheries has remained virtually constant, urtherauaculture growth will be needed to meet the rising global demand or seaood.However, many constraints might aect the production prospects or this sector. Theyinclude the growing scarcity o water and limited opportunities or sites or new
operations given the multiple users o coastal and riparian areas, the carrying capacityo the environment or nutrient and pollution loading and a less permissive regulatoryenvironment. Unless guided and monitored adeuately, auaculture epansion maycontribute to environmental problems, including degradation o land and marinehabitats, chemical pollution, endangering biodiversity through escapees, and reductiono ish resistance to diseases. Inadeuate biosecurity measures and disease outbreascould also cause large economic losses to the sector. Meeting the uture demand orood rom auaculture will also depend on the availability o inputs, including ishseeds43 as well as o eeds in the reuisite uality and uantities. Continued progressin developing terrestrially sourced substitutes or ishmeal and oils will help supportcontinued growth in auaculture.
Consumer concerns related to issues such as animal welare, ood uality,
production and processing methods may cause urther uncertainties in the ish sector.Especially in the more aluent marets, consumers are increasingly reuiring high
Figure 48
Fishery production in live weight equivalent
Million tonnes
Source: OECD and FAO Secretariats.
0
10
20
30
40
50
60
70
80
90
100
2000 2003 2006 2009 2012 2015 2018 2021
Total capture
Aquaculture
Capture for human
consumption

7/28/2019 The State of World Fisheries and Aquaculture_2012
http://slidepdf.com/reader/full/the-state-of-world-fisheries-and-aquaculture2012 211/230
Highlights o special studies 193
standards o uality assurance and demanding guarantees that the ish they purchaseare produced sustainably. The stringent uality- and saety-related import standards,together with reuirements or products meeting international animal health andenvironmental standards and social responsibility reuirements, might act as barriers tosmall-scale ish producers and operators attempting to penetrate international maretsand distribution channels. Future prices might be inluenced not only by higher eedprices but also by the introduction o more rigorous regulations on the environment,ood saety, traceability and animal welare.

7/28/2019 The State of World Fisheries and Aquaculture_2012
http://slidepdf.com/reader/full/the-state-of-world-fisheries-and-aquaculture2012 212/230
The State o World Fisheries and Aquaculture 2012194
notes
1 Windle, M.J.S., Neis, B., Bornstein, S. and Navarro, P. 2006. Fishing occupational
health and saety: a comparative analysis o regulatory regimes [online]. St. John’s,Canada, SaetyNet, Memorial University o Newoundland. [Cited 6 December2011]. www.saetynet.mun.ca/pds/CARR.pdWiseman, M. and Burge, H. 2000. Fishing vessel saety review (less than 65 eet).St. John’s, Canada, Maritime Search and Rescue Newoundland Region.Petursdottir, G., Hannibalsson, O. and Turner, J. 2001. Saety at sea as an integral
part o isheries management . FAO Fisheries Circular No. 966. Rome, FAO. 39 pp.(also available at www.ao.org/docrep/003/9656e/9656e00.htm).Jensen, O. 1997. Health hazards while ishing in heavy weather. Occupational and
Environmental Medicine, 54(2): 141.2 kaplan, I.M. and kite-Powell, H.L. 2000. Saety at sea and isheries management:
ishermen’s attitudes and the need or co-management. Marine Policy , 24(6): 493–497.
3 Lincoln, J. and knapp, G. (orthcoming). Synthesis o case studies: eects o
isheries management policies on ishing saety. FAO Fisheries Circular No. 1073.Rome, FAO.
4 FAO. 1995. Code o Conduct or Responsible Fisheries. Rome. 41 pp. (also availableat www.ao.org/docrep/005/v9878e/v9878e00.HTM).
5 Op. cit. see note 1, Petursdottir, Hannibalsson and Turner (2001).6 Op. cit. see note 1, Windle et al . (2006, p. 14).7 Op. cit. see note 1, Wiseman and Burge (2000, p B5).8 Op. cit. see note 1, Petursdottir, Hannibalsson and Turner (2001, p. 25).9 National Oceanic and Atmospheric Administration. 2011. National Standard
10 Guidelines: a proposed rule by the National Oceanic and AtmosphericAdministration on 04/21/2011. In: Federal Register [online]. [Cited 6 December2011]. www.ederalregister.gov/articles/2011/04/21/2011-9718/national-standard-
10-guidelines10 Huss, H.H. 1994. Assurance o seaood quality . FAO Fisheries Technical PaperNo. 334. Rome, FAO. 169 pp.
11 Huss, H.H., Ababouch, L. and Gram, L. 2004. Assessment and management o
seaood saety and quality . FAO Fisheries Technical Paper No. 444. Rome, FAO.230 pp.
12 Ababouch, L. and karunasagar, I. (orthcoming). Seaood saety and quality:
current practices and emerging issues. FAO Fisheries and Auaculture TechnicalPaper No. 574. Rome, FAO.
13 World Health Organization. 2007. Food saety and oodborne illness. In: World
Health Organization [online]. [Cited 30 November]. www.who.int/mediacentre/ actsheets/s237/en/inde.html
14 The Food Hygiene Regulations include Regulation EC/852/2004, which lays down
the general hygiene reuirements or all ood business operators, and RegulationEC/853/2004, which lays down additional speciic reuirements or ood businessesdealing with oods o animal origin, including live bivalve molluscs and isheryproducts. Regulation EC/854/2004 lays down the oicial controls or oods oanimal origin. The basis or the Regulations is set down by the General FoodLaw Regulation EC/178/2002, which provides a ramewor to ensure a coherentapproach in the development o ood legislation.
15 FAO. 2011. Fisheries management. 4. Marine protected areas and isheries. FAOTechnical Guidelines or Responsible Fisheries No. 4, Suppl. 4. Rome. 198 pp.
16 Sanders, J.S., Gréboval, D. and Hjort, A., comps. 2011. Marine protected areas:
country case studies on policy, governance and institutional issues. FAO Fisheriesand Auaculture Technical Paper No. 556/1. Rome, FAO. 118 pp.
17 The term “low-value ish” is preerred to “trash ish”.

7/28/2019 The State of World Fisheries and Aquaculture_2012
http://slidepdf.com/reader/full/the-state-of-world-fisheries-and-aquaculture2012 213/230
Highlights o special studies 195
18 Tacon, A.G.J., Hasan, M.R. and Metian, M. 2011. Demand and supply o eed
ingredients or armed ish and crustaceans: trends and prospects. FAO Fisheriesand Auaculture Technical Paper No. 564. Rome, FAO. 87 pp.
19 FAO. 2011. FishStat Plus – universal sotware or ishery statistical time series. In: FAO Fisheries and Aquaculture Department [online]. Rome. [Cited 20 December2011]. www.ao.org/ishery/statistics/sotware/ishstat/en
20 Typically, a arm-made auaeed is a eed produced by armers or small-scale eedmanuacturers using some orm o processing on-arm or in a small processingplant, resulting in a moist dough or a simple moist or dry pellet.
21 An industrially manuactured compound auaeed consists o a number oingredients mied in various proportions to complement one another to orm anutritionally complete compound diet.
22 De Silva, S.S. and Hasan, M.R. 2007. Feeds and ertilizers: the ey to long-termsustainability o Asian auaculture. In M.R. Hasan, T. Hecht, S.S. De Silva andA.G.J. Tacon, eds. Study and analysis o eeds and ertilizers or sustainable
aquaculture development , pp. 19–47. FAO Fisheries Technical Paper No. 497. Rome,FAO. 510 pp.
23 Op. cit., see note 19.24 Rana, k.J., Siriwardena, S. and Hasan, M.R. 2009. Impact o rising eed prices on
aquaeeds and aquaculture production. FAO Fisheries and Auaculture TechnicalPaper No. 541. Rome, FAO. 63 pp.
25 Avnimelech, Y. 2009. Bioloc technology – a practical guide book. Baton Rouge,USA, World Auaculture Society. 181 pp.
26 Washington, S. and Ababouch, L. 2011. Private standards and certiication in
isheries and aquaculture: current practice and emerging issues. FAO Fisheries andAuaculture Technical Paper No. 553. Rome, FAO. 181 pp.
27 FAO. 1998. Report o the Technical Consultation on the Feasibility o Developing
Non-Discriminatory Technical Guidelines or Eco-Labelling o Products rom Marine
Capture Fisheries. Rome, Italy, 21–23 October 1998. FAO Fisheries Report No. 594.
Rome. 29 pp.28 FAO has concentrated on ISO Type I environmental labels, which are voluntary andbased on third-party assessment o the environmental impact o the productionsystem. ISO Type II and Type III ecolabels are sel-declared statements o compliancewith previously established indices, i.e. no independent conirmation o productclaims. Although ISO Type II and Type III are not the subject o FAO guidelines, theyare oten high-proile types o labels and are becoming increasingly widespread.
29 FAO. 2009. Guidelines or the Ecolabelling o Fish and Fishery Products rom
Marine Capture Fisheries. Revision 1. Directives pour l’étiquetage écologique du
poisson et des produits des pêches de capture marines. Révision 1. Directrices para
el ecoetiquetado de pescado y productos pesqueros de la pesca de captura marina.
Revisión 1. Rome/Roma. 97 pp.30 FAO. 2011. Guidelines or the Ecolabelling o Fish and Fishery Products rom
Inland Capture Fisheries. Directives pour l’étiquetage écologique du poisson et des
produits des pêches de capture continentales. Directrices para el ecoetiquetado de
pescado y productos pesqueros de la pesca de captura continental . Rome/Roma.106 pp.
31 FAO. 2011. Technical Guidelines on Aquaculture Certiication. Directives techniques
relatives à la certiication en aquaculture. Directrices técnicas para la certiicación
en la acuicultura. Rome/Roma. 122 pp.32 For introductions, see www.msc.org/documents/scheme-documents/msc-scheme-
reuirements/msc-certiication-reuirement-v1.1/view [cited 6 February 2012] andor enhancements, see www.msc.org/documents/scheme-documents/msc-scheme-reuirements/directives/TAB_D_001_Enhanced_Fisheries.pd/view [cited 6 February2012].
33 Op. cit., note 29.

7/28/2019 The State of World Fisheries and Aquaculture_2012
http://slidepdf.com/reader/full/the-state-of-world-fisheries-and-aquaculture2012 214/230
The State o World Fisheries and Aquaculture 2012196
34 FAO. 2010. Report o the Expert Consultation on the Development o Guidelines
or the Ecolabelling o Fish and Fishery Products rom Inland Capture Fisheries.
Rome, 25–27 May 2010. FAO Fisheries and Auaculture Report No. 943. Rome.37 pp.
35 Beuchelt, T.D. and Zeller, M. 2011. Proits and poverty: certiication’s troubled linor Nicaragua’s organic and airtrade coee producers. Ecological Economics, 70(7):1316–1324.
36 Op. cit., note 26.37 This highlight article is based on the chapter on ish in the most recent edition o
the OECD–FAO Agricultural Outlook: OECD/FAO. 2012. OECD–FAO AgriculturalOutloo 2012. Paris, OECD Publishing. DOI : 10.1787/agr_outloo-2012-en
38 More inormation on the OECD–FAO AGLINk–COSIMO Projection System isavailable at www.agri-outloo.org/
39 The baseline is deterministic and assumes normal weather and productionconditions, with the eception o the impact o the El Niño phenomenon set in themodel or selected Latin American countries in 2015 and 2020.
40 That share will be lower in years o El Niño events (set in the model in 2015 and
2020) owing to reduced catches o anchoveta.41 The reerence point is low because o the El Niño event in 2010.42 Organisation or Economic Co-operation and Development. 2010. The Economics
o Rebuilding Fisheries: Workshop Proceedings. Paris. 268 pp.43 The term ish seeds indicates eggs, spawn, ospring, progeny or brood o the
auatic organism (including auatic plants) being cultured. At this inantilestage, seed may also be reerred to or nown as ry, larvae, postlarvae, spat andingerlings. They may originate rom two principal sources: rom captive breedingprogrammes, or caught rom the wild.

7/28/2019 The State of World Fisheries and Aquaculture_2012
http://slidepdf.com/reader/full/the-state-of-world-fisheries-and-aquaculture2012 215/230
PART 4
oUtlook

7/28/2019 The State of World Fisheries and Aquaculture_2012
http://slidepdf.com/reader/full/the-state-of-world-fisheries-and-aquaculture2012 216/230

7/28/2019 The State of World Fisheries and Aquaculture_2012
http://slidepdf.com/reader/full/the-state-of-world-fisheries-and-aquaculture2012 217/230
199
oUtlook
th f capu fihi i a gba uaiab fpuci m: ppuii a chag
In recent editions o The State o World Fisheries and Aquaculture, the Outloo sectionhas ocused on auaculture (in 2008) and inland isheries (in 2010). In this Outloo,while not ignoring their importance (auaculture is highlighted in Part 3 on p. 172), the
emphasis is on how developments in capture isheries in particular can contribute toensuring a global sustainable ood production system.
ConteXt
A recent major study o the world’s ood production systems1 ound that they areunsustainable and that, in attempting to improve the present ones, policy-maers aceive major challenges:
• balancing uture demand and supply sustainably – to ensure that oodsupplies are aordable;
• ensuring that there is adeuate stability in ood supplies – and protecting themost vulnerable rom the volatility that does occur;
• achieving global access to ood and ending hunger;•
managing the contribution o the ood system to the mitigation o climatechange;• maintaining biodiversity and ecosystem services while eeding the world.
The study also concluded that policies aecting agriculture should be developedon the basis o assessments o the whole ood chain and that these assessments shouldinclude judgements o the etent to which ood chains contribute to meeting theabove ive challenges. The study states that actions are reuired now to ensure that:
• more ood is produced sustainably;• demand or the most resource-intense types o ood is contained;• waste in all areas o the ood system is minimized;• the political and economic governance o the ood system is improved to
increase the productivity and sustainability o ood systems.Thereore, as a part o the whole, those responsible or capture isheries (and
auaculture) will be epected to play their part in meeting these challenges, initially byimplementing the above actions. The ollowing sections eamine how they may addressthe tas and contribute to achieving the goal o a global sustainable ood productionsystem.
tHe ProsPeCts For sUstAInABle InCreAsed ProdUCtIon
The latter hal o the twentieth century witnessed widespread epansion o captureisheries supply, and correspondingly positive social and economic impacts associatedwith the global availability o high-uality auatic oods.2 However, recent decadeshave been mared by an increasingly uneasy relationship between, on the one hand,the concerns or stoc levels and ishing eort, and, on the other, the attempts bycommercial leets and smaller-scale ishers to maintain and improve income and
livelihoods. These have interacted with national policy aims o controlling resourceaccess, supporting income and ood supply, and meeting local interests in commercialand artisanal ishing, and the related vessel and gear, ishing supplies and post-harvest

7/28/2019 The State of World Fisheries and Aquaculture_2012
http://slidepdf.com/reader/full/the-state-of-world-fisheries-and-aquaculture2012 218/230
200 The State o World Fisheries and Aquaculture 2012
sectors.3 Through a combination o inadeuate regulatory and monitoring capacity,misguided or misapplied policy aims and interventions, overcapitalization, and short-term proit-seeing by ishing leets, the global imbalance between stoc levels andishing capacity and eort has grown steadily, and the pressures on ey stocs havebecome increasingly unsupportable.4 Based on FAO statistics or 1950–2006, theirst overview o marine isheries resources by country conirmed that, globally, themaimum average level o bottom ish and small pelagic ish production had beenreached within the inal decade. While data were not available to eplore ully therelationship between stoc status and global landings, data covering some 75 percento recent landings (1998–2002) showed that 14.1 percent o world production(about 11 million tonnes) came rom undereploited or moderately eploited stocs,57.3 percent (about 41 million tones) rom ully eploited stocs, 13.7 percent(about 18.4 million tonnes) rom overeploited stocs and 7.6 percent (about10.2 million tonnes) rom depleted or recovering stocs.5
These analyses are troubling rom a resource eploitation perspective and suggesta global system that is overstressed, reducing in biodiversity and in imminent dangero collapse.6 However, total capture isheries output data over this period suggest that
under the management regimes in place to date, or in spite o them, the resourcesystem has been surprisingly resilient in terms o output and ood value, althoughharvesting has been increasingly ineicient in terms o catch per unit o eort (CPUE).There is also a strong societal argument or maimizing beneicial use o naturalresources, and the clear need or ood, which would justiy the ullest possible levelo harvesting consistent with the ability or these harvests to be sustained. However,there have been speciic instances o serious stoc collapse, evidence o historically lowbiomasses o ey stocs, increasing awareness o ecosystem interactions and changingbalances towards harvesting lower in the ood chain. Together with mounting concernor the possible impacts o climate change on ecosystems and dependent communities,7 these have all combined to build the case or more eplicit and increasingly urgentstrategies to improve the capture isheries system and to put in place securely
sustainable isheries.The biological and ecosystem arguments or change have been widely epressed,and they have also been relected in growing consumer awareness and concern orpurchasing decisions related to sustainable isheries.8 An increasingly compelling claimor policy action also arises rom the eplicit and continuing economic losses associatedwith the current ishing system. On a 2004 baseline, a joint World Ban and FAOreview9 estimated global losses o net economic beneit o the order o US$50 billion,compared with irst sale values o US$80 billion, resulting rom a combination oecess capacity and eort, lined with capital and operating-cost subsidies. For 2003,“harmul” subsidies, acting primarily to perpetuate overishing, were estimated atUS$16.2 billion out o a total o US$27 billion a year globally.10 A simulation o subsidyimpacts in North Sea isheries11 showed that, while removing subsidies might reducetotal catch and revenue, overall proitability would increase, as would the total biomass
o commercially important species. A strategy or isheries reorm would be to reducethe capitalization o leets, reduce vessel numbers, restore depleted stocs, changeey practices and improve eiciency by increasing the CPUE, and by devising resource-access and management approaches to bring this about eectively.12
The reasons or change and the prescriptions or action eist, and signiicant movescan be epected in the net two decades to bring more o the world’s isheries intoa more recognizably sustainable state. This is also relected in the growing numbero commitments or change,13 lined also with concerns or eective climate changeresponse.14 However, as noted by the World Ban/FAO review,15 isheries reormwould “reuire broad-based political will ounded on a social consensus” with “acommon vision that endures changes o governments”, which would tae time tobuild. To urther deine the potential or change and the uture share o landings
rom sustainable isheries, distinctions can be made between those parts o the globalcapture ishing system that are:

7/28/2019 The State of World Fisheries and Aquaculture_2012
http://slidepdf.com/reader/full/the-state-of-world-fisheries-and-aquaculture2012 219/230
201Outlook
• unmanaged – including those outside national jurisdictions and/or ishedby leets not under speciic lag state control, characterized by illegalunregulated and unreported (IUU) ishing, and with signiicant potential orcatching and discard o non-target species;
• poorly managed, either because o limited capacity or political will, and maybe overished, have high levels o IUU ishing and have negative ecosystemimpacts;
• managed relatively well, with deinable processes or regulating ishingactivity and monitoring outcomes.
The building o political commitment, even in wealthy economies with adeuateinancial and human resources or eective management, can tae time, and inregionally shared waters, as currently evidenced in the European Union process oisheries reorm, interactions can be comple and conlictual. Nonetheless, a number oprocesses are under way to bring more unmanaged areas under eective internationalagreement, to improve the eectiveness o poorly managed systems, to increase thenumbers o well-managed isheries, and to strengthen and mae more resilient theirpotential or remaining so.
The FAO Code o Conduct or Responsible Fisheries (the Code) and its associatedinternational plans o action and technical guidelines16 have an important role in thisprocess, providing a means or establishing political commitment, a structure withinwhich various contributing actions can be implemented, and a basis or support orstrengthening management capacity. Although the challenges o implementationcan be considerable, a number o initiatives have, together with maret incentives,helped to create the prospects o a “virtuous circle” o systems and actions that cansigniicantly improve the prospects o sustainable isheries. These initiatives includethe Global Record o Fishing Vessels, port State measures to deine landing locationsand recording o catches, global and national initiatives on control o IUU ishing,and strategies or introducing various orms o rights-based approaches to addressconstraints o managing open-access isheries.
While there is scope or reducing ishing capacity across the sector, there areparticular challenges in small-scale isheries, which involve large numbers o people,oten in very diicult circumstances o poverty and vulnerability.17 Low costs o entryand operation allow access to income and ood or many, and individual ishingimpacts are usually relatively modest. However, cumulative eects are potentiallyvery signiicant, with numerous eamples o ecess ishing pressure, yet with ewother livelihood options18 to provide alternatives. Approaches based on ishing rightscould potentially rationalize eort and improve returns in small-scale isheries, andincrease resource rent at the national level. However, unless the beneits were broadlyshared within ishing communities, these could increase vulnerability in the absenceo access to alternative livelihoods or other orms o social support.19 Although variouscommunity-based management approaches have been developed and applied, theeectiveness o reconciling sustainable ishing with human needs varies widely with
the resource, social and economic contet.20 This aspect o reconciling potentiallycompeting needs is also important in relation to inland isheries (Bo 23).
More positively, across a range o capture isheries, opportunities may be seen orcreating tipping points, which, i well deined and with widely understood ecosystemand social impacts, could bring about an accelerating process o change towardssustainability. Thus, where the costs or other constraints to non-compliance becometoo great (including sanctions on vessels and leets and marets, and possible tradeor indirect penalties), vessels, leets and ishing nations may respond more rapidlyand deinitively. Similarly, where rising uel costs combine with ecess ishing eort,and subsidies are less politically acceptable, incentives will increase or more rationalmanagement. The impacts o such change would etend not just to target and bycatchish stocs but also to secondary impacts such as increased protection or endangered
ish, mammalian and avian species. A number o leverage opportunities can beidentiied – the eample already eists or pressures on supermarets to improve

7/28/2019 The State of World Fisheries and Aquaculture_2012
http://slidepdf.com/reader/full/the-state-of-world-fisheries-and-aquaculture2012 220/230
202 The State o World Fisheries and Aquaculture 2012
buying practices, and or campaigners to target speciic policy issues. Further leveragecould also be applied at leet level, pushing or compliance at the total level o activity(not just in speciic isheries or vessels), and at the national level, whereby all orms oishing engagement could be made subject to good conduct criteria.
Pib chag b 2030The current decade and the net are liely to see major changes in economies, marets,resources and social conduct. Climate change impacts will bring about increasinguncertainty in many ood sectors, including capture isheries, and climate adaptationapproaches will need to be well integrated with the processes o improving isheriesgovernance. The size o the shit in balance towards sustainable isheries will also
depend in part on how it will be deined; whether, or eample, by conduct (theishing sector agreeing to speciic actions or signing commitments o varying orce) orby outcome (where signiicant measures or indicators are put in place to conirm theconseuences o good practice). It will also depend on whether sustainable isheries arespecies-based or ecosystem-based, and whether the airmation o sustainability actionor outcome is determined by private-sector monitoring and accreditation or throughmore broadly deined standards.
Within the policy ramewor set out by the Code and related instruments, the roleo private-sector certiication systems, such as those o the Marine Stewardship Counciland others, have already been signiicant in incentivizing better ishing practice andin reuiring certiication o leet operations and their management regimes, chaino custody controls and guarantees to customers. However, although their scope has
epanded maredly in the last ive years, many isheries are still relatively unconnectedwith the maret or political drivers necessary to create the incentives. There is also
Bo 23 Reconciling sustainable inland isheries with the needs o other sectors
Although important in many parts o the world, inland isheries tend to
have been overlooed in many development policy perspectives and eature
ar less in the sustainable isheries debate. They ace signiicant issues
relating not just to ishing pressure but also the impacts o inrastructure
development, drainage and land reclamation, continuous or periodic
water withdrawals, and water-uality impacts rom urban, industrial and
agricultural use.1 Here, the governance o ishing and the associated social
impacts are important, and they are now starting to receive more policy
attention. However, the achieving o sustainable inland isheries will also
depend on policies and actions in many other sectors, and will reuire a level
o strategic interaction, value trade-os across speciic resource beneits, and
a policy response that has yet to be developed. Where there is a convergenceo impacts o climate change on hydrological balances, potential increases
in related etraction demands or agriculture and other sectors, and greater
calls or renewable energy, the case or deending inland isheries resources
and the livelihoods o many millions o dependent people becomes more
challenging.
1 Welcomme, R.L., Cow, I.G., Coates, D., Béné, C., Funge-Smith, S., Halls, A. and Lorenszen, k.2010. Inland capture sheries. Philosophical Transactions o the Royal Society B, 365(1554):2881–2896.

7/28/2019 The State of World Fisheries and Aquaculture_2012
http://slidepdf.com/reader/full/the-state-of-world-fisheries-and-aquaculture2012 221/230
203Outlook
substantial scope or misrepresenting the provenance o ish, and, given the cost ocertiication and the related beneits o maret access, the rewards or doing so canbe signiicant. This might only be countered eectively by the widespread availabilityo rapid diagnostic tools or species or stoc identiication and by appropriate levelso monitoring. There are notable challenges in moving outside higher-value globalmarets, where certiication has a role in supply chain competition, towards othermarets where there may be ar less incentive to adopt certiication, much less theresources to do so.
With a view to improving estimates o the potential or sustainable captureisheries, prospects or enhanced ishing regimes can be divided into broad categories.First, there are well-managed national and regional isheries with managementregimes that have undergone considerable improvement in recent years, supportsustainable isheries and have strong prospects or continuing to do so. A secondcategory comprises national and regional isheries systems undergoing steadyimprovement as management measures tae eect and bring about greater levelso compliance. A urther category includes national and regional isheries with lowmanagement capacity and widespread IUU ishing, commonly with comple isheries
and diicult management contets. A ourth group contains international high seasisheries, also including deep-sea isheries, with varying levels o leet or nationalmanagement agreement and compliance. In some cases, responsible ishing practicecan be incentivized through maret pressures, but compliance is at best partial, actionso non-compliant leets are diicult to sanction, and, in many instances, eectiveprotocols under international law are as yet developing. A inal category is that onew isheries undergoing possible epansion, or which management systems are onlyemerging. A more detailed assessment o management change potential is yet to becarried out, but based on the earlier estimates o catch status,21 more than 20 percento output is related to overeploited, depleted or recovering stocs. A moratoriumon ishing or all o these is unliely, but a concerted approach or change mightreasonably be epected to reduce this category to 10 percent (some 14 million tonnes).
Similarly, a more signiicant part o the 41 million tonnes rom ully eploitedstocs could be subject to more secure regimes, and the 11 million tonnes romundereploited or moderately eploited stocs might be epanded, but this wouldneed to done within a sound management environment.
Pici cuci a ica ha f uaiab fihiA number o policy areas can be distinguished, and their potential evolutionconsidered. These can broadly be described as: (i) direct, which speciically aect theway the capture ishing system operates; and (ii) indirect, which change the widerenvironment in which people, businesses and communities interact, and which cancreate positive or negative incentives or improving unction and behaviour.
Direct policies would include those on resource management and their allocationto speciic groups, licensing and regulatory eatures, capacity development in ey
agencies, those associated with uel and energy pricing, capital costs and possiblesubsidization, and those addressing maret management and trade issues (includingmaret access and the use o maret sanctions against unsustainable ishing). Wherepossible, these would be aligned to provide positive incentives or good practice,removal o perverse inluences, and adeuate deterrence or non-compliance.Although more immediately eective within national jurisdictions, a strong policyenvironment at the national level can have an important impact on wider application.
A range o indirect policy areas can be noted. Apart rom the generic iscalenvironment and its eects on investment and earnings, and policies aectinginrastructure investment and maintenance, a number o social policy areas may berelevant. Those addressing broader development issues, including gender and rights,child labour, health, education and social welare, may help to ease pressures in small-
scale isheries, while various local empowerment policies can provide more positiveenvironments in which community-based management initiatives may be developed.

7/28/2019 The State of World Fisheries and Aquaculture_2012
http://slidepdf.com/reader/full/the-state-of-world-fisheries-and-aquaculture2012 222/230
204 The State o World Fisheries and Aquaculture 2012
The clarity and coherence o policies in related sectors will also aect the potentialor sustainable isheries, as noted above in the case o inland isheries. Climate changeresponse policies with eective resilience building measures are also liely to have animportant eect on the stress on capture isheries systems. Across these policy areas,the role o nowledge and capacity building will be critical, and eective policiesor these, including resources or isheries data and scientiic management,22 will beimportant.
While policy areas and approaches to support sustainable isheries can be readilyidentiied, their eective implementation is a particular challenge. There have beentoo many eamples o policy ormulation that has been unconnected with actionand outcome, or in some cases has resulted in perverse conseuences. Where eistingpractices have to be substantially changed, social and political interests challenged, andpreviously unconnected issues brought together, considerable thought and eort maybe reuired, building support or action across a range o agents.
CAPtUre FIsHerIes As tArGets oF eFForts to redUCe resoUrCe
Use And GreenHoUse GAs eMIssIons
Bottom trawling and dredging are liely to become double targets, not just becauseo their potential damage to sealoor habitats,23 but because o their relatively highuel use (and hence greenhouse gas [GHG] output) per uantity o ish landed (seealso p. 126). Rising energy costs may possibly limit some o the more etreme cases ohigh uel use (e.g. with ineicient gear or low-CPUE characteristics). However, i uelsubsidies are maintained or increased to permit their continuation, this is liely toattract more adverse response rom the public and non-governmental organizations(NGOs). More generally, the possibility o structuring isheries reorm so that iteliminates “the race or ish” or reduces overishing more widely has the potential todeliver “triple win” outcomes – better returns to ishing vessels, healthier stocs, andreduced energy use and GHG output per unit o output. For smaller-scale, less-energy-intensive isheries, the choices may not be so etreme, but rising energy costs may well
limit longer trips or low catches and create longer-term disincentives or overcapacity.There may be more comple interactions i climate change impacts on stocdistribution result in leets having to travel greater distances and ish wider areas,hence increasing energy use per unit o output, even i stocs are relatively healthy. Insuch cases, a longer-term monitoring approach would be justiied, and the balance opreerred types o ishing gear might change.
A urther issue may relate to the whole lie-cycle assessment o the ishery inuestion, as investment in new vessels and gear, and the associated carbon emissionsand energy use, will have to be considered. However, i accompanied by greater ueleiciency, e.g. through improved hull, propeller and gear design, this investment coulduicly be recouped.
Pic a-ff
In many renewable-resource contets, there is a presumption that secure accessrights together with ully costed operating conditions can bring about long-lastingoutcomes that are eicient and able to meet wider social objectives. Appropriatevaluing o eternalities and a transparent process o internalizing these costs willallow producers to select the most eective means o delivering output commensuratewith the returns available rom mareted products. Such a system can also be usedto incorporate compensatory values associated with mitigation, or eample throughcarbon seuestration in auatic systems. However, there may be wider social andenvironmental trade-os; or eample, regarding the need or more ish supply, abalance between uel subsidy and additional output ood value. Another eamplewould concern the need to retain communities and rural economies, where it wouldbe necessary to strie a balance between uel subsidy, local ood security, supply into
wider marets, and opportunity costs associated with avoiding social breadown.

7/28/2019 The State of World Fisheries and Aquaculture_2012
http://slidepdf.com/reader/full/the-state-of-world-fisheries-and-aquaculture2012 223/230
205Outlook
Pubic puThe public pressure eerted by NGOs on approaches in isheries that are moreresource and energy eicient will be an important element in change. However,eperience across other policy ields has suggested that independent evidence is alsoessential in targeting the debate towards realistic, broadly supported and eectivepolicy. Thereore, it will be necessary to build support and intent across a range ostaeholders, particularly or more diicult areas o change.
MInIMIZInG wAste
The current discussions about mandatory landing o catch, particularly in the lead-up to the reorm o the European Union Common Fisheries Policy, have helped tohighlight the dilemmas o uota management in multispecies ishing, the conlictingviews o the range o staeholders,24 and the increasing role o issue-targeted publiccampaigns in isheries policy ormulation.25 It is clear also that, under closer publicscrutiny, with valuable local marets much more directly inluenced by perceptions oishing conduct, and with increasing technical means to engage in real-time decision-maing on stoc conditions and ishing activity, much more leible, responsive and
ecosystem-sensitive ishing could start to become more easible. The processes odiscussion themselves are also important eamples o greater openness o debate onsuch issues, and ideally will lead to more mature, ully reasoned and widely sanctionedmanagement strategies and industry responses. Given the wide diversity o captureishery systems and management regimes, it is unliely that mandatory landing o catchwill rapidly become the norm. However, the arguments are liely to gain traction, andtogether with a growing appreciation o the practical aspects o ecosystem approachesto isheries management,26 catch landing practice in more isheries may be epectedto ollow suit. In many isheries, particularly multispecies ishing in tropical waters,substantial uantities o bycatch are already being landed and used.
Pici pm -impac fu-ffici fihig agi
The development o low-impact uel-eicient (LIFE) ishing is increasingly seen as apractical response to rising uel costs and concern or ecosystem impacts, potentiallydelivering gains in uel use and GHG outputs, improving selectivity and catch value,reducing habitat damage and improving returns (see also p. 134). Regardless o otheractors, a primary element in uel eiciency is that o ish stoc status, and improvedstoc levels and better eort allocation should lead to substantial reductions in ueluse in many isheries. In the absence o urther subsidies, and their possible phasingout, uel costs alone may start to shit practice in this direction, although a morestrategic approach could permit more eective adjustment, and ensure that theinterests o more socially dependent groups were adeuately addressed. Ideally,these would involve incentives and transer mechanisms to enable these groups toaccess and beneit rom LIFE strategies with appropriate investment in improvingvessels and gear, and in promoting maret and other incentives to change. Energy
use and GHG mitigation linages would also be important, and options could beurther eplored or raising awareness o the signiicance o the isheries sector,and or accessing mitigation unding. Were payments to be made or ecosystemservices, more stringent monitoring might be reuired, lined with the developmento benchmars and best practice concepts. Policy approaches would also need to beepanded to demonstrate the wider impacts o LIFE ishing, their linages into thelarger ishery sector supply and value chain,27 and the means by which LIFE ishingbecome embedded into normal practice.
IMProvInG GovernAnCe
In addition to the array o mechanisms or transition to a green economy consideredat Rio+20 (see Part 1 sections on Governance and Rio+20), the ocus here is on aspects
relating to sanctions and small-scale isheries.

7/28/2019 The State of World Fisheries and Aquaculture_2012
http://slidepdf.com/reader/full/the-state-of-world-fisheries-and-aquaculture2012 224/230
206 The State o World Fisheries and Aquaculture 2012
saciSanctions or IUU ishing will probably become tougher, to the etent that consensusbuilding or strong and resolute policy action is eective among ishing nations,particularly those engaged in international waters or operating with access agreementsor licences. Pressure rom international lobbying groups is unliely to relent, andmaret sanctions have been shown to have direct eects on a number o isheries.While IUU ishing remains a serious global challenge, there is increasing evidencethat some IUU control measures are starting to “bite”, and there is more potentialor better regulated isheries to become the norm.28 However, sanctions or stocdepletions per se may be more diicult to put in place, as the attribution andresponsibility issues may be more comple. Nonetheless, as evidenced by the currentinternational concern or management o tuna, particularly or Eastern Atlanticstocs,29 a range o pressures may be brought to bear on the management agenciesand individual countries concerned.
As the capture isheries sector is not commonly a major part o national economies,and may not receive immediate priority or action, the threat o applying widertrade or other sanctions, e.g. in other sectors or or speciic interest groups, can also
potentially be eective in addressing non-compliance issues at the national level.However, groups within individual nations wishing to resist compliance, by political orother means, may still attempt to hold bac wider and more eective managementin more comple resource and eploitation systems. Here, careul and sensitiveassessments o the political economy o ishing and its beneiciaries may need to bemade, and appropriate mies o incentives and sanctions through a number o routesmay need to be considered, in order to bring about change.
sma-ca fihi a acc pubic icThere is widespread evidence that many communities engaged in small-scale isheriesehibit multiple deprivations with respect to income opportunities, maret power,access to land-based resources, political access, and inclusion in public services such
as health and education.30
This poverty and vulnerability neus leaves little scope orpeople to give up the immediate possibilities o ishing income, and little opportunityto move away rom ishing, either in the shorter term through livelihood diversiicationor over the longer term through education and sill building. Improving public servicesand social support will be an important actor in reducing this negative dynamic, andsome speciic poverty alleviation interventions, such as improved maternal and childhealth care, or school eeding programmes, can have very positive eects relativelyuicly.31 However, or lasting changes and more stable human–resource relationships,this has to be done as part o an integrated approach, one that also includes a ullerunderstanding o the role o ishing as a “last resort”, the causes and dynamicso people leaving and entering ishing, evolving lins between rural and urbanpopulations, marets and economies, and the political weight related to these. Muchis now being done within the isheries sector to raise awareness o the economic and
social importance o small-scale isheries and the need to address wider developmentissues;32 the challenge will be to move these more centrally into national economicdevelopment agendas and investment strategies.

7/28/2019 The State of World Fisheries and Aquaculture_2012
http://slidepdf.com/reader/full/the-state-of-world-fisheries-and-aquaculture2012 225/230
207Outlook
notes
1 Foresight. 2011. The uture o ood and arming: challenges and choices or global
sustainability . Final project report. London, The Government Oice or Science.208 pp.
2 FAO. 2009. The State o World Aquaculture and Fisheries 2008 . Rome. 176 pp.3 Hilborn, R. 2007. Deining success in isheries and conlicts in objectives. Marine
Policy , 31(2): 153–158.4 Garcia, S.M. and Grainger, R.J.R. 2005. Gloom and doom? The uture o marine
capture isheries. Philosophical Transactions o the Royal Society B, 360(1453):21–46.
5 Garcia, S.M. and Rosenberg, A.A. 2010. Food security and marine capture isheries:characteristics, trends, drivers and uture perspectives. Philosophical Transactions o
the Royal Society B, 365(1554): 2869–2880.6 Pauly, D., Watson, R. and Alder, J. 2005. Global trends in world isheries: impacts
on marine ecosystems and ood security. Philosophical Transactions o the Royal
Society B, 360(1453): 5–12. Worm, B., Barbier, E.B., Beaumont, N., Duy, J.E., Fole, C., Halpern, B.S.,
Jacson, J.B.C., Lotze, H.k., Micheli, F, Palumbi, S.R., Sala, E., Seloe, k.A.,Stachowicz, J.J. and Watson, R. 2006. Impacts o biodiversity loss on oceanecosystem services. Science, 314: 787–790.
7 Brander, k.M. 2007. Global ish production and climate change. Proceedings o the
National Academy o Sciences o the United States o America, 104(50): 19709–19714.Fice, A.D., Myric, C.A. and Hansen, L.J. 2007. Potential impacts o global climatechange on reshwater isheries. Reviews in Fish Biology and Fisheries, 17 (4): 581–613.Cochrane, k., De Young, C., Soto, D. and Bahri, T., eds. 2009. Climate change
implications or isheries and aquaculture: overview o current scientiic knowledge. Fisheries and Auaculture Technical Paper No. 530. Rome, FAO.212 pp.Allison, E.H., Perry, A.L., Badjec, M.-C., Adger, W.N., Brown, k., Conway, D.,Halls, A.S., Pilling, G.M., Reynolds, J.D., Andrew, N. L. and Dulvy, N.k. 2009.Vulnerability o national economies to the impacts o climate change on isheries.Fish and Fisheries, 10(2), 173–196.
8 Pares, G., Young, J.A., Walmsley, S.F., Abel, R., Harman, J., Horvat, P, Lem, A.,MacFarlane, A., Mens, M. and Nolan, C. 2010. Behind the signs – a global reviewo ish sustainability inormation schemes. Reviews in Fisheries Science, 18(4): 344–356.
9 World Ban and FAO. 2009. The sunken billions: the economic justiication or
isheries reorm. Washington, DC, The World Ban, and Rome, FAO. 100 pp.
10 Sumaila, U.R., khan, A.J., Dyc, A., Watson, R., Munro, G., Tyedmerset, P. andPauly, D. 2010. A bottom-up re-estimation o global isheries subsidies. Journal o
Bioeconomics, 12(3): 201–225.11 Heymans, J.J., Macinson, S., Sumaila, U.R., Dyc, A., Little, A. 2011. The impact
o subsidies on the ecological sustainability and uture proits rom North Seaisheries. PLoS ONE , 6(5): e20239 [online]. [Cited 31 March 2012]. www.plosone.org/article/ino%3Adoi%2F10.1371%2Fjournal.pone.0020239
12 Leal, D.R., ed. 2010. The political economy o natural resource use: lessons or
isheries reorm. Washington, DC, World Ban.13 UN. 2011. Sustainable isheries, including through the 1995 Agreement or the
Implementation o the Provisions o the United Nations Convention on the Law
o the Sea o 10 December 1982 relating to the Conservation and Management o
Straddling Fish Stocks and Highly Migratory Fish Stocks, and related instruments.Resolution 65/38. New Yor, USA. 26 pp.

7/28/2019 The State of World Fisheries and Aquaculture_2012
http://slidepdf.com/reader/full/the-state-of-world-fisheries-and-aquaculture2012 226/230
208 The State o World Fisheries and Aquaculture 2012
Staeholder Forum. 2011. Monaco message [online]. [Cited 31 March 2012]. www.staeholderorum.org/ileadmin/iles/Monaco%20Message.pd
14 Hall, S.J. 2011. Climate change and other eternal drivers in small-scale isheries:practical steps or responding. In R. Pomeroy and N.L. Andrew, eds. Small-scale
isheries management: rameworks and approaches or the developing world , pp. 132–159. Wallingord, Uk, CABI Publishing. 247 pp.
15 Op. cit., see note 9.16 FAO. 1995. Code o Conduct or Responsible Fisheries. Rome, FAO. 41 pp.17 Andrew, N.L., Béné, C., Hall, S.J., Allison, E.H., Hec, S. and Ratner, B.D. 2007.
Diagnosis and management o small-scale isheries in developing countries. Fish
and Fisheries, 8(3): 227–240.FAO. 2009. Report o the Global Conerence on Small-Scale Fisheries – Securing
sustainable small-scale Fisheries: Bringing together responsible isheries and social
development. Bangkok, Thailand, 13–17 Octobre 2008. Rapport de la Conérence
mondiale sur les pêches artisanales – Pour une pêche artisanale durable:
Associer la pêche responsable au développement social. Bangkok, Thaïlande, 13-
17 octobre 2008. Inorme de la Conerencia Mundial sobre la Pesca en Pequeña
Escala – Garantizar la pesca en pequeña escala: Pesca responsable y desarrollo social unidos. Bangkok, Tailandia, 13-17 de octubre de 2008 . FAO Fisheries andAuaculture Report/FAO Rapport sur les pêches et l’auaculture/FAO Inorme dePesca y Acuicultura No. 911. Rome/Roma. 189 pp.
18 World Ban, FAO and WorldFish Center. 2010. The hidden harvests: the global
contribution o capture isheries. Conerence edition. Washington, DC, WorldBan. 99 pp.Mills, D.J., Westlund, L., de Graa, G., kura, Y., Willman, R. and kelleher, k. 2011.Under-reported and undervalued: Small-scale isheries in the developing world. In R. Pomeroy and N.L. Andrew, eds. Small-scale isheries management: rameworks
and approaches or the developing world , pp. 1–15. Wallingord, Uk, CABIPublishing. 247 pp.
19 Béné, C., Hersoug, B. and Allison, E.H. 2010. Not by rent alone: analysing the pro-poor unctions o small-scale isheries in developing countries. Development Policy
Review , 28(3): 325–358.20 Béné, C., Belal, E., Baba, M.O., Ovie, S., Raji, A., Malasha, I., Njaya, F., Na Andi, M.,
Russell, A. and Neiland, A. 2009. Power struggle, dispute and alliance over localresources: analyzing ‘democratic’ decentralization o natural resources through thelenses o Arica inland isheries. World Development , 37(12): 1935–1950.
21 Op. cit., see note 5.22 Mora, C., Myers, R.A., Coll, M., Libralato, S., Pitcher, T.J., Sumaila, R.U., Zeller, D.,
Watson R., Gaston k.J. and Worm, B. 2009. Management eectiveness o theworld’s marine isheries. PLoS Biology , 7(6): e1000131 [online]. [Cited 31 March2012]. www.plosbiology.org/article/ino%3Adoi%2F10.1371%2Fjournal.pbio.1000131
23 Hiddin, J.G., Johnson, A.F., kingham, R. and Hinz, H. 2011. Could our isheriesbe more productive? Indirect negative eects o bottom trawl isheries on ishcondition Journal o Applied Ecology , 48(6): 1441–1449.
24 National Federation o Fishermen’s Organisations. 2011. The mixed blessings o
celebrity – the ight or ish [online]. [Cited 31 March 2012]. www.no.org.u/ news/mied_blessing.html
25 Young, I.A. 2011. Change and continuity in Common Fisheries Policy: a case study
o the proposed discards ban. School o Government and Public Policy, Universityo Strathclyde. (MSc dissertation)
Suárez de Vivero, J.L., Rodríguez Mateos, J.C. and Florido del Corral, D. 2008. Theparado o public participation in isheries governance. The rising number oactors and the devolution process. Marine Policy , 32(3): 319–325.
26 FAO. 2003. Fisheries management. 2. The ecosystem approach to isheries. FAOTechnical Guidelines or Responsible Fisheries No. 4 Suppl. 2. Rome. 112 pp.

7/28/2019 The State of World Fisheries and Aquaculture_2012
http://slidepdf.com/reader/full/the-state-of-world-fisheries-and-aquaculture2012 227/230
209Outlook
27 Suuronen, P., Chopin, F., Glass, C., Løeborg, S., Matsushita, Y., queirolo, D. andRihan, D. 2012. Low impact and uel eicient ishing—looing beyond the horizon.Fisheries Research, 119–120: 135–146.
28 Agnew, D.J., Pearce, J., Pramod, G., Peatman, T., Watson, R., Beddington, J.R. andPitcher, T.J. 2009. Estimating the worldwide etent o illegal ishing PLoS ONE , 4(2):e4570 [online]. [Cited 31 March 2012]. www.plosone.org/article/ino:doi/10.1371/
journal.pone.000457029 Convention on International Trade in Endangered Species o Wild Fauna and
Flora. 2010. Fiteenth meeting o the Conerence o the Parties Doha (Qatar),
13–25 March, Summary record o the eighth session o Committee I [online]. [Cited31 March 2012]. www.cites.org/eng/cop/15/sum/E15-Com-I-Rec08.pd
30 Béné, C. 2003. When ishery rhymes with poverty: a irst step beyond the oldparadigm on poverty in small-scale isheries. World Development , 31(6): 949–975.Op. cit., see note 17, FAO.
31 FAO. 2006. Microinance helps poverty reduction and isheries management –
policies to support microinance. New Directions in Fisheries – a series o PolicyBries on Development Issues No. 4. Rome. 8 pp.
Shepherd, A. 2011. Tackling chronic poverty: the policy implications o researchon chronic poverty and poverty dynamics [online]. Chronic Poverty ResearchCentre. [Cited 31 March 2012]. www.chronicpoverty.org/uploads/publication_iles/ Tacling%20chronic%20poverty%20webcopy.pd
32 Op. cit., see note 17, FAO.Béné, C., Macadyen, G. and Allison, E.H. 2007. Increasing the contribution o small-
scale isheries to poverty alleviation and ood security. FAO Fisheries TechnicalPaper No. 481. Rome, FAO. 125 pp.

7/28/2019 The State of World Fisheries and Aquaculture_2012
http://slidepdf.com/reader/full/the-state-of-world-fisheries-and-aquaculture2012 228/230

7/28/2019 The State of World Fisheries and Aquaculture_2012
http://slidepdf.com/reader/full/the-state-of-world-fisheries-and-aquaculture2012 229/230

7/28/2019 The State of World Fisheries and Aquaculture_2012
http://slidepdf.com/reader/full/the-state-of-world-fisheries-and-aquaculture2012 230/230
THE STATE OF
WORLD FISHERIES
AND AQUACULTURE
In addition to striving to meet the United Nations Millennium Development
Goals, the global community is also grappling with other pressing and