Embed Size (px)
Citation preview

The Statistical Nature of Unsteady Inlet Flow
Bernhard H. Anderson NASA Glenn Research Center
Cleveland, Ohio, 44135

Statistical Nature of Unsteady Inlet Flow “The understanding and analysis of the unsteady information obtained from LES and DES analyses is fundamentally different from steady Reynolds Averaged Navier Stokes (RANS) analysis. That is because the process described by unsteady analyses is fundamentally stochastic in nature and not deterministic. The basic feature of the probability theory, or more commonly the statistical approach, is the transition from the consideration of a single turbulent flow within the inlet, to the consideration of a statistical ensemble of all similar turbulent flows created by the inlet. Thus the only possible description of the turbulent flow within the inlet is a statistical description based on the study of specific statistical laws, i.e. “the theory of random fields” (1)
(1) Monin, A. S., and Yaglom, A. M., “Statistical Fluid Mechanics”, The MIT Press, Cambridge, Massachusetts, 1971.

Statistical Nature of Unsteady Inlet Flow Stochastic Processes
Stationary processes are unsteady flows which are statistical stable with probabilistic properties that do not change over time, in particular varying about a fixed mean level and with constant variance. Non-Stationary processes are unsteady flows which exhibit no natural mean level over time and contain both coherent and random variations in their unsteady flow field structure.

Statistical Nature of Unsteady Inlet Flow Homogeneous Random Processes(1)
“Many time series actually encountered in aerodynamics exhibit non-stationary behavior and in particular do not vary about a fixed mean. Such series nevertheless exhibit homogeneous behavior over time of a kind. In particular, although the general level about which fluctuations are occurring may be different at different times, the broad behavior of the series, when differences in level are accounted for, may be similar over time. This behavior may be modeled in terms of an autocorrelation operator.”(2) (1) To detect coherent structures in data containing random variations.
(2) To identify an appropriate time series model for the mean if the data is non-stationary. (1) George, W. K.: “Lectures in Turbulence for the 21st Century”, January, 2013 (2) Box, E. P., Jenkins, G. M., and Reinsel, G. C.: “Time Series Analysis”, John Wiley & Sons, 2008.

Boeing QEVC Low Boom Supersonic Inlet Design 8x6 NASA/GRC SWT

Side View
Top View
Boeing QEVC Low Boom Supersonic Inlet Design Computational Grid = 32.945 x 10⁶
Number of Blocks = 151

Boeing QEVC Low Boom Supersonic Inlet Design Inlet Scale Information
Model Acap (sq. in.) Daip (in.) Actual Scale Approx. Scale Test Scale 1.5631 1.5361 0.0231 1/43 Ref. Scale 381.57 24.0 0.3692 1/3 Full Scale 2802.0 65.0 1.0 1/1

Variable Value
Tunnel Mach Number, M0 1.560
Tunnel Total Pressure (lbs/ft2), Po 2942.9
Tunnel Total Temperature (oR), To 627.0
Reynolds Number, ReDaip 6.275 x 10⁵
Boeing QEVC Low Boom Supersonic Inlet Design 8x6 SWT Conditions for Test

Response Variable Symbol
Area Averaged Capture Mass Flow m/m0
Area Averaged AIP Total Pressure Recovery PFAIP
AIP Circumferential Distortion DPC/P
Boeing QEVC Low Boom Supersonic Inlet Design Response Variables

Boeing QEVC Low Boom Supersonic Inlet Design Time Relevant Variables
Time Variable Value
Computational Time Step, Sec. 5.0 x10⁻⁷
CFD Data Sampling Rate, Sec 1.0 x10⁻⁴(1)
Per/Rev Time Span (4300 RPM), Sec. 1.395 x10⁻²
CFD Data Per/Rev Sampling Time Span, Sec (1) 1.4 x10⁻²
Total Number of Data Samples 141
(1) Equivalent to experimental sampling rate, 1.0 x 10⁴ samples/sec

Boeing QEVC Low Boom Supersonic Inlet Design Re = 6.275 x 10⁵, Scale ≈ 1/43, M0 = 1.560
Steady PFAIP Cane Curve

Boeing QEVC Low Boom Supersonic Inlet Design Critical Operating Condition, M0 = 1.560
Capture Mass Flow Ratio, m/m0

Capture Mass Flow m/mo Probability Distribution Critical Operating Condition, M0 = 1.560
m/m0 Histogram Plot
Frequency Occurrence Diagram

Capture Mass Flow m/mo Probability Distribution Critical Operating Condition, M0 = 1.560
Normal Scores Plot, ρ = 0.9880

Boeing QEVC Low Boom Supersonic Inlet Design Critical Operating Condition, M0 = 1.560
Normalized m/mo Autocorrelation
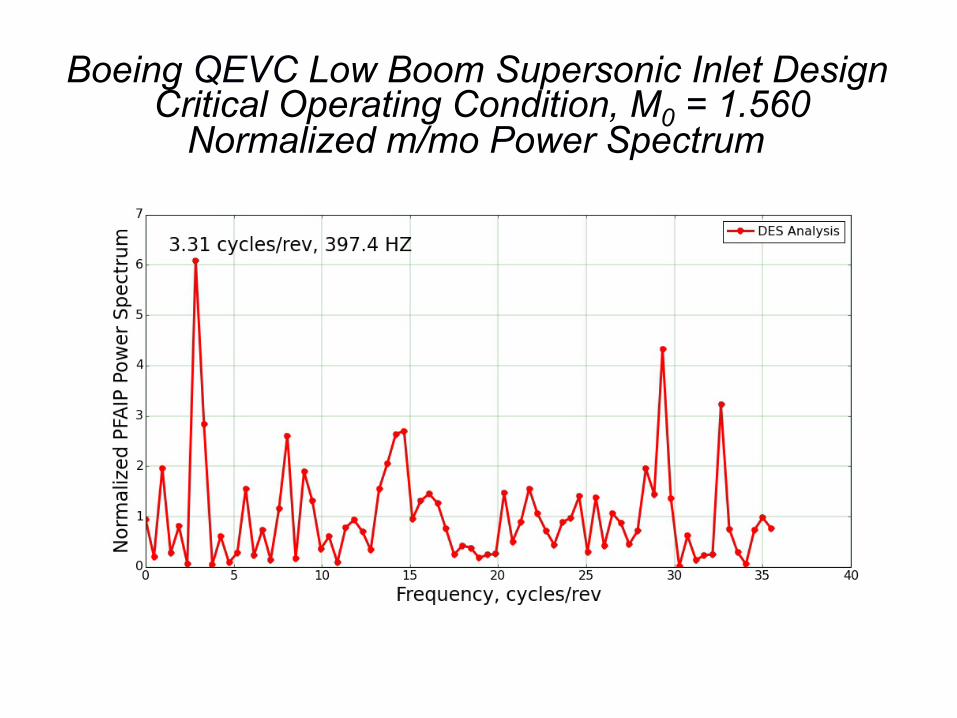
Boeing QEVC Low Boom Supersonic Inlet Design Critical Operating Condition, M0 = 1.560
Normalized m/mo Power Spectrum

Boeing QEVC Low Boom Supersonic Inlet Design Normalized Autocorrelation
White Noise

Boeing QEVC Low Boom Supersonic Inlet Design Critical Operating Condition, M0 = 1.560
Total Pressure Recovery, PFAIP

Total Pressure Recovery PFAIP Probability Distribution Critical Operating Condition, M0 = 1.560
Normal Scores Plot, ρ = 0.9906

Boeing QEVC Low Boom Supersonic Inlet Design Critical Operating Condition, M0 = 1.560
Normalized PFAIP Autocorrelation
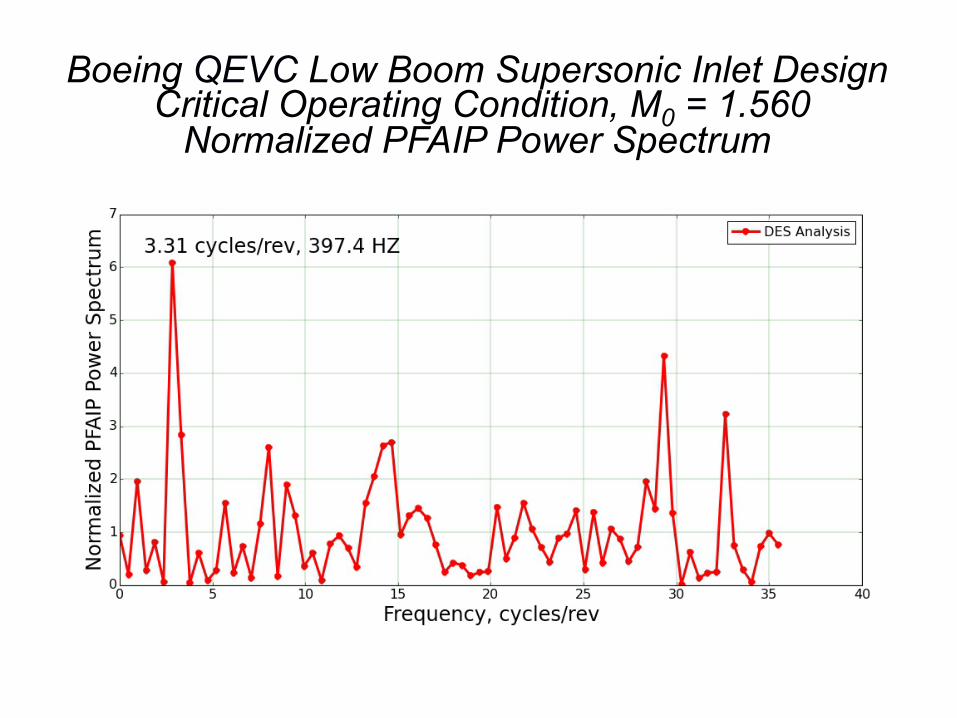
Boeing QEVC Low Boom Supersonic Inlet Design Critical Operating Condition, M0 = 1.560
Normalized PFAIP Power Spectrum

Boeing QEVC Low Boom Supersonic Inlet Design Critical Inlet Operation, M0 = 1.560
Scatter Plot, ρ = 0.984

Boeing QEVC Low Boom Supersonic Inlet Design Critical Operating Condition, M0 = 1.560
Total Pressure Recovery, DPC/P

Circumferential Distortion DPC/P Probability Distribution Critical Operating Condition, M0 = 1.560
Normal Scores Plot, ρ = 0.9913

Boeing QEVC Low Boom Supersonic Inlet Design Critical Inlet Operation, M0 = 1.560
Scatter Plot, ρ = 0.289

Boeing QEVC Low Boom Supersonic Inlet Design Re = 6.275 x 10⁵, Scale ≈ 1/43, M0 = 1.560
Unsteady PFAIP Cane Curve

Boeing QEVC Low Boom Supersonic Inlet Design Re = 6.275 x 10⁵, Scale ≈ 1/43, M0 = 1.560
Unsteady DPC/P Cane Curve

Boeing QEVC Low Boom Supersonic Inlet Design Critical Inlet Operating Condition, M0 = 1.560
Streamwise Mach Number Contours

Boeing QEVC Low Boom Supersonic Inlet Design Supercritical Operating Condition, M0 = 1.560
Streamwise Mach Number Contours
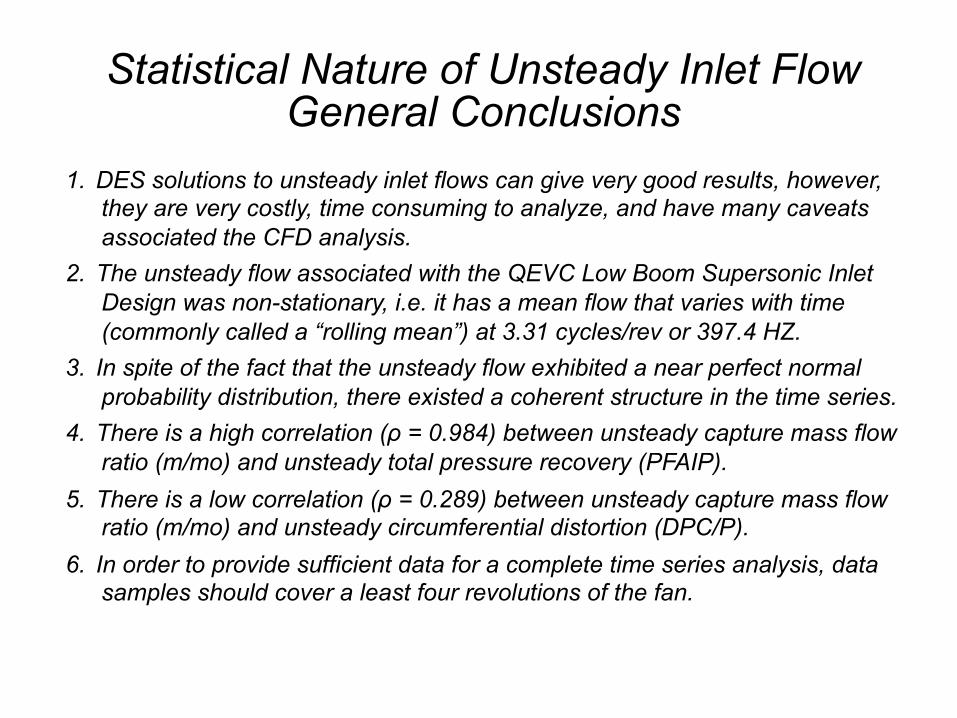
Statistical Nature of Unsteady Inlet Flow General Conclusions
1. DES solutions to unsteady inlet flows can give very good results, however, they are very costly, time consuming to analyze, and have many caveats associated the CFD analysis.
2. The unsteady flow associated with the QEVC Low Boom Supersonic Inlet Design was non-stationary, i.e. it has a mean flow that varies with time (commonly called a “rolling mean”) at 3.31 cycles/rev or 397.4 HZ.
3. In spite of the fact that the unsteady flow exhibited a near perfect normal probability distribution, there existed a coherent structure in the time series.
4. There is a high correlation (ρ = 0.984) between unsteady capture mass flow ratio (m/mo) and unsteady total pressure recovery (PFAIP).
5. There is a low correlation (ρ = 0.289) between unsteady capture mass flow ratio (m/mo) and unsteady circumferential distortion (DPC/P).
6. In order to provide sufficient data for a complete time series analysis, data samples should cover a least four revolutions of the fan.

Statistical Nature of Unsteady Inlet Flows Aerodynamic References
1. Trefny, C J., Hirt, S. M., Anderson, B. H., Fink, L. E., and Magee, T. E., “Performance of a Supersonic Over-Wing Inlet with Application to a Low-Sonic-Boom Aircraft”, AIAA Paper, 2014.
2. Mace, J, Lakebrink, M, Mani, M, and Steeken, W: ”Computational Simulation of Dynamic Total Pressure Distortion, AIAA Paper, 2014.

Statistical Nature of Unsteady Inlet Flows Statistical References
3. Box, G. E. P., Hunter, W. G., and Hunter, J. S., “Statistics for Experimenters,” John Wiley, New York, 1978. 4. Box, E. P., Jenkins, G. M., and Reinsel, G. C.: “Time Series Analysis”, John Wiley & Sons, 2008.

Statistical Nature of Unsteady Inlet Flows Turbulent Flow References
5. Monin, A. S., and Yaglom, A. M., “Statistical Fluid Mechanics”, The MIT Press, Cambridge, Massachusetts, 1971 6. George, W. K.: “Lectures in Turbulence for the 21st Century”, January, 2013.

The Statistical Nature of Inlet Buzz
Bernhard H. Anderson NASA Glenn Research Center
Cleveland, Ohio, 44135

LMCO Low Boom Supersonic Inlet Design Unsteady PFAIP Cane Curve, M0 = 1.70
Analysis of Inlet Buzz

The Role of Design-of-Experiments Methodology in Unsteady Inlet Flows
Bernhard H. Anderson
NASA Glenn Research Center Cleveland, Ohio, 44135

Maximum Error = -37.5% Case No. 508
Boeing Low Boom Supersonic Inlet Design Engine Corrected Airflow Systemic Errors Re = 8.068 x 10⁶, Scale ≈ 1/3, M0 = 1.80

The Role of Autocorrelations in Turbulent Flow Studies
Bernhard H. Anderson
NASA Glenn Research Center Cleveland, Ohio, 44135
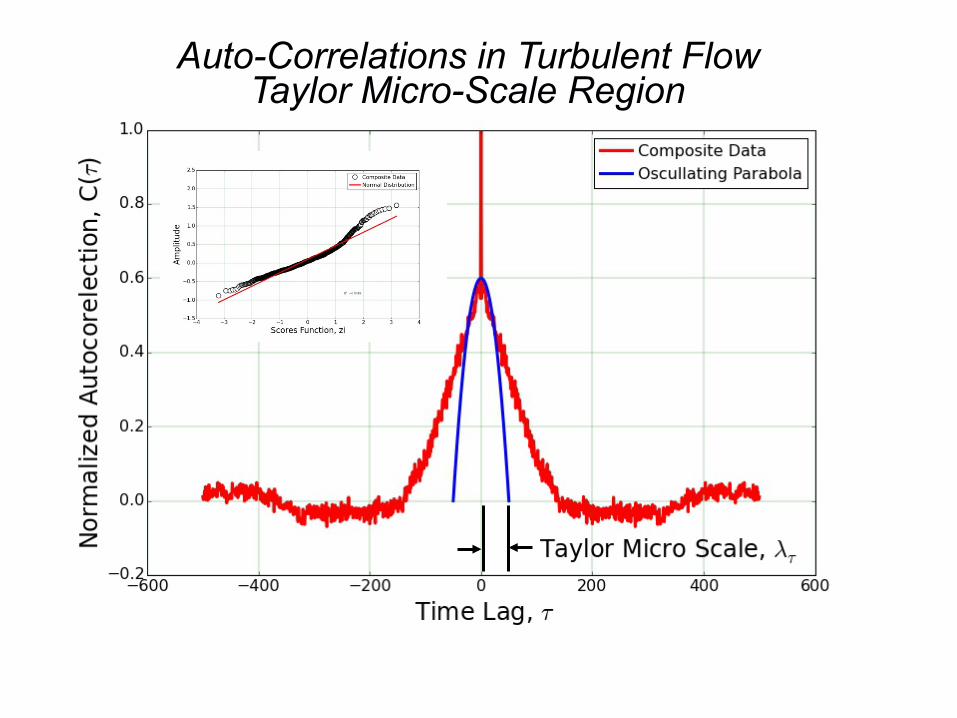
Auto-Correlations in Turbulent Flow Taylor Micro-Scale Region