Embed Size (px)
Citation preview
THE STATUS OF EDUCATION IN ZAMBIA REPORT: A SPECIAL FOCUS ON QUALITY OF EDUCATION
i
Contents Acknowledgements ...................................................................................................................................... iii
Abbreviations ............................................................................................................................................... iv
1.0 INTRODUCTION ....................................................................................................................................... 1
1.1 Background ......................................................................................................................................... 1
1.2 Objectives of the Study ....................................................................................................................... 1
1.3 Scope of the Study ........................................................................................................................ 1
1.4 Limitations of the Study ................................................................................................................ 2
3.0 METHODOLOGY ................................................................................................................................ 2
3.1 Sources of Data Collection ............................................................................................................ 2
3.2 Research Design ............................................................................................................................ 2
3.2.1 Qualitative and Quantitative Research Methodology .......................................................... 2
3.3. Data Analysis ................................................................................................................................. 2
4.0 LITERATURE REVIEW ......................................................................................................................... 3
4.1 Overview of Education Policy and Implementation Framework .................................................. 3
4.2 Perimeters for the Definition of Quality in Zambia ...................................................................... 4
4.3 The Indicators of Quality Education Used by the Ministry of General Education ........................ 4
4.4 The New Educational Quality Conceptual Framework for Ministry of General Education .......... 4
5.0 CURRENT PROGRESS MADE ON SET TARGETS ON QUALITY IN NATIONAL PLANS ........................... 6
5.1 Current Status of Education Sector Performance Indicators .............................................................. 6
5.2 Description of Some Key Quality Indicators ................................................................................. 7
5.2.1 Number of Schools and Teachers ......................................................................................... 7
5.2.2 Teacher Recruitment ............................................................................................................ 8
5.2.3 Progress on the Implementation of the New Curriculum ..................................................... 8
6.0 SUBSECTOR ANALYSIS OF THE QUALITY OF EDUCATION................................................................. 9
6.1 Access to Early Childhood Education ............................................................................................ 9
6.3 Quality of Early Childhood Education ........................................................................................... 9
6.2.1 Infrastructure ...................................................................................................................... 10
6.2.2 Water and Sanitation .......................................................................................................... 10
6.2.3 Playgrounds ......................................................................................................................... 10
6.2.4 Furniture ............................................................................................................................. 10
6.2.5 Equipment and Materials .................................................................................................... 10
6.3 Access to Primary Education ....................................................................................................... 10
ii
6.4 Quality of Primary Education ...................................................................................................... 11
6.4.1 Grade 2 National Assessment Survey ................................................................................. 11
6.4.2 Grade 5 National Assessments ........................................................................................... 12
6.4.3 Survival rate to Grade 5 ...................................................................................................... 12
6.4.4 Examination Pass rate at Grade 7 Level .............................................................................. 13
6.4.5 Pupil Book Ratio .................................................................................................................. 14
6.4.6 Pupil Teacher Ratio ............................................................................................................. 14
6.4.7 Pupil Classroom Ratio ......................................................................................................... 15
6.4.8 Contact Hours ..................................................................................................................... 15
6.5 Access to Secondary Education................................................................................................... 16
6.6 Quality of Education at Secondary School level ......................................................................... 16
6.6.1 Pupil Classroom ratio .......................................................................................................... 16
6.6.2 Pupil Text Book Ratio .......................................................................................................... 16
6.6.3 Pass rates ............................................................................................................................ 16
6.7 Access to Youth and Adult Literacy ............................................................................................. 18
6.8 Quality of Youth and Adult Literacy Education ........................................................................... 19
6.9 Quality of Tertiary Education ...................................................................................................... 19
7.0 EDUCATION FINANCING........................................................................................................................ 19
7.1 The Trend Analysis of the Education Budget Performance ........................................................ 19
7.2 The Trend analysis of Percentage allocations to the Education Budget ..................................... 20
Source: RNDP, multi-year estimates of expenditure and revenue and UNICEF 2016 budget brief ........ 20
7.3 Subsector Allocation of Education Budget ................................................................................. 20
7.5 General Education Budget Allocations, Releases and Expenditure ............................................ 21
7.6 Budget Allocation for Higher Education by Programme for 2015 and 2016 .............................. 23
7.7 Higher Education Expenditure Budget Releases and Expenditure ............................................. 24
8.0 CONCLUSION AND RECOMMENDATIONS ....................................................................................... 26
REFERENCES ................................................................................................................................................ 28

iii
Acknowledgements
iv
Abbreviations CPs - Cooperating Partners
ECE - Early Childhood Education
GCE - General Certificate of Education
ICT - Information and Communication Technology
MoF - Ministry of Finance
MoGE - Ministry of General Education
NIF - National Implementation Framework
SADC - Southern Africa Development Community
TEVET - Technical Education, Vocational and Entrepreneurship Training
TLMs - Teaching and Learning Materials
UNESCO - United Nations Education and Scientific Corporation
UNICEF - United national Children’s Fund
ZANEC - Zambia National Education Coalition
ZESSTA - Zambia’s Education Sector Support Technical Assistance Facility
1
1.0 INTRODUCTION
1.1 Background Education has always ranked high on the Zambian development agenda since independence in 1964. Every decade has seen major education policy pronouncements aimed at improving access to quality education for all which were all consolidated through the development of the National Education Policy, Educating our Future, in 1996 and the enactment of the Education Act of 2011. During the National Implementation Framework III from 2011 to 2015, government invested significant efforts in infrastructure development involving new constructions and upgrading of existing infrastructure. The infrastructure development programme has been impressive with an increase of 1% in the provision of new infrastructure at primary school level to about 4 % at secondary school level during the NIF III period (MoF 2013). Similarly, more emphasis was also placed on the training and deployment of teachers, leading to a marked increase especially in teachers attending in-service training. The strong commitment by government to improve the education system is also evidenced by the share of the national budget allocated to the education sector. These policies have brought about tremendous improvements in the sector. Major developments in the sector have included the continuous expansion of the education system particularly school enrollments at all levels especially after the declaration of free primary education in 2001. Currently, schools also receive grants directly although the allocation and subsequent releases of these funds are low and often delayed. Similarly, the procurement of textbooks and other materials has also increased although there are still critical challenges with the procurement policies and supply of quality textbooks especially under the revised curriculum. However, despite the steady increase in funding to the education sector and the sustained growth in enrolments, the education system continues to face numerous challenges such as the low quality of education and limited share of the education budget going towards service delivery. Concerns about the poor quality of education have been consistently highlighted in the findings of all the national assessment surveys that the Ministry of General Education (MoGE) has undertaken since 1999. Learning achievements have remained low with marginal increases in the overall scores from both the national assessments and examinations pass rates. Overall, the quality of education in Zambia has been compromised by various factors at all levels of the education system. It is on this basis that this study is designed to examine the current status of our education system, by subsector, with special reference to the quality of education during the period 2015 to 2016.
1.2 Objectives of the Study - To conduct a desk review on the perimeters that define quality of education within the Zambian
context; - To conduct an assessment of progress made towards the set targets around quality in the national
plans; - To analyse the budget allocations and disbursements to mitigate quality issues in the learning
institutions;
1.3 Scope of the Study The study first discusses the perimeters that define quality of education by providing a standard conceptual framework that is used by Zambia in the conceptualization of educational quality. More important also, the study distills information on the progress that Zambia has made towards the
2
attainment of its planned targets around quality as indicated in the NIF III documents at primary and secondary school levels. Similarly, the study also presents an analysis of the educational budget allocations and disbursements in the various subsectors. Due to the limited scope, the study discusses access and financing of education across all the subsectors.
1.4 Limitations of the Study The limitations of the study were as follows; - The study relied on secondary data only due to resource constraints in primary data collection
thereby limiting access to real time data and scope for investigating the elements of quality across learner characteristics, enabling inputs and outcomes.
- The data available was mainly for 2015 as the compilation of 2016 figures in some cases was still in the process and expected to be available in 2017.
3.0 METHODOLOGY
3.1 Sources of Data Collection The study was a desk study predominantly based on the collection of secondary data from various
existing research and statistics on the status of education at national level. Overall, the research
involved an extensive collection of secondary data from existing literature, publications and research
reports. The sources of secondary data were mainly institutional libraries such as from the World Bank
Library, Zambia National Education Coalition resource center, the Ministry of General Education,
University of Zambia, Examinations Council of Zambia and UNICEF among others.
3.2 Research Design In order to get a clear understanding of the status of education in Zambia, the research compared the current progress achieved at national level, provincial level as well as progress achieved in all the education subsectors namely early childhood education, primary, secondary, youth and adult literacy, skills development, tertiary and adult literacy. 3.2.1 Qualitative and Quantitative Research Methodology The study combined the use of both qualitative and quantitative research methods. The two techniques were determined by the nature of the national indicators used in measuring the performance of the education sector. Thus, both descriptive and numerical data was collected and presented accordingly. 3.3. Data Analysis A multi-layered analysis of the secondary data involved the classification of the data in three categories namely national, provincial and by subsector. Using these thematic classifications, the data was further organized in subthemes which formed the primary units of drafting the report using primary subheadings.
3
4.0 LITERATURE REVIEW
4.1 Overview of Education Policy and Implementation Framework
The implementation of programmes in the Education sector is currently guided by the National Education Policy of 1996 and the Education and Skills Development chapter of the Revised Sixth National Development Plan for the period 2013 to 2016. In addition, there are other subsector policies guiding the sector such the Free Primary Education (FPE) policy and the Re-entry Policy. The FPE provides for the removal of user fees, and examinations fees up to Grade 7. The policy also provides for the optional use of uniforms, unconditional readmission of out of school children and free education requisites such as exercise books, pencils, pens, and rubbers. Similarly, the Re-entry Policy provides for the retention of pregnant girls in school after delivery. The Patriotic Front government also made several key policy pronouncements after taking over the government leadership in 2011. These pronouncements include the abolition of Grade 9 examination fees, declaration of free education up to Grade 12 to be implemented in a phased approach, the change of the education structure from the 9-3-4 to 7-5-4 and the launch of a new curriculum framework in 2014. These policies provide the context within which the implementation of education programmes is undertaken. The current overarching framework for the implementation of the above policies is the National Implementation Framework (NIF III) for the period 2011 to 2015. The introduction of national implementation frameworks (NIF) was in part a call from Cooperating Partners’ (CP) demands for more detailed sector planning than what was provided for in the National Development Plans. The NIF was designed to serve as both a sector plan to meet funding and accountability requirements of CPs, as well as an implementation framework for the Ministry. The NIF III stipulated the following strategic priorities:
1. Access: achievement of EFA goals through the provision of additional facilities, including infrastructure development.
2. Quality: Enhancement of learning achievement through curriculum development, the provision of educational materials and teacher training and deployment.
3. Improving the efficiency and effectiveness of educational service delivery through the improved school and teacher management, the stimulation of teacher motivation and pupil retention and progression.
4. Equity: the promotion of equitable access through specific programmes targeted at girls and special needs education (MoGE 2010).
The NIF III was the first document that addressed all the subsectors from early childhood education through to university education, TEVET and Science, Technology and Innovation (STI). However NIF III has also been criticised among others for lack of emphasis on the University Education and TEVET subsectors, especially for having a limited conceptualization of the quality and to some extent equity issues. Another complimentary framework that has been used for sector planning and evaluation has been the Performance Assessment Framework (PAF) which is based on the NIF III and serves as a key mechanism for the annual performance review. The PAF has key performance indicators that underlay the improvement of access and quality of teaching and learning. Therefore, the assessment of the status of education for this report is based on the progress achieved so far on the national indicators contained in NIF III and the PAF.
4
4.2 Perimeters for the Definition of Quality in Zambia Amongst all the education indictors, quality is the most difficult aspect to measure. Often times, quality is erroneously attributed to the optimal provision of education inputs and not the learning achievements. According to this view, the Quality of education is high if the school is well-resourced with inputs such as highly qualified teachers, teaching and learning materials, infrastructure, relevant curriculum and students (World Bank Group 2015). At output level, assessment frameworks focus on measuring demonstrable competencies that benchmark performance and are perceived to provide insights on the quality of education provision. Therefore, the common outputs when measuring quality according to the economist view is the learner achievements based on the 3 R’s namely reading, writing and arithmetic. Learning achievements therefore become the most important indicator of quality education at output level. The perimeters that define quality of Zambia’s education have thus been based on National Assessment Survey examination scores of learners, completion rates, survival rates to Grade 5, examination pass rates, pupil book ratios, pupil classroom ratios and contact hours. Thus, Zambia’s conceptualization of quality education has for many years been predicated on the economist view of education which is based on the input-output model (Spoelder 2010).
4.3 The Indicators of Quality Education Used by the Ministry of General Education
The performance of the Zambian education system is monitored using a set of indicators that measure a number of aspects relating to the education system. The core indicators that the Ministry of General Education use mainly measure four aspects of the education system namely, Access and Participation, Quality, Efficiency of education delivery and Equity. It is however noteworthy to acknowledge that the quality indicators by and large have a biasness towards quantitative dimensions. Some of the indicators used to monitor quality of education are mainly by proxy and are ingredients for short-term educational products such as pupil teacher ratio, pupil classroom ratio, teacher class ratio, textbook pupil ratio, curriculum relevance, quality of teachers, learning achievement levels, percentage certificates and percent of students meeting the defined achievement levels (MoGE 2015a).
4.4 The New Educational Quality Conceptual Framework for Ministry of General Education
Though the inputs and outputs model has historically been the major assessment criteria for Zambia, investments in this model have resulted in very little improvements in the quality of education at all levels. As a result, there is currently a growing shift in focus towards the inclusion of genuine education outcomes, which although more complex and abstract, measure permanent changes relating to positive behavior, high productivity, and other qualities as espoused in the national education policy. Thus, Zambia recently adopted the UNESCO educational quality framework which draws most of its elements from the humanist educationalist model. The UNESCO model has been adopted by Zambia as part of the Standards and Evaluation Guidelines launched in 2015 by the Ministry of General Education. This model places more emphasis on the input-process-output view of quality. The model focusses on broader processes of learning involving learners, the learning environment, the teaching content, learning processes and outcomes (Spoelder 2009). The model is based on the human rights based approach to education which puts the learners, content and process at the center of quality improvement. Although basic cognitive skills and general knowledge are considered important, the undue emphasis placed on summative evaluations over the years is now being replaced by competency-based assessment procedures. Similarly, in the UNESCO model, schools are viewed as key sources of good attitudes and cultural values as espoused by Zambia’s new curriculum launched in 2014 which is premised on the use of local languages as media of instruction up to Grade 4. Thus, within this context of conceptualizing educational
5
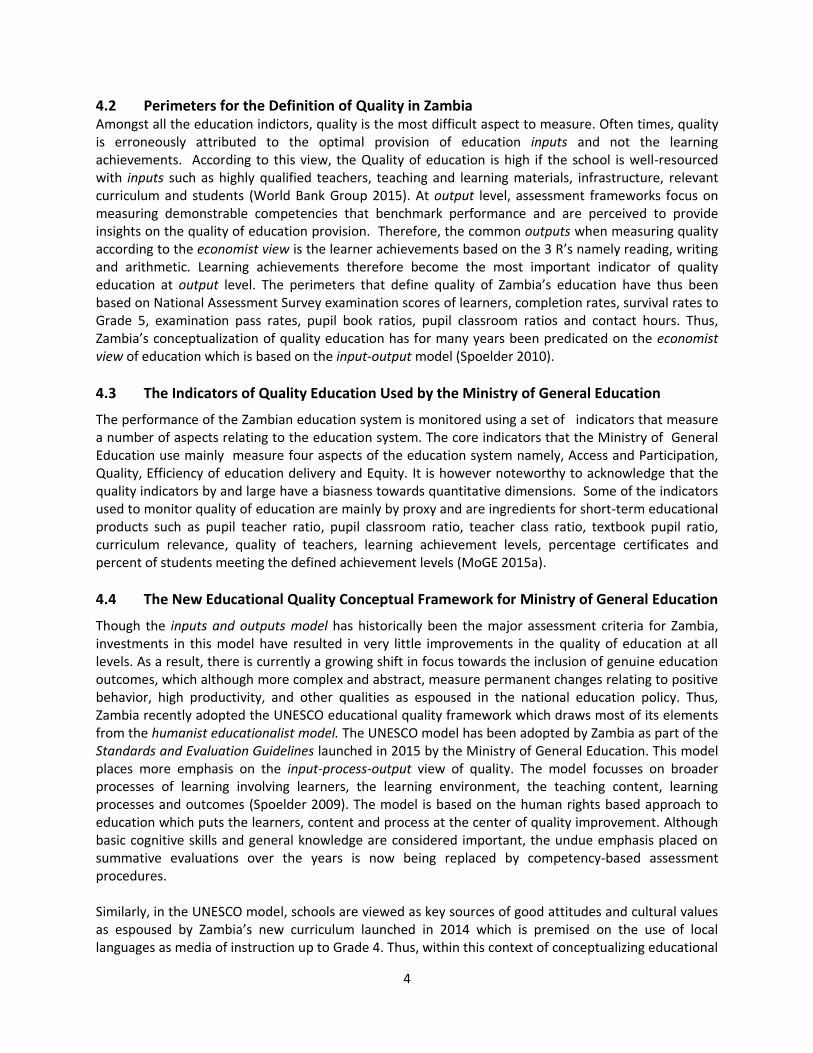
quality, MoGE in its Standards and Evaluation Guidelines describes quality education as; “education based on standards which help learners achieve their needs. It is education that enables learners meet their needs in life and in the community. Where there is quality education, children will be learning and getting better in knowledge, skills and values” (MoGE 2015b:13). This document is a product of a long process of education stakeholder consultations and participation. It is for this reason that this study adopts the perimeters of this framework premised on the understanding that successful quality improvements demand for a shared vision among stakeholders, including government, on the most important elements of quality (Spoelder 2010). Figure 1 below presents the conceptual framework of the UNESCO educational quality framework which also sets the perimeters for quality monitoring by ZANEC and other CSOs.
Source: MoGE 2015 Education Standards and Evaluation Guidelines
This framework posits education as a human right by emphasizing the importance of the needs and priorities of the learners, their families and communities. To this effect, the UNESCO vision of educational quality is influenced by four pillars namely; learning to know, learning to do, learning to live together and learning to be. It is important to state here that future assessments of quality by ZANEC and its members need to focus on establishing the status of all the quality elements detailed under learner characteristics, enabling inputs and outcomes in the above framework since these form the national standard and policy for conceptualizing quality. However, to successfully achieve this, the assessment will need to rely on both primary and secondary data as current data is biased towards
6
enabling outputs. This study, being a desk study, focused more on providing baseline quality indicators on enabling inputs with only few elements of outcomes namely literacy, numeracy and life skills for which secondary data is available (See Annex 1).
5.0 CURRENT PROGRESS MADE ON SET TARGETS ON QUALITY IN NATIONAL PLANS The NIF III (2011–2015) states that the main objectives of general education are to increase access, efficiency and equity and ensure quality in ECE, primary and secondary education. This section thus examines the enrolments and quality of education in the five education subsectors namely Early Childhood Education (ECE), primary school, secondary school, Youth and Adult Literacy and Tertiary Education subsectors.
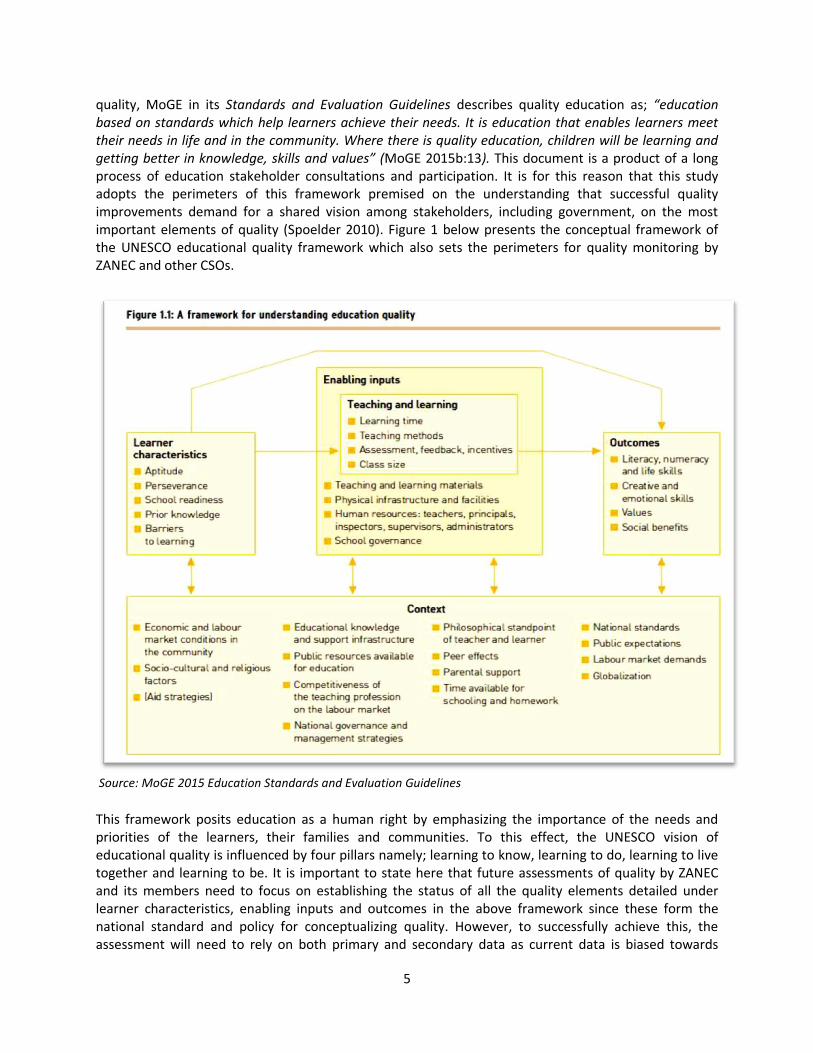
5.1 Current Status of Education Sector Performance Indicators As indicated in selected indicators on Table 1, of the 21 key performance targets that were to be
achieved by 2015 under NIF III, the Ministry managed to achieve 9 targets namely the Grade 7 repetition
rates, school enrolment at primary school level, pupil teacher ratios at all levels, completion rates at
Grade 9 as well as teacher numbers at Grade 1 to 7 and Grades 8 to 9. To the contrary, other indicators
such as the % number of pupils in community schools, the transition rates at Grade 7 to 8, transition
rates at Grade 9 to 10, enrolments for Grades 8 to 9 and enrolments for Grades 10-12 were not
achieved. Other targets that were not achieved are gross enrolment rate at Grades 1-7, completion rate
at Grade 7, completion rate at Grade 12, number of teachers at secondary school level and enrolments
in TEVET institutions. The reduction in the number of community school pupils by 3 percentage points
may be attributed to the upgrading of a number of community schools to government schools.
Table 1: Key Sector Indicators and their Status
Indicators Baseline in 2011
Target by 2015 Progress by 2015 Low Medium High
% of pupils in community schools 16% 10% 10% 5% 13%
Grade 7 Repetition 9.8% 8% 8% 8% 6%
Transition rates from G7 to G8 64% 75% 90% 90% 65%
Transition Rates from G9 to G10 53% 60% 65% 90% 46%
Pupil Teacher Ratio for Grade 1-7 51 47 45 40 42.7
Pupil Teacher Ratio for Grade 8-9 35 35 35 35 35.2
Pupil Teacher Ratio for Grade 10-12 29 35 35 35 35.2
Enrolments for G1 - G7 2,976,913 2,882,083 2,882,083 2,882,083 3,215,723
Enrolment for G8 - G9 429,455 514,566 593,990 593,990 470,961
Enrolment for G10 - G12 358,689 504,932 571,113 728,598 331,380
GER for G1 - G7 117.8% 109 109 109 111.2
GER for G8 - G9 67% 65 71 71 N/A
GER for G10 - G12 30% 43 45 52 45%
Completion rates G7 91% 85.2% 85.2% 85.2% 88.1%
Completion Rates G9 54% 56.9% 64.7% 64.7% 65.6%
Completion rates G12 25% 37% 39.8% 48.1% 36%
Teacher Numbers G1-7 46,737 52,123 54,439 64,847 75,236
Teacher Numbers G8-9 11,166 14,702 16,971 16,971 22,799
Teacher Numbers G10-12 11,626 28,263 21,474 27,395 -
7
TEVET Enrolment 58,057 22,753
University Enrolments 44,000 - Source: RNDP, MoGE 2015 Annual Performance Report and Draft NIF (IV)
5.2 Description of Some Key Quality Indicators
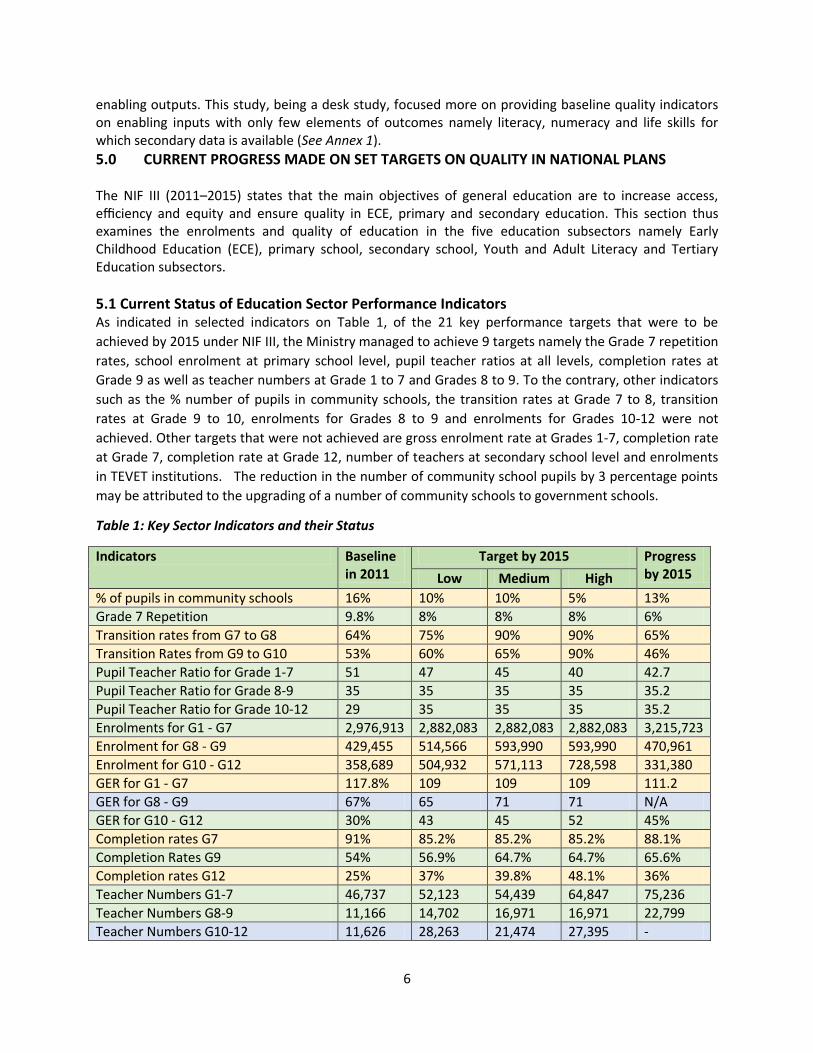
5.2.1 Number of Schools and Teachers According to the 2015 education statistical bulletin, the numbers of schools stood at 9,636 with half of these offering Grade 1 to 7 (primary), while slightly over a third were offering Grades 1 to 9 . The total number of students for all categories and at all levels stood at 4 million of which 80 percent were primary school going children. In terms of teachers, there were a total of 98,035 teachers in 2015 who were in active service. Majority of these teachers (75,236) were deployed at primary school level while 22,799 were at secondary school level. The teacher pupil ratios were higher at primary school level (42.7) than it was at secondary schooll level where the ratio stood at 35.2. However, the number of teachers as reflecetd by the 2015 Educational Statistical bulletin did not take into account the recruitment of the 5000 teachers that took place towards the end of 2015 . Implying that the total teacher numbers as at 2015 should stand at 103,035 insteady. It is also anticpated that these numbers would increase with the 2016 projected recruitment of 6000 teachers. Similarly, there were 8,804 primary schools against 832 secondary schools in 2015. The number of primary schools increased in 2015 by 50 schools representing an increase of 0.6 percent. Similarly, secondary schools increased by 38 more schools representing 4.8 % increase from the previous year. Overal, the increase in the number of schools between 2014 and 2015 was 88 representing an increase of 0.9 percent. The following table shows the number of schools, students, teachers and the pupil teacher ratios for 2015.
Table 1: Number of Schools and Teachers by Level- 2015
Classification Schools
2015 Students Teachers
Pupil/Teacher Ratio
Grade 1-4 467 2 029 813
Grade 1-7 3,681 3,215,723 75,236 42.7
Grade 1-9 2,811 3,686,684
Grade 1-12 64 4,018,064
Grade 8-9 15 470,961
Grade 8-12 392 802,341 22,799 35.2
Grade 10-12 21 331,380
Primary school Grades not stated
1830
Secondary Schools not stated 355
Total 9,636 4,018,064 98,035
Source: Education Statistical Bulletin 2015
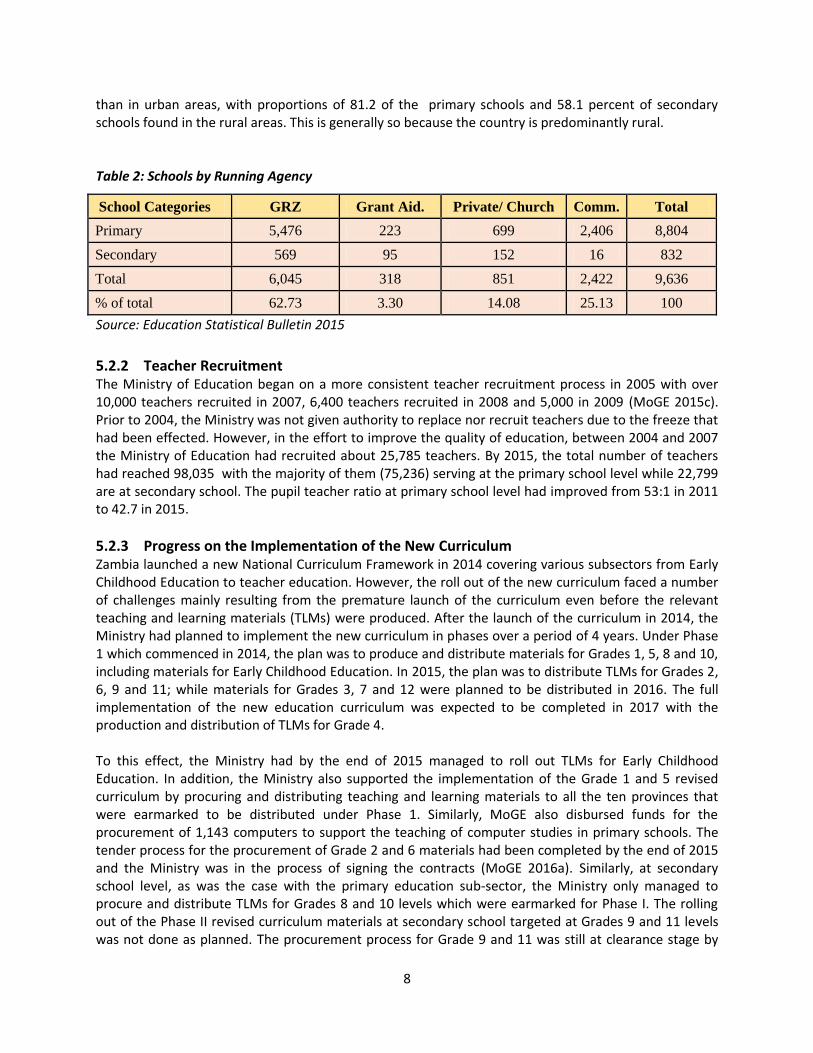
Government still remains the main provider of education in Zambia with about 62% of public schools, while grant aided schools consitute only 3%, while community school account for 25%. In terms of geographical distribution of schools by rural and urban, typically there are more schools in rural areas
8
than in urban areas, with proportions of 81.2 of the primary schools and 58.1 percent of secondary schools found in the rural areas. This is generally so because the country is predominantly rural. Table 2: Schools by Running Agency
School Categories GRZ Grant Aid. Private/ Church Comm. Total
Primary 5,476 223 699 2,406 8,804
Secondary 569 95 152 16 832
Total 6,045 318 851 2,422 9,636
% of total 62.73 3.30 14.08 25.13 100
Source: Education Statistical Bulletin 2015
5.2.2 Teacher Recruitment The Ministry of Education began on a more consistent teacher recruitment process in 2005 with over 10,000 teachers recruited in 2007, 6,400 teachers recruited in 2008 and 5,000 in 2009 (MoGE 2015c). Prior to 2004, the Ministry was not given authority to replace nor recruit teachers due to the freeze that had been effected. However, in the effort to improve the quality of education, between 2004 and 2007 the Ministry of Education had recruited about 25,785 teachers. By 2015, the total number of teachers had reached 98,035 with the majority of them (75,236) serving at the primary school level while 22,799 are at secondary school. The pupil teacher ratio at primary school level had improved from 53:1 in 2011 to 42.7 in 2015.
5.2.3 Progress on the Implementation of the New Curriculum Zambia launched a new National Curriculum Framework in 2014 covering various subsectors from Early Childhood Education to teacher education. However, the roll out of the new curriculum faced a number of challenges mainly resulting from the premature launch of the curriculum even before the relevant teaching and learning materials (TLMs) were produced. After the launch of the curriculum in 2014, the Ministry had planned to implement the new curriculum in phases over a period of 4 years. Under Phase 1 which commenced in 2014, the plan was to produce and distribute materials for Grades 1, 5, 8 and 10, including materials for Early Childhood Education. In 2015, the plan was to distribute TLMs for Grades 2, 6, 9 and 11; while materials for Grades 3, 7 and 12 were planned to be distributed in 2016. The full implementation of the new education curriculum was expected to be completed in 2017 with the production and distribution of TLMs for Grade 4. To this effect, the Ministry had by the end of 2015 managed to roll out TLMs for Early Childhood Education. In addition, the Ministry also supported the implementation of the Grade 1 and 5 revised curriculum by procuring and distributing teaching and learning materials to all the ten provinces that were earmarked to be distributed under Phase 1. Similarly, MoGE also disbursed funds for the procurement of 1,143 computers to support the teaching of computer studies in primary schools. The tender process for the procurement of Grade 2 and 6 materials had been completed by the end of 2015 and the Ministry was in the process of signing the contracts (MoGE 2016a). Similarly, at secondary school level, as was the case with the primary education sub-sector, the Ministry only managed to procure and distribute TLMs for Grades 8 and 10 levels which were earmarked for Phase I. The rolling out of the Phase II revised curriculum materials at secondary school targeted at Grades 9 and 11 levels was not done as planned. The procurement process for Grade 9 and 11 was still at clearance stage by
9
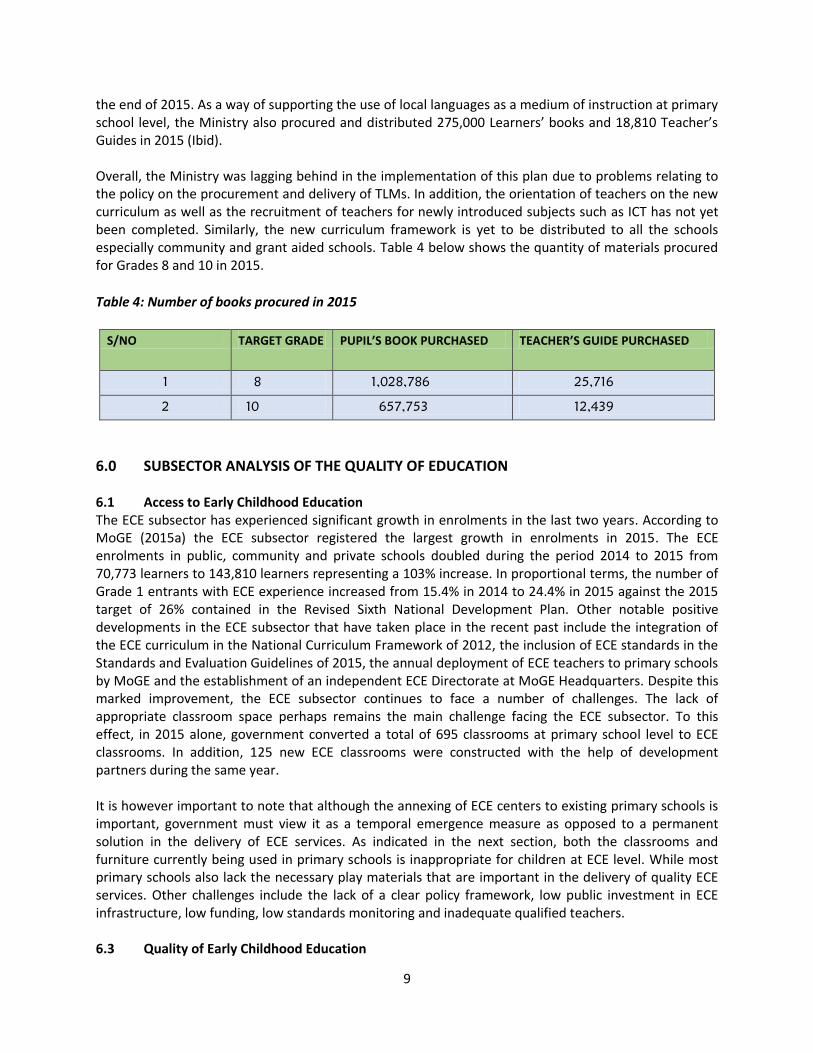
the end of 2015. As a way of supporting the use of local languages as a medium of instruction at primary school level, the Ministry also procured and distributed 275,000 Learners’ books and 18,810 Teacher’s Guides in 2015 (Ibid). Overall, the Ministry was lagging behind in the implementation of this plan due to problems relating to the policy on the procurement and delivery of TLMs. In addition, the orientation of teachers on the new curriculum as well as the recruitment of teachers for newly introduced subjects such as ICT has not yet been completed. Similarly, the new curriculum framework is yet to be distributed to all the schools especially community and grant aided schools. Table 4 below shows the quantity of materials procured for Grades 8 and 10 in 2015.
Table 4: Number of books procured in 2015
S/NO TARGET GRADE PUPIL’S BOOK PURCHASED TEACHER’S GUIDE PURCHASED
1 8 1,028,786 25,716
2 10 657,753 12,439
6.0 SUBSECTOR ANALYSIS OF THE QUALITY OF EDUCATION 6.1 Access to Early Childhood Education The ECE subsector has experienced significant growth in enrolments in the last two years. According to MoGE (2015a) the ECE subsector registered the largest growth in enrolments in 2015. The ECE enrolments in public, community and private schools doubled during the period 2014 to 2015 from 70,773 learners to 143,810 learners representing a 103% increase. In proportional terms, the number of Grade 1 entrants with ECE experience increased from 15.4% in 2014 to 24.4% in 2015 against the 2015 target of 26% contained in the Revised Sixth National Development Plan. Other notable positive developments in the ECE subsector that have taken place in the recent past include the integration of the ECE curriculum in the National Curriculum Framework of 2012, the inclusion of ECE standards in the Standards and Evaluation Guidelines of 2015, the annual deployment of ECE teachers to primary schools by MoGE and the establishment of an independent ECE Directorate at MoGE Headquarters. Despite this marked improvement, the ECE subsector continues to face a number of challenges. The lack of appropriate classroom space perhaps remains the main challenge facing the ECE subsector. To this effect, in 2015 alone, government converted a total of 695 classrooms at primary school level to ECE classrooms. In addition, 125 new ECE classrooms were constructed with the help of development partners during the same year. It is however important to note that although the annexing of ECE centers to existing primary schools is important, government must view it as a temporal emergence measure as opposed to a permanent solution in the delivery of ECE services. As indicated in the next section, both the classrooms and furniture currently being used in primary schools is inappropriate for children at ECE level. While most primary schools also lack the necessary play materials that are important in the delivery of quality ECE services. Other challenges include the lack of a clear policy framework, low public investment in ECE infrastructure, low funding, low standards monitoring and inadequate qualified teachers. 6.3 Quality of Early Childhood Education
10
The improvement of the quality of ECE has mainly focused on the implementation of the new curriculum as well as the recruitment of teachers. As part of the implementation of the new curriculum, the ministry distributed a total of 76,013 textbooks and 322,996 exercise books to 886 ECE centers countrywide in 2015 (MoGE 2016a). The Ministry also recruited and deployed only 25 ECE teachers against the planned 1,000 teachers in 2015 after the authority to recruit teachers was limited to the replacement of the teachers who had left the system due to either death or resignations. The status of other ECE quality standards contained in the Standards and Evaluation Guidelines is described below.
6.2.1 Infrastructure In terms of infrastructure standards, although ECE infrastructure is required to be of standard measurement, government has not yet developed the appropriate specifications. Thus, although most ECE providers generally keep their premises clean, much of the infrastructure has inadequate natural lighting and ventilation. Similarly, majority of the ECE centres, including the government ECE centres do not have kitchens and adequate resting or sleeping rooms within their premises.
6.2.2 Water and Sanitation The main quality standards here are age appropriate toilets, hand washing facilities, several clean and safe water points as well as the toilet to child ratio of 1:10. The general experience is that majority of centers have few clean and safe running water points, have a high toilet to child ratios and few designated hand washing facilities within the ECE centers.
6.2.3 Playgrounds The presence of a safe play park painted in attractive colors with a sand pit is yet another key quality standard which is important in the provision of a natural way of learning for children through play. The experience from majority of the centers show that only few centers have playgrounds within their premises. Most of them do not have safe playgrounds, while the few available playgrounds are mostly not painted in appropriate colors and are without sand pits.
6.2.4 Furniture According to the national quality standards, ECE centers must have age appropriate basic furniture mainly tables, chairs and carpets without any desks. To this effect, majority of the ECE centers have the appropriate type of furniture. However, in government supported ECE centers annexed to existing primary schools, the furniture is mostly the same as that meant for the primary school children and thus is not appropriate.
6.2.5 Equipment and Materials There are various materials and equipment that must be found in an ECE center in order to meet the prescribed national quality standards. Among them are age appropriate in-door and outdoor play equipment and toys; books and print materials; and first aid box. However, whereas majority of the ECE centers have first aid boxes and indoor play materials such as toys, most centers do not have outdoor play equipment such as swings, see-saws, merry-go-round and slides due to lack of playgrounds.
6.3 Access to Primary Education Zambia has experienced increased investment in primary school infrastructure over the years resulting in increased enrolment levels with the number of primary school children reaching 3, 215,723 by 2015, while the quality of education has remained low. The Ministry of General Education has since 2000 implemented ambitious plans aimed at improving access to education at primary school levels. Some
11
notable achievements include the abolition of school fees at primary school level, the annual recruitment of teachers and the implementation of an aggressive infrastructure development programme leading to the construction of several classrooms and teachers’ houses (MoGE 2016b). According to MoGE (2015a), the primary school Gross Enrolment Rate is currently at 120.8%, with overall enrolments reaching 3,215,723 by 2015, representing 93% of the children of school going age. This leaves only 249, 416 (7%) out-of-school children of primary school age. However, the 2015 enrolments represent a reduction in the number of pupils at primary school level from the 2014 enrolment figure of 3,691,486. Apart from increased investment in infrastructure and the pronouncement of free education at primary school level, the growth in primary school enrolments is also attributed to contributions by education providers such as community schools, Grant Aided institutions and the private sector. The major problem at primary school level has been the high dropout rates estimated at 1.6% in 2015. Drop-out rates are especially higher among girls than they are among the boys. Although there are almost an equal number of boys and girls at Grade 1 enrolment, more girls start dropping out of schools at Grade 4 level due to pregnancies, early marriages and the low parental value for the education of girls. In 2015 alone, a total of 11,989 girls fell pregnant, while the gender parity at primary school stood at 0.99. Although government has a Re-entry Policy which allows girls to go back to school after delivery, there are still many barriers that hinder pregnant girls’ retention in school. In 2015, only 5,217 girls were re-admitted in school after delivery, representing 44%. In addition, the number of school children with special education needs (CSEN) were 89,646 in 2015 representing about 3% of the total enrolment at primary schools level.
6.4 Quality of Primary Education The quality of education at primary school level has remained low with 2014 learning achievement figures stagnated below 40%, while there has been little improvement in teaching content, processes and school environments. Zambia’s top priority currently is to achieve efficient and quality universal primary education (UPE). However, despite the Country’s credible achievements in increasing enrolments, the disappointment for Zambia is that the quality of education remains very low at primary school level when considering the input-out indicators that are used to measure the quality of education. The key indicators used to measure quality in the Educational Statistical Bulletin produced by the Ministry of General Education annually are the examination pass rates, the survival rate to Grade 5, the pupil/book ratio, pupil/classroom ratio and the contact hours. In addition, the quality of education at primary school level is also measured through the National Assessments on pupils’ learning achievements conducted by the Examinations Council of Zambia every after two years. The current status of the quality of education at primary school level on the basis of the above out-put and input indicators are described in details below.
6.4.1 Grade 2 National Assessment Survey DFID et al (2014) conducted a national assessment for Grade 2 pupils in basic reading and numeracy. The results of this national assessment revealed that Grade 2 pupils had difficulties in reading fluently. The study reports an average reading fluency rate ranging from 1.84 to 8.40 words per minute. Overall, this entails that on average, a Grade 2 pupil could recognise a few words but have problems in stringing words from a passage into a logical sentence. In terms of numbers, the study found out that on average, Grade 2 pupils could identify about 13.3 numbers in a minute. Only 11.4% and 19.4% of the pupils scored zero in simple addition and subtraction respectively. However, both percentages increased to 49.5% and 60.7 % for addition and subtraction respectively for level two sub-tasks that required more techniques than just counting.
12
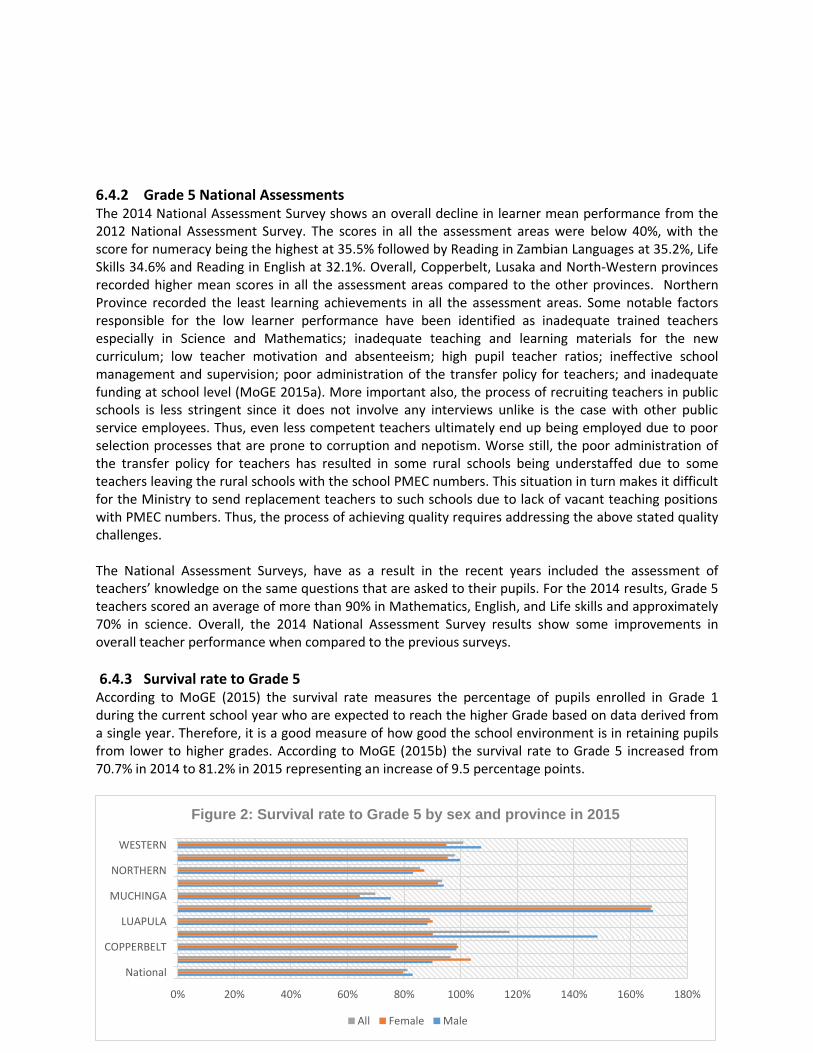
6.4.2 Grade 5 National Assessments The 2014 National Assessment Survey shows an overall decline in learner mean performance from the 2012 National Assessment Survey. The scores in all the assessment areas were below 40%, with the score for numeracy being the highest at 35.5% followed by Reading in Zambian Languages at 35.2%, Life Skills 34.6% and Reading in English at 32.1%. Overall, Copperbelt, Lusaka and North-Western provinces recorded higher mean scores in all the assessment areas compared to the other provinces. Northern Province recorded the least learning achievements in all the assessment areas. Some notable factors responsible for the low learner performance have been identified as inadequate trained teachers especially in Science and Mathematics; inadequate teaching and learning materials for the new curriculum; low teacher motivation and absenteeism; high pupil teacher ratios; ineffective school management and supervision; poor administration of the transfer policy for teachers; and inadequate funding at school level (MoGE 2015a). More important also, the process of recruiting teachers in public schools is less stringent since it does not involve any interviews unlike is the case with other public service employees. Thus, even less competent teachers ultimately end up being employed due to poor selection processes that are prone to corruption and nepotism. Worse still, the poor administration of the transfer policy for teachers has resulted in some rural schools being understaffed due to some teachers leaving the rural schools with the school PMEC numbers. This situation in turn makes it difficult for the Ministry to send replacement teachers to such schools due to lack of vacant teaching positions with PMEC numbers. Thus, the process of achieving quality requires addressing the above stated quality challenges. The National Assessment Surveys, have as a result in the recent years included the assessment of teachers’ knowledge on the same questions that are asked to their pupils. For the 2014 results, Grade 5 teachers scored an average of more than 90% in Mathematics, English, and Life skills and approximately 70% in science. Overall, the 2014 National Assessment Survey results show some improvements in overall teacher performance when compared to the previous surveys.
6.4.3 Survival rate to Grade 5 According to MoGE (2015) the survival rate measures the percentage of pupils enrolled in Grade 1 during the current school year who are expected to reach the higher Grade based on data derived from a single year. Therefore, it is a good measure of how good the school environment is in retaining pupils from lower to higher grades. According to MoGE (2015b) the survival rate to Grade 5 increased from 70.7% in 2014 to 81.2% in 2015 representing an increase of 9.5 percentage points.
0% 20% 40% 60% 80% 100% 120% 140% 160% 180%
National
COPPERBELT
LUAPULA
MUCHINGA
NORTHERN
WESTERN
Figure 2: Survival rate to Grade 5 by sex and province in 2015
All Female Male
13
Source: 2015 MoGE Educational Statistical Bulletin
As shown in the table, the 2015 survival rate for girls was lower than that of boys for majority of the provinces. Only Northern, Luapula and Central Provinces had higher survival rates for girls than that of boys. Meaning that the chances of girls’ retention up to the 5th Grade in three provinces was higher than that of boys.
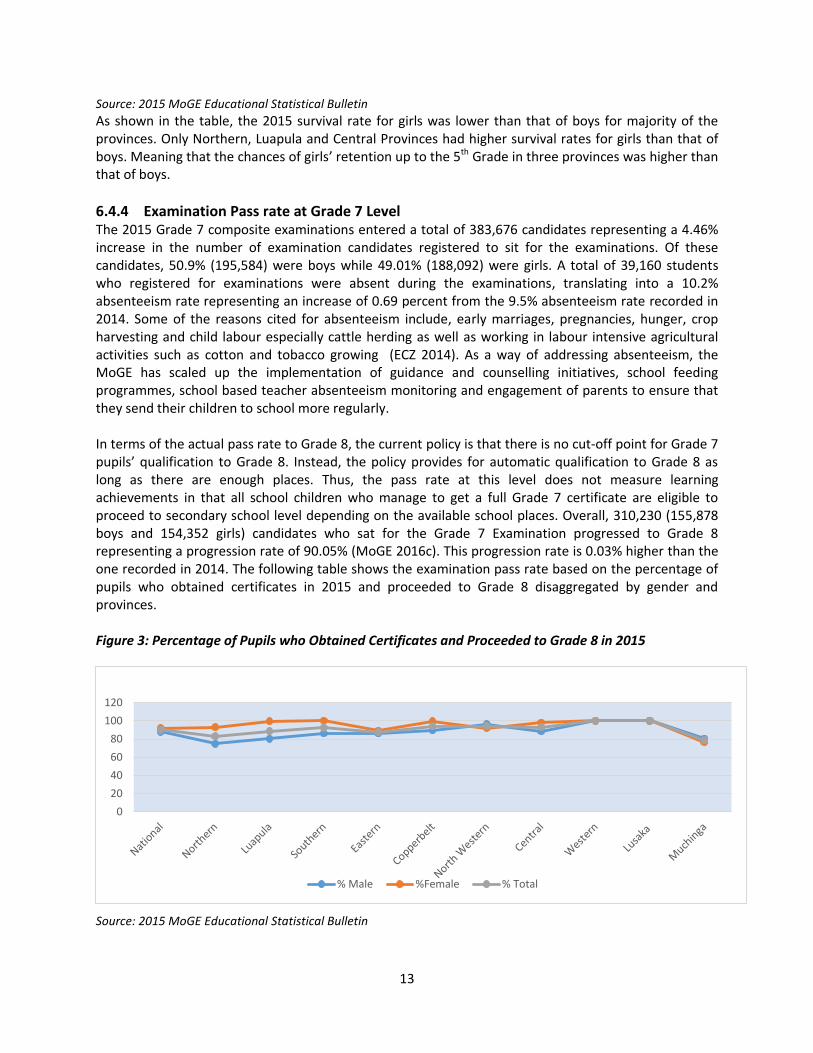
6.4.4 Examination Pass rate at Grade 7 Level The 2015 Grade 7 composite examinations entered a total of 383,676 candidates representing a 4.46% increase in the number of examination candidates registered to sit for the examinations. Of these candidates, 50.9% (195,584) were boys while 49.01% (188,092) were girls. A total of 39,160 students who registered for examinations were absent during the examinations, translating into a 10.2% absenteeism rate representing an increase of 0.69 percent from the 9.5% absenteeism rate recorded in 2014. Some of the reasons cited for absenteeism include, early marriages, pregnancies, hunger, crop harvesting and child labour especially cattle herding as well as working in labour intensive agricultural activities such as cotton and tobacco growing (ECZ 2014). As a way of addressing absenteeism, the MoGE has scaled up the implementation of guidance and counselling initiatives, school feeding programmes, school based teacher absenteeism monitoring and engagement of parents to ensure that they send their children to school more regularly. In terms of the actual pass rate to Grade 8, the current policy is that there is no cut-off point for Grade 7 pupils’ qualification to Grade 8. Instead, the policy provides for automatic qualification to Grade 8 as long as there are enough places. Thus, the pass rate at this level does not measure learning achievements in that all school children who manage to get a full Grade 7 certificate are eligible to proceed to secondary school level depending on the available school places. Overall, 310,230 (155,878 boys and 154,352 girls) candidates who sat for the Grade 7 Examination progressed to Grade 8 representing a progression rate of 90.05% (MoGE 2016c). This progression rate is 0.03% higher than the one recorded in 2014. The following table shows the examination pass rate based on the percentage of pupils who obtained certificates in 2015 and proceeded to Grade 8 disaggregated by gender and provinces. Figure 3: Percentage of Pupils who Obtained Certificates and Proceeded to Grade 8 in 2015
Source: 2015 MoGE Educational Statistical Bulletin
0
20
40
60
80
100
120
% Male %Female % Total
14
Overall, Figure 3, shows that the Grade 7 pass rate ranges between 78% and 100%, with Northern, Muchinga and Luapula provinces having the lowest pass rates, while Western and Lusaka provinces have the highest pass rates averaging 100%. In other words, all the children who were in Grade 7 in 2015 in Lusaka and Western Province proceeded to Grade 8. While, Northern, Muchinga and Luapula had the highest number of children who dropped out of school at Grade 7 level due to inadequate places at secondary school level. Similarly, the gender dimension of the pass rates shows that girls had the highest pass rates in almost all the provinces except in Northwestern and Muchinga provinces. The pass rates for both girls and boys was the same in Western and Lusaka provinces.
6.4.5 Pupil Book Ratio The lack of textbooks can be a major barrier to learning among pupils thereby impacting on the quality of the learning outcomes. A research by World Bank Group (2015) indicates that there is a great shortage of textbooks at primary school level in Zambia due to inadequate funding and systemic weaknesses in the execution of the textbook procurement policy. According to the 2015 Educational Statistical Bulletin, the pupil/book ratios for both English and Mathematics was at 4:1 in 2015. While the book ratios for Zambian Languages and Life Skills was 5:1 and 7:1 respectively. The figures show that there is little or in some cases, no difference at all in the pupil-to textbook ratios between urban and rural based primary schools. The main problem cited for the low pupil book ratio is that the current textbook procurement policy places the responsibility of delivering textbooks to publishers. As a result, the role of primary schools is limited to the submission of textbook orders to publishers through the District Education Board Secretaries (DEBS). This procurement policy has proved to be inefficient especially given the pressure brought about by the launch of a new curriculum framework in 2014 which requires new teaching and learning materials. As a result of these policy bottlenecks, the textbook shortages at primary school level are common. The survey conducted by the World Bank Group (2015) revealed that about 92% of the pupils and 16% of the teachers at Grade 5 level had no textbooks in Zambia mainly as a result of the inefficient delivery of books by the suppliers.
6.4.6 Pupil Teacher Ratio According to the MOGE (2016a), 2,351 primary school teachers were recruited in 2015 bringing the total number of teachers to 75,236. This resulted in the reduction of the pupil teacher ratio to 42.7 in 2015 from 55.3 in 2014 against the set target ratio of 40. The pupil teacher ratio, according to the Grade of the school, averaged 40 pupils per teacher for Grade 1 Schools; 45 pupils per teacher for urban schools; and 51 pupils per teacher for rural Grade 2 schools. Grade 5 schools had 43 pupils per teacher for urban schools against 37 pupils for rural schools; while Grade 7 schools had a pupil teacher ratio of 39 and 31 pupils for rural and urban schools respectively (World Bank Group 2015). The Ministry also reported that a total of 991 primary school administrators were trained in Education Leadership and Management (ELM) to equipping them with quality management skills against the target of 700. One of the problems affecting the pupil teacher ratio is the high attrition rate resulting from teacher loss due to retirements, resignations, deaths and promotion to management positions. The attrition rate reduced from 8, 351 in 2014 to the all-time low of 6,835 in 2015. This reduction may be attributed to the progress made by the MoGE in the implementation of the policy on the increased retirement age from 60 to 65 years leading to the reduction in the loss of teachers due to retirements.
15
6.4.7 Pupil Classroom Ratio The number of classes gradually decrease as you move from Grade 1 to 7. Despite the large investments made in the development of infrastructure at primary school level over the years, the pupil classroom ratio has increased from 36.9 to 41.8 over the last five years. This increase is attributed to the policy shift from the basic and high school system to the current primary and secondary school system which has resulted in the upgrading of 220 primary schools into secondary schools. Other infrastructure availability in Primary schools shows that 75% of the schools have potable water, 36% have electricity. In addition, the ratio of latrines shows that currently 83 boys are sharing one latrine, there are 75 girls sharing one latrine (MoGE 2015a).
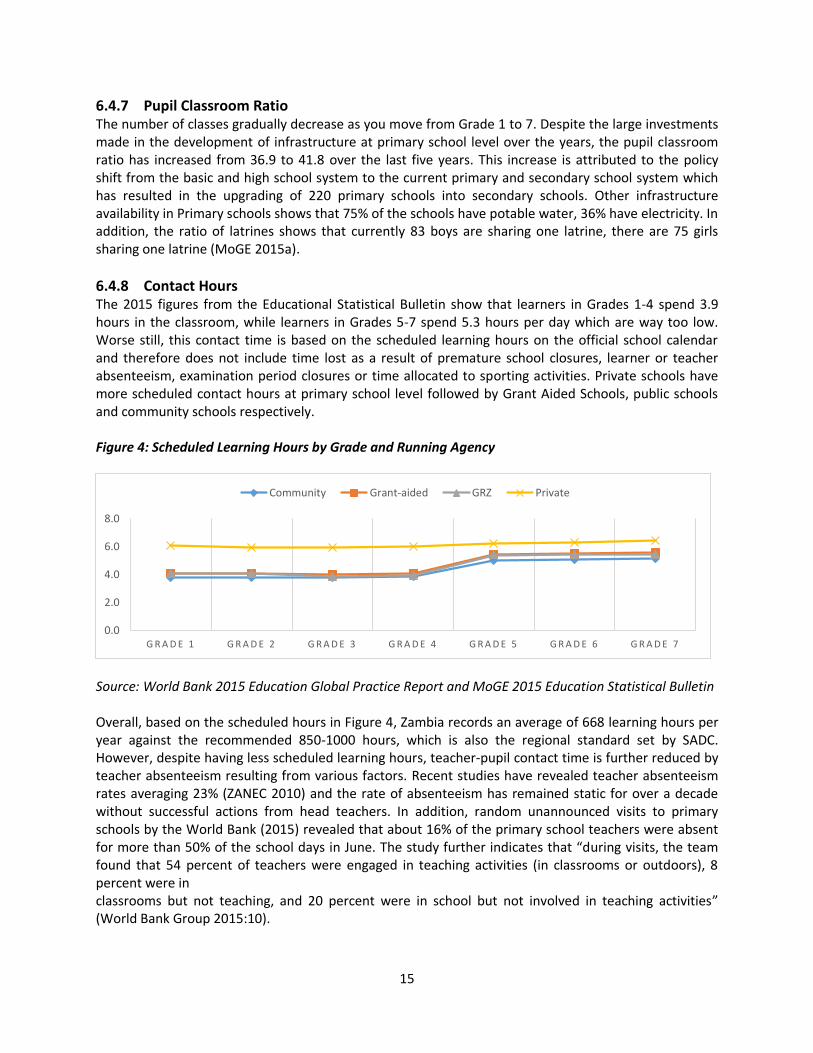
6.4.8 Contact Hours The 2015 figures from the Educational Statistical Bulletin show that learners in Grades 1-4 spend 3.9 hours in the classroom, while learners in Grades 5-7 spend 5.3 hours per day which are way too low. Worse still, this contact time is based on the scheduled learning hours on the official school calendar and therefore does not include time lost as a result of premature school closures, learner or teacher absenteeism, examination period closures or time allocated to sporting activities. Private schools have more scheduled contact hours at primary school level followed by Grant Aided Schools, public schools and community schools respectively. Figure 4: Scheduled Learning Hours by Grade and Running Agency
Source: World Bank 2015 Education Global Practice Report and MoGE 2015 Education Statistical Bulletin Overall, based on the scheduled hours in Figure 4, Zambia records an average of 668 learning hours per year against the recommended 850-1000 hours, which is also the regional standard set by SADC. However, despite having less scheduled learning hours, teacher-pupil contact time is further reduced by teacher absenteeism resulting from various factors. Recent studies have revealed teacher absenteeism rates averaging 23% (ZANEC 2010) and the rate of absenteeism has remained static for over a decade without successful actions from head teachers. In addition, random unannounced visits to primary schools by the World Bank (2015) revealed that about 16% of the primary school teachers were absent for more than 50% of the school days in June. The study further indicates that “during visits, the team found that 54 percent of teachers were engaged in teaching activities (in classrooms or outdoors), 8 percent were in classrooms but not teaching, and 20 percent were in school but not involved in teaching activities” (World Bank Group 2015:10).
0.0
2.0
4.0
6.0
8.0
G R A D E 1 G R A D E 2 G R A D E 3 G R A D E 4 G R A D E 5 G R A D E 6 G R A D E 7
Community Grant-aided GRZ Private
16
6.5 Access to Secondary Education Zambia has a serious shortage of secondary school places resulting from inadequate investment in infrastructure over the years. As a result, access to secondary education is more costly compared to primary schools due to limited school places. Despite the upgrading of 220 primary schools into junior secondary schools brought about by the policy change from the basic and high school education system to the primary and secondary school education system, there is still a serious shortage of secondary school places in Zambia. According to World Bank Group (2015:2), “the current number of secondary schools can accommodate only about 30 percent of the current students in grades 1–5”. However, figures from the Educational Statistical Bulletin show a marked increase in both the number of secondary schools and enrollments. The data shows that there were 794 secondary schools in 2014 enrolling 327,980 pupils. In 2015, the number of secondary schools increased to 832 with a total enrollment of 802,341 representing an increase of 5% and 144% in the number of schools and enrollment respectively. The increase is mainly due to the inclusion of the Grades 8 and 9 enrollments under the secondary school subsector. Currently, 88% of the lower secondary schools were part of the basic school subsector in 2013 (World Bank Group 2015).
6.6 Quality of Education at Secondary School level
6.6.1 Pupil Classroom ratio The number of classrooms available at secondary school level is lower than at primary school level. In 2015, there were 9,904 classrooms at secondary school level compared to 9,473 classrooms in 2014 representing an annual increase of 431 classrooms. The increase in the number of classrooms is also attributed to the conversion of the 220 basic schools into junior secondary schools. Equally, the pupil classroom ratio has increased at Grades 8-9 and grades 10-12 from 52 in 2014 to 47 in 2015. Overall, there is an average of 58 pupils per class at secondary school level. In addition, 93% of the schools are connected to portable water, 56% to electricity, while the pupil toilet ratio is at 73 for boys and 67 for girls (World Bank Group 2015). In addition, only 28% of the schools have library facilities, with only 22% having science laboratories.
6.6.2 Pupil Text Book Ratio About 20% of the pupils at secondary school level have textbooks. The individual subject ratios are however different with 20% of pupils having mathematics and science textbooks, while 34% have English textbooks. The actual number of pupils per textbook for the four main subjects namely English, Life skills, mathematics and Zambia language is 4, 24, 6 and 9 at secondary school respectively. Therefore, the greatest need for textbooks at secondary school level is in Life skills and Zambian Languages respectively. The book procurement policy for secondary schools is favorable in that it provides for the direct purchase of textbooks by school managements from the book publishers. The publishers are however still responsible for the delivery of textbooks in schools. The problem however is that the cost of delivery of books to the schools is in most cases not provided for in the budgetary allocations. This means that some money meant for books is instead spent on the delivery of books.
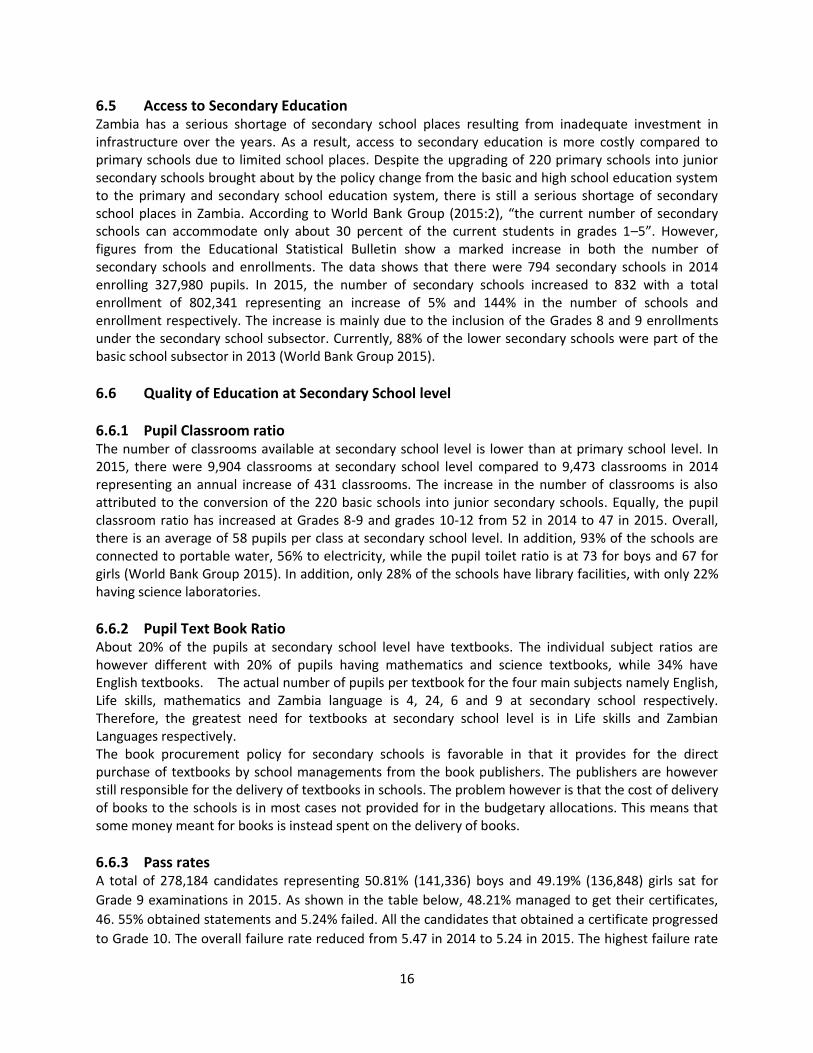
6.6.3 Pass rates A total of 278,184 candidates representing 50.81% (141,336) boys and 49.19% (136,848) girls sat for
Grade 9 examinations in 2015. As shown in the table below, 48.21% managed to get their certificates,
46. 55% obtained statements and 5.24% failed. All the candidates that obtained a certificate progressed
to Grade 10. The overall failure rate reduced from 5.47 in 2014 to 5.24 in 2015. The highest failure rate
17
recorded was in Mathematics and Science subjects averaging 39.12%. MoGE (2016a) attributes this
failure rate to a limited number of science and mathematics teachers as well as inadequate laboratories
that are equipped with the relevant materials. The highest performance was recorded in vocational
subjects especially Agriculture Science; Technology; Home Economics and Hospitality; Performing and
Creative Arts; and Physical Education and Sports compared to theoretical subjects.
Table 5: Pass Rates at Grade 9 Level
CERTIFICATE CLASSIFICATION BOYS GIRLS TOTAL
Certificates 70,699 (50.02%) 63,424 (46.35%) 134,123 (48.21%)
Statements 63,514 (44.94%) 65,973 (48.21%) 129,487 (46.55%)
Fail 7,123 (5.04%) 7,451 (5.44%) 14,574 (5.24%)
Source: MoGE 2015 Education Statistical Bulletin
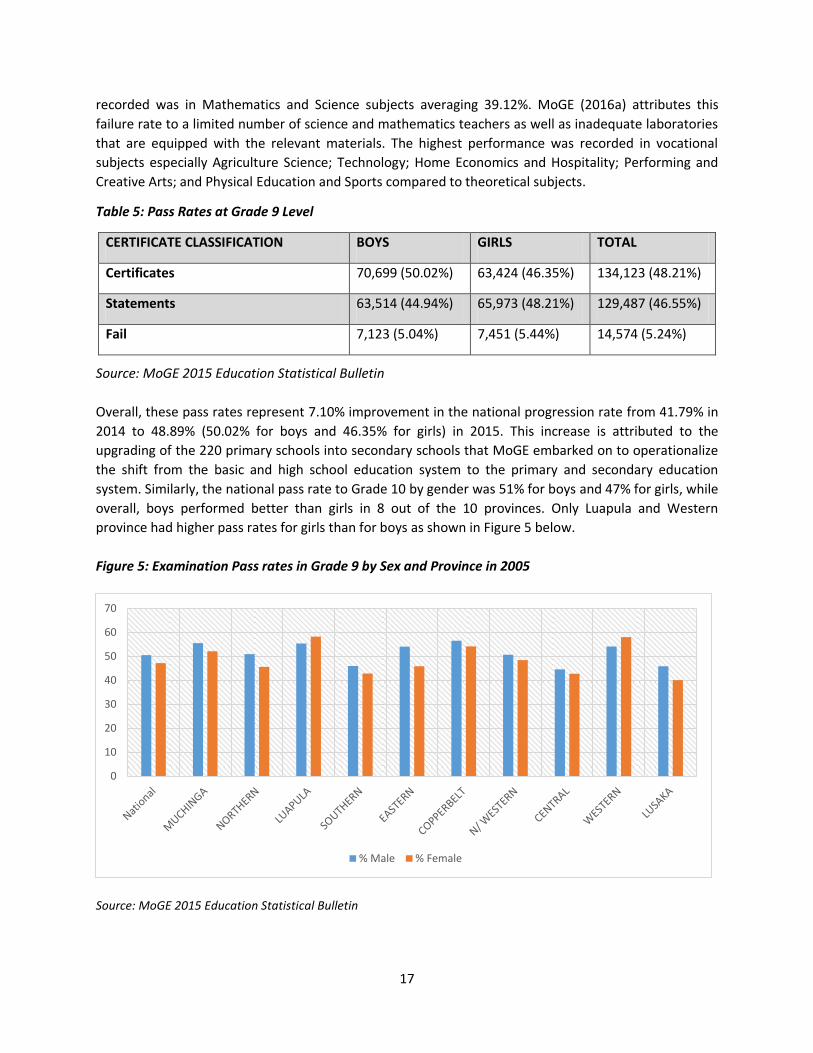
Overall, these pass rates represent 7.10% improvement in the national progression rate from 41.79% in
2014 to 48.89% (50.02% for boys and 46.35% for girls) in 2015. This increase is attributed to the
upgrading of the 220 primary schools into secondary schools that MoGE embarked on to operationalize
the shift from the basic and high school education system to the primary and secondary education
system. Similarly, the national pass rate to Grade 10 by gender was 51% for boys and 47% for girls, while
overall, boys performed better than girls in 8 out of the 10 provinces. Only Luapula and Western
province had higher pass rates for girls than for boys as shown in Figure 5 below.
Figure 5: Examination Pass rates in Grade 9 by Sex and Province in 2005
Source: MoGE 2015 Education Statistical Bulletin
0
10
20
30
40
50
60
70
% Male % Female
18
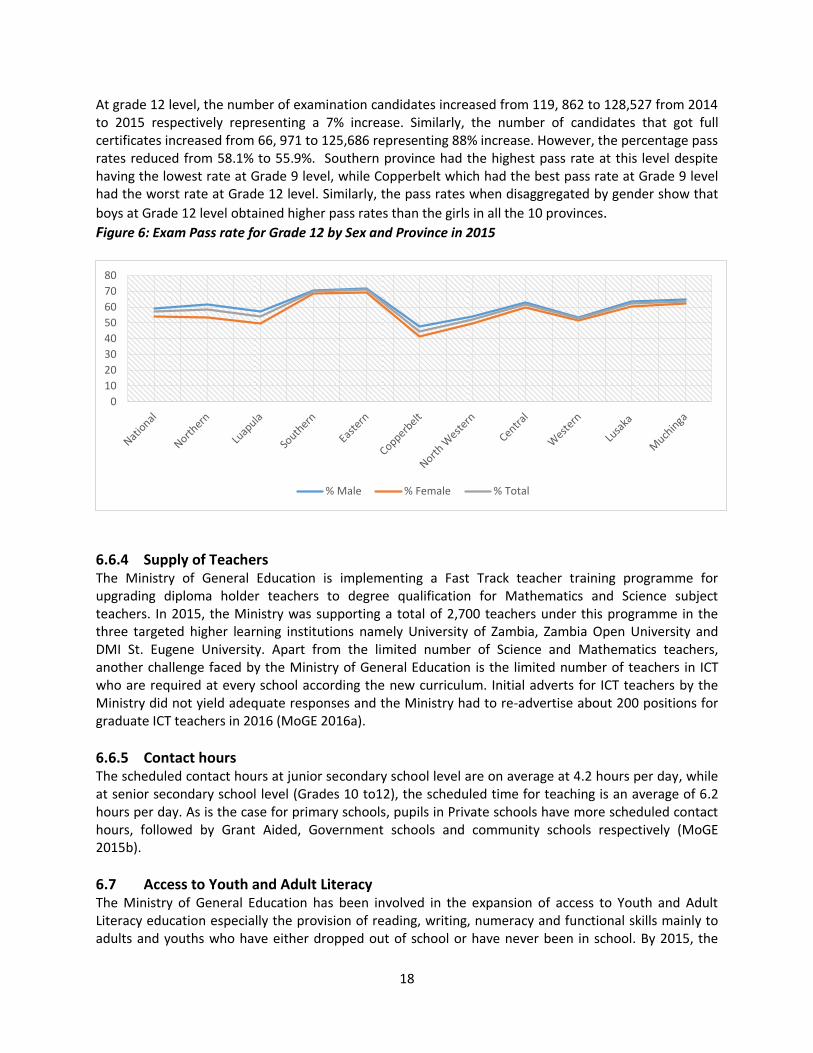
At grade 12 level, the number of examination candidates increased from 119, 862 to 128,527 from 2014 to 2015 respectively representing a 7% increase. Similarly, the number of candidates that got full certificates increased from 66, 971 to 125,686 representing 88% increase. However, the percentage pass rates reduced from 58.1% to 55.9%. Southern province had the highest pass rate at this level despite having the lowest rate at Grade 9 level, while Copperbelt which had the best pass rate at Grade 9 level had the worst rate at Grade 12 level. Similarly, the pass rates when disaggregated by gender show that
boys at Grade 12 level obtained higher pass rates than the girls in all the 10 provinces. Figure 6: Exam Pass rate for Grade 12 by Sex and Province in 2015
6.6.4 Supply of Teachers The Ministry of General Education is implementing a Fast Track teacher training programme for upgrading diploma holder teachers to degree qualification for Mathematics and Science subject teachers. In 2015, the Ministry was supporting a total of 2,700 teachers under this programme in the three targeted higher learning institutions namely University of Zambia, Zambia Open University and DMI St. Eugene University. Apart from the limited number of Science and Mathematics teachers, another challenge faced by the Ministry of General Education is the limited number of teachers in ICT who are required at every school according the new curriculum. Initial adverts for ICT teachers by the Ministry did not yield adequate responses and the Ministry had to re-advertise about 200 positions for graduate ICT teachers in 2016 (MoGE 2016a).
6.6.5 Contact hours The scheduled contact hours at junior secondary school level are on average at 4.2 hours per day, while at senior secondary school level (Grades 10 to12), the scheduled time for teaching is an average of 6.2 hours per day. As is the case for primary schools, pupils in Private schools have more scheduled contact hours, followed by Grant Aided, Government schools and community schools respectively (MoGE 2015b).
6.7 Access to Youth and Adult Literacy The Ministry of General Education has been involved in the expansion of access to Youth and Adult Literacy education especially the provision of reading, writing, numeracy and functional skills mainly to adults and youths who have either dropped out of school or have never been in school. By 2015, the
0
10
20
30
40
50
60
70
80
% Male % Female % Total
19
Ministry was running 2,215 literacy centers with a total of 288,814 learners enrolled in open learning GCE and evening classes; basic literacy adult literacy centres; school for continuing education, academic and vocational skills; and distance learning centres (MoGE 2016b). The key targets for this subsector were the construction of 10 schools for continuing education and rehabilitation of 13 existing centres of continuing education. These targets were designed to increase enrolments in Adult Literacy Centres country wide from 41,893 in 2007 to 60,000 by 2015. However, information from the Draft NIF IV document shows that none of these targets were achieved due inadequate funding to the subsector.
6.8 Quality of Youth and Adult Literacy Education One of the major achievements of the Ministry in promoting the quality of youth and adult literacy is the investment in teaching and learning materials. In 2015, “the Ministry developed, produced and distributed adult literacy teaching and learning materials, established adult literacy centres, trained adult literacy teachers/ facilitators, and established tele-centres to empower adult literacy learners with ICT and life skills” (MoGE 2016c:31) . In addition, the Ministry trained 491 teachers/facilitators in youth and adult literacy techniques out of the targeted number of 800 teachers. The target could not be met mainly due to inadequate funding.
6.9 Quality of Tertiary Education The Government plan in the Sixth National Development Plan was to expand distance learning and increase admissions for privately funded students in public and private universities. This policy focus ultimately resulted in the proliferation of private tertiary institutions leading to increased enrolments in both public and tertiary institutions. Unfortunately, the increase in enrolment coupled with inadequate qualified staff; inadequate and dilapidated classroom space; lack of quality standards and lack of a relevant curriculum compromised the quality of tertiary education. Although the current student / lecturer ratio stands at 18:1 which is acceptable, the quality of tertiary education has remained low given the low qualifications of some lecturers especially in private institutions, less stringent admission requirements, over-enrolment, inadequate faculty and the disconnect between theory and practice in the teaching and learning processes. To this effect, in describing the quality of tertiary education in Zambia, OSISA (2013:29) indicates that “The quality of education delivery is quite poor. Many of the institutions are in in a state of despair, with broken down workshops and laboratories. Even the quality of teachers entering these institutions is highly questionable”. However, one of the most important developments that has taken place in addressing the quality of tertiary education is the development of the National Qualifications Framework and the subsequent establishment of the National Qualifications Authority which is responsible for monitoring and regulating the quality of education in tertiary institutions.
7.0 EDUCATION FINANCING 7.1 The Trend Analysis of the Education Budget Performance The analysis of the 2016 education budget shows that education was allocated ZMW9, 143 million which represents 17.2 % of the national budget and about 4% of GDP. Of this allocation, 98.7% of the budget projected to be funded from domestic revenue, while 1.3% was going to be funded by the Cooperating Partners. The allocation for 2016 reduced by ZMW290 million, representing a 3% reduction in absolute terms from the 2015 allocation. The budget allocation was also lower than the SADC recommended minimum threshold of either 20% of the national budget allocation, or 6% of GDP. The intra budget analysis also shows that of the total amount allocated to the sector in 2016, 84% will be spent on
20
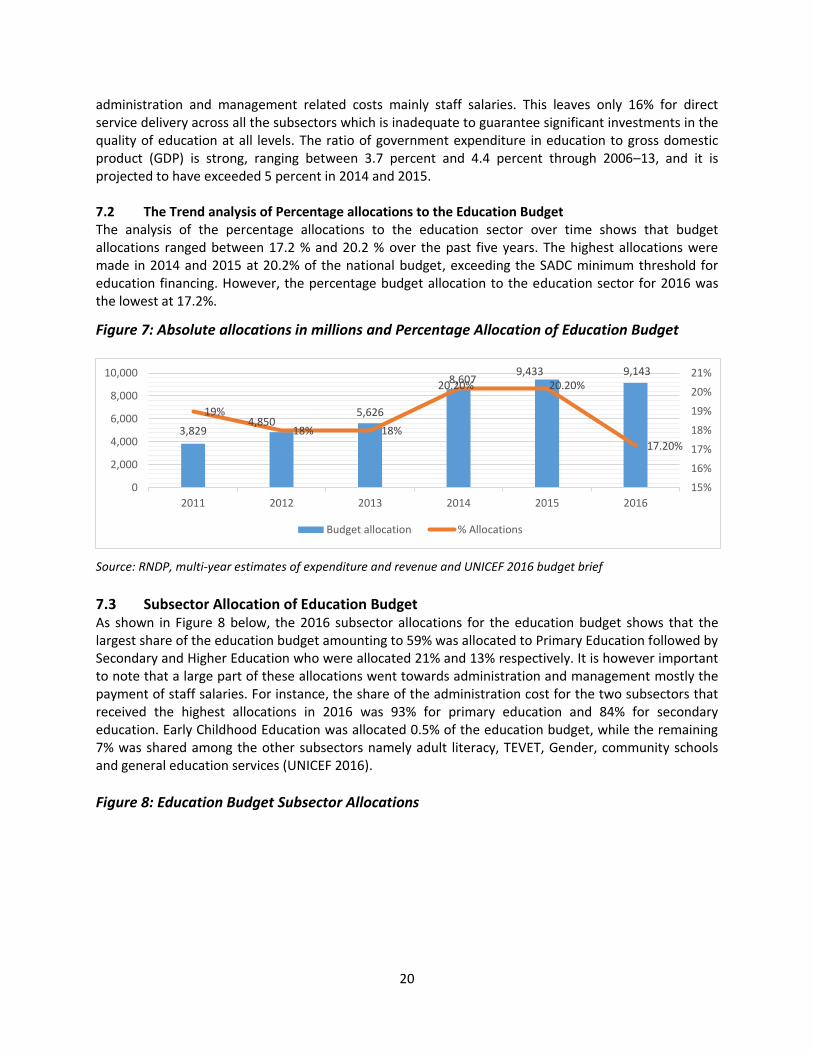
administration and management related costs mainly staff salaries. This leaves only 16% for direct service delivery across all the subsectors which is inadequate to guarantee significant investments in the quality of education at all levels. The ratio of government expenditure in education to gross domestic product (GDP) is strong, ranging between 3.7 percent and 4.4 percent through 2006–13, and it is projected to have exceeded 5 percent in 2014 and 2015. 7.2 The Trend analysis of Percentage allocations to the Education Budget The analysis of the percentage allocations to the education sector over time shows that budget allocations ranged between 17.2 % and 20.2 % over the past five years. The highest allocations were made in 2014 and 2015 at 20.2% of the national budget, exceeding the SADC minimum threshold for education financing. However, the percentage budget allocation to the education sector for 2016 was the lowest at 17.2%.
Figure 7: Absolute allocations in millions and Percentage Allocation of Education Budget
Source: RNDP, multi-year estimates of expenditure and revenue and UNICEF 2016 budget brief
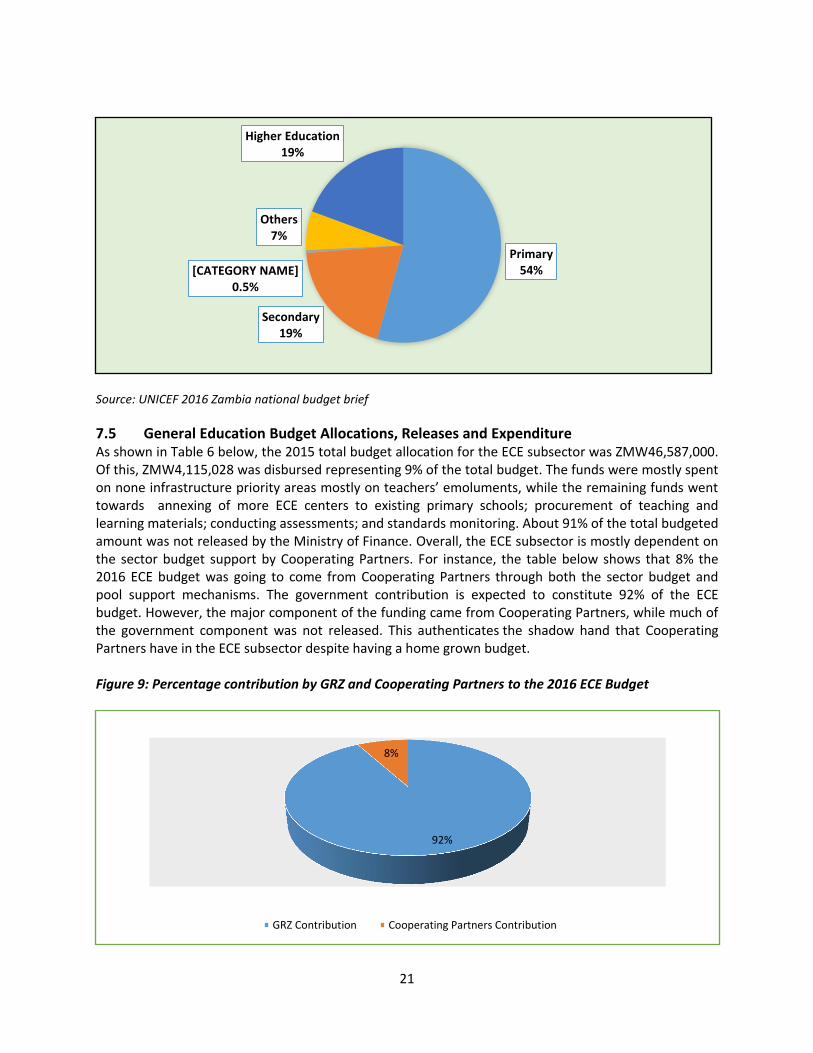
7.3 Subsector Allocation of Education Budget As shown in Figure 8 below, the 2016 subsector allocations for the education budget shows that the largest share of the education budget amounting to 59% was allocated to Primary Education followed by Secondary and Higher Education who were allocated 21% and 13% respectively. It is however important to note that a large part of these allocations went towards administration and management mostly the payment of staff salaries. For instance, the share of the administration cost for the two subsectors that received the highest allocations in 2016 was 93% for primary education and 84% for secondary education. Early Childhood Education was allocated 0.5% of the education budget, while the remaining 7% was shared among the other subsectors namely adult literacy, TEVET, Gender, community schools and general education services (UNICEF 2016).
Figure 8: Education Budget Subsector Allocations
3,829 4,850
5,626
8,607 9,433 9,143
19%
18% 18%
20.20% 20.20%
17.20%
15%
16%
17%
18%
19%
20%
21%
0
2,000
4,000
6,000
8,000
10,000
2011 2012 2013 2014 2015 2016
Budget allocation % Allocations
21
Source: UNICEF 2016 Zambia national budget brief
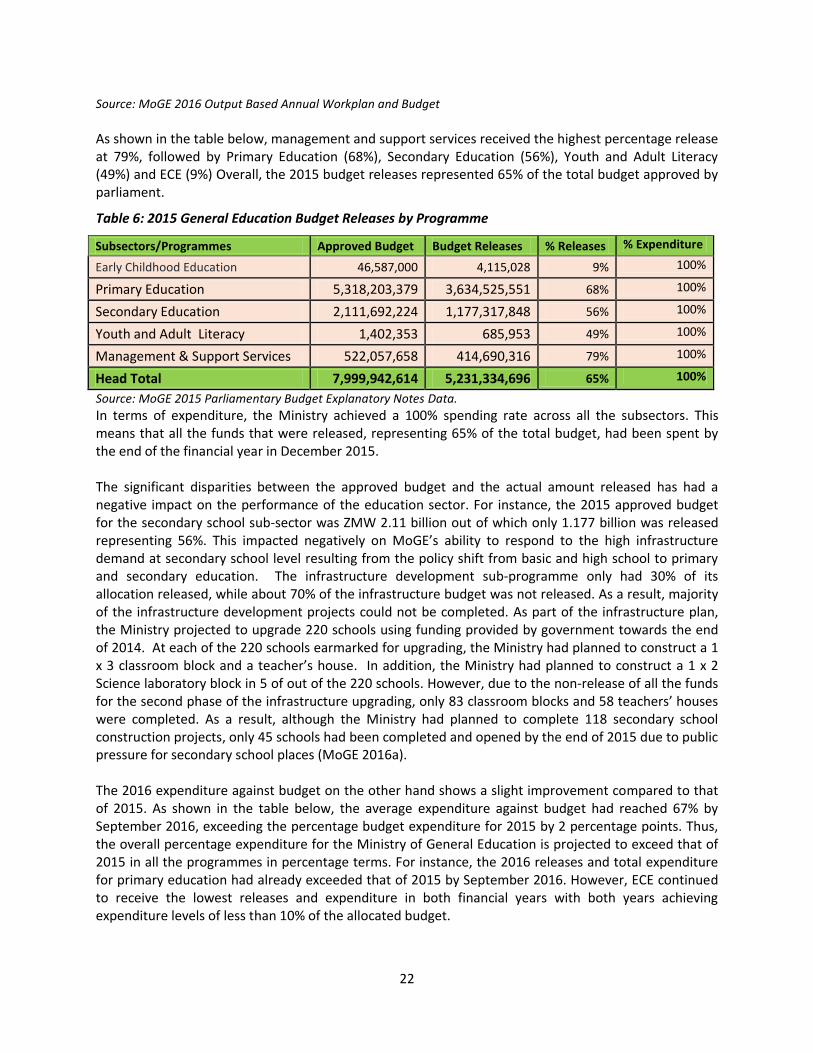
7.5 General Education Budget Allocations, Releases and Expenditure As shown in Table 6 below, the 2015 total budget allocation for the ECE subsector was ZMW46,587,000. Of this, ZMW4,115,028 was disbursed representing 9% of the total budget. The funds were mostly spent on none infrastructure priority areas mostly on teachers’ emoluments, while the remaining funds went towards annexing of more ECE centers to existing primary schools; procurement of teaching and learning materials; conducting assessments; and standards monitoring. About 91% of the total budgeted amount was not released by the Ministry of Finance. Overall, the ECE subsector is mostly dependent on the sector budget support by Cooperating Partners. For instance, the table below shows that 8% the 2016 ECE budget was going to come from Cooperating Partners through both the sector budget and pool support mechanisms. The government contribution is expected to constitute 92% of the ECE budget. However, the major component of the funding came from Cooperating Partners, while much of the government component was not released. This authenticates the shadow hand that Cooperating Partners have in the ECE subsector despite having a home grown budget. Figure 9: Percentage contribution by GRZ and Cooperating Partners to the 2016 ECE Budget
92%
8%
GRZ Contribution Cooperating Partners Contribution
Primary 54%
Secondary 19%
[CATEGORY NAME] 0.5%
Others 7%
Higher Education 19%
22
Source: MoGE 2016 Output Based Annual Workplan and Budget
As shown in the table below, management and support services received the highest percentage release at 79%, followed by Primary Education (68%), Secondary Education (56%), Youth and Adult Literacy (49%) and ECE (9%) Overall, the 2015 budget releases represented 65% of the total budget approved by parliament.
Table 6: 2015 General Education Budget Releases by Programme
Subsectors/Programmes Approved Budget Budget Releases % Releases % Expenditure
Early Childhood Education 46,587,000 4,115,028 9% 100%
Primary Education 5,318,203,379 3,634,525,551 68% 100%
Secondary Education 2,111,692,224 1,177,317,848 56% 100%
Youth and Adult Literacy 1,402,353 685,953 49% 100%
Management & Support Services 522,057,658 414,690,316 79% 100%
Head Total 7,999,942,614 5,231,334,696 65% 100%
Source: MoGE 2015 Parliamentary Budget Explanatory Notes Data.
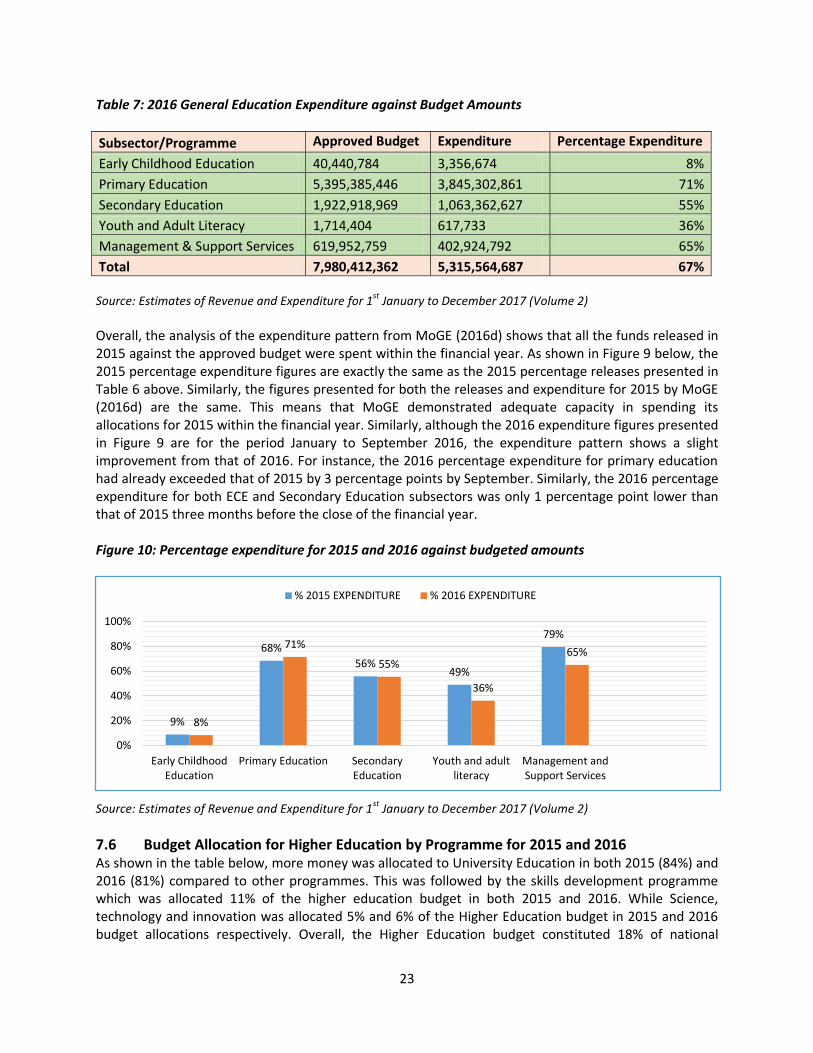
In terms of expenditure, the Ministry achieved a 100% spending rate across all the subsectors. This means that all the funds that were released, representing 65% of the total budget, had been spent by the end of the financial year in December 2015. The significant disparities between the approved budget and the actual amount released has had a negative impact on the performance of the education sector. For instance, the 2015 approved budget for the secondary school sub-sector was ZMW 2.11 billion out of which only 1.177 billion was released representing 56%. This impacted negatively on MoGE’s ability to respond to the high infrastructure demand at secondary school level resulting from the policy shift from basic and high school to primary and secondary education. The infrastructure development sub-programme only had 30% of its allocation released, while about 70% of the infrastructure budget was not released. As a result, majority of the infrastructure development projects could not be completed. As part of the infrastructure plan, the Ministry projected to upgrade 220 schools using funding provided by government towards the end of 2014. At each of the 220 schools earmarked for upgrading, the Ministry had planned to construct a 1 x 3 classroom block and a teacher’s house. In addition, the Ministry had planned to construct a 1 x 2 Science laboratory block in 5 of out of the 220 schools. However, due to the non-release of all the funds for the second phase of the infrastructure upgrading, only 83 classroom blocks and 58 teachers’ houses were completed. As a result, although the Ministry had planned to complete 118 secondary school construction projects, only 45 schools had been completed and opened by the end of 2015 due to public pressure for secondary school places (MoGE 2016a). The 2016 expenditure against budget on the other hand shows a slight improvement compared to that of 2015. As shown in the table below, the average expenditure against budget had reached 67% by September 2016, exceeding the percentage budget expenditure for 2015 by 2 percentage points. Thus, the overall percentage expenditure for the Ministry of General Education is projected to exceed that of 2015 in all the programmes in percentage terms. For instance, the 2016 releases and total expenditure for primary education had already exceeded that of 2015 by September 2016. However, ECE continued to receive the lowest releases and expenditure in both financial years with both years achieving expenditure levels of less than 10% of the allocated budget.
23
Table 7: 2016 General Education Expenditure against Budget Amounts
Subsector/Programme Approved Budget Expenditure Percentage Expenditure
Early Childhood Education 40,440,784 3,356,674 8%
Primary Education 5,395,385,446 3,845,302,861 71%
Secondary Education 1,922,918,969 1,063,362,627 55%
Youth and Adult Literacy 1,714,404 617,733 36%
Management & Support Services 619,952,759 402,924,792 65%
Total 7,980,412,362 5,315,564,687 67% Source: Estimates of Revenue and Expenditure for 1
st January to December 2017 (Volume 2)
Overall, the analysis of the expenditure pattern from MoGE (2016d) shows that all the funds released in 2015 against the approved budget were spent within the financial year. As shown in Figure 9 below, the 2015 percentage expenditure figures are exactly the same as the 2015 percentage releases presented in Table 6 above. Similarly, the figures presented for both the releases and expenditure for 2015 by MoGE (2016d) are the same. This means that MoGE demonstrated adequate capacity in spending its allocations for 2015 within the financial year. Similarly, although the 2016 expenditure figures presented in Figure 9 are for the period January to September 2016, the expenditure pattern shows a slight improvement from that of 2016. For instance, the 2016 percentage expenditure for primary education had already exceeded that of 2015 by 3 percentage points by September. Similarly, the 2016 percentage expenditure for both ECE and Secondary Education subsectors was only 1 percentage point lower than that of 2015 three months before the close of the financial year. Figure 10: Percentage expenditure for 2015 and 2016 against budgeted amounts
Source: Estimates of Revenue and Expenditure for 1st
January to December 2017 (Volume 2)
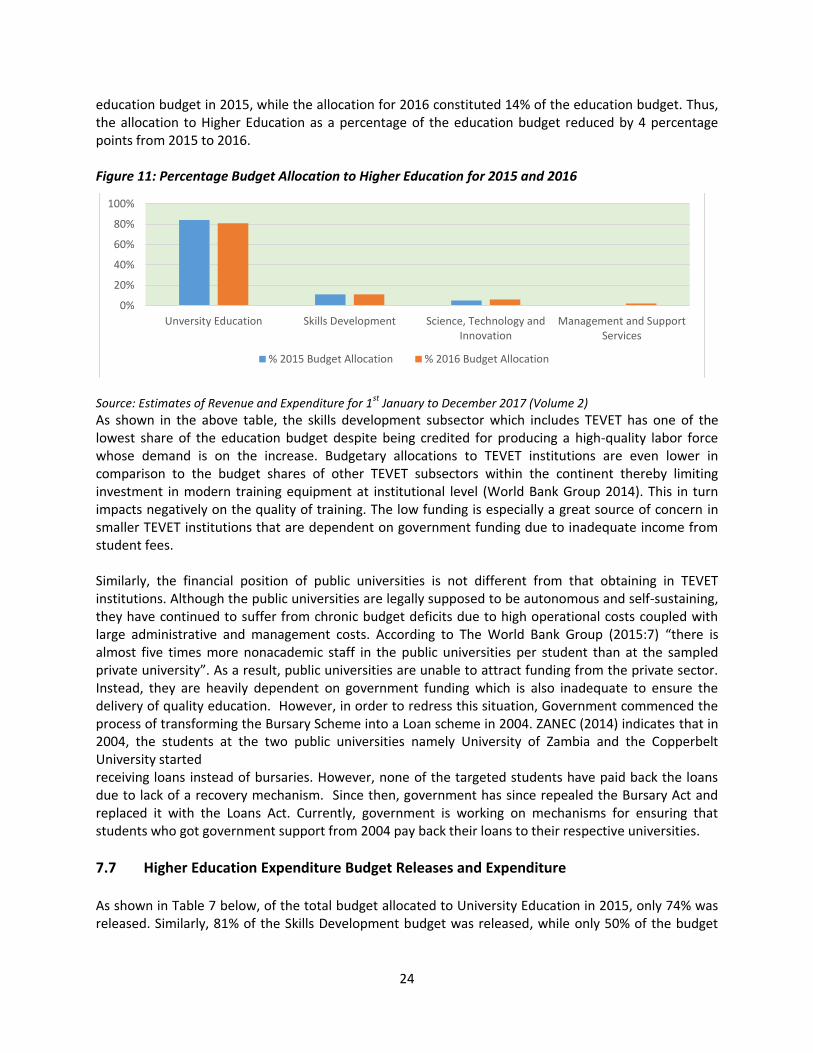
7.6 Budget Allocation for Higher Education by Programme for 2015 and 2016 As shown in the table below, more money was allocated to University Education in both 2015 (84%) and 2016 (81%) compared to other programmes. This was followed by the skills development programme which was allocated 11% of the higher education budget in both 2015 and 2016. While Science, technology and innovation was allocated 5% and 6% of the Higher Education budget in 2015 and 2016 budget allocations respectively. Overall, the Higher Education budget constituted 18% of national
9%
68%
56% 49%
79%
8%
71%
55%
36%
65%
0%
20%
40%
60%
80%
100%
Early ChildhoodEducation
Primary Education SecondaryEducation
Youth and adultliteracy
Management andSupport Services
% 2015 EXPENDITURE % 2016 EXPENDITURE
24
education budget in 2015, while the allocation for 2016 constituted 14% of the education budget. Thus, the allocation to Higher Education as a percentage of the education budget reduced by 4 percentage points from 2015 to 2016. Figure 11: Percentage Budget Allocation to Higher Education for 2015 and 2016
Source: Estimates of Revenue and Expenditure for 1
st January to December 2017 (Volume 2)
As shown in the above table, the skills development subsector which includes TEVET has one of the lowest share of the education budget despite being credited for producing a high-quality labor force whose demand is on the increase. Budgetary allocations to TEVET institutions are even lower in comparison to the budget shares of other TEVET subsectors within the continent thereby limiting investment in modern training equipment at institutional level (World Bank Group 2014). This in turn impacts negatively on the quality of training. The low funding is especially a great source of concern in smaller TEVET institutions that are dependent on government funding due to inadequate income from student fees. Similarly, the financial position of public universities is not different from that obtaining in TEVET institutions. Although the public universities are legally supposed to be autonomous and self-sustaining, they have continued to suffer from chronic budget deficits due to high operational costs coupled with large administrative and management costs. According to The World Bank Group (2015:7) “there is almost five times more nonacademic staff in the public universities per student than at the sampled private university”. As a result, public universities are unable to attract funding from the private sector. Instead, they are heavily dependent on government funding which is also inadequate to ensure the delivery of quality education. However, in order to redress this situation, Government commenced the process of transforming the Bursary Scheme into a Loan scheme in 2004. ZANEC (2014) indicates that in 2004, the students at the two public universities namely University of Zambia and the Copperbelt University started receiving loans instead of bursaries. However, none of the targeted students have paid back the loans due to lack of a recovery mechanism. Since then, government has since repealed the Bursary Act and replaced it with the Loans Act. Currently, government is working on mechanisms for ensuring that students who got government support from 2004 pay back their loans to their respective universities.
7.7 Higher Education Expenditure Budget Releases and Expenditure As shown in Table 7 below, of the total budget allocated to University Education in 2015, only 74% was released. Similarly, 81% of the Skills Development budget was released, while only 50% of the budget
0%
20%
40%
60%
80%
100%
Unversity Education Skills Development Science, Technology andInnovation
Management and SupportServices
% 2015 Budget Allocation % 2016 Budget Allocation
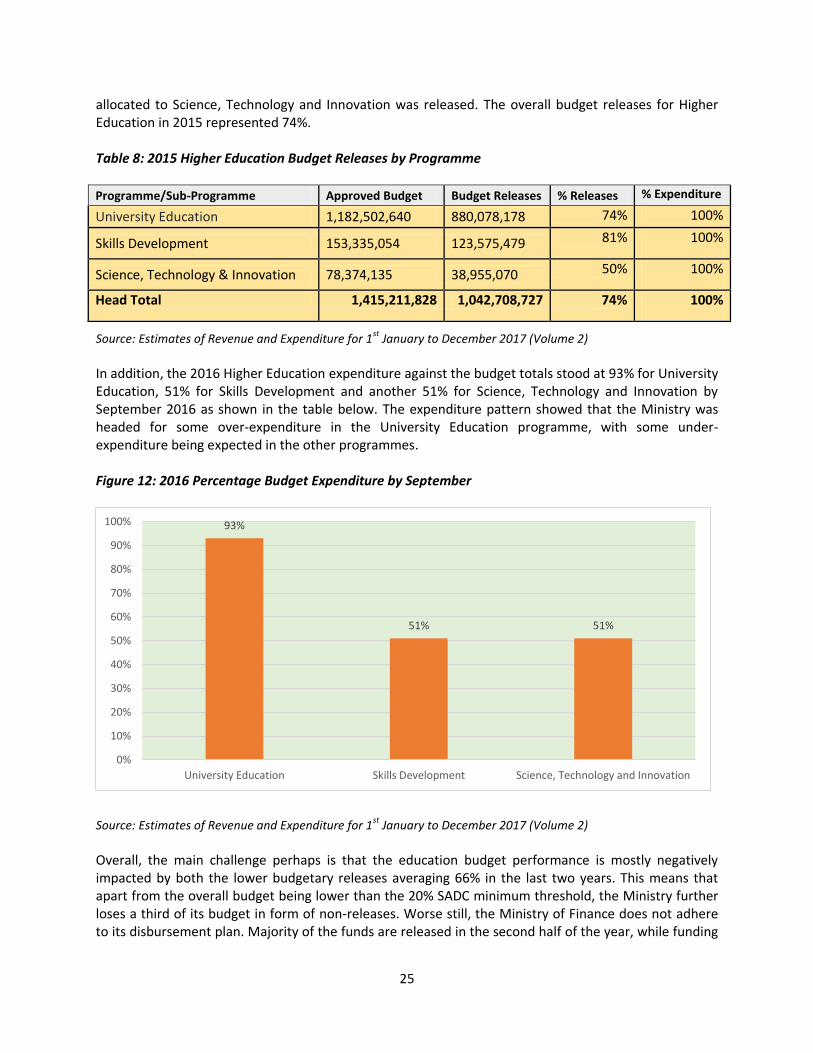
25
allocated to Science, Technology and Innovation was released. The overall budget releases for Higher Education in 2015 represented 74%. Table 8: 2015 Higher Education Budget Releases by Programme
Programme/Sub-Programme Approved Budget Budget Releases % Releases % Expenditure
University Education 1,182,502,640 880,078,178 74% 100%
Skills Development 153,335,054 123,575,479 81% 100%
Science, Technology & Innovation 78,374,135 38,955,070 50% 100%
Head Total 1,415,211,828 1,042,708,727 74% 100%
Source: Estimates of Revenue and Expenditure for 1st
January to December 2017 (Volume 2)
In addition, the 2016 Higher Education expenditure against the budget totals stood at 93% for University Education, 51% for Skills Development and another 51% for Science, Technology and Innovation by September 2016 as shown in the table below. The expenditure pattern showed that the Ministry was headed for some over-expenditure in the University Education programme, with some under-expenditure being expected in the other programmes. Figure 12: 2016 Percentage Budget Expenditure by September
Source: Estimates of Revenue and Expenditure for 1
st January to December 2017 (Volume 2)
Overall, the main challenge perhaps is that the education budget performance is mostly negatively impacted by both the lower budgetary releases averaging 66% in the last two years. This means that apart from the overall budget being lower than the 20% SADC minimum threshold, the Ministry further loses a third of its budget in form of non-releases. Worse still, the Ministry of Finance does not adhere to its disbursement plan. Majority of the funds are released in the second half of the year, while funding
93%
51% 51%
0%
10%
20%
30%
40%
50%
60%
70%
80%
90%
100%
University Education Skills Development Science, Technology and Innovation
26
levels have remained low in the first half of the financial year. This, coupled by the large components of the budget going towards management and administration costs, ultimately impacts on the Ministry’s ability to deliver quality education for all.
8.0 CONCLUSION AND RECOMMENDATIONS Zambia has made steady progress in promoting access and participation especially at primary school
level where nearly all the children are currently enrolled in school due to massive investment in
infrastructure and declaration of free primary education. The enrolments in Early Childhood Education
also doubled during the period 2014 to 2015 although about three quarters of children at this level are
still out of school. At primary school level, the education system has managed to capture an equal
number of boys and girls especially in the lower Grades from Grades 1 to 3. Thereafter children,
especially girls, start dropping out of school leading to a reduction in the number of children especially
as children transition from Grades 7 to 8, and Grades 9 to 10 respectively. However, the major problem
that transcend across all the education subsectors is the poor quality of education. Although the
conceptualisation of quality of education is to a great extent broad in the Standards and Evaluation
Guidelines, the NIF III, which is the main implementation framework does not address the critical
aspects of quality. Instead, NIF III largely presents quality in terms of quality inputs and thus does not
place emphasis on the process issues that link the inputs to the outcomes such as learning environment,
critical thinking, children’s health and use of technology to ensure better presentation and
understanding of theoretical concepts. Thus, Zambia’s pursuit for quality education has remained
inadequate as the key elements that are critical in bringing about improvements in learning outcomes
are mostly left out. This gap has manifested itself in the low learning achievement levels across all the
subsectors with average learning achievement scores at Grade 5 being below 40 percent across most
subjects with the poorest performance being in mathematics and science at both primary and secondary
school levels.
In terms of budget support, the education sector receives a seemingly high budgetary allocation compared to other sectors. However, the allocation to the sector is inadequate to achieve all the planned targets to significantly impact on the access and quality of education at all levels. Given that the largest share of the allocation is spent on administration and management, very little resources are left to invest in the quality of education. More so, the placement of more emphasis on primary and secondary education has meant that both investment and progress in other subsectors has been very limited. The NIF III, just like the previous sector plans, concentrated more on planning for outcomes related to the delivery of primary and secondary education, with little emphasis on TEVET, tertiary, early childhood education and adult literacy. The study therefore recommends the following measures; 1. Although Zambia has introduced one of the most progressive and relevant curriculum that can
contribute to the improved quality of education, there is urgent need to increase both investments and efficiency in the implementation of the curriculum especially in the delivery of relevant teaching and learning materials as well as the training and deployment of teachers in the newly introduced subjects such as ICT.
27
2. Similarly, the Ministry should consider addressing the systemic bottlenecks associated with the practical execution of the book procurement and delivery policy at primary school level in order to enhance the transparency and efficiency of the procurement system.
3. The high teacher attrition rate has continued to undermine the efforts targeted at improving the teacher pupil ratios and therefore, the Ministry must address the underlying causes of the high attrition rate and ensure that the loss of teachers is limited to obvious cases such as retirement.
4. Considering that government investment in infrastructure has for a long time been biased towards
the construction of more classrooms at the expense of other equally important infrastructure, there is need for increased investment in teachers’ houses as well as in school water and sanitation facilities that are also key in contributing to a child friendly school environment.
5. Since the NIF is the main guiding implementation framework for the Ministry of General Education,
the Ministry must ensure that NIF IV, unlike was the case with NIF III, operationalizes the Standards and Evaluation Guidelines in order to ensure the implementation of various standards contained in this important document including the UNESCO model for conceptualizing quality of education.
6. The Ministry should devise interventions for strengthening the skills of school managers in
monitoring and devising strategies for combating teacher absenteeism which contributes significantly to the reduction of pupil teacher contact hours which consequently leads to poor quality of education.
7. The Ministry must strive towards increasing the scheduled contact hours to the level of other
education providers such as private schools and Grant Aided Schools to ensure effective teaching and learning processes in public schools.
8. As the Ministry prioritizes the expansion of the primary and secondary school subsectors, there is
need not to lose sight of the need to invest in other equally important subsectors such as the Early Childhood Education, Adult Literacy, tertiary and the TEVET subsectors.
9. The Ministry of General Education together with Civil Society Organizations must continue engaging
the Ministry of Finance on the need for the increased budgetary allocation to the education sector to the minimum acceptable SADC thresholds of 20% of the national budget or 6% of GDP and further ensure timely release of the budget allocations.
10. Government should not see the annexing of ECE centers to primary schools as an end itself, instead, the annexing of ECE to primary schools should be followed by the construction of age appropriate infrastructure as well as provision of furniture and relevant play materials in line with the Ministry’s standards and evaluation guidelines.
11. The Ministry of General Education will need to expedite the process of developing the National Implementation Framework (NIF IV) for the period 2017 to 2021 to ensure the smooth implementation of the Ministry’s long and medium term education priorities.
28
REFERENCES ECZ .2015. Learning Achievement at Basic School Level. Zambia’s National Assessment Survey Report 2014. Examinations Council of Zambia: Lusaka ECZ .2013. Learning Achievement at Basic School Level. Zambia’s National Assessment Survey Report 2012. Examinations Council of Zambia: Lusaka MoF.2016. Estimates of Revenue and Expenditure for 2017, Volume 2. Lusaka. Government Printers MoF .2015. Estimates of Revenue and Expenditure for 2016. Lusaka: Government Printers. MoF .2014. Estimates of Revenue and Expenditure for 2015. Lusaka: Government Printers. MoF .2013. Revised Sixth National Development Plan 2013-2016. Ministry of Finance: Lusaka MoGE .2016a. Annual Report for 2015. Ministry of General Education: Lusaka MoGE .2016b. Education Statistical Bulletin 2015. Ministry of General Education: Lusaka
MoGE .2016c. Draft National Implementation Framework No. IV. Ministry of General Education: Lusaka MoGE .2015a. Education Statistical Bulletin. Ministry of General Education: Lusaka MoGE 2015b. Standards and Evaluation Guidelines. Ministry of General Education: Lusaka MoGE .2015c. MoGE (2016) Parliamentary Budget Explanatory Notes. Lusaka: Ministry of General Education MoGE .2011. National Implementation Framework III (NIF III). Lusaka. MoGE .2010. National Implementation Framework III 2011-2015. Ministry of General Education: Lusaka MoGE .1996. National Policy on Education; Educating Our Future. Lusaka; Institutional Suppliers Limited OSISA .2013. Effective Delivery of Public Education Services in Zambia: A review by AfriMAP and the Open Society Initiative for Southern Africa. Open Society Initiative for Southern Africa: Johannesburg Spoelder M .2010. The conceptualization of quality education in Zambia. MA Thesis. London School of Education: London UNICEF .2016. Zambia National Budget Brief: Review of 2016 Social Sector Budget Allocations. UNICEF: Lusaka World Bank. 2016. Education Public Expenditure Review in Zambia. World Bank, Washington, DC. License: Creative Commons Attribution CC BY 3.0 IGO
29
World Bank Group (2015) EDUCATION GLOBAL PRACTICE Zambia Education PER and PETS-QSDS at a Glance: International Bank for Reconstruction and Development: Washington DC ZANEC .2016. The Analysis of the 2015 National Education Budget. Zambia National Education Coalition: Lusaka ZANEC .2014. Study on the Administration of Bursaries in Higher Learning Institutions. Zambia National Education Coalition: Lusaka ZANEC .2010. Teacher Absenteeism in selected primary schools in Zambia. Zambia National Education Coalition: Lusaka ZESSTA .2016. Occasional technical report no.7: Third National Implementation Framework (NIF III),
Education and Skills Sector: Lessons learned. Zambia’s Education Sector Support Technical Assistance Facility: Lusaka
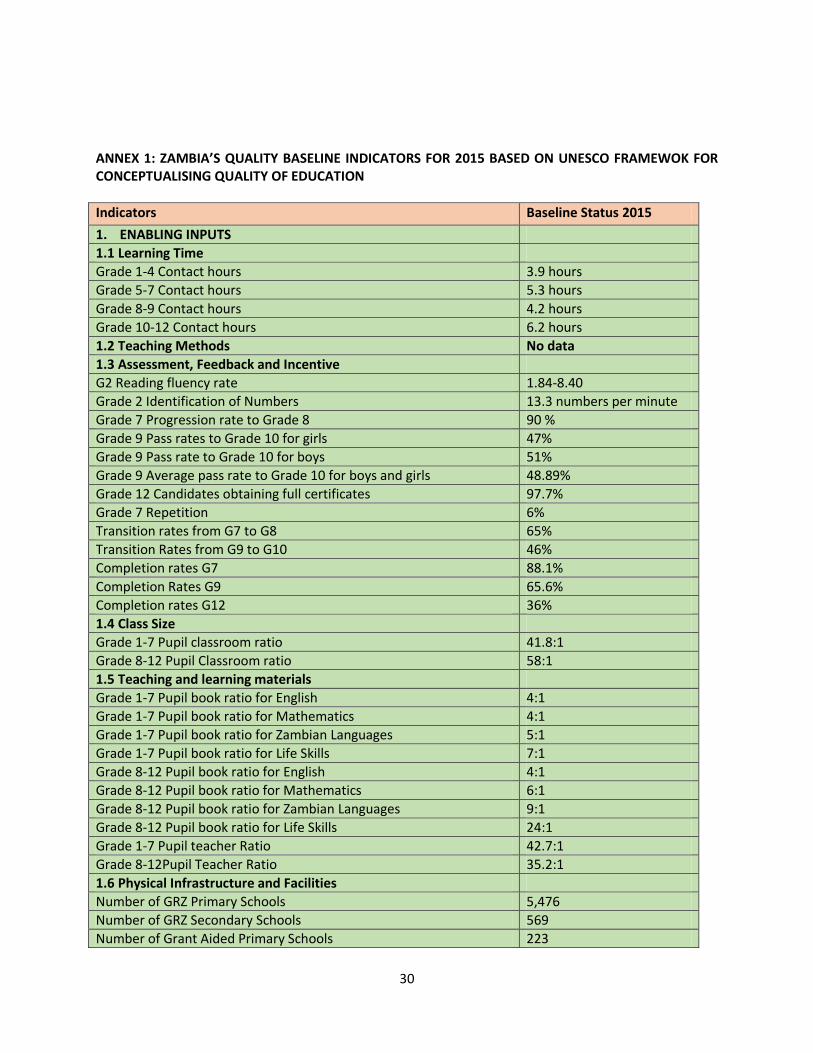
30
ANNEX 1: ZAMBIA’S QUALITY BASELINE INDICATORS FOR 2015 BASED ON UNESCO FRAMEWOK FOR CONCEPTUALISING QUALITY OF EDUCATION
Indicators Baseline Status 2015
1. ENABLING INPUTS
1.1 Learning Time
Grade 1-4 Contact hours 3.9 hours
Grade 5-7 Contact hours 5.3 hours
Grade 8-9 Contact hours 4.2 hours
Grade 10-12 Contact hours 6.2 hours
1.2 Teaching Methods No data
1.3 Assessment, Feedback and Incentive
G2 Reading fluency rate 1.84-8.40
Grade 2 Identification of Numbers 13.3 numbers per minute
Grade 7 Progression rate to Grade 8 90 %
Grade 9 Pass rates to Grade 10 for girls 47%
Grade 9 Pass rate to Grade 10 for boys 51%
Grade 9 Average pass rate to Grade 10 for boys and girls 48.89%
Grade 12 Candidates obtaining full certificates 97.7%
Grade 7 Repetition 6%
Transition rates from G7 to G8 65%
Transition Rates from G9 to G10 46%
Completion rates G7 88.1%
Completion Rates G9 65.6%
Completion rates G12 36%
1.4 Class Size
Grade 1-7 Pupil classroom ratio 41.8:1
Grade 8-12 Pupil Classroom ratio 58:1
1.5 Teaching and learning materials
Grade 1-7 Pupil book ratio for English 4:1
Grade 1-7 Pupil book ratio for Mathematics 4:1
Grade 1-7 Pupil book ratio for Zambian Languages 5:1
Grade 1-7 Pupil book ratio for Life Skills 7:1
Grade 8-12 Pupil book ratio for English 4:1
Grade 8-12 Pupil book ratio for Mathematics 6:1
Grade 8-12 Pupil book ratio for Zambian Languages 9:1
Grade 8-12 Pupil book ratio for Life Skills 24:1
Grade 1-7 Pupil teacher Ratio 42.7:1
Grade 8-12Pupil Teacher Ratio 35.2:1
1.6 Physical Infrastructure and Facilities
Number of GRZ Primary Schools 5,476
Number of GRZ Secondary Schools 569
Number of Grant Aided Primary Schools 223
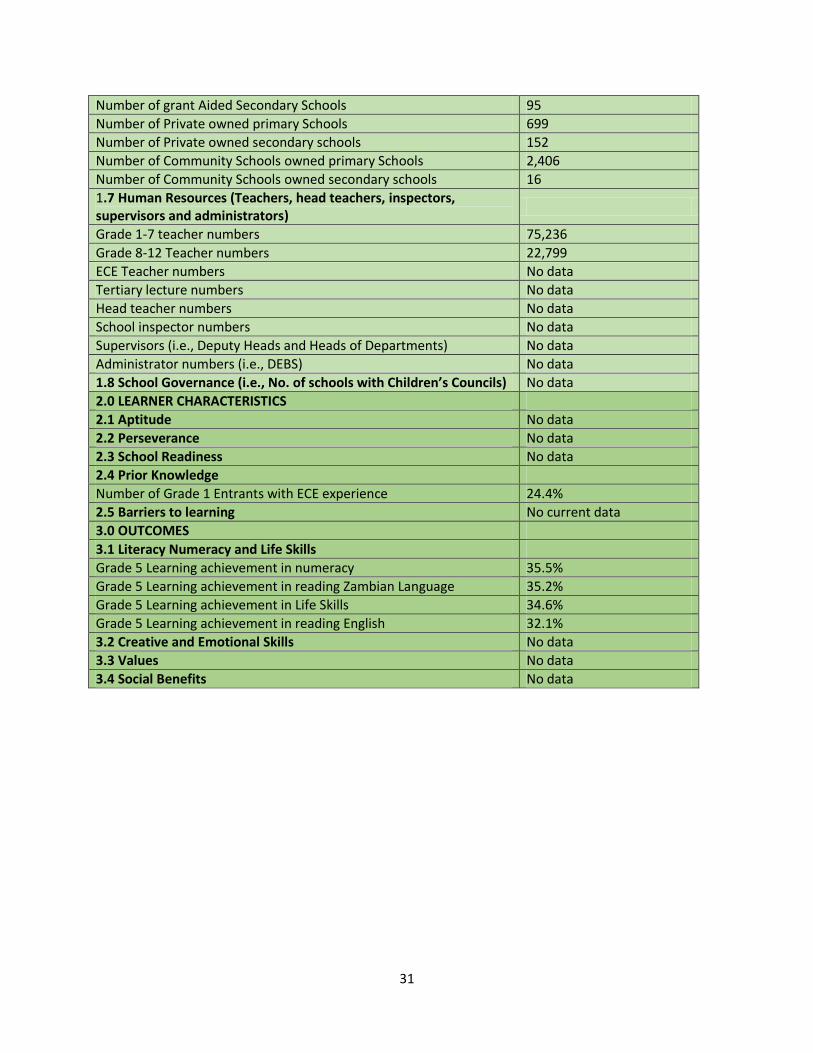
31
Number of grant Aided Secondary Schools 95
Number of Private owned primary Schools 699
Number of Private owned secondary schools 152
Number of Community Schools owned primary Schools 2,406
Number of Community Schools owned secondary schools 16
1.7 Human Resources (Teachers, head teachers, inspectors, supervisors and administrators)
Grade 1-7 teacher numbers 75,236
Grade 8-12 Teacher numbers 22,799
ECE Teacher numbers No data
Tertiary lecture numbers No data
Head teacher numbers No data
School inspector numbers No data
Supervisors (i.e., Deputy Heads and Heads of Departments) No data
Administrator numbers (i.e., DEBS) No data
1.8 School Governance (i.e., No. of schools with Children’s Councils) No data
2.0 LEARNER CHARACTERISTICS
2.1 Aptitude No data
2.2 Perseverance No data
2.3 School Readiness No data
2.4 Prior Knowledge
Number of Grade 1 Entrants with ECE experience 24.4%
2.5 Barriers to learning No current data
3.0 OUTCOMES
3.1 Literacy Numeracy and Life Skills
Grade 5 Learning achievement in numeracy 35.5%
Grade 5 Learning achievement in reading Zambian Language 35.2%
Grade 5 Learning achievement in Life Skills 34.6%
Grade 5 Learning achievement in reading English 32.1%
3.2 Creative and Emotional Skills No data
3.3 Values No data
3.4 Social Benefits No data