Embed Size (px)
Citation preview
The Stock-Flow Approach to the Real ExchangeRate of CEE Transition Economies
Balázs Égert� Amina Lahrèche-Révily
Kirsten Lommatzschz
May 10, 2005
Abstract
This paper investigates the determinants of equilibrium real exchangerates for the new EU member states and candidate countries, relying onan asset model inspired by Aglietta et al. (1998) and Alberola et al.(1999, 2002). The impact of productivity gains on both the Balassa-Samuelson e¤ect and the behaviour of the tradable real exchange rate isespecially assessed. Subdividing the panel into sub-panels, we show thatthe B-S e¤ect is a common feature to all economies, but that the trad-able price-based real appreciation is a distinct feature of transition andemerging economies. We also show that in transition countries, a decreasein net foreign assets leads to an appreciation of the real exchange rate,instead of the depreciation predicted by theory. Comparing in-sample andout-of-sample estimates (in terms of the country coverage) of equilibriumexchange rates shows that these measures can yield di¤erent results, andcould therefore be considered as complementary tools in judging misalign-ments.
JEL: C15, E31, F31, O11, P17Keywords: real equilibrium exchange rate, EU enlargement, , Balassa-
Samuelson e¤ect, productivity, net foreign assets, out-of sample panel
�Oesterreichsiche Nationalbank; MODEM, University of Paris X-Nanterre and WilliamDavidson Institute. Email: [email protected]; [email protected]
yCEPII; [email protected]; [email protected]
1
1 Introduction
Transition economies in Central and Eastern Europe have experienced a rathersubstantial real appreciation of their currencies, which could make meeting thenominal convergence criteria di¢ cult. This sizeable real appreciation is oftenrelated to the Balassa-Samuelson e¤ect of rising prices of non-tradable goodsduring the catch-up process (e.g. Halpern and Wyplosz 2001, Backé et al 2002),although its importance for the price level convergence of transition economieshas been questioned lately (Coricelli and Jazbec, 2004; Égert 2002, Égert etal. 2003, Mihajlek and Klau 2004). Macro-economic models and reduced-formequations have also been used for assessing determinants of the real exchangerate. In addition to productivity, they consider a wide range of other determi-nants, such as foreign debt or net foreign assets, terms of trade, governmentdebt and regulated prices (e.g. Csajbók 2003, Alberola 2003, Rawdanowicz2003, Égert and Lommatzsch 2004).A major problem for assessing the factors driving equilibrium rates for tran-
sition countries is the lack of long time series providing su¢ cient numbers ofobservation for econometric testing. Time series estimations may not be ro-bust enough to establish reliably long-term determinants of the real exchangerate. Therefore, panel estimations have gained popularity (Kim and Korhonen2002, Crespo-Cuaresma et al. 2003). However, a question arises as to whetherit is more appropriate to make use of out-of-sample or in-sample estimations.1
Maeso-Fernandez et al. (2004) argue that out-of-sample panel estimates maybe superior to in-sample panel estimates for transition economies because in thepresence of initial undervaluation, in-sample panels produce biased estimates.However, while such an approach attempts to correct the constant term, it can-not, by nature, account for possible parameter di¤erences between transitioncountries and the more developed countries, e.g. in the OECD, regarding netforeign assets and productivity. Such di¤erences are yet likely: the catch upprocess may, at an early stage, justify an increase in foreign liabilities becauseforeign savings are needed for the growth potential to materialise; rapid changesin supply capacities and technology may imply that productivity impacts on thereal exchange rate through di¤erent channels than in industrialised countries op-erating at the technological frontier.In this paper, we make a further step in comparing panel estimates from
out-of sample and in-sample estimates. As a background, we use the stock-�owapproach as set out in e.g. Faruqee (1995), Aglietta et al. (1998) and Alberolaet al. (1999, 2002). In this approach, the equilibrium real exchange rate isdetermined by the stock and �ow of assets between countries. Any countryhas a desired stock of net foreign assets which it aims to achieve in the longrun. The equilibrium real exchange rate prevails at a current account position
1 In-sample and out-of-sample estimates are de�ned here in terms of country coverage.Namely, out-of-sample measures of the equilibrium exchange rate for a given country arebased on exchange-rate equations estimated on a sample where from this country is excluded.Conversely, in-sample measures are derived from equations estimated on a geographical sampleincluding the country of interest.
2
consistent with the income �ows from the desired stock of foreign assets. Inview of the large current account de�cits that most of the transition countries2
of Central and Eastern Europe have been experiencing, the question of theimpact of net foreign assets on the real exchange rate and external equilibriumis highly relevant. An increase in net foreign liabilities is often found to lead to anappreciation of the equilibrium real exchange rate of the transition countries.This is in contrast to what theory would suggest, i.e. a rise in net foreignliabilities should cause the real exchange rate to depreciate. The solution tothis conundrum seems to be linked to di¤erent time horizons and the movementtowards the desired level of foreign assets or liabilities.Besides net foreign assets, we also consider labour productivity. The pro-
ductivity variable is usually interpreted with reference to the Balassa-Samuelson(B-S) e¤ect, which causes the real exchange rate to appreciate via an increasein the relative price of non-tradable goods. However, we also view productivityas channelling changes in the tradable price-based real exchange. This is thecase in transition economies because industrial productivity gains do not onlyre�ect the cost-competitiveness of the countries, but also quality improvements�i.e. non-price competitiveness �. Therefore, productivity improvements areexpected to lead to an appreciation of the real exchange rate. Using medium-size panels for di¤erent groups of countries: (1) small, open OECD countries (2)emerging economies of Asia and the Americas (3) transition countries from Cen-tral and Eastern Europe (4) all countries put together, we show that transitionand emerging market economies do experience a tradable price-based appre-ciation, which is not the case in the more developed OECD countries. Theuse of di¤erent proxies for productivity allows us to show that the CPI-to-PPIratio so often used in the literature as a proxy for relative productivity vehi-cles other type of information as well, and is an imperfect substitute for theBalassa-Samuelson e¤ect.The paper is organised as follows: Section 2 presents the theoretical frame-
work. Section 3 describes the data and the estimation methods. Estimationresults are then presented in Section 4. Finally, Section 5 concludes.
2 Theoretical Framework
2.1 Real Exchange Rate Decomposition
Decomposing the real exchange rate allows separating competitiveness fromrelative price issues, as all prices need not a¤ect the ability of a country to sellgoods or services abroad.Considering the consumer price index (CPI) composed of tradable and non-
tradable goods with � and (1-�) being the respective share of tradable and
2The term �transition economy�is used throughout the paper instead of �new EU memberstate� (Czech Republic, Estonia, Hungary, Latvia, Lithuania, Poland, Slovakia and Slovenia)or �candidate country�(Bulgaria, Croatia and Romania) because for most of the period usedfor the estimations, the countries from Central and Eastern Europe can be viewed as transitioneconomies.
3
non-tradable goods in the CPI, the real exchange rate (q)3 can be split intotwo components: (1) the real exchange rate of the open sector, pT being theprice index of tradable goods, and (2) the ratio of domestic to foreign relativeprice of non-tradable goods, pNT (which came to be known as the internal realexchange rate) as shown below (all variables are transformed into logs):
q = e+ pT� � pT �h(1� �) (pNT � pT )� (1� ��) (pNT� � pT�)
i(1)
This decomposition allows to separate the factors that in�uence the realexchange rate of the open sector (and hence the current account via the tradebalance), from the ones that are related to the price developments in the non-tradable sector.According to asset models of the real exchange rate4 , the current account
is driven, in the long run, by the adjustment of net foreign assets towardstheir desired position. The equilibrium real exchange rate of the open sector isa¤ected by this adjustment, and can thus deviate from the purchasing powerparity (PPP). On the opposite, the relative price of non-tradable goods neednot a¤ect international competitiveness, and hence the current account positionand changes in net foreign assets .5
2.2 The Real Exchange Rate of the Open Sector
The theoretical motivation of our empirical analysis draws on the model de-veloped by Alberola et al. (1999, 2002). The equilibrium real exchange rateis de�ned as the real exchange rate that leads simultaneously to internal andexternal balances.Internal balance is reached when the domestic goods market clears (non-
in�ationary level of employment, i.e. output near to its potential level). Hence,it conveys both a Balassa-Samuelson (B-S) e¤ect (the relative price of non-tradable goods increases when productivity rises faster in the tradable sectorthan in the non-tradable sector) and a demand e¤ect.External balance refers to current account sustainability, which implies that,
in the long run, the current account is balanced and net foreign assets haveconverged to their steady state. The long-run equilibrium real exchange ratesecures the trade balance de�cit (surplus) to correspond to the income pay-ments received (made) by the country. In the medium term, external balanceis characterised by the convergence of net foreign assets towards their desired
3q=e+p*-p where e and p are the nominal exchange rate and the overall price index. Theasterisk denotes the foreign country. Note also that the exchange rate is de�ned as unitsof domestic currency per one unit of foreign currency. Thus, an increase (decrease) in theexchange rate denote a depreciation (appreciation).
4Frenkel and Mussa (1985), Faruqee (1995), Aglietta et al. (1997), Alberola et al. (1999)and Lane and Milesi-Ferretti (2002).
5 It need not, but it can, if non-tradables are inputs for the production of tradables, andtheir increase implies cost pressure on the tradable goods prices.
4
level, i.e. current account de�cits or surpluses are connected with desired capital�ows. Following Frenkel and Mussa (1985), the medium-run adjustment can bede�ned as the convergence of net foreign assets towards their desired level andas the di¤erence between short and long-run interest rates.This model leads to the following testable equation, where the real e¤ective
exchange rate (qt) is determined jointly by the dual productivity di¤erential(prod)6 and net foreign asset (nfa)
q = f(prod; nfa) (2)
In such a framework, external equilibrium only relies on price-competitiveness,as net foreign asset developments feed back into the real exchange rate to achievethe desired current account position. However, current account developmentsdo not only depend on price-competitiveness. This is especially the case inemerging markets, which experience an upgrading in the quality of specialisa-tion, but also in developed economies, where product di¤erentiation leads theprice-elasticity of demand for tradable goods to decrease. This issue is explicitlytaken into account in the theoretical model developed by Aglietta et al. (1998),drawing on Faruqee (1995).In Aglietta et al (1998), the external equilibrium depends both on the net
foreign asset position and non-price competitiveness (npc), the underlying as-sumption being that an improvement in non-price competitiveness allows foran appreciation of the real exchange rate for a given current account position.Consistently with other theoretical models, the internal equilibrium is deter-mined by a Balassa-Samuelson e¤ect. The resulting reduced real exchange rateequation is the following:
q = f(�prod;
�npc;
+=�nfa) (2�)
This model of stock-�ow adjustment suggests a long-term relationship be-tween the real exchange rate and net foreign assets on the one hand, and deter-minants of the trade account on the other. An increase in non-price competi-tiveness and in relative productivity leads to an appreciation of the equilibriumreal exchange rate. The sign on net foreign assets is, however, not clear-cut. Ifthe desired stock of net foreign assets is negative (because the higher expectedgrowth or returns in the domestic economy make the use of foreign savings de-sirable), the economy will be moving to a desired foreign debt position, which,in turn, implies current account de�cits and a real appreciation of the exchangerate (hence, a positive relationship between nfa and q). Therefore, the e¤ect ofincome payments for the foreign debt (requiring a real depreciation when nfafalls) may dominate the exchange rate determination only at a later point whenthe desired level of foreign debt or negative foreign assets is achieved (negativerelationship between nfa and q).
6The dual productivity di¤erential is de�ned as: (prodT � prodNT )� (prodT�� prodNT�)
5
3 Estimation Issues
3.1 Measuring Non-Price-Competitiveness
Aglietta and others (1998) measure non-price competitiveness by means of theR&D expenditure. This proxy does not seem to �t well non-price competitive-ness developments in transition economies, where technology is mostly importedfrom abroad via massive foreign direct investment (FDI)7 , which is in turn re-�ected in huge productivity advances in the industrial sector. This last featuregives support to the use of average industrial labour poductivity as a proxy fornon-price competitiveness in. The catch-up process entails a shift towards thesupply of goods of higher quality and value-added and better reputation. Iflabour productivity is associated with quality improvements, or a better prod-uct di¤erentiation, the relative price of tradable goods can increase, becausedemand becomes less price-elastic.8 While quality improvement is present in alleconomies, in transition economies, this process seems to be more pronouncedand can even lead to real appreciation, as put forward in Égert and Lommatzsch(2004).Approximation of quality and technology changes by average productivity
may however apply only to transition countries. The fact that an increasein productivity in the open sector may be linked to a real appreciation of theopen sector�s real exchange rate in transition economies is in sharp contrast withpredictions of models within the New Open Economy Macroeconomics (NOEM)framework. In these models, an increase in productivity leads to a depreciationof the real exchange rate of the open sector because of a decrease in the pricesof tradables relative to those in the foreign economy (Beningo and Thoenisssen,2003, MacDonald and Ricci, 2002 and Világi, 2004).When assessing the behaviour of the real exchange rate based on a broad
measure of prices such as the CPI, productivity can also account for the B-Se¤ect: an increase in the dual productivity di¤erential leads to an apprecia-tion of the internal real exchange rate and consequently the CPI-based realexchange rate. In our test, average labour productivity in industry in thehome country relative to the foreign benchmark will capture both the non-price-competitiveness and the B-S e¤ects 9 To distinguish between the two channelsthrough which productivity a¤ects the real exchange rate, not only the CPI-based real exchange rate, but also the producer price index (PPI)-de�ated (asa proxy for tradable goods) real exchange rate is also regressed on productivity
7R&D is chie�y produced in the origin countries of the multinational �rms which havebeen investing in the transition countries.
8The new theory of international trade also accounts for such a possibility. According toKrugman (1989), growth may be associated with an increase in the variety of tradable goodsproduced in the domestic economy. The resulting decrease in the relative price elasticity ofdemand for exports allows for an appreciation of the real exchange rate of the tradable goods.
9 It is implicitly assumed that productivity in the non-tradable sector develops similarly inall countries, and that the transmission mechanism from higher productivity in the tradablegoods sector to higher prices of non-tradables is stable. This is fair compromise to capturetwo e¤ects with one variable.
6
and net foreign assets.
3.2 Reduced Form Equations
The baseline scenario considers the real exchange rate de�ated using the CPIon the one hand, and productivity and net foreign assets on the other, given inequation (3):
qCPI = f(�prod;
+=�nfa) (3)
The e¤ect of productivity improvements on the real exchange rate of the opensector is also assessed in equation (4), where the producer price index (PPI)-de�ated (as a proxy for tradable goods) real exchange rate is also regressed onproductivity and net foreign assets:
qPPI = f(�prod;
+=�nfa) (4)
Because of comparison reasons, we also perform the estimations using therelative price of non-tradables to that of tradables given by the domestic CPI-to-PPI ratio relative to the foreign CPI-to-PPI ratio:
qCPI = f(�rel;
+=�nfa) (3�)
qPPI = f(�rel;
+=�nfa) (4�)
It is common practice in the literature to use the CPI-to-PPI ratio as aproxy for productivity to account for the B-S e¤ect. There are, however, twoproblems with this identi�cation. First, productivity gains can a¤ect the realexchange rate, especially in transition countries via di¤erent channels (see Figure1.). Second, the CPI-to-PPI ratio is not a proper proxy for the relative priceof market non-tradables through which productivity gains feed into the realexchange rate because it also measures the impact of the following factors:(a) Higher demand for non-tradable goods because of higher income(b) Indirect taxes (which are included in the calculation of the CPI, but
not in the calculation of the PPI, the latter referring to producer prices beforeadding indirect taxes);(c) The adjustment of regulated prices (which concerns most often non-
tradables); and(d) More di¢ culties in adjustment for quality changes of non-tradables than
tradables.The sign of net foreign assets is ambiguous as described earlier. A decrease
in net foreign assets results in an appreciation of the real exchange rate duringthe adjustment process if the desired stock of net foreign assets is negative. Therelationship becomes negative once the desired NFA position is reached.
7
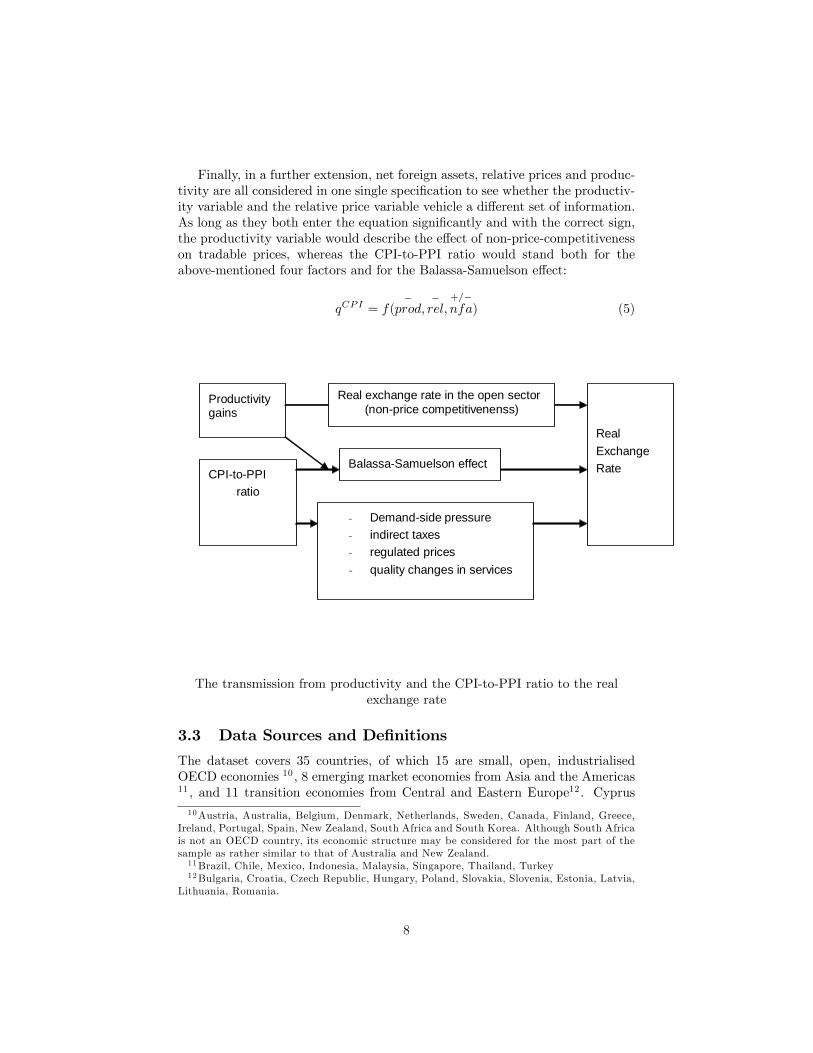
Finally, in a further extension, net foreign assets, relative prices and produc-tivity are all considered in one single speci�cation to see whether the productiv-ity variable and the relative price variable vehicle a di¤erent set of information.As long as they both enter the equation signi�cantly and with the correct sign,the productivity variable would describe the e¤ect of non-price-competitivenesson tradable prices, whereas the CPI-to-PPI ratio would stand both for theabove-mentioned four factors and for the Balassa-Samuelson e¤ect:
qCPI = f(�prod;
�rel;
+=�nfa) (5)
Productivitygains
RealExchangeRate
Real exchange rate in the open sector(non-price competitivenenss)
CPI-to-PPIratio
Balassa-Samuelson effect
- Demand-side pressure- indirect taxes- regulated prices- quality changes in services
The transmission from productivity and the CPI-to-PPI ratio to the realexchange rate
3.3 Data Sources and De�nitions
The dataset covers 35 countries, of which 15 are small, open, industrialisedOECD economies 10 , 8 emerging market economies from Asia and the Americas11 , and 11 transition economies from Central and Eastern Europe12 . Cyprus10Austria, Australia, Belgium, Denmark, Netherlands, Sweden, Canada, Finland, Greece,
Ireland, Portugal, Spain, New Zealand, South Africa and South Korea. Although South Africais not an OECD country, its economic structure may be considered for the most part of thesample as rather similar to that of Australia and New Zealand.11Brazil, Chile, Mexico, Indonesia, Malaysia, Singapore, Thailand, Turkey12Bulgaria, Croatia, Czech Republic, Hungary, Poland, Slovakia, Slovenia, Estonia, Latvia,
Lithuania, Romania.
8
is also included in the dataset. On the basis of the 35 countries, the followingpanels were considered: (1) OECD countries, (2) emerging countries of Asiaand the Americas, (3) transition economies from Central and Eastern Europe.Because we are concerned primarily with real exchange rates for the transitioneconomies, we further divided the panel of 11 transition economies in order toaccount for possibly signi�cant di¤erences between the transition countries. Forexample, Bulgaria and Romania are less advanced in their reforms than the newEU member states, and together with the Baltic countries they have experiencedhigher real appreciation compared with the rest. Therefore, two further panelswere formed: (4) CEEC5 plus the 3 Baltic countries and (5) only CEEC5. Panel(6) contains all mentioned countries. Finally, panel (7) contains all countriesplus Cyprus, which was di¢ cult to put into any of the speci�c panels. The periodspans from 1970 to 2002 for panel (1) and Cyprus. However, for some of thecountries, some of the series begin later. For panel (2), time series usually beginbetween 1980 and 1990 and end in 2002. Regarding transition economies, thedatasets span from 1992/1993 to 2002.13 All data are quarterly ; the de�nitionof variables and data sources are given in the Appendix.
Table 1. Overview of panelsPanel1 15 OECD countriesPanel2 8 emerging countriesPanel3 11 CEE transition countriesPanel4 8 transition countries (CEEC5+B3)Panel5 CEEC5Panel6 Panel 1 + Panel 2 + Panel 3Panel7 Panel 6 + Cyprus
The real e¤ective exchange rate is a weighted average of the real exchangerate vis-à-vis the US economy and the euro area . Germany and France are takenas a proxy for the euro area14 , where the weights correspond to the relative sizeof French and German GDP (40 and 60 per cent, respectively). The weightsallocated to the US and the euro area are given by the trade patterns of thegiven economy.
Table 2. Share of EU15 and US in AC total trade (in %), 1996-2001 average
13For more details on data sources and available time periods, see Appendix 1.14 In doing so, we do not consider the rest of the world, which implicitly suggests that real
exchange rate adjustments, if any, are to be made against the euro (mostly) and the dollar(marginally). This hypothesis, although apparently restricting, matches both the increasingorientation of transition countries economies towards the euro area, and the future of EMUparticipation, which will leave asymmetric shocks to be adjusted through the relative pricesagainst other EMU countries. See Bénassy-Quéré et al. (2004) for developments about theinclusion/exclusion of the rest of the world in real e¤ective equilibrium exchange rates esti-mations.
9
EU 15 US TotalCzech Rep. 0.66 0.02 0.68Estonia 0.63 0.04 0.67Hungary 0.69 0.04 0.73Latvia 0.55 0.05 0.60Lithuania 0.47 0.02 0.49Poland 0.68 0.02 0.70Slovakia 0.52 0.01 0.53Slovenia 0.70 0.02 0.72
Source: Chelem-Cepii database
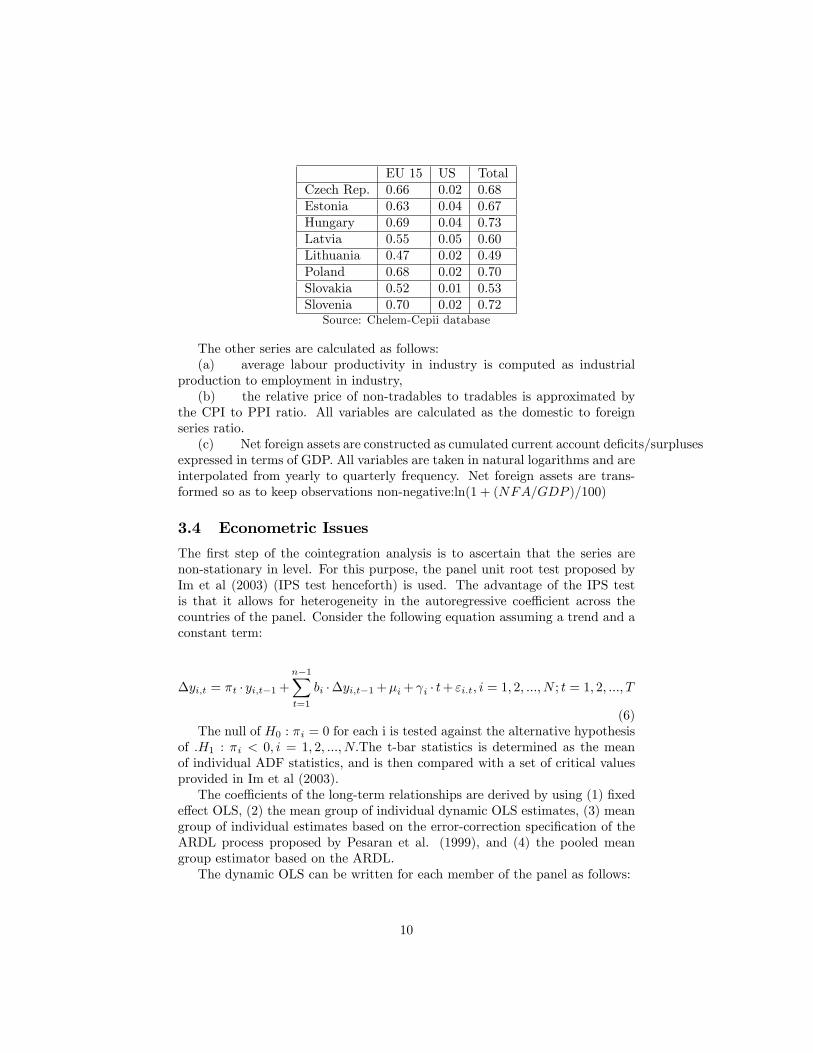
The other series are calculated as follows:(a) average labour productivity in industry is computed as industrial
production to employment in industry,(b) the relative price of non-tradables to tradables is approximated by
the CPI to PPI ratio. All variables are calculated as the domestic to foreignseries ratio.(c) Net foreign assets are constructed as cumulated current account de�cits/surpluses
expressed in terms of GDP. All variables are taken in natural logarithms and areinterpolated from yearly to quarterly frequency. Net foreign assets are trans-formed so as to keep observations non-negative:ln(1 + (NFA=GDP )=100)
3.4 Econometric Issues
The �rst step of the cointegration analysis is to ascertain that the series arenon-stationary in level. For this purpose, the panel unit root test proposed byIm et al (2003) (IPS test henceforth) is used. The advantage of the IPS testis that it allows for heterogeneity in the autoregressive coe¢ cient across thecountries of the panel. Consider the following equation assuming a trend and aconstant term:
�yi;t = �t � yi;t�1+n�1Xt=1
bi ��yi;t�1+�i+ i � t+ "i:t; i = 1; 2; :::; N ; t = 1; 2; :::; T
(6)The null of H0 : �i = 0 for each i is tested against the alternative hypothesis
of .H1 : �i < 0; i = 1; 2; :::; N:The t-bar statistics is determined as the meanof individual ADF statistics, and is then compared with a set of critical valuesprovided in Im et al (2003).The coe¢ cients of the long-term relationships are derived by using (1) �xed
e¤ect OLS, (2) the mean group of individual dynamic OLS estimates, (3) meangroup of individual estimates based on the error-correction speci�cation of theARDL process proposed by Pesaran et al. (1999), and (4) the pooled meangroup estimator based on the ARDL.The dynamic OLS can be written for each member of the panel as follows:
10
Yi:t = �0 +nXi=1
�n �Xi;t +nXi=1
k2Xj=�k1
i;j ��Xi;t�j + "t (7)
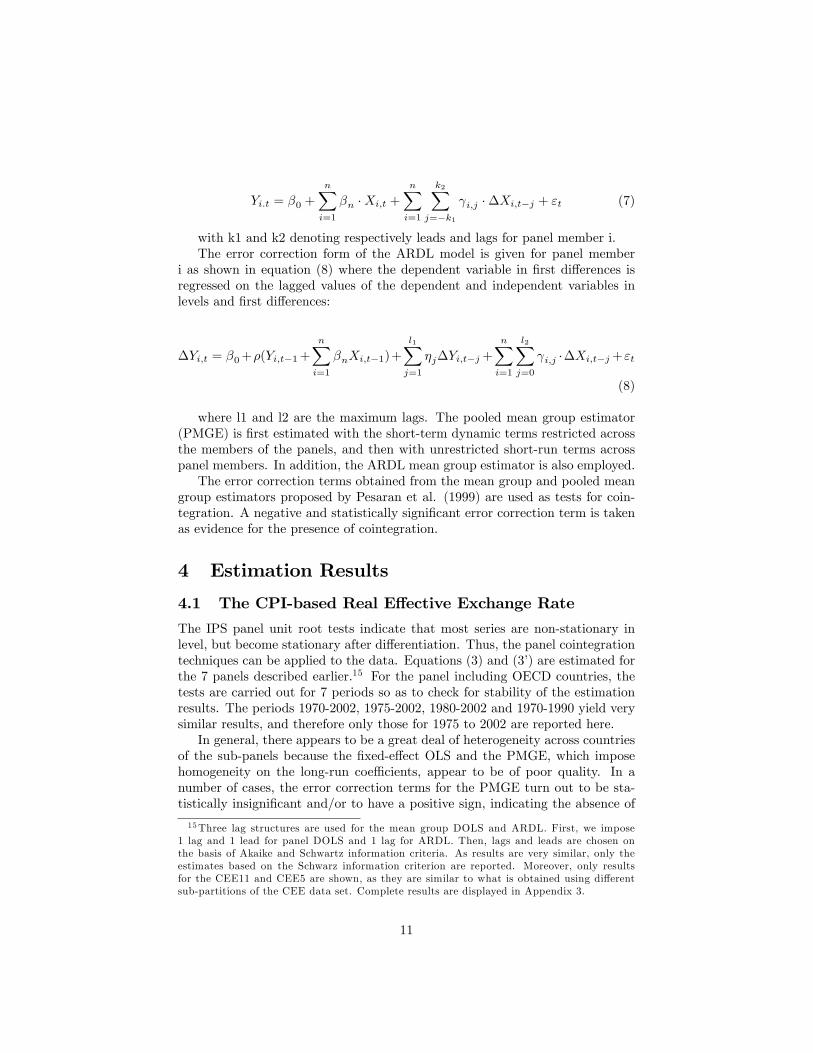
with k1 and k2 denoting respectively leads and lags for panel member i.The error correction form of the ARDL model is given for panel member
i as shown in equation (8) where the dependent variable in �rst di¤erences isregressed on the lagged values of the dependent and independent variables inlevels and �rst di¤erences:
�Yi;t = �0+�(Yi;t�1+nXi=1
�nXi;t�1)+
l1Xj=1
�j�Yi;t�j+nXi=1
l2Xj=0
i;j ��Xi;t�j+"t
(8)
where l1 and l2 are the maximum lags. The pooled mean group estimator(PMGE) is �rst estimated with the short-term dynamic terms restricted acrossthe members of the panels, and then with unrestricted short-run terms acrosspanel members. In addition, the ARDL mean group estimator is also employed.The error correction terms obtained from the mean group and pooled mean
group estimators proposed by Pesaran et al. (1999) are used as tests for coin-tegration. A negative and statistically signi�cant error correction term is takenas evidence for the presence of cointegration.
4 Estimation Results
4.1 The CPI-based Real E¤ective Exchange Rate
The IPS panel unit root tests indicate that most series are non-stationary inlevel, but become stationary after di¤erentiation. Thus, the panel cointegrationtechniques can be applied to the data. Equations (3) and (3�) are estimated forthe 7 panels described earlier.15 For the panel including OECD countries, thetests are carried out for 7 periods so as to check for stability of the estimationresults. The periods 1970-2002, 1975-2002, 1980-2002 and 1970-1990 yield verysimilar results, and therefore only those for 1975 to 2002 are reported here.In general, there appears to be a great deal of heterogeneity across countries
of the sub-panels because the �xed-e¤ect OLS and the PMGE, which imposehomogeneity on the long-run coe¢ cients, appear to be of poor quality. In anumber of cases, the error correction terms for the PMGE turn out to be sta-tistically insigni�cant and/or to have a positive sign, indicating the absence of
15Three lag structures are used for the mean group DOLS and ARDL. First, we impose1 lag and 1 lead for panel DOLS and 1 lag for ARDL. Then, lags and leads are chosen onthe basis of Akaike and Schwartz information criteria. As results are very similar, only theestimates based on the Schwarz information criterion are reported. Moreover, only resultsfor the CEE11 and CEE5 are shown, as they are similar to what is obtained using di¤erentsub-partitions of the CEE data set. Complete results are displayed in Appendix 3.
11
an error correction mechanism towards long-run equilibrium. By contrast, theDOLS and ARDL mean group estimators seem to con�rm our expectations bothin terms of signi�cance, signs and the error correction term. Given this, we willconcentrate on the interpretation of the estimates obtained on the basis of thepanel DOLS and MG estimators. Results for tests based on the CPI-based realexchange rate are displayed in Table 3.Tests can establish cointegration for the speci�cations with the productivity
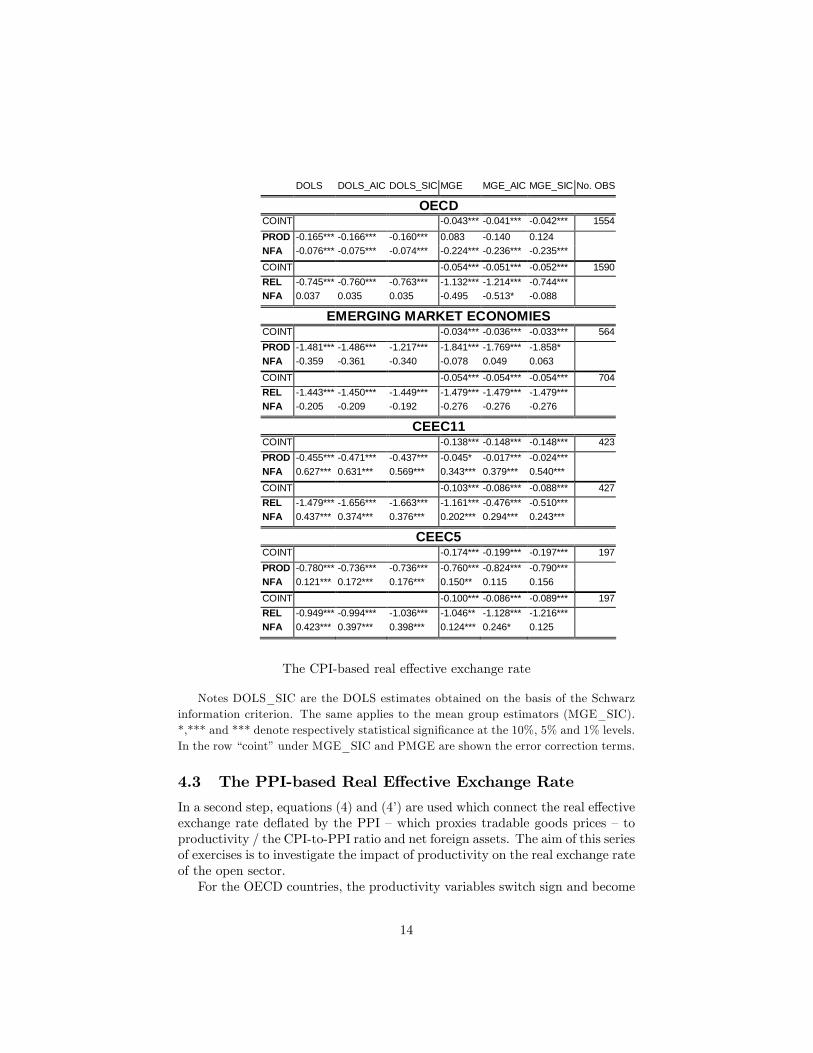
series and the CPI-to-PPI price ratio. For the group of OECD countries, pro-ductivity in industry has the expected negative sign, meaning that an increasein productivity causes the real exchange rate to appreciate. Although the CPI-to-PPI ratio also has a negative sign, the size of it is considerably higher inabsolute terms (-0.7 to �1.2) than that of the two productivity variables (-0.16to �0.2). This is a �rst indication that the variables may convey di¤erent in-formation.16 Net foreign assets are also correctly (negatively) signed and arestatistically signi�cant except when the CPI-to-PPI ratio is used. Thus, an in-crease in net foreign assets leads to an appreciation of the real exchange rate.It should be noted that results obtained using DOLS are in general of betterquality as those based on MGE because in a number of cases, some variablesare not signi�cant using the MGE.With regard to the group of emerging countries from Asia and South Amer-
ica, the two productivity variables and the CPI-to-PPI ratio bear the correctsign, i.e. an increase (decrease) leads to an appreciation (depreciation) of thereal e¤ective exchange rate. However, the absolute size of the variables is higherthan for the OECD panel (1.2 to 1.5 for productivity in industry and the CPI toPPI ratio). By contrast, net foreign assets turn out insigni�cant in most cases,and when they are statistically signi�cant, their sign di¤ers.Coming to the transition economies, we observe a high signi�cance of the
productivity variables. Similar to the OECD countries, the size of the CPI-to-PPI variable is much higher than the one of productivity in industry. Comparingthe three panels (11 transition economies, CEEC5+B5, CEEC5), the elimina-tion of Bulgaria, Croatia and Romania, and then the three Baltic countries leadsto a decrease in the size of the CPI-to-PPI variable and to a rise in the size ofproductivity in industry. In contrast to the group of emerging countries, thenet foreign assets variable is mostly signi�cant at standard signi�cance levels.However, the sign of this variable is always positive.Finally, the estimation results are very similar for the last two panels. This
means that the inclusion of Cyprus to the other countries does not a¤ect theoverall results. For this reason, we only report results for the panel including theOECD, emerging and transition countries and Cyprus (panel (7)). The results
16The CPI to PPI ratio should be connected to relative productivity by a multiplicativefactor, which accounts for the weight of the non-tradable sector in the economy : (1-�), where� is the weight of the tradable sector. According to our estimates, the implicit weight ofthe tradable sector would range between 50% and 0%. The usually accepted �gure is around30%, which matches neither estimate. This is an indication that both variables convey di¤erentinformation. Moreover, in the emerging countries and CEE panels, the estimated parametersdo not allow to infer implicit weights for the tradable sector, which is a further indication ofboth variables relying to di¤erent phenomena.
12
are something of a mixture of the three panels analysed above. The productivityvariables are signi�cant and correctly signed with a size somewhere betweenthose obtained for the OECD panel, on the one hand, and for the emergingand transition economies, on the other hand. The net foreign assets variableturns out to be positive as in the transition countries panel. This is probablybecause in the emerging market panel some countries may also have recordedappreciation alongside foreign debt growth. In addition, higher net foreign assetsmay also be connected to a depreciation, if the movements towards a higher netforeign assets position dominates the e¤ect of subsequent income �ows, whichmay be the case in some of the countries in the OECD panel.
4.2 The Sign on Net Foreign Assets for Transition Economies
The increasing literature on equilibrium exchange rates is not conclusive re-garding the sign of net foreign assets relative to the real exchange rate. Forinstance, Burgess et al. (2003) �nd a positive sign between NFA and the realexchange rate for the three Baltic states: a decrease (increase) in the NFA posi-tion causes the real exchange rate to appreciate (depreciate). Alonso-Gamo etal. (2002) and Lommatzsch and Tober (2002) come to the same conclusion forLithuania, and for the Czech Republic, Hungary and Poland, respectively, asAlberola (2003) does for the case of the Czech Republic. By contrast, Hinnosaret al. (2003) �nd a negative sign for Estonia, and Rahn (2003) for Czech Re-public, Estonia, Hungary, Poland and Slovenia, i.e. a decrease (increase) in theNFA position causes the real exchange rate to depreciate (appreciate). Alberola(2003) comes to the same conclusion for Hungary and Poland. Csajbók (2003),Darvas (2001) and Bitans and Tillars (2003) con�rm these �ndings. Using asmall panel of transition countries, MacDonald and Wojcik (2002) suggest thatthe sign changes in function of the estimated equation.Our results indicate that net foreign assets have a very robust positive link
to the real exchange rate for transition economies, and to a lesser extent foremerging countries. In contrast with this �nding is the observation that NFAbear a strong negative tie to the real exchange rate for a set of small, open OECDcountries. This appears to be a major piece of evidence for the explanationprovided in Égert (2003), according to which in the medium to long term, NFAmay be positively linked to the real exchange rate, but the direction of thislink changes in the longer run. Within the framework of the stock-�ow assetmodel of the real exchange rate shown earlier, this can be explained by the factthat in the medium run, transition economies are moving towards their desiredstock of foreign assets because the higher growth potential cannot be �nanced bydomestic savings only and the use of foreign savings implies the accumulation offoreign liabilities. However, in the long run, the desired level of foreign assets isachieved, and payments on the existing stock of foreign liabilities would reversethe relationship: the higher the stock of foreign liabilities, the higher the needfor real exchange rate depreciation to service the debt through an improvedtrade account, and vice versa. This is exactly what we observe for the averageof the OECD countries.
13
DOLS DOLS_AIC DOLS_SIC MGE MGE_AIC MGE_SIC No. OBS
OECDCOINT -0.043*** -0.041*** -0.042*** 1554PROD -0.165*** -0.166*** -0.160*** 0.083 -0.140 0.124NFA -0.076*** -0.075*** -0.074*** -0.224*** -0.236*** -0.235***COINT -0.054*** -0.051*** -0.052*** 1590REL -0.745*** -0.760*** -0.763*** -1.132*** -1.214*** -0.744***NFA 0.037 0.035 0.035 -0.495 -0.513* -0.088
EMERGING MARKET ECONOMIESCOINT -0.034*** -0.036*** -0.033*** 564PROD -1.481*** -1.486*** -1.217*** -1.841*** -1.769*** -1.858*NFA -0.359 -0.361 -0.340 -0.078 0.049 0.063
COINT -0.054*** -0.054*** -0.054*** 704REL -1.443*** -1.450*** -1.449*** -1.479*** -1.479*** -1.479***NFA -0.205 -0.209 -0.192 -0.276 -0.276 -0.276
CEEC11COINT -0.138*** -0.148*** -0.148*** 423PROD -0.455*** -0.471*** -0.437*** -0.045* -0.017*** -0.024***NFA 0.627*** 0.631*** 0.569*** 0.343*** 0.379*** 0.540***COINT -0.103*** -0.086*** -0.088*** 427REL -1.479*** -1.656*** -1.663*** -1.161*** -0.476*** -0.510***NFA 0.437*** 0.374*** 0.376*** 0.202*** 0.294*** 0.243***
CEEC5COINT -0.174*** -0.199*** -0.197*** 197PROD -0.780*** -0.736*** -0.736*** -0.760*** -0.824*** -0.790***NFA 0.121*** 0.172*** 0.176*** 0.150** 0.115 0.156
COINT -0.100*** -0.086*** -0.089*** 197REL -0.949*** -0.994*** -1.036*** -1.046** -1.128*** -1.216***NFA 0.423*** 0.397*** 0.398*** 0.124*** 0.246* 0.125
The CPI-based real e¤ective exchange rate
Notes DOLS_SIC are the DOLS estimates obtained on the basis of the Schwarzinformation criterion. The same applies to the mean group estimators (MGE_SIC).*,*** and *** denote respectively statistical signi�cance at the 10%, 5% and 1% levels.In the row �coint�under MGE_SIC and PMGE are shown the error correction terms.
4.3 The PPI-based Real E¤ective Exchange Rate
In a second step, equations (4) and (4�) are used which connect the real e¤ectiveexchange rate de�ated by the PPI �which proxies tradable goods prices �toproductivity / the CPI-to-PPI ratio and net foreign assets. The aim of this seriesof exercises is to investigate the impact of productivity on the real exchange rateof the open sector.For the OECD countries, the productivity variables switch sign and become
14
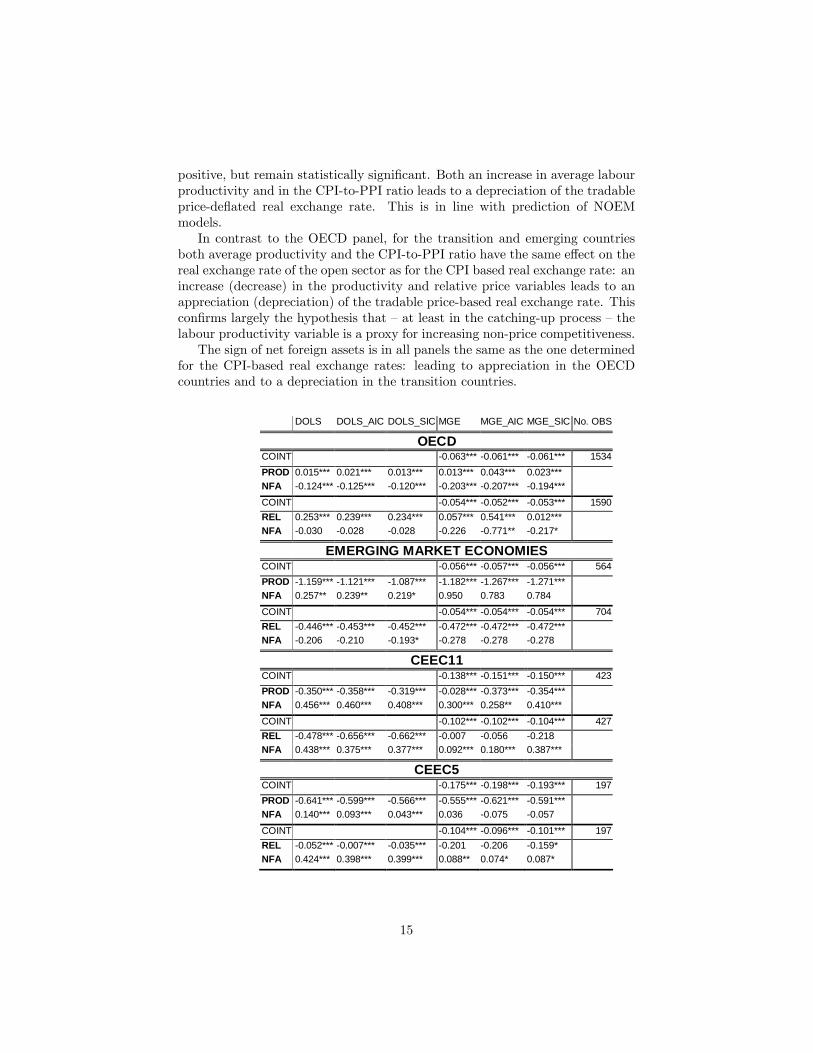
positive, but remain statistically signi�cant. Both an increase in average labourproductivity and in the CPI-to-PPI ratio leads to a depreciation of the tradableprice-de�ated real exchange rate. This is in line with prediction of NOEMmodels.In contrast to the OECD panel, for the transition and emerging countries
both average productivity and the CPI-to-PPI ratio have the same e¤ect on thereal exchange rate of the open sector as for the CPI based real exchange rate: anincrease (decrease) in the productivity and relative price variables leads to anappreciation (depreciation) of the tradable price-based real exchange rate. Thiscon�rms largely the hypothesis that �at least in the catching-up process �thelabour productivity variable is a proxy for increasing non-price competitiveness.The sign of net foreign assets is in all panels the same as the one determined
for the CPI-based real exchange rates: leading to appreciation in the OECDcountries and to a depreciation in the transition countries.
DOLS DOLS_AIC DOLS_SIC MGE MGE_AIC MGE_SIC No. OBS
OECDCOINT -0.063*** -0.061*** -0.061*** 1534PROD 0.015*** 0.021*** 0.013*** 0.013*** 0.043*** 0.023***NFA -0.124*** -0.125*** -0.120*** -0.203*** -0.207*** -0.194***
COINT -0.054*** -0.052*** -0.053*** 1590REL 0.253*** 0.239*** 0.234*** 0.057*** 0.541*** 0.012***NFA -0.030 -0.028 -0.028 -0.226 -0.771** -0.217*
EMERGING MARKET ECONOMIESCOINT -0.056*** -0.057*** -0.056*** 564PROD -1.159*** -1.121*** -1.087*** -1.182*** -1.267*** -1.271***NFA 0.257** 0.239** 0.219* 0.950 0.783 0.784
COINT -0.054*** -0.054*** -0.054*** 704REL -0.446*** -0.453*** -0.452*** -0.472*** -0.472*** -0.472***NFA -0.206 -0.210 -0.193* -0.278 -0.278 -0.278
CEEC11COINT -0.138*** -0.151*** -0.150*** 423PROD -0.350*** -0.358*** -0.319*** -0.028*** -0.373*** -0.354***NFA 0.456*** 0.460*** 0.408*** 0.300*** 0.258** 0.410***
COINT -0.102*** -0.102*** -0.104*** 427REL -0.478*** -0.656*** -0.662*** -0.007 -0.056 -0.218NFA 0.438*** 0.375*** 0.377*** 0.092*** 0.180*** 0.387***
CEEC5COINT -0.175*** -0.198*** -0.193*** 197PROD -0.641*** -0.599*** -0.566*** -0.555*** -0.621*** -0.591***NFA 0.140*** 0.093*** 0.043*** 0.036 -0.075 -0.057
COINT -0.104*** -0.096*** -0.101*** 197REL -0.052*** -0.007*** -0.035*** -0.201 -0.206 -0.159*NFA 0.424*** 0.398*** 0.399*** 0.088** 0.074* 0.087*
15
The PPI-based real exchange rateNotes as for Table 3
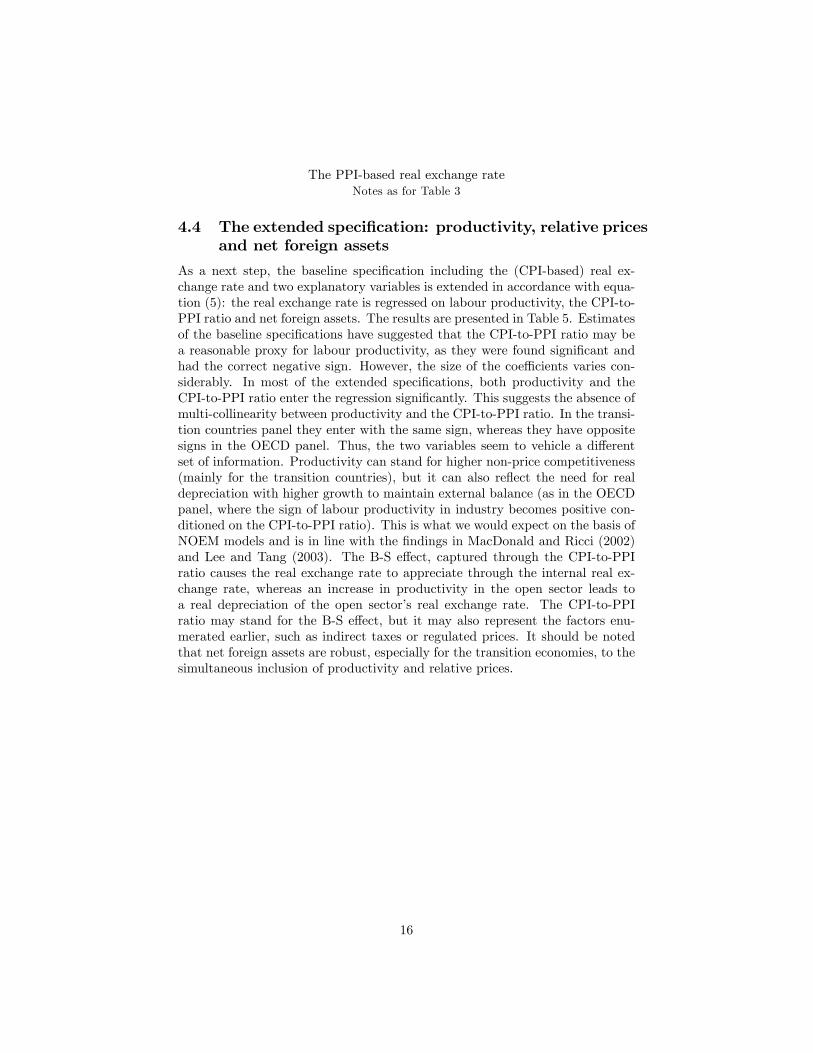
4.4 The extended speci�cation: productivity, relative pricesand net foreign assets
As a next step, the baseline speci�cation including the (CPI-based) real ex-change rate and two explanatory variables is extended in accordance with equa-tion (5): the real exchange rate is regressed on labour productivity, the CPI-to-PPI ratio and net foreign assets. The results are presented in Table 5. Estimatesof the baseline speci�cations have suggested that the CPI-to-PPI ratio may bea reasonable proxy for labour productivity, as they were found signi�cant andhad the correct negative sign. However, the size of the coe¢ cients varies con-siderably. In most of the extended speci�cations, both productivity and theCPI-to-PPI ratio enter the regression signi�cantly. This suggests the absence ofmulti-collinearity between productivity and the CPI-to-PPI ratio. In the transi-tion countries panel they enter with the same sign, whereas they have oppositesigns in the OECD panel. Thus, the two variables seem to vehicle a di¤erentset of information. Productivity can stand for higher non-price competitiveness(mainly for the transition countries), but it can also re�ect the need for realdepreciation with higher growth to maintain external balance (as in the OECDpanel, where the sign of labour productivity in industry becomes positive con-ditioned on the CPI-to-PPI ratio). This is what we would expect on the basis ofNOEM models and is in line with the �ndings in MacDonald and Ricci (2002)and Lee and Tang (2003). The B-S e¤ect, captured through the CPI-to-PPIratio causes the real exchange rate to appreciate through the internal real ex-change rate, whereas an increase in productivity in the open sector leads toa real depreciation of the open sector�s real exchange rate. The CPI-to-PPIratio may stand for the B-S e¤ect, but it may also represent the factors enu-merated earlier, such as indirect taxes or regulated prices. It should be notedthat net foreign assets are robust, especially for the transition economies, to thesimultaneous inclusion of productivity and relative prices.
16
DOLS DOLS_AIC DOLS_SIC MGE MGE_AIC MGE_SIC No. OBS
OECDCOINT -0.073*** -0.070*** -0.070*** 1534PROD 0.016*** 0.011*** 0.016*** 0.105 0.103 0.064REL -0.811*** -0.811*** -0.803*** -0.501*** -0.584*** -0.610***NFA -0.012 -0.019* -0.020* -0.184 -0.198** -0.124*
EMERGING MARKET ECONOMIESCOINT -0.074*** -0.074*** -0.074*** 564PROD -1.264*** -1.197*** -1.168*** -2.864* -1.737 -1.560REL -1.332*** -1.349*** -1.365*** -0.472*** -1.045*** -1.144***NFA -0.314 -0.295 -0.257 -1.298 -0.543 -0.574
CEEC11COINT -0.106*** -0.143*** -0.112*** 423PROD -0.514*** -0.488*** -0.486*** -0.124 -0.077*** -0.007*REL -1.502*** -1.657*** -1.652*** -1.241 -0.795** -0.904NFA 0.276*** 0.179*** 0.190*** 0.192*** 0.184*** 0.046***
CEEC5COINT -0.187*** -0.197*** -0.173*** 197PROD -0.475*** -0.459*** -0.454*** -0.248*** -0.389*** -0.306***REL -0.485*** -0.491*** -0.479*** -1.100*** -0.863*** -0.983***NFA 0.181*** 0.202*** 0.226*** 0.138* 0.085* 0.030
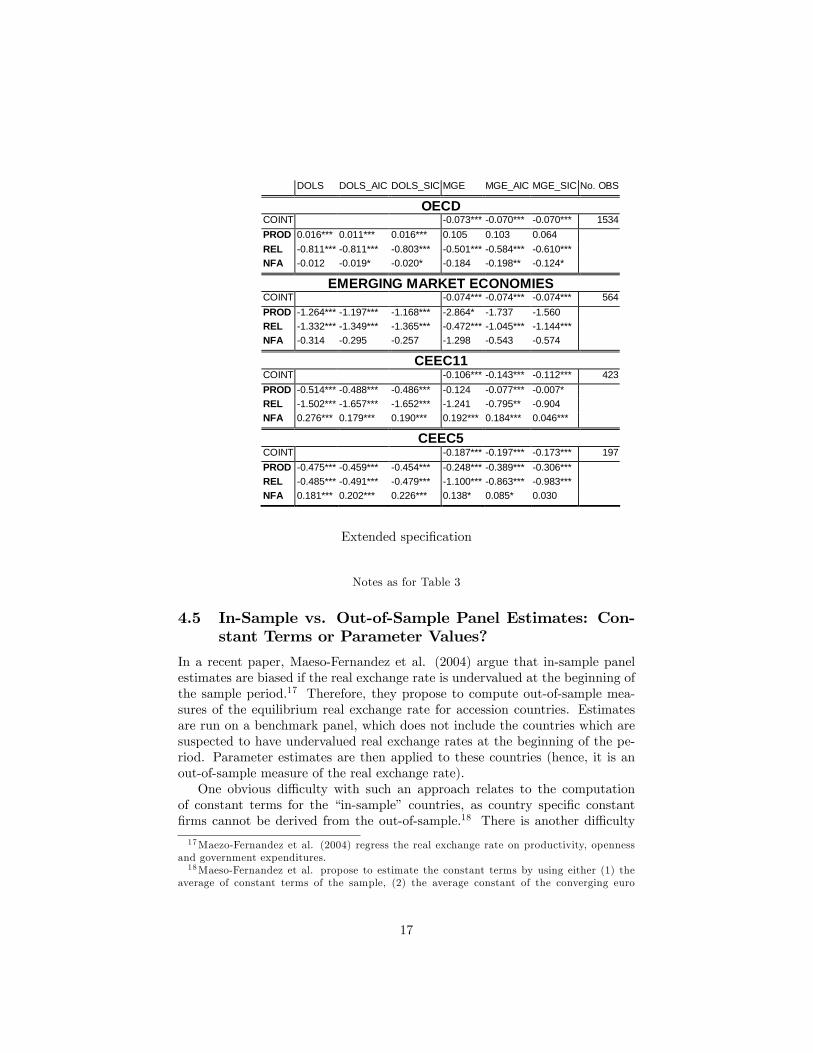
Extended speci�cation
Notes as for Table 3
4.5 In-Sample vs. Out-of-Sample Panel Estimates: Con-stant Terms or Parameter Values?
In a recent paper, Maeso-Fernandez et al. (2004) argue that in-sample panelestimates are biased if the real exchange rate is undervalued at the beginning ofthe sample period.17 Therefore, they propose to compute out-of-sample mea-sures of the equilibrium real exchange rate for accession countries. Estimatesare run on a benchmark panel, which does not include the countries which aresuspected to have undervalued real exchange rates at the beginning of the pe-riod. Parameter estimates are then applied to these countries (hence, it is anout-of-sample measure of the real exchange rate).One obvious di¢ culty with such an approach relates to the computation
of constant terms for the �in-sample� countries, as country speci�c constant�rms cannot be derived from the out-of-sample.18 There is another di¢ culty
17Maezo-Fernandez et al. (2004) regress the real exchange rate on productivity, opennessand government expenditures.18Maeso-Fernandez et al. propose to estimate the constant terms by using either (1) the
average of constant terms of the sample, (2) the average constant of the converging euro
17
however, which is evidenced by the sensitiveness of parameter values to thecomposition of the geographical sample. Depending on the countries included inthe sample, our results show that estimated coe¢ cients can change dramatically.At least on the basis of the stock-�ow approach, this result strongly questionsthe economic meaning of equilibrium exchange rate measures, which rest onlyon out-of-sample estimates.Indeed, while out-of-sample estimates mirror long-term behaviour � and
can be di¢ cult to interpret in policy terms �, in-sample estimates may re�ectmedium-term developments and therefore trace the equilibrium developmentmore appropriately for policy purposes.Therefore, out-of-sample estimates alone do not allow to assess the degree
of misalignment of a currency because of the strong heterogeneity between thepanel for which the estimations are performed and the countries for which thoseestimations are applied. When this is not the case, in-sample estimates areuseful to assess whether the observed long-run misalignment is compensated bya medium-run equilibrium, or whether it is both a long-run and medium-termmisalignment.
5 Conclusion
In this study, we used the stock-�ow approach to the equilibrium exchange rateproposed by Alberola et al. (1999, 2002) to determine long-term factors drivingthe real exchange rate and compare results from in-sample and out-of-sample es-timates. We also follow Aglietta et al. (1998) by taking into account the impactof non-price competitiveness on equilibrium real exchange rate developments.A number of conclusions arise from our empirical analysis.Firstly, we show that the normally positive relationship between net foreign
asset accumulation and real exchange rate appreciation is not a general featureof small open economies. A number of papers had already shown that a decreasein net foreign assets yields an appreciation of the real exchange rate in transitioneconomies. Using panel cointegration techniques, and splitting our sample intosmaller and more homogeneous sub-samples, we show that an improving netforeign asset position does correspond to a real exchange rate appreciation for agroup of small and open OECD countries. By contrast, a decrease in net foreignassets is found to be systematically linked to a real appreciation of the exchangerate for di¤erent groups of transition economies.We suggest that the systematically di¤erent sign of net foreign assets may be
related to the time period studied, i.e. the distinction between the medium runand the long run. The 30-year period for the OECD countries may be viewed asthe long term, whereas the slightly more than 10-year period for the transitioneconomies can be considered as the medium run, i.e. convergence towards along-term level. According to the model, in the long run, net foreign assets
area countries, such as Greece, Portugal and Spain, or (3) the lowest constant term of theeuro area countries. Note, however that these strategies do not allow for the case when thecountry-speci�c constant terms are outside the range given by the out-of-sample panel.
18
are assumed to have reached their desired level. Therefore, an increase in netforeign assets implies an appreciation of the real exchange rate because highernet foreign assets mean higher in�ows of income. However, the medium run ischaracterised by the adjustment of net foreign assets to their desired level. Ifcountries desire a negative stock of net foreign assets (which seems to be thecase in the transition economies), they run current account de�cits and recorda real appreciation of the exchange rate.Secondly, the sources of CPI-based real exchange rate appreciation di¤er
between groups of countries. Real exchange rate in OECD countries are foundto behave in line with predictions of NOEM models implying that the B-S e¤ectcauses the real exchange rate to appreciate whilst productivity gains in the opensector result in a depreciation of the open sector�s real exchange rate. In contrastto this stand our �ndings for transition economies, where the real exchange rateappreciates not only because of B-S type of factors but also because of theappreciation of the open sector driven by improving non-price-competitiveness.Thirdly, our results indicate that the CPI-to-PPI ratio is an imperfect proxy
for relative prices when measuring the B-S e¤ect because this ratio not onlyre�ects the relative price of market-based non-tradable goods but also a numberof other factors. Moreover, it is not appropriate to use the CPI-to-PPI ratio(and relative prices in general) as a proxy for relative productivity in transitioneconomies because it cannot fully convey the e¤ect of productivity gains to thereal exchange rate, i.e. the appreciation of the real exchange rate of the opensector.Finally, we show that sizeable di¤erences exist between in-sample (transition
economies and all countries put together) and out-of-sample (OECD countries),as regards the sign and the size of the estimated coe¢ cients. This suggests thatboth measures o¤er complementary information on equilibrium exchange rates.Equilibrium rates derived from the panel of OECD countries give an insight onthe long run for the transition economies, but may be less easily interpreted forpolicy purposes.
19
6 References
Aglietta, M., C. Baulant and V. Coudert (1998) Why the euro will be strong:An approach based on equilibrium exchange rates, Revue Economique, 49(3),721-731.Alberola, E. (2003) Real Convergence, External Disequilibria and Equilib-
rium Exchange Rates in EU Acceding Countries, Banco de España mimeo.Alberola, E., S. G. Cervero, H. Lopez and A. Ubide (1999) Global Equilib-
rium Exchange Rates: Euro, Dollar, �Ins,��Outs,�and Other Major Currenciesin a Panel Cointegration Framework, IMF Working Paper No. 175.Alberola, E., S. G. Cervero, H. Lopez and A. Ubide (2002) Quo vadis Euro?
The European Journal of Finance, 8, 352-370.Alonso-Gamo, P., S. Fabrizio, V. Kramarenko and Q. Wang (2002) Lithua-
nia: History and Future of the Currency Board Arrangement, IMF WorkingPaper No. 127.Backé, P., J. Fidrmuc, T. Reininger and F. Schardax (2003) Price dynamics
in Central and Eastern European EU Accession Countries, Emerging MarketsFinance and Trade 39(3). 42�78.Bénassy-Quéré, A., Duran-Vigneron, P., Mignon, V. and A. Lahrèche-Révil
(2004) Distributing Key Currency Adjustment: A G-200 Panel CointegrationApproach, CEPII working paper No. 2004-13, September.Benigno, G. and C. Thoenissen (2003) Equilibrium Exchange Rates and
Capital and Supply Side Performance, Economic Journal, 113(486), 103-124.Bitans, M. and I. Tillers (2003) Estimates of Equilibrium Exchange Rate in
Latvia. Bank of Latvia mimeo.Burgess, R., Fabrizio, S. and Y. Xiao (2003) Competitiveness in the Baltics
in the Run-Up to EU Accession, IMF Country Report No. 114.Coricelli, F. and B. Jazbec (2004) Real Exchange Rate Dynamics in Transi-
tion Economies. Structural Change and Economic Dynamics, 15 (1), 83-100.Csajbók, A. (2003) The Equilibrium Real Exchange Rate in Hungary: Re-
sults from Alternative Approaches. Paper presented at the 2nd Workshop onMacroecomic Policy Research, National Bank of Hungary, October 2�3.Crespo-Cuaresma, J., J. Fifrmuc and R. MacDonald (2004) The Monetary
Approach to Exchange Rates in the CEECs, William Davidson Institute Work-ing Paper No. 642.Darvas, Zs. (2001) Exchange Rate Pass-Through and Real Exchange Rate
in EU Candidate Countries, Economic Research Centre of the Deutsche Bun-desbank Discussion Paper No. 10.Égert, B. (2002) Investigating the Balassa-Samuelson Hypothesis in the
Transition: Do We Understand What We See? A Panel Study, Economicsof Transition 10(2). 273�309.Égert, B. and K. Lommatzsch (2004) Equilibrium Exchange Rate in the
Transition: The Tradable Price-Based Appreciation and Estimation Uncer-tainty, William Davidson Institute Working Paper No. 676Égert, B., I. Drine, K. Lommatzsch and Ch. Rault (2003) The Balassa-
Samuelson E¤ect in Central and Eastern Europe: Myth or Reality? Journal of
20
Comparative Economics 31(3), 552�572.Faruqee, H. (1995) Long-Run Determinants of the Real Exchange Rate: A
Stock-Flow Perspective, IMF Sta¤ Papers. 42(1), 80-107.Frenkel, J.A and M. L. Mussa (1985) Asset Markets, Exchange Rates and
the Balance of Payments. In R. W. Jones and P.B. Kenen (eds). Handbook ofInternational Economics. 2. North-Holland, Amsterdam, 679-747.Halpern, L. and Ch. Wyplosz (2001) Economic Transformation and Real
Exchange Rates in the 2000s: The Balassa-Samuelson Connection, UNO Eco-nomic Survey of Europe, 227�239.Hinnosar, M., R. Juks, H. Kaadu and L. Uusküla (2003) Estimating the
Equilibrium Exchange Rate of the Estonian Kroon, Bank of Estonia. mimeo.Im, K. S., M. H. Pesaran and Y. Shin (2003) Testing for unit roots in het-
erogeneous panels. Journal of Econometrics. 115(1), 53�74.Kim, B. Y. and I. Korhonen (2002) Equilibrium Exchange Rates in Transi-
tion Countries: Evidence from Dynamic Heterogeneous Panel Models, BOFITDiscussion Paper No. 15.Krugman, P. (1989) Di¤erences in Income Elasticities and Trends in Real
Exchange Rates, European Economic Review. 33 (5). 1031-1054.Lane, Ph. And G. M. Milesi-Ferretti (2002) External Wealth, the Trade
Balance and the Real Exchange Rate. CEPR Discussion Paper No. 3153.Lee, J. and M. K. Tang (2003) Does Productivity Growth Lead to Appreci-
ation of the Real Exchange Rate? IMF Working Paper 154.Lommatzsch, K. and S. Tober (2002) What Is behind the Real Appreciation
of the Accession Countries� Currencies? An Investigation of the PPI-BasedReal Exchange Rate. Presented at "Exchange Rate Strategies during the EUEnlargement." Budapest. 27 �30 November.Lommatzsch, K. and S. Tober (2004) The in�ation target of the ECB: Does
the Balassa-Samuelson e¤ect matter? DIW-Berlin mimeo.MacDonald, R. and L. Ricci (2002) Purchasing Power Parity and New Trade
Theory, IMF Working Paper No. 32.MacDonald, R. and C. Wójcik (2004) Catching Up: The Role of Demand,
Supply and Regulated Price E¤ects on the Real Exchange Rates of Four Acces-sion Countries, Economics of transition, 12(1), 153-179.Maeso-Fernandez, F., Ch. Osbat and B. Schnatz (2004) Towards the Esti-
mation of Equilibrium Exchange Rates for CEE Acceding Countries: Method-ological Issues and a Panel Cointegration Perspective, ECB Working Paper No.353.Mihaljek, D. and M. Klau (2004) The Balassa-Samuelson E¤ect in Central
Europe: A Disaggregated Analysis, Comparative Economic Studies, 46(1), 63-94Pesaran, M. H., Y. Shin and R. J. Smith (1999) Pooled mean group es-
timation of dynamic hetergoneous panels, Journal of the American StatisticalAssociation, 94, 621-634.Rahn, J. (2003) Bilateral Equilibrium Exchange Rates of the EU Accession
Countries Against the Euro, BOFIT Discussion Paper No. 11.
21
Rawdanowicz, ×. W. (2003) Poland�s Accession to EMU: Choosing the Ex-change Rate Parity. CASE Studies&Analyses 247. December 2002, and forth-coming in: De Souza, L.V. and B. Van Aarle (eds.). The Euro Area and theNew EU Member States. New York: Palgrave Macmillan.Világi, B. (2004) Dual In�ation and Real Exchange Rate in New Open Econ-
omy Macroeconomics, National Bank of Hungary Working Paper No. 5.
22