Embed Size (px)
Citation preview

)
)
THE STRATIFICATION PROCESS
(Modified and Updated By)
Yvonne H. Dodson
(Edited by )
P. Gajary, M. Kim, F. Moore and R. Roberts
July 1994
(1st version 1980 by Kevin Dunleavy)

)
)
2
STRA TIFICA TION
Land-use stratification is the division of a land area into broad land-use categories. The major landuses we distinguish are cultivation, natural vegetation or range, cities, non-agricultural land and largebodies of water. Each of the major land uses can be subdivided into various substrata (separate stratafor individual crops in agricultural areas, for example). Stratification in this way makes for moreefficient sampling and estimates for livestock, crop, and farm counts.
To complete construction of the land-use frame, each substratum is further subdivided into primarysampling units (specific land areas with an assigned number of sampling units). Sampling units arethen selected at random for enumeration.
The materials used in the stratification process include aerial photography, satellite imagery,topographic and county maps, and other available agricultural information and statistics.
Land-use strata are separated by boundaries identifiable on Landsat, supplemental maps and aerialphotography. These boundaries must be visible on the groundso that accurate information can be collected during segment enumeration. Acceptable boundariesinclude roads, railroads, and rivers. Since the land-use sampling frame cannot be revised each year,permanent boundaries must be used.
Each defined stratum should be used as a target for locating a particular type of land use. Thestratum must be as homogeneous as possible throughout the state. ( Homogeneous = meaning eachstrata is accurately representing the percentage of cultivation of the strata definition.
Once the boundaries have been drawn on the aerial photography or topographic maps they aretransferred to the county maps for use as the area sampling frame.
STRA TUM BOUNDARIES
Land-use strata are separated by boundaries which we identifY on Landsat, aerial photography,topographic and county maps. In many cases these stratum boundaries will be used as segmentboundaries. To assure that accurate information can be collected during segment enumeration,boundaries must be identifiable on the ground. Since the sampling frame cannot be revised each year,it will be necessary to choose boundaries that are permanent. These boundaries must be identifiablefor as long as the frame is in existence (ten to fifteen year average).
The following is a list of physical geographic features which represent strata boundaries. The list isranked from highest to lowest:
1. Paved Highways2. Secondary all weather roads3. Railroads

)
)
3
4. Local farm to market roads (unimproved roads)5. Permanent rivers and streams6. Permanent drainage and irrigation canals7. Visible section lines8. Trails and internal roads9. Intermittent streams and rivers or prominent water courses that carry water during or
immediately following rains.
Occasionally, when delineating non-agricultural areas it is acceptable to use legal, permanentboundaries recognized within the state. These boundaries often will not be visible on aerialphotography. These areas include state and national parks, military bases, large airports, and wildliferefuges.
Do not, under any circumstances, split a field with a boundary.
STRATA DEFINITIONS
Each stratum definition should be used as a target for locating a particular type of land use within astate. A stratum should be as homogeneous as possible throughout the state. Because of boundaryand minimum stratum block constraints, it will be impossible to place all land areas into the stratummost appropriate. Small areas of differing land will have to be merged into a single stratum in somecases. Boundary problems, sometimes cause areas of non-agricultural land to be included in areasof agricultural land, thus lowering the percentage of cultivation in the strata block.
Most of the strata definitions will remain constant from state to state. Intensive agricultural stratawill be the most subject to change.
COUNTY BOUNDARIES
Prior to starting stratification, all county boundaries must be outlined. For the most part countyboundaries do not follow permanent features that are visible on aerial photography. County boundarylines are often straight lines drawn from one point to another or following longitude and latitude lines.It will be necessary to use some permanent physical features in the vicinity. This will entail tradingofland areas with bordering counties. With each bordering county, land should be given and takenin roughly equal proportions to avoid expanding a county's total land area.
To find the exact position of the county borders check the topographic maps. Counties that do notfollow permanent land features must be changed. Use the aerial photograph along with thetopographic maps to determine the best boundaries available. Try to choose boundaries which mostefficiently stratifY the land. "'(Example) a small rural town that is split by a county boundary shouldbe placed entirely in one county. Do the same for small agricultural areas.
)
)
4
Land trade-off's will not occur between states. The state borders must be drawn exactly as they existon the neighboring state's Area Frame Map.
Draw the boundaries on the photographs. Usa a color not used for strata blocks. (ex. black greasepencil) . They can later be changed to the appropriate strata color.
The next step in the stratification process is the delineation of urban, nonagricultural and water areas.
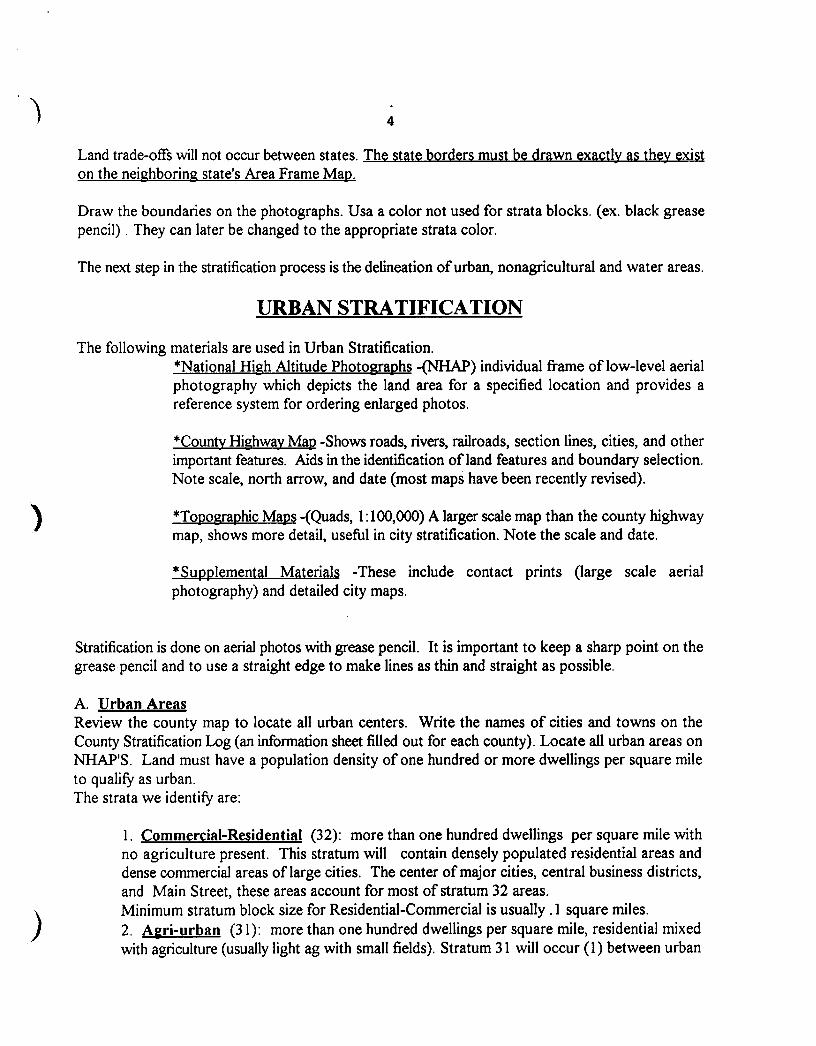
URBAN STRA TIFICA TION
The following materials are used in Urban Stratification.*National High Altitude Photographs -(NHAP) individual frame oflow-Ievel aerialphotography which depicts the land area for a specified location and provides areference system for ordering enlarged photos.
*County Highway Map -Shows roads, rivers, railroads, section lines, cities, and otherimportant features. Aids in the identification of land features and boundary selection.Note scale, north arrow, and date (most maps have been recently revised).
*Topographic Maps -(Quads, 1:100,000) A larger scale map than the county highwaymap, shows more detail, useful in city stratification. Note the scale and date.
*Supplemental Materials -These include contact prints (large scale aerialphotography) and detailed city maps.
Stratification is done on aerial photos with grease pencil. It is important to keep a sharp point on thegrease pencil and to use a straight edge to make lines as thin and straight as possible.
A. Urban AreasReview the county map to locate all urban centers. Write the names of cities and towns on theCounty Stratification Log (an information sheet filled out for each county). Locate all urban areas onNHAP'S. Land must have a population density of one hundred or more dwellings per square mileto qualify as urban.The strata we identify are:
1. Commercial-Residential (32): more than one hundred dwellings per square mile withno agriculture present. This stratum will contain densely populated residential areas anddense commercial areas of large cities. The center of major cities, central business districts,and Main Street, these areas account for most of stratum 32 areas.Minimum stratum block size for Residential-Commercial is usually .1 square miles.2. Aeri-urban (31): more than one hundred dwellings per square mile, residential mixedwith agriculture (usually light ag with small fields). Stratum 31 will occur (1) between urban

)
5
areas oflarge cities and towns (stratum 32) and the open country~ (2) in small cities or townsand (3) include industrial and recreation areas, parks and golf courses and airports.
Not all areas with one hundred or more dwellings will be placed in an urban stratum. Somedensely populated agricultural areas will have dwellings numbering over one hundred persquare mile dotted along roads. Decide what is the main activity of the land. If fields arelarge and cultivation appears intensive it will be best to put these areas in an agriculturalstratum.
Most stratum 32 areas will be surrounded by land that should be classified as stratum 31. Allindustrial and non-agricultural developed areas on the periphery of cities will be included inthis stratum also.
A stratum 31 minimum stratum block size is .25 square miles.
Some very small but densely populated towns that are composed mainly of city blocks mayfit the Residential-Commercial definition.
For all urban strata use maps and photography simultaneously to find good boundaries. Quad mapsare the most useful materials available for this purpose. Keep in mind that cities in some areas aregrowing rapidly. Use the most recent maps/photos to determine the extent of growth. Ifno recentmaterials are available and growth is suspected, it may be necessary to move boundary lines forAgri-Urban strata out to account for possible growth. See a reviewer before doing this. Neverstretch Residential-Commercial (32) boundaries in this way, however. Areas where dense urbangrowth is suspected are better left in stratum 31.
Some rapidly growing states may have a separate "Potential-Urban" stratum (34) representing landsthat in the next few years are schedules or expected to be developed. (Maps will be provided showingproposed construction sites in areas where this stratum will apply.)
B. Non-A2ricultural
Non -Aericultural Lands (50): lands include areas designated by law for purposes otherthan agriculture. State and national monuments national parks, game and wildlife refuges,military installations and large airports would be included. Usually these areas have definite,legal boundaries delineated on the county map. These boundaries often do not correspondwith features that are visible on the aerial photography, but should be used nonetheless.Other large non-agricultural uses may be placed in stratum 50, these include mining andindustry.
Prior to stratifying each state, a list of potential 50's ( non-agricultural land) is sent to the state. Theseareas ar checked for agriculture and grazing. If there is no agriculture or grazing in these areas, theyare compiled to make the state 50's list.

)
)
6
Make sure no agriculture is present in this stratum. Sometimes land in military installations, nearairports,and inside prison boundaries (prison farms) will be used for agriculture. Examine thephotography and if agriculture is present do not place is stratum 50. sometimes grazed. Check your50's list before delineating any 50. Airports will be placed in stratum 50 only if they meet theminimum size restriction (usually two square miles). Airports too small for this stratum will be placedin stratum 31. Small private airstrips should not be delineated and will be placed in the stratum of thesurrounding land.
Non-Agricultural area (strata 50) minimum block size is one square mile.
C. WaterBodies of water (62): Water bodies, greater than one square mile will be placed in stratum62. Only include water areas that lie within county boundaries. Ocean, ocean bays, and otherbodies of water with outlets to the sea will not be included in stratum 62. These areas willnot be stratified. Narrow rivers that have over one square mile of surface area will not betaken out because of problems with transferral of these boundaries to smaller scale countymaps and to make digitization (a computerized method for measuring delineated land areas)easIer.
When a river is used as a stratum boundary, place the boundary line in the center of the river.Do not put the entire river into one stratum. When delineating stratum 62 keep in mind thatflooding and drought can temporarily change the size of water bodies. If differences areevident on materials, determine where the permanent boundary should lie. Usually thesupplemental maps and Landsat will be reliable sources.
Checkin2 Urban Stratification
Urban Stratification will be checked and reviewed. Reviewing will be done only by designated"reviewers." Others should check and do counties in equal proportion.
When checking make sure all appropriate areas have been delineated, and good boundaries have beenused. To check boundaries, compare NHAP'S with quads and other maps. If a boundary on thephotography fails to correspond with a feature shown on the map, make sure the boundary used isacceptable. To do this you might have to erase portions of the boundary line. If you erase, re-drawthe boundary. If you find something you do not agree with, do not change the stratification. Onlysuggest changes. Slip the photo into an acetate jacket, and make the suggested changes on theacetate. Discuss these changes with the stratifier. If the stratifier does not agree with them, leave itfor the reviewer. The reviewer will later decide what changes should be made and discuss them withthe stratifier and the checker.
Communication between the parties involved is important. This will allow us to see what mistakesare being made and will help make our product more consistent.
)
7
Material Transfer
After Urban Stratification has been checked, the next step is transfer of the boundaries from the aerialphotography to quads and supplementary materials. Transfer the boundaries using colored pencils.After the boundary has been outlined, shade inside the border lightly about 1/4 inch.
If in the material transfer process you find a better boundary than the one used, you may change thestratification with the permission ofa reviewer. Material transfer will be reviewed. When reviewing,make sure all urban stratification has been transferred to the available materials. All stratum 32 areasmust be transferred to quads. If there is no quad coverage in the county packet, it should be orderedfor future transfer. If no quad coverage is available through U.S. Geologic Survey, some othermaterials should be obtained (Talk to Supervisor).
SATELLITE IMAGERY
The basic tool used in agricultural stratification will be satellite imagery.
Satellite imagery is derived from digital data collected by scanners aboard the satellite. Presently, theimagery product from LANDSAT satellite is used. A scanner mounted on the satellite collects thereflected and emitted energy from the ground. Two types of scanners are used: a multispectralscanner (MSS) and a thematic mapper (TM). The optics of the scanner separate this energy intobands - four for MSS and seven for TM.
The spatial resolution is 60 meters for MSS and 30 meters for TM. The increased number of bandscoupled with the much greater resolution makes TM the preferred product for stratification.
LANDSAT will be used primarily to determine cultivated and what crops are present in a county.Theoretically different crops will show different color signatures depending on the stage of growth.
Wheat, for example, will show a brown soil signature prior to the planting of the crop. A light greencolor follows after planting in the pre-emergence stage. As the crop sprouts a reddish appearanceoccurs and becomes a deeper red as growth continues. A ripe wheat field will have a greenish-yellowcolor, becoming greener just prior to harvest. After harvest the field will appear white or tan. Mostcrops will follow this general pattern.
Crop calendars will be available showing approximate planting, growing, and harvest periods formajor crops in the state. Ifa bright red signature is apparent on LANDSAT in an agricultural area,look on the crop calendar and find what crop is in the growing stage in the season indicated on theLANDSAT scene. If multitemporal coverage (more than one scene of a LANDSAT print) isavailable follow the crop through its varicus stages of growth to see if it agrees with the colorsoutlined for the particular crop. Ifmultitemporal coverage is available for the print(s) covering thecounty, note the various dates of scenes.
)
)
8
For more about LANDSAT imagery interpretation, see "Landsat Analyst".
Preparine LANDSAT for Use in Stratification
You will be provided with a county overlay, an acetate copy of the county highway map adjusted tothe scale of the LANDSAT scene. JES segments (previously enumerated sample segments for whichdata is available showing land-use percentages) will be drawn in on the county overlay.
Get a clear piece of acetate to fit over the county overlay (cut the clear piece to match) and tape thetwo pieces together. All your markings will be done on this second piece of acetate using alumocolor marker. Outline the corners of the county boundary and write the name of the county onthe bottom. This will allow for easy alignment. Outside the county boundary trace in a few referencepoints showing exactly how you aligned the overlay. Follow a well defined river or some otherobvious feature for this purpose.
Line up the overlay on the LANDSAT scene using the most obvious features available. Rivers andlakes are the most evident features, but their reliability is suspect due to shifting, drought, andflooding. Still water bodies make the best general reference points and should be used. When usingwater bodies make sure roads line up accurately throughout the county.
There may be some distortion on the LANDSAT scene causing slight differences between it and theoverlay. If the overlay doesn't match up exactly (this is more apt to be the case with larger counties),line ·up the overlay so as to distribute error evenly. Tape the overlay to the imagery.
AGRICULTURAL STRATIFICATION
The following materials will be used in the Agricultural Stratification procedure in addition to thoseused in City Stratification:
*JES Segment Data - Results of sample segments enumerated in past years are provided inprintout form. The segments shown should correspond with those drawn on LANDSAToverlay. Individual crops acreages for the segment are given as well as pasture andnon-agricultural acreages.
*County Agricultural Data - Data will be available summarizing county estimates of cropyields. Pasture, crop, non-agricultural, and urban acreages should also be available as wellas a number of varied farm counts.
*Reference Maps -1: 100,000 topographic maps. A larger scale map than the county highwaymap, shows detailed boundaries, useful in ag stratification. Note scale and date.

)
9
*Crop Calendar - Chart showing planting, growing and harvesting periods for major cropsin the state.
State Overview - Summary of state land regions, natural resources, industry, specificlocations of crops and other information supplied by the state.
*LANDSAT Imagery
*LANDSA T Overlay
*High Altitude Photography
In the agricultural stratification process, initial categorization of land will be based on the amount ofcultivation present. Prior to stratifYing,it will be useful to make an inventory of land-use percentages.With available county data, determine what portion of the country land area will be devoted to thefollowing uses: cropland, forest, pasture, range, and urban. Fill in the appropriate information onthe County Stratification Log. Use the ag-stats to determine the percentage of cultivation in thecounty. This will give a rough estimation of how much land in the county should be placed in eachstratum.
Review LANDSAT imagery and aerial photography. Compare dates of all materials. Remember thatthe most recent coverage (usually LANDSAT) may show some features not evident on othermaterials. Check scales so distances can be correlated between the two.
Keeping in mind the strata definitions and land-use percentages earlier outlined, get a general idea ofhow the county will be stratified.
Start by drawing off the smallest stratum blocks and work up to the larger ones. It is usually easiestto separate the cultivated areas first, and so forth. Use the NHAP and LANDSAT simultaneously.Roughly sketch stratification onto the overlay, then use the NHAP and county map to determineprecise boundaries.
Do not assume all features on the county highway map will be visible on the county overlay. Becauseof difficulties in reproducing some colors and small features on the county map, rivers and streamsmay not be evident on the overlay.
Work through the county until it is completely stratified. Review the NHAP'S and LANDSAT tomake sure all areas have been stratified, that all stratum blocks outlined meet strata definitions, thatoverlapping areas on aerial photographs agree, and that stratification reflects the land-use percentagesoutlined from county data and that strata are consistent throughout the county.

)
)
10
Aericultural Strata Definitions
Agricultural strata definitions will change from state to state depending on what types of agricultureare present and how extensive it is. Three broad strata definitions will remain constant. Allagricultural strata will be drawn from these broad definitions:
1. Intensive Airiculture (10-19): Land with 50% or more cultivated will be placed in thisstratum. The major land use is crop production. Crops would include feed grains, foodgrains, fruits, and other cultivated agricultural products. In major wheat producing states,fallow lands would be considered intensively cultivated. A number of substrata can beoutlined from this general category. In some states crop specific strata will be outlined. Forexample, in Texas individual strata were defined for wheat (14), cotton (15), rice (16), andpeanuts (17), in addition to a general stratum (13) where agriculture accounts for over 50%of the land area but less than 50% of the land was devoted to anyone crop.
Differentiation can also be made between dry land and irrigated crops or between groups ofcrops (vegetable or citrus strata, for example). Keys to identifYing individual crops or crop
. types will be determined before work begins in each state.
Field size, shape, and shade differences on NHAP'S and LANDSAT will give clues todetermining cultivation, specific crC'ps or groups of crops. JES segment data will also helpin crop identification.
Consider locational and topographic characteristics too. A certain crop may be grownexclusively on hillsides or near a water source. Some agricultural uses can be distinguishedby relative location. For example, intensive, one-crop agriculture will rarely occur close toa city. More extensive uses like dairying and mixed crops typify these farms, as evidenced
.by smaller field sizes.
Because of boundary constraints, some uncultivated lands will be included in IntensiveAgriculture strata. Small areas of water, pasture, forest, and wasteland may be included ifthey are too small to remove or lack acceptable surrounding boundaries. Intensive Agriculturewill be assigned purple or red colors and will normally have a minimum strata block size ofone square miles.
2. Extensive Airiculture (20-29): Lands with 15-49% cultivation will be placed in thisstratum. The basic land use of stratum 20 is agricultural. Cultivated land is interspersed with"natural cover" (forest, brush, grasses). Fields may be small and scattered, or large fieldsthat aren't surrounded by appropriate boundaries and cannot be placed in IntensiveAgriculture will be included in strat~m 20.
Extensive Agriculture will be located in fringe areas between intensive agriculture andrangelands, where boundaries are not adequate to put cultivation into Intensive Agriculture

)
11
strata. Mountainous valley cultivation where boundaries are troublesome will be placed inthis stratum.
Substrata will be defined from this general category. Substrata may be defined on the basisof percentage of agriculture, or crop type. (* In Florida, extensive agriculture was brokeninto two substrata (21) 33-50% cultivated and (22) 15-33% cultivated) Or it can be separatedon the basis of specific crop or crop type.
Extensive Agriculture will be drawn in light blue. The minimum stratum block size isnormally 1-2 square miles.
3. Ranee and Forest (40-49): Lands ofless than 15% cultivation will be placed in stratum40. Woodland, range, and open pasture are included. The land will have basically a naturalcover. Cropland could be in small fields and widely scattered with no surrounding boundariesfacilitating inclusion into an agricultural stratum.
Remember, it will be better to place non-agricultural areas into stratum 20 than agriculturalareas into stratum 40. Problems arise if a selected segment from stratum 40 has a lot of
, ~griculture.
Depending on the state, two or more divisions of stratum 40 may be utilized. Basis for thestrata differentiation can be the presence of woodland or pasture.
In the western part of the country, stratum 40, range and forest land is also divided into publicand private land. Public land which has been leased out by the Bureau of Land Managementfor private grazing purposes will be included in private land.
We use 1:100,000 Bureau of Land Management maps from USGS to delineate these areas.We use physical boundaries unless the state authorizes us to do other wise. No crops shouldbe evident.BLM and Forest Service lands that do not contain grazing areas should be placed in a stratumseparate from privately owned range, forest, and pasture.
A common mistake made in stratification is the inclusion of large areas of pasture intoagricultural strata. Pasture and cropland may appear similar on aerial photographs, but acloser inspection will usually allow for correct identification. Generally, cropland will havea smooth appearance on aerial photography with plow marks sometimes evident. Pasture willusually have a mottled appearance. A field that is dotted with trees should be consideredpasture.
Do not assume that all cleared land is intensively cultivated.In some cases pasture andcropland will be difficult to distinguish. Pasture in some areas of the country (Florida, Texas,and the West especially) will often have a smooth appearance similar to cropland. If thisoccurs, separation may be based on shade differences. Cropland will sometimes appear

)
)
12
brighter, a white color as opposed to a gray for pasture on aerial photographs.
LANDSAT imagery and available pasture and crop data will be useful in distinguishingagricultural lands from pasture.
JES segments will provide help in making this determination. Sketch the segment boundarieson the NHAP as they app~ on the county overlay or Seg Maps. Try to determine from theprintout what is present in each field in the segment. Look for consistencies in shade and fieldsize on the aerial photography and LANDSAT.
Irrigation (present mainly in the West) will be easily distinguished by round field patterns(Pivot systems) and irrigation canals. Where irrigation is present, make a determination ofwhat crops grown in the county need water. This will aid in distinguishing specific crops.Statistics may be available showing what crops are under irrigation in the county.
When stratifYing,always provide additional information on the worksheet explaining how youarrived at your conclusions. For example, if you determined that corn fields can bedistinguished on a LANDSAT scene by their reddish appearance, and placed these areas ina corn stratum based on this conclusion, indicate it on the worksheet. Explaining how andwhy this determination was made. This will help the checker and reviewer as they analyze
. the county.
Also it will be helpful to explain any inconsistencies from the NHAP to LANDSAT. Ifsomeagriculture is evident on the more recently dated LANDSAT imagery that isn't shown on theaerial photography make a note of it or write on NHAP "AG on LANDSAT" or "SeeLANDSAT". this will clear up any confusion that may arise in the checking and reviewingprocesses. If a recently constructed road is used as a boundary, indicate this on the worksheet."'Only if the road is visible on the county map and not on the aerial photo~raphy'"
COUNTY BOUNDARIES
Make sure the county boundaries are changed to their appropriate colors and make sure that theboundaries used most efficiently stratify the land.
Agricultural Stratification will be checked and reviewed just as urban stratification was. Checkboundaries and stratification keeping in mind county and JES segment data. Make suggested changesin stratification on acetate overlay just as you do when checking urban stratification.

')
)
13
FRAME CONSTRUCTION
After the agricultural stratification has been reviewed the next step is construction of the area framemap. In this process all stratification will be transferred to county maps. The materials used in frameconstruction include:
*County Frame Map - Either 1:100,000 topographic map or county highway map.*Quad and Supplementary Maps - show city stratification.*High Altitude Photography*Proportional Dividers - measuring device*Zoom Transfer Scope - boundary transfer device*Acreage Grid - measuring device
First transfer city stratification boundaries. If the cities have been drawn on quads or supplementarymaterials transfer these boundaries to the frame map. It is difficult to transfer the detailed citystratification from the photo; use the ZTS (Zoom Transfer Scope). After drawing the strataboundaries lightly shade along the inside part of the boundary about 1/4 of an inch thick so the stratablocks stand out. Lines should be shaded on one side and in the same color of the line.
Go on to progressively larger stratum blocks until all stratification has been transferred. Transferboundary lines in the color used on the aerial photography.Accuracy is crucial in this step. Lines must be drawn exactly on the appropriate boundaries used instratification. Due to photo distortions and inaccuracies on the maps, boundaries may look slightlydifferent. For example, a road may appear to have a slight curve on the photo which isn't shown onthe frame map. If this occurs, use the Zoom Transfer Scope or proportional dividers. If there is alarge discrepancy between the county map and the aerial photography, consult a reviewer. Riverroutes can change over time and flooding and drought can change the shape of a lake.
Neatness is important in frame construction. Keep a sharp point on your pencils and use a straightedge for drawing lines. Lines should be thin but dark.
Sometimes boundaries used in stratification aren't shown on the county map. If this happens theZoom Transfer Scope should be used, to accurately transfer the boundary to the map.
Some counties may have more than one map page. For these it is important that lines agree frompage to page. * Use a light table to line up maps and draw lines so they meet exactly. Overlappingareas on map pages should be traced.
County Boundaries

)
)
14
The county boundaries have already been determined. Check the bordering counties to see ifframeconstruction has been completed. If so, boundaries will be transferred just as they are on thebordering county; always checking for accuracy. Do not draw in these boundaries freehand. Be sureto use the color of the appropriate stratum in your county. An orange (stratum 40) county boundaryon one county map be a light blue (stratum 20) boundary on the next counties boundary.
When transferring the county boundary to the frame map, use a light table and the bordering county'sframe map so boundaries drawn outside the county will match up with the features on the borderingcounty's frame map. Make sure county boundaries. which most efficiently stratify the land. are used.It is acceptable to draw straight line county boundaries through stratum 62. Split a stratum 62,however, when there is at least one square mile of surface water area on each side of the boundary.If it is too small on one side. put the entire body of water in one county.
Checkine: Frame Construction
Since accuracy is more crucial in this step than any other in Stratification, checking the framethoroughly is a must. Make sure all boundaries have been transferred accurately and that all strataon the photo have been accounted for.
PRIMARY SAMPLING UNIT CONSTRUCTION
Following frame construction, stratum blocks will be broken into smaller sections (primary samplingunits). Each stratum will have minimum and maximum size restrictions. Stratum blocks whichexceed the maximum size outlined will be br0ken into primary sampling units. The primary samplingunits should conform to these size restrictions.
Target sizes will be outlined for each stratum as well. For example. ifstratum 10 has a minimum PSUsize of two square miles and a maximum often, the target size might be six to eight square miles. Ifboundaries allow, make PSU for the desired (target) size, but do not sacrifice good boundaries toaccommodate the desired size range. PSU's should conform to the minimum and maximum sizes.
For the most part PSU boundaries will be found on the frame map. If sufficient boundaries are noton the map check the aerial photography or 1:100.000 map to find appropriate boundaries. PrimarySampling Unit boundaries will be subject to the same criteria that strata boundaries are. Permanentboundaries must be used. Use the ZTS for boundaries not appearing on the frame maps.Primarysampling unit boundaries are outlined in yellow on the county map. They should not be shaded.
Make PSU's as rectangular as possible. Identification of the primary sampling unit will be easier ifthis is done. After delineating primary sampling units. they will be assigned numbers for identificationpurposes. Primary sampling units will have two numbers-first the stratum number then the PSUsequence number. Numbering will be done in the following manner: 10-1. 10-2, 31-3, 20-4, 10-5•....

)
)
15
The numbering sequence will start in the northeast comer of the county and work west continuingthrough the county in a serpentine fashion. Numbers should be put out in the open, preferably inthe center of the count unit so they can be easily seen.' Some PSUs may be too small toaccommodate a number, if so place the number outside the PSU, making it clear which PSU thenumber belongs to.
icNumbers should be done in the color of the stratum.
If a PSU is on more than one county frame map page place the PSU number on both pages.Do not number stratum 62 in its serpentine sequence. Wait and number these areas after all otherstrata have been numbered. Stratum 62 units will then be added on at the end of the numberingsequence. If there are two or more stratum 62 units in the county, they will be numbered also in aserpentine manner starting from the northeast comer of the county.
Checkin2 and Reviewin2
When checking Primary Sampling Unit Construction be sure that the correct stratum numbers havebeen assigned to PSUs, that no PSUs have been overlooked in the numbering sequence, and that nonumbers have been skipped or repeated. These are the most commonly made errors in this process.It is important that these errors be caught.