Embed Size (px)
Citation preview

The Stress Physiology of Enteromorpha flexuosa (Wulfen) and
Enteromorpha intestinalis (Linnaeus) (Chlorophyta) as an
Indicator of Environmental Stress in the Intertidal Zones.
By:
Reema PRAKASH
A thesis submitted as a requirement for the fulfillment of a degree of Master of Science in Biology at the University of the South Pacific.
Division of Biology School of Biological, Chemical and Environmental Sciences.
Faculty of Science and Technology University of the South Pacific
2008

i
DECLARATION
“I, Reema Prakash, Student ID number S99007253, hereby declare that the work presented in
this thesis has not been previously submitted for a degree at any university. To the best of my
knowledge and belief, this thesis contains material that is original and has not been previously
published or written by another author except where due reference is made.”
Reema Prakash Date
I hereby declare that the work contained in this thesis is the work of Reema Prakash unless
stated otherwise.
Dr. Anjeela Jokhan Date
Senior Lecturer in Plant Physiology
Principal Supervisor

ii
ABSTRACT
Enteromorpha flexuosa and Enteromorpha intestinalis are filamentous green algae that
usually grow attached to surfaces in the intertidal zones. Algae are rapid responders to water
quality changes, hence considerable information concerning the environmental condition of
an aquatic habitat can be obtained from their physiological analyses. This thesis examined the
effects of changes on environmental conditions such as temperature, pH, nitrogen levels and
presence of herbicide on the physiology of E. flexuosa and E. intestinalis. The possibility of
the algae’s physiological conditions to act as a bioindicator of the intertidal environment was
investigated. The algae were cultured in the artificial seawater medium under laboratory
conditions and exposed to variable temperature, pH, nitrogen (ammonium and nitrate) and
herbicide levels. The germling growth rates, photosynthetic rates, total chlorophyll content,
total soluble proteins and carbohydrates within the algae were then determined. Similar
physiological studies were done on E. flexuosa and E. intestinalis collected from Nasese,
Lami and Laucala Beach area around Suva. The results obtained showed that E. flexuosa and
E. intestinalis were affected by the variations in their abiotic environment. Increase in
temperature and herbicide levels had an adverse effect on algal growth and survival while
increase in pH and high nitrogen levels advanced algal growth and survival. The findings
indicate that Enteromorpha are quite sensitive to temperature and herbicide. They are a little
more tolerant to varying pH. These algae are excellent bio-indicators for high nitrogen levels
(especially ammonium) as their presence in the intertidal zone indicates high nitrogen levels.

iii
ACKNOWLEDGMENTS
My sincere thanks to my supervisor, Dr Anjeela Jokhan, for her continuous encouragement
and guidance throughout my study.
I also thank Abhineshwar Prasad for helping me setup the aeration system and the basics for
the experimentation. I greatly appreciate the technical support and contributions received
from the Biology department technical staff including Arvindra Rishi Prasad, Shiva
Padiyachi, Dinesh Kumar, Ragni Mudaliar, Babita Narayan, Vere and Amit Singh. I
appreciate the help of Vinay Narayan and Amit Sukal for helping me with my sample
collection. I also thank the Biology postgraduate students who have helped me during this
study. I am indebted to Sunil Prasad and Romika Chandra for their constant help and support
and encouragement throughout the writing and editing of the thesis. I greatly appreciate
Avinesh Prasad from Mathematics Division, Ravinesh Ram, Mere Tabudravu and Sujlesh
Sharma for helping me with the statistical analysis of the results. I am grateful to my husband
Rinal Deo and his family for their continuous support and considerable patience during the
study.
Finally I would like to acknowledge the NZ Aid and University of the South Pacific for
funding this research.

iv
TABLE OF CONTENTS
Page
DECLARATION…………………………………………………………………. i
ABSTRACT……………….. ………………………………………………………ii
ACKNOWLEDMENTS………………………...………………………………... iii
TABLE OF CONTENTS..……………………………………………………….. vi
LIST OF ABBREVIATIONS AND SYMBOLS…...……………………………viii
LIST OF FIGURES………………………………………………………………. xi
LIST OF TABLES………………………………………………………………... xvi
LIST OF PLATES………………………………………………………………... xvi
LIST OF APPENDICES…………………………………………………………..xvii
CHAPTER 1 INTRODUCTION…………………………………………….. 1
1.1 Background to research…………………………………………………… 1
1.2 Literature review.......……………………………………………………….4
1.2.1 Habitat and distribution……………………………………………..5
1.2.2 Biology and ecology……………………………………………….. 6
1.2.3 Life history………………………………………………………… 6
1.2.4 Photosynthesis in Enteromorpha………………………….……… 9
1.2.5 Factors affecting the distribution of Enteromorpha……………….. 10
1.2.5.1 Temperature……………………………………………... 10
1.2.5.2 pH………….………………………………………….. 11
1.2.5.2.1 Inorganic carbon sources and uptake in Enteromorpha...11
1.2.5.3 Salinity…………………………………………………... 14
1.2.5.4 Nutrients…………………………………………………. 14
1.2.5.5 Other factors that limit the species distribution…………. 16
1.2.6 The importance of these species…………………………………. 18
1.2.6.1 Economic importance………………………………………... 18
1.2.6.2 Environmental importance………………………………..19
1.2.7 Physiological response to environmental stresses………………... 21
1.3 Significance of this thesis…………………………………………………. 24
1.4 Objectives………………………………………………………………….. 26

v
CHAPTER 2 METHOD AND MATERIALS……………………………….. 28
2.1 Algal Sample Collection…………………………………………………… 28
2.2 Laboratory experimental methods…………………………………………. 32
2.3 Exposure of algae to abiotic stress conditions……………………………... 32
2.3.1 pH…………………………………………………………………. 32
2.3.2 Temperature……………………………………………………….. 32
2.3.3 Nitrogen…………………………………………………………… 33
2.3.4 Herbicide…………………………………………………………...33
2.4 Experimental procedure…………………………………………………….. 33
2.4.1 Growth Experiment………………………………………………... 34
2.4.1.1 Seeding (Propagule collection)……………………………34
2.4.1.2 Measuring growth rate…………………………………… 35
2.4.2 Exposure of adult thalli to stress………………………………….. 36
2.5 Analysis of stress response………………………………………………… 37
2.5.1 Photosynthesis...……………………………………………............37
2.5.2 Chlorophyll content……………………………………………….. 38
2.5.3 Total soluble protein………………………………………………. 38
2.5.4 Total soluble carbohydrates………………………………………. 40
2.5.5 Sporulation………………………………………………………… 41
2.6 Statistical analysis of results………………………………………………….41
CHAPTER 3 EFFECTS OF pH ON Enteromorpha flexuosa AND Enteromorpha
intestinalis: RESULTS AND DISCUSSION……………..…………………….. 42
3.1 Results……………………………………………………………………... 42
3.1.1 Growth…………………………………………………………….. 42
3.1.2 Photosynthesis…..………………………………………….............42
3.1.3 Chlorophyll content……………………………………………….. 44
3.1.4 Total soluble protein………………………………………………. 44
3.1.5 Total soluble carbohydrates………………………………………. 46
3.2 Discussion…………………………………………………………………. 46

vi
CHAPTER 4 EFFECTS OF TEMPERATURE ON Enteromorpha flexuosa AND
Enteromorpha intestinalis: RESULTS AND DISCUSSION................................53
4.1 Results…………………………………………………………………….. 53
4.1.1 Growth……………………………………………………………. 53
4.1.2 Photosynthesis…………………………………………………….54
4.1.3 Chlorophyll content………………………………………………. 55
4.1.4 Total soluble protein……………………………………………... 55
4.1.5 Total soluble carbohydrates ……………………………………... 57
4.2 Discussion………………………………………………………………… 57
CHAPTER 5 EFFECTS OF AMMONIUM (NH4+) AND NITRATE (NO3
-) ON
Enteromorpha flexuosa AND Enteromorpha intestinalis: RESULTS AND
DISCUSSION…….……………………………………………………………….. 64
5.1 Results illustrating the effects of Ammonium (NH4+)…………………… 64
5.1.1 Growth…………………………………………………………... 64
5.1.2 Photosynthesis…………………………………………................64
5.1.3 Chlorophyll content……………………………………………... 66
5.1.4 Total soluble protein…………………………………………….. 66
5.1.5 Total soluble carbohydrates…………………………………….. 68
5.2 Results illustrating the effects of Nitrate (NO3-)…………………………. 68
5.2.1 Growth………………………………………………………….. 68
5.2.2 Photosynthesis………………………………………...................70
5.2.3 Chlorophyll content...…………………………………………… 70
5.2.4 Total soluble protein……………………………………………... 71
5.2.5 Total soluble carbohydrates……………………………………... 71
5.3 Discussion………………………………………………………………... 72
CHAPTER 6 EFFECTS OF DIURON 80 (HERBICIDE) ON Enteromorpha flexuosa
AND Enteromorpha intestinalis: RESULTS AND DISCUSSION……….……. 78
6.1 Results…………………………………………………………………… 78
6.1.1 Growth…………………………………………………………... 80
6.1.2 Photosynthesis...………………………………………………… 80
6.1.3 Chlorophyll content……………………………………………... 82

vii
6.1.4 Total soluble protein…………………………………………….. 82
6.1.5 Total soluble carbohydrates…………………………………….. 83
6.2 Discussion………………………………………………………………. 83
CHAPTER 7 ANALYSIS OF Enteromorpha flexuosa AND Enteromorpha intestinalis
FROM 3 SITES AROUND THE SUVA AREA (NASESE, LAMI AND LAUCALA
BEACH): RESULTS AND DISCUSSION………..………………………….. 88
7.1 Results………………………………………………………………….. 88
7.1.1 Photosynthesis…………………………………………………..89
7.1.2 Chlorophyll content…………………………………...……….. 90
7.1.3 Total Soluble Protein…………………………………………... 91
7.1.4 Total soluble carbohydrates…………………………………… 91
7.2 Discussion ……………………………………………………………... 92
CHAPTER 8 SIGNIFICANCE OF THE RESEARCH, CONCLUSION AND
RECOMMENDATIONS…………………………………………………………. 98
8.1 Research significance and conclusion………………………………… 98
8.2 Future work recommendations………………………………………... 101
REFERENCES………………………………………………………………….. 102
APPENDIX…………………………………………………………………………116

viii
LIST OF ABBREVIATIONS AND SYMBOLS
% percentage
Abs absorbance
ADP adenosine diphosphate
AE anion exchange mechanism
Ag silver
AHLs N-acylhomoserine lactones
aq aqueous
ASW artificial seawater
ATP adenosine triphosphate
C2OH39COO⎯ long fatty acid tail
CA carbonic acid
CaCl2. 2H2O calcium chloride
CC core complex
CO2 carbon dioxide
CP47 and CP43 membrane-bound chlorophyll a binding proteins
Cu copper
Cyt f cytochrome f
Cytb6 cytochrome b6
D1 polypeptide (PS II-A)
D2 polypeptide (PS II-D)
DIC dissolved inorganic carbon
DIN dissolved inorganic nitrogen
DMS Dimethylsulfide
DMSP dimethylsulfoniopropionate
DON dissolved organic nitrogen
dwt dry weight
e.g. example
et. al and others
Fe iron
FeS iron-sulphur

ix
Fig figure
fwt fresh weight
g gram
g/ day grams per day
G3P glyceraldehydes
H+ hydrogen ion
H2O2 hydrogen peroxide
HCO3- bicarbonate
Hg mercury
hrs hours
HSPs heat shock proteins
i.e. that is
KCL potassium chloride
KH2PO4 potassium dihydrogen phosphate
L litre
LHC light harvesting complex
LHPC light harvesting pigment complexes
m meter
mg milligram
mg/g milligrams per gram
mg/l milligrams per litre
Mg2+ magnesium ion
MgCO3 magnesium chloride
MgSO4.7H2O magnesium sulphate
mm millimeters
N2 nitrogen
NaCl sodium chloride
NADP+ nicotinamide adenine dinucleotide phosphate, oxidized form
NADPH nicotinamide adenine dinucleotide phosphate, reduced form
NaNO3 sodium nitrate
ng nanograms
NH4+ ammonium ion

x
NH4Cl ammonium chloride
Ni nickel
NO2- nitrite ion
NO3- nitrate ion
O oxygen
O2 oxygen oC degrees Celsius
OEC oxygen evolving complex
OH- hydroxide
Pb lead
PC plastocyanin
pH power of hydrogen
PQ plastoquinone
PS I photosystem one
PS II photosystem two
QA quinone
RC reaction centre
RUBISCO ribulose 1,5 biphosphate oxygenase
RuBP ribulose biphosphate
S sulphur
spp species
TCA tricarboxylic acid
TSC total soluble carbohydrates
TSP total soluble proteins
Zn zinc
�g micrograms
�g/ ml micrograms per milliliter
�l microlitre
�m micrometres
�moles micromoles
�moles /L micromoles per litre
�moles/ min/ g fwt micromoles per minute per gram fresh weight

xi
LIST OF FIGURES
Page
Figure 1.1 Percentage distributions of different forms of inorganic carbon in seawater as a
function of pH in three different salinities (Source: Lobban and Harrison,
1994)…................................................................................................................11
Figure 1.2 Diagram showing two concurrent mechanisms of bicarbonate use by the
macroalgae Ulva lactua (Axelsson et al., 1999)…………………..……………13
Figure 1.3 Schematic representation of the nitrogen cycle of the sea. PON- particulate
organic nitrogen, DON- dissolved organic nitrogen, DIN- dissolved inorganic
nitrogen. (Turpin, 1980)...………………...............................................................15
Figure 3.1 The growth rates of E. flexuosa and E. intestinalis (together) at different levels of
pH in Artificial Seawater Medium……………………….…………………......43
Figure 3.2 Photosynthesis rates of E. flexuosa and E. intestinalis at different pH levels over
10 days…………………...……………………………………………………..43
Figure 3.3 The total chlorophyll content in E. flexuosa and E. intestinalis at different pH
levels in Artificial Seawater Medium………..…………………….…………...44

xii
Figure 3.4 The amount of total soluble protein in E. flexuosa and E. intestinalis after
treatment at different levels of pH in Artificial Seawater Medium……...……..45
Figure 3.5 The amount of total soluble carbohydrates in E. flexuosa and E. intestinalis after
treatment at different levels of pH in Artificial Seawater Medium……….……45
Figure 3.6 The effects of pH on percentage of H2CO3, HCO3-, and CO3
- to total dissolved
inorganic carbon (DIC)…………………………………..……………………..47
Figure 3.7 The carbonate equilibrium. (Lobban and Harrison, 1994)…………….………..48
Figure 4.1 The growth rates of E. flexuosa and E. intestinalis (together) at different
temperatures in Artificial Seawater Medium ……...………………….………..53
Figure 4.2 Photosynthesis rates of E. flexuosa and E. intestinalis at different temperatures
over 10 days…………………………………………………………..…...……54
Figure 4.3 The total chlorophyll content in E. flexuosa and E. intestinalis at different
temperatures in Artificial Seawater Medium …...……………………………...55
Figure 4.4 The amount of total soluble protein in E. flexuosa and E. intestinalis after
treatment at different temperatures in Artificial Seawater Medium …………...56
xiii
Figure 4.5 The amount of total soluble carbohydrates in E. flexuosa and E. intestinalis at
different temperatures in Artificial Seawater Medium …….………….….……56
Figure 5.1 The growth rates of E. flexuosa and E. intestinalis (together) at different levels of
NH4+ in Artificial Seawater Medium…………………………………………...65
Figure 5.2 Photosynthesis rates of E. flexuosa and E. intestinalis at different NH4+ levels
over 10 days…………………………………………..……...………….……...65
Figure 5.3 The total chlorophyll content in E. flexuosa and E. intestinalis at different levels
of NH4+ in Artificial Seawater Medium………...…...……..…………………...66
Figure 5.4 The amount of total soluble protein in E. flexuosa and E. intestinalis after the
treatment at different concentrations of NH4+ in Artificial Seawater
Medium…………………………………………………………………...…….67
Figure 5.5 The amount of total soluble carbohydrates E. flexuosa and E. intestinalis after the
treatment at different concentrations of NH4+ in Artificial Seawater
Medium…………………………………………………………………………67
Figure 5.6 The growth rates of E. flexuosa and E. intestinalis (together) at different levels of
NO3- in Artificial Seawater Medium ……...…………………...……………….69
xiv
Figure 5.7 Photosynthesis rates of E. flexuosa and E. intestinalis at different NO3- levels
over 10 days……………………...………………..……………….…………...69
Figure 5.8 The total chlorophyll content in E. flexuosa and E. intestinalis at different levels
of NO3- in Artificial Seawater Medium…………...………….……...……........70
Figure 5.9 The amount of total soluble protein in E. flexuosa and E. intestinalis after the
treatment at different concentrations of NO3- in Artificial Seawater
Medium………………………………………………………………….……...71
Figure 5.10 The amount of total soluble carbohydrates in E. flexuosa and E. intestinalis after
the treatment at different concentrations of NO3- in Artificial Seawater
Medium…………………………………………………………………………72
Figure 5.11 Showing main features of nitrogen uptake and assimilation in a eukaryotic algal
cell. (Lobban and Harrison, 1994)……………………………………………..74
Figure 6.1 The growth rates of E. flexuosa and E. intestinalis (together) at different
concentrations of Diuron 80 in Artificial Seawater Medium ...…….….……..79
Figure 6.2 Photosynthesis rates of E. flexuosa and E. intestinalis at different concentrations
of Diuron 80 over 10 days………………………………………........………....79

xv
Figure 6.3 The total chlorophyll content in E. flexuosa and E. intestinalis at different
concentrations of Diuron 80 in Artificial Seawater Medium…….......................81
Figure 6.4 The total soluble protein content in E. flexuosa and E. intestinalis after the
treatment at different concentrations of Diuron 80 in Artificial Seawater
Medium…………………………………………………………………….….81
Figure 6.5 The total soluble carbohydrates content in E. flexuosa and E. intestinalis after
treatment at different concentrations of Diuron 80 in Artificial Seawater
Medium…………………………………………………………………………83
Figure 7.1 The photosynthesis rates of E. flexuosa and E. intestinalis (together) from Nasese,
Lami and Laucala………………………...……………………………………..89
Figure 7.2 The total chlorophyll content in E. flexuosa and E. intestinalis from Nasese, Lami
and Laucala Beach area measured randomly over a 12 month
period…………………………………………………………………………...90
Figure 7.3 The total soluble protein content in E. flexuosa and E. intestinalis from Nasese,
Lami and Laucala Beach area measured randomly over a 12 month
period…………………………………………………….……………………..91
xvi
Figure 8.4 The total soluble carbohydrate content in E. flexuosa and E. intestinalis from
Nasese, Lami and Laucala Beach area measured randomly over a 12 month
period…………………………………………………………………...............92
LIST OF TABLES
Table 7.1 Averages of temperature, pH, NH4
+ and NO3- in Lami, Laucala Beach and Nasese
area measured randomly……..…………………………………………………..88
LIST OF PLATES
Plate 1.1 A coastal habitat showing extensive growth of Enteromorpha which includes E.
intestinalis and E. flexuosa............................................................................……..2
Plate 2.1 Locations of the Nasese, Lami and Laucala Beach sampling sites……….............31
Plate 2.2 The growth experimental setup tiles containing the germlings placed in Artificial
Seawater Medium in the beaker…………….……………………..……………...36
Plate 2.3 Adult algae exposed to stress conditions (in a similar setup as the growth
experiment) (Plate 2.1)…………..……………………………….…….................37
Plate 2.4 Adult algae in beaker with Artificial Seawater Medium with spores stuck on the
sides of the beaker (which is evidence for sporulation)……………......................41
xvii
LIST OF APPENDICES
Page
A1.1 Preparation of Artificial Seawater Medium (Brand, 1984)………………….116
Table A 1.1 Functions and compounds of the essential elements in seaweeds…………..117
Table A 1.2 Concentrations of some essential elements in seawater and in seaweeds.......118
Plate A 1.1 Enteromorpha flexuosa and Enteromorpha intestinalis associations growing
near a drainage outfall at Nasese, Suva…………………………………...…119
Plate A 1.2 Adult algae exposed to stress in a beaker with Artificial Seawater Medium. (a)
Healthy algae with sporulation (spores stuck and germinating on the sides of
the beaker). (b) Unhealthy algae with no sporulation (no spores on the sides of
the beaker)……...………………………………………………………..…..119

1
CHAPTER 1
INTRODUCTION
1.2 Background to Research
Enteromorpha are filamentous green alga that belong to the phylum Chlorophyta and class
Ulvophyceae. They usually grow attached to surfaces in the intertidal zones (Plate 1.1).
Species within the genus Enteromorpha are very difficult to identify, as differences between
species are small and hard to spot with naked eyes. They are bright green seaweeds, with
tubular and elongate fronds that may be branched, flattened or inflated. Occasionally they
appear bleached (white in colour). They are attached to the substrate with their minute disc-
like holdfasts. The fronds of species from this genus may vary in appearance due to changes
in environmental conditions, which sometimes confuses their identification, and
microscopic cell details are often required to identify certain species (Graham and Wilcox,
2000). The two species used in this research are Enteromorpha flexuosa and Enteromorpha
intestinalis.
Enteromorpha flexuosa is a long (usually up to 150 mm), filamentous, light green algae.
However, it can grow up to 200 - 300 mm in length (Hill, 2001). Its thallus consists of
hollow tubes that are made up of walls one cell thick and axes 1 - 7 mm wide (N’Yeurt,
2001). The cells of this species are angular or sub angular in shape, up to 25 x 35 μm in size
and are arranged in distinct longitudinal rows, where each cell usually has 3 pyrenoids
(N’Yeurt, 2001). E. flexuosa is commonly known as the hollow weed.
Enteromorpha intestinalis, similarly, is light green in colour and consists of tubular thallus.
Its thallus is coarse and twisted; filaments are irregularly and radially branched near its
2
narrow holdfast. The cells of this species are angular to sub rectangular 7 - 20 μm x 7 - 13
μm and are arranged in an irregularly disposed manner with cells having 2, rarely 3
pyrenoids per cell ( N’Yeurt, 2001). A common name for E. intestinalis is gut weed.
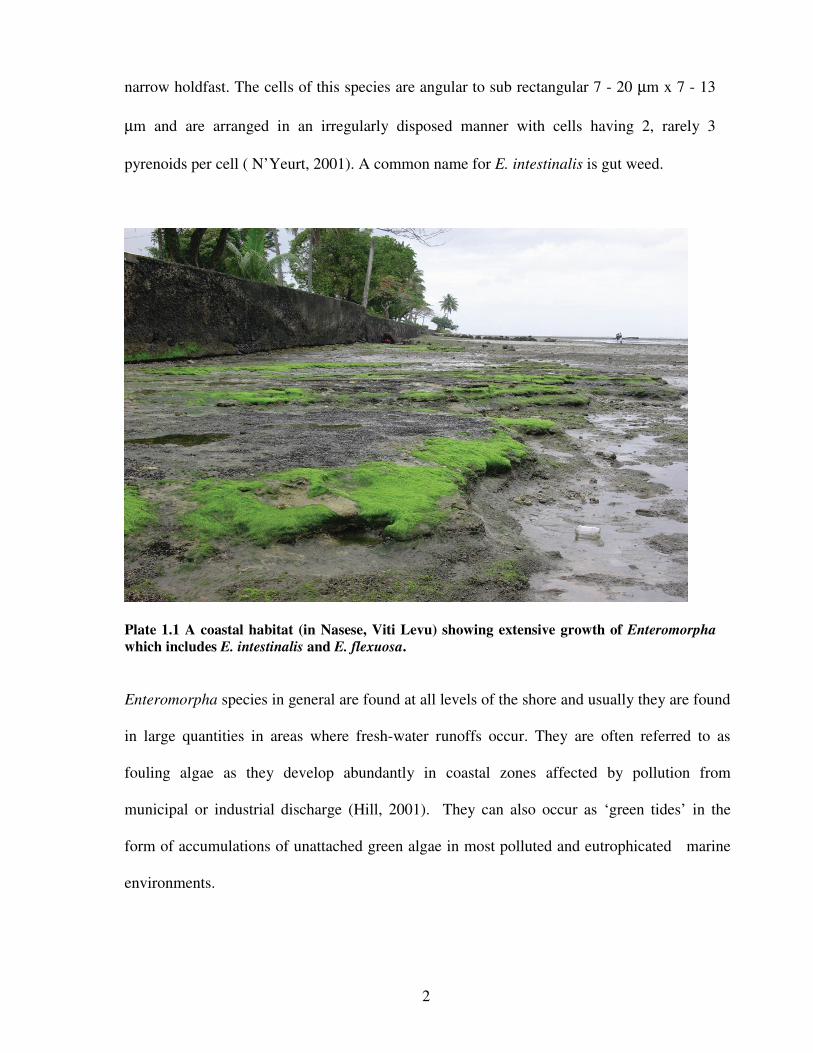
Plate 1.1 A coastal habitat (in Nasese, Viti Levu) showing extensive growth of Enteromorpha which includes E. intestinalis and E. flexuosa.
Enteromorpha species in general are found at all levels of the shore and usually they are found
in large quantities in areas where fresh-water runoffs occur. They are often referred to as
fouling algae as they develop abundantly in coastal zones affected by pollution from
municipal or industrial discharge (Hill, 2001). They can also occur as ‘green tides’ in the
form of accumulations of unattached green algae in most polluted and eutrophicated marine
environments.

3
Algae respond rapidly to water quality changes hence considerable information concerning
the environmental condition of an aquatic habitat can be obtained from their analysis (Lewis
and Wang, 1997). Abiotic environmental stresses (such as variations in temperature, salinity,
pH and nutrient availability) limit algal distribution and abundance. Because of their trophic
level and rapid growth, algae are rapid responders to environmental stresses within an
ecosystem. A variety of physiological, morphological and community parameters of algae can
be used to monitor the health of an ecosystem (Lewis and Wang, 1997). Decrease or increase
in the diversity of algae that indicates the environmental quality of a system has been mostly
studied at the community level. This is done on a structural basis that includes measurement
of algal biomass and non-taxonomic measures for example the presence, abundance or
absence of a population or species composition (Lewis and Wang, 1997). In Fiji, Tabudravu,
(1998) and Tabudravu et. al, (2002) carried out chemical analysis of E. flexuosa and
confirmed the algae to be an excellent bioindicator for heavy metals.
Investigating physiological parameters which include functional measures (such as the rates
of productivity, photosynthesis, nutrient flux and cellular activity) require a large amount of
time and work hence indications of environmental stresses are not preferably studied at
physiological levels (Carins and McCormick, 1997). However, physiological parameters and
processes provide an accurate account of environmental stress response since the
physiological responses of most species reveal the mechanisms by which the organisms adjust
to cope with the environment. Once these mechanisms and processes are understood, the
information can be applied towards understanding the distribution and abundance of a species
in an area (Nilsen and Orcutt, 1996).
4
1.2 Literature review
This review is about the biology, ecology and physiology of the Enteromorpha species,
factors that affect its distribution in general together with its abiotic environmental
interactions. E. flexuosa and E. intestinalis are believed to be highly adapted to grow in the
intertidal zones and coastal areas especially where there is pollution. The algae are highly
associated with macroalgal blooms since they possess life-history characteristics that enhance
their response to the increased nutrient supplies. In addition the algae are very good bio-
accumulators which enables them to accumulate certain pollutants such as heavy metals
(Tabudravu et. al, 2002). Hence the species of these genera have excellent qualities to act as
bio-indicators of coastal environmental quality. In Fiji they are commonly found along the
coastal areas adjacent to settlements and estuaries.
Enteromorpha are included in the order Ulvales and family Ulvaceae (Graham and Wilcox,
2000). When this alga was discovered it was initially included in the genera called Ulva. The
genus Ulva in general included a variety of unrelated algae and was first named by Linnaeus
(1753) cited in Hayden et. al, (2003). Later in the nineteenth century, the algal members of
this genus were split into several genera. The genus Ulva contained only the seaweeds with
distromatic blades, and the tubular forms of green algae were placed in new genera called
Enteromorpha (Hayden et. al, 2003). Both genera remained closely related. The term
Enteromorpha literally means ‘intestine shape’ which describes the tube like filaments of
these species. Generally Enteromorpha thalli consist of elongated tubes, sometimes with
constrictions that are attached to substrate by rhizoidial branches that form an attachment
disk. Some species exist as an intermediate form of the two genera, for example
Enteromorpha linza that has Enteromorpha flexuosa like tubular base, and distromatic blades

5
like Ulva. Several studies carried out on the two genera report close similarities (Hayden et.
al., 2003). Ulva and Enteromorpha were not two separate genera according to the molecular
data obtained by Hayden et. al., (2003) and therefore Enteromorpha could be referred to as
Ulva and vise-versa.
1.2.1 Habitat and Distribution
Both species E. flexuosa and E. intestinalis have a worldwide distribution in shallow brackish
or marine habitats (Hill, 2001; Graham and Wilson, 2000). The species are generally found at
all zones of the shore, ranging from high intertidal zone up to 5 m below the surface of the
seawater (Hill, 2001). Both species grow in clusters on suitable substrates such as rocks, mud,
sand, mangrove roots and wood. They are also common epiphytes on other algae, shells and
organisms. For example, they commonly grow on limpet shells. This becomes an ideal place
for them to grow since limpets cannot turn around and graze them (Thomas, 2002). They are
excellent pioneer species, that is, they are able to colonize newly available substrata at all
times during the year (Hill, 2001). They are usually referred to as an opportunistic species,
they are very successful under the right conditions. However, both species are considered
invasive and problem seaweeds as they periodically densely cover the mudflats and clog up
sheltered bays and shallow waters. They are often washed up on shores where they lay rotting
and produce foul odor (Thomas, 2002). They are also members of the group of algae that
cause harmful green tides in marine coastal areas. The green macro-algal biomasses occur
excessively (up to 27 kg wet mass/ m2) during green tides that drift in shallow water. E.
intestinalis has been identified as the major species in most of the ‘green tide’ studies, where
it has been observed to be occurring as unattached masses (Back et. al., 2000; Nelson et. al.,
2003; Blomster et. al., 2002).

6
1.2.2 Biology and Ecology
Both algae, like any other Enteromorpha species, are bleached and decay at the end of the
season (Budd and Pizzola, 2002). They are fast growing species under suitable conditions.
Maximum growth and increase in biomass of E. flexuosa was recorded at depths less than 400
mm and it can grow up to 200 – 300 mm long if left ungrazed by fish and invertebrates (Hill,
2001). Similar conditions have been reported for E. intestinalis. Its maximum habitual growth
is up to 300 – 400 mm but it can grow up to 1 m in length at a speed of 1.5 – 2.5 mm/ day if
left ungrazed under optimum conditions (Budd and Pizzola, 2002). Both species are
opportunistic; they have an r-type strategy for survival thus posses high growth rate and high
reproductive rates (Budd and Pizzola, 2002). Both species can continue growing in floating
masses at the water surface if they become detached from the substratum (Fish and Fish,
1989), since they can reproduce very quickly through both asexual and sexual reproduction.
1.2.3 Life history
Asexual reproduction of Enteromorpha is by vegetative propagation (by transversal scission)
and the production of zoospores. Sexual reproduction involves the production of gametes by
the gametophytes, which join together to produce a sporophyte. Enteromorpha is dioecious,
that is, having separate sexes, it can be isogamous (reproduction involving gametes of
identical size and shape) or anisogamous (reproduction involving gametes (reproduction with
gametes that are not identical in size and shape). However, it is difficult to differentiate male
or female gametophytes because of their similar morphology. Any of the cells in a frond
however, is capable of producing gametes Hayden et. al., (2003). The high reproductive
potential of Enteromorpha is due to the release of many thousands of motile spores
(propagules or zoospores), which contribute to its high ecological success.

7
Propagule release by means of both meiotic gametes and mitotic spores occur on a daily basis
in lower altitudes (Hill, 2001). Tidal and lunar rhythms generally drive the release of
propagules (Budd and Pizzola, 2002). Maximum release of gametes occurs a few days prior to
the highest tide in a lunar cycle (Graham and Wilcox, 2000). The zoospores first sense the
surface they attach on, they then adhere on to that surface on a temporary basis. If the
conditions during the temporary attachment are not favourable, the propagules get detached
and continue to find other suitable attachment sites (Patel et. al., 2003). Once a favourable site
is detected, it releases a glycoprotein adhesive, which attaches it permanently to the substrate
(Patel et. al., 2003; Callow and Callow 2002; Joint et. al., 2002). These permanently attached
propagules then grow and differentiate into new plants. The settling of zoospores however, is
affected by factors such as negative phototaxis, thigmotaxis, chemotaxis (Callow and Callow,
2000), surface chemistry and wettability (Callow et. al., 2000) and surface topography
(Callow et. al., 2002). These factors contribute in finding a suitable surface for propagule
settling. A very important factor that contributes towards zoospore settling is the presence of
bacterial biofilms (Patel et. al., 2003). Bacterial biofilms are generally present on all
submerged surfaces in the marine environment; they change the surface properties and
produce signals that attract the zoospores to those surfaces (Patel et. al., 2003). The presence
of biofilms enhances the settlement of Enteromorpha zoospores (Dillion et .al., 1989). Joint
et. al. (2002), observed the positive co-association between the bacterial biofilms and
Enteromorpha zoospore number on glass slides in natural seawater. In addition, Joint et. al.
(2002) also found that the zoospores attached to only certain bacteria present in the biofilm.
Hence they suggested that this attachment was due to the zoospores’ ability to detect the
chemical signal emitted by the bacteria that involves the process of cell-to-cell signalling
across the bacterial cell and the algal cell. The chemical signal molecules responsible are N-

8
acylhomoserine lactones (AHLs), which are involved in cell signalling in Gram-negative
bacteria (Joint et. al., 2002). Zoospores were found not being attracted to bacterial biofilm in
which the AHLs were destroyed (Joint et. al., 2002). Patel et. al. (2003) obtained a total of 99
bacterial isolates from the biofilms of rocks and Enteromorpha, where all isolates were found
to be Gram-negative and rod shaped. Some genera include Pseudoalteromonas, Vibro,
Shewanella, Halomonas and Pseudomonas.
In addition, the propagules of these algae along with other marine algae can form banks of
dormant propagules similar to dormancy in higher land plants during unfavourable conditions.
They can remain dormant for a few months until the environmental conditions become
favourable (Worm et. al., 2001). The propagule banks of Enteromorpha are common in
winter seasons. The propagules and germlings however, are delicate in structure and are
vulnerable to physical and biological stresses since they lack the protection or resistance
mechanisms as in adults. In addition, propagule banks are exposed to some biotic interactions
such as herbivore grazing and competition. They respond to changes in the environment in
different ways when compared with the adults (Lotze et. al., 2001). Herbivory and
competition with other algal species have been considered as a means of controlling the algal
boom especially where Enteromorpha is involved. Herbivore grazing naturally decreases
blooms but increase in nutrients in the water can overcome this control mechanism (Lotze et.
al., 2000).
The propagules released have the ability to photosynthesize as soon as they are released into
the water (Budd and Pizzola, 2002; Beach et. al., 1995; Hill, 2001). Amsler and Searles
(1980) confirmed that the propagules of Enteromorpha along with other pioneer genera

9
Blidirlia and Ulothrix can stay long enough in the planktonic phase to reach a distance of
about 10 kilometres. The photosynthetic rate for gametes and zoospores of E. flexuosa
including E. intestinalis which fall under pioneering species are significantly higher when
compared with the reproductive cells of the latter successional genera. Enteromorpha was
recorded to have the highest net photosynthesis rate of 11 mg/ day/ g dwt/ hr (Luning, 1990).
The species have increased ecological success in settlement and mobilization and this is
largely due to their highly motile characteristics. Their ecological success is also greatly
enhanced due to gas filled thallus, which keeps the algae in an upright position, optimising
photosynthesis (Luning, 1990).
1.2.4 Photosynthesis in Enteromorpha
Photosynthesis in marine algae is similar to that in higher plants. Some factors however, make
photosynthesis a little different from higher plants. These factors include their habitat (aquatic
environment), diversity of photosynthetic pigments in marine algae, diversity of climates in
the oceans, the type of carbon supply in the habitat and in the diversity of photosynthetic
products in different types of algae (Lobban and Harrison, 1994).
Photosynthesis generally (both in algae and higher plants) involves two major groups of
reactions involving capturing of light energy, and chemical reactions involving conversion of
light energy to chemical energy in the form of ATP and NADPH. Light dependent reactions
involve the trapping of light and the conversion of photon energy into chemical energy via an
electron transport chain. The electron transport chain is powered by reducing equivalents
extracted from water. During the light reaction, the excited electrons from the chlorophyll in
the reaction centre enter the electron transport chain. These electrons arise from the splitting

10
of water molecules, which produces oxygen molecules and hydrogen ions. Electrons from this
reaction are used together with the hydrogen ions to produce NADPH from NADP+ while
some hydrogen ions are used to produce ATP from ADP (Salisbury and Ross, 1992). The
NAPDH and ATP from the light reactions are used in a second group of carbon fixation
reactions (Calvin Cycle or the light- independent reactions) for the reduction and fixing of
carbon dioxide (CO2) to produce sugars and starch.
1.2.5 Factors affecting the distribution of Enteromorpha
Spatial and temporal distribution of these species is limited by factors such as temperature,
pH, salinity and nutrient availability.
1.2.5.1 Temperature
The ability of various seaweeds to tolerate the water temperature up to a certain level is partly
responsible for the patterns of geographic distribution of adult plants. Enteromorpha species
can tolerate temperatures up to 30oC (Graham and Wilcox, 2000). My preliminary field
studies done in 2003 in Nasese, Suva area showed that both species were successfully
growing at a pH of 7 and at an average temperature of 28oC. Hill (2001) noted a favorable
growth of E. flexuosa at temperatures ranging from 15oC - 30oC and adverse effects on
growth together with bleaching at temperatures of 33oC and above. He also reported E.
flexuosa to have optimum reproduction in waters with temperature under 30oC and a pH of
8.2 (Hill, 2001). The species’ temperature tolerance up to 30oC is an extra advantage as it may
help benefit indirectly through the removal of other competing algae at 27 - 30oC (Budd and
Pizzola, 2002).

11
1.2.5.2 pH
pH of seawater generally is around 8.1 but can range from 7.5 - 8.5 (Lobban and Harrison,
1994). These algae prefer high pH since they use inorganic carbon (Ci) as their major source
of carbon for photosynthesis similar to all other algae. The relative forms of inorganic carbon
are dependent on the pH and the salinity of the seawater (Fig 1.1)
Figure 1.1 Percentage distributions of different forms of inorganic carbon in seawater as a function of pH in three different salinities (source: Lobban and Harrison, 1994).
1.2.5.2.1 Inorganic carbon sources and uptake in Enteromopha
Algae of the genus Enteromorpha and Ulva posses limited ability to take up and use organic
carbon sources such as glucose, acetate and leucine together with inorganic carbon if they are
available (Mrakager and Sand-Jenson, 1990).
Inorganic carbon properties in seawater are different when compared to that in the air or fresh
water, since the pH and salinity are high. Carbon dioxide concentration in seawater is

12
basically the same as in the air but its diffusion into plants in water is about 104 times slower
than in air (Lobban and Harrison, 1994). In seawater, CO2 is a component of the carbonate
buffer system and inorganic carbon is available as bicarbonate (HCO3-). In seawater of pH 8
and 35% salinity, about 90% of the inorganic carbon occurs as HCO3- (Lobban and Harrison,
1994), which is about 200 times higher than the CO2 concentration in seawater (Sand-Jenson
and Gordon, 1984).
Green algae can carry out photosynthesis at high pH using HCO3- since they have an
inducible mechanism to do so (Carlberg et. al., 1990). Bojork et. al. (1993) described two
principle ways (Fig 1.2) in which green algae utilize HCO3-; one way is when the surface
bound carbonic anhydrase (CA) dehydrates HCO3- extracellularly to form CO2 that is then
taken up by the cells. The other way is when HCO3- is taken up directly for example in the
Ulva spp (Giordano and Maberly, 1989; Drechsler and Beer, 1991). In addition, Drechsler et.
al. (1993 and (1994) found that a mechanism similar to the anion exchanger (AE) of the red
blood cells could allow uptake of HCO3- in Ulva spp.

13
Figure 1.2 Diagram illustrates two concurrent mechanisms of bicarbonate use by the macroalgae Ulva lactua (source: Axelsson et. al., 1999)
In both cases, the enzyme carbonic anhydrase (CA) greatly speeds up the equilibrium between
HCO3- and CO2 (Lobban and Harrison, 1994). In algae, the enzyme can be located
extarcellularly, in the cytoplasm and or possibly in the chloroplast (Lobban and Harrison,
1994).
In addition both Enteromorpha spp. and the Ulva spp., like other intertidal seaweeds, can
carry out photosynthesis almost at equal rates either when emerged or submerged in water
(Kremer and Schmitz, 1973 cited in Lobban and Harrison, 1994). This means that they have
the ability to take up CO2 directly as well. This is because the bicarbonate that remains in the
capillary layer (diffusion boundary layer) of the water remaining on the plant surface is
quickly exhausted (Kerby and Raven, 1985 cited in Lobban and Harrison, 1994).

14
1.2.5.3 Salinity
Like temperature and pH, there are optimum salinities for the metabolic processes and growth
for algae. Enteromorpha grows well at normal salinity. Some species can even occur at
hypersaline conditions (Graham and Wilcox, 2000). Enteromorpha flexuosa however, grows
well in eurysaline conditions (Hill, 2001). However, both species are found to be widely
tolerant of salinity, Irene et. al. (1998) showed that E. intestinalis growth was highly affected
by varying salinity and its abundance decreased at low salinity.
1.2.5.4 Nutrients
About 21 elements are required for the main metabolic processes in plants (see appendix for
Table A 1.1). In seaweeds, more than double that number are present. However, the presence
and the amount of an element in seaweed does not mean that the element is an essential one or
is relatively important (Lobban and Harrison, 1994). Vital elements are usually accumulated
in algal tissues in amounts above their concentrations in seawater resulting in concentration
factors of up to 103 (Phillips, 1991 cited in Lobban and Harrison, 1994).
The nutrient elements necessary for macroalgal growth include nitrate, ammonium and
phosphate. Nitrate, nitrite, ammonium and phosphate concentrations vary from 0 to 30, 1, 3
and 2 μM respectively for most of the pristine temperate areas (Lobban and Harrison, 1994).
Nitrogen is the limiting nutrient for algal growth in the sea. The important features of nitrogen
cycle and the processes, which bring nitrogen into the sea, are illustrated in Fig 1.3.
15
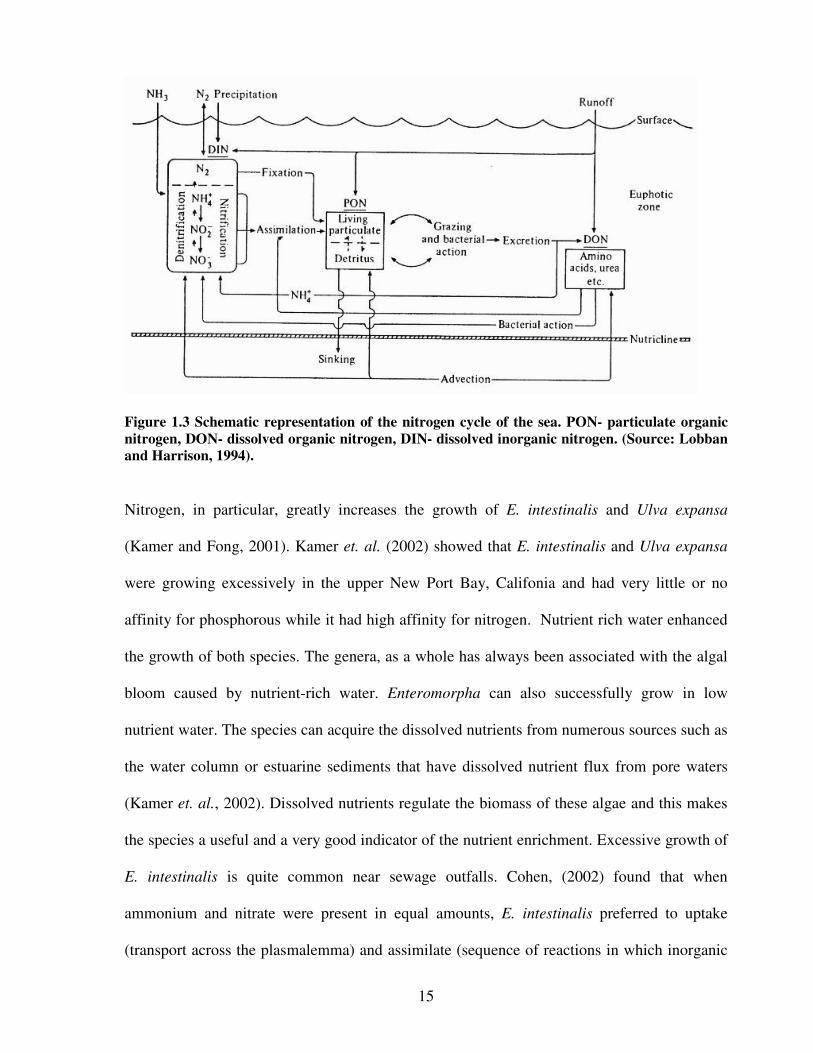
Figure 1.3 Schematic representation of the nitrogen cycle of the sea. PON- particulate organic nitrogen, DON- dissolved organic nitrogen, DIN- dissolved inorganic nitrogen. (Source: Lobban and Harrison, 1994).
Nitrogen, in particular, greatly increases the growth of E. intestinalis and Ulva expansa
(Kamer and Fong, 2001). Kamer et. al. (2002) showed that E. intestinalis and Ulva expansa
were growing excessively in the upper New Port Bay, Califonia and had very little or no
affinity for phosphorous while it had high affinity for nitrogen. Nutrient rich water enhanced
the growth of both species. The genera, as a whole has always been associated with the algal
bloom caused by nutrient-rich water. Enteromorpha can also successfully grow in low
nutrient water. The species can acquire the dissolved nutrients from numerous sources such as
the water column or estuarine sediments that have dissolved nutrient flux from pore waters
(Kamer et. al., 2002). Dissolved nutrients regulate the biomass of these algae and this makes
the species a useful and a very good indicator of the nutrient enrichment. Excessive growth of
E. intestinalis is quite common near sewage outfalls. Cohen, (2002) found that when
ammonium and nitrate were present in equal amounts, E. intestinalis preferred to uptake
(transport across the plasmalemma) and assimilate (sequence of reactions in which inorganic

16
ions are incorporated into organic cellular components) ammonium. In addition, Cohen,
(2002) determined that E. intestinalis was able to take up and store nutrients for future growth
even in times of environmental stresses due to short-term reduction in salinity and light
availability. He found that tissue nutrients increased with increased nutrient supply regardless
of variations in salinity or light availability.
1.1.5.5 Other factors that limit the species distribution
Other factors that limit the species distribution include substrate loss, smothering, sediment
suspension, desiccation, water flow rate, wave exposure, and contamination (Budd and
Pizzola, 2002). The algae are intolerant to substrate loss, as they require it for development
even though they may continue to grow in mats once they become displaced from the
substrate. They are highly vulnerable to smothering due to increased suspended sediments in
water. Smothering reduces light and hence may interfere with the photosynthesis and within a
month the algae would rot. In shore areas where the water current is reduced, sediments are
likely to increase and the spores, germlings and juveniles are highly intolerant of smothering
which leads to high mortality. However, if returned to earlier conditions the species is
expected to recolonise the available substrate.
Desiccation stress is another primary factor that controls the distribution of these algae on
high shore areas such as areas above the tidal limits of the shore. The species can live for
several weeks in completely dried pools while becoming entirely bleached on the uppermost
areas but remaining moist below the bleached fronds. Enteromorpha intestinalis has a unique
ability to survive without water for long, making it an ideal shelter for copepods in
supralittoral rock pools (Budd and Pizzola, 2002).

17
The water flow rate affects the algae to some extent since the algae have no structural support
in the thalli. The fronds conform to the direction of water flow and increased flows can cause
tearing of fronds and dislodgement of the holdfast. Yet the recovery of the species is high
since flow rate does not affect the settlement of the propagules. Houghton et. al. (1973)
observed that the propagules of Ulva were able to settle on surfaces exposed up to 10.7 knots
of water flow speed. The species has different ranges of tolerance to different chemical
pollution.
When considering exposure to herbicide pollution, E. intestinalis is intolerant to synthetic
compound pollution at an intermediate level (Budd and Pizzola, 2002). Herbicides are not
directly used in the marine environment but may enter the estuary areas through river
discharge and runoffs from the terrestrial environment. Moss and Woodhead, (1975)
investigated the effects of two commercial herbicides (Paraquat and 3AT) on settlement,
germination and growth of Enteromorpha. They observed that zygotes germinated into
filaments in the presence of Paraquat at 7 mg/l but stopped growing when the level was
increased. They also observed that the zygotes were highly resistant when they settled in
clumps on the substratum. The adult thalli however, were more vulnerable to the herbicides
than the un-germinated zygotes. Some synthetic chemicals can be directly introduced into the
marine environment such as chemicals that are used as the antifouling agents. Scarlett et. al.
(1997) studied the occurrence of the marine antifouling agent s-triazine herbicide Irgarol 1051
(an ingredient of antifouling paints used on boats and ships) within the Plymouth Sound area
in UK and its effect on the E. intestinalis. The authors found out that the highest concentration
of Irgarol 1050 occurred in areas close to where there were high numbers of boats, and the
highest concentration detected (120 ng/ l) caused a significant decrease in the growth of E.
18
intestinalis under laboratory conditions. However, smaller concentrations like 22 ng/l had no
effect on the species. Higher concentrations also inhibited photosynthetic efficiency.
Heavy metal toxicity in algae varies with different species but normally the order of toxicity is
Hg>Cu>Ag>Pb>Zn (Rice et. al, 1973 and Rai et. al, 1981). These species have been studied
mostly to find out the effect of copper since copper is used in antifouling paints (Budd and
Pizzola, 2002).
1.2.6 The importance of these species
1.2.6.1 Economic importance
Generally Enteromorpha algae are consumed as food and other uses include animal feed,
fertilizers, industrial applications, medicines, food processing agents and manufacturing of
personal care products (McHugh, 2003). A great variety of essential amino acids have been
found to be present in E. intestinalis (Haroon et. al, 2000). In addition, it was found that the
vitamin-B group content was higher in E. intestinalis than most vegetables and it was also a
good source of vitamin A (McHugh, 2003).
Methanisation tests showed that Enteromorpha had a good capacity for fermentation
(Haroon et. al 2000). Research has also been carried out using Enteromorpha species to
generate methane through anaerobic digestion (Haroon et. al., 2000). In addition,
Enteromorpha have also been used as a source of bioactive compounds similar to those that
inhibit the bacterium Xanthomonas oryzae which causes leaf blight disease in paddy
(Manimala and Rengasamy, 1993 cited in Haroon et. al., 2000). Enteromorpha flexuosa was
found to have antibacterial activity against Mycobacterium tuberculosis (Hill, 2001).

19
1.2.6.2 Environmental importance
Like any other seaweed in the marine ecosystem, these species also acts as a food source
and shelter for several organisms in the ecosystem. They also produce oxygen and fix
carbon in the water. They are particularly important as a food source for some ‘grazing’
organisms such as Littorina snails (Fish and Fish, 1989). In addition, they are important in
holding of sediments in environments they exist in.
Enteromorpha are often referred to as the fouling algae as they develop abundantly in zones
directly affected by pollution discharges (Hill, 2001). In most pollution affected areas and
eutrophicated marine environments, they occur as ‘green tides’ in the form of accumulations
of unattached green algae.
Since these species can bio-accumulate, they have proved to be suitable bio-indicators
(Tabudravu, 1998; Philips and Segar, 1986; Hill, 2001). In fact the Enteromorpha genus is
used as heavy metal indicators in waters world-wide (Ratkevicius et. al., 2003). Tabudravu
(1998) and Tabudravu et. al. (2002) specifically studied the potential of E. flexuosa for
monitoring heavy metals such as copper, zinc, and lead concentration in the coastal and
estuary area and they revealed a perfect correlation between the heavy metal content in
water and the algae. In 2001, Vallares et. al. studied Ulva and Enteromorpha species as the
indicators of heavy metal contamination in the north coast of Spain. They evaluated external
contamination whereby fine particles adhered to the algal thalli and they found out that the
external contamination was high and evident in Enteromorpha species. Tabudravu (1998)
and Philip and Segar (1986) also used E. intestinalis with other green, brown and red algae
to access the heavy metal content in sediment and water from the Bulgarian Black Sea coast

20
and found the similar results. E. compressa was studied by Ratkevicious et. al. (2003) in
order to identify the biochemical mechanisms responsible for buffering the effect of heavy
metals, especially copper. He suggested that the species bio-accumulated copper, triggered
ascorbate peroxidase, synthesized ascorbate and consumed glutathione and water-soluble
phenolic compounds in order to tolerate the copper enriched environment and the
accompanying oxidative stress. The algae were also found to express heat shock proteins
(HSPs) in response to a variety of stresses such as temperature stress including heavy metal
stress as their cellular response to stress (Lewis et. al., 1998). Lewis et. al. (1998)
investigated the effect of copper exposure and heat shock on the physiology at cellular level
and found that HSP in E. intestinalis was at Stress-70 level and that Stress-70 in E.
intestinalis was a better indicator of copper exposure. These studies suggest that E.
intestinalis is a reliable indicator of heavy metals.
Moreover, Enteromorpha like any other marine algae contributes to atmospheric sulphur
by producing Dimethylsulfide (DMS) (Van Alstyne et. al., 2003). Sulphur compounds such
as DMS quickly form sulphur oxides that function as cloud nuclei; hence the release of
DMS is likely to affect the global climate (Van Alstyne et. al., 2003). DMS is produced
during the cleavage of dimethylsulfoniopropionate (DMSP) by the enzyme DMSPlyase
hence resulting in DMS and acrylic acid (Van Alstyne et. al., 2003). Evidence suggests that
the production of DMSP is part of an activated anti-herbivore chemical defence system
where DMS is the by-product during the production of the defensive compound acrylic acid
(Van Alstyne et. al., 2001). Van Alstyne et. al. (2003) showed that Enteromorpha and Ulva
produced DMS when macro-invertebrates grazed on them suggesting that DMS may
function as a feeding inhibitor. In addition, they observed that DMSP containing

21
Enteromorpha and Ulva together with Polysiphonia were avoided by macro-invertebrates
during grazing when they were offered a choice between these species and other species
which did not contain DMS in their defence system. It is not so clear why Enteromorpha
with many other different taxa of algae occurring in different environments produce DMS.
However, DMSP can function as an osmoregulator (Edwards et. al., 1987 and 1988) and as
osmoprotectants (compactible solutes) (McNeil et. al., 1999). Osmoprotectants function by
increasing the osmotic pressure in cytoplasm and can also serve as protein and membrane
stabilizers when salt and temperature levels are unfavourable. Apart from DMS,
Enteromorpha also produces volatile hydrocarbons (which have ozone depleting potential)
during oxidative stress involving H2O2 and algal peroxidases (Abrahamsson et. al., 2003).
1.2.7 Physiological response to environmental stresses.
Very little has been done on the laboratory analysis of the physiological responses of E.
flexuosa and E. intestinalis to pollution. According to Davison and Pearson (1996)
laboratory physiological studies are very important in establishing correlations between
stress tolerance and the distribution of seaweeds in a particular area. Most of the
physiological work that has been done on macro-algae to establish this correlation has been
on photosynthesis metabolism and growth studies.
Villares and Carballeria (2004) studied photosynthesis and growth rate in Ulva and
Enteromorpha from the coastal embayment in Galicia (NW Spain) in response to the
nutrient limitations. They found out that the physiological activity of Enteromorpha species
was not affected by the low amount of nutrients in the water. Similarly, Chapman et. al.
(1978) studied the effects of nitrate concentration on Laminaria saccharina using

22
photosynthesis and growth as the physiological parameters under laboratory conditions and
found an increase in photosynthesis, chlorophyll content and growth of the algae with
increasing nitrate concentration. Photosynthetic performance of a number of green and
brown algae were studied under natural conditions (in-situ) by Ramus and Rosenberg
(1980) who showed that photosynthesis was a satisfactory measure of determining the total
net diurnal productivity. In addition, Wheeler (1980) quantified the photosynthetic rates and
pigment content of the giant kelp Macrocystis pyrifera to study the unique distribution and
adaptation of the species to a very large gradient of irradiances.
Cabello-Pasini et. al. (2003) studied the distribution and survival of some competing marine
macrophytes in the Gulf of California under fluctuating irradiance and temperature. They
studied photosynthesis, growth, together with nitrogen uptake and found that increase in
photosynthesis is reflected in an increase of growth rates which in turn may regulate the
abundance and survival of different species in field. Abrahamsson et. al. (2003) studied the
effects of temperature on the production of hydrogen peroxide and volatile halocarbons in
E. flexuosa and E. intestinalis with other brackish water algae. They suggested that the
formation of these compounds were related to oxidative stress. They concluded that the
production of certain halocarbons in these species may increase with temperature and the
amount and composition of the volatile halocarbons released by the algae are more affected
by temperature-associated species shift.
Biochemical composition of nitrogen, phosphorous and carbon content has also been used
to study the effects of abiotic stresses. Israel et. al. (1999) studied photosynthesis, growth
rate together with carbon and nitrogen content and soluble protein content to see the effect

23
of salinity and pH on growth and agar yield of Gracillaria tenuistipitata (a red alga) in
laboratory and outdoor culture. He found that photosynthesis responses represented growth
responses. Pinchetti et. al. (1998) investigated photosynthesis and biochemical composition
in terms of fatty acids, dietary fibre content, carbon and nitrogen content and ash, and
caloric contents to see the influence of variable amounts of nitrogen availability in Ulva
rigida. They found an increase in all the variables with an increase in the available nitrogen.
Similarly, the effects of temperature and nitrogen availability were studied in terms of
photosynthetic performance by Rivers and Peckol (1995) to assess the summer decline of
Ulva lactuca in a eutrophic embayment and found out that the summer decline was because
of the low photosynthetic performance due to high temperature and low nitrogen
availability. Lewis et. al. (2001) investigated the potential of using stress protein HSP70 in
E. intestinalis as a biomarker of contaminant (thermal stress, copper, variable nutrient
availability and herbicides) exposure to the species. They proved it to be an insensitive
biomarker and stated that growth measurements were more reliable indicators of stress.
The studies above have been carried out to investigate the effects of various factors such as
temperature, pH, salinity, nutrient availability, UV light and irradiance on algae. All studies
overall have shown a decrease in photosynthesis rate, growth rate and tissue constituents
when the tested abiotic variables were altered from the optimum range of tolerance of the
investigated species. A few studies on this aspect have been on E. intestinalis but
physiological studies of this kind are yet to be carried out on E. flexuosa. However,
preliminary studies done by the author in 2003, where E. flexuosa was exposed to different
pH and temperature for 3 days under the laboratory conditions, photosynthesis measured in
terms of dissolved oxygen in the medium showed a marked decrease in treatments that

24
varied from the control. In addition, some degree of plasmolysis of cells was also observed
except for the set-ups with optimum conditions. Bleaching of alga was also observed at
extreme temperatures and pH. Bleaching in Ulvaceae however can be caused by number of
factors other than stress. Rao et. al., (2006) showed that bleaching in Ulva australis was
associated with the epiphytic bacteria that form biofilms (see section 1.2.3). They found that
algae without any bacterial association bleached and died easily. Specific bacterial colonies
are located on specific parts of the thallus. Stress probably affects bacteria as well, which
explains the bleaching of only part (part housing specific bacteria) of the algal thallus
sometimes.
Some physiological studies on E. flexuosa and E. intestinalis done to examine the stress
response when exposed to variable temperatures, pH, nutrient (nitrogen) and herbicide over
a longer period of time are investigated in this research.
1.3 Significance of this thesis
(1) The results of this study will provide an account of stress response of E. intestinalis
and E. flexuosa to environmental stresses in terms of physiological parameters. This
would then provide better information about the distribution of the algae in various
coastal areas both polluted and unpolluted.
(2) The physiological stress response of the algae could be efficiently used as a
bioindicator to monitor environmental quality of coastal areas.

25
(3) Studying algae at community level does not always provide a definite indication of the
level of stress and pollution impact in an area because algae are bioaccumulators and
they keep on accumulating toxins up to the level they can tolerate. This does not
necessarily show up as a physical character. Studying algae at physiological level
would give an account of stress at an early stage of pollution. Hence the pollution
source and the impact could be identified and managed before any major harm is done
to the environment.
(4) This research would allow and form a baseline for the proper management of pollution
and discharges in the intertidal zone before the health of the ecosystem, including
people, is affected severely. It can also be used to formulate strategies to control
pollution and the risks associated with it. The research will be highly beneficial to the
Pacific region since people in the region are dependent upon food items, especially
seaweeds they collect from the intertidal zones and people could be at risk of
consuming items that are polluted. For example in Fiji, Gracillaria species (a red
algae) is collected for consumption and since this species grows together with the
Enteromorpha species within the intertidal zone it will also be affected by the
degrading environmental quality.
(4) This is the first study in Fiji Islands on aspects of E. intestinalis and E. flexuosa stress
physiology.

26
1.4 Objectives
The detection of the physiological stress responses of E. flexuosa and E. intestinalis depends
on understanding of how selected abiotic environmental factors (i.e. temperature variation, pH
levels and nutrition (nitrogen) and herbicide levels) limit algal distribution and abundance by
affecting physiological parameters. Thus, the objectives of this research are:
(1) To study the stress response of E. flexuosa and E. intestinalis at different temperatures,
pH, variable amounts of nitrogen and exposure to an herbicide (Diuron 80) for 1
month and analyze them in terms of growth rate, photosynthesis rate, chlorophyll
content, total soluble protein and total carbohydrates.
(2) To study the stress response of E. flexuosa and E. intestinalis collected from sites with
different pollution rates and analysed in terms of growth rate, photosynthesis rate,
chlorophyll content, total soluble protein and total carbohydrates.
(3) To test the hypothesis that pH, temperature and nutrients, higher or lower than those of
natural seawater have a significant effect on the algae’s growth rate, photosynthesis
rate, chlorophyll content, total soluble protein and total carbohydrates. Also that
Diuron has adverse effect on algae hence reduces growth rate, photosynthesis rate,
chlorophyll content, total soluble protein and total carbohydrates.
(4) To show that the stress physiology of E. flexuosa and E. intestinalis can be used as a
reliable biological indicator of environmental stresses resulting through pollution in
the intertidal zones.

27
Based on these objectives, Chapter 2 states the methodology used for the study. Chapter 3
examines the stress response of the two species when exposed to different pH levels while
Chapter 4 looks at the response to temperature. Further, Chapter 5 looks at the response to
different levels of Nitrogen availability while Chapter 6 looks at the response to Diuron 80
levels. Chapter 7 examines the stress responses of algae in some polluted and unpolluted
sites and Chapter 8 states conclusions and outlines future work that can be done on this
aspect.

28
CHAPTER 2
METHOD AND MATERIALS
2.1 Algal Sample Collection
The experiments were done over 18 months, from April, 2005 to September, 2006. Samples
of E. flexuosa and E. intestinalis were collected from intertidal flats at low tide along Nasese,
Lami and Laucala Beach area in Suva, Fiji. All three sites were used for comparative studies
(see chapter 7 and section 2.4.3 below). Nasese samples, due to its accessibility and location
were used for lab experiments. The Lami and Laucala Beach sites are within close proximity
of anthropogenic pollution sources hence were not used for lab experiments. See below for a
detailed description of the sites and plate 2.1 for a map of the sample sites.
Nasese area
The intertidal zone is adjacent to the main road connecting the residential and recreational
areas. The shoreline consists of reef platform rather than rubble and beach sand. The area has
a small estuary and several drainage outfalls that carry drainage water from the connecting
residential and developing areas.
Enteromorpha were found growing mainly on the rocky platforms, rocks, on the sides of the
seawall and on some foreign items that are the result of dumping of rubbish such as on pieces
of clothes, bamboos, coconut shells etc. Enteromorpha here were mainly associations of E.
intestinalis and E. flexuosa that were about 5 – 10 cm in length, brightly green colored forms.
The thallus appeared bright green and slightly transparent and about 2-3 mm in width.
29
Possible means of pollution in the area could be small amount of sewage discharge and
runoffs from drainage outfalls, soap and detergent contaminated water from household
drainage, possible thermal pollution resulting from drainage outfalls, herbicide runoffs from
wayside sediment runoffs from nearby developing sites. There is also a slight possibility of oil
pollution from the small outboard boats which may be insignificant to a certain extent.
Lami area
The intertidal area consists of sand and rubble and is located near the main highway and a
connecting industrial area. The area is reclaimed, has an estuary that runs through the
industrial area. In addition, it has a rubbish dump (no longer in operation) in its vicinity as
well as the main harbour (Suva harbour with Kings Wharf). The intertidal zone has several
old metal scraps, which may have been washed up from the nearby dumpsite and also is a
result of on site dumping.
Enteromorpha was found growing mainly on few of the rocks found in the area, on metal
scraps, driftwood and tires etc. This area had mostly E. flexuosa. It was dark green in color,
thinner and the growth forms were smaller (2 – 4 cm in length and 1 - 1.5 mm width).
Possible means of pollution in this area include thermal discharge (from factories operating in
the area) to a certain extent, industrial discharge via the estuary, heavy metals, leaching from
the former rubbish dump, factory effluent, antifouling compounds and oil pollution which
could be coming from Suva harbour which has several big ships passing through everyday.

30
Laucala Beach
The shoreline is rocky and made up of a rocky reef platform. The area is reclaimed, is situated
away from the main highway but is connected to a residential area. It also has an industrial
area in its vicinity. In addition, it is close to a sewage treatment plant.
Like Lami, the site has several pieces of scrap metals, tires and other rubbish on which
Enteromorpha was found growing. The algae appeared very dark green in colour, had a width
ranging from 1 – 2 mm and were of smaller lengths (2 – 5 cm).
Sewage discharge could be the main source of pollution in the area, but moderate industrial
discharge from the nearby industrial area, heavy metals and runoffs from the residential area
could also be included.
31
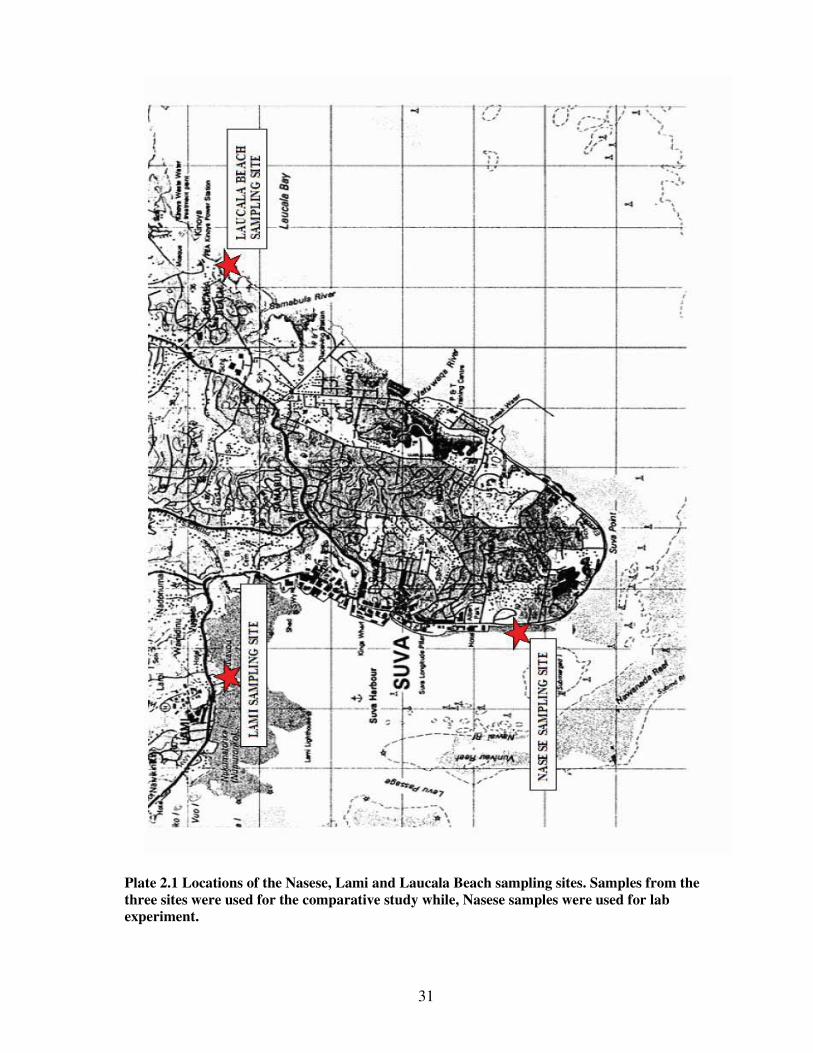
Plate 2.1 Locations of the Nasese, Lami and Laucala Beach sampling sites. Samples from the three sites were used for the comparative study while, Nasese samples were used for lab experiment.

32
2.2 Laboratory experimental methods
The algae were washed in sterile seawater in a series of 10 washes (2 litres per wash) to
remove debris and as many diatoms and other attached epiphytic algae before they were
placed in Artificial Seawater Medium (ASM) (Brand, 1984).
Artificial Seawater Medium was used because the concentrations of materials in the medium
were known and the purity of the medium is maintained unlike seawater, where the contents
are unknown with anything extra such as trace metals etc. Any bioaccumulation by the algae
in its habitat was ignored. Artificial Seawater Medium was further altered to establish the
stress conditions investigated. The algae were exposed to different temperatures, pH, variable
amounts of nitrogen and Diuron 80 (herbicide).
2.3 Exposure of algae to abiotic stress conditions.
2.3.1 pH
The algae were exposed to pH ranging from pH 4 – pH 10 (pH 4, 5, 6, 7, 8, 9 and 10). The pH
of the ASM was altered using sodium hydroxide (NaOH) and hydrochloric acid (HCl)
(Pederson and Henson, 2003). 1 M sodium hydroxide was added to the ASM for pH 9 and 10,
and 1 M Hydrochloric acid was added to establish pH 4, 5, 6, 7 and 8. During the pH
alteration, pH was measured by the Ecoscan hand-held pH meter (Eutech Instruments Pte Ltd,
Singapore). pH 8 was used as control since this was found to be the pH of natural seawater.
2.3.2 Temperature
The algae were exposed to five different temperatures ranging from 20oC to 35oC (20oC,
25oC, 28oC, 30oC, 35oC). For 20oC, temperature controlled (air-conditioned) room was used
33
and for 25oC to 35oC water baths were used. This range of temperature used is similar to
temperature variations which can occur in the field. 28oC was used as control as it was the
average temperature in the field and was also the room temperature most of the time.
2.3.3 Nitrogen
The algae were exposed to variable amounts of ammonium (NH4+) ranging from 0 – 2.5
�moles/L (0, 0.25, 0.5, 1.0, 1.5, 2.0 and 2.5 �moles/L) and nitrate (NO3-) in the range 0 – 7.0
�moles/L (0, 0.7, 1.4, 2.8, 4.2, 5.6 and 7.0 �moles/L). The concentrations used are higher and
lower than those of ASM. Variable amounts of nitrogen levels were achieved by varying the
amount of ammonium chloride (NH4Cl) or sodium nitrate (NaNO3) added to the ASM. 0.5
�moles/L was the control concentration for NH4+ while for NO3
-, 1.4 �moles/L was used
since these were the concentration in the ASM.
2.3.4 Herbicide
Herbicide Durion 80 was introduced into the ASM in concentrations ranging from 0 - 1 mg/ l
(0.0001, 0.001, 0.01, 0.1 and 1 mg/L). 0 mg/ l was used as the control concentration. These
concentrations were chosen because it has been reported that several herbicides are phytotoxic
at concentrations of less than 0.001 mg/ l. Diuron is phytotoxic at 0.004 mg/ l (Lewis and
Wang, 1997).
2.4 Experimental procedure
The experiment (exposure of algae to different abiotic conditions) was carried out in two
parts, the growth experiment which measured the growth rate of germlings when subjected to
different stresses while the exposure of adult thalli to stress was measured in the second part.

34
2.4.1 Growth Experiment
The propagules were collected and germinated in ASM and the growth rate was measured as
an increase in fresh weight for 4 weeks.
2.4.1.1 Seeding (Propagule collection)
Following the washing as stated in part 2, about 200 g fwt thalli were swabbed with sterile
cotton wool. This was done to remove as many diatoms and attached epiphytic algae (blue
green algae). The algal thalli were then cut into pieces 10 mm in length, placed between moist
paper towels and placed in darkness at 10oC for 24 hours. This treatment enables the thalli to
produce a large number of swarmer cells (spores and gametes) (McManus et. al., 2004;
Tabudravu, 1998).
After 24 hours the cut thalli were removed from the paper towels and placed in 4 containers
(glass troughs) containing sterile filtered natural seawater and 50 mm x 50 mm unglazed
(rough surface) ceramic tiles (8 - 9 tiles in each container). 50 g fwt algal thalli were placed in
each of the 4 containers. The ceramic tiles that were placed at the bottom of the glass
container were used as a substrate to collect the propagules released by the algal thalli. The
containers with the algae and the ceramic tiles were placed under 100 μmol m-2 s-2 light for 16
hours and 8 hours dark cycle for 3 days with aeration for sporulation (release of spores).
After 3 days the tiles containing the propagules were placed in another clean glass trough
containing ASM. After 2 days, the germlings (germinating propagules) were highly visible.
The tiles containing germlings were then removed from the trough, a tile each was weighed
and was placed in a beaker containing 500 ml of ASM. The ASM was altered before hand to

35
create the abiotic conditions (see section 3.3). The wet weight of the tile with germlings was
recorded as the initial weight.
Four beakers with a tile each (4 replicate cultures) were used for each treatment set up
(example, 4 culture beakers for pH 5). The setup was placed under 100 μmol m-2s-2 light for
16 hours and 8 hours dark for a month. 16 hours of light was used to facilitate the germination
process and the ASM medium was changed every 5 days. Light and dark hours were
controlled using a light timer. The beakers containing the algal cultures were aerated using
aeration tubes and aerator (aquarium aerators).
2.4.1.2 Measuring growth rate
Growth rate was measured by taking the fresh weight that is the weight of the germinating
propagules (germlings) on the tiles. The tiles with germlings were removed from the beaker
and placed between the paper towels to remove excess water and then weighed using a top
pan balance. To reduce uncertainty in water removal via paper towels, each tile was dried 4
times between fresh paper towels before it was placed on the balance. The fresh weights of
the germlings were taken every 5 days.

36
Plate 2.2 The growth experimental setup with tiles containing the germlings place in ASM in the beaker.
2.4.2 Exposure of adult thalli to stress.
For this part of the experiment, about 200 g of fresh algal samples were collected from Naese
area. In the laboratory, the algal thalli were washed off debris and visible invertebrates were
removed and it was placed in one large glass trough with ASM for 24 hours. This was done to
acclimatize the algae in ASM. After 24 hours, the algae were removed and exposed to
different abiotic conditions. For each set up, approximately 20 g fwt of thalli (with no excess
water removal) was placed in 1000 ml Kimax beakers containing 800 ml of ASM with altered
conditions. Four replicates (4 beakers with 20 g algae and 800 ml of ASM in each) were used.
The set up was placed at room temperature (except for where temperature was a variable)
with continuous aeration under the illumination of cool daylight fluorescence of 100 μmol m-2
s-2 and a photoperiod of 12 hours daylight and 12 hours of darkness for 10 days. Since the
algae were already in an adult state, 12 hours of light was used as the photoperiod. 16 hours of
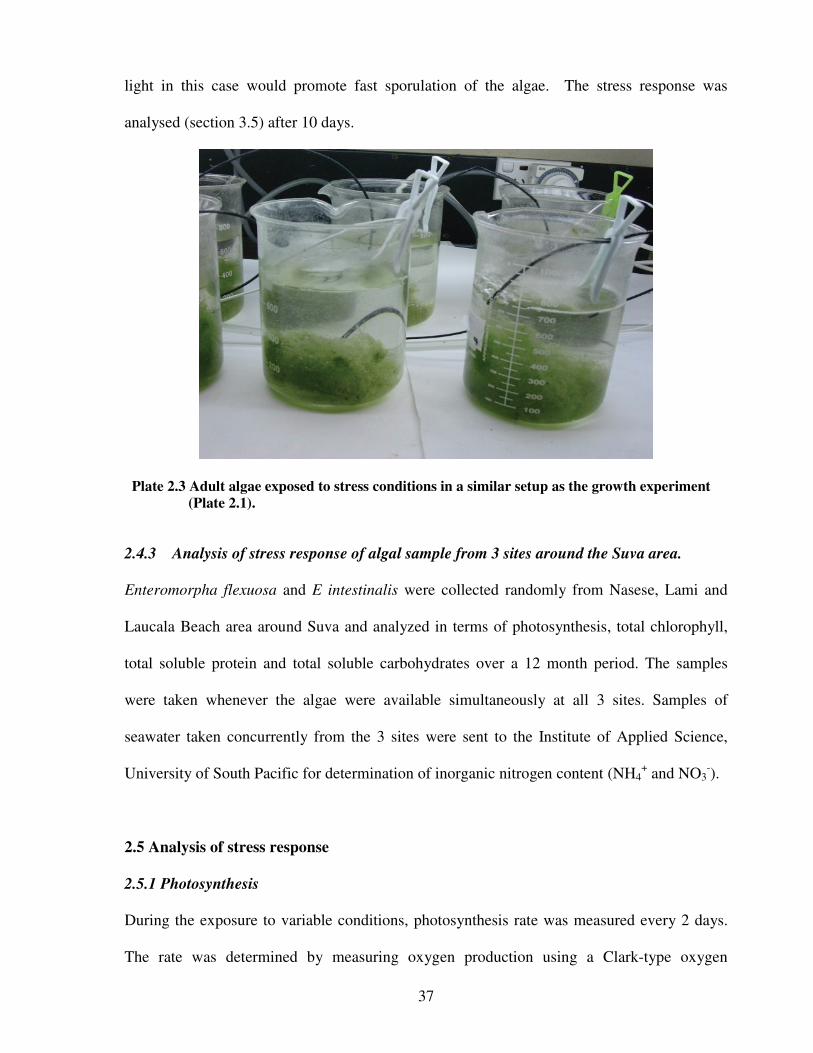
37
light in this case would promote fast sporulation of the algae. The stress response was
analysed (section 3.5) after 10 days.
Plate 2.3 Adult algae exposed to stress conditions in a similar setup as the growth experiment (Plate 2.1).
2.4.3 Analysis of stress response of algal sample from 3 sites around the Suva area.
Enteromorpha flexuosa and E intestinalis were collected randomly from Nasese, Lami and
Laucala Beach area around Suva and analyzed in terms of photosynthesis, total chlorophyll,
total soluble protein and total soluble carbohydrates over a 12 month period. The samples
were taken whenever the algae were available simultaneously at all 3 sites. Samples of
seawater taken concurrently from the 3 sites were sent to the Institute of Applied Science,
University of South Pacific for determination of inorganic nitrogen content (NH4+ and NO3
-).
2.5 Analysis of stress response
2.5.1 Photosynthesis
During the exposure to variable conditions, photosynthesis rate was measured every 2 days.
The rate was determined by measuring oxygen production using a Clark-type oxygen

38
electrode fitted with a DW 2 chamber (Hansatech, Kings Lynn, Norfolk, England). The water
jacket of the DW electrode was connected to the tap so that the temperature of the system was
maintained around 25oC. Algal thalli of 100 mg fresh weight was held with a thin wire hook
and suspended into the 5 ml cylindrical reaction chamber that was filled with 2 ml of ASM.
Photosynthesis evolution was initiated by illumination using the standard high intensity light
source LS2 (Hansatech, Kings Lynn, Norfolk, England).
Photosynthesis was recorded on a pen chart recorder as change in voltage that was displayed
on the CB1-D control box connected to the DW electrode. Photosynthesis was recorded for 3
minutes starting from when there was a change in the voltage displayed on CB1-D control
box. Light intensity was measured using Quantitherm light meter (Hansatech, Kings Lynn,
Norfolk, England). The O2 electrode system was calibrated daily with N2 gas that is referred
to as N2 line and O2 saturated de-ionised water as described by Walker, (1990).
Since a small amount (100 mg) of algae was used as sample for each photosynthetic
measurement, 3 measurements were made from each of the 4 replicates. Hence in total 12
replicate measurements were done for each treatment. For analysis of algae from the field
(Chapter 7 and section 2.4.3), 8 replicate measurements were made depending on the
availability of algae at the 3 sites.
2.5.2 Chlorophyll content
Chlorophyll was measured (once for each of the 4 replicates) at the end of each experiment
(after 10 days) (see section 2.4.2). Chlorophyll extraction was done using the method
described by Kreast and Grant (1976).

39
5 g fwt of algal thalli was initially submerged in 50 ml of 100 % acetone for a few seconds. It
was removed and ground under dim light with 0.5 g of MgCO3 per sample in fresh 10 ml of
100 % acetone. The mixture was centrifuged at 800 revolutions per minute for 15 minutes at
5oC. The supernanent (chlorophyll extract) was transferred to a clean test tube with lid. The
absorbance of the extract was read at 647 nm and 664 nm using a UV-Visible
Spectrophotometer (Shimadzu Corporation Analytical Instruments Division, Kyoto, Japan).
Using the absorbance read at the 2 wavelengths, the total chlorophyll content was calculated
using the following equations by Jeffery and Humphrey (1975):
Total chlorophyll (�g/ml) = 7.04(Abs 664) + 20.27 (Abs 647)
Where: Abs 664 = absorbance at 664 nm wavelength
Abs 647 = absorbance at 647 nm wavelength
2.5.3 Total soluble protein
A comparative test for total soluble protein (TSP) determination was done using Bradford
Method and Biuret Method. Both methods gave similar results. Bradford’s method was
chosen for measuring total soluble protein content. Total soluble protein was measured (once
for each of the 4 replicates) at the end of each experiment (after 10 days) (see section 2.4.2)
1 g fwt of the algal thalli was homogenized into powder in liquid nitrogen and further ground
with extraction buffer (Phosphate buffer pH 7.0) in the ratio of plant material: extraction
buffer = 1 g:5 ml. The extraction was transferred to 10 ml centrifuge tubes and centrifuged at
2000 revolutions per minute for 20 minutes. Total soluble protein (TSP) was determined
according to the Bradford dye binding Method (Bradford, 1976) using the Bradford reagent.
Bradford reagent was made by dissolving 100 mg Coomassie Brilliant Blue G-250 in 50 ml

40
95% ethanol to which 100 ml 85% phosphoric acid was added. When the dye was completely
dissolved, it was diluted to 1 liter and filtered through a Whatman #1 paper before use.
After centrifugation, 500 μl of supernant was taken in a test tube and made up to 1000 μl. 1
ml Bradfords reagent was added to the each of the samples and mixed thoroughly by
vortexing. Bovine serum albumin was used as the standard. The samples were incubated for 5
minutes after the addition of Bradfords reagent and absorbance was read at 595 nm within 60
minutes using UV-Visible Spectrophotometer (Shimadzu Corporation Analytical Instruments
Division, Kyoto, Japan).
2.5.4 Total soluble carbohydrates
Total soluble carbohydrate (TSC) was measured (once for each of the 4 replicates) at the end
of each experiment (after 10 days) (see section 2.4.2).
1 g fwt of algal thalli was homogenized into powder in liquid nitrogen and further ground
with 3 ml of trichloroacetic acid for extracting soluble carbohydrates. 1 ml of the extraction
was transferred to an eppendorf tube and centrifuged at 20,000 revolutions per minute for 20
minutes. 50 μl of supernant was taken in a test tube and made up to 100 μl with distilled
water. Total soluble carbohydrates were determined by Phenol-sulphuric method (Dubois et.
al., 1956). 50 μl of 80 % phenol solution was added and mixed thoroughly by vortexing. 2 ml
of 95 % sulphuric acid was then added in a stream. Glucose was used as the standard. The
samples were incubated for 10 minutes at room temperature. Absorbance was read at 490 nm
using a calorimeter. Total soluble carbohydrate was measured in replicates of 4 for each
treatment.

41
2.5.5 Sporulation
Sporulation was detected through observation of the treatment beakers. Any germlings seen
stuck and growing on the sides of the beakers was accounted for as sporulation. Sporulation
showed that the algae were actively reproducing.
Plate 2.4 Adult algae in beaker with ASM. Spores are stuck on the sides of the beaker which shows sporulation has taken place.
2.6 Statistical analysis of results
For all the experiments done, results were analysed using Graph Pad Prism version 4. Data
presented on the graphs was produced as means of the number of replicated used; error bars
were used to indicate the range of results obtained from the replicates. Differences between
treatments were tested for significance using ANOVA. One way ANOVA was used to test the
differences between results obtained for total chlorophyll, total soluble protein content and
total soluble carbohydrates while the growth and photosynthesis rates were tested with 2 ways
ANOVA. For both types of testing, Bonferroni’s Test was used as a post test for multiple
comparisons of means. A significance level of p < 0.05 was adopted.
Sporulation

42
CHAPTER 3
EFFECTS OF pH ON Enteromorpha flexuosa AND Enteromorpha intestinalis :
RESULTS AND DISCUSSION
3.1 Results
3.1.1 Growth
Growth rate (Fig 3.1) under control pH (pH 8) increased slightly for the first 10 days and then
a sharp increase from about 0.03 g/ day to approximately 1 g/ day in the next 15 days was
noted. Growth rate at a pH of 9 showed a similar pattern and did not vary from pH 8
throughout the experiment (p > 0.05). There was significant increase in growth rate at pH 8
and 9 (p < 0.0001 i.e p < 0.05). The growth rate of the algae at pH 10, 7 and 6 were
significantly lower (p < 0.0001 i.e p < 0.05) throughout the experimental period, ranging from
about 0.013 g/ day to 0.030 g/ day. At pH 5 and 4 the algae did not grow. At pH 4 while there
was no increase in weight the plants remained green. In pH 5 medium there was a very small
amount of growth initially but after 10 days the growth rate declined. The algae remained
green in this case as well.
3.1.2 Photosynthesis
Similar to the growth rates, pH overall had a significant effect on the rates of photosynthesis
(p < 0.0001 i.e. p < 0.05). The rates of photosynthesis (Fig 3.2) at pH 8 and 9 were the highest
with no significant difference between the two (p > 0.05). The rate of photosynthesis at pH 10
increased on day 3 and then decreased there after. At pH 7 there was a constant increase in the
rate of photosynthesis from 1.1 μmoles/ min/ g fwt to 2.1 μmoles/ min/ g fwt over the 8 days.
The increase was not as significant as compared to pH 8 (p > 0.05). The rate of
photosynthesis at pH 6 fluctuated between 1.1 μmoles/ min/ g fwt and 1.2 μmoles/ min/ g fwt
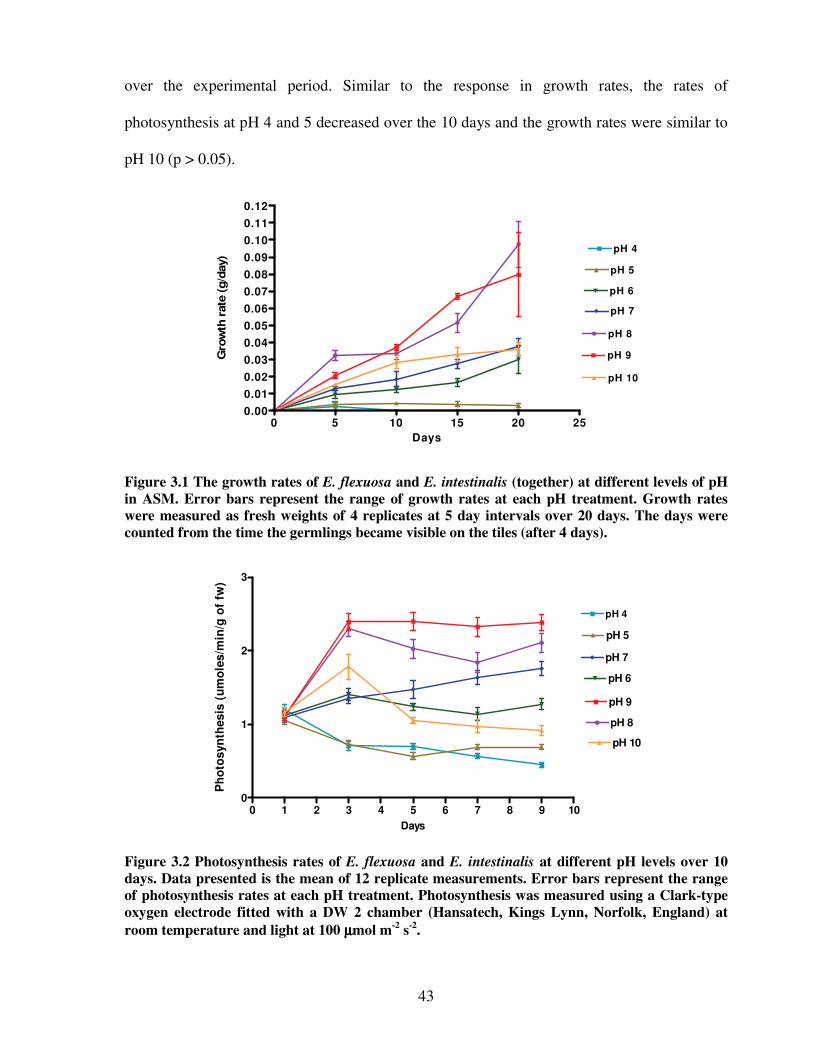
43
over the experimental period. Similar to the response in growth rates, the rates of
photosynthesis at pH 4 and 5 decreased over the 10 days and the growth rates were similar to
pH 10 (p > 0.05).
0 5 10 15 20 250.00
0.01
0.02
0.03
0.04
0.05
0.06
0.07
0.08
0.09
0.10
0.11
0.12
pH 4
pH 5
pH 6
pH 7
pH 8
pH 9
pH 10
Days
Gro
wth
rat
e (g
/day
)
Figure 3.1 The growth rates of E. flexuosa and E. intestinalis (together) at different levels of pH in ASM. Error bars represent the range of growth rates at each pH treatment. Growth rates were measured as fresh weights of 4 replicates at 5 day intervals over 20 days. The days were counted from the time the germlings became visible on the tiles (after 4 days).
0 1 2 3 4 5 6 7 8 9 100
1
2
3
pH 4
pH 5
pH 6
pH 7
pH 8
pH 9
pH 10
Days
Ph
oto
syn
thes
is (
um
ole
s/m
in/g
of
fw)
Figure 3.2 Photosynthesis rates of E. flexuosa and E. intestinalis at different pH levels over 10 days. Data presented is the mean of 12 replicate measurements. Error bars represent the range of photosynthesis rates at each pH treatment. Photosynthesis was measured using a Clark-type oxygen electrode fitted with a DW 2 chamber (Hansatech, Kings Lynn, Norfolk, England) at room temperature and light at 100 μμμμmol m-2 s-2.
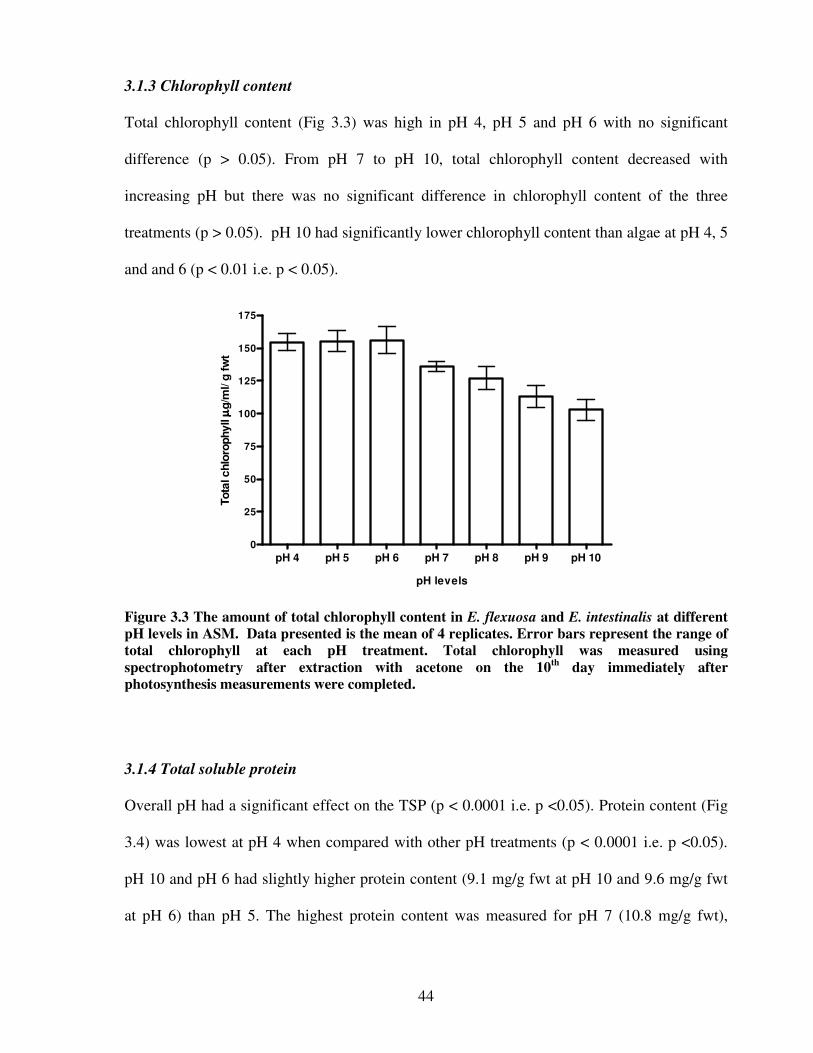
44
3.1.3 Chlorophyll content
Total chlorophyll content (Fig 3.3) was high in pH 4, pH 5 and pH 6 with no significant
difference (p > 0.05). From pH 7 to pH 10, total chlorophyll content decreased with
increasing pH but there was no significant difference in chlorophyll content of the three
treatments (p > 0.05). pH 10 had significantly lower chlorophyll content than algae at pH 4, 5
and and 6 (p < 0.01 i.e. p < 0.05).
pH 4 pH 5 pH 6 pH 7 pH 8 pH 9 pH 100
25
50
75
100
125
150
175
pH levels
Tota
l chl
orop
hyll
μμ μμg/
ml/
g fw
t
Figure 3.3 The amount of total chlorophyll content in E. flexuosa and E. intestinalis at different pH levels in ASM. Data presented is the mean of 4 replicates. Error bars represent the range of total chlorophyll at each pH treatment. Total chlorophyll was measured using spectrophotometry after extraction with acetone on the 10th day immediately after photosynthesis measurements were completed.
3.1.4 Total soluble protein
Overall pH had a significant effect on the TSP (p < 0.0001 i.e. p <0.05). Protein content (Fig
3.4) was lowest at pH 4 when compared with other pH treatments (p < 0.0001 i.e. p <0.05).
pH 10 and pH 6 had slightly higher protein content (9.1 mg/g fwt at pH 10 and 9.6 mg/g fwt
at pH 6) than pH 5. The highest protein content was measured for pH 7 (10.8 mg/g fwt),
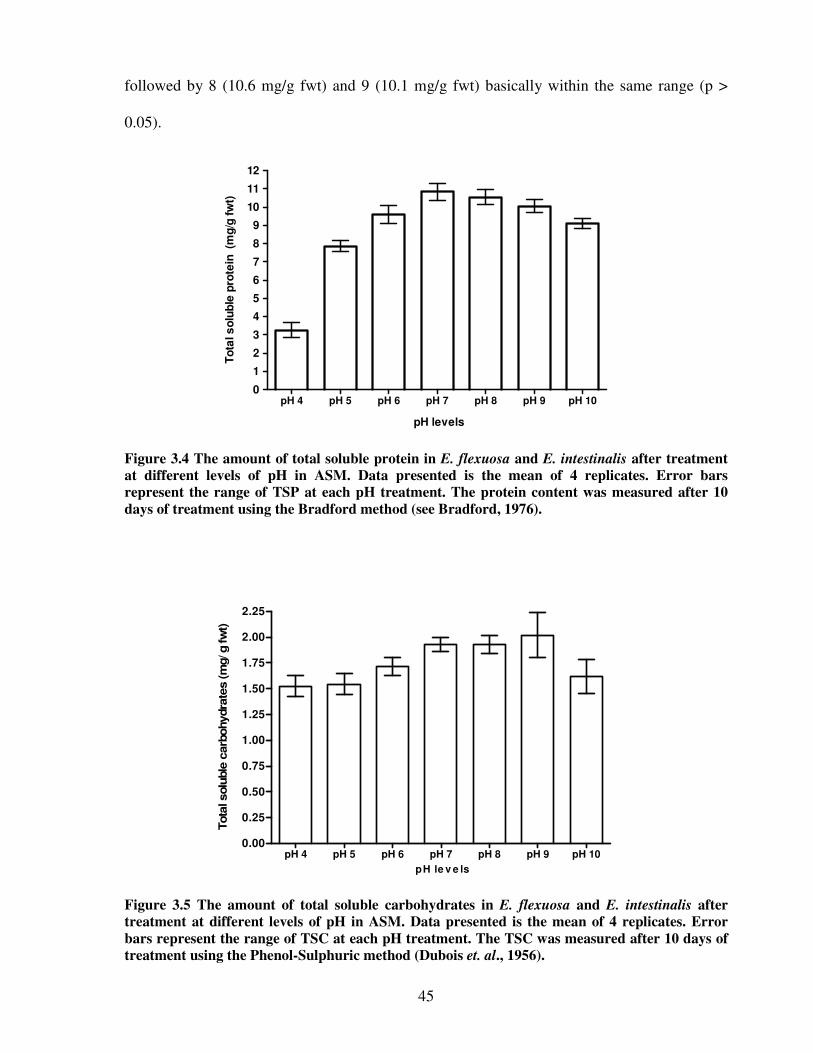
45
followed by 8 (10.6 mg/g fwt) and 9 (10.1 mg/g fwt) basically within the same range (p >
0.05).
pH 4 pH 5 pH 6 pH 7 pH 8 pH 9 pH 100
1
2
3
4
5
6
7
8
9
10
11
12
pH levels
Tota
l sol
uble
pro
tein
(m
g/g
fwt)
Figure 3.4 The amount of total soluble protein in E. flexuosa and E. intestinalis after treatment at different levels of pH in ASM. Data presented is the mean of 4 replicates. Error bars represent the range of TSP at each pH treatment. The protein content was measured after 10 days of treatment using the Bradford method (see Bradford, 1976).
pH 4 pH 5 pH 6 pH 7 pH 8 pH 9 pH 100.00
0.25
0.50
0.75
1.00
1.25
1.50
1.75
2.00
2.25
pH le v e ls
Tota
l sol
uble
car
bohy
drat
es (m
g/ g
fwt)
Figure 3.5 The amount of total soluble carbohydrates in E. flexuosa and E. intestinalis after treatment at different levels of pH in ASM. Data presented is the mean of 4 replicates. Error bars represent the range of TSC at each pH treatment. The TSC was measured after 10 days of treatment using the Phenol-Sulphuric method (Dubois et. al., 1956).

46
3.1.5 Total soluble carbohydrates
Total soluble carbohydrates content (Fig 3.5) was slightly low at pH 4, 5 followed by pH 10,
which was slightly higher. TSC content at pH 6 was slightly higher than pH 10. High TSC
content was measured at pH 7 and pH 8 and algae treated at pH 9 had the highest TSC
content. Overall there were no significant differences in the TSC content between all the pH
treatments (p > 0.05).
3.2 Discussion
The growth experiments (Fig 3.1) showed optimum growth of Enteromorpha at high pH
levels below pH 10. This pattern of growth was similar to the observed photosynthetic rate of
the adult thalli (Fig. 3.2), where algae at pH 7, 8, 9 had high photosynthetic rates compared to
algae at pH 4, 5 and 6. Similar patterns of photosynthesis and growth rates indicate that
growth in this case was a direct result of photosynthesis. The similar pattern of growth rates
and photosynthesis confirms that pH has a significant effect on growth (p < 0.05) and
photosynthesis (p < 0.05). Enteromorpha cannot exist in low pH conditions whereas high pH
actually favours the algae.
The effect of environmental pH or the external pH on the algae is a result of the regulation of
intracellular pH and the speciation of the inorganic carbon species in the medium (Raven and
Geider, 2003). Inorganic carbon is the sole carbon source for seaweeds (Lobban and Harrison,
1994) and in seawater where there is a high pH, 90% of inorganic carbon occurs as
bicarbonate (HCO3-).
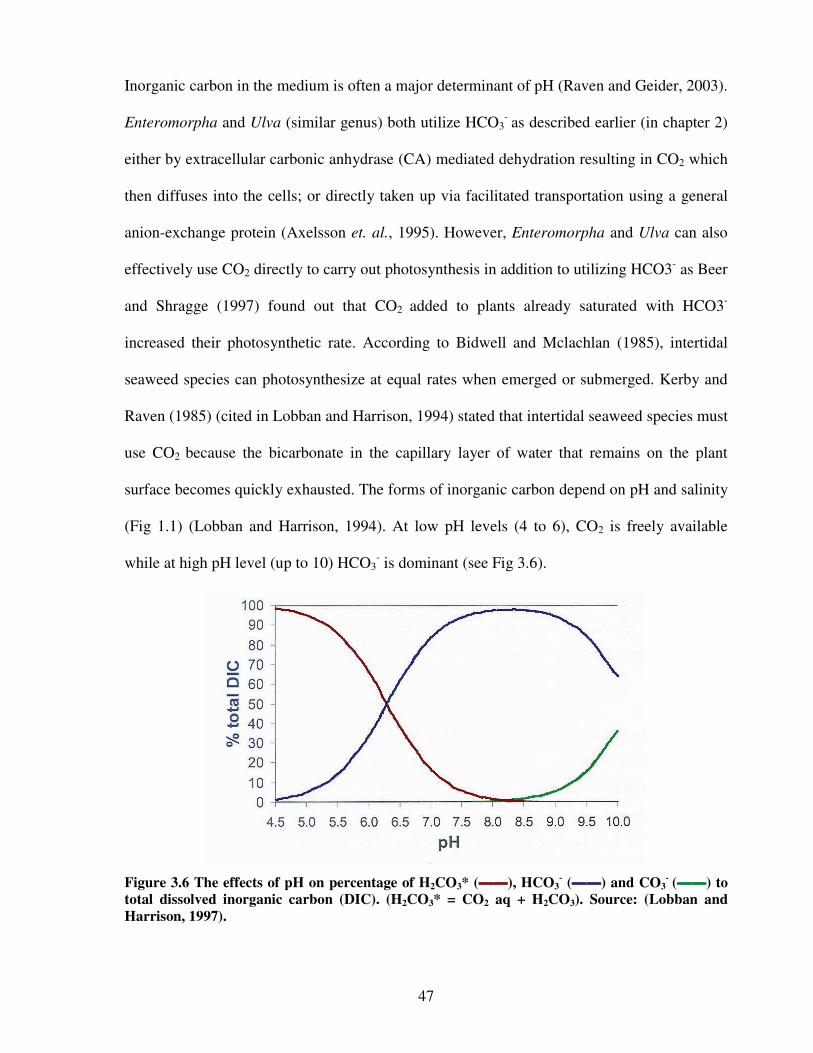
47
Inorganic carbon in the medium is often a major determinant of pH (Raven and Geider, 2003).
Enteromorpha and Ulva (similar genus) both utilize HCO3- as described earlier (in chapter 2)
either by extracellular carbonic anhydrase (CA) mediated dehydration resulting in CO2 which
then diffuses into the cells; or directly taken up via facilitated transportation using a general
anion-exchange protein (Axelsson et. al., 1995). However, Enteromorpha and Ulva can also
effectively use CO2 directly to carry out photosynthesis in addition to utilizing HCO3- as Beer
and Shragge (1997) found out that CO2 added to plants already saturated with HCO3-
increased their photosynthetic rate. According to Bidwell and Mclachlan (1985), intertidal
seaweed species can photosynthesize at equal rates when emerged or submerged. Kerby and
Raven (1985) (cited in Lobban and Harrison, 1994) stated that intertidal seaweed species must
use CO2 because the bicarbonate in the capillary layer of water that remains on the plant
surface becomes quickly exhausted. The forms of inorganic carbon depend on pH and salinity
(Fig 1.1) (Lobban and Harrison, 1994). At low pH levels (4 to 6), CO2 is freely available
while at high pH level (up to 10) HCO3- is dominant (see Fig 3.6).
Figure 3.6 The effects of pH on percentage of H2CO3* (��), HCO3- (��) and CO3
- (��) to total dissolved inorganic carbon (DIC). (H2CO3* = CO2 aq + H2CO3). Source: (Lobban and Harrison, 1997).

48
Carbon dioxide (CO2) reacts with water (H2O) to form carbonic acid (H2CO3) which
dissociates into bicarbonate ions (HCO3-) (Fig 3.7) which in turn affects the pH and alkalinity.
Therefore equilibrium shifts to the right with increasing pH (Lobban and Harrison, 1994).
Figure 3.7 The carbonate equilibrium (source: Lobban and Harrison, 1994).
Hence both growth (Fig 3.1) and photosynthesis (Fig 3.2) observed are higher in algae at high
pH due to adequate supply and utilization of HCO3 – for photosynthesis. However, at pH 10,
both growth and photosynthesis were lower than at other pH levels (pH 7, 8, and 9). This is
due to a further increase in pH level (more than 10 or 11) at which free CO2 and HCO3- were
depleted (Fig 3.6). In addition it could be due to other toxic effects on enzyme activity and
membrane permeability of the algal cells brought about by increasing pH.
Biocarbonate users raise the pH around their thalli while utilizing the HCO3-, some algae raise
the pH to over 10.5 (Maberly, 1990). E. intestinalis was found to raise the pH of its
surrounding seawater to more than 10 under closed conditions (Larsson et. al., 1997). The
ability to raise the pH is due to its capacity to transport HCO3- across the plasma membrane
into the cells through an anion exchange protein. Carbon dioxide concentrating mechanism
inside the cell has to work against the leakiness of the plasmalemma to avoid a back flux. The
electrochemical potential across the membrane is affected once the HCO3- is exchanged for
another anion and OH- is released when HCO- is dissociated (Raven and Lucas, 1985).

49
Plants in aquatic environment can also get CO2 of similar concentration as the plants in air but
the diffusion rate of CO2 is 104 time slower than air (Lobban and Harrison, 1994). At low pH
photosynthesis is fairly low even though free CO2 is readily available (which Enteromorpha
also has the ability to utilize) and it can easily diffuse across cells and chloroplast membranes.
This is mainly due to a very low concentration of CO2 present in the medium as compared to
HCO3-, hence the amount of CO2 incorporated into Rubisco is relatively lower than the CO2
that could be obtained from HCO3- in the same medium. A low concentration of this CO2 is
evident in this case. According to Beer and Shragge, (1987), increasing CO2 addition to
HCO3- saturated Enteromorpha plants increases the photosynthetic rate and this indicates that
bicarbonate does not fully compensate for the CO2 limitation in Enteromorpha and that CO2
is significant in regulating the photosynthesis.
Furthermore, environmental surrounding (external) pH affects the intracellular pH. Coleman
and Coleman (1981) found a drop in the intracellular pH of a blue green alga Coccochloris
peniocystis in response to a drop in the external (medium) pH. In addition the blue green alga
was not able to maintain its intracellular pH when placed in an acidic medium hence its
photosynthetic capacity decreased by a direct effect on the principal CO2 fixing enzyme
Rubisco.
The level of enzyme activities effectively controls photosynthesis. The enzymes of the Calvin
cycle are sensitive to the proton concentration of the chloroplast stromal compartment. The
activity of Rubisco is optimum at around pH 8. The proton pump during the light absorption
moves protons from stroma to the lumenal side to the thylakoid membrane that increases the
stromal pH. This activates the Rubisco and hence the Calvin cycle. Moreover, the key

50
enzymes of Calvin cycle, fructose biphosphate and sedoheptulose biphosphate are sensitive to
pH changes (McDonald, 2003). Coleman and Coleman, (1981) found that at a low external
(medium) pH of 5.25, the intracellular pH of Coccochloris was lowered to an extent where the
activity of RuBP-caboxylase was minimum and photosynthesis was inhibited. Raising the
external pH raised the intracellular pH, hence increasing the optimal pH up to 7.8 at which
there is an optimum activity of Rubisco. Woodraw et. al. (1984) cited in Velilova and
Yordanov (1996) also stated that input of excess protons into stroma could lower the rates of
enzymatic reaction of Calvin cycle and further increase the sensivity of the photosynthetic
apparatus to photo damage.
Chlorophyll content in pH 4, 5, 6 was higher than in pH 7, 8, 9 (Fig 3.3). The results obtained
shows that pH has a significant effect (p < 0.05) on total chlorophyll. Lower pigment content
at these pH levels was due to sporulation and the release of zoospores from the cells.
Germlings were found growing robustly on the walls of the glass beaker. Germlings were not
observed in beakers with pH 4, 5 and pH 6 which had very little growth. This indicates that at
pH 7, 8 and 9, the conditions were most favourable for the algae to survive and thrive on
while at low pH the conditions were not so favourable. Lowest chlorophyll content was found
at pH 10 due to the disintegration of the algae. On the other hand, during the growth
experiment, the growing germlings were lighter in colour at pH 4 and pH 5 when compared to
the other pH treatments. The lighter colour of the algal thalli could be due to low pH
affecting the key enzymes that are involved in the formation and biosynthesis of chlorophyll
molecules. Low pH on the other hand leads to loss of Magnesium ions from the chlorophyll
molecule which leads to breakdown of the whole chlorophyll structure (Lewis and Wang,

51
1997). However, this case is not evident in this experiment since there is a considerable
amount of chlorophyll at pH 4 and pH 5 (Fig 3.3).
The total soluble protein (TSP) content was significantly affected by pH (p < 0.05). TSP was
lower at low pH levels with lowest TSP content in pH 4 (Fig 3.4) and higher at high pH levels
from pH 7 – 9. The high TSP in pH 7 – 9 is an indication of the high photosynthesis rates at
these pH as well the high growth rates (except at pH 7). The low protein content at low pH
levels is due to pH severely affecting the biochemical compositions (proteins and enzymes).
pH of the medium influences enzyme activity in various ways since all enzymes function best
at certain optimum pH. The optimum pH for enzyme activity is usually between pH 6 – 8 but
can vary for some enzymes (Salisbury and Ross, 1991). Extreme pH causes denaturing of
enzymes which can be seen in algae exposed at pH 4. In addition, pH can influence the
enzyme reaction rates. The enzyme activity depends on the presence of free amino or
carboxyl groups. These groups can occur as charged or uncharged depending on the enzyme,
with only one form being active in a given case. The pH optimum for enzymes are high if an
uncharged amino group is required for reaction and for neutral carboxyl groups, a low pH
optimum is needed (Salisbury and Ross, 1991). Hence, it can be said that enzymes in
Enteromorpha require an uncharged amino group for active reactions. Moreover, the
ionization of many substrates (which must be ionized for the reaction to continue) is
controlled by pH (Salisbury and Ross, 1991). Apart from the enzymes and enzymatic
reactions of the Calvin cycle, increased acidity in chloroplasts can also cause damage to the
chlorophyll-proteins particulary those that are involved in PS II (Siefermann-Harms, 1992
cited in Velilova and Yordanov, 1996).

52
Similar to TSP, the total soluble carbohydrates (TSC) was lower in algae at low pH levels and
higher at high pH levels (p < 0.05). At pH 10 the TSC content was equivalent to the TSC
levels at pH 4 and 5 (Fig 3.5). The TSC content emulates the pattern of photosynthesis and
growth of Enteromorpha at various pH levels. Hence the pattern can be simply explained by
the effects of pH on photosynthesis as stated earlier. Apart from photosynthesis, pH also
affects the membrane proteins and transport processes (Pedersen and Hansen, 2003) which
affect the sites at which the various cell wall and storage polysaccharides are synthesized.
Overall, it can be said that pH changes in the surrounding environment affects
photosynthesis, membrane transport processes, biochemical composition, enzyme activity
jointly with protein and carbohydrates which in turn affects the growth of Enteromorpha.
However when looking at the growth and survival of Enteromorpha, the most important
factor affected by the pH is the inorganic carbon content, which, in turn affects the
photosynthesis. The experiment showed that Enteromorpha was able to grow and carry out
photosynthesis over a wider pH range (pH 6 – 9) hence showing the algae’s ability to grow in
and tolerate a variable pH environment.

53
CHAPTER 4
EFFECTS OF TEMPERATURE ON Enteromorpha flexuosa AND Enteromorpha
intestinalis:
RESULTS AND DISCUSSION
4.1 Results
4.1.1 Growth
Temperature in general has a significant effect on growth rates (p < 0.0001 i.e. p < 0.05)
Growth rates (Fig 4.1) of germlings at temperatures 20oC, 25oC and 28oC increased gradually
over the 20 days. The highest growth rate however was recorded at 20oC followed by 25oC
when compared with growth at other temperatures (p < 0.001 i.e. p < 0.05). Growth rate at
28oC which was the control temperature remained lower than at 20oC and 25oC over the 20
days (p < 0.01 i.e. p < 0.05). Germlings kept at 30oC had a gradual increase in growth rate
until the 10th day after which it became stable and there was no further increase. Germlings at
35oC showed absolutely no increase in the growth rate from the 1st day and were assumed to
be dead, as they had lost their green colour as well.
0.0 2.5 5.0 7.5 10.0 12.5 15.0 17.5 20.0 22.50.00
0.01
0.02
0.03
0.04
0.05
0.06
0.07
0.08
0.09
20oC
25oC
28oC
30oC
35oC
Days
Gro
wth
rat
e (g
/day
)
Figure 4.1 The growth rates of E. flexuosa and E. intestinalis (together) at different temperatures in ASM. Error bars represent the range of growth rates at each temperature. Growth rates were measured as fresh weights of 4 replicates at 5 day intervals over 20 days. The days were counted
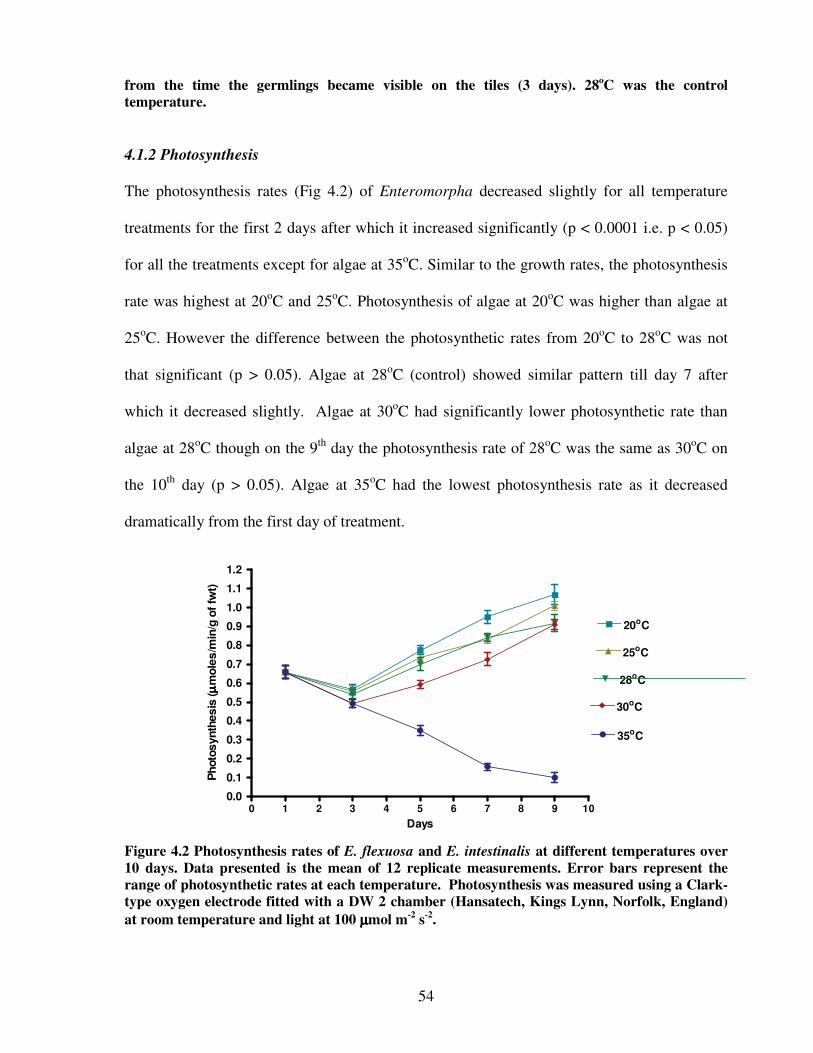
54
from the time the germlings became visible on the tiles (3 days). 28oC was the control temperature. 4.1.2 Photosynthesis
The photosynthesis rates (Fig 4.2) of Enteromorpha decreased slightly for all temperature
treatments for the first 2 days after which it increased significantly (p < 0.0001 i.e. p < 0.05)
for all the treatments except for algae at 35oC. Similar to the growth rates, the photosynthesis
rate was highest at 20oC and 25oC. Photosynthesis of algae at 20oC was higher than algae at
25oC. However the difference between the photosynthetic rates from 20oC to 28oC was not
that significant (p > 0.05). Algae at 28oC (control) showed similar pattern till day 7 after
which it decreased slightly. Algae at 30oC had significantly lower photosynthetic rate than
algae at 28oC though on the 9th day the photosynthesis rate of 28oC was the same as 30oC on
the 10th day (p > 0.05). Algae at 35oC had the lowest photosynthesis rate as it decreased
dramatically from the first day of treatment.
0 1 2 3 4 5 6 7 8 9 100.0
0.1
0.2
0.3
0.4
0.5
0.6
0.7
0.8
0.9
1.0
1.1
1.2
20oC
25oC
28oC
30oC
35oC
Days
Pho
tosy
nthe
sis
(μμ μμm
oles
/min
/g o
f fw
t)
Figure 4.2 Photosynthesis rates of E. flexuosa and E. intestinalis at different temperatures over 10 days. Data presented is the mean of 12 replicate measurements. Error bars represent the range of photosynthetic rates at each temperature. Photosynthesis was measured using a Clark-type oxygen electrode fitted with a DW 2 chamber (Hansatech, Kings Lynn, Norfolk, England) at room temperature and light at 100 μμμμmol m-2 s-2.
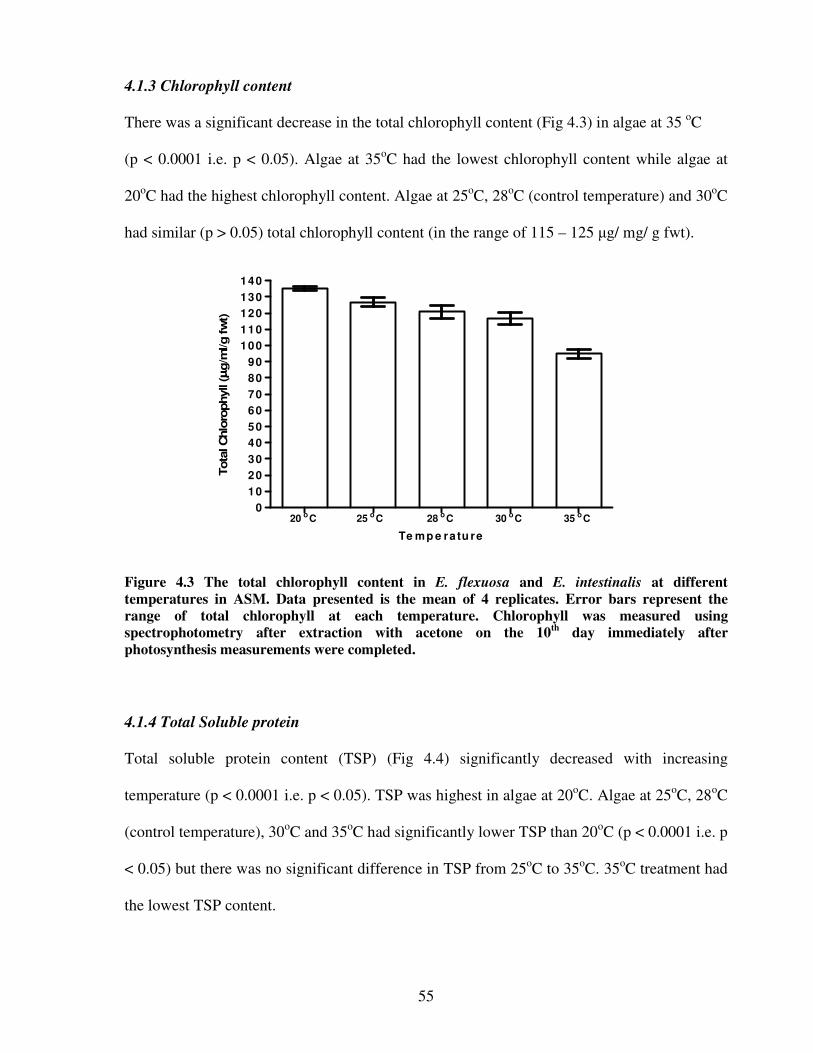
55
4.1.3 Chlorophyll content There was a significant decrease in the total chlorophyll content (Fig 4.3) in algae at 35 oC
(p < 0.0001 i.e. p < 0.05). Algae at 35oC had the lowest chlorophyll content while algae at
20oC had the highest chlorophyll content. Algae at 25oC, 28oC (control temperature) and 30oC
had similar (p > 0.05) total chlorophyll content (in the range of 115 – 125 �g/ mg/ g fwt).
20 oC 25 oC 28 oC 30 oC 35 oC0
102030405060708090
100110120130140
Te mp e ratu re
Tota
l Chlo
rophyl
l (μμ μμg/m
l/g fw
t)
Figure 4.3 The total chlorophyll content in E. flexuosa and E. intestinalis at different temperatures in ASM. Data presented is the mean of 4 replicates. Error bars represent the range of total chlorophyll at each temperature. Chlorophyll was measured using spectrophotometry after extraction with acetone on the 10th day immediately after photosynthesis measurements were completed. 4.1.4 Total Soluble protein
Total soluble protein content (TSP) (Fig 4.4) significantly decreased with increasing
temperature (p < 0.0001 i.e. p < 0.05). TSP was highest in algae at 20oC. Algae at 25oC, 28oC
(control temperature), 30oC and 35oC had significantly lower TSP than 20oC (p < 0.0001 i.e. p
< 0.05) but there was no significant difference in TSP from 25oC to 35oC. 35oC treatment had
the lowest TSP content.
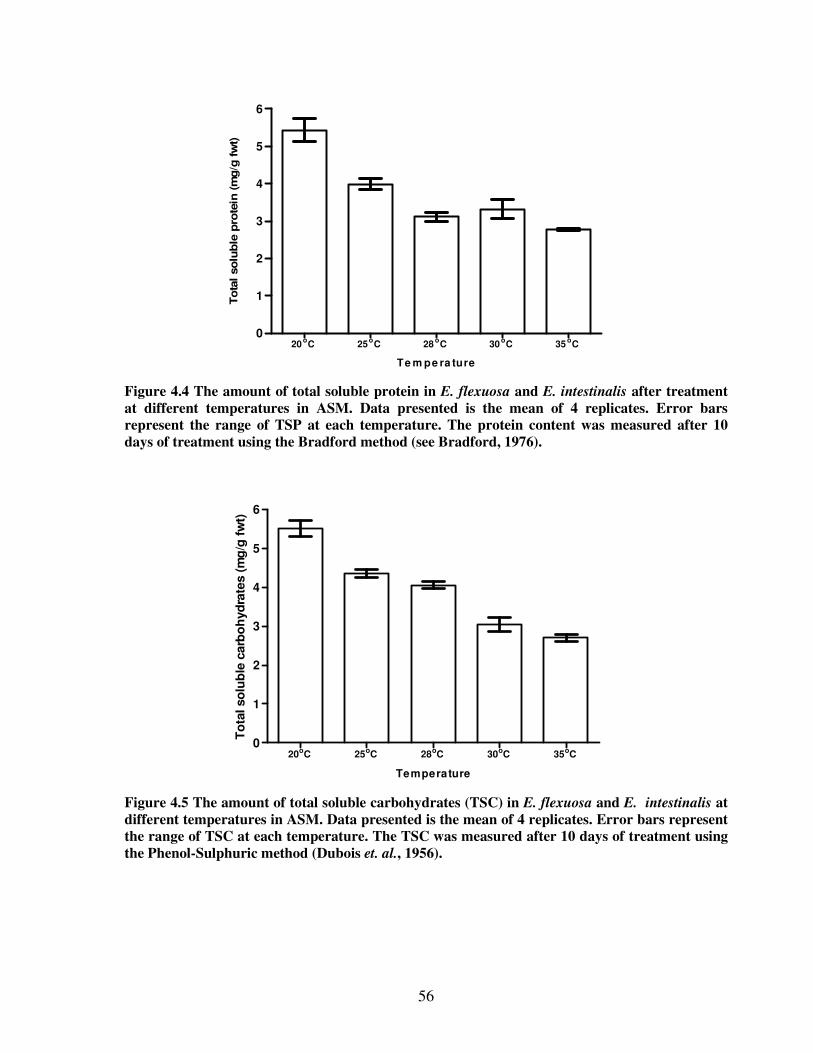
56
Figure 4.4 The amount of total soluble protein in E. flexuosa and E. intestinalis after treatment at different temperatures in ASM. Data presented is the mean of 4 replicates. Error bars represent the range of TSP at each temperature. The protein content was measured after 10 days of treatment using the Bradford method (see Bradford, 1976).
20oC 25oC 28oC 30oC 35oC0
1
2
3
4
5
6
Temperature
To
tal s
olu
ble
car
bo
hyd
rate
s (m
g/g
fw
t)
Figure 4.5 The amount of total soluble carbohydrates (TSC) in E. flexuosa and E. intestinalis at different temperatures in ASM. Data presented is the mean of 4 replicates. Error bars represent the range of TSC at each temperature. The TSC was measured after 10 days of treatment using the Phenol-Sulphuric method (Dubois et. al., 1956).
20oC 25oC 28oC 30oC 35oC0
1
2
3
4
5
6
Te m pe ra ture
To
tal
solu
ble
pro
tein
(m
g/g
fw
t)

57
4.1.5 Total soluble carbohydrates.
The total soluble carbohydrates (Fig 5.5) decreased significantly with increasing temperatures
(p < 0.0001 i.e. p < 0.05). The highest TSC (5.5 mg/g fwt) was measured for algae at 20oC.
Algae at 25oC and 28oC (control temperature) had the TSC in the similar range of (4 – 4.3
mg/g fwt) (p > 0.05). Algae at 30oC had fairly low TSC (3.3 mg/g fwt) similar (p > 0.05) to
algae at 35oC, which had the lowest (2.7 mg/g fwt) TSC content.
4.2 Discussion
Highest growth of the germlings of the two Enteromorpha species was recorded at 20oC (Fig
4.1) and lowest growth was recorded at 30oC while no growth occurred at 35oC. The pattern
observed is similar to the recorded photosynthesis rate of the adult thalli (Fig 4.2), total
soluble protein (Fig 4.4) and total soluble carbohydrates. However, photosynthesis rates
between 20oC and 30oC were not significantly different (p > 0.05). These analogous patterns
show that Enteromorpha can exist over a wide temperature range although it appears not to
accumulate soluble protein and soluble carbohydrate as temperature increases. The results
also illustrate that high temperature above its tolerance range (35oC) has adverse effects on
the algae.
Hill (2001) noted a favourable growth of E. flexuosa at temperatures ranging from 15oC -30oC
and adverse effects on growth together with bleaching at temperatures of 33oC and above.
This research shows that while photosynthesis and chlorophyll content do not appear to be
adversely affected between 20 – 30oC, TSP and TSC contents significantly (p < 0.05)
decrease with temperature.
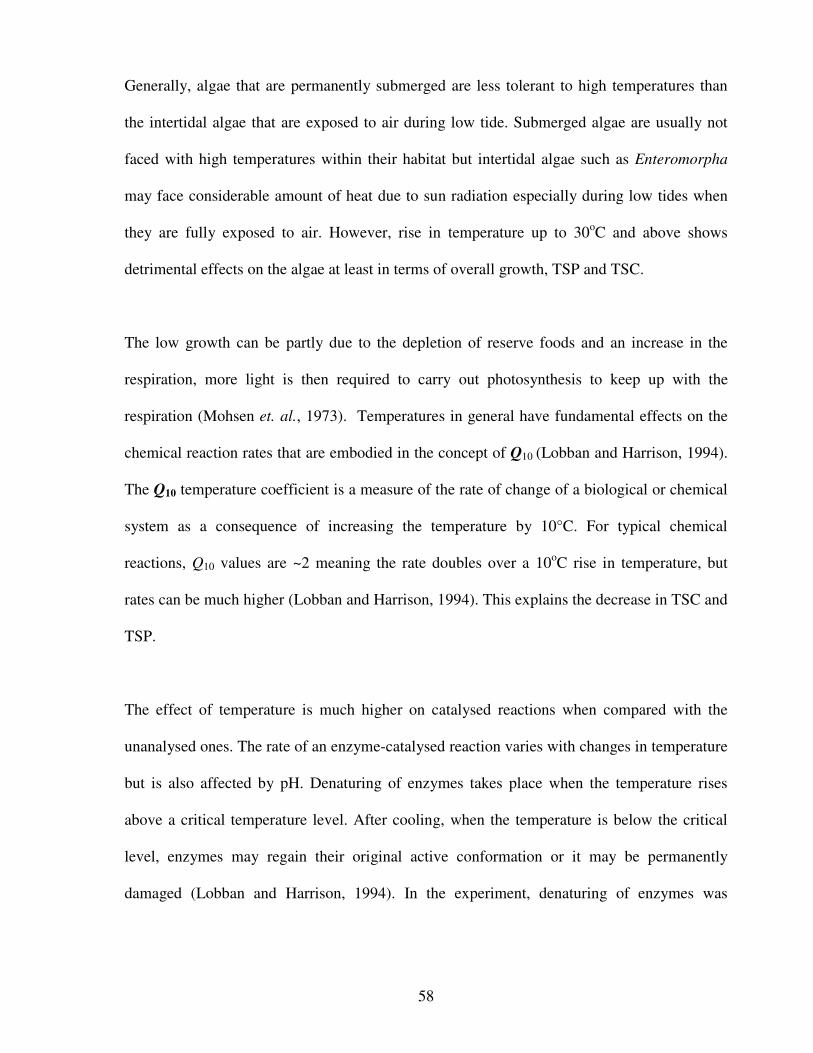
58
Generally, algae that are permanently submerged are less tolerant to high temperatures than
the intertidal algae that are exposed to air during low tide. Submerged algae are usually not
faced with high temperatures within their habitat but intertidal algae such as Enteromorpha
may face considerable amount of heat due to sun radiation especially during low tides when
they are fully exposed to air. However, rise in temperature up to 30oC and above shows
detrimental effects on the algae at least in terms of overall growth, TSP and TSC.
The low growth can be partly due to the depletion of reserve foods and an increase in the
respiration, more light is then required to carry out photosynthesis to keep up with the
respiration (Mohsen et. al., 1973). Temperatures in general have fundamental effects on the
chemical reaction rates that are embodied in the concept of Q10 (Lobban and Harrison, 1994).
The Q10 temperature coefficient is a measure of the rate of change of a biological or chemical
system as a consequence of increasing the temperature by 10°C. For typical chemical
reactions, Q10 values are ~2 meaning the rate doubles over a 10oC rise in temperature, but
rates can be much higher (Lobban and Harrison, 1994). This explains the decrease in TSC and
TSP.
The effect of temperature is much higher on catalysed reactions when compared with the
unanalysed ones. The rate of an enzyme-catalysed reaction varies with changes in temperature
but is also affected by pH. Denaturing of enzymes takes place when the temperature rises
above a critical temperature level. After cooling, when the temperature is below the critical
level, enzymes may regain their original active conformation or it may be permanently
damaged (Lobban and Harrison, 1994). In the experiment, denaturing of enzymes was

59
assumed to be due to permanent damage to their original active conformation. This is evident
to some extent when looking at the TSP content (Fig. 4.4).
When measuring reaction rates verses temperatures in complex reactions such as
photosynthesis and respiration, the overall rate is the total of all individual reaction rates.
Hence the effects of a given temperature change is not the same for all the metabolic
processes since different temperature sensitivities exist for different enzymes in different
processes and in addition they are influenced by other factors such as light, pH, and nutrients.
The rate is always determined by the rate limiting steps.
High temperatures may induce lethal effect possibly by shifting the equilibrium between the
reaction sequences with different Q10 values (Marre, 1962). This is evident in algae at 35oC.
Inhibition of both photosynthesis and respiration occur at high temperatures, but during the
increase in temperature, photosynthesis rates decrease before respiration rates in algae at
35oC. Respiration has higher Q10 value than photosynthesis hence when temperature is
increased photosynthesis decreased due to denaturing of enzymes and hence the depletion of
food due to respiration is must faster than the rate of food manufacturing and storage. In a
given time, the temperature at which the amount of CO2 is fixed via photosynthesis is equal to
the amount of CO2 released via respiration is known as the compensation point. Any rise in
temperature above this does not allow photosynthesis to replace the carbon that is used in
respiration as a substrate. The carbohydrate reserves decrease consequently (Taiz and Zeiger,
1998). This is evident when looking at the low TSC of Enteromoprha at high temperatures
(Fig 4.5).

60
The total chlorophyll content (Fig 4.3) was slightly lower in algae at higher temperatures (Fig
4.3), bleaching of thalli was observed. However bleaching of fronds was incomplete, meaning
entire frond did not get bleached; part of the thalli was green in color, while part appeared
white. This may be because some cells become resistant to heat. Mohsen et. al. (1973)
observed incomplete bleaching in cells of Ulva fasciata during his study of the effects of
temperature variations on U. fasciata. They found the resistant cells of U. fasciata were
growing on nylon threads and rope, indicating that such cells were associated with
regeneration under drastic conditions. Bleached cells were assumed to be dead since all the
parameters measured became lower with an increase in the amount of bleached algae during
the experiment. In addition there was no germlings observed in the beakers at 30oC and 35oC,
which confirms the death of the algal cells. Little sporulation was observed at 20oC while at
25oC and 28oC, considerable amount of sporulation was observed. Considerable sporulation
at these two temperatures indicates favorable temperatures for reproduction. Extreme
temperature changes the quantity of pigments, organization of thylakoids, the primary
photochemistry and carbon dioxide fixing ability of the chloroplasts (Biswal, 2005). In
contrast to this, the behavior of adult thalli to varying temperatures was different. Adult thalli
exhibited a greater degree of tolerance to a wider temperature range.
Photosynthesis and respiration decrease largely since they are highly dependent on the
activity of membrane associated electron carriers and enzymes (Tiaz and Zeiger, 1998). PS II
is more sensitive to high temperatures than PS I (Berry and Bjorkmann, 1980). Havaux et. al.
(1991) found that that at high temperatures, PS II activity in pea leaves was inhibited while
the PS I activity was stimulated. Photosynthetic oxygen evolution was inhibited and the
photochemical energy storage decreased and these were correlated with a significant loss of
61
variable PS II chlorophyll fluorescence emission while the capacity of cyclic electron flow
around PS I increased (Havaux et. al., 1991). Inactivation of PS II at high temperature is due
to extraction of divalent ions Ca2+ and Mn 2+ from the oxygen-evolving complex of PS II. In
addition dissociation of the 32kDa extrinsic polypeptide that is involved in Mn-cluster
stabilization occurs (Carpentier, 1999). Bjorkman et. al. (1980) (cited in Tiaz and Zeiger,
1998) found that the temperature at which the enzymes involved in photosynthesis began to
denature and lose activity was much higher than the temperatures at which the photosynthesis
began to decline hence they suggested that the early stages of heat stress to photosynthesis is
directly related to changes in membrane properties and to uncoupling of energy transfer
mechanisms in the chloroplast than to general denaturing of enzymes and proteins. This
explains the lowering of the photosynthesis rate as the temperature increases from 20oC to
30oC (Fig 4.2).
In addition, the cause of death by high temperatures is generally explained to be the result of
denaturing of proteins (Daniell et. al., 1969). The TSP recorded is lower at high temperatures
(Fig 4.4). High temperatures affect the stability of various cellular membranes. The loss of
physiological functions is often correlated with the excessive fluidity of the membrane lipids
at high temperature. Exposure to high temperatures decreases the strength of the hydrogen
bonds and the electrostatic interactions between the polar groups of proteins within the
aqueous phase of the membrane allowing the integral membrane proteins to associate more
strongly with the lipid phase. The membrane composition and structure is modified which
may lead to leakage of ions. Hence membrane fluidity is increased, leading to peroxidation
and lateral diffusion of membrane lipids. Increased membrane permeability causes a decrease
in proton gradient formation across the thylakoid membrane (Berry and Bjorkmann, 1980).

62
According to Crafts-Brandner et. al. (2000) high temperature also decreases the level and
activation state of the carboxylating enzyme Rubicso. Photosynthesis (Fig 4.2) in the
experiment does not noticeably indicate the Rubisco deactivation and death except at 35oC.
Further investigation on Rubisco deactivation is needed to confirm this.
Denaturing of various enzymes and proteins may also lead to a lower TSP content in
Enteromorpha at high temperatures (28oC, 30oC and 35oC) (Fig. 4.4). Mohsen (1973) also
found within the temperature range from 20oC to 25oC, most of the amino acids in Ulva
fasciata increased greatly while it decreased below the initial content at 30oC.
The low soluble sugar content in Enteromoprha at high temperatures (30oC and 35oC) can
also be accounted by the denaturing and degradation of enzymes responsible for the cleavage
of several glucosides of various polysaccharides hence inhibiting the synthesis of
polysaccharides (Mohsen et. al., 1973). The TSC content in algae also follows the pattern of
photosynthetic rate in Enteromoprha, low photosynthesis hence low sugars are synthesized.
Total soluble protein (Fig 4.4) and TSC (Fig 4.5) seem to be direct results of photosynthesis
as at 20oC, photosynthesis is high and so is TSP and TSC. However, at higher temperature
while photosynthesis occurs, respiration demands appear to decrease TSC and TSP content.
While increase in temperature is normally expected to increase membrane fluidity resulting in
the loss of metabolic activity, this would be unlikely in the case of Enteromorpha in the
experiment since the photosynthesis structures appear to be intact and functioning well
between 25oC – 30oC.

63
Overall, the response of E. flexuosa and E. intestinalis show that this alga is able to carry out
photosynthesis over a wide temperature range and remain viable. The germlings of algae are
much more sensitive to temperature than the adult thalli. Extremely high temperature (35oC in
this experiment) has adverse effects (p <0.05) on the algae.

64
CHAPTER 5
EFFECTS OF AMMONIUM (NH4+) AND NITRATE (NO3
-) ON Enteromorpha
flexuosa AND Enteromorpha intestinalis:
RESULTS AND DISCUSSION
5.1 Results illustrating the effects of Ammonium (NH4+).
5.1.1 Growth
There was an overall increase in the growth rates of germlings (Fig 5.1) of the algae in all the
treatments, increasing as the concentration of NH4+ increased (p = 0.0062 i.e. p < 0.05). The
highest overall growth was seen in the algae with 2.5 �moles of NH4+, which after 10 days
gradually increased from 0.04 g/ day to 0.08 g/ day. Algae at 0.5 �moles/L (control
concentration) had similar growth rate at 1.0 �moles/L (p > 0.05) much lower growth rate
than 1.5 �moles/L, and 2.0 �moles/L (p < 0.01). The growth pattern at 0 �moles/L was
similar to that at 0.25 �moles/L (p > 0.05), which was lower than the control levels. There
was still some N present in the medium even though no NH4+ was added.
5.1.2 Photosynthesis
Overall all the treatments showed an increase in the photosynthesis rate (Fig 5.2) from the 1st
day till the 10th day regardless of the fluctuations. However there was no significant
differences between the photosynthetic rates obtained at different ammonium levels (p >
0.05). On the last day all the treatments had the photosynthesis rate in the range of 0.9
�moles/ min/ g fwt to 1.0 �moles/ min/ g fwt (all rates seemed to even out in the end) (p >
0.05).

65
0 5 10 15 20 250.00
0.01
0.02
0.03
0.04
0.05
0.06
0.07
0.08
0.09
0 μμμμmoles/L
2.5 μμμμmoles/L
2.0 μμμμmoles/L
1.5 μμμμmoles/L
1.0 μμμμmoles/L
0.5 μμμμmoles/L
0.25 μμμμmoles/L
Days
Gro
wth
rat
e (g
/day
)
Figure 5.1 The growth rates of E. flexuosa and E. intestinalis (together) at different levels of NH4
+ in ASM. Error bars represent the range of growth rates at each NH4+ concentration.
Growth rates were measured as fresh weights of 4 replicates at 5 day intervals over 20 days. The days were counted from the time the germlings became visible on the tiles (4 days).
0 1 2 3 4 5 6 7 8 9 100.4
0.5
0.6
0.7
0.8
0.9
1.0
1.1
0 μμμμmoles/L
0.25 μμμμmoles/L
0.5 μμμμmoles/L
1.0 μμμμmoles/L
1.5 μμμμmoles/L
2.0 μμμμmoles/L
2.5 μμμμmoles/L
Days
Ph
oto
syn
thes
is (
um
ole
s/m
in/g
of
fw)
Figure 6.2 Photosynthesis rates of E. flexuosa and E. intestinalis at different NH4
+ levels over 10 days. Data presented is the mean of 12 replicate measurements. Error bars indicate the range of photosynthetic rates at each NH4
+ concentration. Photosynthesis was measured using a Clark-type oxygen electrode fitted with a DW 2 chamber (Hansatech, Kings Lynn, Norfolk, England) at room temperature and fluoresce light at 100 μμμμmol photons m-2 s-1.

66
5.1.3 Chlorophyll content
There was no significant difference in the total chlorophyll content (Fig 5.3) in all treatments
(p = 0.09 i.e. p > 0.05) including the treatment with zero ammonium. The values ranged
between 125 – 150 �g/ ml/ g fwt. The lowest chlorophyll content however was seen in the
treatment with the highest amount of NH4+ (2.5 �moles/L).
Figure 5.3 The total chlorophyll content in E. flexuosa and E. intestinalis at different levels of NH4
+ in ASM. Data presented is the mean of 4 replicates. Error bars indicate the range of total chlorophyll at each NH4
+ treatment. Total chlorophyll was measured using Spectrophotometry after extraction with acetone on the 10th day immediately after photosynthesis measurements were completed. 5.1.4 Total soluble protein Generally there was an increase in the total soluble protein (TSP) content (Fig 5.4) in the
algae with increasing NH4+ (p = 0.045 i.e. p < 0.05). While the difference between TSP
content was significant between the lowest (0 �moles/L) and highest concentration (2.5
�moles/L), there was generally no significant difference between the consecutive
concentrations (p > 0.05).
Nil 0.25 0.5 1.0 1.5 2.0 2.50
25
50
75
100
125
150
175
NH4+ concentration in the media (μμμμmoles/L )
Tota
l chl
orop
hyll
cont
ent (
μμ μμg/
ml/g
fw
t)

67
0 0.25 0.5 1.0 1.5 2.0 2.50
1
2
3
4
NH4+ concentration in the media (μμμμmoles/L )
To
tal s
olu
ble
pro
tein
(m
g/ g
fw
t)
Figure 5.4 The amount of total soluble protein in E.flexuosa and E.intestinalis after the treatment at different concentrations of NH4+ in ASM. Data presented is the mean of 4 replicates. Error bars indicate the range of TSP at each NH4
+ concentration. The protein content was measured after 10 days of treatment using the Bradford method (see Bradford, 1976).
0 0.25 0.5 1.0 1.5 2.0 2.50.0
0.5
1.0
1.5
2.0
2.5
NH4+conce ntration in the media (μμμμmoles/L )
Tota
l sol
uble
car
bohy
drat
e (m
g/ g
)
Figure 5.5 The amount of total soluble carbohydrates in E. flexuosa and E. intestinalis after the treatment at different concentrations of NH4
+ in ASM. Data presented is the mean of 4 replicates. Error bars indicate the range of TSC at each NH4
+ concentration. The TSC was measured after 10 days of treatment using the Phenol-Sulphuric method (see Dubois et. al., 1956).

68
5.1.5 Total soluble carbohydrates
The total soluble carbohydrate content (Fig 5.5) at all 7 concentrations was basically the same
ranging from 1.88 mg/g fwt to 2.02 mg/g fwt (p = 0.0997 i.e. p > 0.05). Algae in the control
concentration of ammonia (0.5 �moles/L) showed the lowest TSC content and at zero
concentration the TSC content was the highest. However, there was no significant difference
in the TSC content in all 7 concentrations (p > 0.05).
5.2 Results illustrating the effects of Nitrate (NO3-)
5.2.1 Growth
There was an overall increase in growth rate (Fig 5.6) of germlings of algae in all the
treatments, increasing as NO3- concentration in the growth media increased (p = 0.0004 i.e. p
< 0.05). The highest growth rate was observed for 7.0 �moles/L treatment which after the 10th
day increased rapidly from 0.040 g/ day to 0.07 g/ day. The 4.2 �moles/L and 5.6 �moles/L
treatments showed a similar trend of gradual increase in the growth rates from approximately
0.03 g/ day up to 0.055 g / day while 2.8 �moles/L treatments showed lower growth rates (an
increase from 0.025 g/ day to 0.055 g/day). The 1.4 �moles/L treatment, which was the
control, together with 0.7 �moles/L showed lower growth rates (an approximate increase from
0.025 g/ day to about 0.047 g/ day). The lowest rate was recorded for the germlings with no
NO3- (p < 0.01).

69
0 5 10 15 20 250.00
0.01
0.02
0.03
0.04
0.05
0.06
0.07
0.08
1.4 μμμμmole s/L
2.8 μμμμmole s/L
4.2 μμμμ mole s/L
5.6 μμμμ mole s/L
7.0 μμμμ mole s/L
0.7 μμμμ mole s/L
0 μμμμ mole s/L
Days
Gro
wth
rat
e (g
/day
)
Figure 5.6 The growth rates of E. flexuosa and E. intestinalis (together) at different levels of NO3
- in ASM. Error bars indicate the range of growth rates at each NO3- concentration. Growth
rates were measured as fresh weights of 4 replicates at 5 day intervals over 20 days. The days were counted from the time the germlings became visible on the tiles (5 days).
0 1 2 3 4 5 6 7 8 9 101.3
1.4
1.5
1.6
1.7
1.8
1.9
2.0
2.1
0 μμμμmoles/L
0.7 μμμμmoles/L
1.4 μμμμmoles/L
2.8 μμμμmoles/L
4.2 μμμμmoles/L
5.6 μμμμmoles/L
7.0 μμμμmoles/L
Days
pho
tosy
nth
esis
rat
e ( μμ μμ
mol
es/m
in/g
fwt)
Figure 5.7 Photosynthesis rates of E. flexuosa and E. intestinalis at different NO3
- levels over 10 days. Data presented is the mean of 12 replicate measurements. Error bars indicate the range of photosynthetic rates at each NO3
-concentration. Photosynthesis was measured using a Clark-type oxygen electrode fitted with a DW 2 chamber (Hansatech, Kings Lynn, Norfolk, England) at room temperature and fluorescent light at 100 μμμμmol photons m-2 s-1.

70
5.2.2 Photosynthesis
Generally there was a significant increase in the photosynthetic rates (Fig 5.7) in all
treatments over the 10 days (p = 0.016 i.e p < 0.05). The lowest photosynthesis rate was in
algae with no NO3- while in all other treatments, the rate was within similar range (1.88 – 1.97
�moles/ min/ g fwt) with no significant difference (p > 0.05). Overall there was no significant
difference between the photosynthetic rates measured except for the algae with no NO3-.
5.2.3 Chlorophyll
There is no significant difference in the measured total chlorophyll content (Fig 5.8) between
algae in all treatments (p = 0.061 i.e. p < 0.05).
0 0.7 1.4 2.8 4.2 5.6 7.00
102030405060708090
100110120130140
Nitrate (NO3-) levels in medium (μμμμmoles/ L)
Tota
l ch
loro
phyl
l ( μμ μμ
g/m
l/g f
wt)
Figure 5.8 The concentrations of total chlorophyll in E. flexuosa and E. intestinalis at different levels of NO3
- in ASM. Data presented is the mean of 4 replicates. Error bars indicate the range of total chlorophyll at each NO3
- concentration. Total chlorophyll content was measured using Spectrophotometry after extraction with acetone on the 10th day immediately after photosynthesis measurements were completed.

71
5.2.4 Total soluble protein
Generally higher total soluble protein content (Fig 5.9) was measured for algae with high
NO3- in 4.2 �moles/L, 5.6 �moles/L, 7.0 �moles/L treatments where the TSP was around 7
mg/ g fwt with no significant difference (p > 0.05). Algae at 1.4 �moles/L and 2.8 �moles/L
treatments that had TSP around 6.5 mg/g fwt. Algae in 0.7 �moles/L treatment had slightly
lower TSP content (6.2 mg/g fwt). The lowest TSP (5.3 mg/g fwt) was measured for algae
with no NO3- . TSP in algae with no NO3
- was significantly lower when compared with 4.2
�moles/L, 5.6 �moles/L and 7.0 �moles/L (p < 0.01) but did not differ significantly from TSP
content in 1.4 �moles/L and 0.7 �moles/L (p > 0.05).
0 0.7 1.4 2.8 4.2 5.6 70
1
2
3
4
5
6
7
8
Nitrate (NO3-) leve ls in the medium (μμμμmoles/L)
Tot
al s
olub
le p
rote
in (m
g/g
fwt)
Figure 5.9 The amount of total soluble protein content in E. flexuosa and E. intestinalis after the treatment at different concentrations of NO3
- in ASM. Data presented is the mean of 4 replicates. Error bars indicate the range of TSP at each NO3
- concentration. The protein content was measured after 10 days of treatment using the Bradford method (see Bradford, 1976).
5.2.5 Total soluble carbohydrates
A significant increase in the total soluble carbohydrate content (Fig 5.10) was recorded as the
amount of NO3- in the medium increased (p < 0.0001 i.e p < 0.05). Highest TSC was

72
measured for algae in 7 �moles/L NO3- (54 mg/g fwt). Algae at 1.4 �moles/L, 2.8 �moles/L,
4.2 �moles/L NO3- treatments which had TSC in the range of 4.32 – 4.97 mg/g fwt. Algae at
0.7 �moles/L NO3- had slightly lower TSC content while the lowest TSC content was
measured for algae with no NO3-.
Figure 5.10 The amount of total soluble carbohydrates in E. flexuosa and E. intestinalis after the treatment at different concentrations of NO3
- in ASM. Data presented is the mean of 4 replicates. Error bars indicate the range of TSC at each NO3
- concentration. The TSC was measured after 10 days of treatment using the Phenol-Sulphuric method (see Dubois et. al., 1956).
5.3 Discussion
The growth experiments both in NH4+ treatments (Fig 5.1) and in NO3
- treatments (Fig 5.6)
showed an increase in the growth of Enteromorpha with an increase in the concentration of
nitrogen contents in the medium which means that the growth rates are directly proportional
to the variations in the nitrogen supply. Similarly an increase in the photosynthetic rates of
Enteromorpha in both the treatments was observed with an increase in the nitrogen
concentrations. However there was no significant difference between the rates observed. This
0 0.7 1.4 2.8 4.2 5.6 7.00
1
2
3
4
5
6
Nitrate (NO 3-) leve ls in the medium (μμμμmoles/L)
Tot
al s
olubl
e ca
rbohy
dra
te (
mg/g
fw
t)
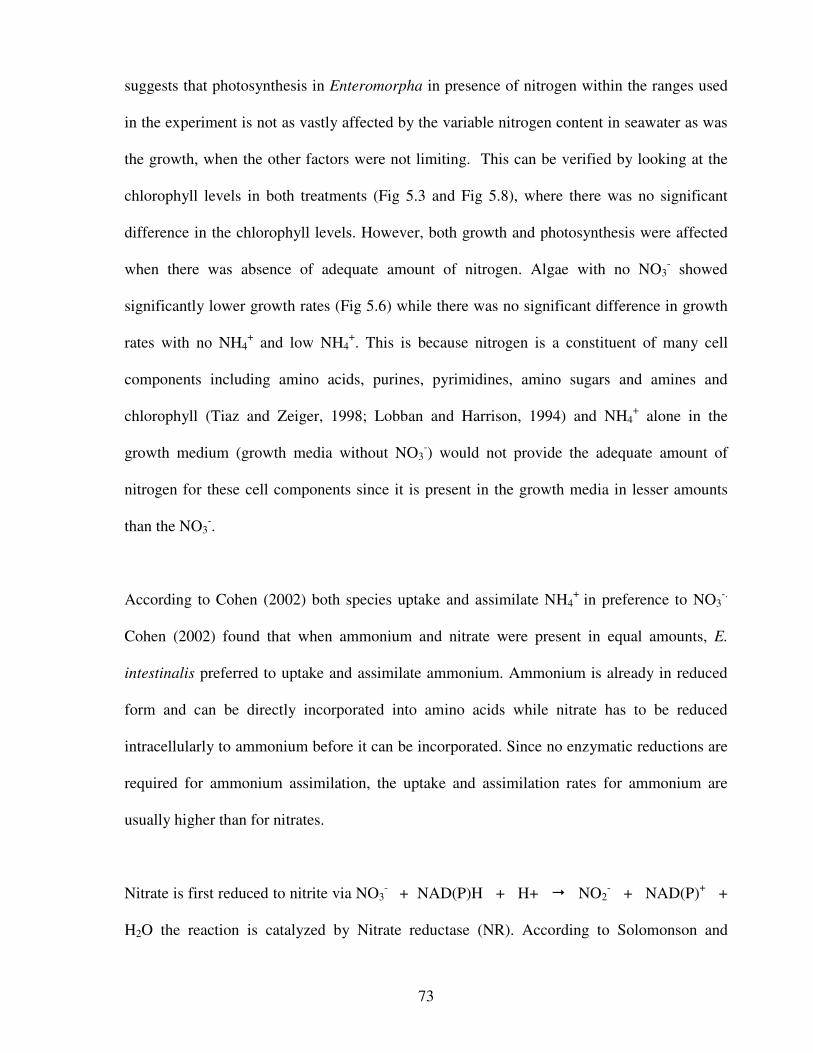
73
suggests that photosynthesis in Enteromorpha in presence of nitrogen within the ranges used
in the experiment is not as vastly affected by the variable nitrogen content in seawater as was
the growth, when the other factors were not limiting. This can be verified by looking at the
chlorophyll levels in both treatments (Fig 5.3 and Fig 5.8), where there was no significant
difference in the chlorophyll levels. However, both growth and photosynthesis were affected
when there was absence of adequate amount of nitrogen. Algae with no NO3- showed
significantly lower growth rates (Fig 5.6) while there was no significant difference in growth
rates with no NH4+ and low NH4
+. This is because nitrogen is a constituent of many cell
components including amino acids, purines, pyrimidines, amino sugars and amines and
chlorophyll (Tiaz and Zeiger, 1998; Lobban and Harrison, 1994) and NH4+ alone in the
growth medium (growth media without NO3-) would not provide the adequate amount of
nitrogen for these cell components since it is present in the growth media in lesser amounts
than the NO3-.
According to Cohen (2002) both species uptake and assimilate NH4+ in preference to NO3
-.
Cohen (2002) found that when ammonium and nitrate were present in equal amounts, E.
intestinalis preferred to uptake and assimilate ammonium. Ammonium is already in reduced
form and can be directly incorporated into amino acids while nitrate has to be reduced
intracellularly to ammonium before it can be incorporated. Since no enzymatic reductions are
required for ammonium assimilation, the uptake and assimilation rates for ammonium are
usually higher than for nitrates.
Nitrate is first reduced to nitrite via NO3- + NAD(P)H + H+ � NO2
- + NAD(P)+ +
H2O the reaction is catalyzed by Nitrate reductase (NR). According to Solomonson and

74
Barber (1990) cited in Lobban and Harrison (1994) Nitrate reductase maybe associated with
chloroplast membranes. Nitrate reduction to ammonium requires 8 electrons (8 ferrodoxins)
and the reduction is catalyzed by the enzyme nitrate reductase (Davison and Stewart, 1984
cited in Lobban and Harrison, 1994). After formation of nitrite (by reduction of nitrate), it is
transported to the chloroplasts for reduction to ammonium via the reaction: NO2- + 6Fered
+ 8H+ � NH4+ 6Feox + 2H2O where Fered and Feox are the reduced amd oxidized forms
of ferrodoxins respectively) that is catalysed by nitrite reductase (NiR). NiR is also thought to
be associated with the chloroplast.
Figure 5.11 showing main features of nitrogen uptake and assimilation in a eukaryotic algal cell. (source: Lobban and Harrison, 1994)
Once the nitrate is reduced to intermediate compounds such as ammonium and amino acids, it
is then incorporated into proteins and chlorophyll while incorporation of ammonium is direct.
As a result there would be an increase in protein and chlorophyll content as it would then
promote cell division hence increasing algal biomass. This is however not evident in the
experiment as the TSP is higher in NO3- treatments (Fig 5.9) than in NH4
+ treatments (Fig

75
5.4). The increase or decrease in TSP was not prominent because the algae used for the
experiment were already in their adult form growing possibly in much higher nitrogen levels
in their natural environment than the levels in ASM used for the experiment.
Preferential uptake of ammonium also means lower energy costs since 8
ferrodoxins is not required (Lara et. al., 1987 cited in Ruckert and Giani, 2004). Preferential
uptake of ammonium can be also appreciated by the fact that the nitrate reductase and nitrite
reductase are associated with the chloroplasts. It was observed that the algae lost chloroplasts
in parts (matured portions usually located on the upper sides) of the thallus during sporulation
but still thrived on. This is because they uptake ammonium and incorporate it directly and the
process of reduction of nitrates is not required.
There was no significant difference in the carbohydrate content of the algae in NH4+
treatments, even in the treatment where there was no NH4+. The treatments with high NH4
+
content also did not show any significant changes. This could have been due to process of
conversion of present nitrate to ammonium and being used up the plant, which requires more
energy hence the carbohydrates are being used up subsequently to provide the energy for the
conversion process. As evident from Chapter 7, the algae are exposed to much higher NH4+
levels in their natural environment. In nitrate treatments the soluble carbohydrate increased
with an increase in the nitrate content. The patterns in both treatments are analogous to the
pattern of photosynthesis. In nitrate treatment however ammonium was present as well hence
lower energy to convert adequate amounts of nitrate to ammonia is much lower and hence the
carbohydrate content is slightly higher (Fig 5.10).
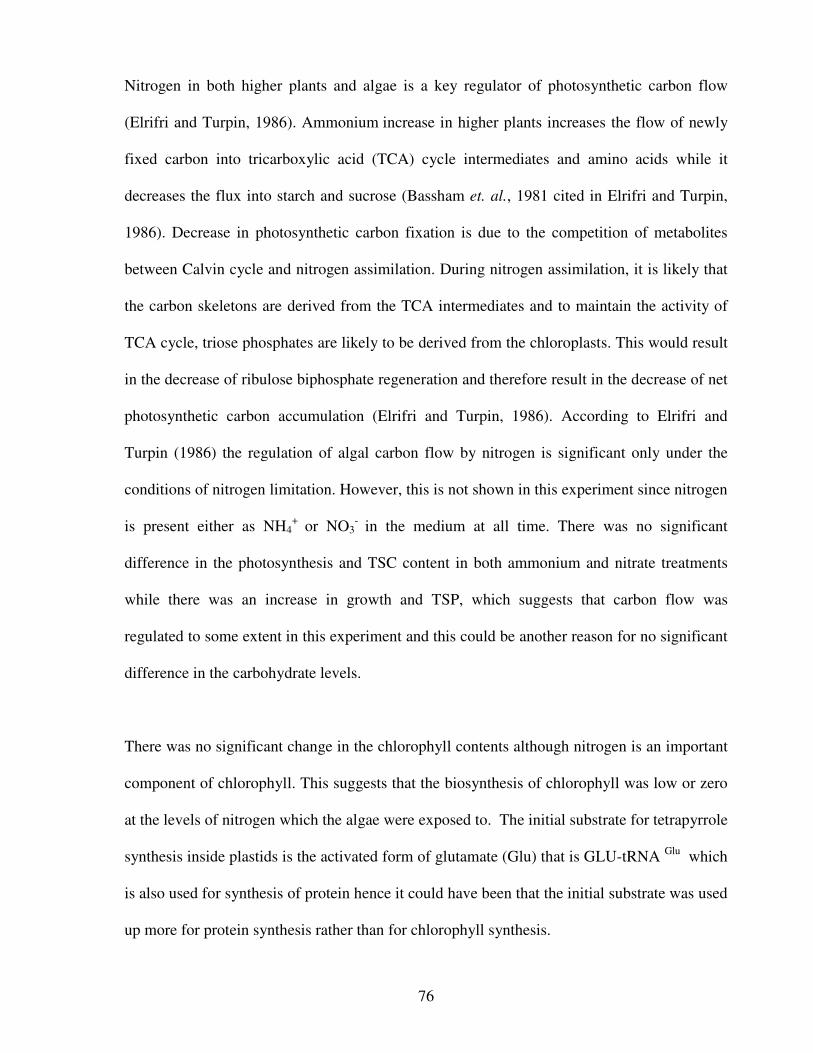
76
Nitrogen in both higher plants and algae is a key regulator of photosynthetic carbon flow
(Elrifri and Turpin, 1986). Ammonium increase in higher plants increases the flow of newly
fixed carbon into tricarboxylic acid (TCA) cycle intermediates and amino acids while it
decreases the flux into starch and sucrose (Bassham et. al., 1981 cited in Elrifri and Turpin,
1986). Decrease in photosynthetic carbon fixation is due to the competition of metabolites
between Calvin cycle and nitrogen assimilation. During nitrogen assimilation, it is likely that
the carbon skeletons are derived from the TCA intermediates and to maintain the activity of
TCA cycle, triose phosphates are likely to be derived from the chloroplasts. This would result
in the decrease of ribulose biphosphate regeneration and therefore result in the decrease of net
photosynthetic carbon accumulation (Elrifri and Turpin, 1986). According to Elrifri and
Turpin (1986) the regulation of algal carbon flow by nitrogen is significant only under the
conditions of nitrogen limitation. However, this is not shown in this experiment since nitrogen
is present either as NH4+ or NO3
- in the medium at all time. There was no significant
difference in the photosynthesis and TSC content in both ammonium and nitrate treatments
while there was an increase in growth and TSP, which suggests that carbon flow was
regulated to some extent in this experiment and this could be another reason for no significant
difference in the carbohydrate levels.
There was no significant change in the chlorophyll contents although nitrogen is an important
component of chlorophyll. This suggests that the biosynthesis of chlorophyll was low or zero
at the levels of nitrogen which the algae were exposed to. The initial substrate for tetrapyrrole
synthesis inside plastids is the activated form of glutamate (Glu) that is GLU-tRNA Glu which
is also used for synthesis of protein hence it could have been that the initial substrate was used
up more for protein synthesis rather than for chlorophyll synthesis.

77
No obvious change in the results obtained for both the treatments could be due to another
reason that, algae efficiently store large amounts of nutrients and use them for growth when
nutrient supplies are low. This was demonstrated by (Kamer et. al., 2002), they observed
significant growth in E. intestinalis and Ulva expansa regardless of the amount and frequency
of nutrient addition. This was highly likely since the algal samples were obtained from the site
where the ammonia and nitrate levels in water were much higher than the levels used in the
experiment.
Overall it can be said that the experiment does not distinctly show the effects of ammonia and
nitrate concentrations on photosynthesis and biochemical composition with minus or plus
either one (ammonium or nitrate) in the medium since one is present to cover up for the other.
In general the experiment does show that an increase in nitrogen level in either form increases
the growth, photosynthesis and biochemical compositions.

78
CHAPTER 6
EFFECTS OF THE HERBICIDE, DIURON 80, ON Enteromorpha flexuosa
AND Enteromorpha intestinalis:
RESULTS AND DISCUSSION
6.1 Results
6.1.1 Growth
The patterns of growth of algae at different Diuron 80 levels (Fig. 6.1) were quite distinct.
There was a significant decrease in the growth rate of algae with an increase in the Diuron 80
concentration in the medium (p < 0.0001 i.e. p < 0.05). The highest growth rate was observed
for algae that were grown in the medium containing no Diuron 80 (control), where the growth
rate increased rapidly till the last day. Growth rate also increased for algae grown in the
medium with minimum Diuron 80 level (0.0001 mg/l), but the increase was not as rapid as in
the control. At Diuron 80 level 0.001 mg/l there was a little increase in the growth rate (about
0.01- 0.04 g/ day) in the first 5 days, after which it gradually decreased. For algae at 0.01
mg/l, the growth rate decreased rapidly to zero after very little increase for the first 5 days.
The germlings with Diuron 80 appeared to lose colour towards the last day. Germlings at 0.1
mg/l and 1 mg/l Diuron 80 level showed no grow further growth and appeared completely
bleached on the 2nd day. There was a significant difference (p < 0.01 i.e. p < 0.05) between
the growth rates at different Diuron concentrations from the 15th day onwards.
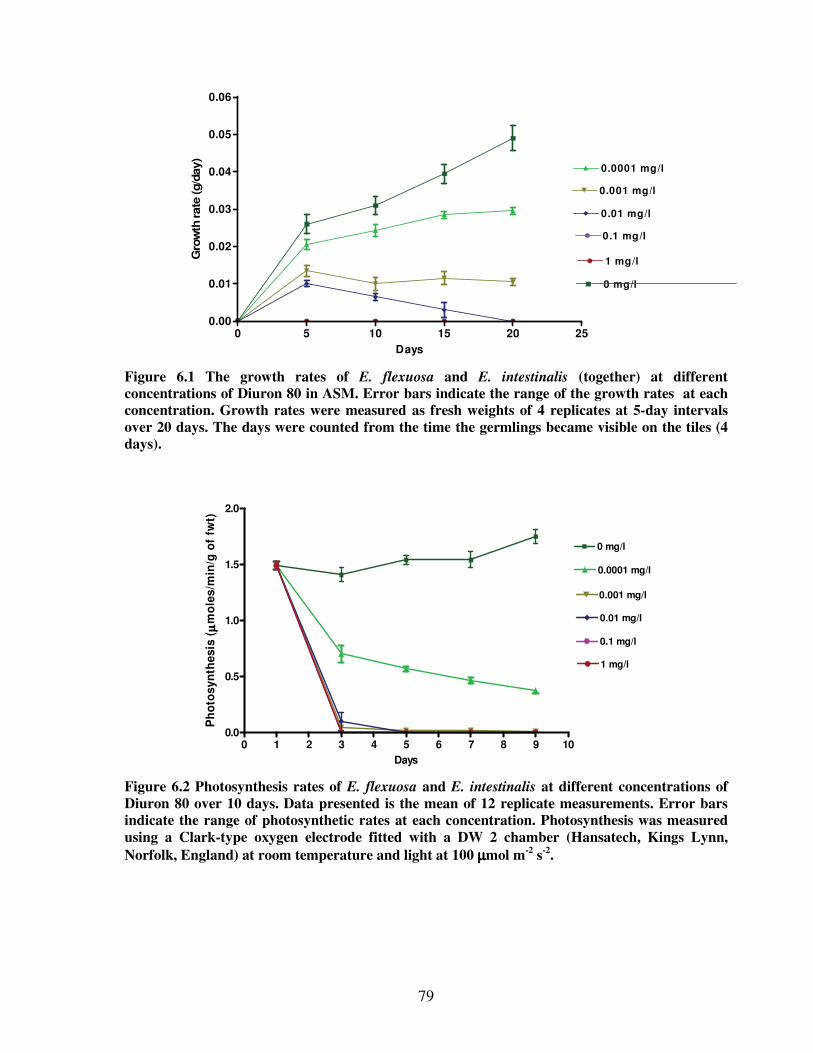
79
0 5 10 15 20 250.00
0.01
0.02
0.03
0.04
0.05
0.06
0.0001 mg/l
0.001 mg/l
0.01 mg/l
0.1 mg/l
1 mg/l
0 mg/l
Days
Gro
wth
rat
e (g
/day
)
Figure 6.1 The growth rates of E. flexuosa and E. intestinalis (together) at different concentrations of Diuron 80 in ASM. Error bars indicate the range of the growth rates at each concentration. Growth rates were measured as fresh weights of 4 replicates at 5-day intervals over 20 days. The days were counted from the time the germlings became visible on the tiles (4 days).
0 1 2 3 4 5 6 7 8 9 100.0
0.5
1.0
1.5
2.0
0 mg/l
0.0001 mg/l
0.001 mg/l
0.01 mg/l
0.1 mg/l
1 mg/l
Days
Ph
oto
syn
thes
is (
μμ μμm
ole
s/m
in/g
of
fwt)
Figure 6.2 Photosynthesis rates of E. flexuosa and E. intestinalis at different concentrations of Diuron 80 over 10 days. Data presented is the mean of 12 replicate measurements. Error bars indicate the range of photosynthetic rates at each concentration. Photosynthesis was measured using a Clark-type oxygen electrode fitted with a DW 2 chamber (Hansatech, Kings Lynn, Norfolk, England) at room temperature and light at 100 μμμμmol m-2 s-2.

80
6.1.2 Photosynthesis
The photosynthesis rates (Fig 6.2), like growth rates were inversely proportional to the Diuron
80 levels in the medium and decreased with an increase in the Diuron 80 levels (p < 0.0001 ie.
P < 0.05). The photosynthesis rate was the highest in algae that were not exposed to any
Diuron 80 in the medium (control) and showed a gradual increase until the last day. For algae
at minimum Diuron 80 level (0.0001 mg/l), there was a rapid decrease in the photosynthesis
rate within the first 2 days, after which the decrease became gradual. A rapid decrease in
photosynthesis rate was also observed for algae at 0.001 mg/l and 0.01 mg/l until the 5th day,
after which photosynthesis ceased. There was no photosynthesis observed for algae at 0.1
mg/l and 1mg/l as the rate of photosynthesis decreased sharply to zero within the first 2 days.
6.1.3 Chlorophyll content
Total chlorophyll content (Fig 6.3) decreased with increasing Diuron 80 levels (p < 0.0001 i.e.
p < 0.05). Total chlorophyll was highest in algae at 0.0001 mg/l Diuron 80 which was similar
to that of control (p > 0.05). Algae at concentrations (0.001 mg/l – 1 mg/l) had significantly
lower chlorophyll concentration than algae at 0.0001 mg/l and the control concentration.
However there was no significant difference (p > 0.05) between the lower chlorophyll
concentrations obtained at these (0.001 mg/l – 1 mg/l) concentrations.

81
0 0.0001 0.001 0.01 0.1 10
102030405060708090
100110120130140
Diuron leve ls in the medium (mg/l)
Tot
al C
hlo
roph
yll
(μμ μμg
/ml/g
fw
t)
Figure 6.3 The total chlorophyll content in E. flexuosa and E. intestinalis at different concentrations of Diuron 80 in ASM. Data presented is the mean of 4 replicates. Error bars indicate the range of total chlorophyll at each concentration. Total chlorophyll was measured using Spectrophotometry after extraction with acetone on the 10th day immediately after photosynthesis measurements were completed.
0 0.0001 0.001 0.01 0.1 1 0
1
2
3
4
5
6
Diuron level in medium (mg/l)
Tota
l Sol
uble
Pro
tein
(mg
/g fw
t)
Figure 6.4 The total soluble protein (TSP) content in E.flexuosa and E.intestinalis after the treatment at different concentrations of Diuron 80 in ASM. Data presented is the mean of 4 replicates. Error bars represent the range of TSP at each concentration. The protein content was measured after 10 days of treatment using the Bradford method (see Bradford, 1976).

82
6.1.4 Total soluble protein
The highest total soluble protein content (5.75 mg/g fwt) was measured in the control setup
with no Diuron 80 (Fig 6.4). The TSP content decreased significantly with increasing levels
of Diuron 80 (p < 0.0001 i.e p < 0.05). Algae at 0.0001 mg/l had about 4.5 mg/ g fwt TSP that
was less than the control but more than the content in algae exposed to higher Diuron 80
levels. There was no significant difference between TSP at 0.0001 mg/l and 0 mg/l. Algae at
0.001 mg/l and 0.01 mg/l Diuron 80 had similar TSP content (3.2 – 3.4 mg/g fwt) while TSP
algae at 0.1 mg/l and 1 mg/l Diuron 80 had slightly lower TSP with algae at 1 mg/l having the
lowest TSP of 2.4 mg/g fwt. However there was no significant difference in TSP in algae
from 0.001 mg/l – 1 mg/l (p > 0.05).
6.1.5 Total soluble carbohydrates The total soluble carbohydrate (Fig 6.5) decreased with increasing Diuron 80 levels (p <
0.0001 i.e p < 0.05) in the medium similar to the pattern seen in TSP. The highest TSC (3.9
mg/ g fwt) was measured in algae in the control setup with no Diuron 80 followed by algae at
minimum Diuron 80 level (0.0001 mg/l) that had 3.2 mg/g fwt. Algae at 0.001 mg/l, 0.01mg/l
and 0.1 mg/l had significantly lower TSC than the algae at control and 0.0001 mg/l. Algae at
1 mg/l Diuron 80 level had the lowest TSC content of 2 mg/g fwt. There was no significant
difference (p > 0.05) between TSC content in algae from 0 – 0.001 mg/l.
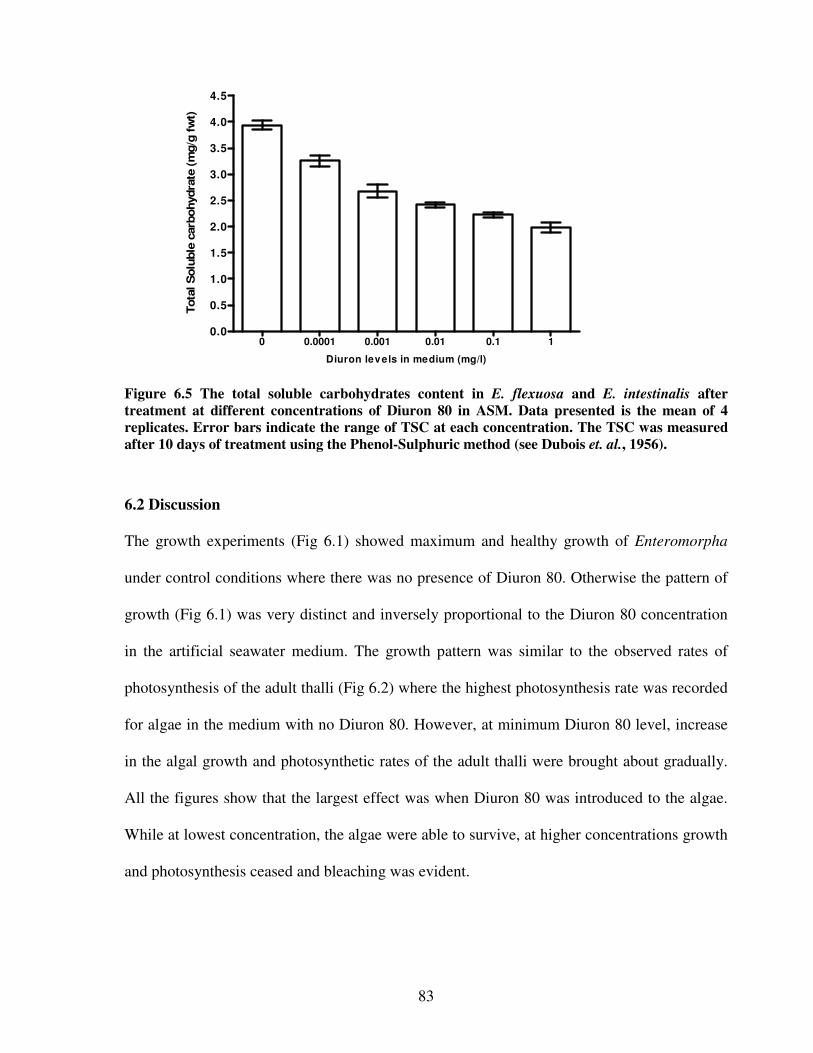
83
0 0.0001 0.001 0.01 0.1 10.0
0.5
1.0
1.5
2.0
2.5
3.0
3.5
4.0
4.5
Diuron levels in medium (mg/l)
Tot
al S
olu
ble
car
bohyd
rate
(m
g/g
fw
t)
Figure 6.5 The total soluble carbohydrates content in E. flexuosa and E. intestinalis after treatment at different concentrations of Diuron 80 in ASM. Data presented is the mean of 4 replicates. Error bars indicate the range of TSC at each concentration. The TSC was measured after 10 days of treatment using the Phenol-Sulphuric method (see Dubois et. al., 1956).
6.2 Discussion
The growth experiments (Fig 6.1) showed maximum and healthy growth of Enteromorpha
under control conditions where there was no presence of Diuron 80. Otherwise the pattern of
growth (Fig 6.1) was very distinct and inversely proportional to the Diuron 80 concentration
in the artificial seawater medium. The growth pattern was similar to the observed rates of
photosynthesis of the adult thalli (Fig 6.2) where the highest photosynthesis rate was recorded
for algae in the medium with no Diuron 80. However, at minimum Diuron 80 level, increase
in the algal growth and photosynthetic rates of the adult thalli were brought about gradually.
All the figures show that the largest effect was when Diuron 80 was introduced to the algae.
While at lowest concentration, the algae were able to survive, at higher concentrations growth
and photosynthesis ceased and bleaching was evident.

84
Diuron 80 is a broad spectrum herbicide used for controlling broadleaf and grass weeds in
many crops. Diuron 80 is chemically named N-(3,4-dichlorophenyl)-N, N-dimethylurea
(C6H10Cl2N2O) (Monacada, 2004). Diuron 80 is usually used for control of pre-emergent and
post-emergent control of both broadleaf and annual grassy weeds. It is widely used in
agriculture on wide variety of crops. In addition, it is widely used for vegetation control in
non-agricultural applications, specially industrial and way side uses which include fence lines,
pipelines, powerlines, railway lines, roads, foothpaths, in timber yards and storage areas,
around commercial, industrial and farm buildings, electrical substations and petroleum
storage tanks (Moncada, 2004). The possibility of ‘offsite’ movement of herbicides is quite
high especially in areas where there is frequent and high rainfall. Usually this ‘offsite’
movements end up contaminating the flanking aquatic environments.
Powell et. al. (1996) studied off-site movement of Diuron 80 in surface water from a highway
wayside application and found that the concentrations of Diuron 80 in runoff (water and
sediment combined) were as high as 1770 ug/ l after one day of herbicide application.
Typical reporting limits for the Diuron 80 analyses in California Department of Pesticide
Regulation’s surface water database are 0.05- 0.1 ug/ l and out of the concentrations detected
in the range of 0.01 –30.6 ug/ l, majority of concentrations range from 0.1 – 1 ug/ l
(Monacada, 2006).
In plants, Diuron 80 is easily taken up from the soil via the root system and xylem. It is taken
less rapidly through the leaves and stem, translocation from roots to shoots through xylem is
rapid, and translocation via phloem is very little to nil (Hess and Warren, 2002 cited in
Monacada, 2006). Diuron 80 primarily functions by inhabiting the Calvin cycle in

85
photosynthesis. It also limits the production of high energy compounds like adenosine
triphosphate (ATP) that is used for various metabolic processes.
Ferrell et. al. (2004) showed that Diuron 80 allowed normal seed germination when used on
pre-emergent weeds but causes chlorophyll loss which inhibited photosynthesis and the plants
died of starvation. Loss of chlorophyll occurred in algae which had Diuron 80 concentration
0.001 mg/l, 0.01 mg/l, 0.1 mg/l and 1 mg/l, with 0.1 mg/l and 1 mg/l having the greatest
amount of bleached thalli on the 10th day of treatment and chlorophyll content measured was
low (Fig 7.4). Destruction and loss of chlorophyll is the primary symptom of Diuron 80
phytoxicity (Ridley, 1977). Chlorosis is due to the inability of chlorophyll to dissipate its
absorbed light energy which leads to irreversible photo-destruction (Heath and Packer, 1968
cited in Ridley, 1977). This photo-destruction is brought about by the breakdown or
overloading of the mechanism that usually protects the chloroplasts from excessive
illumination. The total chlorophyll content (Fig. 6.3) however was slightly lower in the
control setup (with no Diuron 80) than algae at minimum Diuron 80 (0.0001 mg/l). Lower
pigment content resulted due to sporulation and the release of zoospores from the cells. No
sporulation was observed for algae with Diuron 80 treatments although the cells appeared
bleached.
Inhibition of photosynthesis by Diuron 80 involves the blockage of electron transport from
QA to QB (electron acceptor molecules in the electron transport chain) (Barr and Crane,
2005; Salisbury and Ross, 1992). Diuron 80 binds to the secondary electron acceptor QB-
binding niche on D1 protein of the PS II complex in the thylakoid membranes. This causes a
decrease in the oxidation reduction potential of QB with respect to the primary electron
86
acceptor QA hence it becomes hard for QA to reduce QB (Allen et. al., 1983). Studies on
inhibition of photosynthesis electron transport by Diuron 80 using a cyanobacterium,
Aphanocapsa 6714, showed that Diuron 80 acted at the same step of the electron transport in
cyanobacteria and higher plants (Astier et. al., 1981) hence it can be said that Diuron 80 acts
on the same step in Enteromorpha as well. The inhibition of electron transport further puts a
stop to the CO2 fixation and the production of ATP hence inhibiting photosynthesis hence
reducing the carbohydrate content. The total soluble carbohydrate content in Enteromorpha
(Fig 6.5) at different Diuron 80 concerntration is analogous to the amount of photosynthesis at
different Diuron 80 levels and the TSC is significantly lower even at the minimum Diuron 80
concentration.
The total soluble protein content as well is significantly lower in the algae that had Diuron 80
in the medium (Fig 6.4). The low protein content can be accounted on the basis of the electron
transport blockage. The inability to reoxidize QA advances formation of triplet state
chlorophyll which interacts with oxygen in a ground state to form singlet oxygen. Both triplet
chlorophyll and singlet oxygen are capable of extracting hydrogen molecules from
unsaturated lipids which produces a lipid radical and initiates a chain reaction of lipid
peroxidation. Hence lipids and proteins are attacked during the electron transport blockage
and oxidized resulting in chlorophyll and carotenoids loss together with leaky membranes
which causes cells and cell organelles to dry out and disintegrate rapidly (Hess and Warren,
2002 cited in Monacada, 2006).

87
Overall, it can be said that the effect of Diuron 80 on Enteromoprha is drastic even at
minimum concentration. It primarily affects photosynthesis, which in turn inhibits the overall
growth of the algae.
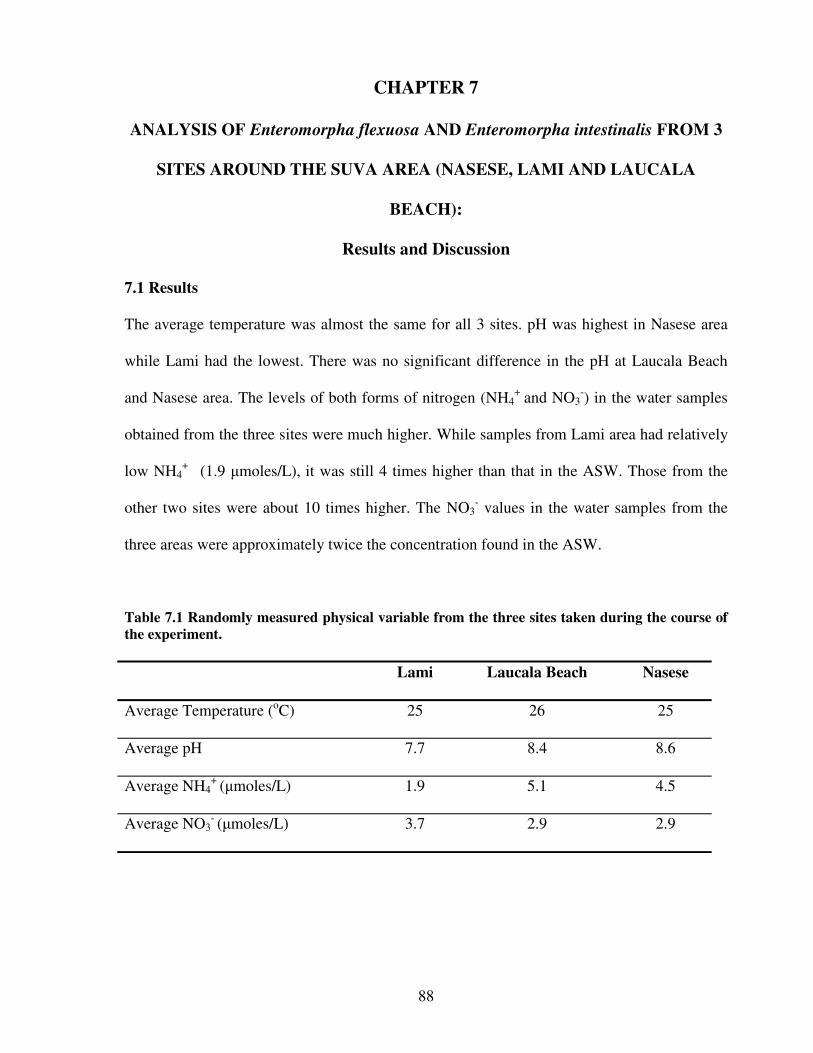
88
CHAPTER 7
ANALYSIS OF Enteromorpha flexuosa AND Enteromorpha intestinalis FROM 3
SITES AROUND THE SUVA AREA (NASESE, LAMI AND LAUCALA
BEACH):
Results and Discussion
7.1 Results
The average temperature was almost the same for all 3 sites. pH was highest in Nasese area
while Lami had the lowest. There was no significant difference in the pH at Laucala Beach
and Nasese area. The levels of both forms of nitrogen (NH4+ and NO3
-) in the water samples
obtained from the three sites were much higher. While samples from Lami area had relatively
low NH4+ (1.9 �moles/L), it was still 4 times higher than that in the ASW. Those from the
other two sites were about 10 times higher. The NO3- values in the water samples from the
three areas were approximately twice the concentration found in the ASW.
Table 7.1 Randomly measured physical variable from the three sites taken during the course of the experiment. Lami Laucala Beach Nasese
Average Temperature (oC) 25 26 25
Average pH 7.7 8.4 8.6
Average NH4+ (�moles/L) 1.9 5.1 4.5
Average NO3- (�moles/L) 3.7 2.9 2.9

89
7.1.1 Photosynthesis
Highest rates of photosynthesis (Fig 7.1) in E. intestinalis and E. flexuosa were observed in
algae from the Laucala Beach area, the observed rates are significantly higher (p < 0.0001 i.e.
p < 0.05) than the rates in Nasese or Lami area. The average recorded photosynthetic rates for
all the samples were in the range of 1.05 – 1.3 �moles/ min/ g of fwt. Algae in the Lami area
had slightly lower photosynthetic rates than the algae at Nasese but the difference was not
significant (p > 0.05). In two out of the five analyses done, algae at Nasese and Lami had
similar rates. Overall, photosynthetic rates of algae from Lami and Nasese were similar, while
that from Laucala Beach was much higher, although showed fluctuations in this high range.
0 1 2 3 4 5 60.600.650.700.750.800.850.900.951.001.051.101.151.201.251.301.351.401.45
Nasese
Lami
Laucala Beach
Numbe r of analysis done
Pho
tosy
nthe
sis
rate
(μμ μμm
oles
/min
/g fw
t)
Figure 7.1 The photosynthesis rates of E. flexuosa and E. intestinalis (together) from Nasese, Lami and Laucala Beach area measured randomly over a 12 months. Data presented is the mean of 8 replicates. Error bars indicate the range of photosynthetic rate for each site. The samples were taken whenever the algae were available at all 3 sites. Photosynthesis was measured using a Clark-type oxygen electrode fitted with a DW 2 chamber (Hansatech, Kings Lynn, Norfolk, England) at room temperature and light at 100 μμμμmol m-2 s-2.

90
7.1.2 Chlorophyll content
The algae from Laucala Beach recorded the highest level of chlorophyll in all five analyses
with some fluctuations. The total chlorophyll content is significantly higher (p < 0.01 i.e. p <
0.05) than in the Nasese and Lami areas. Algae from Nasese and Lami had the average
chlorophyll in the range of 115 – 140 �g/ ml/ g fwt which was lower than that in algae from
Laucala Beach. There was no significant difference between the total chlorophyll recorded in
Lami and Nasese area (p > 0.05).
1 2 3 4 50
102030405060708090
100110120130140150160
Nasese
Lami
Laucala Beach
Number of analysis done
Tota
l chl
orop
hyll
(μμ μμg
/ml/g
fw
t)
Figure 7.2 The concentrations of total chlorophyll in E. flexuosa and E. intestinalis from Nasese, Lami and Laucala Beach area measured randomly over a 12 month period. Data presented is the mean of 4 replicates. Error bars indicate the range of total chlorophyll at each site. The samples were taken randomly whenever the algae were available at all 3 sites. Total chlorophyll was measured using spectrophotometry after extraction with acetone on the 10th day immediately after photosynthesis measurements were completed.
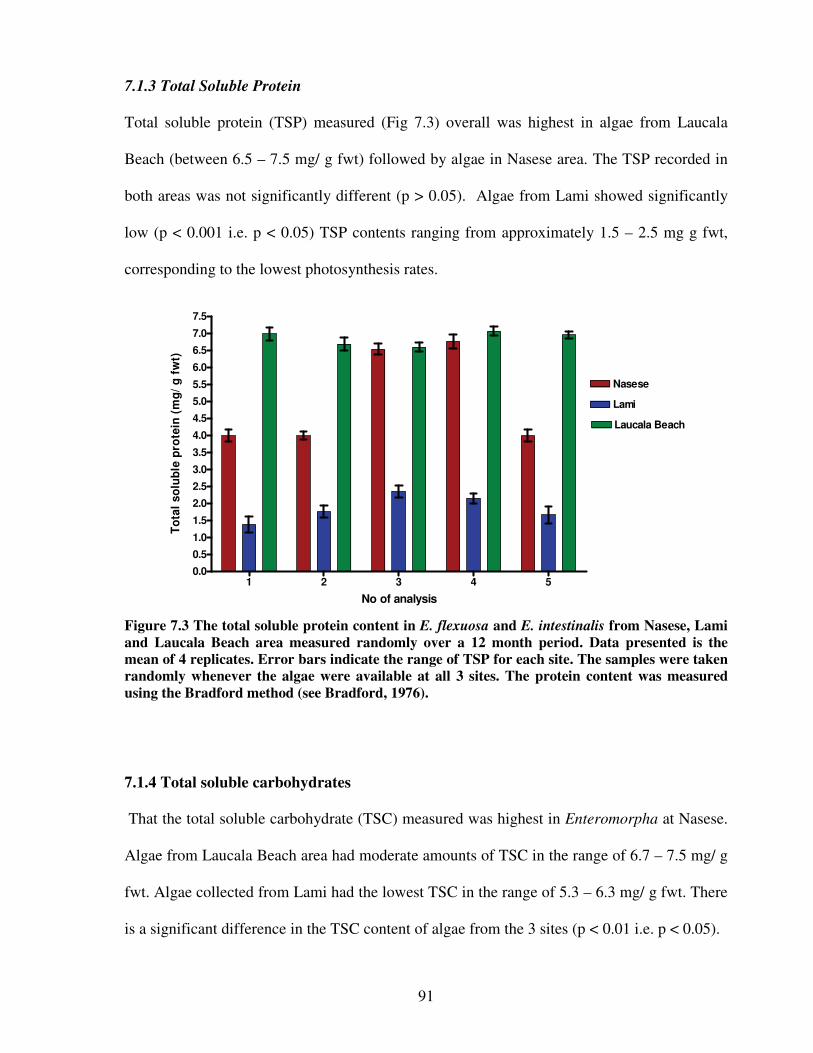
91
7.1.3 Total Soluble Protein
Total soluble protein (TSP) measured (Fig 7.3) overall was highest in algae from Laucala
Beach (between 6.5 – 7.5 mg/ g fwt) followed by algae in Nasese area. The TSP recorded in
both areas was not significantly different (p > 0.05). Algae from Lami showed significantly
low (p < 0.001 i.e. p < 0.05) TSP contents ranging from approximately 1.5 – 2.5 mg g fwt,
corresponding to the lowest photosynthesis rates.
1 2 3 4 50.0
0.5
1.0
1.5
2.0
2.5
3.0
3.5
4.0
4.5
5.0
5.5
6.0
6.5
7.0
7.5
Nasese
Lami
Laucala Beach
No of analysis
To
tal
solu
ble
pro
tein
(m
g/
g f
wt)
Figure 7.3 The total soluble protein content in E. flexuosa and E. intestinalis from Nasese, Lami and Laucala Beach area measured randomly over a 12 month period. Data presented is the mean of 4 replicates. Error bars indicate the range of TSP for each site. The samples were taken randomly whenever the algae were available at all 3 sites. The protein content was measured using the Bradford method (see Bradford, 1976).
7.1.4 Total soluble carbohydrates
That the total soluble carbohydrate (TSC) measured was highest in Enteromorpha at Nasese.
Algae from Laucala Beach area had moderate amounts of TSC in the range of 6.7 – 7.5 mg/ g
fwt. Algae collected from Lami had the lowest TSC in the range of 5.3 – 6.3 mg/ g fwt. There
is a significant difference in the TSC content of algae from the 3 sites (p < 0.01 i.e. p < 0.05).

92
1 2 3 4 50
1
2
3
4
5
6
7
8
9
10
NaseseLamiLaucala Beach
Number of analysis
Tota
l sol
uble
car
bohy
drat
es (m
g/ g
fw
t)
Figure 7.4 The total soluble carbohydrate content in E. flexuosa and E. intestinalis from Nasese , Lami and Laucala Beach area measured randomly over a 12 month period. Data presented is the mean of 4 replicates. Error bars indicate the range of TSC obtained for each site. The samples were taken whenever the algae were available at all 3 sites. The TSC was measured using the Phenol-Sulphuric method (see Dubois et. al., 1956).
7.2 Discussion
The results show that there is significant difference in the recorded photosynthesis rate (p <
0.0001), total chlorophyll content (p < 0.0001), TSP content (p < 0.0001) and TSC content (p
< 0.0001). p < 0.05 in all the cases. The results show optimum growth of Enteromorpha in the
Laucala Beach area. This is evident from the measured high photosynthesis (Fig 7.1), high
chlorophyll (Fig 7.2) and high total soluble protein content (TSP) (Fig 7.3). Algae from
Nasese area had moderate photosynthetic rate, chlorophyll and TSP but the highest levels of
total soluble carbohydrates (TSC) (Fig 7.4) while algae from Lami area had low
photosynthetic rate, total chlorophyll, TSP and TSC contents.

93
The credit of most favourable growth of Enteromorpha in Laucala Beach area could be given
to the high nutrient (nitrogen) content (in the form of NH4+) in the area since it is situated near
the sewage treatment plant. The high nitrogen content is reflected in the high TSP of algae
from this area. High TSP content (Fig 7.3) results in biomass accumulation as well as an
increase in proteins that takes part in photosynthesis hence increasing photosynthetic activity
(Fig 7.1). However in two of the analysis, algae from Nasese have similar TSP (high content)
as the algae from Laucala Beach. This is because nutrient content could be high at Nasese as
well since it does have drainage outfalls that open up in its intertidal area. On an average,
water from the Nasese area had less NH4+ than the Laucala Beach water, although NO3
-
contents were the same.
The carbohydrate content however was highest in algae from the Nasese area, which indicates
a more healthy growth than Laucala Beach and Lami. Though photosynthesis and TSP and
chlorophyll were high at Laucala Beach, the carbohydrate content was lower than the Nasese
area. This could be because of increased transfer of photosynthetically incorporated carbon to
synthesis of amino acid skeletons at the expense of sucrose synthesis, which results during
nitrate reduction and ammonia incorporation (Platt, 1977; Elrifi and Turpin, 1986). Nitrogen
plays an important role in the photosynthetic carbon flow in both higher plants and algae
(Elrifi and Turpin, 1986). However the nutrient levels can fluctuate on short time scales,
hence it is difficult to relate the physiological changes found during the experiment in terms
of nitrogen availability. Enteromorpha usually grows where there is high nitrogen level in the
water.

94
A fluctuation in nutrient content at Laucala Beach was evident as Enteromorpha did not occur
continuously over the period of research; it cropped up, flourished a few times while the site
did not have any algae at other times. Similar patterns were observed at Nasese. The site at
Lami remained bare (without Enteromorpha growth) for a longer period of time.
Algae from Lami area according to the results obtained were the unhealthiest with low
photosynthesis, TSP and TSC. The chlorophyll content however was similar to algae in
Laucala Beach and Nasese. This is obvious as the algal growth observed in the area was very
little and whatever growth occurred was after very longer interval compared to the other two
sites. Lami area also had lower nitrogen content than the other two sites which could be a
factor contributing to low growth. However growth of germlings in ASW (Chapter 5, Fig 5.1)
around that concentration showed considerably increased growth. Hence it can be said that
apart from that the algae here could be affected due to pollution which includes, thermal
pollution, industrial and factory effluents, heavy metals, antifouling compounds and oil
pollution. Thermal pollution that could have resulted from factory effluents and from heating
up of metal scraps lying in the area, posed temperature related stress (chapter 4) that could
have resulted in low growth of algae in the area. However, there was no significant difference
in the temperature in all 3 sites; hence temperature could not definitely be the factor affecting
the growth. Industrial chemicals such as Polychlorinated biphenyls (PCBs) are toxic to
aquatic organism (Lobban and Harrison, 1994). The PCBs can inhibit photosynthesis at a site
on the electron transport chain, close to PS II (Sinclair et. al., 1977). Furthermore, antifouling
compound such as triphenyltin (TPT) and tributyltin (TBT) that are used as antifouling
compositions on boat hulls could be posing an effect on Enteromoprha in the area.
Antifouling compounds are highly effective against Enteromorpha species as the

95
photosynthetic apparatus of zoospores and the vegetative tissues of Enteromorpha are very
sensitive to it (Lobban and Harrison, 1994). Antifouling compounds from the Suva harbour
area provide a good reason for low growth of Enteromorpha in the Lami area. Enteromorpha
and Ulva are usually the target species for antifouling compositions; it does however affect
the other non-target organisms including fish and oysters but at low levels. This can be a
matter of concern as people residing in the area consume organisms such as fish and oysters.
Similarly, oil pollution from the harbour area could be another reason for low algal growth.
Petroleum or crude oil consists of a mixture of hydrocarbons and some additional compounds
containing O, S and N and metals such as Ni, V, Fe and Cu (Preston, 1988). Algae are
affected by oil pollution in two ways: one associated with the coating of the organism which
reduces CO2 diffusion and light penetration, secondly due to the uptake of hydrocarbons
which leads to disruption of cell metabolism (Lobban and Harrison, 1994). Enteromorpha
could have been affected by oil pollution to some extent possibly due the uptake of whatever
hydrocarbons were present in the water. Heavy metals in addition are one of the major
sources of pollution in the Lami area. Enteromorpha can bioaccumulate heavy metals
(Tabudravu, 1998). The order of metal toxicity in algae are Hg > Cu > Cd > Ag > Pb > Zn,
but it varies with algal species and environmental conditions (Rai et. al., 1981). The toxic
effects generally include growth cessation in extreme cases, inhibition of photosynthesis,
reduction of chlorophyll content, increased cell permeability and disruption of enzyme
activity (Lobban and Harrison, 1994). Presence of Cu in the area could be possibly resulting
from the antifouling agents as well, which inhibits reproduction and growth of Enteromorpha.
When looking at the possible means of pollution in all the 3 sites, Lami area appears to be the
most polluted in terms of other pollutants. It does have the highest NO3- levels compared to

96
the other 2 sites but much lower NH4+. Enteromorpha in this area complements the results
obtained as its photosynthesis, TSP and TSC were lower than the other two sites. In addition
the growth of algae was very low throughout the duration of the experiment and the algae did
not appear healthy when compared to the other two sites. During two visits to Lami, most of
the existing algae appeared bleached (whole frond bleaching). Bleaching and loss of colour
was also observed in Nasese but loss of colour here could be accounted by the sporulation
process, as only part of the thalli picked appeared bleached while part of it remained green
and healthy.
Nasese area had significant amount of pollution via small amount of sewage discharge and
runoffs from the drainage outfalls, soap and detergent contaminated water from the household
drainage. Yet the algae here appeared healthy and were in larger growth forms. Significant
growth in Nasese can be related to the increase in alkalinity, which probably resulted from the
household drainage. The pH experiments (chapter 4) illustrated that Enteromorpha growth
was highest at pH 9. In addition it had high nutrient supply in the form of NH4+ from the
drainage outfall.
In Laucala Beach the presence and flourishing of Enteromorpha can be attributed to the high
nitrogen content especially in the form of NH4+ resulting from sewage discharge from the
near by sewage treatment plant (Table 7.1). The effects of nutrients in the area seemed to
mask of the effects of other pollutants in the area.
Overall, it can be said that the algae in these three different sites are affected to some extent
by their environment and the pollution within their environment. The most striking

97
observation is that the high levels of NH4+ influenced algal growth and photosynthesis,
perhaps masking the effects of other pollutants in Laucala Beach and Nasese, while in Lami
in the presence of relatively low levels of NH4+, other pollutants appeared to have an adverse
effect on the growth of these algae.

98
CHAPTER 8
SIGNIFICANCE OF THE RESEARCH, CONCLUSIONS AND
RECOMMENDATIONS.
8.1 Research significance and conclusions.
Overall, the results obtained from the research are consistent with the hypothesis that
Enteromorpha flexuosa and Enteromorpha intestinalis are affected by the variations in their
abiotic environment that pose stressful conditions. From the obtained growth rate in germlings
and photosynthesis rate, total soluble protein, and total soluble carbohydrates and chlorophyll
content whilst exposure of Enteromorpha to variations in pH, temperature, nitrogen (nitrate
and ammonium) and herbicide in seawater, it was apparent that while some stresses
(temperature and herbicide) had an adverse effect on algal growth, high alkalinity and high
nitrogen levels promoted the growth of algae.
From the pH experiment (chapter 3), it was evident that Enteromorpha preferred higher pH
for growth and its optimal metabolic activities and growth and metabolic activities were low
at unfavourable pH. The optimum pH was in the range 8 – 9. The optimum temperature for
Enteromorpha was between 20 – 25oC. There was significant decrease in growth and
photosynthesis in both the experiments where the range was unfavorable. When looking at
herbicide experiments (chapter 6), minimal growth and an apparent decrease in
photosynthesis together with chlorophyll, TSP and TSC were obtained even with the
minimum level of exposure. Nitrogen experiments (chapter 5) however did not portray clear
consequences except that increase in nitrogen content in either ammonia (NH4+) or nitrate
(NO3-) form prospers growth and metabolic activity in general. Its effect is more explicit

99
when looking at the TSP content in this case. Growth and photosynthesis both increase
significantly in relation to the level of ammonia and nitrate and are slightly low only in
absence of ammonia and nitrate. The lack of clarity in the response of the algae to the two
forms of nitrogen in chapter 5 is probably because of the low levels of NH4+ and NO3
- used in
the experiment. As it can be seen from chapter 7, NH4+ in Laucala Beach and Nasese were at
least 10 times the control levels in the ASW. The effect of NH4+ in these areas is highly
evident in chapter 7.
Most of the evidence that was obtained from the laboratory experiment is complemented by
Enteromorpha in the natural environment (chapter 7). However, the productivity (the
measured photosynthesis rate, total chlorophyll, TSP and TSC) is lower in samples analysed
from the laboratory experiments (chapter 3, 4, 5 and 6) compared to the samples from the
sites (natural environment) (chapter 7). The observed difference is due to the laboratory
environment conditions being dissimilar from the natural environment hence lower
productivity.
Photosynthesis and TSP, TSC were low in Lami area, which was assumed to be the most
pollution affected area although NH4+ levels were relatively low. In Laucala Beach area
which had high nutrient content particularly nitrogen had high photosynthesis, chlorophyll
and TSP content while in Nasese area, Enteromorpha had moderate photosynthetic rate,
chlorophyll, TSP and TSC content.
The research shows that growth measurements, photosynthetic rates, protein contents and
carbohydrate contents give a clear account of changes in functional physiology brought about

100
by the stress created via changes in the pH, temperature and nutrient content of the habitat that
could result from point source and non-point source pollution. Chlorophyll, on the other hand
does not provide clear evidence of physiological damage as does photosynthesis, TSP and
TSC in stressed and non-stressed algae in the natural environment have similar chlorophyll
levels (chapter 7) unless the pollution is severe as in the case of herbicide contamination in
significant amount (chapter 6) and thermal pollution (chapter 4) which resulted in bleaching.
Enteromorpha collected from Nasese area had lower chlorophyll content when compared to
Lami and Laucala Beach area (chapter 7) but looked the healthiest out of the three sites.
Nasese area was assumed to be the least polluted one and was used as the reference site.
However, NH4+ levels were very high here. Algae from Lami area on the other hand had
similar levels of chlorophyll as algae in Nasese area but appeared the unhealthiest and had
low metabolic activity in terms of photosynthesis, TSP and TSC.
This research illustrates that Enteromorpha can be used as a bioindicator for marine pollution
in Fiji with respect to high nitrogen content (especially for high NH4+ levels). Enteromorpha
presence in any intertidal zone itself indicates high level of nitrogen. It also appears to
indicate high pH levels. Moreover, these algae are adversely affected by unfavourable
temperature and herbicides.
Since Enteromorpha is a opportunist algae, it prefers and is well adapted to grow in coastal
areas where there is pollution (chapter 1, section 2.1). Hence, logically it would exhibit stress
responses when the pollution level is significant to it and beyond its tolerance range, which
for other existing life forms could be very much harmful. It could be more harmful than it is
to Enteromorpha. Since, Enteromorpha is a fast growing alga and responds rapidly to water

101
quality changes, it can efficiently be used to spot and detect polluted environments before
other life forms are vastly affected. Its growth rate can also be effectively used as indicators of
environment health apart from its photosynthetic rates, chlorophyll, TSP and TSC since in the
growth experiment carried out in lab it grew very fast under optimal condition and its growth
rate was slow in unfavorable conditions. Growth rates can be easily monitored by random
sampling of algae in pollution predicted areas. However to use these stress responses, a
reference ‘unpolluted’ site should be chosen to compare the physiological parameters.
9.2 Future work recommendations
• The work done was of very small scale. When done on a much larger scale that is,
with natural light, bigger growth area (outside tanks instead of beakers) and using
more natural substrates such as rocks etc would allow obtaining more prominent and
precise results.
• Work of this approach would give more precise account of stress physiology if
possibly carried out in-situ.
• Detailed aspects of stress physiology could be studied in terms of enzyme activity,
respiration, various metabolic pathways and biochemistry with a similar experimental
approach.
• The same laboratory experiments can be done together with other macro-algae from
the same habitat to compare the responses and pick out the most efficient algae to be
used as bioindicators.
102
REFERENCES
1. Abrahamsson, K., Choo, K. S., Pederson, M., Johannson, G. and Snoejis, P. (2003). Effects of
temperature on the production of hydrogen peroxide and volatile halocarbons by brackish
water algae. Phytochemistry. 64: 725-734.
2. Allen, M. M., Turnburke, A. C., Lagace, E. A. and Steinback, K. E. (1983). Effects of
photosystem II herbicides on the photosynthetic membrane of the cynobacterium
Aphanocapsa 6308. Plant Physiology. 71: 388-392.
3. Amsler, C.D. and Searles, R. B. (1980). Vertical distribution of seaweed spores in a water
column offshore of North Carolina. Journal of Phycology. 16: 617-619.
4. Anonymous (2001). Algae: Invasive Native -Enteromorpha flexuosa (Wulfen). Unpublished
report. Botany, University of Hawaii, Manoa. Available from:
http://www.hawaii.edu/reef/invasive_algae/chloro/Enteromorpha_flexuosa.htm
5. Astier C., Vernotte, C., DerVartanian, M. and Joset-Espardllier, F. (1979). Isolation and
characterization of DCMU-resistant mutants of the blur-green alga Aphanocapsa 6714. Plant
Cell Physiology. 20: 1-5.
6. Axelsson, L., Larsson, C. and Ryberg, H. (1999). Affinity, capacity and sensivity of oxygen of
two different mechanisms for bicarbonate utilization in Ulva lactuca. Plant, Cell and
Environment. 22: 969-978.
7. Axelsson, L., Ryberg, H. and Beer, S. (1995). Two modes of bicarbonate utilization in the
marine green macroalga Ulva lactuca. Plant, Cell and Environment. 18: 439-445.
8. Back, S., Lehvo, A. and Blomster, J. (2000). Mass occurrence of unattached Enteromorpha
intestinalis on Finnish Baltic Sea coast. Annales Botanica Fennici. 37: 155-161.
9. Barr, R. and Crane, F. L. (2005). Inhibition or inactivation of higher-plant chloroplast electron
transport. In Pessarakli, M (ed.), Handbook of Photosynthesis. New York, Taylor and Francis
Group, pp: 149-166.

103
10. Bassham, J. A., Larsen, P.O., Lawyer, A.L. and Cornwell, K.L. (1981). Relationships between
nitrogen metabolism and photosynthesis. In Bewley, J (ed), Nitrogen and Carbon Metabolism.
Junk, London, pp 135-163.
11. Beach, K. S., Smith, C. M., Michael, T. and Shin, H. (1995). Photosynthesis in reproductive
unicells of Ulva fasciata and Enteromorpha flexuosa: implications for ecological success.
Marine Ecology Progress Series. 125: 229-237.
12. Beer, S. and Shragge, B. (1987). Photosynthetic carbon metabolism in Enteromorpha
compressa (Chlorophyta). Journal of Phycology. 23: 580-584.
13. Berry, J. and Bjorkmann, O. (1980). Photosynthetic response and adaptation to temperature in
higher plant. Annual Review of Plant Physiology. 31: 491-543.
14. Bidwell, R. G. S. and Mclachlan, J. (1985). Carbon nutrition of seaweeds: photosynthesis,
photorespiration and respiration. Journal of Experimental Marine Biological Ecology. 86: 15-
46.
15. Biswal, B. (2005). Photosynthetic response of green plants to environmental stresses:
Inhibition of photosynthesis and adaptation mechanisms. In Pessarakli M, (ed). Handbook of
Plant and Crop Stress. New York: Taylor and Francis Group, pp: 739- 750.
16. Biswal, B. and Biswal, U. C. (1999). Photosynthesis under stress: stress signals and adaptive
response of chloroplasts. In Pessarakli, M (ed). Handbook of Plant and Crop Stress. New
York: Marcel Dekker, Inc., pp. 337-348.
17. Bjorkman, O., Badger, M. R. and Armond, P. A. (1980). Response and adaptation of
photosynthesis to high temperatures. In Turner, N. C. and Kramer, P. J (eds). Adaptation of
Plants to Water and High Temperature Stress. Wiley, New York, pp. 233-249.
18. Blomster, J., Back, S., Fewer, D. P., Kiirikki, M., Lehvo, A. and Maggs, C.A. (2002). Novel
morphology in Enteromorpha (Ulvophyceae) forming green tides. American Journal of
Botany. 89: 1756-1763.

104
19. Bogorad, L. (1964). Chlorophylls. In Lewin, R. A (ed). Physiology and Biochemistry of
Algae. Academic Press, New York, pp: 385-408.
20. Bradford, M.M. (1976). A rapid and sensitive method for quantification of microgram
quanties of protein using the principle of protein-dye binding. Analytical Biochemistry. 72:
248-254.
21. Brand, J. (1984). Artificial Seawater Medium, Growth Media Recipes. Available from:
http:www.bio.utexas.edu/research/utex/media/artificial.html
22. Bruland, K. W. (1983). Trace elements in seawater. In Riley, J.P (ed), Chemical
Oceanography, (vol. 8), pp. 157-219. London, Academic Press.
23. Budd, G. C. and Pizzola, P. (2002). Enteromorpha intestinalis. Gut weed. Marine Life
Information Network: Biology and Sensivity Key Information Sub-programme (on-line).
Plymouth: Marine Biological Association of the United Kingdom. Available from
http://www.marlin.ac.uk/species/Entint.htm.
24. Cabello-Pasini, A., Zertuche-Gonazalez, J. A. and Pacheo-Ruiz, I. (2003). Photosynthesis,
growth and nitrogen uptake of competing marine macrophytes in the Gulf of California,
Botanica Marina. 46: 503-512.
25. Cairns, J. Jr. and McCormick, P. V. (1997). Algal indicators of aquatic ecosystem condition
and change. In Wang, W., Gorsuch, J. W. and Huges, J. S (eds). Plants for environmental
studies, Lewis Publishers, New York, pp: 177-224.
26. Callow, J.A., Stanley, M. S., Wetherbee, R. and Callow, M. E. (2000). Cellular and molecular
to understanding primary adhesion in Enteromorpha: an overview. Biofouling. 16: 141-150.
27. Callow, M. E. and Callow, J. A. (2000). Substratum location and zoospore behaviour in the
fouling alga Enteromorpha. Biofouling. 15:49-56.
28. Callow, M. E. and Callow, J. A. (2002). Marine biofouling: a sticky problem. Biologist. 49:
10-14.

105
29. Callow, M. E., Jennings, A. R., Brennan, A. B., Seegert, C. E., Gibson, A. and Wilson, L.
(2002). Microtopographic cues for settlement of zoospores of green fouling alga
Enteromorpha. Biofouling. 18:237-245.
30. Carlberg, S., Axelsson, L., Larsson, C., Ryberg, H. and Uusitalo, J. (1990). Inducible CO2
concentrating mechanisms in green seaweeds. I. Taxonomical and physiological aspects. In
Baltsheffky, M, (ed.). Current Research in Photosynthesis, (Vol 4), pp. 529-532.
31. Carpentier, R. (1999). Effect of high-temperature stress on the photosynthetic apparatus. In
Pessarakli, M, (ed). Handbook of Plant and Crop Stress. New York: Marcel Dekker, Inc., pp.
337-348.
32. Chapman, A. R. O., Markham, J. W. and Luning, K. (1978). Effects of nitrate concentration
on the growth and physiology of Laminaria saccharina (Phaeophyta) in culture. Journal of
Phycology. 14 : 195-198.
33. Cohen, R. (2002). The effects of runoff on the physiology of Enteromorpha intestinalis:
implications for use as a bioindicator of freshwater and nutrient influx to estuarine and coastal
areas. Coastal environmental quality initiative. UC Marine Council, University of California.
Available from: http:// www.repositories.cdlib.org/ucmarine/ceqi/025.
34. Coleman, J. R. and Coleman, B. (1981). Inorganic carbon accumulation and photosynthesis in
Blue-green alga as a function of external pH. Plant Physiology. 67: 917- 921.
35. Crafts-Brandner, S. J. and Salvucci, M. E. (2000). Rubisco activase constrains the
photosynthetic potential of leaves at high temperature and CO2. Proceedings of the National
Academy of Science of the United States of America. 97: 13430- 13435.
36. Daniell, J. W., Chappell, W. E. and Couch, H. B. (1969). Effect of sublethal and lethal
temperatures on plant cells. Plant Physiology. 44: 1684-1689.
37. Davison, I. R. and Pearson, G. A. (1996). Stress tolerance in intertidal seaweeds. Journal of
Phycology. 32: 197-211.

106
38. Davison, I. R. and Stewart, W. D. P. (1984). Studies on nitrate reductase activity in Laminaria
digitata (Huds) Lamour. I. Longitudinal and transverse profiles of nitrate reductase activity
within the thallus. Journal of Experimental Marine Biological Ecology. 74: 201- 17.
39. Dillion, P. S., Maki, J. S. and Mitchell, R. (1989). Adhesion of Enteromorpha swarmers to
microbial flims. Microbial Ecology. 17: 39-47.
40. Drechsler, Z. and Beer, S. (1991). Utilization of inorganic carbon by Ulva lactuca. Plant
Physiology. 97: 1439-1444.
41. Drechsler, Z., Sharkia, R., Cabantchik, Z. I. and Beer, S. (1993). Bicarbonate uptake in the
marine macroalga Ulva sp. is inhibited by classical probes of anion exchange by red blood
cells. Planta. 191: 34-40.
42. Dubois, M., Gilles, K. A., Hamilton, J. K., Rebers, P. A. and Smith, F. (1956). Calorimetric
methods for determination of sugars and related substances. Analytical Chemistry. 28: 350-
356.
43. Edwards, D. M., Reed, R. H. and Stewart, W. D. P. (1988). Osmoacclimation in
Enteromorpha intestinalis: long-term effects of osmotic stress on organic solute concentration.
Marine Biology. 98: 467-476.
44. Edwards, D. M., Reed, R. H., Chudek, J. A., Foster, R. and Stewart, W. D. P. (1987). Organic
solute concentration in osmotically-stressed Enteromorpha intestinalis. Marine Biology. 95:
583-592.
45. Elrifri, I. R. and Turpin, D. H. (1986). Nitrate and ammonium induced photosynthetic
suppression in N-limited Selenastrum minutum. Plant Physiology. 81: 273-279.
46. Ferrell, M. A., Miller, S. D. and Whitson, T. D. (2004). Basic Guide to Weeds and Herbicides.
Department of Plant Sciences, University of Wyoming.
47. Fish, J. D. and Fish, S. (1989). A Student’s Guide to the Seashore. Unwin Hyman Ltd,
London.
107
48. Giordano, M. and Maberly, S. C. (1989). Distribution of carbonic anhydrase in British marine
macroalgae. Oecologia. 81: 534-539.
49. Gomez, I. and Figueroa, F. L. (1998). Effects of solar UV stress on chlorophyll fluorescence
kinetics of intertidal macroalgae from southern Spain: a case study in Gelidium species.
Journal of Applied Phycology. 10: 285-294.
50. Graham, L. E. and Wilcox, L. W. (2000). Algae. Prentice Hall, Upper Saddle River, pp: 431.
51. Haroon, A. M., Szaniawska, A., Normant, M. and Janas, U. (2000). The biochemical
composition of Enteromorpha spp from the Gulf of Gdansk coast on the southern Baltic Sea.
Oceanologica. 42:19-28.
52. Havaux, M., Greppin, H. and Strasser, R. J. (1991). Functioning of photosystem I and II in
pea leaves exposed to heat stress in the presence or absence of light. Planta. 186: 88-98.
53. Hayden, H. S., Blomster, J., Maggs, C. A., Silva, P. C., Stanhope, M. J. and Waaland, J. R.
(2003). Linnaeus was right all along: Ulva and Enteromorpha are not distinct genera.
European Journal of Phycology. 38: 277- 294.
54. Heath, R. L. and Packer, L. (1968). Photoperoxidation in isolated chloroplasts II: role of
electron transfer. Archives of Biochemistry and Biophysics. 125: 850-857.
55. Hess, D. and Warren, F. (2002). The Herbicide handbook of Weed Science. Society of
America. 8th Edition, pp. 159- 161.
56. Hill K, 2001. Species Name: Enteromorpha flexuosa, Species Report, Smithsonian Marine
Station. Available from: http://www. sms.si. edu/irlspec/ Entero_flexuo.htm.
57. Houghton, D. R., Pearman, I., Tiemey, D. (1973). The effects of water velocity on the
settlement of swarmers of Enteromorpha species. In : Acker, R. F., Brown, B. F., DePalma, J.
R. and Iverson, W. P (eds). Proc 3rd Int Congr. Mar. Corrosion and Fouling. Northwest
University Press, Evanston, pp: 682-689.

108
58. Israel, A., Martinez-Goss, M. and Friedlander, M., (1999). Effect of salinity and pH on growth
and agar yield of Gracilaria tenuistipitata var.liui in laboratory and outdoor cultivation.
Journal of Applied Phycology. 11: 543-549.
59. Jeffrey, S.W and Humphrey, G. F. (1975). New spectrophotometric equations for determining
chlorophylls a, b, c1 and c2 in higher plants, algae and natural phytoplankton. Biochemical
Physiology Pflanzen., 167: 191-194.
60. Joint, I., Tait, K., Callow, M. E., Callow, J. A., Milton, D., Williams, P. and Camara, M.
(2002). Cell-to-cell communication across the prokaryote-eucaryote boundary. Science. 298:
1207.
61. Jordanova, A., Strezov, A., Ayranov, M., Petkov, N. and Stoilova, T. (1999). Heavy metal
assessment in algae, sediments and water from the Bulgarian Black Sea coast. Water Science
and Technology, 39: 207-212.
62. Kamer, K. and Fong, P. (2001). Nitrogen enrichment ameliorates the negative effects of
reduced salinity on green macroalga Enteromorpha intestinalis. Marine Ecology Progress
Series. 218:87-93.
63. Kamer, K., Schiff, K., Kennison, R. L. and Fong, P. (2002). Macroalgal nutrient dynamics in
upper Newport Bay. Southern Califrornia Coastal Water Research Project. University of
California, Los Angeles. Available from:
http//www.ftp://ftp.sccwrp.org/pub/download/PDFs/365_macroalgal_nutrient.pdf
64. Kerby, N. W. and Raven, P. J. (1985). Transport and fixation of inorganic carbon by marine
algae. Advance Botanical Research. 11: 71-123.
65. Kreast, J. F. and Grant, B. (1976). Chlorophyll A:B ratios in some siphonous green algae in
relation to species and environment. Journal of Phycology. 12: 328-331.

109
66. Lara, C., Romero, J. M., Coronil, T. and Guerreno, M. G. (1987). Interactions between
photosynthetic nitrate assimilation and CO2 fixation in cynobacteris. In Ulrich, W. R.,
Aparicio, P. J., Syrett, P. J. and Castillo, F (eds), Inorganic nitrogen metabolism. Springer-
Verlag, Berlin, pp. 45-52.
67. Larsson, C., Axelsson, L., Ryberg, H. and Beer, S. (1997). Photosynthetic carbon utilization
by Enteromorpha intestinalis (Chlorophyta) from a Swedish rockpool. European Journal of
Phycology. 32: 49-54.
68. Lewis, M. A. and Wang, W. (1997). Water quality and aquatic Plants. In Wang, W., Gorsuch,
J. W. and Hughes, J. S (eds), Plants for environmental studies Lewis Publishers, New York,
pp: 141-176.
69. Lewis, S., Donkin, M. E. and Depledge, M. H. (2001). Hsp70 expression in Enteromorpha
intestinalis (Chlorophyta) exposed to environmental stressors. Aquatic Toxicology. 51: 277-
291.
70. Lewis, S., May, S., Donkin, M. E. and Depledge, M. H. (1998). The influence of copper and
heat shock on the physiology and cellular stress response of Enteromorpha intestinalis.
Marine Environmental Research. 46: 421-424.
71. Lobban, C. S. and Harrison, P. J. (1994). Seaweed Ecology and Physiology. Cambridge
University Press, New York.
72. Lotze, H., Worm, B. and Sommer, U. (2000). Propagule banks, herbivory and nutrient supply
control population development and dominance patterns in macroalgal blooms. Oikos. 89: 46-
58.
73. Lotze, H., Worm, B. and Sommer, U. (2001). Strong bottom-up and top-down control of early
stages of maccroalgae. Liminology and Oceanography. 46: 749-757.
74. Luning, K. (1990). Seaweeds, their Environment, Biogeography and Ecophysiology. John
Wiley & Sons, Inc, New York.

110
75. Maberly, S. C. (1990). Exogenous sources of inorganic carbon for photosynthesis by marine
macroalgae. Journal of Phycology. 26: 439- 449.
76. Major, K. M. and Davison, I. R. (1998). Influence of temperature and light on growth and
photosynthetic physiology of Fucus evanescens (Phaeophyta) embryos. European Journal of
Phycology. 33: 129-138.
77. Markager, S. and Sand-Jensen. (1990). Heteromorphic growth of Ulva lactuca
(Chlorophyceae). Journal of Phycology. 26: 670-673.
78. Marre, E. (1962). Physiology and biochemistry of algae. Academic Press, London.
79. Martin, I., Oliveira, J. M., Flindt, M. and Marques, J. C. (1998). The effect of salinity on the
growth rate of macroalge Enteromorpha intestinalis (Chlorophyta) in the Mondego estuary
(West Portugal). Acta Oceanologica, 20: 259-265.
80. McAllen, R., 1999. Enteromorpha intestinalis - a refuge for the supralittoral rockpool
harpacticoid copepod Tigriopus brevicornis. Journal of the Marine Biological Association of
the United Kingdom, 79:1125-1126.
81. McDonald, M. S. (2003). Photobiology of Higher Plants. John Wiley and Sons Inc. New
York.
82. McHugh, D. J. (2003). A Guide to Seaweed Industry. FAO Fisheries Technical paper 441.
Available from: http://www.fao.org/docrep/006/y4765e/y4765eoo.htm
83. McManus, G. B., Zang, H. and Lin, S. (2004). Marine planktonic cilicates that prey on
macroalgae and enslave their chloroplast. Limnological Oceanography. 49: 308-313.
84. McNeil, S. D., Nuccio, M. L. and Hanson, A. D. (1999). Betaines and related
osmoprotectants. Target for metabolic engineering of stress resistance. Plant Physiology. 120:
945-949.
111
85. Mohsen, A. F., Nasr, A. H. and Metawalli, A. M. (1973). Effects of temperature variations on
growth, reproduction, amino acid synthesis, fat and sugar content in Ulva fasciata delile
plants. Hydrobiologia. 42: 451- 460.
86. Monacada, A. (2004). Environmental fate of Diuron 80. Environmental Monitoring Branch,
Department of Pesticide Regulation. Sacramento, California. Available from:
www.Cdpr.ca.gov/doc/empm/pubs/fatememo/Diuron 80.pdf.
87. Moss, B. L. and Woodhead, P. (1975). The effect of two commercial herbicides on the
settlement, germination and growth of Enteromorpha. Marine Pollution Bulletin. 6: 189-192.
88. N’Yeurt A.D.R., 2001. Marine algae from Suva lagoon and reef, Fiji. Australian Systematic
Botany. 14: 695-698.
89. Nelson, T. A., Nelson, A.V. and Tjoelker, M. (2003). Seasonal and spatial patterns of “Green
Tides” (Ulvoid algal blooms) and related water quality parameters in the coastal waters of
Washington State, USA. Botanica Marina. 46: 263-275.
90. Nilsen, E. T and Orcutt, D. M. (1996). Physiology of plants under stress, abiotic factors. John
Wiley & Sons. Inc. New York.
91. Patel, P., Callow, M. E., Joint, I. and Callow, J. A. (2003). Specificity in settlement –
modifying response of bacterial bioflims towards zoospores of the marine alga Enteromorpha.
Environmental Microbiology. 5: 338-349.
92. Peckol, P., DeMeo-Anderson., Rivers, J., Valiela., Maldonado, M. and Yates, J. (1994).
Growth, nutrient uptake capacities and tissue constituents of the macroalgae Cladophora
vagabunda and Gracilaria tikvahiae related to site specific nitrogen loading rates. Marine
Biology. 121: 175-185.
93. Pedersen, M. F. and Hansen, P. J. (2003). Effect of high pH on the growth and survival of six
marine heterotrophic protists. Marine Ecology Progress Series. 260: 33-41.

112
94. Philips, D. H. J. and Segar, D. A. (1986). Use of bioindicators in monitoring conservative
contaminants: programme design imperatives. Marine Pollution Bulletin. 17: 10-17.
95. Pinchetti, J. L. G., Fernandez, E. C., Diez, P. M. and Reina, G. G. (1998). Nitrogen
availability influences the biochemical composition and photosynthesis of tank-cultivated
Ulva rigida (Chlorophyta), Journal of Applied Phycology 10: 383-389.
96. Platt, S. G., Plaut, Z. and Bassham, J. (1977). Ammonia regulation of carbon metabolism in
photosynthesizing leaf discs. Plant Physiology. 60: 739-472.
97. Powell, S., Neal, R. and Leyva, J. (1996). Runoff and Leaching of Simazine and Diuron 80
Used on highway Rights-Of-Way. Environmental Hazards Assesment Program. EH 96-03.
Available from: www.uwyo.edu/plants/wyopest/ TrainingMannuals/Weedctrl.pdf.
98. Preston, M. R. (1988). Marine Pollution. In Riley, J. P (ed.), Chemical Oceanography (pp. 53-
196). Orlando, FL, Academic Press.
99. Rai, L. C., Gaur, J. P. and Kumar, H. D. (1981). Phycology and heavy-metal pollution.
Biological Review. 56: 99-151.
100. Ramus, J. and Rosenberg, G. (1980). Diurnal photosynthetic performance of seaweeds
measured under natural conditions. Marine Biology. 56: 21-28.
101. Rao, D., Webb, J. S and Kjelleberg, S. (2006). Microbial colonization and competition on the
marine alga Ulva australis. Applied and Environmental Microbiology. 72: 5547-5555.
102. Ratkevicius, N., Correa, J. and Moenne, A. (2003). Copper accumulation, synthesis of
ascorbate and activation of ascorbate peroxidase in Enteromorpha compressa (L.) Grev.
(Chlorophyta) from heavy metal enriched environments in noethern Chille. Plant, Cell and
Environment. 26: 1599-1608.
103. Raven, J. A. and Geider, R. J. (2003). Adaptation, acclimation and regulation in algal
photosynthesis. In Larkum, A. W. D., Douglas, S. E. and Raven, J. A (eds), Photosynthesis in
Algae. Kluwer Academic Publishers, London.; pp 385-412.

113
104. Ridley, S. M. (1977). Interaction of chloroplasts with inhibitors: induction of chlorosis by
Diuron 80 during prolonged illumination in vitro. Plant Physiology. 59: 724-732.
105. Rivers, J. S. and Peckol, P. (1995). Summer decline of Ulva Lactuca (Chlorophyta) in
eutrophic embayment: interactive effects of temperature and nitrogen availability. Journal of
Phycology. 31: 223-228
106. Ruckert, G. V. and Giani, A. (2004). Effect of nitrate and ammonium on growth and protein
concentration of Microcystic viridis Lemmerman (Cynobacteria). Revista Brasil Botany. 27:
325-331.
107. Salisbury, F. B. and Ross, C. W. (1991). Plant Physiology. Wadsworth Publishing Company,
Belmont, California.
108. Sand-Jenson, K. and Gordon, D. M. (1984). Differential ability of marine and freshwater
macrophytes to utilize HCO3- and CO2. Marine Biology. 80: 247-253.
109. Scarlett, A., Donkin, M.E., Fileman, T.W. and Donkin, P. (1997). Occurrence of the marine
antifouling agent Irgarol 1051 within the Plymouth Sound locality: implications for the green
macroalga Enteromorpha intestinalis. Marine Pollution Bulletin. 38: 645-651.
110. Siefermann-Harms, D. (1992). The yellowing of spruce in polluted atmosphere.
Photosynthetica. 27: 323-341.
111. Sinclair, J., Garland, S., Arnason, T., Hope, P. and Granville, M. (1977). Polychlorinated
biphenyls and their effects on photosynthesis and respiration. Canadian Journal of Botany. 55:
2679-2684.
112. Solomonson, L. P. and Barber, M. J. (1990). Assimilatory nitrate reductase: functional
properties and regulation. Annu. Rev. Plant Phyisol. Plant Molec Biol. 4: 225-253.
113. Tabudravu, J. N., Gangaiya, P., Sotheeswaran, S. and South, G. R. (2002). Enteromorpha
flexuosa (Wulfen) J.Agardh (Chlorophyta: Ulvales) – Evaluation as an indicator of heavy

114
metal contamination in a tropical estuary. Environmental monitoring and assessment. 75: 201-
213.
114. Tabudravu, N. J. (1998). Experimental and field evaluation of Enteromorpha flexuosa as an
indicator of heavy metal pollution by zinc, lead and copper in the coastal waters of Lami, MSc
Thesis, University of the South Pacific, Suva.
115. Taylor, R., Fletcher, R. L. and Raven, J. A. (2001). Preliminary studies on the growth of
selected ‘green tide’ algae in laboratory culture: effects of irradiance, temperature, salinity and
nutrients on growth rate, Botanica Marina. 44: 327-336.
116. Thomas, D. (2002). Seaweeds. The Natural Health Museum, London.
117. Tiaz, L. and Zeiger, E. (1998). Plant Physiology. Sinauer Associates, Inc., Publishers,
Sunderland, Massachusetts.
118. Turpin, D. H. (1980). Procresses in nutrient based phytoplankton ecology. Ph.D. dissertation,
University of British Columbia, Vancouver.
119. Vallares, R., Puente, X. and Carballeira, A. (2001). Ulva and Enteromorpha as indicators of
heavy metal pollution. Hydrobiologia. 462: 221-232.
120. Van Alstyne, K. L. and Houser, L. T. (2003). Dimethylsulfide release during
macroinvertebrate grazing and its role as an activated chemical defense. Marine Ecology
Progress Series. 250: 175-181.
121. Van Alstyne, K. L., Wolfe, G. V., Friedenberg, T. L., Neill, A. and Hicken, C. (2001).
Activated defense systems in marine macroalgae: an ecological role for DMSP cleavage.
Marine Ecology Progress Series. 213:53-65.
122. Velikova, V. and Yordanov, I. (1996). Changes in prompt chlorophyll fluorescence and
oxygen evolution after bean plant treatment with artificial acid rain. Bulgarian Journal of
Plant Physiology. 22: 14-24.

115
123. Villares, R. and Carballeira, A. (2004). Nutrient limitation in macroalgae (Ulva and
Enteromorpha) from the Rias Baixas (NW Spain). Marine ecology. 25: 225-243.
124. Walker, D. (1990). The Use of the Oxygen Electrode & Fluorescence Probes in Simple
Measurements of Photosynthesis. Robert Hill Institute, The University of Sheffield, UK.
125. Wheeler, W. N. (1980). Pigment content and photosynthetic rate of the fronds of Macrocystis
pyrifera. Marine Biology. 56: 97-102.
126. Woodrow, Z. E., Murphy, D. J. and Latzko, E. (1984). Regulation of stromal sedoheptulose-
1,7 bisphosphatase activity by pH and Mg 2+ concentration. Journal of Biological Chemistry.
259: 3791-3795.
127. Worm, B., Lotze, H. K. and Sommer, U. (2001). Algal propagule banks modify competition,
consumer and resource control on Baltic rocky shores. Oceanologica. 128: 281-293.
116
APPENDIX
A 1.1 Preparation of Artificial Seawater Medium (Brand, 1984)
Artificial Seawater Medium was prepared using the following ingredients:
• 925 ml of glass distilled water
• 18 g NaCl
• 10 ml MgSO4.7H2O
• 10 ml KCl
• 10 ml NaNO3
• 10 ml CaCl2.2H2O
• 10 ml KH2PO4
• 10 ml Tris buffer (Sigma Co.)
• 1 ml NH4Cl
• 1 ml vitamin B12
• 10 ml PI metal solution
• 3ml Chelated iron solution

117
Table A 1.1. Functions and compounds of the essential elements in seaweeds.
Element Probable functions Examples of compounds Nitrogen Major metabolic importance in compounds Amino acids, purines, pyrimidines, amino
sugars, amines Phosphorus Structural, energy transfer ATP, GTP, etc., nucleic acids,
phopholopids, coenzymes (including coenzymes A), phosphoenolpyruvate
Potassium Osmotic regulation, pH control, protein conformation and stability
Probably occurs predominantly in ionic form
Calcium Structural, enzyme activation, cofactor in ion transport
Calcium alginate, calcium carbonate
Magnesium Photosynthetic pigments, enzyme activation, cofactor in ion transport, ribosome stability
Chlorophyll
Sulphur Active groups in enzymes and coenzymes, structural
Methionine, cystine, glutathion, agae, carrageenan, sulfolipids, coenzyme A
Iron Active groups in porphyrin molecules and enzymes
Ferredoxin, ctychromes, nitrate reductase, nitrite reductase, catalase
Manganese Electron transport in photosystem ll, maintenance of chloroplast membrane structure
Copper Electron transport in photosynthesis, enzymes
Plastocyanin, amine oxidase
Zinc Enzymes, ribosome structure (?) Carbonic anhydrase Molybdenum Nitrate reduction, ion absorption Nitrate reductase Sodium Enzyme activation, water balance Nitrate reductase Chlorine Photosystem ll, secondary metabolites Violacene Boron Regulation of carbon utilization (?),
ribosome structure (?)
Cobalt Component of vitamin B12 B12 Bromine* Iodine*
Toxicity of antibiotic compounds (?) Wide range of halogenated compounds, especially in Rhodophyseae
*Possibly an essential element in some seaweed.
Modified from Lobban and Harrison, (1994).

118
Table A 1.2 Concentrations of some essential elements in seawater and in seaweeds.
Modified from Lobban and Harrison, (1994).
Mean concentration Concentration in In seawater dry matter
Mean Range Ration of concentration in
Element (mmol kg-1) (�g g-1) (�g g-1) (�g g-1) seawater to concentration in tissue
Macronutrient H 105,000 10,500 49,500 22,000-72,000 2.1 x 10n Mg 53.2 1,293 7,300 1,900-66,000 1.8 x 10⁻¹ S 28.2 904 19,400 4,500-8,200 4.7 x 10⁻² K 10.2 399 41,100 30,000-82,000 1.0 x 10⁻² Ca 10.3 413 14,300 2,000-360,000 2.9 x 10⁻² C 2.3 27.6a, b 274,000 140,000-460, 000 1.0 x 10⁻⁴ B 0.42 4.50 184 15-910 2.4 x 10⁻² N 0.03 0.420a, c 23,00 500-65,000 2.1 x 10⁻⁵ P 0.002 0.071 2,800 300-12,000 2.4 x 10⁻⁵ Micronutrients Zn 6 x 10⁻⁶ 0.0004a 90 2-680 4.4 x 10⁻⁵ Fe 1 x 10⁻⁶ 0.00006a 300 90-1,500 1.0 x 10⁻⁵ Cu 4 x 10⁻⁶ 0.0002a 15 0.6-80 1.7 x 10⁻⁴ Mn 0.5 x 10⁻⁶ 0.00003a 50 4-240 2.0 x 10⁻⁵
a = Considerable variation occurs in seawater (Bruland 1983). b = Dissolved organic carbon. c = Combine nitrogen (dissolved organic and inorganic).
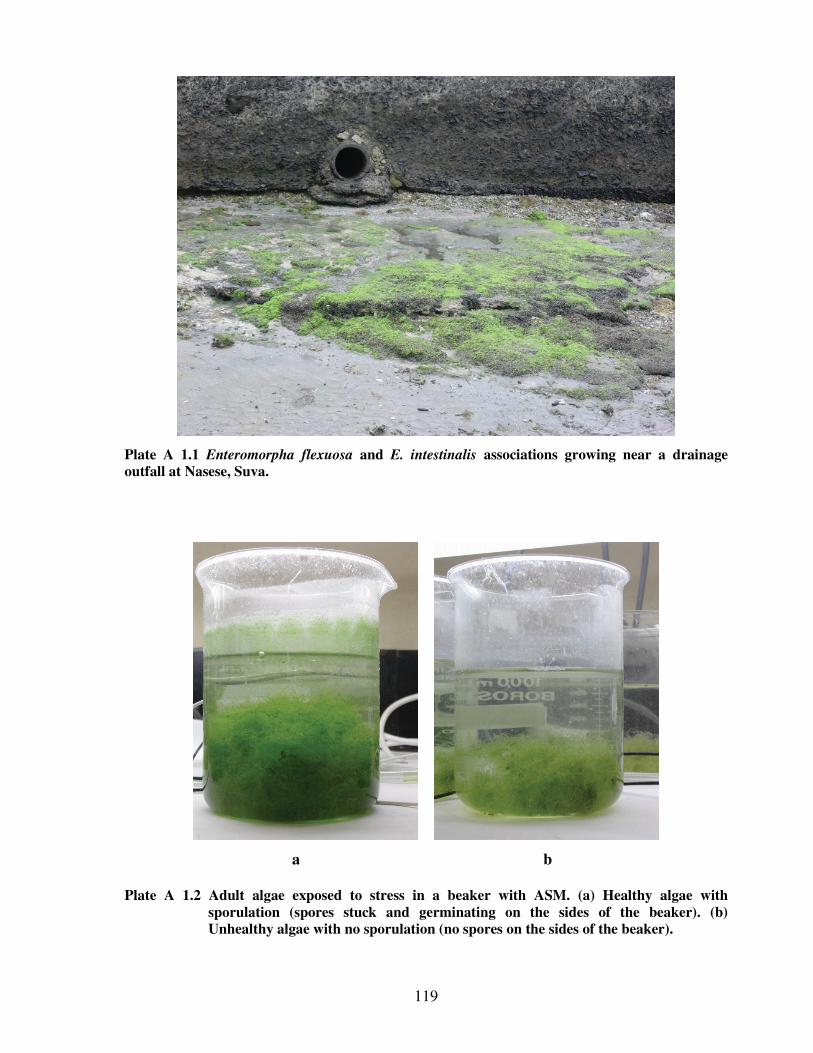
119
Plate A 1.1 Enteromorpha flexuosa and E. intestinalis associations growing near a drainage outfall at Nasese, Suva.
a b
Plate A 1.2 Adult algae exposed to stress in a beaker with ASM. (a) Healthy algae with sporulation (spores stuck and germinating on the sides of the beaker). (b) Unhealthy algae with no sporulation (no spores on the sides of the beaker).