Embed Size (px)
Citation preview

elifesciences.org
RESEARCH ARTICLE
The structure of plant photosystemI super-complex at 2.8 A resolutionYuval Mazor*, Anna Borovikova, Nathan Nelson*
Department of Biochemistry, The George S. Wise Faculty of Life Sciences, Tel AvivUniversity, Tel Aviv, Israel
Abstract Most life forms on Earth are supported by solar energy harnessed by oxygenic
photosynthesis. In eukaryotes, photosynthesis is achieved by large membrane-embedded super-
complexes, containing reaction centers and connected antennae. Here, we report the structure of
the higher plant PSI-LHCI super-complex determined at 2.8 A resolution. The structure includes
16 subunits and more than 200 prosthetic groups, which are mostly light harvesting pigments.
The complete structures of the four LhcA subunits of LHCI include 52 chlorophyll a and 9 chlorophyll
b molecules, as well as 10 carotenoids and 4 lipids. The structure of PSI-LHCI includes detailed
protein pigments and pigment–pigment interactions, essential for the mechanism of excitation
energy transfer and its modulation in one of nature’s most efficient photochemical machines.
DOI: 10.7554/eLife.07433.001
IntroductionOxygenic photosynthesis, in which the conversion of sunlight into chemical energy by plants, green
algae, and cyanobacteria, occurs, underpins the survival of virtually all life forms. By producing oxygen
and assimilating carbon dioxide into organic matter, this process determines, to a large extent, the
composition of our atmosphere and provides essential food and fuel. Light photons are captured by
pigments in very large membrane–bound complexes and the excitation energy is utilized to form
NADPH and ATP. Two reaction centers, photosystem II (PSII) and photosystem I (PSI), drive this
electron transport chain. PSII oxidizes water to produce oxygen and reduce membrane-embedded
quinones. The reduced quinones are then utilized by the cytochrome b6f complex to produce a proton
gradient across the membrane and to reduce the small copper protein plastocyanin (PC), the electron
donor of PSI. After an additional photon is absorbed by any of the 200 antenna pigments of PSI, its
energy migrates through this large network of connected pigments and eventually oxidizes P700,
a special chlorophyll pair located at the center of PSI. The electron removed from P700 by this
oxidation event migrates along an internal electron transport chain and finally reduces ferredoxin (Fd),
the final electron acceptor of PSI. Reduced Fd is utilized by several cellular pathways, mainly the
reduction of NADP to NADPH. This NADPH and ATP generated by the thylakoid ATP-synthase
complex powers the Calvin cycle to produce carbohydrates.
Oxygenic photosynthesis evolved over 3 billion years ago in cyanobacteria (Blankenship, 1992;
Barber, 2004; Nelson, 2013). Later, approximately 1.5 billion years ago, the first photosynthetic
eukaryotes appeared, eventually evolving into land plants roughly 0.5 billion years ago. The basic
building blocks of photosynthesis are remarkably conserved. The architectures of both photosystems
have been determined by numerous techniques, but X-ray crystallography has provided the most
detailed structural information for the four large membrane complexes catalyzing oxygenic
photosynthesis (Nelson and Ben-Shem, 2004; Nelson and Yocum, 2006; Croce and van
Amerongen, 2013; Nelson and Junge, 2015). Structures at the highest resolution has been
obtained for thermophilic cyanobacteria, but representative structures from eukaryotic chloroplasts,
especially plants, are scarce (Jordan et al., 2001; Ben-Shem et al., 2003; Kurisu et al., 2003;
*For correspondence: yuval.
[email protected] (YM); nelson@
post.tau.ac.il (NN)
Competing interests: The
authors declare that no
competing interests exist.
Funding: See page 15
Received: 11 March 2015
Accepted: 14 June 2015
Published: 15 June 2015
Reviewing editor: Werner
Kuhlbrandt, Max Planck Institute
of Biophysics, Germany
Copyright Mazor et al. This
article is distributed under the
terms of the Creative Commons
Attribution License, which
permits unrestricted use and
redistribution provided that the
original author and source are
credited.
Mazor et al. eLife 2015;4:e07433. DOI: 10.7554/eLife.07433 1 of 18

Stroebel et al., 2003; Ferreira et al., 2004; Loll et al., 2005; Amunts et al., 2007, 2010; Umena
et al., 2011). Here, we report the structure of plant PSI super-complex at high resolution.
Results and discussion
Structure determinationThe crystal structure of plant PSI was first reported at 4.4 A resolution (Ben-Shem et al., 2003) and has
been improved up to 3.3 A resolution in the last decade (PDB 2WSC). This PSI preparation was limited to
pea plants from the variety Alaska, and good crystals were hard to come by (Amunts et al., 2007, 2010).
Therefore, we screened for new robust crystals that are abundant, stable, and much more uniform.
The new crystals could be obtained from several pea plants varieties, a large proportion of them diffracted
to 3 A with several yielding higher resolutions. In contrast to the P21 symmetry of the previous crystal, the
current crystal belonged to higher symmetry space group P212121. The organization of the PSI unit within
the new crystal was also markedly different. In the P21 crystal the PSI-LHCI complex was organized
as parallel layers in which the iron-sulfur clusters FX, FA and FB face the adjacent P700 (Figure 1A).
The complexes inside the new crystal lattice were serially arranged in a crissed-crossed manner in which
the polarity of each PSI unit contrasts another (Figure 1B). Consequently, the current crystals generated
no net voltage (data not shown), whereas a voltage of up to 50 V was recorded (Toporik et al., 2012)
upon illumination of dried P21 crystals placed on electron conductive material.
The extreme size and complexity of the PSI assembly was a major obstacle for accurate and bias-free
modeling. The best way to eliminate model bias in X-ray crystallography is to utilize experimentally
measured phase information. Using the new, highly stable crystal form of PSI we were able to measure
the weak native anomalous signal from the iron, sulfur, and phosphate atoms in the complex. Starting
with a minimal model containing only the three natively bound iron-sulfur clusters, the entire structure
was eventually re-built with more than 35,000 atoms (Figure 2 and Figure 2—figure supplement 1, see
‘Material and methods’ section for details).
Core subunits: PC binding site and implications for the state II PSIcomplexThe structure of plant PSI includes 12 core subunits bound with four light-harvesting proteins
comprising the LHCI antenna complex. The entire complex contains 214 prosthetic groups, including
eLife digest Most plants, green algae and some bacteria use a process called photosynthesis to
convert energy from sunlight into the chemical energy they need to survive and grow. With this
energy, these organisms use carbon dioxide and water to create organic matter and release oxygen
into the atmosphere. Therefore, photosynthesis plays a major role in providing the basis for life on
earth.
During photosynthesis, molecules of pigments known as chlorophyll and carotenoid capture the
light energy. These pigments are contained within large groups (or ‘complexes’) of proteins that sit in
membrane structures within cells. Two of the protein complexes—called photosystem I and
LHCI—interact with each other to form a ‘supercomplex’ that transfers energy to a small protein
called ferredoxin. To achieve this, the light energy captured by pigment molecules is transferred to
other pigment molecules so that the energy is funneled towards the center of photosystem I.
Mazor et al. used a technique called X-ray crystallography to create a very detailed three-
dimensional model of photosystem I and LHCI from pea plants. The model shows how the twelve
proteins of photosystem I are arranged in relation to the four proteins of the LHCI complex. The
super-complex contains more than 200 other molecules, which are mostly chlorophylls and
carotenoids. Of these, 61 chlorophyll molecules and ten carotenoid molecules are found in LHCI.
The model also provides detailed information about how the pigments interact with each other
and with the proteins in the supercomplex. Mazor et al.’s detailed model may help us to understand
how these interactions allow photosystem I to harvest light energy with almost 100% efficiency, and
aid efforts to develop new technologies that harness light.
DOI: 10.7554/eLife.07433.002
Mazor et al. eLife 2015;4:e07433. DOI: 10.7554/eLife.07433 2 of 18
Research article Biophysics and structural biology | Plant biology

156 chlorophylls (nine assigned as chlorophyll b), 32 carotenes, and 14 lipids, many of them located at
key contact points of the complex.
The core photosynthetic reaction centers have remained virtually unchanged over the entire
2 billion years of their evolution (Jordan et al., 2001; Ben-Shem et al., 2003; Amunts et al., 2010).
Instead, the evolution of PSI is marked by the loss and gain of whole subunits from the complex
(Scheller et al., 2001; Nelson, 2011; Nelson and Junge, 2015). Compared to our previous model
(PDB 2WSC), the root-mean-square deviation (rmsd) between the plant and cyanobacterial core
(PDB 1JB0) decreased from 1.1 A to 0.55 A. The majority of the changes made in the core subunits
involved the configuration of extramembrane loops, which now closely resemble the cyanobacterial
configuration. The exceptions to this role are found at the anchor points of LHCI to the core
(discussed below) and at the interfaces between plant-specific subunits, such as the PsaH–PsaL
Figure 1. Comparison of two PSI-LHCI crystal lattices. (A) The previous PSI-LHCI crystal in the P21 space group with
a layered arrangement of the complex. This arrangement is capable of generating extremely high voltages upon
illumination. (B) The new crystal lattice in the P212121 space group. Iron sulfur clusters are colored in red and the
pigments of the internal electron transport chain in magenta (chlorophylls) and blue (quinones). PSI-LHCI complexes
are arranged in a crissed-crossed manner from left to right.
DOI: 10.7554/eLife.07433.003
Mazor et al. eLife 2015;4:e07433. DOI: 10.7554/eLife.07433 3 of 18
Research article Biophysics and structural biology | Plant biology

interaction (Figure 3A). The dramatic change from trimer to monomeric organization that occurred
in eukaryotes, was triggered by the addition of the PsaH subunit (Ben-Shem et al., 2003). A new
configuration for PsaH shows that this subunit binds four other core subunits. Starting from the
stromal side of the membrane, the N-terminus is tightly tucked between the N-terminus of PsaD and
a eukaryotic-specific loop in the PsaL subunit. PsaH then enters the membrane surrounding PsaL to
prevent PSI trimerization and associates with PsaI and PsaB via mostly hydrophobic interactions
(Figure 3A).
Eukaryotes can modulate the distribution of excitation energy transfer between their two
photosystems via a mechanism called state transitions (Lunde et al., 2000; Bellafiore et al., 2005;
Rochaix, 2011; Rochaix et al., 2012). Under state II conditions, PSI associates with a mobile pool
of the LHCII antennae, which increases its absorbance cross-section (Kargul et al., 2005; de
Bianchi et al., 2010). Genetic studies suggest that PsaH, PsaL, and PsaK play important roles in
this process (Scheller et al., 2001; Zhang and Scheller, 2004). Electron microscopy studies have
identified the binding site of the additional antennae complexes along the PsaL/PsaH-PsaK side
(Kargul et al., 2005; Kouril et al., 2005). A new chlorophyll bound by PsaH was identified at the
current resolution. This new chlorophyll, together with pigments bound by PsaL, probably participates
in energy transfer into the core (Figure 3A), suggesting that PsaH is not simply a ‘landing pad’ for LHCII,
but is also important for energy transfer into the core during state II. Additional pigments bound by
PsaA in close proximity to subunit PsaK (the structure of which is now almost completely defined)
provided the first accurate description of this binding site and suggest a mechanism for energy transfer
into the core antenna through the PsaK side (Figure 3—figure supplement 1).
On the luminal side of the membrane, the new position of the N-terminus of PsaH suggests that
this subunit also directly contributes to PC binding. One of the distinguishing characteristics of the
eukaryotic PSI is the stable complex it forms with its electron donor PC, which results in a thousand-
fold acceleration of the electron transfer rate (Bottin and Mathis, 1985).
Figure 2. Overall structure and organization of the plant PSI-LHCI supercomplex. (A) A view from the stromal side of
the membrane of PSI-LHCI with the PsaL subunit pointing up. The PsaF and PsaJ subunits connecting in the middle
of LHCI are colored in magenta and green, respectively. The three subunits of the stromal ridge, PsaC, PsaD, and
PsaE, can be seen in the middle of the complex, colored cyan, pink, and blue, respectively. The two iron-sulfur
clusters of PsaC can be distinguished as yellow and orange clusters in the middle of the complex. (B) Pigment
organization in PSI-LHCI. The central pigments of the internal electron transport chain are colored red, chlorophylls
of the core antenna green, chlorophyll a in LHCI in cyan, and chlorophyll b in magenta. Carotenoids, which are
distributed throughout the complex, are colored in blue and lipids in key connecting points and conserved positions
in the core, in orange.
DOI: 10.7554/eLife.07433.004
The following figure supplement is available for figure 2:
Figure supplement 1. Phasing substructure and electron density maps.
DOI: 10.7554/eLife.07433.005
Mazor et al. eLife 2015;4:e07433. DOI: 10.7554/eLife.07433 4 of 18
Research article Biophysics and structural biology | Plant biology
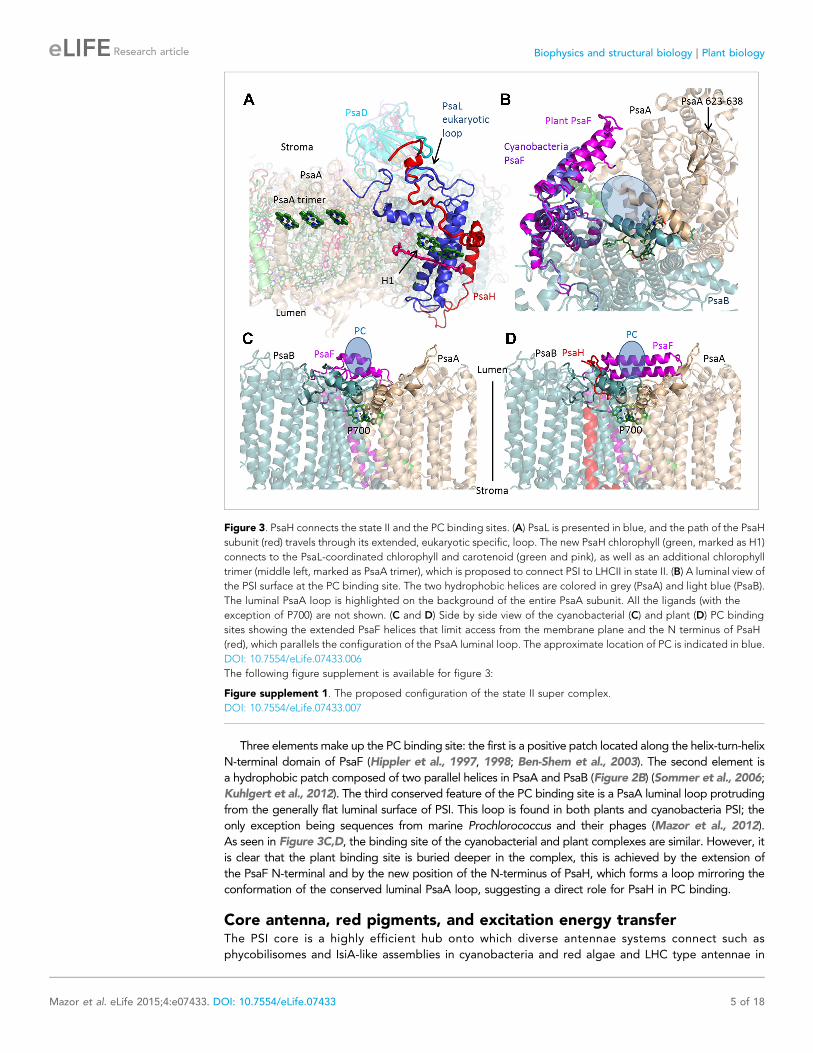
Three elements make up the PC binding site: the first is a positive patch located along the helix-turn-helix
N-terminal domain of PsaF (Hippler et al., 1997, 1998; Ben-Shem et al., 2003). The second element is
a hydrophobic patch composed of two parallel helices in PsaA and PsaB (Figure 2B) (Sommer et al., 2006;
Kuhlgert et al., 2012). The third conserved feature of the PC binding site is a PsaA luminal loop protruding
from the generally flat luminal surface of PSI. This loop is found in both plants and cyanobacteria PSI; the
only exception being sequences from marine Prochlorococcus and their phages (Mazor et al., 2012).
As seen in Figure 3C,D, the binding site of the cyanobacterial and plant complexes are similar. However, it
is clear that the plant binding site is buried deeper in the complex, this is achieved by the extension of
the PsaF N-terminal and by the new position of the N-terminus of PsaH, which forms a loop mirroring the
conformation of the conserved luminal PsaA loop, suggesting a direct role for PsaH in PC binding.
Core antenna, red pigments, and excitation energy transferThe PSI core is a highly efficient hub onto which diverse antennae systems connect such as
phycobilisomes and IsiA-like assemblies in cyanobacteria and red algae and LHC type antennae in
Figure 3. PsaH connects the state II and the PC binding sites. (A) PsaL is presented in blue, and the path of the PsaH
subunit (red) travels through its extended, eukaryotic specific, loop. The new PsaH chlorophyll (green, marked as H1)
connects to the PsaL-coordinated chlorophyll and carotenoid (green and pink), as well as an additional chlorophyll
trimer (middle left, marked as PsaA trimer), which is proposed to connect PSI to LHCII in state II. (B) A luminal view of
the PSI surface at the PC binding site. The two hydrophobic helices are colored in grey (PsaA) and light blue (PsaB).
The luminal PsaA loop is highlighted on the background of the entire PsaA subunit. All the ligands (with the
exception of P700) are not shown. (C and D) Side by side view of the cyanobacterial (C) and plant (D) PC binding
sites showing the extended PsaF helices that limit access from the membrane plane and the N terminus of PsaH
(red), which parallels the configuration of the PsaA luminal loop. The approximate location of PC is indicated in blue.
DOI: 10.7554/eLife.07433.006
The following figure supplement is available for figure 3:
Figure supplement 1. The proposed configuration of the state II super complex.
DOI: 10.7554/eLife.07433.007
Mazor et al. eLife 2015;4:e07433. DOI: 10.7554/eLife.07433 5 of 18
Research article Biophysics and structural biology | Plant biology

eukaryotes (Berera et al., 2009; Engelken et al., 2010; Nelson and Junge, 2015; Wahadoszamen
et al., 2015). Remarkably, the core pigment organization is conserved across kingdoms despite this
diversity in connected antenna (Amunts et al., 2007; Busch and Hippler, 2011; Croce and van
Amerongen, 2013), which suggests that the connection points between the core and the antennae
are conserved. The existence of red-absorbing pigments (or ‘red traps’) is a general property of PSI
(Morosinotto et al., 2005; Wientjes et al., 2012). These pigments affect the rate of trapping in PSI
and can affect the path of excitation migration in the complex. Most of the eukaryotic red pigments
have been shown to reside at LHCI. However, red pigments may be lost from the core complex during
the isolation of LHCI. The first high-resolution PSI structure from thermophilic cyanobacteria revealed
the organization of the core antenna (Jordan et al., 2001). A stacked chlorophyll trimer supported by
an extended loop in PsaB was the best candidate for one of the strong red absorbers in this complex
(Jordan et al., 2001). PsaB sequences from eukaryotes and many cyanobacteria lack this extended
loop, resulting in this chlorophyll trimer being lost, as has been shown in the plant and mesophilic PSI
structures (Amunts et al., 2010;Mazor et al., 2014). At the current resolution, we observed new core
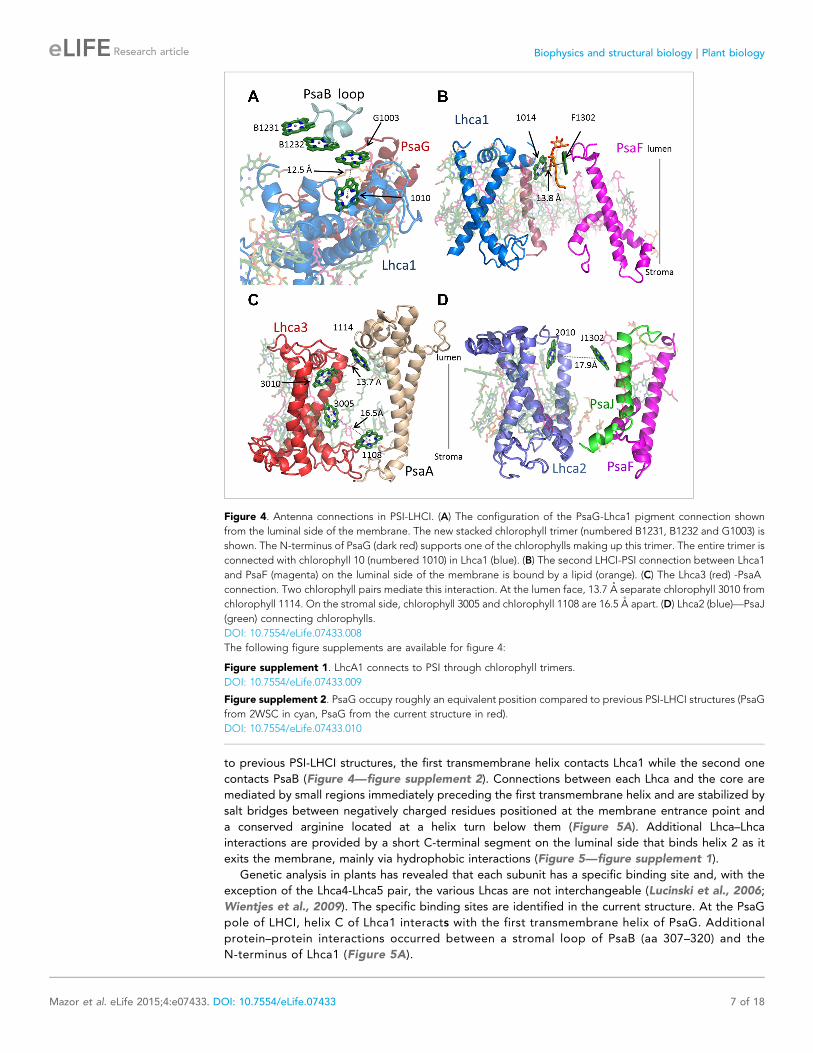
chlorophyll bound between PsaG and Lhca1 and a newly discovered lipid (Figure 4A). This new
chlorophyll restores the stacked chlorophyll trimer independent of the shortened PsaB loop and is
responsible for one of the connection points between the core complex and the LHCI antenna, with
a Mg–Mg distance of 12.5 A between it and chlorophyll 1010 in Lhca1 (the nomenclature for LHCII is
used to describe Lhcas [Standfuss et al., 2005]). On the stromal side of the membrane, an additional
chlorophyll trimer first discovered in Synechocystis is also responsible for an antenna attachment point
with a Mg–Mg distance of 13.7 A between the core chlorophyll A40 and chlorophyll 1005 in Lhca1
(Figure 4—figure supplement 1). We suggest that chlorophyll trimers located at the periphery of the
core antenna are extremely important for antenna attachment and are probably general attachment
points to the core that are utilized not only by eukaryotes, but also by other antenna systems in
cyanobacteria.
In contrast to the previous plant structures, which included a small pool of ‘Gap chlorophylls’, only
six pigment pairs connect LHCI to the core antenna in the current structure. Lhca1 is the main
connector for excitation transfer, harboring three chlorophylls that are within 14 A of reaction center
pigments (Figure 4A,B and Figure 4—figure supplement 1). This close proximity ensures efficient
and fast energy transfer. Surprisingly, Lhca3 is also one of the main connection points with two such
pairs (Figure 4C). The final excitonic connection between PSI to LHCI is located between chlorophyll
J1302 bound by PsaJ and chlorophyll 2010 (A chlorophyll b molecule). The Mg–Mg distance of this
pair is quite large (17.6 A) however, since the gap between LHCI and PSI allows for some
movement, this distance can change to provide an efficient link between the core and LHCI
(Figure 4D). To summarize, the extremely fast and efficient energy transfer processes that typify
PSI-LHCI occurs through only six pairs of pigment molecules located at three sites. These sites
connect to the core antennae at the PsaG and PsaK poles through Lhca1 and Lhca3, with Lhca2
playing a relatively minor role.
The structure of the LHCI complexOur structure includes the fully modeled LHCI belt with nearly complete structures of all four Lhca
proteins. These structures reveal the essential features of the specific interactions between: each
Lhca protein and the core; the red chlorophyll assembly present in Lhca4 and Lhca3; and a
previously unknown pigment binding site, which is the probable site for the recently discovered
non-photochemical quenching (NPQ) at the luminal gap region of LHCI (de Bianchi et al., 2010;
Ballottari et al., 2014).
Overall viewThe LHCI belt is located on the PsaF side of the PSI core. On the stromal face of the membrane, the
four conserved N-terminal domains connect each Lhca subunit to its neighbor through interaction with
an Lhca-specific loop (loop 23) (Figure 5A) that follows immediately after the second transmembrane
helix and supports a new chlorophyll site (numbered 16) in Lhca4 and Lhca2 (Figure 6A,B). Lhca1,
which interacts with PsaG in the core complex, completely lacks this loop and instead contains a short,
positively charged linker in this region (Figure 5A). One of the major changes in the structure of LHCI
is the reversal in the polarity of PsaG. While PsaG occupies roughly an equivalent position compared
Mazor et al. eLife 2015;4:e07433. DOI: 10.7554/eLife.07433 6 of 18
Research article Biophysics and structural biology | Plant biology
to previous PSI-LHCI structures, the first transmembrane helix contacts Lhca1 while the second one
contacts PsaB (Figure 4—figure supplement 2). Connections between each Lhca and the core are
mediated by small regions immediately preceding the first transmembrane helix and are stabilized by
salt bridges between negatively charged residues positioned at the membrane entrance point and
a conserved arginine located at a helix turn below them (Figure 5A). Additional Lhca–Lhca
interactions are provided by a short C-terminal segment on the luminal side that binds helix 2 as it
exits the membrane, mainly via hydrophobic interactions (Figure 5—figure supplement 1).
Genetic analysis in plants has revealed that each subunit has a specific binding site and, with the
exception of the Lhca4-Lhca5 pair, the various Lhcas are not interchangeable (Lucinski et al., 2006;
Wientjes et al., 2009). The specific binding sites are identified in the current structure. At the PsaG
pole of LHCI, helix C of Lhca1 interacts with the first transmembrane helix of PsaG. Additional
protein–protein interactions occurred between a stromal loop of PsaB (aa 307–320) and the
N-terminus of Lhca1 (Figure 5A).
Figure 4. Antenna connections in PSI-LHCI. (A) The configuration of the PsaG-Lhca1 pigment connection shown
from the luminal side of the membrane. The new stacked chlorophyll trimer (numbered B1231, B1232 and G1003) is
shown. The N-terminus of PsaG (dark red) supports one of the chlorophylls making up this trimer. The entire trimer is
connected with chlorophyll 10 (numbered 1010) in Lhca1 (blue). (B) The second LHCI-PSI connection between Lhca1
and PsaF (magenta) on the luminal side of the membrane is bound by a lipid (orange). (C) The Lhca3 (red) -PsaA
connection. Two chlorophyll pairs mediate this interaction. At the lumen face, 13.7 A separate chlorophyll 3010 from
chlorophyll 1114. On the stromal side, chlorophyll 3005 and chlorophyll 1108 are 16.5 A apart. (D) Lhca2 (blue)—PsaJ
(green) connecting chlorophylls.
DOI: 10.7554/eLife.07433.008
The following figure supplements are available for figure 4:
Figure supplement 1. LhcA1 connects to PSI through chlorophyll trimers.
DOI: 10.7554/eLife.07433.009
Figure supplement 2. PsaG occupy roughly an equivalent position compared to previous PSI-LHCI structures (PsaG
from 2WSC in cyan, PsaG from the current structure in red).
DOI: 10.7554/eLife.07433.010
Mazor et al. eLife 2015;4:e07433. DOI: 10.7554/eLife.07433 7 of 18
Research article Biophysics and structural biology | Plant biology

The next contact point between LHCI and the core occurs between the N-terminus of Lhca4 and
the C-terminus of PsaF, the conformation of which is almost identical to the conformation found in
cyanobacteria. This interaction consists of hydrophobic patches surrounding charged residues in the
membrane-buried regions of both proteins. This binding site should be shared between Lhca4 and
Figure 5. Lhcas connect to the PSI core through conserved structural elements. (A) A view from the stromal side of
the membrane of LHCI. Each Lhca connects to the next one through its conserved N-terminal domain (marked N).
All connections to the core are mediated by the short region preceding the entrance of the first transmembrane
helix into the membrane (marked by a circle). The extended loop (L23) is conserved in all Lhcas except Lhca1.
(B) Electrostatic interactions determine the specificity of the Lhca4/5 binding site to PsaF. The conserved E84-R209
interaction occurs within the PsaF (magenta) domain, which is partially membrane-buried, and Lhca4 (raspberry).
(C) Superposition of Lhca3 (red) and LHCII (cyan). Lhca3 interacts with the core via contacts with PsaA and PsaK
through short extension (red circle) or deletion (green circle) in the otherwise highly conserved N terminus.
The extension of loop 23 is also seen at the bottom left corner of the image.
DOI: 10.7554/eLife.07433.011
The following figure supplement is available for figure 5:
Figure supplement 1. Luminal side connections between the core PSI and LHCI.
DOI: 10.7554/eLife.07433.012
Mazor et al. eLife 2015;4:e07433. DOI: 10.7554/eLife.07433 8 of 18
Research article Biophysics and structural biology | Plant biology
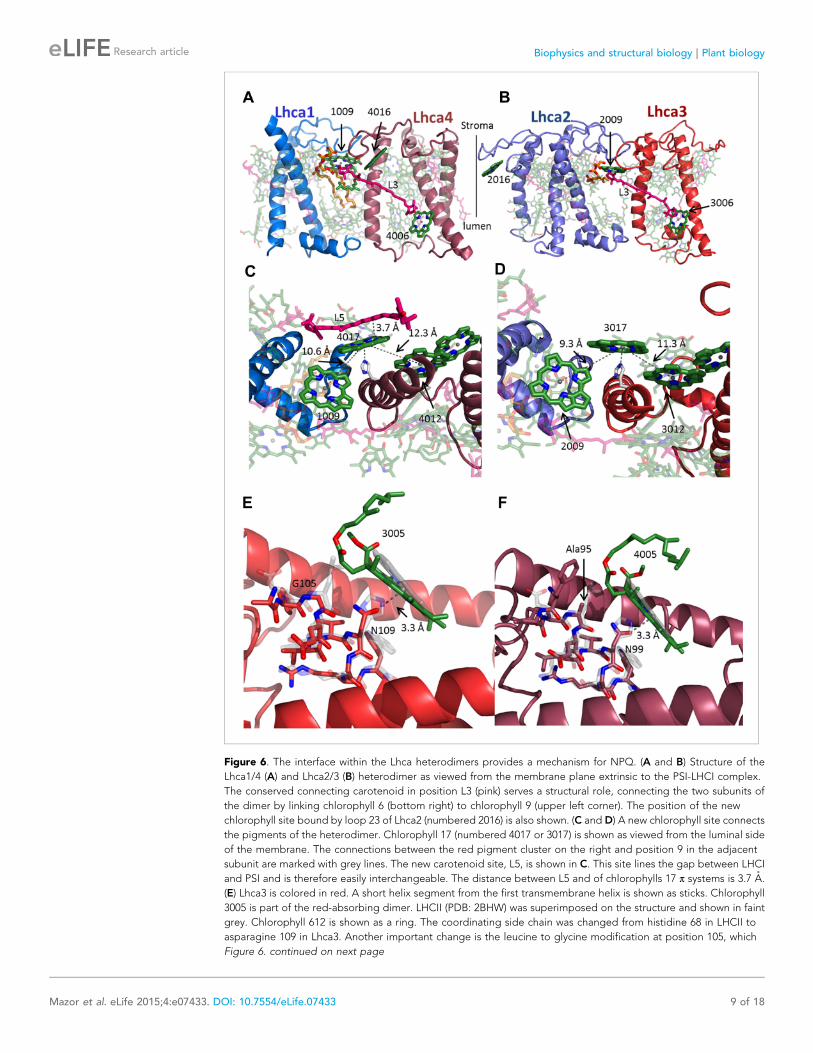
Figure 6. The interface within the Lhca heterodimers provides a mechanism for NPQ. (A and B) Structure of the
Lhca1/4 (A) and Lhca2/3 (B) heterodimer as viewed from the membrane plane extrinsic to the PSI-LHCI complex.
The conserved connecting carotenoid in position L3 (pink) serves a structural role, connecting the two subunits of
the dimer by linking chlorophyll 6 (bottom right) to chlorophyll 9 (upper left corner). The position of the new
chlorophyll site bound by loop 23 of Lhca2 (numbered 2016) is also shown. (C and D) A new chlorophyll site connects
the pigments of the heterodimer. Chlorophyll 17 (numbered 4017 or 3017) is shown as viewed from the luminal side
of the membrane. The connections between the red pigment cluster on the right and position 9 in the adjacent
subunit are marked with grey lines. The new carotenoid site, L5, is shown in C. This site lines the gap between LHCI
and PSI and is therefore easily interchangeable. The distance between L5 and of chlorophylls 17 π systems is 3.7 A.
(E) Lhca3 is colored in red. A short helix segment from the first transmembrane helix is shown as sticks. Chlorophyll
3005 is part of the red-absorbing dimer. LHCII (PDB: 2BHW) was superimposed on the structure and shown in faint
grey. Chlorophyll 612 is shown as a ring. The coordinating side chain was changed from histidine 68 in LHCII to
asparagine 109 in Lhca3. Another important change is the leucine to glycine modification at position 105, which
Figure 6. continued on next page
Mazor et al. eLife 2015;4:e07433. DOI: 10.7554/eLife.07433 9 of 18
Research article Biophysics and structural biology | Plant biology

Lhca5 and indeed, arginine 209 of PsaF and glutamate 84 of Lhca4 form electrostatic interactions in
the middle of the hydrophobic binding site (Figure 5B). This residue is conserved in Lhca5 as well,
but absent from Lhca1-3 sequences, explaining the specificity of the interaction. The PsaF-Lhca4
interaction in the current structure does not include any pigments. Energy transfer from Lhca4 to the
core probably occurs through the Lhca1-PsaB pigment cluster or the Lhca2-PsaJ clusters. Lhca2 is
connected to the core almost exclusively through interactions with the N-terminus of PsaJ on the
stromal side of the membrane (Figure 5—figure supplement 1).
The main contact point of Lhca3 is in the N-terminus of PsaA, which contacts a small patch just before
helix 1 enters the membrane as in all other Lhcas (Figure 5C). The structure shows that this site is the
main determinant of Lhca binding to the core. In contrast to the previous PSI-LHCI model, Lhca3 follows
the general fold of LHCII (rmsd 0.8 A between the two apoproteins). Departures from the LHCII fold are
seen in key contact points where small loops were extended or deleted from the otherwise conserved
N-terminus domain to facilitate protein–protein interactions with the core (Figure 5C).
Energy transfer and photo-protection mechanisms in Lhca1/4 Lhca2/3heterodimersAll four Lhcas are remarkably similar to each other and to LHCII. Most of the differences between
them can be explained by their interaction partner, such as the loss of loop 23 in Lhca1 due to its
binding to PsaG.
Two key differences in pigment organization were found between lhcas and other lhcs. The extended
loop 23 supports a new chlorophyll-binding site (numbered 16), common to Lhca4 and Lhca2
(Figure 6A,B) and an additional chlorophyll site, coordinated by transmembrane helix two,
connects the two partners of each heterodimer.
Chlorophyll b pigments are bound by the different Lhca proteins to various extents and serve
as antennae pigments. Four binding sites for chlorophyll b were detected in the high resolution
structure of LHCII (Liu et al., 2004; Standfuss et al., 2005) as well as in the structure of CP29
(Pan et al., 2011). We were able to assign nine chlorophyll b sites in LHCI based on electron density
maps (Figure 6—figure supplement 1). All Lhca proteins contain a glutamine to glutamate change
(similarly to CP29) in equivalent positions to position 131 of LHCII, this change makes the binding of
Chlorophyll b less likely at three sites (10, 12 and 13). In agreement with this change we find that
site 12 is occupied by chlorophyll a in all Lhcas and sites 10 and 13 are occupied differentially.
The distribution of chlorophyll b sites in LHCI is markedly uneven, with three sites located in
Lhca2 (2010, 2011 and 2013), two sites found at Lhca1 (site 1009 and 1010), three sites at Lhca4
(4010, 4011 and 4013) and a single site on Lhca3 (site 3011). These findings are consistent with
mutational data which identified more chlorophyll b sites on Lhca2 then on Lhca3 (Castelletti et al.,
2003). Site 13 on Lhca1, 2 and 4 is probably a mixed site, which can accommodate both chlorophyll
a and chlorophyll b. The high number of chlorophyll b pigments in Lhca2 and the fact that its closest
connection to the core is mediated by chlorophyll b (site 2010, shown in Figure 4D) is consistent with
our suggestion that Lhca1 and Lhca3 are the main junctions for excitation energy transfer from LHCI to
the PSI core. The dipole orientations of all but two chlorophylls were identified in the current structure.
The most significant changes in LHCI compared to LHCII exist in two sites, 2009 and 4009, where 90˚
rotations are observed. Such a rotation is expected to impact the energy transfer processes within these
LHCI subunits but the significance of this change cannot be ascertained from the rotation alone.
Each of the two Lhca1/4 Lhca2/3 heterodimers contains a blue- and red-absorbing subunit.
The structures of Lhca3 and Lhca4 clearly show a coordinating asparagine residue unique to this
site (Arnoux et al., 2009). The configurations of the pigments themselves differed, with the red
Figure 6. Continued
allows chlorophyll 3005 to alter its ring orientation by approximately 12˚. (F) The same site in Lhca4 shown in a similar
fashion with Lhca4 colored in raspberry. The same basic coordination is observed, though the ring tilt is smaller
because of the alanine occupying position 95.
DOI: 10.7554/eLife.07433.013
The following figure supplement is available for figure 6:
Figure supplement 1. Identification of chlorophyll b molecules.
DOI: 10.7554/eLife.07433.014
Mazor et al. eLife 2015;4:e07433. DOI: 10.7554/eLife.07433 10 of 18
Research article Biophysics and structural biology | Plant biology
pigments of Lhca3 and Lhca4 tilted approximately 12˚ relative to their orientation in LHCII,
Lhca1, and Lhca2 due to a second change from a bulky leucine residue at position 64 of LHCII to
glycine and alanine in Lhca3 and Lhca4, respectively (Figure 6E,F). Additional connections that
stabilize LHCI are formed by three luteins at position L3. These luteins bridge the chlorophylls at
site 6 in Lhca1, Lhca3, and Lhca4 to PsaG, Lhca2, and Lhca1 (Figure 6A,B).
Photosynthetic eukaryotes respond to high light conditions by decreasing the efficiency of energy
transfer from the antennae in a process called NPQ. First discovered in the PSII complex, NPQ was
recently reported in PSI. NPQ sites are located on LHC proteins bound by the hydroxylated
carotenoid zeaxanthin, which quenches harmful chlorophyll triplets (Standfuss et al., 2005).
The main excitonic connections in the two Lhca dimers appear to be intimately linked to NPQ.
A new chlorophyll site (numbered 17) coordinated by a histidine residue (histidine 150 in Lhca4
and histidine 170 in lhca3) is located at the heterodimer interface of both Lhca1/4 and Lhca2/3.
Site 17 links the putative red chlorophyll pair with site 9 of the adjacent complex. In the Lhca1/4
interface, a new carotenoid site (numbered 4505 or L5) forms co-planar π systems (plane to plane
distance 3.7 A) with the ring of chlorophyll 4017, positioning it in a configuration that should
provide efficient photo-protection from chlorophyll triplets (Figure 6C,D). We propose that this is also
the site of NPQ in LHCI, and this fits well with the experimental observation (Standfuss et al., 2005) that
the zeaxanthin responsible for NPQ is located near the red pair in the PSI-LHCI luminal gap region.
In response to lumen acidification, zeaxanthin is synthesized from violaxanthin by violaxanthin
deepoxidase (VDE) as part of the xanthophyll cycle. Both the activity and location of VDE are
regulated by pH changes (Ballottari et al., 2014). At low pH, VDE is activated and binds the
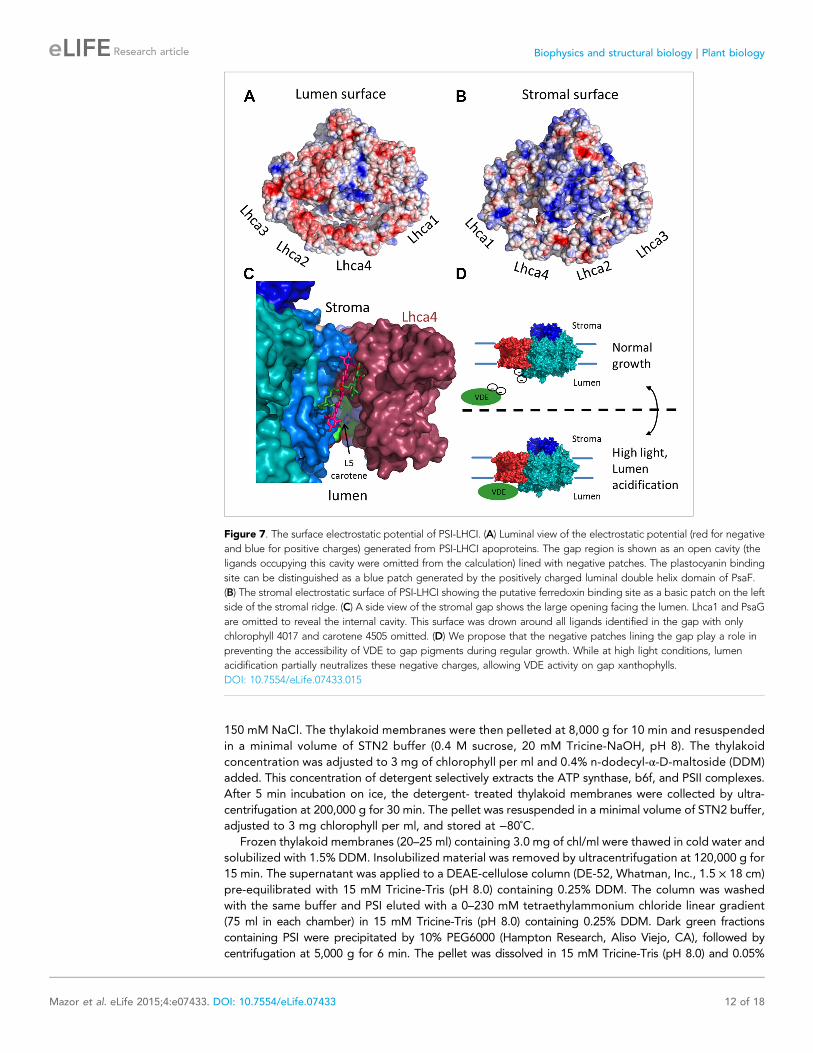
luminal side of the membrane, gaining access to its substrate. On the luminal side, a large gap
(25 A) separates LHCI from the core. This gap stems from the fact that most of the connections
between LHCI and PSI are located at the stromal side (seen in Figure 7C, also compare
Figure 5A and Figure 5—figure supplement 1), leaving the luminal side open.
The complete modeling of LHCI side chains shows that the luminal side of PSI-LHCI contains patches
of negative potential distributed on both sides of the PSI-LHCI gap (Figure 7). We suggest that the
negative charge characteristic of the luminal side of PSI-LHCI is an important feature regulating the
accessibility of VDE to the PSI-LHCI gap. Under low light conditions, the relatively high luminal pH will
result in strong repulsive forces between these negative patches and the acidic domain of VDE,
preventing VDE from binding to PSI. Under high light, acidification of lumen, which is known to trigger
VDE activity, will result in partial neutralization of these patches and allow VDE access to the PSI-LHCI
gap regions (Arnoux et al., 2009) (Figure 7D). Carotene L4505 is ideally positioned to be exchanged
easily via this mechanism (Figure 7C). Ligands, which are easily exchangeable, are particularly labile and
may disassociate from the complex during its purification, accounting for a lack of a second carotene
bound at the analogous position in Lhca3. In the current structure, position L5 is occupied with
zeaxanthin; however, the pigment assignment cannot be definite, even at the current resolution.
In this work we presented the most complete plant PSI-LHCI structure obtained thus far, revealing
the locations of and interactions among its protein subunits and more than 200 non-covalently bound
photochemical cofactors. Using the new crystal structure, we examined the network of contacts
among the protein subunits from a structural perspective, which provide the basis for elucidating the
functional organization of the complex.
Materials and methods
Purification of plant PSIPea seeds (Pisum sativum var. Kalvadon) were washed with running water for 6–8 hr and seeded in
a vermiculite tray. Plants were germinated in the dark at 22˚C for 5 days in shaded sunlight or the dark.
After germination, the plants were grown for an additional 10 days under cool-white fluorescent light
at a photon flux density of 90–130 μE m−2 s−1 in a 14 hr light/10 hr dark cycle at 22˚C. Approximately
200 g of leaves were ground for 25 s in a blender with 1000 ml of ice-cold solution containing
0.3 M sucrose, 15 mM NaCl, 30 mM Tricine-NaOH (pH 8), 1 mM PMSF, 15 μM leupeptin, and 1 μMpepstatin A. The slurry was filtered through eight layers of cheesecloth and chloroplasts pelleted by
centrifugation at 1000 g for 9 min. The pellet was suspended in 500 ml of hypotonic medium (10 mM
Tricine-NaOH, pH 8) to disrupt the chloroplasts. Thylakoids were collected by centrifugation at
12,000 g for 10 min and resuspended in 500 ml of buffer containing 10 mM Tricine-NaOH (pH 8) and
Mazor et al. eLife 2015;4:e07433. DOI: 10.7554/eLife.07433 11 of 18
Research article Biophysics and structural biology | Plant biology
150 mM NaCl. The thylakoid membranes were then pelleted at 8,000 g for 10 min and resuspended
in a minimal volume of STN2 buffer (0.4 M sucrose, 20 mM Tricine-NaOH, pH 8). The thylakoid
concentration was adjusted to 3 mg of chlorophyll per ml and 0.4% n-dodecyl-α-D-maltoside (DDM)
added. This concentration of detergent selectively extracts the ATP synthase, b6f, and PSII complexes.
After 5 min incubation on ice, the detergent- treated thylakoid membranes were collected by ultra-
centrifugation at 200,000 g for 30 min. The pellet was resuspended in a minimal volume of STN2 buffer,
adjusted to 3 mg chlorophyll per ml, and stored at −80˚C.Frozen thylakoid membranes (20–25 ml) containing 3.0 mg of chl/ml were thawed in cold water and
solubilized with 1.5% DDM. Insolubilized material was removed by ultracentrifugation at 120,000 g for
15 min. The supernatant was applied to a DEAE-cellulose column (DE-52, Whatman, Inc., 1.5 × 18 cm)
pre-equilibrated with 15 mM Tricine-Tris (pH 8.0) containing 0.25% DDM. The column was washed
with the same buffer and PSI eluted with a 0–230 mM tetraethylammonium chloride linear gradient
(75 ml in each chamber) in 15 mM Tricine-Tris (pH 8.0) containing 0.25% DDM. Dark green fractions
containing PSI were precipitated by 10% PEG6000 (Hampton Research, Aliso Viejo, CA), followed by
centrifugation at 5,000 g for 6 min. The pellet was dissolved in 15 mM Tricine-Tris (pH 8.0) and 0.05%
Figure 7. The surface electrostatic potential of PSI-LHCI. (A) Luminal view of the electrostatic potential (red for negative
and blue for positive charges) generated from PSI-LHCI apoproteins. The gap region is shown as an open cavity (the
ligands occupying this cavity were omitted from the calculation) lined with negative patches. The plastocyanin binding
site can be distinguished as a blue patch generated by the positively charged luminal double helix domain of PsaF.
(B) The stromal electrostatic surface of PSI-LHCI showing the putative ferredoxin binding site as a basic patch on the left
side of the stromal ridge. (C) A side view of the stromal gap shows the large opening facing the lumen. Lhca1 and PsaG
are omitted to reveal the internal cavity. This surface was drown around all ligands identified in the gap with only
chlorophyll 4017 and carotene 4505 omitted. (D) We propose that the negative patches lining the gap play a role in
preventing the accessibility of VDE to gap pigments during regular growth. While at high light conditions, lumen
acidification partially neutralizes these negative charges, allowing VDE activity on gap xanthophylls.
DOI: 10.7554/eLife.07433.015
Mazor et al. eLife 2015;4:e07433. DOI: 10.7554/eLife.07433 12 of 18
Research article Biophysics and structural biology | Plant biology

DDM. The green solution was applied to a 10–35% sucrose gradient containing the same buffer and
centrifuged using the SW-40 rotor (Beckman Coulter, Fullerton, CA) at 37,000 rpm (170,000 g) for 16 hr.
The wide green band containing PSI was collected and loaded onto a second DEAE-cellulose column (0.5
× 4 cm) pre-equilibrated with 15 mM Tricine-Tris (pH 8.0) and 0.05% DDM, mainly to concentrate it for
a second sucrose gradient. PSI was eluted with 230 mM tetraethylammonium chloride. The
collected dark green fraction was applied to a 10–35% sucrose gradient and centrifuged at 57,000
rpm (330,000 g) for 4 hr using an SW-60 rotor (Beckman Coulter). Purified PSI appeared as a dark
band in the middle of the tube, but only the central part of the band was collected. The material
was precipitated with 15% PEG1500 and 100 mM tetraethylammonium chloride and centrifuged at
10,000 g for 4 min. The pellet was dissolved in a solution containing 2 mM Tricine (pH 8.75) and 0.02%
n-dodecyl-β-D-thiomaltoside (DTM, Glycon Biochemicals, Luckenwalde, Germany) and adjusted to
a chlorophyll concentration of 2.5 mg/ml.
PSI crystallization and cryogenic protectionCrystallization was performed manually in 24-well plates using the sitting drop variant of the
vapor-diffusion technique at 4˚C (Charles Super Company, Natick, MA). Aliquots (6–8 μl) of PSIsolution were mixed with equal volumes of reservoir solution (50 mM di-potassium phosphate, 50
Table 1. Data collection and refinement statistics
Data collection
Beamline BESSY PX14.1 SLS PXI−X06SA ESRF ID 23-2
Wavelength (A) 1.73 1.74 0.873
Resolution (A) 40−2.8 (2.85–2.8) 40−2.8 (2.85−2.8) 50−3 (3.1−3)
Space group P212121 P212121 P21
Unit cell dimensions
a, b, c (A) 188.7, 200.8, 212.4 188.6, 201.3, 212.7 120.6, 189.2, 129.7
α, β, γ 90, 90, 90 90, 90, 90 90, 91.1, 90
Measured reflections 7,831,302 14,841,310 724,010
Unique reflections 198,911 200,218 116,039
Rpim (%) 0.051 (1.276) 0.030 (0.180) 0.099 (0.812)
<I/σ(I)> 10.5 (1.2) 13.4 (1.4) 5.8 (1.3)
Completeness (%) 99.9 (98.4) 99.9 (98.4) 99.9 (99.2)
Redundancy 39.9 (37) 74.1 (33.4) 6.2 (5.4)
Refinement statistics
Resolution (A) 40−2.8 40−2.8 50−3
Rwork/Rfree 25.6/26.5 24/25.2 25.8/29.3
No. of chains 16 16 17
No. of ligands 214 214 197
Average B-factor (A2) 98.7 112 96.6
R.M.S deviations
Bond angles 1.9 2 2.4
Bond lengths 0.004 0.005 0.011
Ramachandran statistics
Favoured region % 90.2 90.2 86.6
Allowed region % 7.1 7.1 8.7
Outlier region % 2.7 2.7 4.7
Data collection, scaling and merging statistics were calculated using XDS, AIMLESS and PHENIX XTRIAGE.
Refinement statistics are from PHENIX.
DOI: 10.7554/eLife.07433.016
Mazor et al. eLife 2015;4:e07433. DOI: 10.7554/eLife.07433 13 of 18
Research article Biophysics and structural biology | Plant biology

mM Tris [pH 8], 12–17% PEG400, 1% glycerol, 2 mM L-glutathione, and 0.03% octyl glucose
neopentyl glycol) and equilibrated against 0.5 ml of reservoir solution. Dark green rectangular
crystals appeared after 3 days at the higher PEG concentrations, but the best diffracting crystals
appeared after 1 month at the lower PEG concentrations.
For cryogenic protection, the crystals were moved to a solution containing 50 mM di-potassium
phosphate, 50 mM Tris (pH 8), 20% PEG400, 2% glycerol, and 2 mM L-glutathione. After a brief
incubation the crystals were soaked sequentially in the same buffer containing 5% and 10% glycerol
and immediately frozen in liquid nitrogen. X-ray diffraction data were collected at the European
Synchrotron Radiation Facility (ID23- 2, ID23-1, ID-29 and MASSIF-3), the Swiss Light Source (PXI, PXII,
and PXIII), and BESSYII.
Data collection and processingImages were collected at 0.1˚ oscillation using full beam at exposures of 0.1–0.05 s. The large size of
the crystals helped mitigate the effect of radiation damage, yet only 60˚–90˚ of data were collected
from each crystal using constant translation of the crystal in the beam. Images were integrated
using XDS (Kabsch, 2010) and scaled with XSCALE or AIMLESS (Evans and Murshudov, 2013).
Measurements were carried out at the peak of the iron fluorescence scan. Individual datasets
generally had I/SIGMA values of ∼1 at 3.1 A with CC1/2 values of ∼0.5 calculated by XDS. To obtain
a more accurate measure of weak reflections, we combined several datasets measured under similar
conditions. This combination was possible because of the consistency of the new crystals. The most
effective method for combining datasets was to simply choose the sets with the strongest statistics
at lower resolutions, and these crystals were also very similar to each other in terms of their unit cell
dimensions. The unified datasets contained 40–100 independent measurements of each reflection
with I/SIGMA of ∼1.5 at 2.8 A and CC1/2 of ∼0.4 at the same resolution (Table 1). The CCanomalous
calculated by XDS or AIMLESS was ∼0.3 at 6 A. Some individual datasets had measurable
anomalous signals (CCanomalous > 0.3) to 4.5 A, but the final quality of phases was similar, as
Table 2. Amino acid changes between PSI-LHCI structures
Subunit Number of amino acids
Modeled amino acids
Number of changes4Y28 2WSC
PsaA 758 741 729 1
PsaB 734 732 732 1
PsaC 81 80 81 1
PsaD* 156 140 135 5
PsaE* 92 68 65 9
PsaF* 154 150 154 18
PsaG* 98 95 95 15
PsaH* 95 84 69 11
PsaJ* 42 41 42 5
PsaK* 134 79 85 10
PsaL* 168 160 161 21
Lhca1* 204 193 165 12
Lhca2 256 206 176 3
Lhca3 242 210 162 16
Lhca4 252 197 166 3
The number of modeled amino acids in each subunit is shown and compared to the most recent PSI-LHCI structure
(2WSC). Insertions, deletions and extensions are counted as a single change. Since the genome sequence of Pisum
Sativum is not completely known (genes with no DNA data are marked with an *) we relied on high-throughput
mRNA sequence data for verification (Franssen et al., 2011).
DOI: 10.7554/eLife.07433.017
Mazor et al. eLife 2015;4:e07433. DOI: 10.7554/eLife.07433 14 of 18
Research article Biophysics and structural biology | Plant biology
judged by the figure of merit for substructures from PHASER runs (typically ∼0.6 [McCoy et al., 2007])
and visual inspection of the maps.
Phasing and refinementThe crystals were initially solved by molecular replacement (MR) with a partial model containing only
the reaction center subunits with chlorophylls modeled as rings using PHASER. This solution was
used to place the three iron-sulfur clusters, which were subsequently used as the initial substructure
for locating additional sites. These initial runs located approximately 40 sites of the 100 that were
eventually modeled. Phases were improved using DM (Cowtan, 1994), and the resulting maps
showed most of the transmembrane helices of the reaction center with 11 transmembrane helices of
LHCI (missing helix 2 of Lhca3). To improve the phases, information from the visible parts of the
reaction center was incorporated as a partial MR solution. This model included the 22 transmembrane
helices of PsaA and PsaB, the PsaC subunit, and chlorophyll rings, omitting all of the loops from the
proteins. From the maps generated in this step, we proceeded to build the model using Coot
(Emsley et al., 2010) and used the modified phases as restraints during refinement in either PHENIX
(Adams et al., 2010) or REFMAC (Murshudov et al., 1997). At various points during the refinement
process, the phases were recalculated with the newly modeled sites using PHASER and including the
improved model (Read and McCoy, 2011). Final runs identified 99 sites, 89 of them present in the
model. The final model refined to an R-free of 25.2% with 3% Ramachandran outliers, a considerable
decrease from previous values (Table 1). A complete model for the lhca subunits of LHCI was obtained,
as well as extensions and modifications to some of the other PSI subunits (Table 2). Images were
created using Pymol and electrostatic surfaces calculated using APBS (Baker et al., 2001).
AcknowledgementsThe authors would like to thank the ESRF, SLS and BESSYII synchrotrons for beam time and the staff
scientists for excellent guide and assistance as well as to the MASSIF beamline team in ESRF.
We would like to thank Prof Martin Kupiec and Dr Ofer Rog for their critical reading of the manuscript.
This work is supported by a grant no. 293579—HOPSEP from the European Research Council, The Israel
Science Foundation through grant No. 71/14 and by the I-CORE Program of the Planning and
Budgeting Committee and The Israel Science Foundation (grant No 1775/12).
Additional information
Funding
Funder Author
European Research Council (ERC) Yuval Mazor, Nathan Nelson
Israel Science Foundation (ISF) Anna Borovikova
The funders had no role in study design, data collection and interpretation, or thedecision to submit the work for publication.
Author contributions
YM, NN, Conception and design, Acquisition of data, Analysis and interpretation of data, Drafting or
revising the article; AB, Acquisition of data, Drafting or revising the article
Additional files
Major datasetThe following dataset was generated:
Author(s) YearDatasettitle
Dataset IDand/or URL
Database, license, andaccessibility information
Mazor Y, Brovikov A,Nelson N
2015 TBD http://www.rcsb.org/pdb/search/structidSearch.do?structureId=4Y28
Publicly available at RCSBProtein Data Bank (AccessionNo: 4Y28).
Mazor et al. eLife 2015;4:e07433. DOI: 10.7554/eLife.07433 15 of 18
Research article Biophysics and structural biology | Plant biology
ReferencesAdams PD, Afonine PV, Bunkoczi G, Chen VB, Davis IW, Echols N, Headd JJ, Hung LW, Kapral GJ, Grosse-Kunstleve RW, McCoy AJ, Moriarty NW, Oeffner R, Read RJ, Richardson DC, Richardson JS, Terwilliger TC, ZwartPH. 2010. PHENIX: a comprehensive Python-based system for macromolecular structure solution. ActaCrystallographica. Section D, Biological Crystallography 66:213–221. doi: 10.1107/S0907444909052925.
Amunts A, Drory O, Nelson N. 2007. The structure of a plant photosystem I supercomplex at 3.4 A resolution.Nature 447:58–63. doi: 10.1038/nature05687.
Amunts A, Toporik H, Borovikova A, Nelson N. 2010. Structure determination and improved model of plantphotosystem I. The Journal of Biological Chemistry 285:3478–3486. doi: 10.1074/jbc.M109.072645.
Arnoux P, Morosinotto T, Saga G, Bassi R, Pignol DA. 2009. Structural basis for the pH-dependent xanthophyllcycle in Arabidopsis thaliana. Plant Cell 21:2036–2044. doi: 10.1105/tpc.109.068007.
Baker NA, Sept D, Joseph S, Holst MJ, McCammon JA. 2001. Electrostatics of nanosystems: application tomicrotubules and the ribosome. Proceedings of the National Academy of Sciences of USA 98:10037–10041.doi: 10.1073/pnas.181342398.
Ballottari M, Alcocer MJ, D’Andrea C, Viola D, Ahn TK, Petrozza A, Polli D, Fleming GR, Cerullo G, Bassi R. 2014.Regulation of photosystem I light harvesting by zeaxanthin. Proceedings of the National Academy of Sciences ofUSA 111:2431–2438. doi: 10.1073/pnas.1404377111.
Barber J. 2004. Engine of life and big bang of evolution: a personal perspective. Photosynthesis Research 80:137–155. doi: 10.1023/B:PRES.0000030662.04618.27.
Bellafiore S, Barneche F, Peltier G, Rochaix JD. 2005. State transitions and light adaptation require chloroplastthylakoid protein kinase STN7. Nature 433:892–895. doi: 10.1038/nature03286.
Ben-Shem A, Frolow F, Nelson N. 2003. The crystal structure of plant photosystem I. Nature 426:630–635. doi: 10.1038/nature02200.
Berera R, van Stokkum IH, d’Haene S, Kennis JT, van Grondelle R, Dekker JP. 2009. A mechanism of energydissipation in cyanobacteria. Biophysical Journal 96:2261–2267. doi: 10.1016/j.bpj.2008.12.3905.
Blankenship RE. 1992. Origin and early evolution of photosynthesis. Photosynthesis Research 33:91–111. doi: 10.1007/BF00039173.
Bottin H, Mathis P. 1985. Interaction of plastocyanin with the photosystem I reaction center: a kinetic study by flashabsorption spectroscopy. Biochemistry 24:6453–6460. doi: 10.1021/bi00344a022.
Busch A, Hippler M. 2011. The structure and function of eukaryotic photosystem I. Biochimica et Biophysica Acta1807:864–877. doi: 10.1016/j.bbabio.2010.09.009.
Castelletti S, Morosinotto T, Robert B, Caffarri S, Bassi R, Croce R. 2003. Recombinant Lhca2 and Lhca3 subunits ofthe photosystem I antenna system. Biochemistry 42:4226–4234. doi: 10.1021/bi027398r.
Cowtan K. 1994. ’dm’: an automated procedure for phase improvement by density modification. Joint CCP4 andESF-EACBM Newsletter on Protein Crystallography 31:34.
Croce R, van Amerongen H. 2013. Light-harvesting in photosystem I. Photosynthesis Research 116:153–166.doi: 10.1007/s11120-013-9838-x.
de Bianchi S, Ballottari M, Dall’osto L, Bassi R. 2010. Regulation of plant light harvesting by thermal dissipation ofexcess energy. Biochemical Society Transactions 38:651–660. doi: 10.1042/BST0380651.
Emsley P, Lohkamp B, Scott WG, Cowtan K. 2010. Features and development of Coot. Acta Crystallographica.Section D, Biological Crystallography 66:486–501. doi: 10.1107/S0907444910007493.
Engelken J, Brinkmann H, Adamska I. 2010. Taxonomic distribution and origins of the extended LHC (light-harvestingcomplex) antenna protein superfamily. BMC Evolutionary Biology 10:233. doi: 10.1186/1471-2148-10-233.
Evans PR, Murshudov GN. 2013. How good are my data and what is the resolution? Acta Crystallographica. SectionD, Biological Crystallography 69:1204–1214. doi: 10.1107/S0907444913000061.
Ferreira KN, Iverson TM, Maghlaoui K, Barber J, Iwata S. 2004. Architecture of the photosynthetic oxygen-evolving center. Science 303:1831–1838. doi: 10.1126/science.1093087.
Franssen SU, Shrestha RP, Brautigam A, Bornberg-Bauer E, Weber AP. 2011. Comprehensive transcriptomeanalysis of the highly complex Pisum sativum genome using next generation sequencing. BMC Genomics 12:227.doi: 10.1186/1471-2164-12-227.
Hippler M, Drepper F, Farah J, Rochaix JD. 1997. Fast electron transfer from cytochrome c6 and plastocyanin tophotosystem I of Chlamydomonas reinhardtii requires PsaF. Biochemistry 36:6343–6349. doi: 10.1021/bi970082c.
Hippler M, Drepper F, Haehnel W, Rochaix JD. 1998. The N-terminal domain of PsaF: precise recognition site forbinding and fast electron transfer from cytochrome c6 and plastocyanin to photosystem I of Chlamydomonasreinhardtii. Proceedings of the National Academy of Sciences of USA 95:7339–7344. doi: 10.1073/pnas.95.13.7339.
Jordan P, Fromme P, Witt HT, Klukas O, Saenger W, Krauss N. 2001. Three-dimensional structure of cyanobacterialphotosystem I at 2.5 A resolution. Nature 411:909–917. doi: 10.1038/35082000.
Kabsch W. 2010. XDS. Acta Crystallographica. Section D, Biological Crystallography 66:125–132. doi: 10.1107/S0907444909047337.
Kargul J, Turkina MV, Nield J, Benson S, Vener AV, Barber J. 2005. Light-harvesting complex II protein CP29 bindsto photosystem I of Chlamydomonas reinhardtii under State 2 conditions. The FEBS Journal 272:4797–4806.doi: 10.1111/j.1742-4658.2005.04894.x.
Kouril R, Zygadlo A, Arteni AA, de Wit CD, Dekker JP, Jensen PE, Scheller HV, Boekema EJ. 2005. Structuralcharacterization of a complex of photosystem I and light-harvesting complex II of Arabidopsis thaliana.Biochemistry 44:10935–10940. doi: 10.1021/bi051097a.
Mazor et al. eLife 2015;4:e07433. DOI: 10.7554/eLife.07433 16 of 18
Research article Biophysics and structural biology | Plant biology

Kuhlgert S, Drepper F, Fufezan C, Sommer F, Hippler M. 2012. Residues PsaB Asp612 and PsaB Glu613 ofphotosystem I confer pH-dependent binding of plastocyanin and cytochrome c(6). Biochemistry 51:7297–7303.doi: 10.1021/bi300898j.
Kurisu G, Zhang H, Smith JL, Cramer WA. 2003. Structure of the cytochrome b6f complex of oxygenicphotosynthesis: tuning the cavity. Science 302:1009–1014. doi: 10.1126/science.1090165.
Liu Z, Yan H, Wang K, Kuang T, Zhang J, Gui L, An X, Chang W. 2004. Crystal structure of spinach major light-harvesting complex at 2.72 A resolution. Nature 428:287–292. doi: 10.1038/nature02373.
Loll B, Kern J, Saenger W, Zouni A, Biesiadka J. 2005. Towards complete cofactor arrangement in the 3.0 Aresolution structure of photosystem II. Nature 438:1040–1044. doi: 10.1038/nature04224.
Lucinski R, Schmid VH, Jansson S, Klimmek F. 2006. Lhca5 interaction with plant photosystem I. FEBS Letters 580:6485–6488. doi: 10.1016/j.febslet.2006.10.063.
Lunde CP, Jensen PE, Haldrup A, Knoetzel J, Scheller HV. 2000. The PSI-H subunit of photosystem I is essential forstate transitions in plant photosynthesis. Nature 408:613–615. doi: 10.1038/35046121.
Mazor Y, Greenberg I, Toporik H, Beja O, Nelson N. 2012. The evolution of photosystem I in light of phage-encoded reaction centers. Philosophical Transactions of the Royal Society of London. Series B, Biological Sciences367:3400–3405. doi: 10.1098/rstb.2012.0057.
Mazor Y, Nataf D, Toporik H, Nelson N. 2014. Crystal structures of virus-like photosystem I complexes from themesophilic cyanobacterium Synechocystis PCC 6803. eLife 3:e01496. doi: 10.7554/eLife.01496.
McCoy AJ, Grosse-Kunstleve RW, Adams PD, Winn MD, Storoni LC, Read RJ. 2007. Phaser crystallographicsoftware. Journal of Applied Crystallography 40:658–674. doi: 10.1107/S0021889807021206.
Morosinotto T, Ballottari M, Klimmek F, Jansson S, Bassi R. 2005. The association of the antenna system tophotosystem I in higher plants. Cooperative interactions stabilize the supramolecular complex and enhance red-shifted spectral forms. The Journal of Biological Chemistry 280:31050–31058. doi: 10.1074/jbc.M502935200.
Murshudov GN, Vagin AA, Dodson EJ. 1997. Refinement of macromolecular structures by the maximum-likelihoodmethod. Acta Crystallographica. Section D, Biological Crystallography 53:240–255. doi: 10.1107/S0907444996012255.
Nelson N, Ben-Shem A. 2004. The complex architecture of oxygenic photosynthesis. Nature Reviews. MolecularCell Biology 5:971–982. doi: 10.1038/nrm1525.
Nelson N, Junge W. 2015. Structure and energy transfer in photosystems of oxygenic photosynthesis. AnnualReview of Biochemistry 84:659–683. doi: 10.1146/annurev-biochem-092914-041942.
Nelson N, Yocum C. 2006. Structure and function of photosystems I and II. Annual Review of Plant Biology 57:521–565. doi: 10.1146/annurev.arplant.57.032905.105350.
Nelson N. 2011. Photosystems and global effects of oxygenic photosynthesis. Biochimica et Biophysica Acta 1807:856–863. doi: 10.1016/j.bbabio.2010.10.011.
Nelson N. 2013. Evolution of photosystem I and the control of global enthalpy in an oxidizing world.Photosynthesis Research 116:145–151. doi: 10.1007/s11120-013-9902-6.
Pan X, Li M, Wan T, Wang L, Jia C, Hou Z, Zhao X, Zhang J, Chang W. 2011. Structural insights into energyregulation of light-harvesting complex CP29 from spinach. Nature Structural & Molecular Biology 18:309–315.doi: 10.1038/nsmb.2008.
Read RJ, McCoy AJ. 2011. Using SAD data in phaser. Acta Crystallographica. Section D, Biological Crystallography67:338–344. doi: 10.1107/S0907444910051371.
Rochaix JD. 2011. Assembly of the photosynthetic apparatus. Plant Physiology 155:1493–1500. doi: 10.1104/pp.110.169839.
Rochaix JD, Lemeille S, Shapiguzov A, Samol I, Fucile G, Willig A, Goldschmidt-Clermont M. 2012. Protein kinasesand phosphatases involved in the acclimation of the photosynthetic apparatus to a changing light environment.Philosophical Transactions of the Royal Society of London. Series B, Biological Sciences 367:3466–3474. doi: 10.1098/rstb.2012.0064.
Scheller HV, Jensen PE, Haldrup A, Lunde C, Knoetzel J. 2001. Role of subunits in eukaryotic Photosystem I.Biochimica et Biophysica Acta 1507:41–60. doi: 10.1016/S0005-2728(01)00196-7.
Sommer F, Drepper F, Haehnel W, Hippler M. 2006. Identification of precise electrostatic recognition sitesbetween cytochrome c6 and the photosystem I subunit PsaF using mass spectrometry. The Journal of BiologicalChemistry 281:35097–35103. doi: 10.1074/jbc.M607384200.
Standfuss J, Terwisscha van Scheltinga AC, Lamborghini M, Kuhlbrandt W. 2005. Mechanisms of photoprotectionand nonphotochemical quenching in pea light-harvesting complex at 2.5 A resolution. The EMBO Journal 24:919–928. doi: 10.1038/sj.emboj.7600585.
Stroebel D, Choquet Y, Popot JL, Picot D. 2003. An atypical haem in the cytochrome b6f complex. Nature 426:413–418. doi: 10.1038/nature02155.
Toporik H, Carmeli I, Volotsenko I, Molotskii M, Rosenwaks Y, Carmeli C, Nelson N. 2012. Large photovoltagegenerated by plant photosystem I crystals. Advanced Materials 24:2988–2991. doi: 10.1002/adma.201200039.
Umena Y, Kawakami K, Shen JR, Kamiya N. 2011. Crystal structure of oxygen-evolving photosystem II ata resolution of 1.9 A. Nature 473:55–60. doi: 10.1038/nature09913.
Wahadoszamen M, D’Haene S, Ara AM, Romero E, Dekker JP, Grondelle RV, Berera R. 2015. Identification ofcommon motifs in the regulation of light harvesting: the case of cyanobacteria IsiA. Biochimica et Biophysica Acta1847:486–492. doi: 10.1016/j.bbabio.2015.01.003.
Wientjes E, Oostergetel GT, Jansson S, Boekema EJ, Croce R. 2009. The role of Lhca complexes in thesupramolecular organization of higher plant photosystem I. The Journal of Biological Chemistry 284:7803–7810.doi: 10.1074/jbc.M808395200.
Mazor et al. eLife 2015;4:e07433. DOI: 10.7554/eLife.07433 17 of 18
Research article Biophysics and structural biology | Plant biology

Wientjes E, Roest G, Croce R. 2012. From red to blue to far-red in Lhca4: how does the protein modulate thespectral properties of the pigments? Biochimica et Biophysica Acta 1817:711–717. doi: 10.1016/j.bbabio.2012.02.030.
Zhang S, Scheller HV. 2004. Light-harvesting complex II binds to several small subunits of photosystem I. TheJournal of Biological Chemistry 279:3180–3187. doi: 10.1074/jbc.M311640200.
Mazor et al. eLife 2015;4:e07433. DOI: 10.7554/eLife.07433 18 of 18
Research article Biophysics and structural biology | Plant biology