Embed Size (px)
Citation preview
The struggle to belong
Dealing with diversity in the 21st century urban settings.
Amsterdam, 7 – 9 July 2011
Non-metropolitan Residential Gated Developments in
the Western Cape Province, South Africa
Manfred Spocter
Paper presented at the International RC21 conference 2011
Session: No. RT7.1 ‘Gated communities’ from a global perspective
Council for Scientific and Industrial Research (CSIR)
PO Box 320, Stellenbosch, South Africa, 7599
Department of Geography and Environmental Studies, Stellenbosch University
Private Bag X1, Stellenbosch, South Africa, 7599

2
Abstract
Gated developments are a global phenomenon that has become an ubiquitous feature of the
post-apartheid South African urban landscape. Gated developments and the privatisation of
urban public space in South Africa has been the subject of academic scrutiny since the turn of the
century. However, the vast majority of academic research the world over has tended to focus on
gated developments as an urban phenomenon. There are very few international studies that
investigate gated developments in the non-metropolitan locale and the topic is also unexplored in
the South African context. This research attempts to address this research gap by investigating
the locations of gated developments in non-metropolitan towns of varying sizes in the Western
Cape and the conditions that favour its proliferation in towns. Security is a synonymous, central
theme of gated developments. Thus, the security features in non-metropolitan gated
developments are analysed – some non-metropolitan gated developments do not have gates! In
addition, study also focuses on the security level index in each town and investigates the
locational aspects of differing levels of security in various towns.

3
1. Introduction
Gated developments are altering the way in which metropolitan areas are being administratively,
socially, politically and economically organised. Gated developments have become a ubiquitous
feature on the contemporary South African metropolitan landscape (Durington, 2006; Hook and
Vrdoljak, 2002; Landman, 2000). A large, worldwide volume of research has been done on gated
developments. A common thread amongst the large majority of the research conducted globally
is that the focus is on gated developments in metropolitan areas, in cities across the globe. It is
acknowledged that definitions of what constitutes ‘metropolitan’ and ‘non-metropolitan’ vary
between countries and regions, yet very few studies have specifically researched gated
developments in the non-metropolitan sphere (Mittelsteadt, 2003). In South Africa, as in many
others countries, gated developments have expanded their spatial manifestation beyond the
borders of South Africa’s metropolitan areas. In spite of this, residential non-metropolitan gated
developments remain under-researched. This paper investigated the categorisation and location
of non-metropolitan gated developments as well as its security aspects.
2. Conceptualisation considerations
There exist problematic aspects in utilising the word ‘rural’ in terms of this study as it includes
gated residential estates within settlement borders and on land previously used for agricultural
purposes. The debate is whether such settlements, with diverse characteristics, could be deemed
to be ‘rural’. Thus, the conceptualisation and clarification of the terms ‘metropolitan’ and ‘non-
metropolitan’ is important in order to best describe the study area.
2.1 Metropolitan vs non-metropolitan
This paper investigates aspects of gated residential security estates that are found outside the
urban or metropolitan sphere. The dialectical opposite of urban would be rural, but in reality this
dualism is not that simplistic. The preference for the use of the term ‘non-metropolitan gated
residential estates’ rather than ‘rural gated residential estates’ necessitates an exploration and
explanation.
The problem with defining ‘rural’ lies in the fact that one finds a mixing of ‘urban’ and ‘rural’
functions across space. In addition, static borders of designated space are not viable given the
cross-cutting and integrated nature of rural and urban functions, which further problematises the
quest for suitable definitions of urban and rural. All settlements undergo temporal changes of its
size, extent and nature; and this has blurred the urban-rural difference with one-dimensional
classification of settlements being brought into question (Champion and Hugo, 2005). As an
example, in the United Kingdom, the concept of ‘rural’ is largely viewed as land-based in terms of

4
what is produced or extracted, be it animal, vegetable or mineral; and where the lives of people
are intertwined with the aforementioned productive and extractive activities (Halfacree, 2006).
However, these activities are present in urban areas as well. It could be argued that metropolitan
areas receive the bulk of their resources from outside its borders, whilst the bulk on non-
metropolitan resources tends to be sourced locally. However, with all-reaching modern resource
distribution systems, one can find the same product in both metropolitan areas as well as non-
metropolitan areas. Further to this, Brown and Cromartie (2005) believe that a multi-dimensional
concept of rurality should include social, economic and demographic variables.
South Africa has seen a number of studies that tie the concept of rural to population-based
definitions. The Centre for Development and Enterprise (1996) recognises small towns (in rural
areas) as those with having a population of fewer that 50 000 persons. The CSIR (1999) divided
six settlements types between the broad categories of urban and rural. This typology, based on
population size and location, classifies small towns as rural settlements with a population of less
than 50 000 inhabitants. Statistics South Africa (2003), in its still ongoing discussion on the
definition of the concepts of urban and rural, quotes the Municipal Demarcation Board in stating
that the Constitution (Act 108 of 1996) and Municipal Structures Act (Act 117 of 1998) do not
make provision for the definition of these concepts. There is thus no agreed, robust and clear
definition of the term ‘rural’ in South Africa. The absence of a definition results in “the term (being)
used loosely for different purposes and this causes confusion” (Rural Doctors Association of
Southern Africa, 2006, p.4).
Given the current conundrum that exists with the definition of what constitutes a ‘rural’ place in
South Africa, and given the focus of this research on gated residential security estates outside the
metropolitan area of the province of the Western Cape, a clearer divide is required to delineate
the study area. Whilst the Municipal Structures Act (Act 117 of 1998) does not provide for the
definition of ‘urban’ and ‘rural’, it does have a politico-administrative definition based on a
particular tier of government. The Constitution (Act 108 of 1996) makes provision for the
establishment of metropolitan areas in South Africa. This process is facilitated by the Municipal
Demarcation Act (Act 28 of 1998) which provides for the criteria and procedures for the
determination of municipal boundaries by an independent authority, namely, the Municipal
Demarcation Board. There are six metropolitan municipalities that have been determined by the
Municipal Demarcation Board, of which one, the City of Cape Town, is located in the Western
Cape Province. The rest of the Western Cape Province is governed by District- and Local
Municipalities, which are termed, non-metropolitan municipalities. Hence, rather than utilising the
term ‘rural’ to describe the area of investigation, the politico-administrative term of ‘non-
metropolitan’ is employed. By using this politico-administrative term, it allows the inclusion of all
5
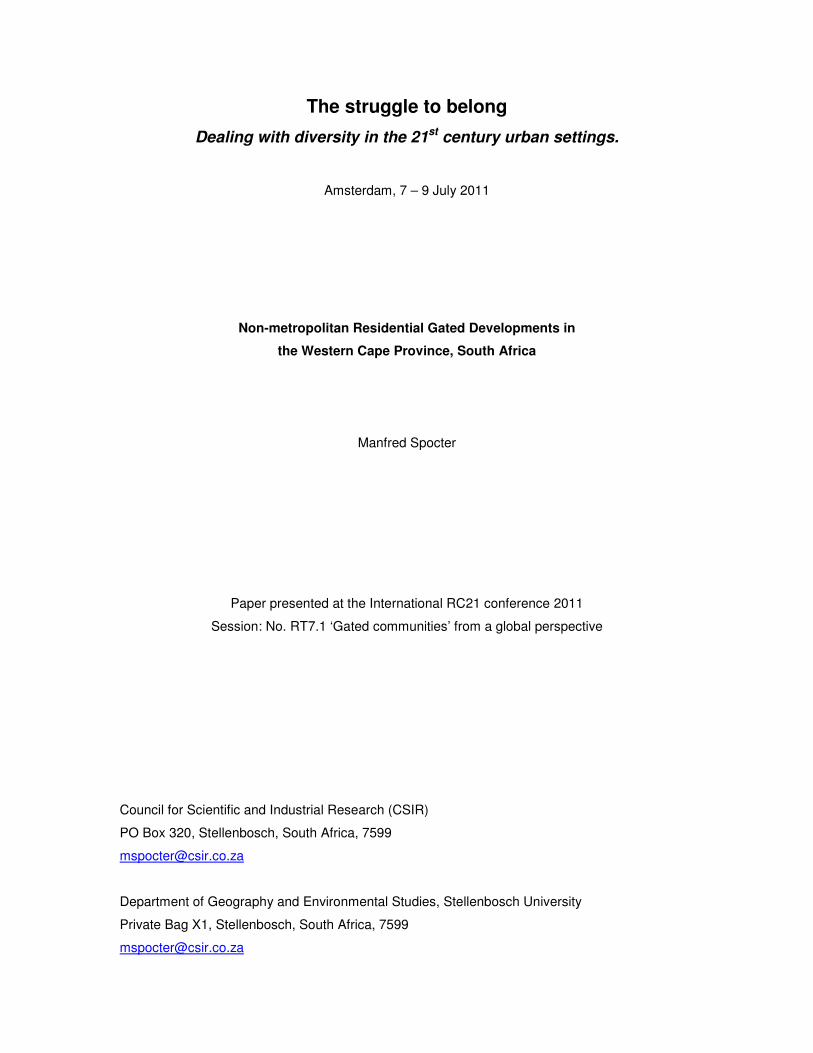
towns in the Western Cape. However, it must be said that there are differences between the
various District- and Local Municipalities with regard to population size, population density, main
economic activity and geophysical factors. Figure 1 gives an indication of the extent of the study
area, which are all the Local Municipalities in the Western Cape. District Management Areas are
national parks or areas of very low population density. They are managed by District
Municipalities and do not fall within Local Municipality jurisdiction.
(Source: Wikipedia, 2008)
Figure 1: Location of the administrative divisions of the Western Cape Province
A study conducted on the growth potential of towns in the Western Cape has identified 131 non-
metropolitan towns in the province (van der Merwe et al., 2004). Whilst the variable of population
size alone is not a determinant of rurality or urbanity, the 131 towns that are located within the
study area have a population size of between 51 and 142 569 persons. Table 1 gives an
indication of the number of towns within arbitrary population ranges. The average population size
of towns in non-metropolitan Western Cape is 11 273, but this masks a size difference of 142 518
people between the smallest and largest town.

6
Table 1: Number of towns in non-metropolitan Western Cape
within population size categories
Population category No. of towns
1 – 1 000 22
1 001 – 5 000 47
5 001 – 10 000 30
10 001 – 50 000 24
50 001+ 8
Total 131
(Source: van Niekerk et al., 2010)
It is important in terms of this study to recognise and acknowledge the differences in population
size of the settlements within the study area, as gated residential security estates may be located
in towns of varying population sizes. The largest settlement located in study area, George
(population 142 569), in the George Local Municipality, has 33 gated residential security estates,
whilst the one of the smallest settlements, Jakobsbaai (population 110), in the Saldanha Bay
Local Municipality, has one such a security estate. Settlement size is not a determination as to
whether a gated residential security estate would be present or not.
2.2 Categorisation of gated developments
Gated developments as a physical construct were defined as a single residential entity which has
all, or a combination of, the following elements: perimeter hardening, restricted access, controlled
access, security, legal agreements and representative bodies; within in which are found sub-
divided erven of individually-owned dwellings.
The gated developments in the survey were categorised on two levels. Figure 2 allows for the
visualisation of the how the surveyed gated developments were categorised. The first criterion in
classifying gated developments was its match to the definition as set in terms of this study. Once
it has been determined that a development meets the defined definitional prescripts, it was then
classified as ‘undeveloped’ or ‘developed’ – the first level of classification. The second level of
classification was the ‘security estate’ and ‘townhouse complex’ level.

7
Figure 2: Typology of surveyed gated developments
An ‘undeveloped’ gated development was viewed as a development that did not have dwellings
built inside the gated development, where construction was in progress or where dwellings have
been constructed but there were no visible signs of human habitation on the survey date.
‘Undeveloped’ gated developments would eventually, upon completion of construction, become
‘security estates’ or ‘townhouse complexes’, hence the dashed lines and boxes in Figure 2. At the
very least, the gated development had to be entirely enclosed by a perimeter wall or fence
(including a gate or similar entry/ exit barrier) and had to have a/ an internal road/ roads.
3. Spatial aspects of gated developments in the Western Cape
Data collected from the various surveys were collated into a single database and groundtruthing
was performed in order to map the location of each of the gated developments. The mapping of
the distribution of non-metropolitan gated developments in the province allows for a spatial
analysis to be done on the data. A number of trends could be identified as to the distribution and
character of gated developments within and outside the towns.
3.1 Locational aspects of gated developments
Locational aspects of gated developments are important in that they relate to other phenomenon,
which could be proximity to the coast, medical facilities, natural resources, recreation areas, the
metropolitan area, national roads, etc. The understanding of the spatialities of non-metropolitan
gated developments also serves as a basis for further investigation into understanding various
aspects of their presence in specific towns or local municipalities.
Developed Undeveloped
Townhouse complexes
Security estates
Townhouse complexes
Security estates
Gated developments

8
The gated development survey yielded 449 non-metropolitan residential gated developments in
the province, which were mapped in order to present a provincial snapshot of the location of
these non-metropolitan gated developments (Figure 3)1. At first glance the distribution of gated
developments indicates a concentration in local municipalities with coastal borders and/or was in
close proximity to the metropolitan region of Cape Town. The number of gated developments per
local municipality indicates a general decrease as one moved inland. These are broad general
tendencies as each local municipality has a specific set of factors that assisted or constrained the
manifestation of gated developments.
(Source: Compiled from author’s survey)
Figure 3: Distribution of gated developments per local municipality in the Western Cape
Those local municipalities that had the most gated developments (40 or more) per local
municipality were, in rank: George LM (66), Overstrand LM (62), Mossel Bay LM (57),
Stellenbosch LM (42) and Knysna LM (40). This group of local municipalities presents a distinct
section within the total gated development count (Table 2). Three of the five largest towns in the
1 Classification of data in the maps was decided automatically by ESRI ArcGIS 9.3 software using Jencks’ natural breaks.
Jencks’ algorithm which uses statistical analysis to find natural breaks in the data (Jencks, 1967).

9
study area, in terms of population size, are located in the aforementioned local municipalities.
Proximity to the coast and to the City of Cape Town are features of this group of LMs. Four of the
five top LMs are situated along the coast, and two of them border the City of Cape Town. The
coastal LMs, and their respective settlements, are especially well-known as tourist destinations.
Furthermore, the population growth in settlements in these LMs between 2001 and 2007 has
shown tremendous population growth, which has necessitated the construction of new housing
units (van Niekerk et al., 2010).
Four local municipalities have 20 – 39 gated developments, namely; Drakenstein LM (26),
Saldanha Bay LM (23); Swartland LM (21) and Bitou LM (21). Oudtshoorn LM (18), Bergrivier LM
(11) and Swellendam LM (10) have 10 – 19 gated developments within their borders. Nine of the
remaining local municipalities have 1 – 9 gated developments while the local municipalities of
Matzikama, Laingsburg and Prince Albert do not have any gated developments in their areas of
jurisdiction.
The statistics that compares the data on the local municipality scale does mask the tendencies
within each local municipality. It does not provide an indication as to whether gated developments
are restricted to a particular area or specific town(s) within each local municipality. As indicated in
Table 2, all the gated developments in Bitou LM are concentrated in Plettenberg Bay; those in the
Oudtshoorn LM, in Oudtshoorn; those in the Swellendam LM, in Swellendam; those in the
Witzenberg LM, in Ceres; those in the Breede River/ Winelands, in Robertson and those in the
Beaufort West LM, in Beaufort West.
Table 2: Count of gated developments per local municipality
Inside towns’
boundaries
Outside towns’
boundaries Local
Municipality
No. of towns
with gated
developments
Total number
of gated
developments2 Number Percentage Number Percentage
George 3 66 62 94% 4 6%
Overstrand 6 62 61 98% 1 2%
Mossel Bay 4 57 54 95% 3 5%
Stellenbosch 3 42 35 85% 7 15%
Knysna 2 40 37 93% 3 7%
Drakenstein 2 26 25 96% 1 4%
Saldanha Bay 5 23 23 100% 0 0%
2 Includes ‘developed’ and ‘undeveloped’ gated developments.

10
Swartland 5 21 19 90% 2 10%
Bitou 1 21 20 95% 1 5%
Oudtshoorn 1 18 18 100% 0 0%
Bergrivier 4 11 11 100% 0 0%
Swellendam 1 10 10 100% 0 0%
Theewaterskloof 5 9 8 89% 1 11%
Cederberg 2 8 6 75% 2 25%
Witzenberg 1 7 7 100% 0 0%
Breede Valley 2 7 7 100% 0 0%
Breede
River/Winelands 1 7 7 100% 0 0%
Hessequa 3 6 6 100% 0 0%
Beaufort West 1 4 4 100% 0 0%
Cape Agulhas 2 3 3 100% 0 0%
Kannaland 0 1 0 0% 1 100%
Matzikama 0 0 0 0
Laingsburg 0 0 0 0
Prince Albert 0 0 0 0
TOTAL 54 449 423 94% 26 6%
(Source: Compiled from author’s survey)
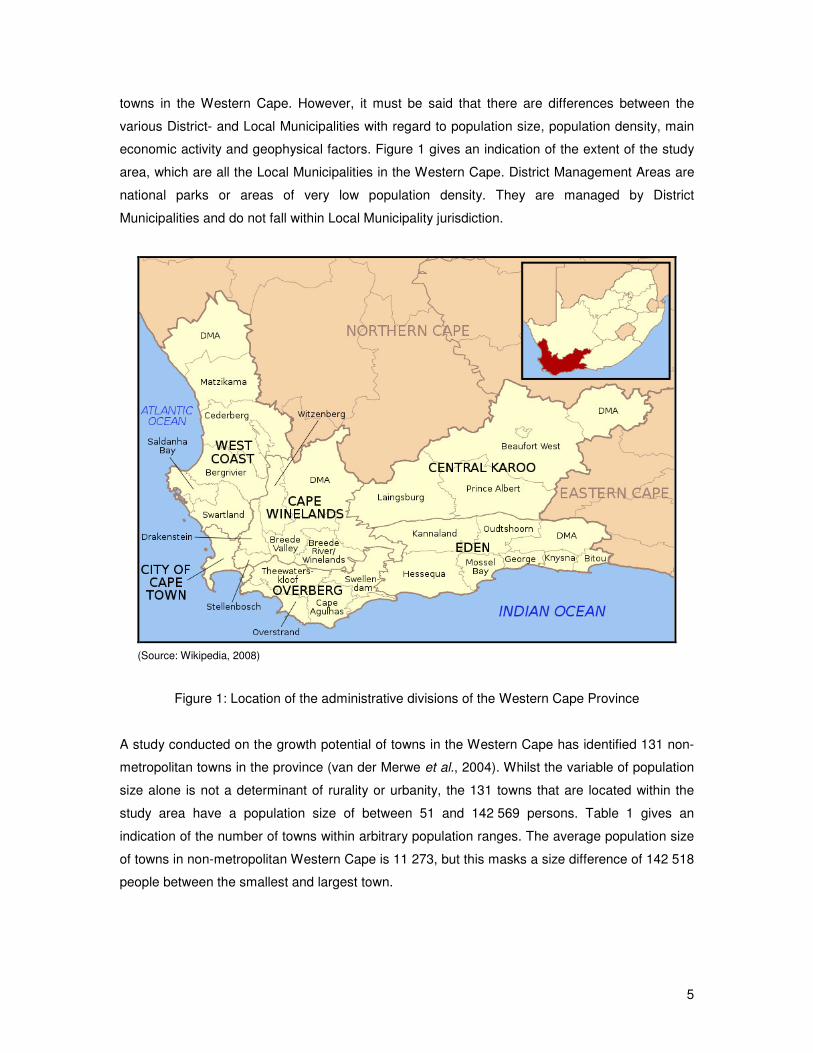
Figure 4 illustrates that in the George LM, the town of George dominates the local municipality in
terms of the number of gated developments – George has 95% of the gated developments in the
George LM whilst the town of Wilderness contributes the outstanding 5%.3 Conversely, the
Overstrand LM has a larger distribution area of its gated developments – between a number of
towns: Hermanus 44%, Onrus River 30%, Kleinmond 20%, Franskraalstrand 3% and Stanford
3%, respectively.4
3 The two gated developments in Herold’s Bay are included with George.
4 The three gated developments in Vermont are included with Onrusrivier and the fifteen gated developments in Sandbaai
are included with Hermanus.
11
(Source: Compiled from author’s survey)
Figure 4: Distribution of gated developments within the George LM and Overstrand LM
Gated developments in different local municipalities are either dispersed through a number of
towns or clustered together in one main town. There are thus 54 towns in the Western Cape in
which gated developments are present. This translates to 41% of the 131 towns in the province,
12
identified in the van der Merwe et al. (2004) study, as home to gated developments. However, not
all non-metropolitan gated developments are located in towns.
3.2 Gated developments within and beyond town boundaries
Table 2 indicates that approximately 94% (423 in total) of non-metropolitan gated developments
in the Western Cape are located within the boundaries of towns in the province. However, 6% (26
in total) are located outside the boundaries of any towns – on land that at some point in time has
had an agricultural zoning. A specific land planning process has to be followed to transform
agricultural land to a residential zoning and/or amending the town boundary (urban edge) to
include the area of development in the town. Of the 26 gated developments located outside of
towns, 23 are security estates and only three are townhouse complexes. This shows a clear bias
towards locating space-intensive security estates outside town borders. There are also instances
where amenity activities such as golf and watersports are played by the residents of these
security estates. High-density townhouse complexes do not feature strongly in the gated
developments outside of towns.
Kannaland LM has one gated development and it is situated outside of a town. The Cederberg
LM (25%), Stellenbosch LM (15%), Theewaterskloof LM (11%) and Swartland LM (10%) all have
more than ten percent of its gated developments outside town boundaries (see Table 2). In terms
of numbers, it is the Stellenbosch LM (7 gated developments), the George LM (4 gated
developments) and Mossel Bay and Knysna LMs (3 gated developments each) that lead the pack
(see Figure 5).

13
(Source: Compiled from author’s survey)
Figure 5: Distribution of gated developments located beyond town boundaries (per local
municipality)
3.3 ‘Undeveloped’ gated developments
Gated developments that were surveyed were categorised in two groups, namely, ‘undeveloped’
and ‘developed’, with the latter containing two further sub-divisions of ‘security estates’ and
‘townhouse complexes’ (Figure 2). ‘Undeveloped’ gated developments indicate locations where
future gated developments would be available for habitation. Although there may not be dwellings
erected on them, they have completed the process of land use application, rezoning and
environmental impact assessment (if required) – it is thus a simply the case of the dwellings being
constructed.
As indicated in Table 3, approximately 89% of gated developments in the Western Cape are
classified as ‘developed’, with approximately 11% classified as ‘undeveloped’. One can infer that
the 11% ‘undeveloped’ is an indication of the amount of gated developments that are available to
the market in the short- to medium-term. Whilst 23 (46%) of the ‘undeveloped’ gated
developments could not be classified according to the type of gated development, 21 (42%) were
security estates and 6 (12%) were townhouse complexes. It was at least three times more likely

14
for an ‘undeveloped’ gated development to be a security estate than a townhouse complex. In
addition, 46 (92%) of ‘undeveloped’ gated developments are within town boundaries. Most future
gated developments would thus occur within towns and most probably be a security estate.
Table 3: ‘Developed’ and ‘Undeveloped’ gated developments per local municipality
Developed Undeveloped Local
Municipality
Total number
of gated
developments No. Percentage No. Percentage
George 66 64 97% 2 3%
Overstrand 62 55 89% 7 11%
Mossel Bay 57 51 89% 6 11%
Stellenbosch 42 38 95% 4 5%
Knysna 40 37 93% 3 7%
Drakenstein 26 23 89% 3 11%
Saldanha Bay 23 20 87% 3 13%
Swartland 21 20 95% 1 5%
Bitou 21 20 95% 1 5%
Oudtshoorn 18 16 89% 2 11%
Bergrivier 11 6 55% 5 45%
Swellendam 10 9 90% 1 10%
Theewaterskloof 9 8 89% 1 11%
Cederberg 8 6 75% 2 25%
Witzenberg 7 5 71% 2 29%
Breede Valley 7 6 86% 1 14%
Breede
River/Winelands 7 6 86% 1 14%
Hessequa 6 3 50% 3 50%
Beaufort West 4 3 75% 1 25%
Cape Agulhas 3 3 100% 0 0%
Kannaland 1 0 0 1 100%
Matzikama 0 0 0 0 0
Laingsburg 0 0 0 0 0
Prince Albert 0 0 0 0 0
TOTAL 449 399 89% 50 11%
(Source: Compiled from author’s survey)
15
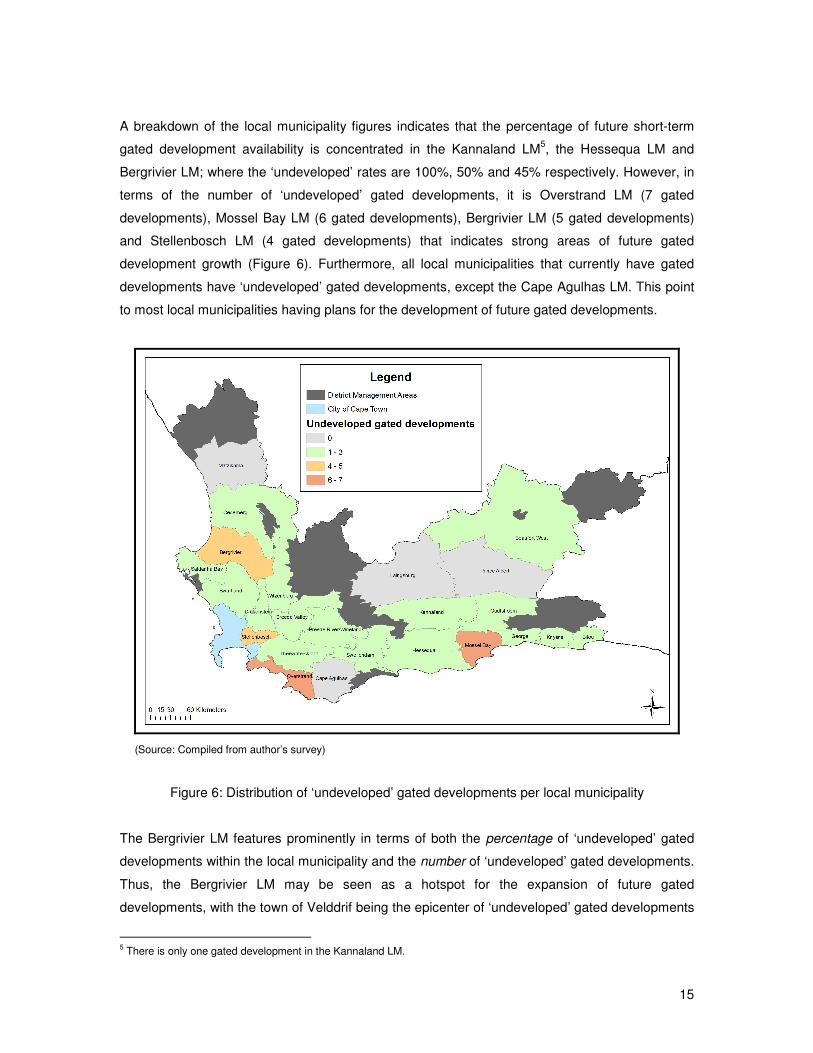
A breakdown of the local municipality figures indicates that the percentage of future short-term
gated development availability is concentrated in the Kannaland LM5, the Hessequa LM and
Bergrivier LM; where the ‘undeveloped’ rates are 100%, 50% and 45% respectively. However, in
terms of the number of ‘undeveloped’ gated developments, it is Overstrand LM (7 gated
developments), Mossel Bay LM (6 gated developments), Bergrivier LM (5 gated developments)
and Stellenbosch LM (4 gated developments) that indicates strong areas of future gated
development growth (Figure 6). Furthermore, all local municipalities that currently have gated
developments have ‘undeveloped’ gated developments, except the Cape Agulhas LM. This point
to most local municipalities having plans for the development of future gated developments.
(Source: Compiled from author’s survey)
Figure 6: Distribution of ‘undeveloped’ gated developments per local municipality
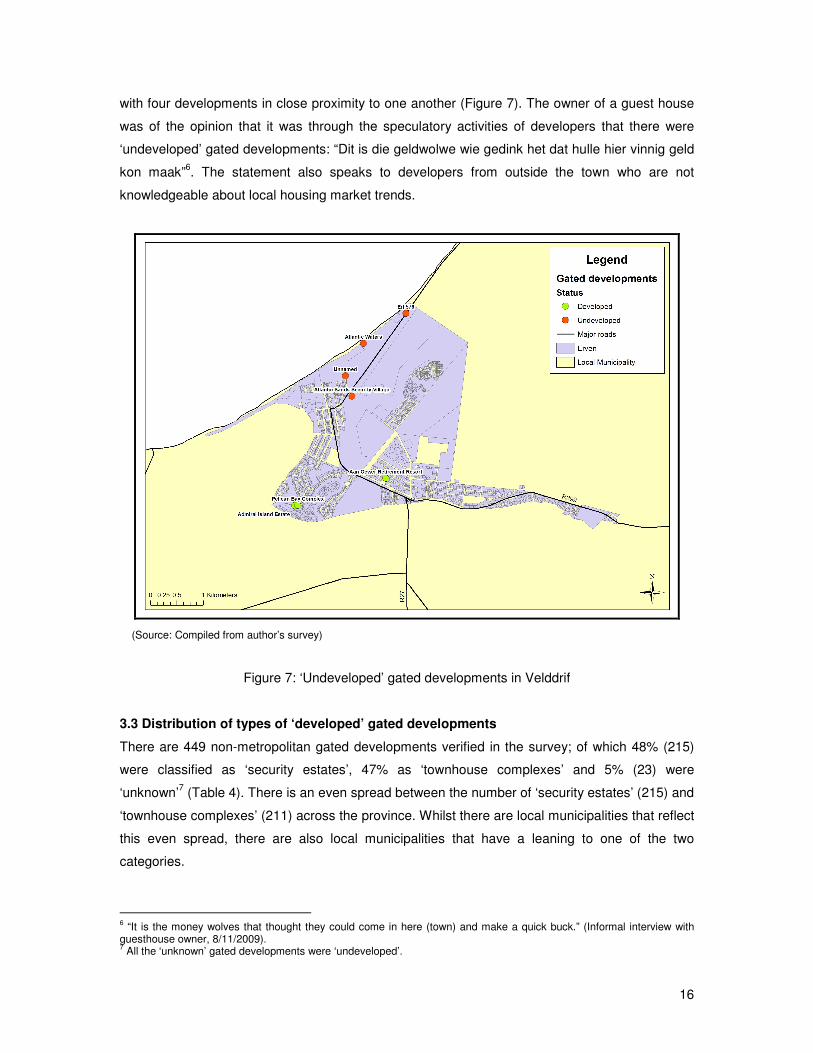
The Bergrivier LM features prominently in terms of both the percentage of ‘undeveloped’ gated
developments within the local municipality and the number of ‘undeveloped’ gated developments.
Thus, the Bergrivier LM may be seen as a hotspot for the expansion of future gated
developments, with the town of Velddrif being the epicenter of ‘undeveloped’ gated developments
5 There is only one gated development in the Kannaland LM.
16
with four developments in close proximity to one another (Figure 7). The owner of a guest house
was of the opinion that it was through the speculatory activities of developers that there were
‘undeveloped’ gated developments: “Dit is die geldwolwe wie gedink het dat hulle hier vinnig geld
kon maak”6. The statement also speaks to developers from outside the town who are not
knowledgeable about local housing market trends.
(Source: Compiled from author’s survey)
Figure 7: ‘Undeveloped’ gated developments in Velddrif
3.3 Distribution of types of ‘developed’ gated developments
There are 449 non-metropolitan gated developments verified in the survey; of which 48% (215)
were classified as ‘security estates’, 47% as ‘townhouse complexes’ and 5% (23) were
‘unknown’7 (Table 4). There is an even spread between the number of ‘security estates’ (215) and
‘townhouse complexes’ (211) across the province. Whilst there are local municipalities that reflect
this even spread, there are also local municipalities that have a leaning to one of the two
categories.
6 “It is the money wolves that thought they could come in here (town) and make a quick buck.” (Informal interview with
guesthouse owner, 8/11/2009). 7 All the ‘unknown’ gated developments were ‘undeveloped’.

17
Table 4: Types of gated developments per local municipality8
Type of gated development
Security estates Townhouse
complexes Unknown
Local Municipality
Total number of
gated
developments
No. Percentage No. Percentage No. Percentage
George 66 35 53% 29 44% 2 3%
Overstrand 62 29 47% 29 47% 4 6%
Mossel Bay 57 27 47% 26 46% 4 7%
Stellenbosch 42 17 41% 23 55% 2 4%
Knysna 40 24 60% 13 33% 3 7%
Drakenstein 26 7 27% 18 69% 1 4%
Saldanha Bay 23 12 52% 11 48% 0 0%
Swartland 21 5 24% 16 76% 0 0%
Bitou 21 15 71% 5 24% 1 5%
Oudtshoorn 18 9 50% 8 44% 1 6%
Bergrivier 11 8 73% 3 27% 0 0%
Swellendam 10 6 60% 3 30% 1 10%
Theewaterskloof 9 2 22% 7 78% 0 0%
Cederberg 8 6 75% 2 25% 0 0%
Witzenberg 7 1 14% 6 86% 0 0%
Breede Valley 7 2 28% 4 57% 1 15%
Breede River/
Winelands 7 3 43% 3 43% 1 14%
Hessequa 6 3 50% 1 17% 2 33%
Beaufort West 4 1 25% 3 75% 0 0%
Cape Agulhas 3 2 67% 1 33% 0 0%
Kannaland 1 1 100% 0 0% 0 0%
Matzikama 0
Laingsburg 0
Prince Albert 0
TOTAL 449 215 48% 211 47% 23 5%
(Source: Compiled from author’s survey)
8 This table includes both ‘developed’ and ‘undeveloped’ gated developments.

18
3.3.1 Security estate analysis
In terms of numbers (Figure 8), security estates are most abundant in the George LM (35),
Overstrand LM (29), Mossel Bay LM (27) and Knysna LM (24). The Stellenbosch LM (17), Bitou
LM (15) and Saldanha Bay LM (12) have more than ten security estates within their local
municipality boundaries. All the afore-mentioned local municipalities are in close proximity to
Cape Town or are situated along the coast. Security estates usually require large tracts of land
(Landman, 2003) as the density of dwelling units per hectare is much lower than townhouse
complexes. In many instances, security estates have some sort of recreational/ sporting activity
such as golf or is positioned within a vineyard environment.
(Source: Compiled from author’s survey)
Figure 8: Distribution of security estates
A closer inspection of the percentage of security estates within local municipalities reveals that
certain local municipalities have a greater percentage of security estates as compared to
townhouse complexes (Table 4). Those local municipalities that have sixty percent and more
security estates than townhouse complexes within its borders are the Cederberg LM (75%),
Bergrivier LM (73%), Bitou LM (71%), Cape Agulhas LM (67%), Swellendam LM (60%) and
Knysna LM (60%). All the afore-mentioned local municipalities, except the Swellendam LM, are
19
situated along the coast or as in the case of the Cederberg LM; there is the presence of a large
dam (with concomitant recreation activities).
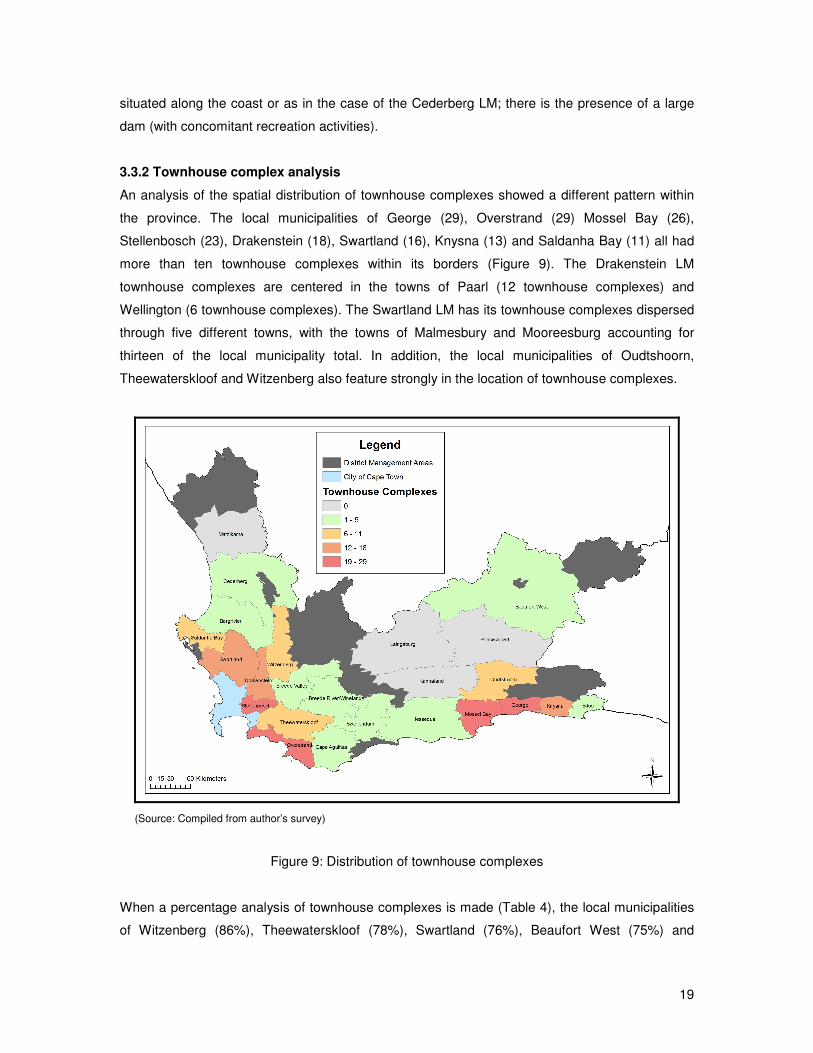
3.3.2 Townhouse complex analysis
An analysis of the spatial distribution of townhouse complexes showed a different pattern within
the province. The local municipalities of George (29), Overstrand (29) Mossel Bay (26),
Stellenbosch (23), Drakenstein (18), Swartland (16), Knysna (13) and Saldanha Bay (11) all had
more than ten townhouse complexes within its borders (Figure 9). The Drakenstein LM
townhouse complexes are centered in the towns of Paarl (12 townhouse complexes) and
Wellington (6 townhouse complexes). The Swartland LM has its townhouse complexes dispersed
through five different towns, with the towns of Malmesbury and Mooreesburg accounting for
thirteen of the local municipality total. In addition, the local municipalities of Oudtshoorn,
Theewaterskloof and Witzenberg also feature strongly in the location of townhouse complexes.
(Source: Compiled from author’s survey)
Figure 9: Distribution of townhouse complexes
When a percentage analysis of townhouse complexes is made (Table 4), the local municipalities
of Witzenberg (86%), Theewaterskloof (78%), Swartland (76%), Beaufort West (75%) and
20
Drakenstein (69%), show a definite preference toward townhouse complexes as opposed to
security estates. The focus of gated developments in these areas may be on the provision of
high-density housing, rather than space-intensive security estates. The focus would be more on
housing space rather than lifestyle space.
4. Securitisation of non-metropolitan gated developments
Security is an important component of gated developments. The province-wide survey not only
collected information on the location of non-metropolitan gated developments, but also served to
collect the details of the security features of each of the 399 ‘developed’ gated developments. No
security feature information was collected from ‘undeveloped’ gated developments because the
very nature of them being undeveloped can not give an accurate indication of the full array of its
future security features.
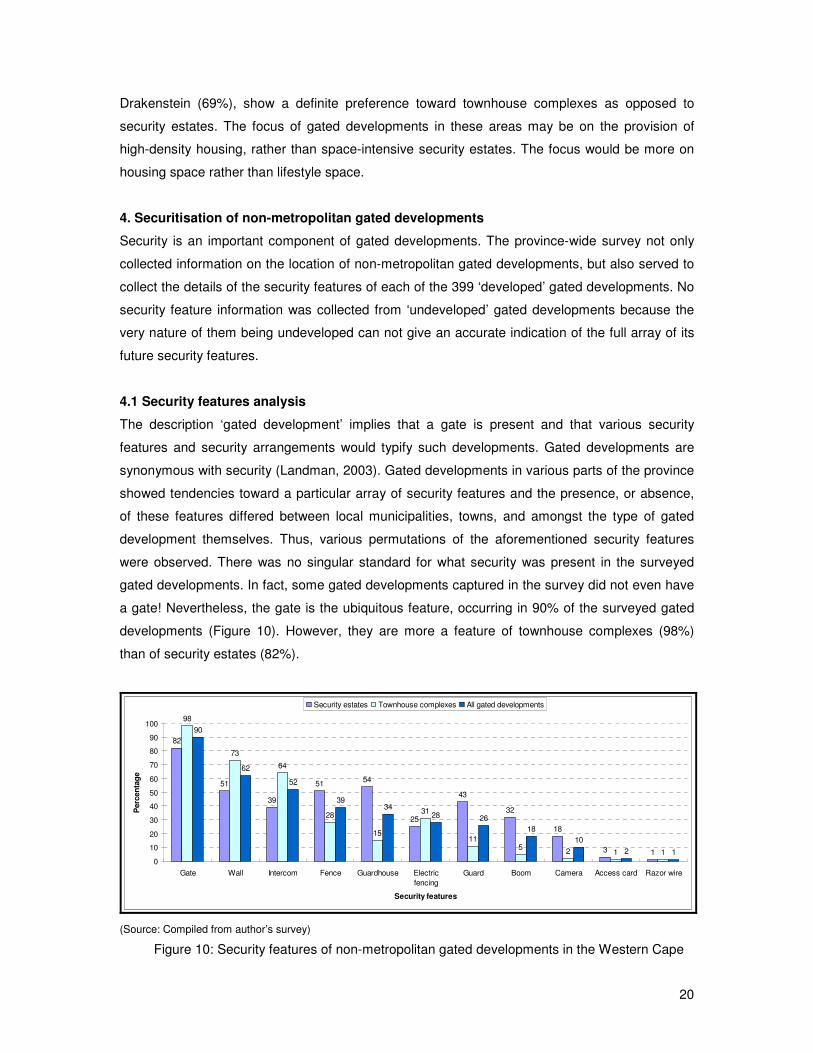
4.1 Security features analysis
The description ‘gated development’ implies that a gate is present and that various security
features and security arrangements would typify such developments. Gated developments are
synonymous with security (Landman, 2003). Gated developments in various parts of the province
showed tendencies toward a particular array of security features and the presence, or absence,
of these features differed between local municipalities, towns, and amongst the type of gated
development themselves. Thus, various permutations of the aforementioned security features
were observed. There was no singular standard for what security was present in the surveyed
gated developments. In fact, some gated developments captured in the survey did not even have
a gate! Nevertheless, the gate is the ubiquitous feature, occurring in 90% of the surveyed gated
developments (Figure 10). However, they are more a feature of townhouse complexes (98%)
than of security estates (82%).
82
51
39
5154
25
43
32
18
3 1
98
73
64
28
15
31
115
2 1 1
90
62
52
3934
28 26
18
10
2 10
10
20
30
40
50
60
70
80
90
100
Gate Wall Intercom Fence Guardhouse Electric
fencing
Guard Boom Camera Access card Razor wire
Security features
Perc
en
tag
e
Security estates Townhouse complexes All gated developments
(Source: Compiled from author’s survey)
Figure 10: Security features of non-metropolitan gated developments in the Western Cape
21
All gated developments have a physical barrier at its entrance and those developments that do
not have gates have a boom instead. Booms are more a feature of security estates (32%) than
townhouse complexes (5%). Twenty-eight security estates and 7 townhouse complexes, have
both gates and booms at its entrances. A physical barrier, be it a gate or a boom or both, is the
first of two features that are common in all the surveyed gated developments. Their important
function is to create a controllable entry/ exit point to the gated development, a function that has
heightened importance from a security perspective as it is the only porous opening in the
perimeter.
The perimeter security of gated developments consists of a wall, fence or combination of the two.
Walls are more commonly used by townhouse complexes (73%) as compared to security estates
(51%). As a rule of thumb, the area coverage of townhouse complexes is smaller than security
estates and it is much less costly to construct a perimeter wall around a townhouse complex than
a security estate. This explains why fencing, the cheaper option, is more popular with security
estates, which tend to have larger perimeters. Eight security estates and four townhouse
complexes have a perimeter security which is a combination of walls and fencing. This is a more
popular option amongst security estates as it does reduce the cost of perimeter security
construction.
Intercoms are the third-most popular security feature. They are more prevalent in townhouse
complexes (64%) than in security estates (39%). Intercoms are the communication accessory
between those inside the gated development and those on the outside. It facilitates a measure of
control for those inside the gated development as to whom they allow inside. Thus, residents rely
on auditory voice or name recognition to decide whether person(s) are allowed access. Some
intercoms have a video feature that gives residents a visual indication of who the potential entrant
is. The lower percentage of intercoms at security estates is because such estates would most
likely have a guard present, who would then decide whether a potential entrant would be allowed
inside the estate – which may include telephonic consultation with the resident being visited.
Access card scanners are often installed in conjunction with intercoms, but they are for the
exclusive access of residents or anybody that has been issued with an access card. Access card
scanners are present in three percent of security estates and in one percent of townhouse
complex – it is the least used security feature.
Perimeter walls and fences are further secured by the use of electric fencing and razor wire.
Approximately 25% of security estates and 31% of townhouse complexes have electric fencing,
with 1% of both types of developments having razor wire. The use of extra security features atop
22
walls and fences indicates that gated developments would make doubly sure that the perimeter
security is as good as can be. The perimeter of gated developments may also be patrolled by
guards.
Guards were present at 43% of security estates and 11% of townhouse complexes – it is more
than three times more likely for a security estate to have guards than it would be for a townhouse
complex. It may be that security estates, being larger that townhouse complexes, would require
ears, eyes and feet on the grounds in addition to inanimate surveillance and access control
features. Larger security estates would have a larger volume of pedestrian and vehicular traffic to
manage, which would be more closely monitored and control by guards. The number of guards
would be determined by the size and requirements of the specific gated development. However,
during the survey, researchers were asked by guards if they wanted to enter the development –
no identification was requested. Guards were found asleep on duty and a survey done on a
Sunday morning encountered two guards at different gated developments that were reeking of
alcohol. On the other hand, there were guards who enquired about the data the researchers were
collecting and absolutely refused permission for the researchers to take photographs. It would
thus appear that the training of guards was of varying quality and that the effectiveness of guards
at gated developments was as good as the training that they have received.
Many gated developments had guardhouses on the property, but no guards. In fact, 54% of
security estates and 15% of townhouse complexes had guardhouses, but no guards were present
at the time of the survey. This point to the fact that guards are only on duty at certain times of the
day or they leave the guardhouse unattended whilst patrolling the rest of the gated development.
Guardhouses were not only to accommodate guards, but functioned as security command
centres of the gated developments. They would, for example, house the control area for the
monitoring of security cameras which appeared in 18% of security estates, but only 2% of
townhouse complexes. These security cameras were positioned mostly at the entrances to gated
developments, but also along the perimeter and in areas within the gated development.
The survey indicated that there were differing levels of security at gated developments.
Furthermore, where some security estates had booms, some had gates whilst others had both.
Some townhouse complexes had electric fencing, others not. Thus, a security level index was
created in order to compare security between different gated developments
4.2 Security level index
The index was developed by analysing groups of specific security features rather than assigning
a rating to a singular security feature. The danger with assigning a rating to a security feature

23
based on its ‘securedness’ or positive security impact is that it may be subjective – one may view
security cameras as being able to better negate a security threat whilst another may view electric
fencing as a better threat deterrent. The researcher is also not qualified to pronounce judgment
as to what security measure, or combination thereof, would be the best to deter any threats to a
gated development. The index, measured out of 100, merely gives an indication of which gated
developments, based on its security attributes, would appear to be the most secure.
4.2.1 Local Municipality analysis – Security estates
Figure 11 gives an indication of the location of those municipalities with the highest security index
value for security estates. The results of the analysis were classified into four classes, one of
which represented a value of 0 (no index for that local municipality). Approximately 79% of local
municipalities have a security index value for security estates, with an average index for security
estates set at 45.
(Source: Compiled from author’s survey)
Figure 11: Security index of security estates
The local municipalities of Bitou and Witzenberg have the highest index; 60 for its security
estates. The difference between the two local municipalities is that while Witzenberg LM has one

24
security estate, Bitou LM has fifteen. Thus, the security index value for Bitou LM is for a larger
number of highly secure security estates. The economic bases of the two municipalities are also
different in that the Witzenberg LM is dominated by agriculture and agro-processing (Witzenberg
Local Municipality, 2010) whilst Bitou LM has tourism and construction as its main economic base
(Bitou Local Municipality, 2009). Whilst one would identify security estates with tourism and
recreation; the link between agriculture and agri-business and security estates is not that clear. A
tourism economic base may be identified with leisure and amenity-driven security estates.
The second set of local municipalities according to the index ranking is those that have an index
of 41 – 54 for its security estates (Figure 11). The local municipalities of Overstrand,
Stellenbosch, Drakenstein and Swartland are contiguous to the metropolitan City of Cape Town.
It may be that perceptions of crime and the fear of crime is influenced by the proximity to the city;
a city that may be seen as unsafe, and hence the higher levels of security. Analysis performed on
2008/09 crime statistics show that the Stellenbosch LM and the Drakenstein LM have lower crime
occurrences than the Overstrand LM and the Swartland LM (van Niekerk et al., 2010). It is thus
unclear if the perception and fear of crime is influenced by proximity to the city. The populous
towns in the George and Mossel Bay LMs as well as the recreation and amenity-driven Saldanha
Bay LM also have an index in this range.
4.2 Local Municipality analysis – Townhouse complexes
Figure 12 gives an indication of the location of those municipalities with the highest security index
value for townhouse complexes. The results of the analysis were classified into four classes, one
of which represented a value of 0 (no index for that local municipality). Approximately 81% of
local municipalities have a security index value for townhouse complexes, with an average index
set at 41.
25
(Source: Compiled from author’s survey)
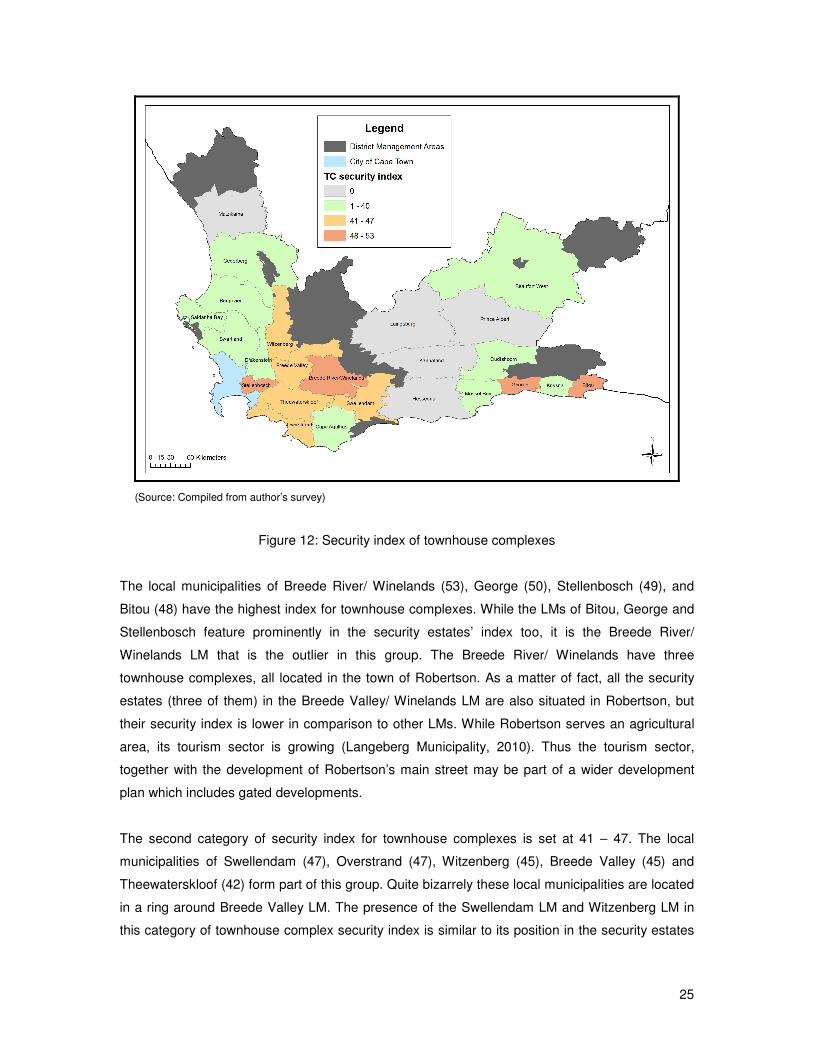
Figure 12: Security index of townhouse complexes
The local municipalities of Breede River/ Winelands (53), George (50), Stellenbosch (49), and
Bitou (48) have the highest index for townhouse complexes. While the LMs of Bitou, George and
Stellenbosch feature prominently in the security estates’ index too, it is the Breede River/
Winelands LM that is the outlier in this group. The Breede River/ Winelands have three
townhouse complexes, all located in the town of Robertson. As a matter of fact, all the security
estates (three of them) in the Breede Valley/ Winelands LM are also situated in Robertson, but
their security index is lower in comparison to other LMs. While Robertson serves an agricultural
area, its tourism sector is growing (Langeberg Municipality, 2010). Thus the tourism sector,
together with the development of Robertson’s main street may be part of a wider development
plan which includes gated developments.
The second category of security index for townhouse complexes is set at 41 – 47. The local
municipalities of Swellendam (47), Overstrand (47), Witzenberg (45), Breede Valley (45) and
Theewaterskloof (42) form part of this group. Quite bizarrely these local municipalities are located
in a ring around Breede Valley LM. The presence of the Swellendam LM and Witzenberg LM in
this category of townhouse complex security index is similar to its position in the security estates

26
index. Local municipalities to the north of the Cape Town metropolitan area have a low security
index for their townhouse complexes. So while proximity to the east of the metropolitan may be a
factor in townhouse security index, those to the north are not similarly affected. A curious
anomaly is that while the Knysna LM has the fifth-highest occurrences of gated developments in
the province at 40; their security index features in the lowest tier in both security estates and
townhouse complexes. This may indicate an emphasis on lifestyle living rather than secure living.
The analysis on the LM level indicates that differences do exist between local municipalities in the
security indexes between security estates and townhouse complexes. An analysis on the town
level would give a clearer understand of what is occurring in individual towns.
4.2.3 Town level analysis
The fear of crime and violence has been touted for the emergence of gated developments (Low,
2003). One of the datasets used in the 2010 revision of the Growth Potential Study was a ranking
of all the recorded crime occurrences within the towns during 2008/2009 (van Niekerk et al.,
2010). Five categories of crime occurrences per person per annum were created: 1 – high, 2 –
high medium, 3 – medium, 4 – low medium, 5 – low. Fifty of the 53 towns were categorised in this
manner. Three towns did not have data available for it.
Table 5: Location of towns and type of gated development within crime occurrences ranking
Number of towns Crime occurrences
ranking SEs and TCs SEs only TCs only
Number of towns per
ranking
1 0 1 1 2
2 2 1 4 7
3 12 2 4 18
4 7 4 3 14
5 3 4 2 9
Total 24 12 14 50
(Source: Compiled from author’s survey and van Niekerk et al., 2010)
Forty-six percent of towns that have gated developments are categorised in the ‘low’ and ‘low
medium’ crime occurrences categories (Table 5). Eight towns within this group have an above-
average gated development security and they reflect a diverse population size ranging from 5 406
to 121 930, which may indicate that settlement size is not a determinant of the location of high
security gated developments and low crime occurrences. While it may be argued on a town level
that the high security gated developments are not in accordance with the ‘low’ and ‘low medium’
crime occurrences; it can also be argued that it is precisely because of high security that crime
occurrences are low. It must also be noted that it is towns that have a preponderance for security

27
estates which are represented in the ‘low’ and ‘medium low’ crime occurrence categories rather
than those with townhouse complexes.
Thirty-six percent of towns with gated developments are located in the ‘medium’ crime occurrence
category. Thus, 82% of towns with gated developments have crime occurrences in the ‘medium’
to ‘low’ categories. Conversely, 18% of towns are in the ‘high medium’ and ‘high’ crime
occurrence categories. Should crime be a factor in the construction of gated developments in
non-metropolitan Western Cape, then one could expect that these towns would have a high
security level index for its gated developments. However, only one of the nine towns in the ‘high
medium’ and the ‘high’ crime occurrence category has an above-average security level index.
The towns in the ‘high’ and ‘medium high’ crime occurrence categories have predominantly
townhouse complexes rather than security estates; this while the average security level index for
townhouse complexes is lower than for security estates.
The data suggest that contrary to perception, gated developments may not be a reaction to high
crime occurrences in a town. Those towns with above-average crime occurrences mostly have
below-average security index levels for its gated developments. On the other hand, most of the
towns with below-average crime occurrences have above-average security level indexes.
5. Conclusion
Residential non-metropolitan gated developments are an under-researched area in the gated
development debate. This paper is part of a broader study to ascertain whether the reasons for
the existence of gated developments in the non-metropolitan sphere are the same as those found
in the metropolitan areas. For this purpose the delineation of the metropolitan/ non-metropolitan
boundary needed to be clarified. The study area contained 131 towns and gated developments
were present in 54 of those. The towns that contained gated developments were of varying sizes
and not restricted to the larger towns.
Two types of gated developments were identified, namely, security estates and townhouse
complexes. These two types of gated developments displayed varying locational characteristics
within the study area. Most gated developments, particularly security estates, were located in
coastal municipalities, or municipalities next to the metropolitan area. However, townhouse
complexes featured strongly in inland municipalities. Most gated developments were located
within town boundaries, but 6% were located outside of towns. A number of ‘undeveloped’ gated
developments bear testament to property speculation and the drop in housing demand owing to
stricter laws for banks in providing home loans.
28
Security is what defines gated developments and it was found that varying security measures
were employed in different types of gated developments. Whilst gates were a ubiquitous feature
of gated developments, not all gated developments had gates. The three most popular security
features that were used in gated developments were gates, walls and intercoms with fences,
guards and electric fencing used to a lesser degree. Using a security index that was developed,
was found that, on average, security estates have more security features than townhouse
complexes, creating the appearance that the former are more secure. Town crime occurrences in
the study area were superimposed with the location of towns which had gated developments. It
was found that gated developments were located in towns that had a medium to low rate of crime
occurrences.
The analysis of non-metropolitan gated developments on the local municipality and town level
provides a base from which to identify towns which display particular gating characteristics. A
qualitative investigation of these towns would provide further elucidation as to the reasons for the
establishment of gated developments, the levels of security and why people feel the need to
reside in these developments.
Acknowledgements This research was financially supported by the South Africa – Netherlands
Research Programme on Alternatives in Development and the CSIR.

29
References
Bitou Local Municipality (2009) IDP Review: 2008/2009. [Online]. Available at:
http://www.plett.gov.za/images/stories/2010/pdfs/bitou_idp.pdf Accessed 2 July 2010.
Brown, D. L. an Cromartie, J. B. (2005) The Nature of Rurality in Postindustrial Society, in
Champion, T. and Hugo, G. (eds), New Forms of Urbanization: Beyond the Rural-Urban
Dichotomy, Aldershot : Ashgate, pp. 269 – 283.
Centre for Development and Enterprise (1996) South Africa’s Small Towns: New Strategies for
Growth and Development, Johannesburg : CDE.
Champion, T. and Hugo, G. (2005) Introduction: Moving Beyond the Rural-Urban Dichotomy, in
Champion, T. and Hugo, G. (eds), New Forms of Urbanization: Beyond the Rural-Urban
Dichotomy, Aldershot : Ashgate, pp. 3 – 24.
CSIR (1999) The State of Human Settlements: South Africa 1994 – 1998, Pretoria : CSIR.
Durington, M. (2006) Race, Space and Place in Suburban Durban: An Ethnographic Assessment
of Gated Community Environments and Residents, GeoJournal, 6 (1-2), 147 – 160.
Halfacree, K. (2006) From Dropping Out to Leading On? British Counter-Cultural Back-to-the
Land in a Changing Rurality, Progress in Human Geography, 30 (3), 309 – 336.
Hook, D. Vrdoljak, M. (2002) Gated Communities, Heterotopia and “Rights” of Privilege: A
Heterotopology of the South African Security-Park, Geoforum, 33 (2), 195 – 219.
Jencks, G. F. (1967) The Data Model Concept in Statistical Mapping, International Yearbook of
Cartography, 7, 186 – 190.
Landman, K. (2000) An Overview of Enclosed Neighbourhoods in South Africa. Boutek Report
Number: BOU/I 187, Pretoria : CSIR.
Landman, K. (2003) Crime, Political Transition and Urban Transformation in South Africa and
Brazil. South African Institute of International Affairs, Report No. 36.
30
Langeberg Municipality (2010) Draft Integrated Development Plan, 2010/2011. [Online]. Available
at: http://www.langeberg.gov.za/storage/files/IDP2010.pdf Accessed 5 July 2010.
Low, S. (2003) Behind the Gates: Life, Security, and the Pursuit of Happiness in Fortress
America. New York : Routledge.
Mittelsteadt, L. (2003) A Case Study of Gated Communities in Nova Scotia. Master’s thesis
submitted in the School of Planning, Dalhousie University, Halifax, Canada.
Rural Doctors Association of Southern Africa (2006) A Rural Health Strategy for South Africa.
[Online]. Available at: http://www.rudasa.org.za/download/RuralHealthStrat_draft020306.doc
Accessed on 27 June 2008.
Statistics South Africa (2003) Investigations into Appropriate Definitions of Urban and Rural Areas
for South Africa: Discussion Document. Pretoria : Statistics South Africa.
van der Merwe, I. J.; Davids, A. J.; Ferreira, S.; Swart, G. P. and Zietsman, H. L. (2004) Growth
Potential of Towns in the Western Cape, Centre for Geographical Analysis, University of
Stellenbosch.
van Niekerk, A.; Donaldson, R.; du Plessis, D. and Spocter, M. (2010) A Revision of the 2004
Growth Potential of Towns in the Western Cape Study: Discussion Document. Stellenbosch :
Stellenbosch University and CSIR.
Wikipedia (2008) Image: Map of the Western Cape with Municipalities Labelled.svg. [Internet].
Available at:
http://en.wikipedia.org/wiki/Image:Map_of_the_Western_Cape_with_municipalities_labelled.svg
Accessed 4 December 2008.
Witzenberg Local Municipality (2010) Witzenberg IDP 2007/2011: Review 2010/2011. [Online].
Available at: http://www.witzenberg.gov.za/idp/(z)%20Final%20IDP%20Review%202010.pdf
Accessed 2 July 2010.