Embed Size (px)
Citation preview
STATE COMMITTEE ON WATER SYSTEMS THE REPUBLIC OF ARMENIA
THE STUDY
FOR
IMPROVEMENT OF RURAL WATER SUPPLY
AND
SEWAGE SYSTEMS
IN
THE REPUBLIC OF ARMENIA
FINAL REPORT
DATA BOOK (3/4)
MARCH 2009
JAPAN INTERNATIONAL COOPERATION AGENCY
NIPPON KOEI CO., LTD.
FINAL REPORT
THE STUDY FOR IMPROVEMENT OF RURAL WATER SUPPLY
AND SEWAGE SYSTEMS - i - IN THE REPUBLIC OF ARMENIA
THE STUDY
FOR
IMPROVEMENT OF RURAL WATER SUPPLY AND SEWAGE SYSTEMS
IN
THE REPUBLIC OF ARMENIA
FINAL REPORT
DATA BOOK (3/4)
3. GAGHARKUNIK MARZ
3.1 Water Resources Survey and Water Quality Analysis Results
3.2 Inventory of Existing Water Supply Facilities
3.3 Results of Socio-economic Survey
3.4 Existing Water Supply Facilities Map
3.5 Preliminary Design
3.6 Water Supply Rehabilitation and Improvement Plan Map
3.7 Cost Estimate
3.8 Financial Analysis
No. Rural Community No. Rural Community 1 Akunq 26 Tsovinar 2 Aghberq 27 Kalavan 3 Aygut 28 Barepat 4 Ayrq 29 Karchaghbyur 5 Antaramej 30 Dzoragyugh 6 Astghadzor 31 Dzoravanq 7 Artsvanist 32 Madina 8 Geghamabak 33 Maqenis 9 Geghamavan 34 Mets Masrik 10 Gegharkunik 35 Norakert 11 Geghhovit 36 Shatjreq 12 Ddmashen 37 Shatvan 13 Dprabak 38 Shorzha 14 Drakhtik 39 Jaghatzadzor 15 Yeranos 40 Semyonovka 16 Zolaqar 41 Vaghashen 17 Zovaber 42 Vardadzor 18 Tazagyugh 43 Verin Getashen 19 Lchavan 44 Torfavan 20 Lusakunq 45 Poqr Masrik 21 Khachaghbyur 22 Tsaghkashen 23 Tsaghkunq 24 Tsovagyugh 25 Tsovak

3 GEGHARKUNIK MARZ
No.1 Akunq
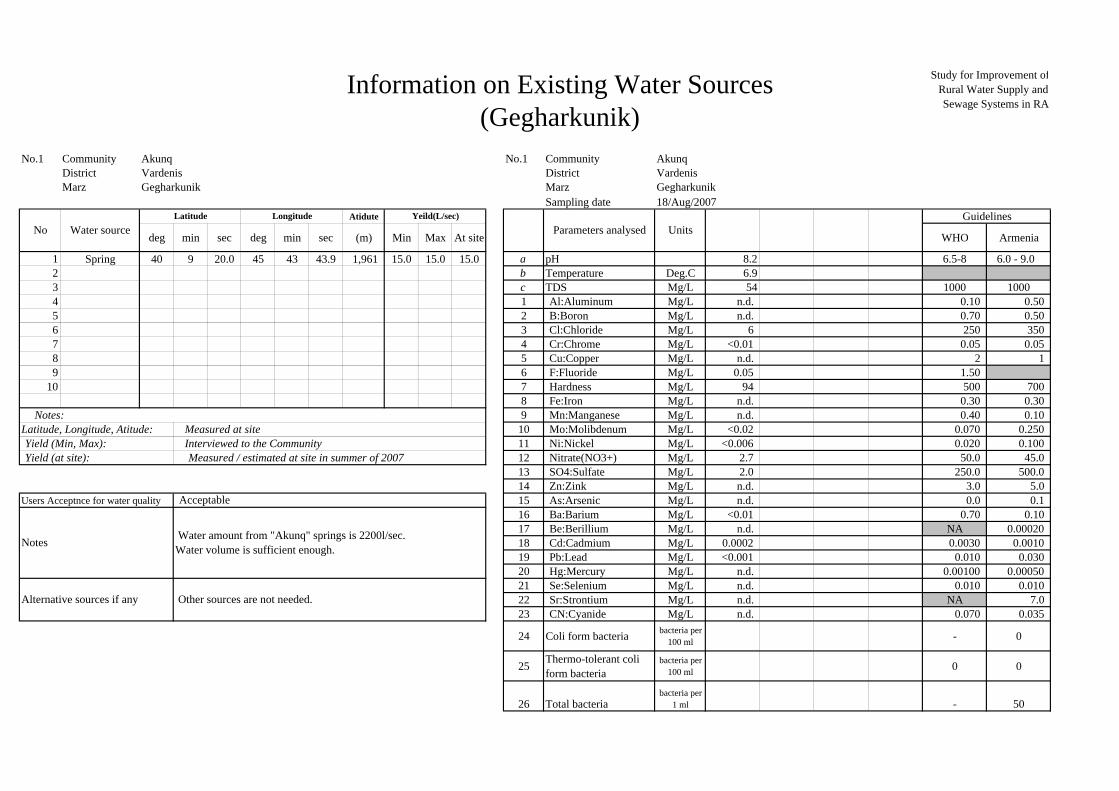
Information on Existing Water Sources(Gegharkunik)
Study for Improvement ofRural Water Supply andSewage Systems in RA
No.1 Community Akunq No.1 Community Akunq No. 1District Vardenis District VardenisMarz Gegharkunik Marz Gegharkunik
Sampling date 18/Aug/2007Atidute
deg min sec deg min sec (m) Min Max At site WHO Armenia
1 Spring 40 9 20.0 45 43 43.9 1,961 15.0 15.0 15.0 a pH 8.2 6.5-8 6.0 - 9.0 2 b Temperature Deg.C 6.93 c TDS Mg/L 54 1000 10004 1 Al:Aluminum Mg/L n.d. 0.10 0.50 5 2 B:Boron Mg/L n.d. 0.70 0.50 6 3 Cl:Chloride Mg/L 6 250 350 7 4 Cr:Chrome Mg/L <0.01 0.05 0.05 8 5 Cu:Copper Mg/L n.d. 2 1 9 6 F:Fluoride Mg/L 0.05 1.50
10 7 Hardness Mg/L 94 500 700 8 Fe:Iron Mg/L n.d. 0.30 0.30
Notes: 9 Mn:Manganese Mg/L n.d. 0.40 0.10 Latitude, Longitude, Atitude: Measured at site 10 Mo:Molibdenum Mg/L <0.02 0.070 0.250 Yield (Min, Max): Interviewed to the Community 11 Ni:Nickel Mg/L <0.006 0.020 0.100 Yield (at site): Measured / estimated at site in summer of 2007 12 Nitrate(NO3+) Mg/L 2.7 50.0 45.0
13 SO4:Sulfate Mg/L 2.0 250.0 500.0 14 Zn:Zink Mg/L n.d. 3.0 5.0
Users Acceptnce for water quality 15 As:Arsenic Mg/L n.d. 0.0 0.1 16 Ba:Barium Mg/L <0.01 0.70 0.10 17 Be:Berillium Mg/L n.d. NA 0.00020 18 Cd:Cadmium Mg/L 0.0002 0.0030 0.0010 19 Pb:Lead Mg/L <0.001 0.010 0.030 20 Hg:Mercury Mg/L n.d. 0.00100 0.00050 21 Se:Selenium Mg/L n.d. 0.010 0.010 22 Sr:Strontium Mg/L n.d. NA 7.0 23 CN:Cyanide Mg/L n.d. 0.070 0.035
24 Coli form bacteria bacteria per100 ml - 0
25 Thermo-tolerant coliform bacteria
bacteria per100 ml 0 0
26 Total bacteriabacteria per
1 ml - 50
Guidelines
Acceptable
Notes Water amount from "Akunq" springs is 2200l/sec.Water volume is sufficient enough.
Alternative sources if any Other sources are not needed.
Parameters analysed UnitsNo Water sourceLatitude Longitude Yeild(L/sec)
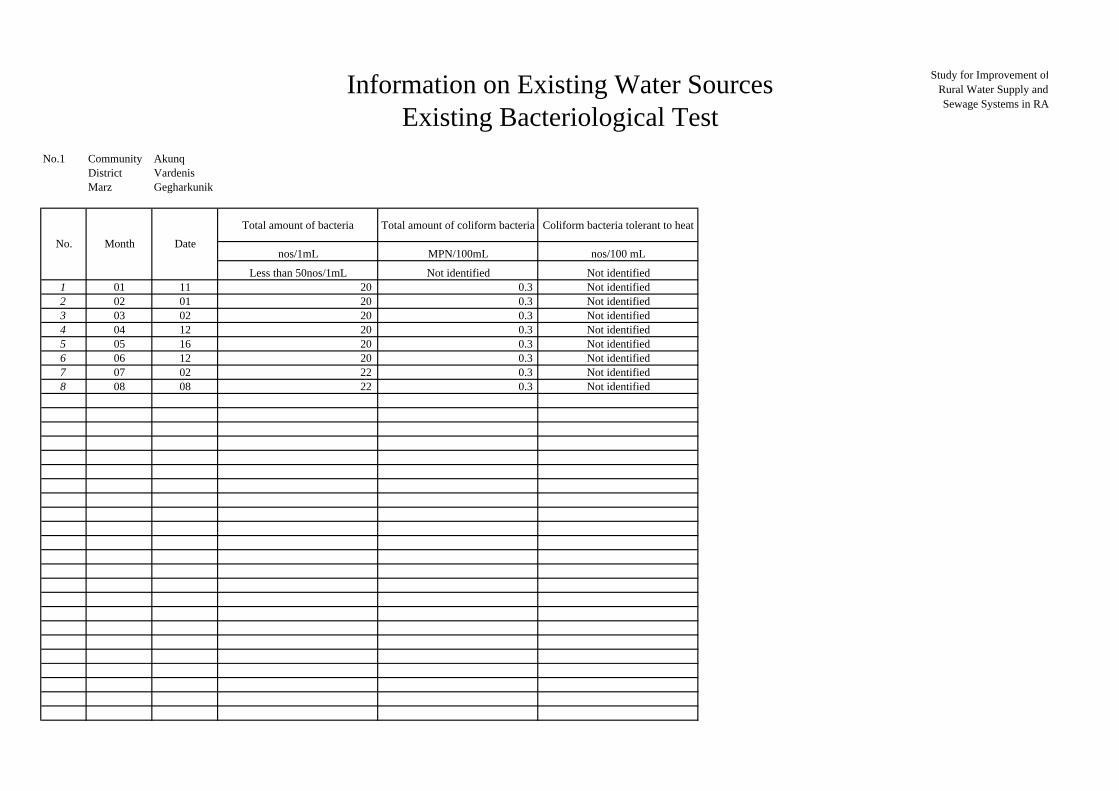
Information on Existing Water SourcesExisting Bacteriological Test
Study for Improvement ofRural Water Supply andSewage Systems in RA
No.1 Community AkunqDistrict VardenisMarz Gegharkunik
Total amount of bacteria Total amount of coliform bacteria Coliform bacteria tolerant to heat
nos/1mL MPN/100mL nos/100 mL
Less than 50nos/1mL Not identified Not identified1 01 11 20 0.3 Not identified2 02 01 20 0.3 Not identified3 03 02 20 0.3 Not identified4 04 12 20 0.3 Not identified5 05 16 20 0.3 Not identified6 06 12 20 0.3 Not identified7 07 02 22 0.3 Not identified8 08 08 22 0.3 Not identified
No. Month Date
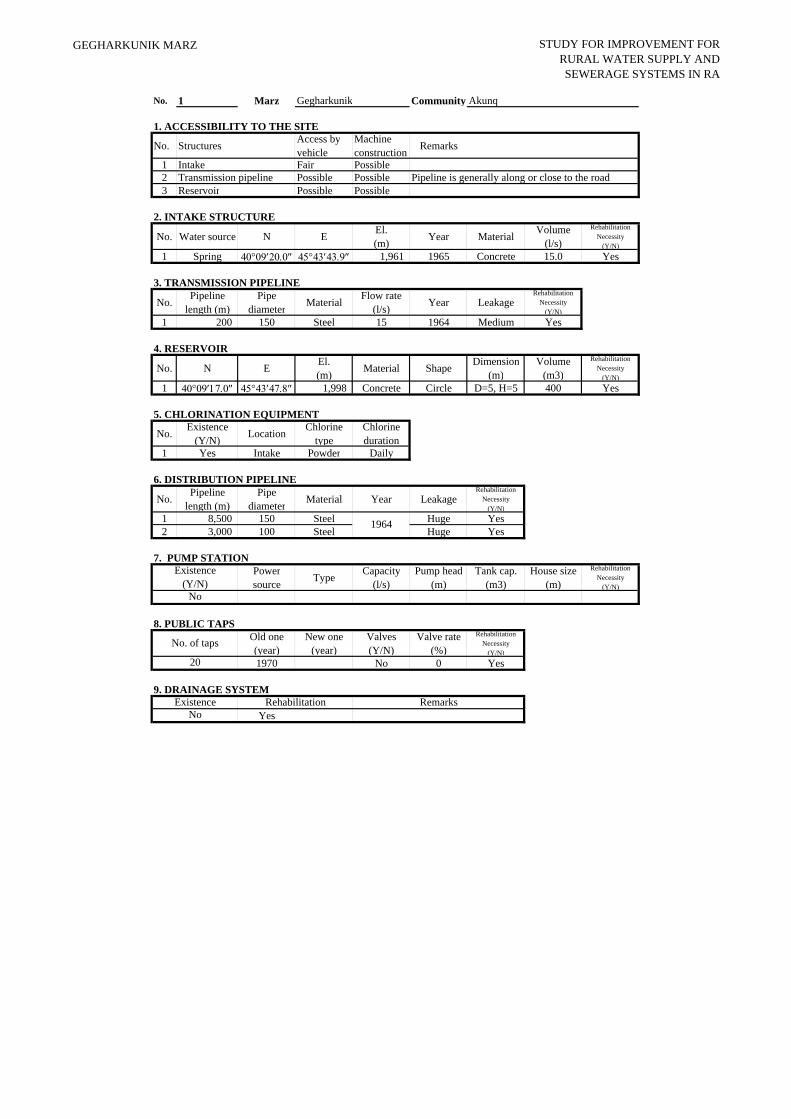
GEGHARKUNIK MARZ STUDY FOR IMPROVEMENT FORRURAL WATER SUPPLY ANDSEWERAGE SYSTEMS IN RA
No. 1 Marz Gegharkunik Community Akunq
1. ACCESSIBILITY TO THE SITE
No. Structures Access byvehicle
Machineconstruction Remarks
1 Intake Fair Possible2 Transmission pipeline Possible Possible Pipeline is generally along or close to the road 3 Reservoir Possible Possible
2. INTAKE STRUCTURE
No. Water source N E El.(m) Year Material Volume
(l/s)
RehabilitationNecessity
(Y/N)1 Spring 40°09′20.0″ 45°43′43.9″ 1,961 1965 Concrete 15.0 Yes
3. TRANSMISSION PIPELINE
No. Pipelinelength (m)
Pipediameter Material Flow rate
(l/s) Year LeakageRehabilitation
Necessity(Y/N)
1 200 150 Steel 15 1964 Medium Yes
4. RESERVOIR
No. N E El.(m) Material Shape Dimension
(m)Volume
(m3)
RehabilitationNecessity
(Y/N)1 40°09′17.0″ 45°43′47.8″ 1,998 Concrete Circle D=5, H=5 400 Yes
5. CHLORINATION EQUIPMENT
No. Existence(Y/N) Location Chlorine
typeChlorineduration
1 Yes Intake Powder Daily
6. DISTRIBUTION PIPELINE
No. Pipelinelength (m)
Pipediameter Material Year Leakage
RehabilitationNecessity
(Y/N)1 8,500 150 Steel Huge Yes2 3,000 100 Steel Huge Yes
7. PUMP STATIONPowersource Type Capacity
(l/s)Pump head
(m)Tank cap.
(m3)House size
(m)
RehabilitationNecessity
(Y/N)
8. PUBLIC TAPSOld one(year)
New one(year)
Valves(Y/N)
Valve rate(%)
RehabilitationNecessity
(Y/N)1970 No 0 Yes
9. DRAINAGE SYSTEM
YesNo
No. of taps
20
1964
Existence(Y/N)
No
Existence Rehabilitation Remarks
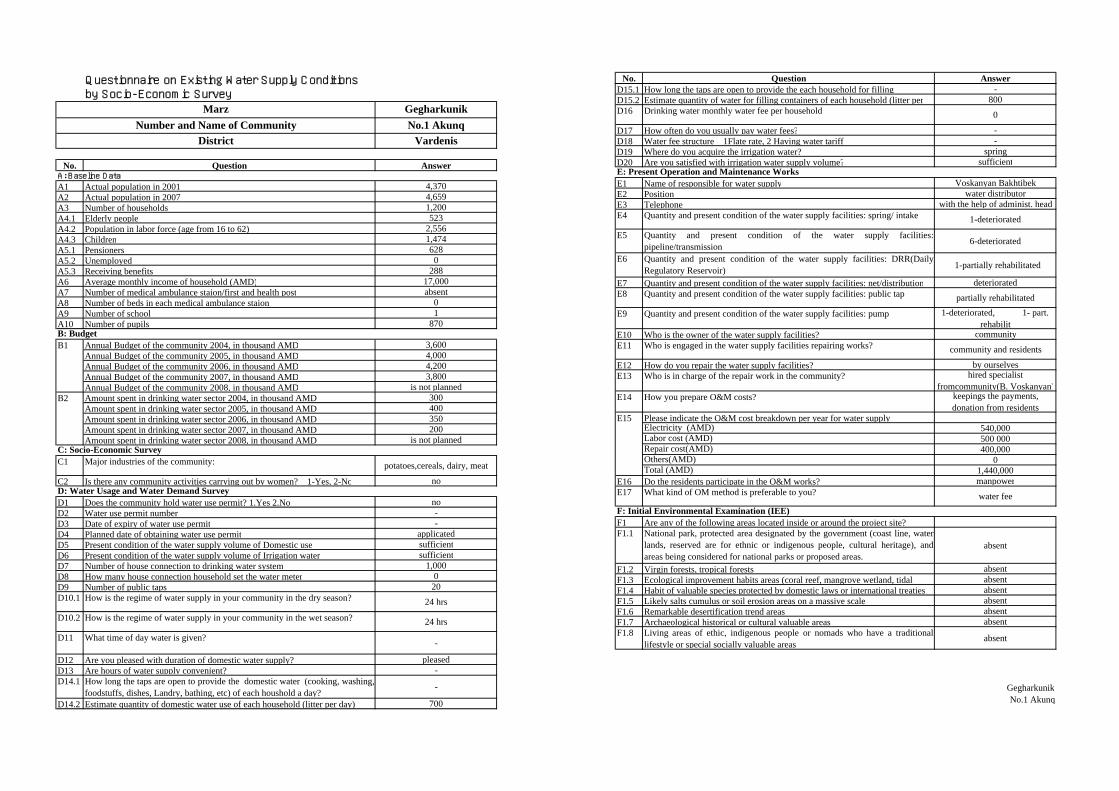
Questionnaire on Existing Water Supply Conditionsby Socio-Economic Survey
GegharkunikNo.1 Akunq
Vardenis
No. Question AnswerA: Baseline DataA1 Actual population in 2001 4,370A2 Actual population in 2007 4,659A3 Number of households 1,200A4.1 Elderly people 523A4.2 Population in labor force (age from 16 to 62) 2,556A4.3 Children 1,474A5.1 Pensioners 628A5.2 Unemployed 0A5.3 Receiving benefits 288A6 Average monthly income of household (AMD) 17,000A7 Number of medical ambulance staion/first and health post absentA8 Number of beds in each medical ambulance staion 0A9 Number of school 1A10 Number of pupils 870B: Budget
Annual Budget of the community 2004, in thousand AMD 3,600Annual Budget of the community 2005, in thousand AMD 4,000Annual Budget of the community 2006, in thousand AMD 4,200Annual Budget of the community 2007, in thousand AMD 3,800Annual Budget of the community 2008, in thousand AMD is not plannedAmount spent in drinking water sector 2004, in thousand AMD 300Amount spent in drinking water sector 2005, in thousand AMD 400Amount spent in drinking water sector 2006, in thousand AMD 350Amount spent in drinking water sector 2007, in thousand AMD 200Amount spent in drinking water sector 2008, in thousand AMD is not planned
C: Socio-Economic SurveyC1 Major industries of the community: potatoes,cereals, dairy, meat
C2 Is there any community activities carrying out by women? 1-Yes, 2-No noD: Water Usage and Water Demand SurveyD1 Does the community hold water use permit? 1.Yes 2.No noD2 Water use permit number -D3 Date of expiry of water use permit -D4 Planned date of obtaining water use permit applicatedD5 Present condition of the water supply volume of Domestic use sufficientD6 Present condition of the water supply volume of Irrigation water sufficientD7 Number of house connection to drinking water system 1,000D8 How many house connection household set the water meter 0D9 Number of public taps 20D10.1 How is the regime of water supply in your community in the dry season? 24 hrs
D10.2 How is the regime of water supply in your community in the wet season? 24 hrs
D11 What time of day water is given? -
D12 Are you pleased with duration of domestic water supply? pleasedD13 Are hours of water supply convenient? -D14.1 How long the taps are open to provide the domestic water (cooking, washing,
foodstuffs, dishes, Landry, bathing, etc) of each houshold a day?-
D14.2 Estimate quantity of domestic water use of each household (litter per day) 700
MarzNumber and Name of Community
District
B1
B2
No. Question AnswerD15.1 How long the taps are open to provide the each household for filling -D15.2 Estimate quantity of water for filling containers of each household (litter per 800D16 Drinking water monthly water fee per household 0
D17 How often do you usually pay water fees? -D18 Water fee structure 1Flate rate, 2 Having water tariff -D19 Where do you acquire the irrigation water? springD20 Are you satisfied with irrigation water supply volume? sufficientE: Present Operation and Maintenance WorksE1 Name of responsible for water supply Voskanyan BakhtibekE2 Position water distributorE3 Telephone with the help of administ. headE4 Quantity and present condition of the water supply facilities: spring/ intake 1-deteriorated
E5 Quantity and present condition of the water supply facilities:pipeline/transmission 6-deteriorated
E6 Quantity and present condition of the water supply facilities: DRR(DailyRegulatory Reservoir) 1-partially rehabilitated
E7 Quantity and present condition of the water supply facilities: net/distribution deterioratedE8 Quantity and present condition of the water supply facilities: public tap partially rehabilitated
E9 Quantity and present condition of the water supply facilities: pump 1-deteriorated, 1- part.rehabilit
E10 Who is the owner of the water supply facilities? communityE11 Who is engaged in the water supply facilities repairing works? community and residents
E12 How do you repair the water supply facilities? by ourselvesE13 Who is in charge of the repair work in the community? hired specialist
fromcommunity(B. Voskanyan)E14 How you prepare O&M costs? keepings the payments,
donation from residentsPlease indicate the O&M cost breakdown per year for water supplyElectricity (AMD) 540,000Labor cost (AMD) 500 000Repair cost(AMD) 400,000Others(AMD) 0Total (AMD) 1,440,000
E16 Do the residents participate in the O&M works? manpowerE17 What kind of OM method is preferable to you? water feeF: Initial Environmental Examination (IEE)F1 Are any of the following areas located inside or around the project site?F1.1 National park, protected area designated by the government (coast line, water
lands, reserved are for ethnic or indigenous people, cultural heritage), andareas being considered for national parks or proposed areas.
absent
F1.2 Virgin forests, tropical forests absentF1.3 Ecological improvement habits areas (coral reef, mangrove wetland, tidal absentF1.4 Habit of valuable species protected by domestic laws or international treaties absentF1.5 Likely salts cumulus or soil erosion areas on a massive scale absentF1.6 Remarkable desertification trend areas absentF1.7 Archaeological historical or cultural valuable areas absentF1.8 Living areas of ethic, indigenous people or nomads who have a traditional
lifestyle or special socially valuable areasabsent
GegharkunikNo.1 Akunq
E15
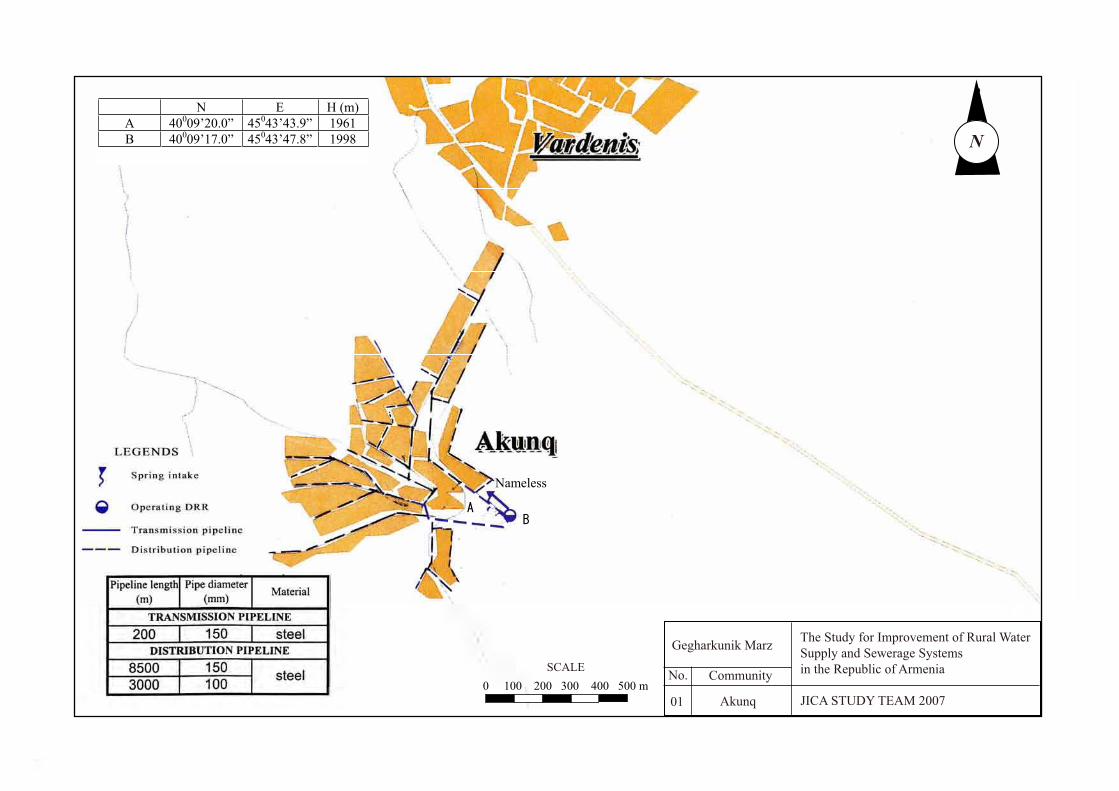
Nameless
N E H (m)A 40009’20.0” 45043’43.9” 1961B 40009’17.0” 45043’47.8” 1998 N
Gegharkunik Marz
No.
Akunq
The Study for Improvement of Rural WaterSupply and Sewerage Systems in the Republic of Armenia
JICA STUDY TEAM 200701
Community0 100 200 300 400 500 m
SCALE
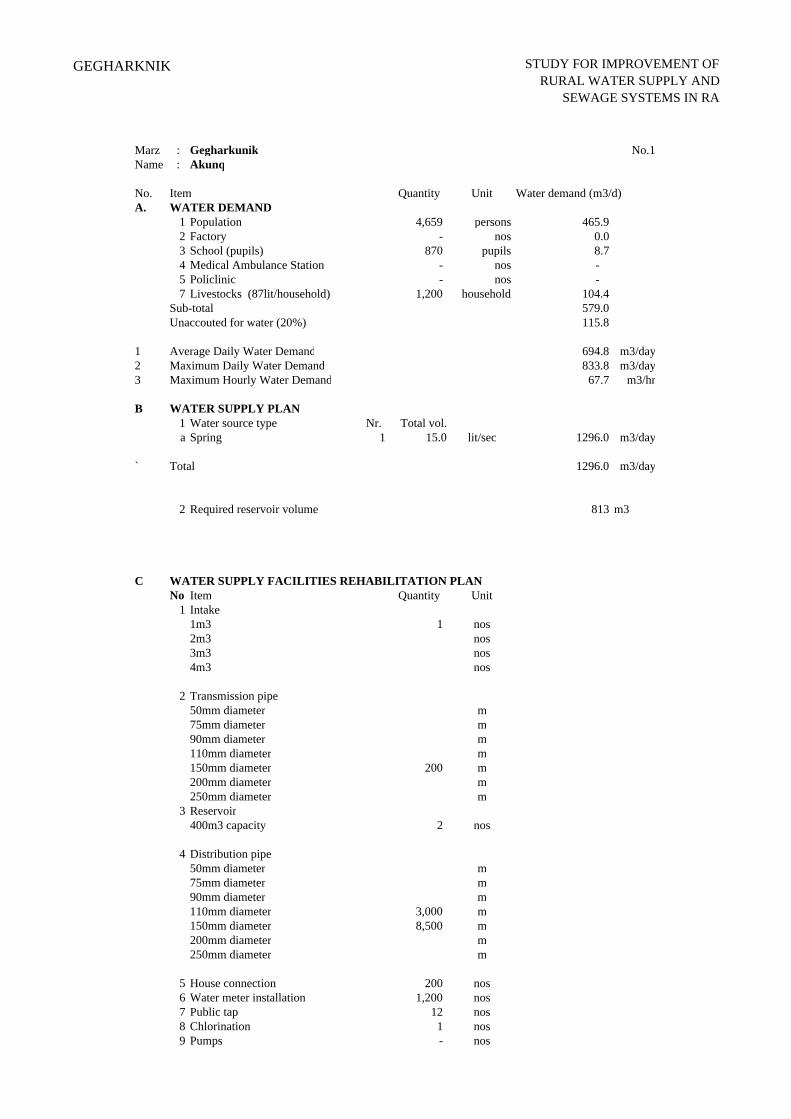
GEGHARKNIK STUDY FOR IMPROVEMENT OF RURAL WATER SUPPLY AND
SEWAGE SYSTEMS IN RA
Marz : Gegharkunik No.1Name : Akunq
No. Item Quantity Unit Water demand (m3/d)A. WATER DEMAND
1 Population 4,659 persons 465.92 Factory - nos 0.03 School (pupils) 870 pupils 8.74 Medical Ambulance Station - nos - 5 Policlinic - nos - 7 Livestocks (87lit/household) 1,200 household 104.4
Sub-total 579.0Unaccouted for water (20%) 115.8
1 Average Daily Water Demand 694.8 m3/day2 Maximum Daily Water Demand 833.8 m3/day3 Maximum Hourly Water Demand 67.7 m3/hr
B WATER SUPPLY PLAN1 Water source type Nr. Total vol.a Spring 1 15.0 lit/sec 1296.0 m3/day
` Total 1296.0 m3/day
2 Required reservoir volume 813 m3
C WATER SUPPLY FACILITIES REHABILITATION PLANNo Item Quantity Unit
1 Intake1m3 1 nos2m3 nos3m3 nos4m3 nos
2 Transmission pipe50mm diameter m75mm diameter m90mm diameter m110mm diameter m150mm diameter 200 m200mm diameter m250mm diameter m
3 Reservoir400m3 capacity 2 nos
4 Distribution pipe50mm diameter m75mm diameter m90mm diameter m110mm diameter 3,000 m150mm diameter 8,500 m200mm diameter m250mm diameter m
5 House connection 200 nos6 Water meter installation 1,200 nos7 Public tap 12 nos8 Chlorination 1 nos9 Pumps - nos
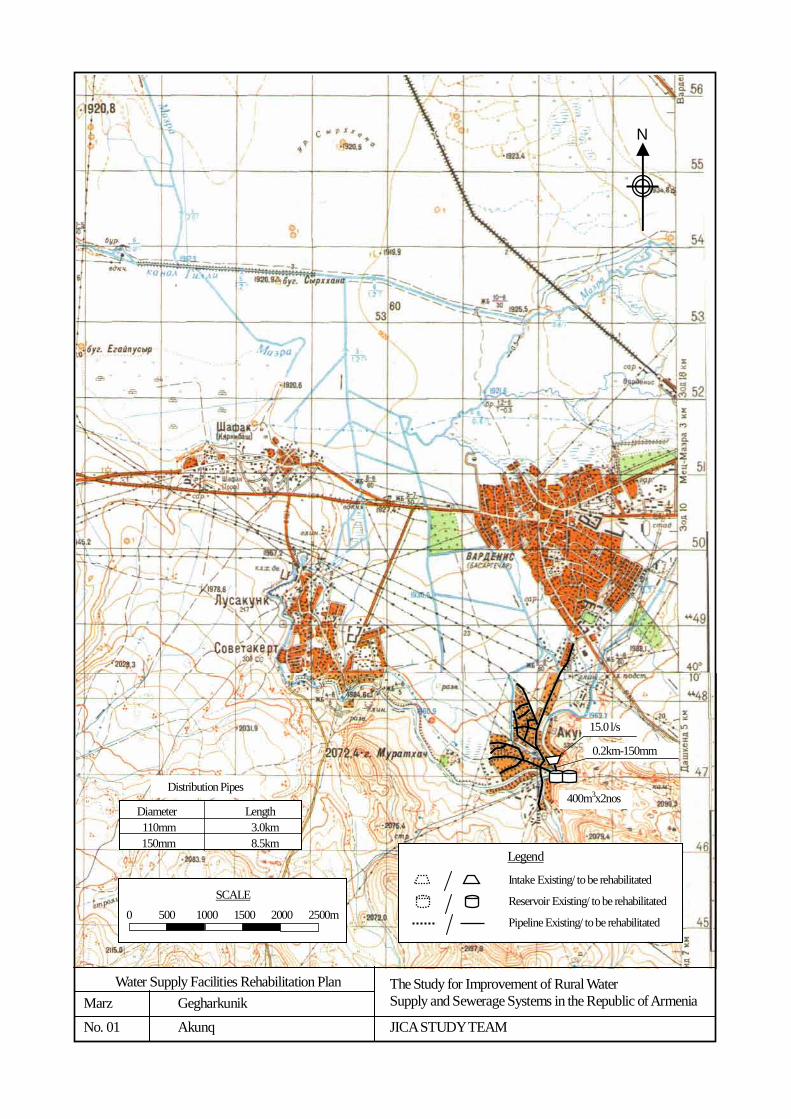
Water Supply Facilities Rehabilitation Plan Marz Gegharkunik No. 01 Akunq
The Study for Improvement of Rural Water Supply and Sewerage Systems in the Republic of Armenia
JICA STUDY TEAM
N
Legend
Intake Existing/ to be rehabilitated
Reservoir Existing/ to be rehabilitated
Pipeline Existing/ to be rehabilitated
SCALE
0 500 1000 1500 2000 2500m
400m3x2nos
15.0 l/s
0.2km-150mm
Diameter Length 110mm 3.0km 150mm 8.5km
Distribution Pipes
STUDY FOR IMPROVEMENT OF RURAL WATER SUPPLY AND
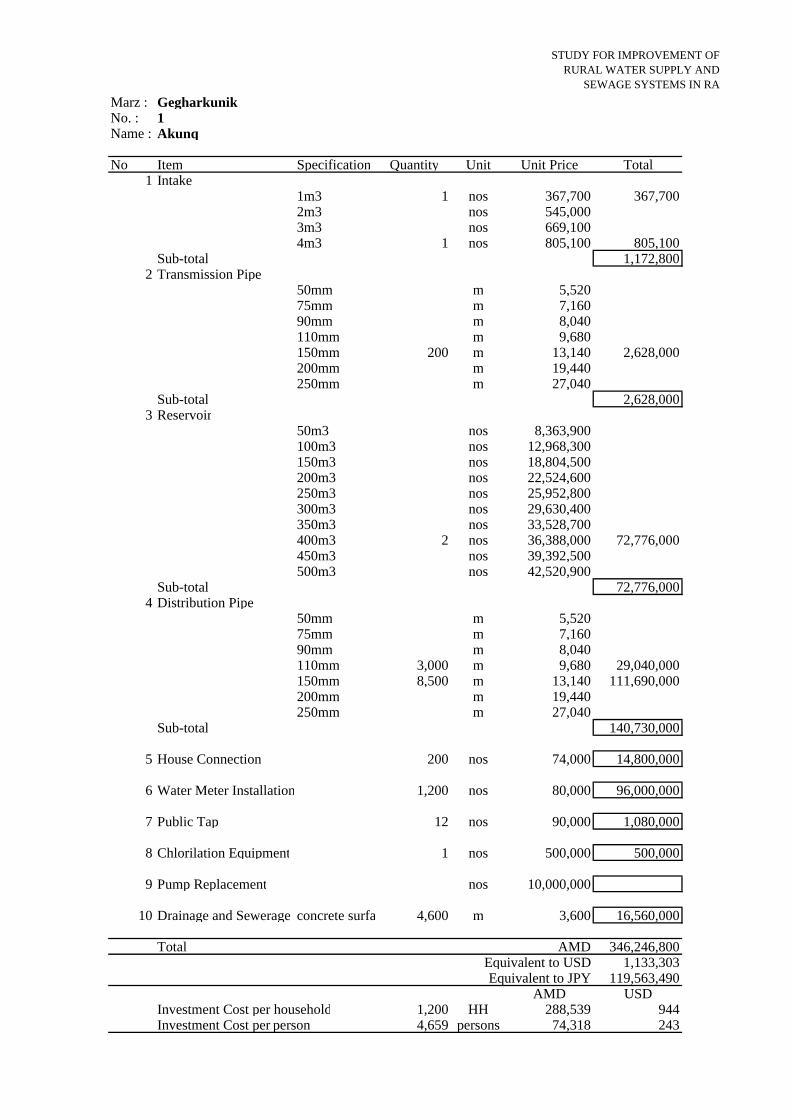
SEWAGE SYSTEMS IN RAMarz : Gegharkunik No. : 1Name : Akunq
No Item Specification Quantity Unit Unit Price Total1 Intake
1m3 1 nos 367,700 367,7002m3 nos 545,0003m3 nos 669,1004m3 1 nos 805,100 805,100
Sub-total 1,172,8002 Transmission Pipe
50mm m 5,52075mm m 7,16090mm m 8,040110mm m 9,680150mm 200 m 13,140 2,628,000200mm m 19,440250mm m 27,040
Sub-total 2,628,0003 Reservoir
50m3 nos 8,363,900100m3 nos 12,968,300150m3 nos 18,804,500200m3 nos 22,524,600250m3 nos 25,952,800300m3 nos 29,630,400350m3 nos 33,528,700400m3 2 nos 36,388,000 72,776,000450m3 nos 39,392,500500m3 nos 42,520,900
Sub-total 72,776,0004 Distribution Pipe
50mm m 5,52075mm m 7,16090mm m 8,040110mm 3,000 m 9,680 29,040,000150mm 8,500 m 13,140 111,690,000200mm m 19,440250mm m 27,040
Sub-total 140,730,000
5 House Connection 200 nos 74,000 14,800,000
6 Water Meter Installation 1,200 nos 80,000 96,000,000
7 Public Tap 12 nos 90,000 1,080,000
8 Chlorilation Equipment 1 nos 500,000 500,000
9 Pump Replacement nos 10,000,000
10 Drainage and Sewerage concrete surfa 4,600 m 3,600 16,560,000
Total AMD 346,246,800Equivalent to USD 1,133,303Equivalent to JPY 119,563,490
AMD USDInvestment Cost per household 1,200 HH 288,539 944Investment Cost per person 4,659 persons 74,318 243
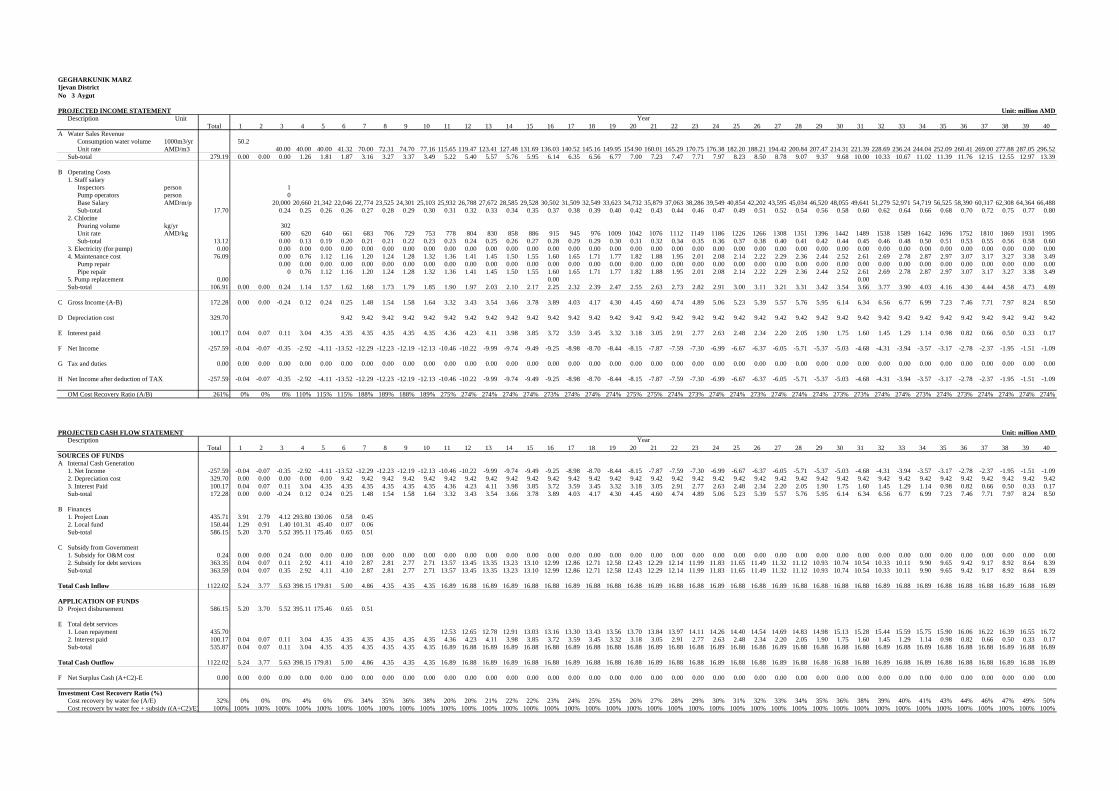
GEGHARKUNIK MARZ
No 1 Akunq41% 41% 18%
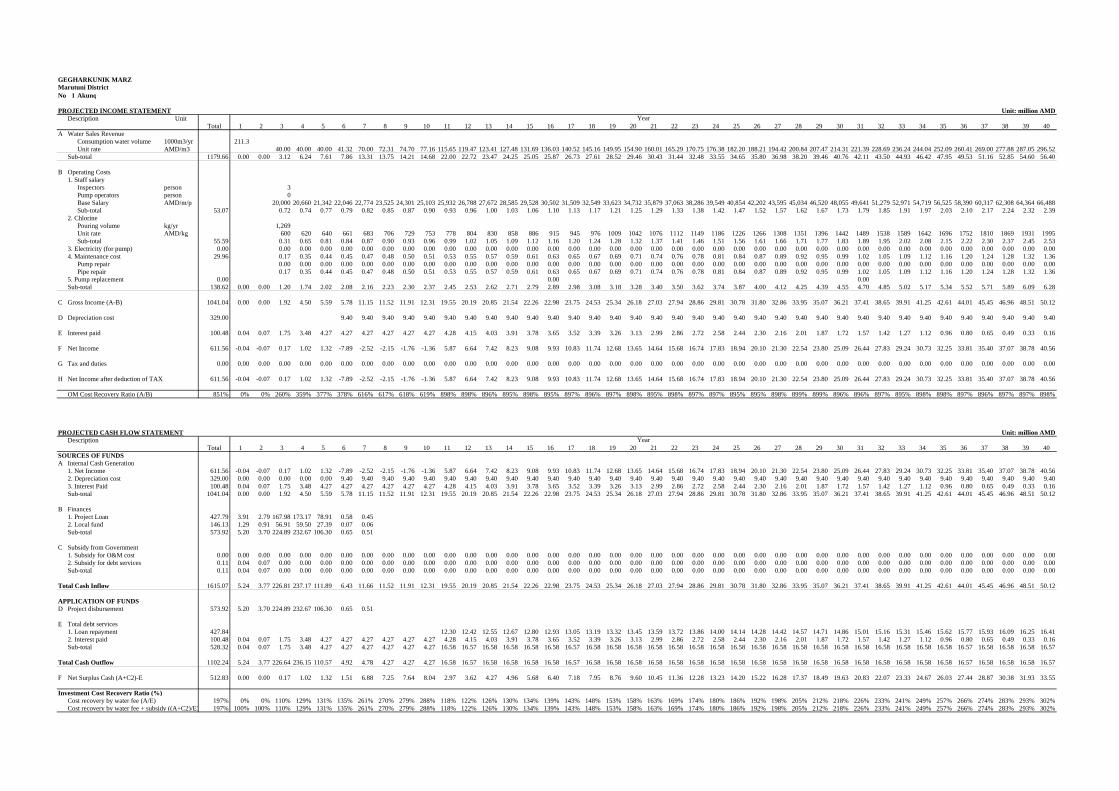
PROJECTED INCOME STATEMENT 41% 82% 100% Unit: million AMDDescription Unit
Total 1 2 3 4 5 6 7 8 9 10 11 12 13 14 15 16 17 18 19 20 21 22 23 24 25 26 27 28 29 30 31 32 33 34 35 36 37 38 39 40A Water Sales Revenue 0 0.00 3.12 6.24 7.61 7.86 13.31 13.75 14.21 14.68 22.00 22.72 23.47 24.25 25.05 25.87 26.73 27.61 28.52 29.46 30.43 31.44 32.48 33.55 34.65 35.80 36.98 38.20 39.46 40.76 42.11 43.50 44.93 46.42 47.95 49.53 51.16 52.85 54.60 56.40
Consumption water volume 1000m3/yr 211.3Unit rate AMD/m3 40.00 40.00 40.00 41.32 70.00 72.31 74.70 77.16 115.65 119.47 123.41 127.48 131.69 136.03 140.52 145.16 149.95 154.90 160.01 165.29 170.75 176.38 182.20 188.21 194.42 200.84 207.47 214.31 221.39 228.69 236.24 244.04 252.09 260.41 269.00 277.88 287.05 296.52
Sub-total 1179.66 0.00 0.00 3.12 6.24 7.61 7.86 13.31 13.75 14.21 14.68 22.00 22.72 23.47 24.25 25.05 25.87 26.73 27.61 28.52 29.46 30.43 31.44 32.48 33.55 34.65 35.80 36.98 38.20 39.46 40.76 42.11 43.50 44.93 46.42 47.95 49.53 51.16 52.85 54.60 56.40
B Operating Costs1. Staff salary 0.72 0.74 0.77 0.79 0.82 0.85 0.87 0.90 0.93 0.96 1.00 1.03 1.06 1.10 1.13 1.17 1.21 1.25 1.29 1.33 1.38 1.42 1.47 1.52 1.57 1.62 1.67 1.73 1.79 1.85 1.91 1.97 2.03 2.10 2.17 2.24 2.32 2.39
Inspectors person 3Pump operators person 0Base Salary AMD/m/p 20,000 20,660 21,342 22,046 22,774 23,525 24,301 25,103 25,932 26,788 27,672 28,585 29,528 30,502 31,509 32,549 33,623 34,732 35,879 37,063 38,286 39,549 40,854 42,202 43,595 45,034 46,520 48,055 49,641 51,279 52,971 54,719 56,525 58,390 60,317 62,308 64,364 66,488Sub-total 53.07 0.72 0.74 0.77 0.79 0.82 0.85 0.87 0.90 0.93 0.96 1.00 1.03 1.06 1.10 1.13 1.17 1.21 1.25 1.29 1.33 1.38 1.42 1.47 1.52 1.57 1.62 1.67 1.73 1.79 1.85 1.91 1.97 2.03 2.10 2.17 2.24 2.32 2.39
2. Chlorine 0.76 0.79 0.81 0.84 0.87 0.90 0.93 0.96 0.99 1.02 1.05 1.09 1.12 1.16 1.20 1.24 1.28 1.32 1.37 1.41 1.46 1.51 1.56 1.61 1.66 1.71 1.77 1.83 1.89 1.95 2.02 2.08 2.15 2.22 2.30 2.37 2.45 2.53Pouring volume kg/yr 1,269Unit rate AMD/kg 600 620 640 661 683 706 729 753 778 804 830 858 886 915 945 976 1009 1042 1076 1112 1149 1186 1226 1266 1308 1351 1396 1442 1489 1538 1589 1642 1696 1752 1810 1869 1931 1995Sub-total 55.59 0.31 0.65 0.81 0.84 0.87 0.90 0.93 0.96 0.99 1.02 1.05 1.09 1.12 1.16 1.20 1.24 1.28 1.32 1.37 1.41 1.46 1.51 1.56 1.61 1.66 1.71 1.77 1.83 1.89 1.95 2.02 2.08 2.15 2.22 2.30 2.37 2.45 2.53
3. Electricity (for pump) 0.00 0.00 0.00 0.00 0.00 0.00 0.00 0.00 0.00 0.00 0.00 0.00 0.00 0.00 0.00 0.00 0.00 0.00 0.00 0.00 0.00 0.00 0.00 0.00 0.00 0.00 0.00 0.00 0.00 0.00 0.00 0.00 0.00 0.00 0.00 0.00 0.00 0.00 0.00 0.004. Maintenance cost 29.96 0.41 0.17 0.35 0.44 0.45 0.47 0.48 0.50 0.51 0.53 0.55 0.57 0.59 0.61 0.63 0.65 0.67 0.69 0.71 0.74 0.76 0.78 0.81 0.84 0.87 0.89 0.92 0.95 0.99 1.02 1.05 1.09 1.12 1.16 1.20 1.24 1.28 1.32 1.36
Pump repair 0.00 0.00 0.00 0.00 0.00 0.00 0.00 0.00 0.00 0.00 0.00 0.00 0.00 0.00 0.00 0.00 0.00 0.00 0.00 0.00 0.00 0.00 0.00 0.00 0.00 0.00 0.00 0.00 0.00 0.00 0.00 0.00 0.00 0.00 0.00 0.00 0.00 0.00 0.00Pipe repair 0.41 0.17 0.35 0.44 0.45 0.47 0.48 0.50 0.51 0.53 0.55 0.57 0.59 0.61 0.63 0.65 0.67 0.69 0.71 0.74 0.76 0.78 0.81 0.84 0.87 0.89 0.92 0.95 0.99 1.02 1.05 1.09 1.12 1.16 1.20 1.24 1.28 1.32 1.36
5. Pump replacement 0.00 0.00 0.00 0.00Sub-total 138.62 0.00 0.00 1.20 1.74 2.02 2.08 2.16 2.23 2.30 2.37 2.45 2.53 2.62 2.71 2.79 2.89 2.98 3.08 3.18 3.28 3.40 3.50 3.62 3.74 3.87 4.00 4.12 4.25 4.39 4.55 4.70 4.85 5.02 5.17 5.34 5.52 5.71 5.89 6.09 6.28
C Gross Income (A-B) 1041.04 0.00 0.00 1.92 4.50 5.59 5.78 11.15 11.52 11.91 12.31 19.55 20.19 20.85 21.54 22.26 22.98 23.75 24.53 25.34 26.18 27.03 27.94 28.86 29.81 30.78 31.80 32.86 33.95 35.07 36.21 37.41 38.65 39.91 41.25 42.61 44.01 45.45 46.96 48.51 50.12
D Depreciation cost 329.00 9.40 9.40 9.40 9.40 9.40 9.40 9.40 9.40 9.40 9.40 9.40 9.40 9.40 9.40 9.40 9.40 9.40 9.40 9.40 9.40 9.40 9.40 9.40 9.40 9.40 9.40 9.40 9.40 9.40 9.40 9.40 9.40 9.40 9.40 9.40
E Interest paid 100.48 0.04 0.07 1.75 3.48 4.27 4.27 4.27 4.27 4.27 4.27 4.28 4.15 4.03 3.91 3.78 3.65 3.52 3.39 3.26 3.13 2.99 2.86 2.72 2.58 2.44 2.30 2.16 2.01 1.87 1.72 1.57 1.42 1.27 1.12 0.96 0.80 0.65 0.49 0.33 0.16
F Net Income 611.56 -0.04 -0.07 0.17 1.02 1.32 -7.89 -2.52 -2.15 -1.76 -1.36 5.87 6.64 7.42 8.23 9.08 9.93 10.83 11.74 12.68 13.65 14.64 15.68 16.74 17.83 18.94 20.10 21.30 22.54 23.80 25.09 26.44 27.83 29.24 30.73 32.25 33.81 35.40 37.07 38.78 40.56
G Tax and duties 0.00 0.00 0.00 0.00 0.00 0.00 0.00 0.00 0.00 0.00 0.00 0.00 0.00 0.00 0.00 0.00 0.00 0.00 0.00 0.00 0.00 0.00 0.00 0.00 0.00 0.00 0.00 0.00 0.00 0.00 0.00 0.00 0.00 0.00 0.00 0.00 0.00 0.00 0.00 0.00 0.00
H Net Income after deduction of TAX 611.56 -0.04 -0.07 0.17 1.02 1.32 -7.89 -2.52 -2.15 -1.76 -1.36 5.87 6.64 7.42 8.23 9.08 9.93 10.83 11.74 12.68 13.65 14.64 15.68 16.74 17.83 18.94 20.10 21.30 22.54 23.80 25.09 26.44 27.83 29.24 30.73 32.25 33.81 35.40 37.07 38.78 40.56
OM Cost Recovery Ratio (A/B) 851% 0% 0% 260% 359% 377% 378% 616% 617% 618% 619% 898% 898% 896% 895% 898% 895% 897% 896% 897% 898% 895% 898% 897% 897% 895% 895% 898% 899% 899% 896% 896% 897% 895% 898% 898% 897% 896% 897% 897% 898%
PROJECTED CASH FLOW STATEMENT Unit: million AMDDescription
Total 1 2 3 4 5 6 7 8 9 10 11 12 13 14 15 16 17 18 19 20 21 22 23 24 25 26 27 28 29 30 31 32 33 34 35 36 37 38 39 40SOURCES OF FUNDSA Internal Cash Generation
1. Net Income 611.56 -0.04 -0.07 0.17 1.02 1.32 -7.89 -2.52 -2.15 -1.76 -1.36 5.87 6.64 7.42 8.23 9.08 9.93 10.83 11.74 12.68 13.65 14.64 15.68 16.74 17.83 18.94 20.10 21.30 22.54 23.80 25.09 26.44 27.83 29.24 30.73 32.25 33.81 35.40 37.07 38.78 40.562. Depreciation cost 329.00 0.00 0.00 0.00 0.00 0.00 9.40 9.40 9.40 9.40 9.40 9.40 9.40 9.40 9.40 9.40 9.40 9.40 9.40 9.40 9.40 9.40 9.40 9.40 9.40 9.40 9.40 9.40 9.40 9.40 9.40 9.40 9.40 9.40 9.40 9.40 9.40 9.40 9.40 9.40 9.403. Interest Paid 100.48 0.04 0.07 1.75 3.48 4.27 4.27 4.27 4.27 4.27 4.27 4.28 4.15 4.03 3.91 3.78 3.65 3.52 3.39 3.26 3.13 2.99 2.86 2.72 2.58 2.44 2.30 2.16 2.01 1.87 1.72 1.57 1.42 1.27 1.12 0.96 0.80 0.65 0.49 0.33 0.16Sub-total 1041.04 0.00 0.00 1.92 4.50 5.59 5.78 11.15 11.52 11.91 12.31 19.55 20.19 20.85 21.54 22.26 22.98 23.75 24.53 25.34 26.18 27.03 27.94 28.86 29.81 30.78 31.80 32.86 33.95 35.07 36.21 37.41 38.65 39.91 41.25 42.61 44.01 45.45 46.96 48.51 50.12
-0.04 #REF! #REF! #REF! #REF! #REF! #REF! #REF! #REF! #REF! #REF! #REF! #REF! #REF! #REF! #REF! #REF! #REF! #REF! #REF! #REF! #REF! #REF! #REF! #REF! #REF! #REF! #REF! #REF! #REF! #REF! #REF! #REF! #REF! #REF! #REF! #REF! #REF! #REF! #REF!B Finances
1. Project Loan 427.79 3.91 2.79 167.98 173.17 78.91 0.58 0.452. Local fund 146.13 1.29 0.91 56.91 59.50 27.39 0.07 0.06Sub-total 573.92 5.20 3.70 224.89 232.67 106.30 0.65 0.51
C Subsidy from Government1. Subsidy for O&M cost 0.00 0.00 0.00 0.00 0.00 0.00 0.00 0.00 0.00 0.00 0.00 0.00 0.00 0.00 0.00 0.00 0.00 0.00 0.00 0.00 0.00 0.00 0.00 0.00 0.00 0.00 0.00 0.00 0.00 0.00 0.00 0.00 0.00 0.00 0.00 0.00 0.00 0.00 0.00 0.00 0.002. Subsidy for debt services 0.11 0.04 0.07 0.00 0.00 0.00 0.00 0.00 0.00 0.00 0.00 0.00 0.00 0.00 0.00 0.00 0.00 0.00 0.00 0.00 0.00 0.00 0.00 0.00 0.00 0.00 0.00 0.00 0.00 0.00 0.00 0.00 0.00 0.00 0.00 0.00 0.00 0.00 0.00 0.00 0.00Sub-total 0.11 0.04 0.07 0.00 0.00 0.00 0.00 0.00 0.00 0.00 0.00 0.00 0.00 0.00 0.00 0.00 0.00 0.00 0.00 0.00 0.00 0.00 0.00 0.00 0.00 0.00 0.00 0.00 0.00 0.00 0.00 0.00 0.00 0.00 0.00 0.00 0.00 0.00 0.00 0.00 0.00
Total Cash Inflow 1615.07 5.24 3.77 226.81 237.17 111.89 6.43 11.66 11.52 11.91 12.31 19.55 20.19 20.85 21.54 22.26 22.98 23.75 24.53 25.34 26.18 27.03 27.94 28.86 29.81 30.78 31.80 32.86 33.95 35.07 36.21 37.41 38.65 39.91 41.25 42.61 44.01 45.45 46.96 48.51 50.12
APPLICATION OF FUNDSD Project disbursement 573.92 5.20 3.70 224.89 232.67 106.30 0.65 0.51
E Total debt services1. Loan repayment 427.84 12.30 12.42 12.55 12.67 12.80 12.93 13.05 13.19 13.32 13.45 13.59 13.72 13.86 14.00 14.14 14.28 14.42 14.57 14.71 14.86 15.01 15.16 15.31 15.46 15.62 15.77 15.93 16.09 16.25 16.412. Interest paid 100.48 0.04 0.07 1.75 3.48 4.27 4.27 4.27 4.27 4.27 4.27 4.28 4.15 4.03 3.91 3.78 3.65 3.52 3.39 3.26 3.13 2.99 2.86 2.72 2.58 2.44 2.30 2.16 2.01 1.87 1.72 1.57 1.42 1.27 1.12 0.96 0.80 0.65 0.49 0.33 0.16Sub-total 528.32 0.04 0.07 1.75 3.48 4.27 4.27 4.27 4.27 4.27 4.27 16.58 16.57 16.58 16.58 16.58 16.58 16.57 16.58 16.58 16.58 16.58 16.58 16.58 16.58 16.58 16.58 16.58 16.58 16.58 16.58 16.58 16.58 16.58 16.58 16.58 16.57 16.58 16.58 16.58 16.57
Total Cash Outflow 1102.24 5.24 3.77 226.64 236.15 110.57 4.92 4.78 4.27 4.27 4.27 16.58 16.57 16.58 16.58 16.58 16.58 16.57 16.58 16.58 16.58 16.58 16.58 16.58 16.58 16.58 16.58 16.58 16.58 16.58 16.58 16.58 16.58 16.58 16.58 16.58 16.57 16.58 16.58 16.58 16.57
F Net Surplus Cash (A+C2)-E 512.83 0.00 0.00 0.17 1.02 1.32 1.51 6.88 7.25 7.64 8.04 2.97 3.62 4.27 4.96 5.68 6.40 7.18 7.95 8.76 9.60 10.45 11.36 12.28 13.23 14.20 15.22 16.28 17.37 18.49 19.63 20.83 22.07 23.33 24.67 26.03 27.44 28.87 30.38 31.93 33.55
Investment Cost Recovery Ratio (%)Cost recovery by water fee (A/E) 197% 0% 0% 110% 129% 131% 135% 261% 270% 279% 288% 118% 122% 126% 130% 134% 139% 143% 148% 153% 158% 163% 169% 174% 180% 186% 192% 198% 205% 212% 218% 226% 233% 241% 249% 257% 266% 274% 283% 293% 302%Cost recovery by water fee + subsidy ((A+C2)/E) 197% 100% 100% 110% 129% 131% 135% 261% 270% 279% 288% 118% 122% 126% 130% 134% 139% 143% 148% 153% 158% 163% 169% 174% 180% 186% 192% 198% 205% 212% 218% 226% 233% 241% 249% 257% 266% 274% 283% 293% 302%
Marutuni District
Year
Year

GEGHARKUNIK MARZMarutuni DistrictNo 1 Akunq
FINANCIAL ANALYSIS
A COST RECOVERY ANALYSISItem Millon AMD Rate
1 RevenueWater fee revenue 1,179.66 100.0%Subsidy 0.11 0.0%Total 1,179.77 100.0%
2 ExpenditureOM cost 138.62 11.7%Loan repayment 427.84 36.3%Interest paid 100.48 8.5%Surplus cash 512.83 43.5%Total 1,179.77 100.0%
B. FIRR CALCULATION Unit: million AMDDescription Total
1 2 3 4 5 6 7 8 9 10 11 12 13 14 15 16 17 18 19 20 21 22 23 24 25 26 27 28 29 30 31 32 33 34 35 36 37 38 39 40A COST
1. Investment Cost 381.75 3.82 2.73 153.29 153.17 67.79 0.53 0.422. Operation and Maintenance Cost
Salary 27.36 0.72 0.72 0.72 0.72 0.72 0.72 0.72 0.72 0.72 0.72 0.72 0.72 0.72 0.72 0.72 0.72 0.72 0.72 0.72 0.72 0.72 0.72 0.72 0.72 0.72 0.72 0.72 0.72 0.72 0.72 0.72 0.72 0.72 0.72 0.72 0.72 0.72 0.72Chlorine 29.40 0.31 0.65 0.79 0.79 0.79 0.79 0.79 0.79 0.79 0.79 0.79 0.79 0.79 0.79 0.79 0.79 0.79 0.79 0.79 0.79 0.79 0.79 0.79 0.79 0.79 0.79 0.79 0.79 0.79 0.79 0.79 0.79 0.79 0.79 0.79 0.79 0.79 0.79Electricity 0.00 0.00 0.00 0.00 0.00 0.00 0.00 0.00 0.00 0.00 0.00 0.00 0.00 0.00 0.00 0.00 0.00 0.00 0.00 0.00 0.00 0.00 0.00 0.00 0.00 0.00 0.00 0.00 0.00 0.00 0.00 0.00 0.00 0.00 0.00 0.00 0.00 0.00 0.00Mantenance cost 15.27 0.17 0.34 0.41 0.41 0.41 0.41 0.41 0.41 0.41 0.41 0.41 0.41 0.41 0.41 0.41 0.41 0.41 0.41 0.41 0.41 0.41 0.41 0.41 0.41 0.41 0.41 0.41 0.41 0.41 0.41 0.41 0.41 0.41 0.41 0.41 0.41 0.41 0.41Pump replacement 0.00 0.00 0.00 0.00Sub-total 72.03 1.20 1.71 1.92 1.92 1.92 1.92 1.92 1.92 1.92 1.92 1.92 1.92 1.92 1.92 1.92 1.92 1.92 1.92 1.92 1.92 1.92 1.92 1.92 1.92 1.92 1.92 1.92 1.92 1.92 1.92 1.92 1.92 1.92 1.92 1.92 1.92 1.92 1.92
Total Outflow 453.78 3.82 2.73 154.49 154.88 69.71 2.45 2.34 1.92 1.92 1.92 1.92 1.92 1.92 1.92 1.92 1.92 1.92 1.92 1.92 1.92 1.92 1.92 1.92 1.92 1.92 1.92 1.92 1.92 1.92 1.92 1.92 1.92 1.92 1.92 1.92 1.92 1.92 1.92 1.92 1.92
B BENEFIT1. Water Tariff 740.78 0.00 0.00 3.12 6.24 7.61 7.86 13.31 13.75 14.21 14.68 22.00 22.00 22.00 22.00 22.00 22.00 22.00 22.00 22.00 22.00 22.00 22.00 22.00 22.00 22.00 22.00 22.00 22.00 22.00 22.00 22.00 22.00 22.00 22.00 22.00 22.00 22.00 22.00 22.00 22.002. Subsidy 0.00 0.00 0.00 0.00 0.00 0.00 0.00 0.00 0.00 0.00 0.00 0.00 0.00 0.00 0.00 0.00 0.00 0.00 0.00 0.00 0.00 0.00 0.00 0.00 0.00 0.00 0.00 0.00 0.00 0.00 0.00 0.00 0.00 0.00 0.00 0.00 0.00 0.00 0.00 0.00 0.00Total Inflow 740.78 0.00 0.00 3.12 6.24 7.61 7.86 13.31 13.75 14.21 14.68 22.00 22.00 22.00 22.00 22.00 22.00 22.00 22.00 22.00 22.00 22.00 22.00 22.00 22.00 22.00 22.00 22.00 22.00 22.00 22.00 22.00 22.00 22.00 22.00 22.00 22.00 22.00 22.00 22.00 22.00
NET BENEFIT 287.00 -3.82 -2.73 -151.4 -148.6 -62.1 5.41 10.97 11.83 12.29 12.76 20.08 20.08 20.08 20.08 20.08 20.08 20.08 20.08 20.08 20.08 20.08 20.08 20.08 20.08 20.08 20.08 20.08 20.08 20.08 20.08 20.08 20.08 20.08 20.08 20.08 20.08 20.08 20.08 20.08 20.08
FIRR = 3.07%
C. SENSITIVITY ANALYSISNo. Description PV 1.75% 1 2 3 4 5 6 7 8 9 10 11 12 13 14 15 16 17 18 19 20 21 22 23 24 25 26 27 28 29 30 31 32 33 34 35 36 37 38 39 40
1 1 Capital cost 10% up 56.07 -4.20 -3.00 -166.7 -164.0 -68.9 5.36 10.93 11.83 12.29 12.76 20.08 20.08 20.08 20.08 20.08 20.08 20.08 20.08 20.08 20.08 20.08 20.08 20.08 20.08 20.08 20.08 20.08 20.08 20.08 20.08 20.08 20.08 20.08 20.08 20.08 20.08 20.08 20.08 20.08 20.082 Capital cost 20% up 20.29 -4.58 -3.28 -182.0 -179.3 -75.7 5.30 10.89 11.83 12.29 12.76 20.08 20.08 20.08 20.08 20.08 20.08 20.08 20.08 20.08 20.08 20.08 20.08 20.08 20.08 20.08 20.08 20.08 20.08 20.08 20.08 20.08 20.08 20.08 20.08 20.08 20.08 20.08 20.08 20.08 20.08
2 1 OM cost 10% up 86.82 -3.82 -2.73 -151.5 -148.8 -62.3 5.22 10.78 11.64 12.10 12.57 19.89 19.89 19.89 19.89 19.89 19.89 19.89 19.89 19.89 19.89 19.89 19.89 19.89 19.89 19.89 19.89 19.89 19.89 19.89 19.89 19.89 19.89 19.89 19.89 19.89 19.89 19.89 19.89 19.89 19.892 OM cost 20% up 81.80 -3.82 -2.73 -151.6 -149.0 -62.5 5.03 10.59 11.45 11.91 12.38 19.70 19.70 19.70 19.70 19.70 19.70 19.70 19.70 19.70 19.70 19.70 19.70 19.70 19.70 19.70 19.70 19.70 19.70 19.70 19.70 19.70 19.70 19.70 19.70 19.70 19.70 19.70 19.70 19.70 19.70
3 1 Revenue 10% down 41.86 -3.82 -2.73 -151.7 -149.3 -62.9 4.62 9.64 10.46 10.87 11.29 17.88 17.88 17.88 17.88 17.88 17.88 17.88 17.88 17.88 17.88 17.88 17.88 17.88 17.88 17.88 17.88 17.88 17.88 17.88 17.88 17.88 17.88 17.88 17.88 17.88 17.88 17.88 17.88 17.88 17.882 Revenue 20% down -8.14 -3.82 -2.73 -152.0 -149.9 -63.6 3.84 8.31 9.08 9.45 9.82 15.68 15.68 15.68 15.68 15.68 15.68 15.68 15.68 15.68 15.68 15.68 15.68 15.68 15.68 15.68 15.68 15.68 15.68 15.68 15.68 15.68 15.68 15.68 15.68 15.68 15.68 15.68 15.68 15.68 15.68
No. Description FIRR Sensitivity indicator Swiching value1 1 Capital cost 10% up 2.51%
2 Capital cost 20% up 2.01%2 1 OM cost 10% up 3.00%
2 OM cost 20% up 2.93%3 1 Revenue 10% down 2.38%
2 Revenue 20% down 1.62%
2.255.30
Year
0.230.482.938.93
34.10%11.20%
44.40%18.88%
430.56%209.86%

No.2 Aghberq
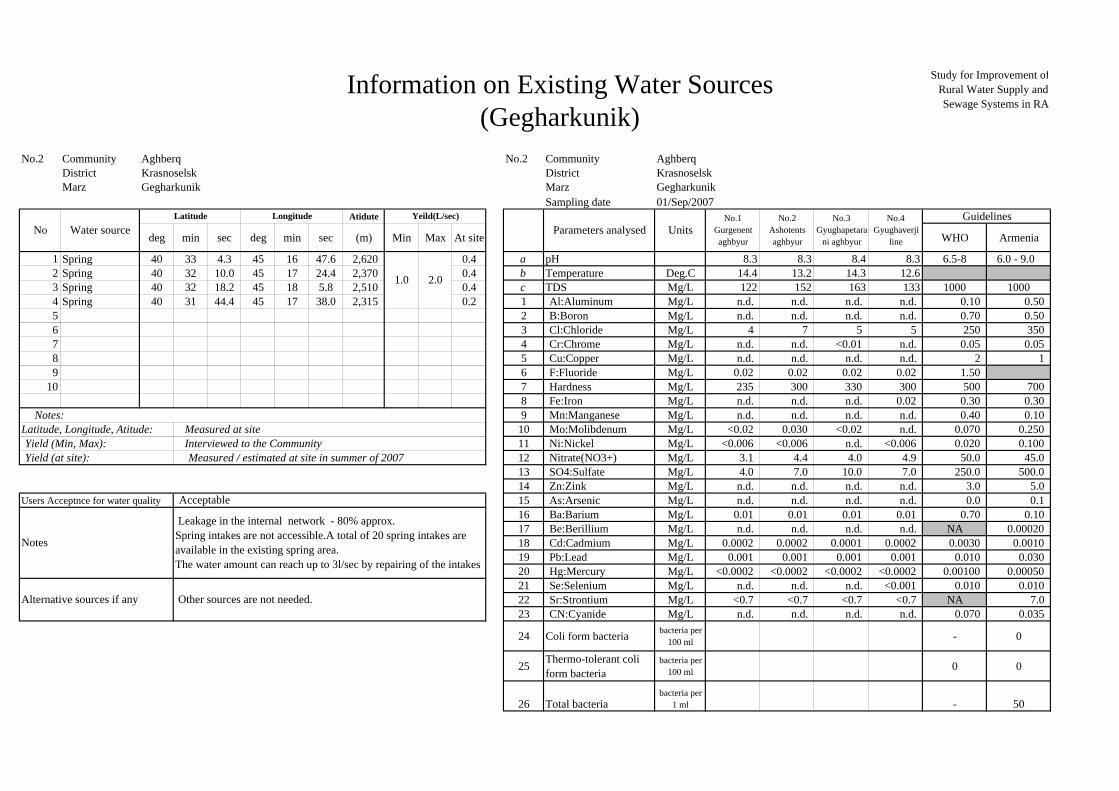
Information on Existing Water Sources(Gegharkunik)
Study for Improvement ofRural Water Supply andSewage Systems in RA
No.2 Community Aghberq No.2 Community Aghberq No. 1District Krasnoselsk District KrasnoselskMarz Gegharkunik Marz Gegharkunik
Sampling date 01/Sep/2007Atidute
deg min sec deg min sec (m) Min Max At site WHO Armenia
1 Spring 40 33 4.3 45 16 47.6 2,620 0.4 a pH 8.3 8.3 8.4 8.3 6.5-8 6.0 - 9.0 2 Spring 40 32 10.0 45 17 24.4 2,370 0.4 b Temperature Deg.C 14.4 13.2 14.3 12.63 Spring 40 32 18.2 45 18 5.8 2,510 0.4 c TDS Mg/L 122 152 163 133 1000 10004 Spring 40 31 44.4 45 17 38.0 2,315 0.2 1 Al:Aluminum Mg/L n.d. n.d. n.d. n.d. 0.10 0.50 5 2 B:Boron Mg/L n.d. n.d. n.d. n.d. 0.70 0.50 6 3 Cl:Chloride Mg/L 4 7 5 5 250 350 7 4 Cr:Chrome Mg/L n.d. n.d. <0.01 n.d. 0.05 0.05 8 5 Cu:Copper Mg/L n.d. n.d. n.d. n.d. 2 1 9 6 F:Fluoride Mg/L 0.02 0.02 0.02 0.02 1.50
10 7 Hardness Mg/L 235 300 330 300 500 700 8 Fe:Iron Mg/L n.d. n.d. n.d. 0.02 0.30 0.30
Notes: 9 Mn:Manganese Mg/L n.d. n.d. n.d. n.d. 0.40 0.10 Latitude, Longitude, Atitude: Measured at site 10 Mo:Molibdenum Mg/L <0.02 0.030 <0.02 n.d. 0.070 0.250 Yield (Min, Max): Interviewed to the Community 11 Ni:Nickel Mg/L <0.006 <0.006 n.d. <0.006 0.020 0.100 Yield (at site): Measured / estimated at site in summer of 2007 12 Nitrate(NO3+) Mg/L 3.1 4.4 4.0 4.9 50.0 45.0
13 SO4:Sulfate Mg/L 4.0 7.0 10.0 7.0 250.0 500.0 14 Zn:Zink Mg/L n.d. n.d. n.d. n.d. 3.0 5.0
Users Acceptnce for water quality 15 As:Arsenic Mg/L n.d. n.d. n.d. n.d. 0.0 0.1 16 Ba:Barium Mg/L 0.01 0.01 0.01 0.01 0.70 0.10 17 Be:Berillium Mg/L n.d. n.d. n.d. n.d. NA 0.00020 18 Cd:Cadmium Mg/L 0.0002 0.0002 0.0001 0.0002 0.0030 0.0010 19 Pb:Lead Mg/L 0.001 0.001 0.001 0.001 0.010 0.030 20 Hg:Mercury Mg/L <0.0002 <0.0002 <0.0002 <0.0002 0.00100 0.00050 21 Se:Selenium Mg/L n.d. n.d. n.d. <0.001 0.010 0.010 22 Sr:Strontium Mg/L <0.7 <0.7 <0.7 <0.7 NA 7.0 23 CN:Cyanide Mg/L n.d. n.d. n.d. n.d. 0.070 0.035
24 Coli form bacteria bacteria per100 ml - 0
25 Thermo-tolerant coliform bacteria
bacteria per100 ml 0 0
26 Total bacteriabacteria per
1 ml - 50
Guidelines
Acceptable
Notes
Leakage in the internal network - 80% approx.Spring intakes are not accessible.A total of 20 spring intakes areavailable in the existing spring area.The water amount can reach up to 3l/sec by repairing of the intakes
Parameters analysed UnitsNo.1
Gurgenentaghbyur
No.2Ashotentsaghbyur
No.3Gyughapetara
ni aghbyur
No.4Gyughaverji
line
Alternative sources if any Other sources are not needed.
1.0 2.0
Yeild(L/sec)No Water source
Latitude Longitude

Information on Existing Water SourcesExisting Bacteriological Test
Study for Improvement ofRural Water Supply andSewage Systems in RA
No.2 Community AghberqDistrict KrasnoselskMarz Gegharkunik
Total amount of bacteria Total amount of coliform bacteria Coliform bacteria tolerant to heat
nos/1mL MPN/100mL nos/100 mL
Less than 50nos/1mL Not identified Not identified1 01 12 30 - Not identified2 02 15 45 - Not identified3 03 02 35 - Not identified4 04 03 45 - Not identified5 06 05 40 - Not identified6 06 22 150 0.7-2.1 Not identified7 07 20 35 - Not identified8 08 08 35 - Not identified9 08 14 40 - Not identified
No. Month Date
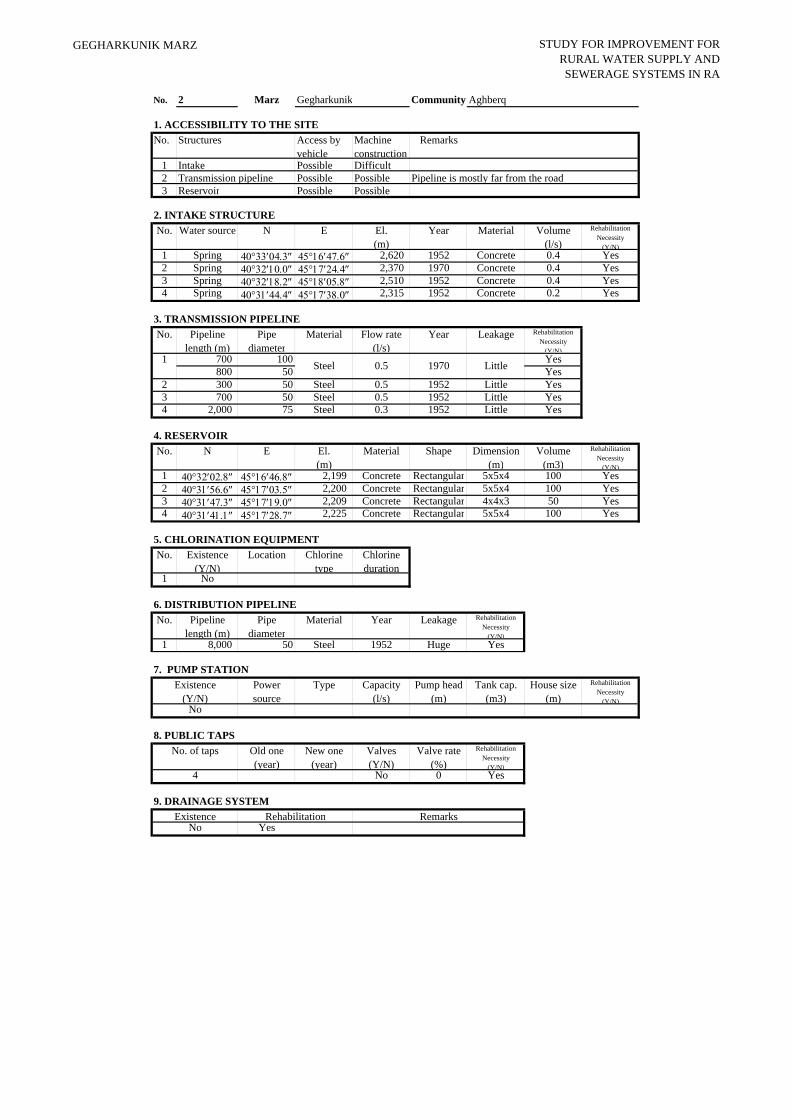
GEGHARKUNIK MARZ STUDY FOR IMPROVEMENT FORRURAL WATER SUPPLY ANDSEWERAGE SYSTEMS IN RA
No. 2 Marz Gegharkunik Community Aghberq
1. ACCESSIBILITY TO THE SITENo. Structures Access by
vehicleMachineconstruction
Remarks
1 Intake Possible Difficult2 Transmission pipeline Possible Possible Pipeline is mostly far from the road3 Reservoir Possible Possible
2. INTAKE STRUCTURENo. Water source N E El.
(m)Year Material Volume
(l/s)Rehabilitation
Necessity(Y/N)
1 Spring 40°33′04.3″ 45°16′47.6″ 2,620 1952 Concrete 0.4 Yes2 Spring 40°32′10.0″ 45°17′24.4″ 2,370 1970 Concrete 0.4 Yes3 Spring 40°32′18.2″ 45°18′05.8″ 2,510 1952 Concrete 0.4 Yes4 Spring 40°31′44.4″ 45°17′38.0″ 2,315 1952 Concrete 0.2 Yes
3. TRANSMISSION PIPELINENo. Pipeline
length (m)Pipe
diameterMaterial Flow rate
(l/s)Year Leakage Rehabilitation
Necessity(Y/N)
1 700 100 Yes800 50 Yes
2 300 50 Steel 0.5 1952 Little Yes3 700 50 Steel 0.5 1952 Little Yes4 2,000 75 Steel 0.3 1952 Little Yes
4. RESERVOIRNo. N E El.
(m)Material Shape Dimension
(m)Volume
(m3)Rehabilitation
Necessity(Y/N)
1 40°32′02.8″ 45°16′46.8″ 2,199 Concrete Rectangular 5x5x4 100 Yes2 40°31′56.6″ 45°17′03.5″ 2,200 Concrete Rectangular 5x5x4 100 Yes3 40°31′47.3″ 45°17′19.0″ 2,209 Concrete Rectangular 4x4x3 50 Yes4 40°31′41.1″ 45°17′28.7″ 2,225 Concrete Rectangular 5x5x4 100 Yes
5. CHLORINATION EQUIPMENTNo. Existence
(Y/N)Location Chlorine
typeChlorineduration
1 No
6. DISTRIBUTION PIPELINENo. Pipeline
length (m)Pipe
diameterMaterial Year Leakage Rehabilitation
Necessity(Y/N)
1 8,000 50 Steel 1952 Huge Yes
7. PUMP STATIONPowersource
Type Capacity(l/s)
Pump head(m)
Tank cap.(m3)
House size(m)
RehabilitationNecessity
(Y/N)
8. PUBLIC TAPSOld one(year)
New one(year)
Valves(Y/N)
Valve rate(%)
RehabilitationNecessity
(Y/N)No 0 Yes
9. DRAINAGE SYSTEM
YesRehabilitation
1970 LittleSteel 0.5
RemarksNo
Existence(Y/N)
No
No. of taps
4
Existence

Questionnaire on Existing Water Supply Conditionsby Socio-Economic Survey
No. QuestionA: Baseline DataA1 Actual population in 2001A2 Actual population in 2007A3 Number of householdsA4.1 Elderly peopleA4.2 Population in labor force (age from 16 to 62)A4.3 ChildrenA5.1 PensionersA5.2 UnemployedA5.3 Receiving benefitsA6 Average monthly income of household (AMD)A7 Number of medical ambulance staion/first and health postA8 Number of beds in each medical ambulance staionA9 Number of schoolA10 Number of pupilsB: Budget
Annual Budget of the community 2004, in thousand AMDAnnual Budget of the community 2005, in thousand AMDAnnual Budget of the community 2006, in thousand AMDAnnual Budget of the community 2007, in thousand AMDAnnual Budget of the community 2008, in thousand AMDAmount spent in drinking water sector 2004, in thousand AMDAmount spent in drinking water sector 2005, in thousand AMDAmount spent in drinking water sector 2006, in thousand AMDAmount spent in drinking water sector 2007, in thousand AMDAmount spent in drinking water sector 2008, in thousand AMD
C: Socio-Economic SurveyC1 Major industries of the community:
C2 Is there any community activities carrying out by women? 1-Yes, 2-NoD: Water Usage and Water Demand SurveyD1 Does the community hold water use permit? 1.Yes 2.NoD2 Water use permit numberD3 Date of expiry of water use permitD4 Planned date of obtaining water use permitD5 Present condition of the water supply volume of Domestic useD6 Present condition of the water supply volume of Irrigation waterD7 Number of house connection to drinking water systemD8 How many house connection household set the water meterD9 Number of public tapsD10.1 How is the regime of water supply in your community in the dry season?
D10.2 How is the regime of water supply in your community in the wet season?
D11 What time of day water is given?
D12 Are you pleased with duration of domestic water supply?D13 Are hours of water supply convenient?D14.1 How long the taps are open to provide the domestic water (cooking, washing,
foodstuffs, dishes, Landry, bathing, etc) of each houshold a day?D14.2 Estimate quantity of domestic water use of each household (litter per day)
MarzNumber and Name of Community
District
B1
B2
GegharkunikNo.2 Aghberq
Kranoseisk
Answer
3553168119
23562301029
50,000absent
01
42
3,4503,5403,7203,974
is not planned0000
is not planned
potatoes,cabbage, cereals, dairy,meatno
no--
is not plannedinsufficient
absent7700
24 hrs
24 hrs
-
pleased-
-
3,000
No. QuestionD15.1 How long the taps are open to provide the each household for fillingD15.2 Estimate quantity of water for filling containers of each household (litter perD16 Drinking water monthly water fee per household
D17 How often do you usually pay water fees?D18 Water fee structure 1Flate rate, 2 Having water tariffD19 Where do you acquire the irrigation water?D20 Are you satisfied with irrigation water supply volume?E: Present Operation and Maintenance WorksE1 Name of responsible for water supplyE2 PositionE3 TelephoneE4 Quantity and present condition of the water supply facilities: spring/ intake
E5 Quantity and present condition of the water supply facilities:pipeline/transmission
E6 Quantity and present condition of the water supply facilities: DRR(DailyRegulatory Reservoir)
E7 Quantity and present condition of the water supply facilities: net/distributionE8 Quantity and present condition of the water supply facilities: public tap
E9 Quantity and present condition of the water supply facilities: pump
E10 Who is the owner of the water supply facilities?E11 Who is engaged in the water supply facilities repairing works?
E12 How do you repair the water supply facilities?E13 Who is in charge of the repair work in the community?
E14 How you prepare O&M costs?
Please indicate the O&M cost breakdown per year for water supplyElectricity (AMD)Labor cost (AMD)Repair cost(AMD)Others(AMD)Total (AMD)
E16 Do the residents participate in the O&M works?E17 What kind of OM method is preferable to you?
F: Initial Environmental Examination (IEE)F1 Are any of the following areas located inside or around the project site?F1.1 National park, protected area designated by the government (coast line, water
lands, reserved are for ethnic or indigenous people, cultural heritage), andareas being considered for national parks or proposed areas.
F1.2 Virgin forests, tropical forestsF1.3 Ecological improvement habits areas (coral reef, mangrove wetland, tidalF1.4 Habit of valuable species protected by domestic laws or international treatiesF1.5 Likely salts cumulus or soil erosion areas on a massive scaleF1.6 Remarkable desertification trend areasF1.7 Archaeological historical or cultural valuable areasF1.8 Living areas of ethic, indigenous people or nomads who have a traditional
lifestyle or special socially valuable areas
E15
Answer-
3,000
0
--
absentinsufficient.
nobody
28-deteriorated
4-deteriorated
6-partially rehabilitated
deteriorated
absent
absent
communitycommunity, environmental
organizationsby ourselves
administration head
donation from variousorganizations
00000
absentresidents participation, water fee
reduction
absent
absentabsentabsentabsentabsentabsent
absent
GegharkunikNo.2 Aghberq
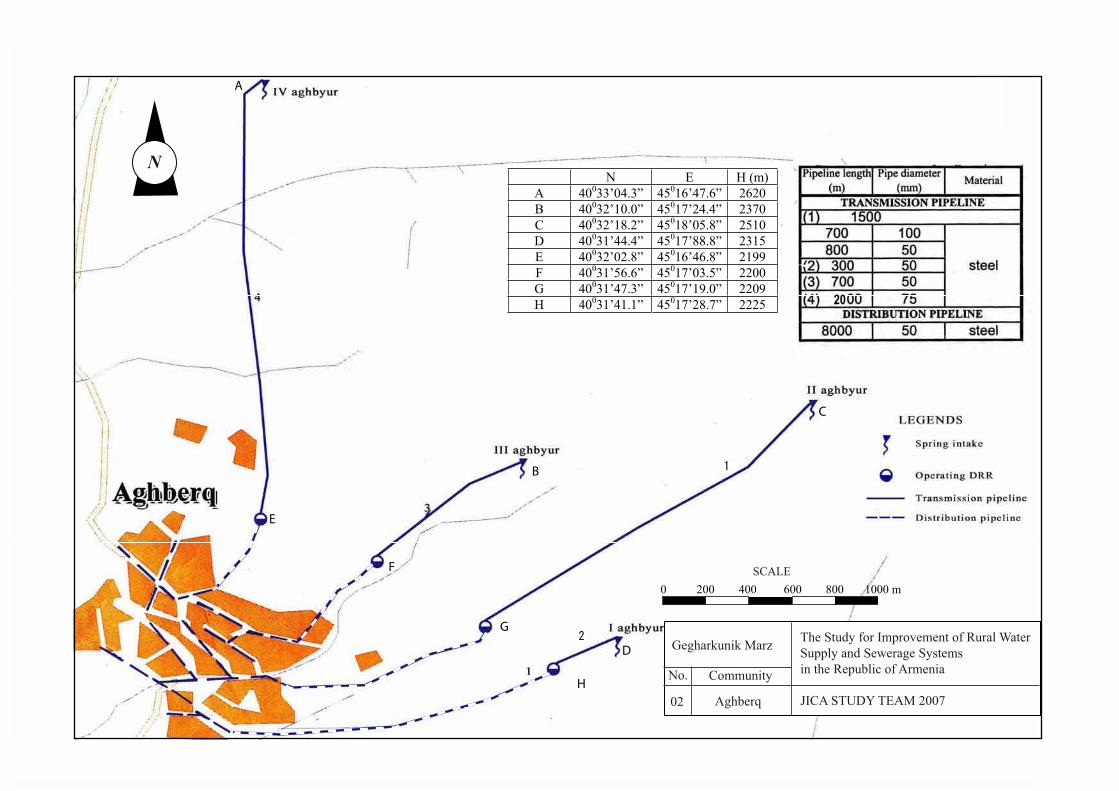
B
C
D
E
F
G
A
H
N E H (m)A 40033’04.3” 45016’47.6” 2620B 40032’10.0” 45017’24.4” 2370C 40032’18.2” 45018’05.8” 2510D 40031’44.4” 45017’88.8” 2315E 40032’02.8” 45016’46.8” 2199F 40031’56.6” 45017’03.5” 2200G 40031’47.3” 45017’19.0” 2209H 40031’41.1” 45017’28.7” 2225
N
Gegharkunik Marz
No.
Aghberq
The Study for Improvement of Rural WaterSupply and Sewerage Systems in the Republic of Armenia
JICA STUDY TEAM 200702
Community
0 200 400 600 800 1000 mSCALE
20

GEGHARKNIK STUDY FOR IMPROVEMENT OF RURAL WATER SUPPLY AND
SEWAGE SYSTEMS IN RA
Marz : Gegharkunik No.2Name : Aghberq
No. Item Quantity Unit Water demand (m3/d)A. WATER DEMAND
1 Population 316 persons 31.62 Factory - nos 0.03 School (pupils) 42 pupils 0.44 Medical Ambulance Station - nos - 5 Policlinic - nos - 7 Livestocks (87lit/household) 81 household 7
Sub-total 39.0Unaccouted for water (20%) 7.8
1 Average Daily Water Demand 46.8 m3/day2 Maximum Daily Water Demand 56.2 m3/day3 Maximum Hourly Water Demand 10.6 m3/hr
B WATER SUPPLY PLAN1 Water source type Nr. Total vol.a Spring 4 1.4 lit/sec 121.0 m3/day
` Total 121.0 m3/day
2 Required reservoir volume 128 m3
C WATER SUPPLY FACILITIES REHABILITATION PLANNo Item Quantity Unit
1 Intake1m3 4 nos2m3 nos3m3 nos4m3 nos
2 Transmission pipe50mm diameter 4,500 m75mm diameter m90mm diameter m110mm diameter m150mm diameter m200mm diameter m250mm diameter m
3 Reservoir50m3 capacity 4 nos For each route
4 Distribution pipe50mm diameter 8,000 m75mm diameter m90mm diameter m110mm diameter m150mm diameter m200mm diameter m250mm diameter m
5 House connection 4 nos6 Water meter installation 81 nos7 Public tap 1 nos8 Chlorination 4 nos9 Pumps - nos
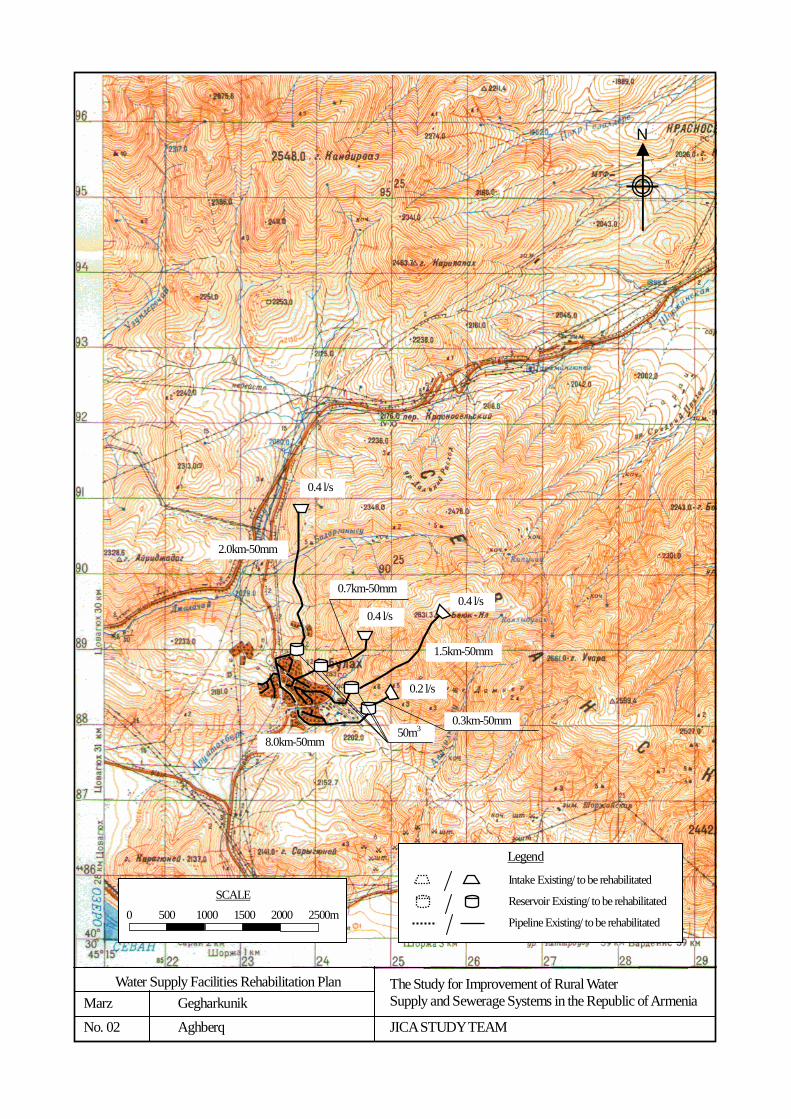
Water Supply Facilities Rehabilitation Plan Marz Gegharkunik No. 02 Aghberq
The Study for Improvement of Rural Water Supply and Sewerage Systems in the Republic of Armenia
JICA STUDY TEAM
N
Legend
Intake Existing/ to be rehabilitated
Reservoir Existing/ to be rehabilitated
Pipeline Existing/ to be rehabilitated
SCALE
0 500 1000 1500 2000 2500m
50m3
0.4 l/s
0.3km-50mm
0.4 l/s0.4 l/s
0.2 l/s
2.0km-50mm
0.7km-50mm
1.5km-50mm
8.0km-50mm
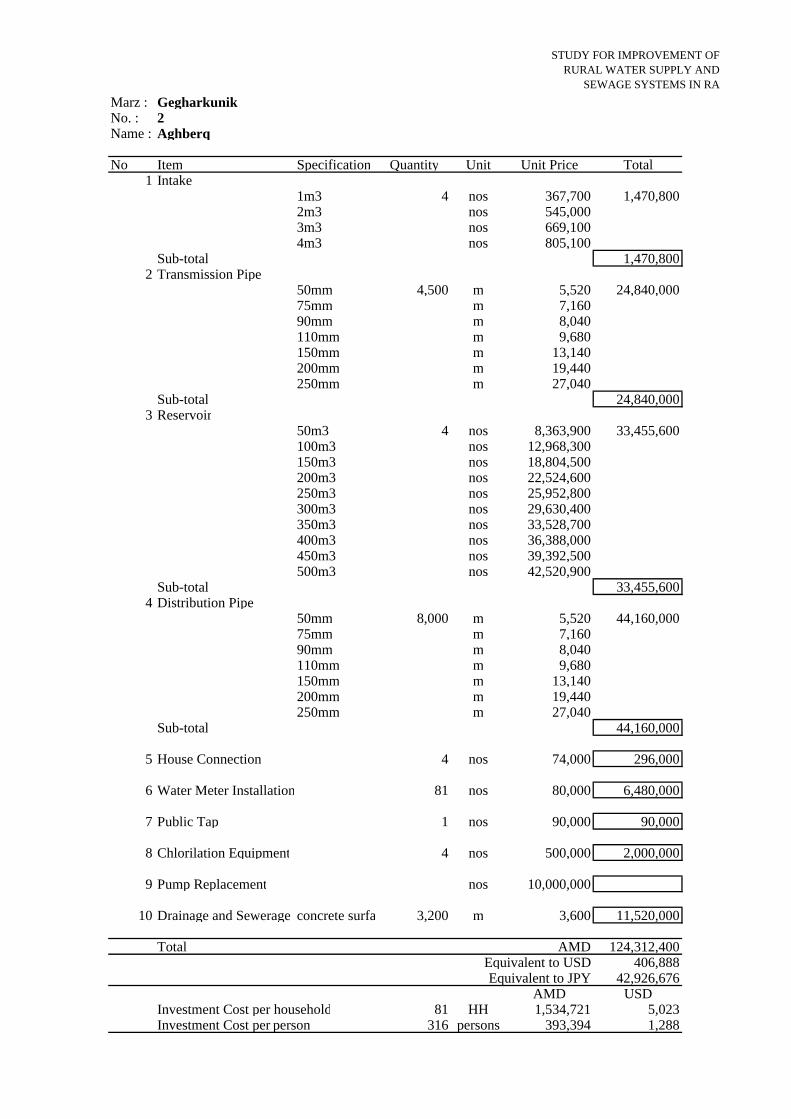
STUDY FOR IMPROVEMENT OF RURAL WATER SUPPLY AND
SEWAGE SYSTEMS IN RAMarz : Gegharkunik No. : 2Name : Aghberq
No Item Specification Quantity Unit Unit Price Total1 Intake
1m3 4 nos 367,700 1,470,8002m3 nos 545,0003m3 nos 669,1004m3 nos 805,100
Sub-total 1,470,8002 Transmission Pipe
50mm 4,500 m 5,520 24,840,00075mm m 7,16090mm m 8,040110mm m 9,680150mm m 13,140200mm m 19,440250mm m 27,040
Sub-total 24,840,0003 Reservoir
50m3 4 nos 8,363,900 33,455,600100m3 nos 12,968,300150m3 nos 18,804,500200m3 nos 22,524,600250m3 nos 25,952,800300m3 nos 29,630,400350m3 nos 33,528,700400m3 nos 36,388,000450m3 nos 39,392,500500m3 nos 42,520,900
Sub-total 33,455,6004 Distribution Pipe
50mm 8,000 m 5,520 44,160,00075mm m 7,16090mm m 8,040110mm m 9,680150mm m 13,140200mm m 19,440250mm m 27,040
Sub-total 44,160,000
5 House Connection 4 nos 74,000 296,000
6 Water Meter Installation 81 nos 80,000 6,480,000
7 Public Tap 1 nos 90,000 90,000
8 Chlorilation Equipment 4 nos 500,000 2,000,000
9 Pump Replacement nos 10,000,000
10 Drainage and Sewerage concrete surfa 3,200 m 3,600 11,520,000
Total AMD 124,312,400Equivalent to USD 406,888Equivalent to JPY 42,926,676
AMD USDInvestment Cost per household 81 HH 1,534,721 5,023Investment Cost per person 316 persons 393,394 1,288

GEGHARKUNIK MARZ
No 2 Aghberq100% 0% 0%
PROJECTED INCOME STATEMENT 100% 100% 100% Unit: million AMDDescription Unit
Total 1 2 3 4 5 6 7 8 9 10 11 12 13 14 15 16 17 18 19 20 21 22 23 24 25 26 27 28 29 30 31 32 33 34 35 36 37 38 39 40A Water Sales Revenue 0 0.00 0.51 0.51 0.51 0.53 0.90 0.93 0.96 0.99 1.48 1.53 1.58 1.63 1.69 1.74 1.80 1.86 1.92 1.98 2.05 2.12 2.19 2.26 2.33 2.41 2.49 2.57 2.66 2.75 2.84 2.93 3.03 3.13 3.23 3.34 3.45 3.56 3.68 3.80
Consumption water volume 1000m3/yr 14.2Unit rate AMD/m3 40.00 40.00 40.00 41.32 70.00 72.31 74.70 77.16 115.65 119.47 123.41 127.48 131.69 136.03 140.52 145.16 149.95 154.90 160.01 165.29 170.75 176.38 182.20 188.21 194.42 200.84 207.47 214.31 221.39 228.69 236.24 244.04 252.09 260.41 269.00 277.88 287.05 296.52
Sub-total 79.87 0.00 0.00 0.51 0.51 0.51 0.53 0.90 0.93 0.96 0.99 1.48 1.53 1.58 1.63 1.69 1.74 1.80 1.86 1.92 1.98 2.05 2.12 2.19 2.26 2.33 2.41 2.49 2.57 2.66 2.75 2.84 2.93 3.03 3.13 3.23 3.34 3.45 3.56 3.68 3.80
B Operating Costs1. Staff salary 0.24 0.25 0.26 0.26 0.27 0.28 0.29 0.30 0.31 0.32 0.33 0.34 0.35 0.37 0.38 0.39 0.40 0.42 0.43 0.44 0.46 0.47 0.49 0.51 0.52 0.54 0.56 0.58 0.60 0.62 0.64 0.66 0.68 0.70 0.72 0.75 0.77 0.80
Inspectors person 1Pump operators person 0Base Salary AMD/m/p 20,000 20,660 21,342 22,046 22,774 23,525 24,301 25,103 25,932 26,788 27,672 28,585 29,528 30,502 31,509 32,549 33,623 34,732 35,879 37,063 38,286 39,549 40,854 42,202 43,595 45,034 46,520 48,055 49,641 51,279 52,971 54,719 56,525 58,390 60,317 62,308 64,364 66,488Sub-total 17.70 0.24 0.25 0.26 0.26 0.27 0.28 0.29 0.30 0.31 0.32 0.33 0.34 0.35 0.37 0.38 0.39 0.40 0.42 0.43 0.44 0.46 0.47 0.49 0.51 0.52 0.54 0.56 0.58 0.60 0.62 0.64 0.66 0.68 0.70 0.72 0.75 0.77 0.80
2. Chlorine 0.05 0.05 0.06 0.06 0.06 0.06 0.06 0.06 0.07 0.07 0.07 0.07 0.08 0.08 0.08 0.08 0.09 0.09 0.09 0.10 0.10 0.10 0.11 0.11 0.11 0.12 0.12 0.12 0.13 0.13 0.14 0.14 0.15 0.15 0.16 0.16 0.17 0.17Pouring volume kg/yr 86Unit rate AMD/kg 600 620 640 661 683 706 729 753 778 804 830 858 886 915 945 976 1009 1042 1076 1112 1149 1186 1226 1266 1308 1351 1396 1442 1489 1538 1589 1642 1696 1752 1810 1869 1931 1995Sub-total 3.82 0.05 0.05 0.06 0.06 0.06 0.06 0.06 0.06 0.07 0.07 0.07 0.07 0.08 0.08 0.08 0.08 0.09 0.09 0.09 0.10 0.10 0.10 0.11 0.11 0.11 0.12 0.12 0.12 0.13 0.13 0.14 0.14 0.15 0.15 0.16 0.16 0.17 0.17
3. Electricity (for pump) 0.00 0.00 0.00 0.00 0.00 0.00 0.00 0.00 0.00 0.00 0.00 0.00 0.00 0.00 0.00 0.00 0.00 0.00 0.00 0.00 0.00 0.00 0.00 0.00 0.00 0.00 0.00 0.00 0.00 0.00 0.00 0.00 0.00 0.00 0.00 0.00 0.00 0.00 0.00 0.004. Maintenance cost 32.45 0.44 0.44 0.45 0.47 0.49 0.50 0.52 0.53 0.55 0.57 0.59 0.61 0.63 0.65 0.67 0.69 0.72 0.74 0.76 0.79 0.82 0.84 0.87 0.90 0.93 0.96 0.99 1.02 1.06 1.09 1.13 1.17 1.20 1.24 1.28 1.33 1.37 1.42 1.46
Pump repair 0.00 0.00 0.00 0.00 0.00 0.00 0.00 0.00 0.00 0.00 0.00 0.00 0.00 0.00 0.00 0.00 0.00 0.00 0.00 0.00 0.00 0.00 0.00 0.00 0.00 0.00 0.00 0.00 0.00 0.00 0.00 0.00 0.00 0.00 0.00 0.00 0.00 0.00 0.00Pipe repair 0.44 0.44 0.45 0.47 0.49 0.50 0.52 0.53 0.55 0.57 0.59 0.61 0.63 0.65 0.67 0.69 0.72 0.74 0.76 0.79 0.82 0.84 0.87 0.90 0.93 0.96 0.99 1.02 1.06 1.09 1.13 1.17 1.20 1.24 1.28 1.33 1.37 1.42 1.46
5. Pump replacement 0.00 0.00 0.00 0.00Sub-total 53.97 0.00 0.00 0.73 0.75 0.79 0.81 0.83 0.86 0.88 0.91 0.95 0.98 1.01 1.04 1.08 1.12 1.15 1.19 1.23 1.27 1.31 1.36 1.40 1.44 1.50 1.55 1.59 1.65 1.70 1.76 1.82 1.88 1.95 2.00 2.07 2.13 2.21 2.28 2.36 2.43
C Gross Income (A-B) 25.90 0.00 0.00 -0.22 -0.24 -0.28 -0.28 0.07 0.07 0.08 0.08 0.53 0.55 0.57 0.59 0.61 0.62 0.65 0.67 0.69 0.71 0.74 0.76 0.79 0.82 0.83 0.86 0.90 0.92 0.96 0.99 1.02 1.05 1.08 1.13 1.16 1.21 1.24 1.28 1.32 1.37
D Depreciation cost 117.95 3.37 3.37 3.37 3.37 3.37 3.37 3.37 3.37 3.37 3.37 3.37 3.37 3.37 3.37 3.37 3.37 3.37 3.37 3.37 3.37 3.37 3.37 3.37 3.37 3.37 3.37 3.37 3.37 3.37 3.37 3.37 3.37 3.37 3.37 3.37
E Interest paid 38.86 0.04 0.07 1.54 1.58 1.60 1.60 1.60 1.60 1.60 1.60 1.60 1.56 1.51 1.46 1.42 1.37 1.32 1.27 1.22 1.17 1.12 1.07 1.02 0.97 0.91 0.86 0.81 0.75 0.70 0.64 0.59 0.53 0.48 0.42 0.36 0.30 0.24 0.18 0.12 0.06
F Net Income -130.91 -0.04 -0.07 -1.76 -1.82 -1.88 -5.25 -4.90 -4.90 -4.89 -4.89 -4.44 -4.38 -4.31 -4.24 -4.18 -4.12 -4.04 -3.97 -3.90 -3.83 -3.75 -3.68 -3.60 -3.52 -3.45 -3.37 -3.28 -3.20 -3.11 -3.02 -2.94 -2.85 -2.77 -2.66 -2.57 -2.46 -2.37 -2.27 -2.17 -2.06
G Tax and duties 0.00 0.00 0.00 0.00 0.00 0.00 0.00 0.00 0.00 0.00 0.00 0.00 0.00 0.00 0.00 0.00 0.00 0.00 0.00 0.00 0.00 0.00 0.00 0.00 0.00 0.00 0.00 0.00 0.00 0.00 0.00 0.00 0.00 0.00 0.00 0.00 0.00 0.00 0.00 0.00 0.00
H Net Income after deduction of TAX -130.91 -0.04 -0.07 -1.76 -1.82 -1.88 -5.25 -4.90 -4.90 -4.89 -4.89 -4.44 -4.38 -4.31 -4.24 -4.18 -4.12 -4.04 -3.97 -3.90 -3.83 -3.75 -3.68 -3.60 -3.52 -3.45 -3.37 -3.28 -3.20 -3.11 -3.02 -2.94 -2.85 -2.77 -2.66 -2.57 -2.46 -2.37 -2.27 -2.17 -2.06
OM Cost Recovery Ratio (A/B) 148% 0% 0% 70% 68% 65% 65% 108% 108% 109% 109% 156% 156% 156% 157% 156% 155% 157% 156% 156% 156% 156% 156% 156% 157% 155% 155% 157% 156% 156% 156% 156% 156% 155% 157% 156% 157% 156% 156% 156% 156%
PROJECTED CASH FLOW STATEMENT Unit: million AMDDescription
Total 1 2 3 4 5 6 7 8 9 10 11 12 13 14 15 16 17 18 19 20 21 22 23 24 25 26 27 28 29 30 31 32 33 34 35 36 37 38 39 40SOURCES OF FUNDSA Internal Cash Generation
1. Net Income -130.91 -0.04 -0.07 -1.76 -1.82 -1.88 -5.25 -4.90 -4.90 -4.89 -4.89 -4.44 -4.38 -4.31 -4.24 -4.18 -4.12 -4.04 -3.97 -3.90 -3.83 -3.75 -3.68 -3.60 -3.52 -3.45 -3.37 -3.28 -3.20 -3.11 -3.02 -2.94 -2.85 -2.77 -2.66 -2.57 -2.46 -2.37 -2.27 -2.17 -2.062. Depreciation cost 117.95 0.00 0.00 0.00 0.00 0.00 3.37 3.37 3.37 3.37 3.37 3.37 3.37 3.37 3.37 3.37 3.37 3.37 3.37 3.37 3.37 3.37 3.37 3.37 3.37 3.37 3.37 3.37 3.37 3.37 3.37 3.37 3.37 3.37 3.37 3.37 3.37 3.37 3.37 3.37 3.373. Interest Paid 38.86 0.04 0.07 1.54 1.58 1.60 1.60 1.60 1.60 1.60 1.60 1.60 1.56 1.51 1.46 1.42 1.37 1.32 1.27 1.22 1.17 1.12 1.07 1.02 0.97 0.91 0.86 0.81 0.75 0.70 0.64 0.59 0.53 0.48 0.42 0.36 0.30 0.24 0.18 0.12 0.06Sub-total 25.90 0.00 0.00 -0.22 -0.24 -0.28 -0.28 0.07 0.07 0.08 0.08 0.53 0.55 0.57 0.59 0.61 0.62 0.65 0.67 0.69 0.71 0.74 0.76 0.79 0.82 0.83 0.86 0.90 0.92 0.96 0.99 1.02 1.05 1.08 1.13 1.16 1.21 1.24 1.28 1.32 1.37
-0.04 #REF! #REF! #REF! #REF! #REF! #REF! #REF! #REF! #REF! #REF! #REF! #REF! #REF! #REF! #REF! #REF! #REF! #REF! #REF! #REF! #REF! #REF! #REF! #REF! #REF! #REF! #REF! #REF! #REF! #REF! #REF! #REF! #REF! #REF! #REF! #REF! #REF! #REF! #REF!B Finances
1. Project Loan 160.38 3.91 2.79 147.56 3.48 1.61 0.58 0.452. Local fund 53.79 1.29 0.91 50.00 1.16 0.30 0.07 0.06Sub-total 214.17 5.20 3.70 197.56 4.64 1.91 0.65 0.51
C Subsidy from Government1. Subsidy for O&M cost 1.02 0.00 0.00 0.22 0.24 0.28 0.28 0.00 0.00 0.00 0.00 0.00 0.00 0.00 0.00 0.00 0.00 0.00 0.00 0.00 0.00 0.00 0.00 0.00 0.00 0.00 0.00 0.00 0.00 0.00 0.00 0.00 0.00 0.00 0.00 0.00 0.00 0.00 0.00 0.00 0.002. Subsidy for debt services 172.31 0.04 0.07 1.54 1.58 1.60 1.60 1.53 1.53 1.52 1.52 5.68 5.67 5.64 5.62 5.61 5.60 5.56 5.54 5.52 5.50 5.47 5.45 5.43 5.40 5.38 5.35 5.32 5.29 5.26 5.22 5.20 5.16 5.14 5.09 5.05 5.00 4.97 4.93 4.89 4.84Sub-total 173.33 0.04 0.07 1.76 1.82 1.88 1.88 1.53 1.53 1.52 1.52 5.68 5.67 5.64 5.62 5.61 5.60 5.56 5.54 5.52 5.50 5.47 5.45 5.43 5.40 5.38 5.35 5.32 5.29 5.26 5.22 5.20 5.16 5.14 5.09 5.05 5.00 4.97 4.93 4.89 4.84
Total Cash Inflow 413.40 5.24 3.77 199.10 6.22 3.51 2.25 2.11 1.60 1.60 1.60 6.21 6.22 6.21 6.21 6.22 6.22 6.21 6.21 6.21 6.21 6.21 6.21 6.22 6.22 6.21 6.21 6.22 6.21 6.22 6.21 6.22 6.21 6.22 6.22 6.21 6.21 6.21 6.21 6.21 6.21
APPLICATION OF FUNDSD Project disbursement 214.17 5.20 3.70 197.56 4.64 1.91 0.65 0.51
E Total debt services1. Loan repayment 160.37 4.61 4.66 4.70 4.75 4.80 4.85 4.89 4.94 4.99 5.04 5.09 5.14 5.20 5.25 5.30 5.35 5.41 5.46 5.52 5.57 5.63 5.68 5.74 5.80 5.85 5.91 5.97 6.03 6.09 6.152. Interest paid 38.86 0.04 0.07 1.54 1.58 1.60 1.60 1.60 1.60 1.60 1.60 1.60 1.56 1.51 1.46 1.42 1.37 1.32 1.27 1.22 1.17 1.12 1.07 1.02 0.97 0.91 0.86 0.81 0.75 0.70 0.64 0.59 0.53 0.48 0.42 0.36 0.30 0.24 0.18 0.12 0.06Sub-total 199.23 0.04 0.07 1.54 1.58 1.60 1.60 1.60 1.60 1.60 1.60 6.21 6.22 6.21 6.21 6.22 6.22 6.21 6.21 6.21 6.21 6.21 6.21 6.22 6.22 6.21 6.21 6.22 6.21 6.22 6.21 6.22 6.21 6.22 6.22 6.21 6.21 6.21 6.21 6.21 6.21
Total Cash Outflow 413.40 5.24 3.77 199.10 6.22 3.51 2.25 2.11 1.60 1.60 1.60 6.21 6.22 6.21 6.21 6.22 6.22 6.21 6.21 6.21 6.21 6.21 6.21 6.22 6.22 6.21 6.21 6.22 6.21 6.22 6.21 6.22 6.21 6.22 6.22 6.21 6.21 6.21 6.21 6.21 6.21
F Net Surplus Cash (A+C2)-E 0.00 0.00 0.00 0.00 0.00 0.00 0.00 0.00 0.00 0.00 0.00 0.00 0.00 0.00 0.00 0.00 0.00 0.00 0.00 0.00 0.00 0.00 0.00 0.00 0.00 0.00 0.00 0.00 0.00 0.00 0.00 0.00 0.00 0.00 0.00 0.00 0.00 0.00 0.00 0.00 0.00
Investment Cost Recovery Ratio (%)Cost recovery by water fee (A/E) 13% 0% 0% 0% 0% 0% 0% 4% 4% 5% 5% 9% 9% 9% 10% 10% 10% 10% 11% 11% 11% 12% 12% 13% 13% 13% 14% 14% 15% 15% 16% 16% 17% 17% 18% 19% 19% 20% 21% 21% 22%Cost recovery by water fee + subsidy ((A+C2)/E) 100% 100% 100% 100% 100% 100% 100% 100% 100% 100% 100% 100% 100% 100% 100% 100% 100% 100% 100% 100% 100% 100% 100% 100% 100% 100% 100% 100% 100% 100% 100% 100% 100% 100% 100% 100% 100% 100% 100% 100% 100%
Sevan District
Year
Year
GEGHARKUNIK MARZSevan DistrictNo 2 Aghberq
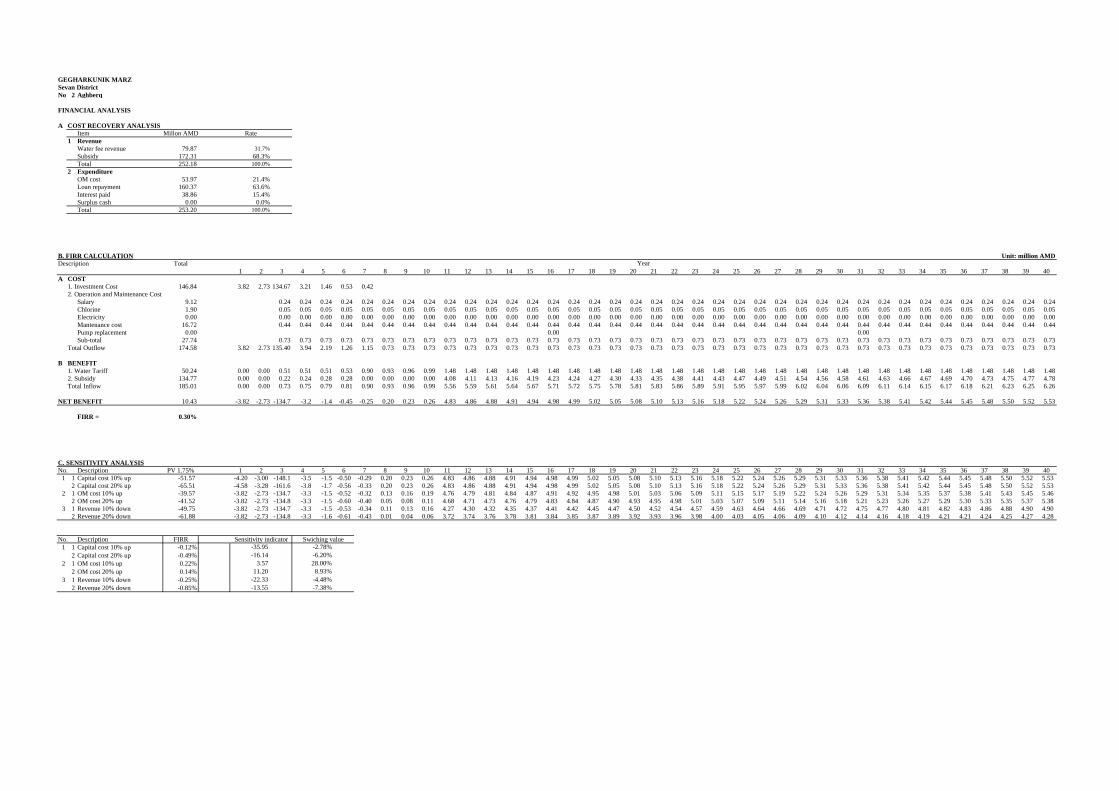
FINANCIAL ANALYSIS
A COST RECOVERY ANALYSISItem Millon AMD Rate
1 RevenueWater fee revenue 79.87 31.7%Subsidy 172.31 68.3%Total 252.18 100.0%
2 ExpenditureOM cost 53.97 21.4%Loan repayment 160.37 63.6%Interest paid 38.86 15.4%Surplus cash 0.00 0.0%Total 253.20 100.0%
B. FIRR CALCULATION Unit: million AMDDescription Total
1 2 3 4 5 6 7 8 9 10 11 12 13 14 15 16 17 18 19 20 21 22 23 24 25 26 27 28 29 30 31 32 33 34 35 36 37 38 39 40A COST
1. Investment Cost 146.84 3.82 2.73 134.67 3.21 1.46 0.53 0.422. Operation and Maintenance Cost
Salary 9.12 0.24 0.24 0.24 0.24 0.24 0.24 0.24 0.24 0.24 0.24 0.24 0.24 0.24 0.24 0.24 0.24 0.24 0.24 0.24 0.24 0.24 0.24 0.24 0.24 0.24 0.24 0.24 0.24 0.24 0.24 0.24 0.24 0.24 0.24 0.24 0.24 0.24 0.24Chlorine 1.90 0.05 0.05 0.05 0.05 0.05 0.05 0.05 0.05 0.05 0.05 0.05 0.05 0.05 0.05 0.05 0.05 0.05 0.05 0.05 0.05 0.05 0.05 0.05 0.05 0.05 0.05 0.05 0.05 0.05 0.05 0.05 0.05 0.05 0.05 0.05 0.05 0.05 0.05Electricity 0.00 0.00 0.00 0.00 0.00 0.00 0.00 0.00 0.00 0.00 0.00 0.00 0.00 0.00 0.00 0.00 0.00 0.00 0.00 0.00 0.00 0.00 0.00 0.00 0.00 0.00 0.00 0.00 0.00 0.00 0.00 0.00 0.00 0.00 0.00 0.00 0.00 0.00 0.00Mantenance cost 16.72 0.44 0.44 0.44 0.44 0.44 0.44 0.44 0.44 0.44 0.44 0.44 0.44 0.44 0.44 0.44 0.44 0.44 0.44 0.44 0.44 0.44 0.44 0.44 0.44 0.44 0.44 0.44 0.44 0.44 0.44 0.44 0.44 0.44 0.44 0.44 0.44 0.44 0.44Pump replacement 0.00 0.00 0.00 0.00Sub-total 27.74 0.73 0.73 0.73 0.73 0.73 0.73 0.73 0.73 0.73 0.73 0.73 0.73 0.73 0.73 0.73 0.73 0.73 0.73 0.73 0.73 0.73 0.73 0.73 0.73 0.73 0.73 0.73 0.73 0.73 0.73 0.73 0.73 0.73 0.73 0.73 0.73 0.73 0.73
Total Outflow 174.58 3.82 2.73 135.40 3.94 2.19 1.26 1.15 0.73 0.73 0.73 0.73 0.73 0.73 0.73 0.73 0.73 0.73 0.73 0.73 0.73 0.73 0.73 0.73 0.73 0.73 0.73 0.73 0.73 0.73 0.73 0.73 0.73 0.73 0.73 0.73 0.73 0.73 0.73 0.73 0.73
B BENEFIT1. Water Tariff 50.24 0.00 0.00 0.51 0.51 0.51 0.53 0.90 0.93 0.96 0.99 1.48 1.48 1.48 1.48 1.48 1.48 1.48 1.48 1.48 1.48 1.48 1.48 1.48 1.48 1.48 1.48 1.48 1.48 1.48 1.48 1.48 1.48 1.48 1.48 1.48 1.48 1.48 1.48 1.48 1.482. Subsidy 134.77 0.00 0.00 0.22 0.24 0.28 0.28 0.00 0.00 0.00 0.00 4.08 4.11 4.13 4.16 4.19 4.23 4.24 4.27 4.30 4.33 4.35 4.38 4.41 4.43 4.47 4.49 4.51 4.54 4.56 4.58 4.61 4.63 4.66 4.67 4.69 4.70 4.73 4.75 4.77 4.78Total Inflow 185.01 0.00 0.00 0.73 0.75 0.79 0.81 0.90 0.93 0.96 0.99 5.56 5.59 5.61 5.64 5.67 5.71 5.72 5.75 5.78 5.81 5.83 5.86 5.89 5.91 5.95 5.97 5.99 6.02 6.04 6.06 6.09 6.11 6.14 6.15 6.17 6.18 6.21 6.23 6.25 6.26
NET BENEFIT 10.43 -3.82 -2.73 -134.7 -3.2 -1.4 -0.45 -0.25 0.20 0.23 0.26 4.83 4.86 4.88 4.91 4.94 4.98 4.99 5.02 5.05 5.08 5.10 5.13 5.16 5.18 5.22 5.24 5.26 5.29 5.31 5.33 5.36 5.38 5.41 5.42 5.44 5.45 5.48 5.50 5.52 5.53
FIRR = 0.30%
C. SENSITIVITY ANALYSISNo. Description PV 1.75% 1 2 3 4 5 6 7 8 9 10 11 12 13 14 15 16 17 18 19 20 21 22 23 24 25 26 27 28 29 30 31 32 33 34 35 36 37 38 39 40
1 1 Capital cost 10% up -51.57 -4.20 -3.00 -148.1 -3.5 -1.5 -0.50 -0.29 0.20 0.23 0.26 4.83 4.86 4.88 4.91 4.94 4.98 4.99 5.02 5.05 5.08 5.10 5.13 5.16 5.18 5.22 5.24 5.26 5.29 5.31 5.33 5.36 5.38 5.41 5.42 5.44 5.45 5.48 5.50 5.52 5.532 Capital cost 20% up -65.51 -4.58 -3.28 -161.6 -3.8 -1.7 -0.56 -0.33 0.20 0.23 0.26 4.83 4.86 4.88 4.91 4.94 4.98 4.99 5.02 5.05 5.08 5.10 5.13 5.16 5.18 5.22 5.24 5.26 5.29 5.31 5.33 5.36 5.38 5.41 5.42 5.44 5.45 5.48 5.50 5.52 5.53
2 1 OM cost 10% up -39.57 -3.82 -2.73 -134.7 -3.3 -1.5 -0.52 -0.32 0.13 0.16 0.19 4.76 4.79 4.81 4.84 4.87 4.91 4.92 4.95 4.98 5.01 5.03 5.06 5.09 5.11 5.15 5.17 5.19 5.22 5.24 5.26 5.29 5.31 5.34 5.35 5.37 5.38 5.41 5.43 5.45 5.462 OM cost 20% up -41.52 -3.82 -2.73 -134.8 -3.3 -1.5 -0.60 -0.40 0.05 0.08 0.11 4.68 4.71 4.73 4.76 4.79 4.83 4.84 4.87 4.90 4.93 4.95 4.98 5.01 5.03 5.07 5.09 5.11 5.14 5.16 5.18 5.21 5.23 5.26 5.27 5.29 5.30 5.33 5.35 5.37 5.38
3 1 Revenue 10% down -49.75 -3.82 -2.73 -134.7 -3.3 -1.5 -0.53 -0.34 0.11 0.13 0.16 4.27 4.30 4.32 4.35 4.37 4.41 4.42 4.45 4.47 4.50 4.52 4.54 4.57 4.59 4.63 4.64 4.66 4.69 4.71 4.72 4.75 4.77 4.80 4.81 4.82 4.83 4.86 4.88 4.90 4.902 Revenue 20% down -61.88 -3.82 -2.73 -134.8 -3.3 -1.6 -0.61 -0.43 0.01 0.04 0.06 3.72 3.74 3.76 3.78 3.81 3.84 3.85 3.87 3.89 3.92 3.93 3.96 3.98 4.00 4.03 4.05 4.06 4.09 4.10 4.12 4.14 4.16 4.18 4.19 4.21 4.21 4.24 4.25 4.27 4.28
No. Description FIRR Sensitivity indicator Swiching value1 1 Capital cost 10% up -0.12%
2 Capital cost 20% up -0.49%2 1 OM cost 10% up 0.22%
2 OM cost 20% up 0.14%3 1 Revenue 10% down -0.25%
2 Revenue 20% down -0.85%-22.33 -4.48%-13.55 -7.38%
3.57 28.00%11.20 8.93%
-35.95 -2.78%-16.14 -6.20%
Year
No.3 Aygut
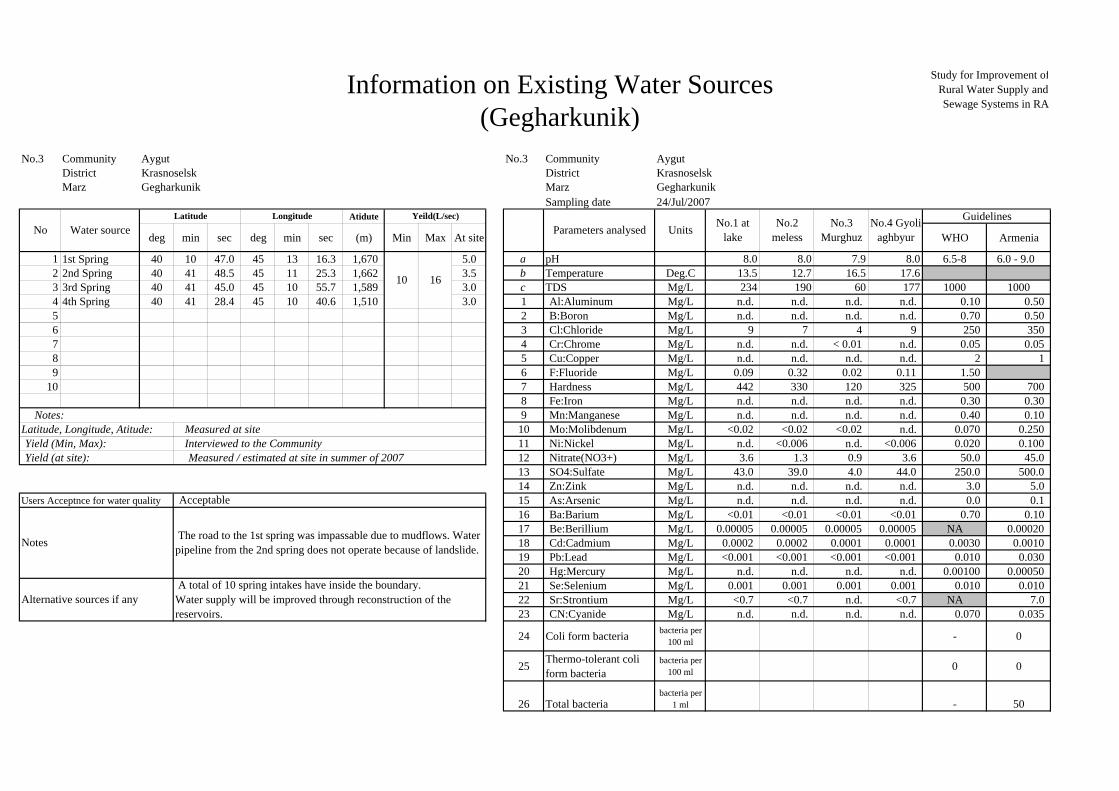
Information on Existing Water Sources(Gegharkunik)
Study for Improvement ofRural Water Supply andSewage Systems in RA
No.3 Community Aygut No.3 Community Aygut No. 1District Krasnoselsk District KrasnoselskMarz Gegharkunik Marz Gegharkunik
Sampling date 24/Jul/2007Atidute
deg min sec deg min sec (m) Min Max At site WHO Armenia
1 1st Spring 40 10 47.0 45 13 16.3 1,670 5.0 a pH 8.0 8.0 7.9 8.0 6.5-8 6.0 - 9.0 2 2nd Spring 40 41 48.5 45 11 25.3 1,662 3.5 b Temperature Deg.C 13.5 12.7 16.5 17.63 3rd Spring 40 41 45.0 45 10 55.7 1,589 3.0 c TDS Mg/L 234 190 60 177 1000 10004 4th Spring 40 41 28.4 45 10 40.6 1,510 3.0 1 Al:Aluminum Mg/L n.d. n.d. n.d. n.d. 0.10 0.50 5 2 B:Boron Mg/L n.d. n.d. n.d. n.d. 0.70 0.50 6 3 Cl:Chloride Mg/L 9 7 4 9 250 350 7 4 Cr:Chrome Mg/L n.d. n.d. < 0.01 n.d. 0.05 0.05 8 5 Cu:Copper Mg/L n.d. n.d. n.d. n.d. 2 1 9 6 F:Fluoride Mg/L 0.09 0.32 0.02 0.11 1.50
10 7 Hardness Mg/L 442 330 120 325 500 700 8 Fe:Iron Mg/L n.d. n.d. n.d. n.d. 0.30 0.30
Notes: 9 Mn:Manganese Mg/L n.d. n.d. n.d. n.d. 0.40 0.10 Latitude, Longitude, Atitude: Measured at site 10 Mo:Molibdenum Mg/L <0.02 <0.02 <0.02 n.d. 0.070 0.250 Yield (Min, Max): Interviewed to the Community 11 Ni:Nickel Mg/L n.d. <0.006 n.d. <0.006 0.020 0.100 Yield (at site): Measured / estimated at site in summer of 2007 12 Nitrate(NO3+) Mg/L 3.6 1.3 0.9 3.6 50.0 45.0
13 SO4:Sulfate Mg/L 43.0 39.0 4.0 44.0 250.0 500.0 14 Zn:Zink Mg/L n.d. n.d. n.d. n.d. 3.0 5.0
Users Acceptnce for water quality 15 As:Arsenic Mg/L n.d. n.d. n.d. n.d. 0.0 0.1 16 Ba:Barium Mg/L <0.01 <0.01 <0.01 <0.01 0.70 0.10 17 Be:Berillium Mg/L 0.00005 0.00005 0.00005 0.00005 NA 0.00020 18 Cd:Cadmium Mg/L 0.0002 0.0002 0.0001 0.0001 0.0030 0.0010 19 Pb:Lead Mg/L <0.001 <0.001 <0.001 <0.001 0.010 0.030 20 Hg:Mercury Mg/L n.d. n.d. n.d. n.d. 0.00100 0.00050 21 Se:Selenium Mg/L 0.001 0.001 0.001 0.001 0.010 0.010 22 Sr:Strontium Mg/L <0.7 <0.7 n.d. <0.7 NA 7.0 23 CN:Cyanide Mg/L n.d. n.d. n.d. n.d. 0.070 0.035
24 Coli form bacteria bacteria per100 ml - 0
25 Thermo-tolerant coliform bacteria
bacteria per100 ml 0 0
26 Total bacteriabacteria per
1 ml - 50
Guidelines
Acceptable
Notes The road to the 1st spring was impassable due to mudflows. Waterpipeline from the 2nd spring does not operate because of landslide.
Parameters analysed Units No.1 atlake
No.2meless
No.3Murghuz
No.4 Gyoliaghbyur
Alternative sources if any A total of 10 spring intakes have inside the boundary.Water supply will be improved through reconstruction of thereservoirs.
10 16
Yeild(L/sec)No Water source
Latitude Longitude
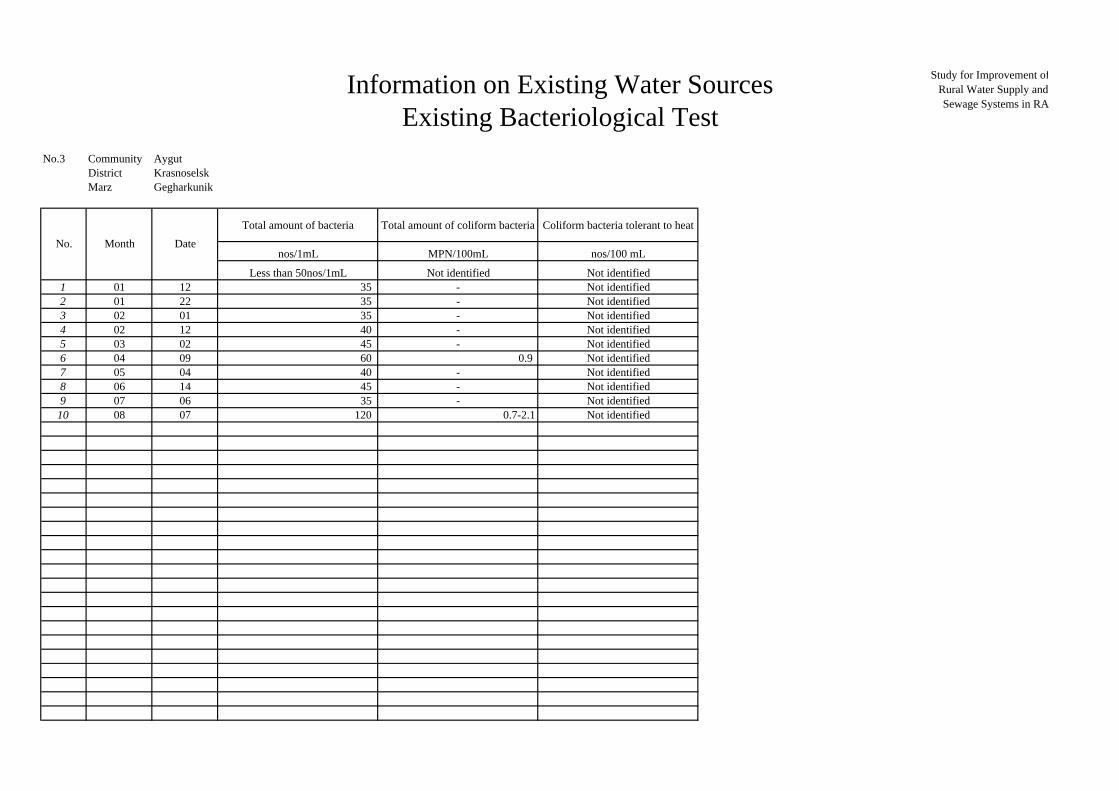
Information on Existing Water SourcesExisting Bacteriological Test
Study for Improvement ofRural Water Supply andSewage Systems in RA
No.3 Community AygutDistrict KrasnoselskMarz Gegharkunik
Total amount of bacteria Total amount of coliform bacteria Coliform bacteria tolerant to heat
nos/1mL MPN/100mL nos/100 mL
Less than 50nos/1mL Not identified Not identified1 01 12 35 - Not identified2 01 22 35 - Not identified3 02 01 35 - Not identified4 02 12 40 - Not identified5 03 02 45 - Not identified6 04 09 60 0.9 Not identified7 05 04 40 - Not identified8 06 14 45 - Not identified9 07 06 35 - Not identified10 08 07 120 0.7-2.1 Not identified
No. Month Date
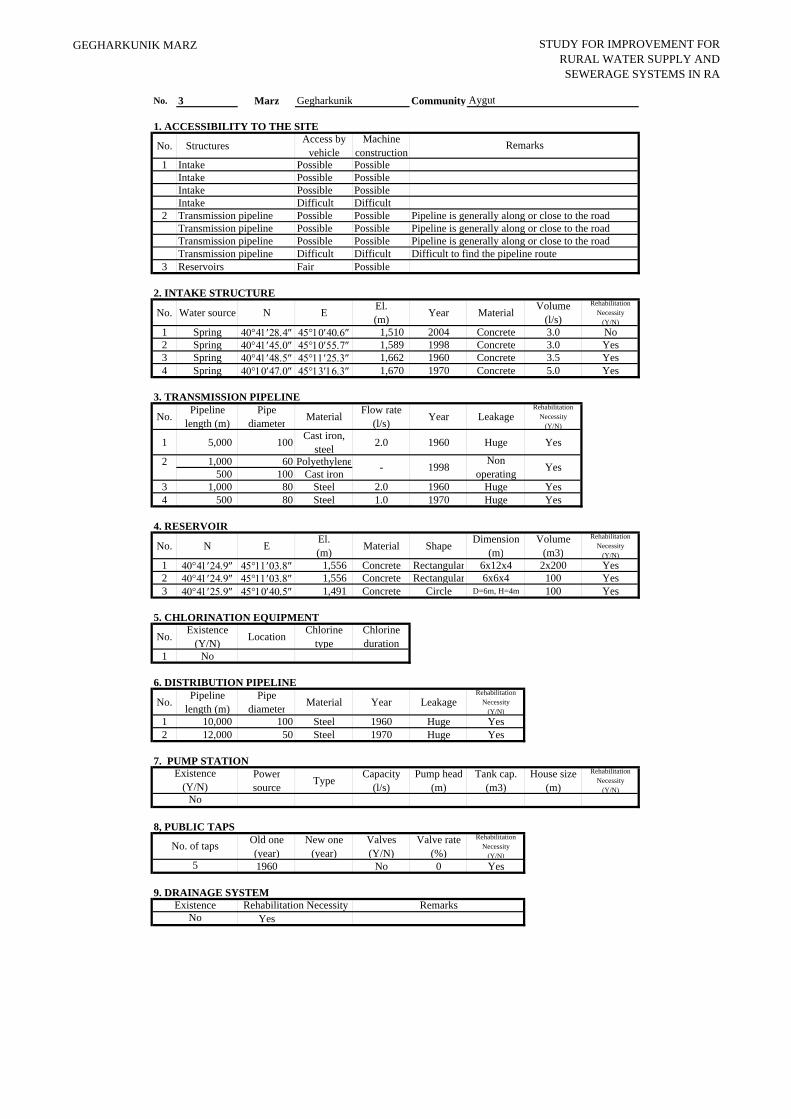
GEGHARKUNIK MARZ STUDY FOR IMPROVEMENT FORRURAL WATER SUPPLY ANDSEWERAGE SYSTEMS IN RA
No. 3 Marz Gegharkunik Community
1. ACCESSIBILITY TO THE SITE
No. Structures Access byvehicle
Machineconstruction
1 Intake Possible PossibleIntake Possible PossibleIntake Possible Possible
Intake Difficult Difficult2 Transmission pipeline Possible Possible Pipeline is generally along or close to the road
Transmission pipeline Possible Possible Pipeline is generally along or close to the road Transmission pipeline Possible Possible Pipeline is generally along or close to the road Transmission pipeline Difficult Difficult Difficult to find the pipeline route
3 Reservoirs Fair Possible
2. INTAKE STRUCTURE
No. Water source N E El.(m) Year Material Volume
(l/s)
RehabilitationNecessity
(Y/N)1 Spring 40°41′28.4″ 45°10′40.6″ 1,510 2004 Concrete 3.0 No2 Spring 40°41′45.0″ 45°10′55.7″ 1,589 1998 Concrete 3.0 Yes3 Spring 40°41′48.5″ 45°11′25.3″ 1,662 1960 Concrete 3.5 Yes4 Spring 40°10′47.0″ 45°13′16.3″ 1,670 1970 Concrete 5.0 Yes
3. TRANSMISSION PIPELINE
No. Pipelinelength (m)
Pipediameter Material Flow rate
(l/s) Year LeakageRehabilitation
Necessity(Y/N)
1 5,000 100 Cast iron,steel 2.0 1960 Huge Yes
2 1,000 60 Polyethylene500 100 Cast iron
3 1,000 80 Steel 2.0 1960 Huge Yes4 500 80 Steel 1.0 1970 Huge Yes
4. RESERVOIR
No. N E El.(m) Material Shape Dimension
(m)Volume
(m3)
RehabilitationNecessity
(Y/N)1 40°41′24.9″ 45°11′03.8″ 1,556 Concrete Rectangular 6x12x4 2x200 Yes2 40°41′24.9″ 45°11′03.8″ 1,556 Concrete Rectangular 6x6x4 100 Yes3 40°41′25.9″ 45°10′40.5″ 1,491 Concrete Circle D=6m, H=4m 100 Yes
5. CHLORINATION EQUIPMENT
No. Existence(Y/N) Location Chlorine
typeChlorineduration
1 No
6. DISTRIBUTION PIPELINE
No. Pipelinelength (m)
Pipediameter Material Year Leakage
RehabilitationNecessity
(Y/N)1 10,000 100 Steel 1960 Huge Yes2 12,000 50 Steel 1970 Huge Yes
7. PUMP STATIONPowersource Type Capacity
(l/s)Pump head
(m)Tank cap.
(m3)House size
(m)
RehabilitationNecessity
(Y/N)
8, PUBLIC TAPSOld one(year)
New one(year)
Valves(Y/N)
Valve rate(%)
RehabilitationNecessity
(Y/N)1960 No 0 Yes
9. DRAINAGE SYSTEM
YesNo
Aygut
Remarks
5
Existence Rehabilitation Necessity Remarks
Existence(Y/N)
No
Yes
No. of taps
- 1998 Nonoperating

Questionnaire on Existing Water Supply Conditionsby Socio-Economic Survey
No. QuestionA: Baseline DataA1 Actual population in 2001A2 Actual population in 2007A3 Number of householdsA4.1 Elderly peopleA4.2 Population in labor force (age from 16 to 62)A4.3 ChildrenA5.1 PensionersA5.2 UnemployedA5.3 Receiving benefitsA6 Average monthly income of household (AMD)A7 Number of medical ambulance staion/first and health postA8 Number of beds in each medical ambulance staionA9 Number of schoolA10 Number of pupilsB: Budget
Annual Budget of the community 2004, in thousand AMDAnnual Budget of the community 2005, in thousand AMDAnnual Budget of the community 2006, in thousand AMDAnnual Budget of the community 2007, in thousand AMDAnnual Budget of the community 2008, in thousand AMDAmount spent in drinking water sector 2004, in thousand AMDAmount spent in drinking water sector 2005, in thousand AMDAmount spent in drinking water sector 2006, in thousand AMDAmount spent in drinking water sector 2007, in thousand AMDAmount spent in drinking water sector 2008, in thousand AMD
C: Socio-Economic SurveyC1 Major industries of the community:
C2 Is there any community activities carrying out by women? 1-Yes, 2-NoD: Water Usage and Water Demand SurveyD1 Does the community hold water use permit? 1.Yes 2.NoD2 Water use permit numberD3 Date of expiry of water use permitD4 Planned date of obtaining water use permitD5 Present condition of the water supply volume of Domestic useD6 Present condition of the water supply volume of Irrigation waterD7 Number of house connection to drinking water systemD8 How many house connection household set the water meterD9 Number of public tapsD10.1 How is the regime of water supply in your community in the dry season?
D10.2 How is the regime of water supply in your community in the wet season?
D11 What time of day water is given?
D12 Are you pleased with duration of domestic water supply?D13 Are hours of water supply convenient?D14.1 How long the taps are open to provide the domestic water (cooking, washing,
foodstuffs, dishes, Landry, bathing, etc) of each houshold a day?D14.2 Estimate quantity of domestic water use of each household (litter per day)
MarzNumber and Name of Community
District
B1
B2
GegharkunikNo.3 AygutKranoseisk
Answer
1,1001,05034717032328232030
12020,000absent
01
225
4,0004,0005,0005,000
is not planned0000
is not planned
potatoes, dairy, meat
no
no--
is not plannedinsufficient
absent100
06
no water at all
24 hrs
-
generaly displeased-
-
500
No. QuestionD15.1 How long the taps are open to provide the each household for fillingD15.2 Estimate quantity of water for filling containers of each household (litter perD16 Drinking water monthly water fee per household
D17 How often do you usually pay water fees?D18 Water fee structure 1Flate rate, 2 Having water tariffD19 Where do you acquire the irrigation water?D20 Are you satisfied with irrigation water supply volume?E: Present Operation and Maintenance WorksE1 Name of responsible for water supplyE2 PositionE3 TelephoneE4 Quantity and present condition of the water supply facilities: spring/ intake
E5 Quantity and present condition of the water supply facilities:pipeline/transmission
E6 Quantity and present condition of the water supply facilities: DRR(DailyRegulatory Reservoir)
E7 Quantity and present condition of the water supply facilities: net/distributionE8 Quantity and present condition of the water supply facilities: public tap
E9 Quantity and present condition of the water supply facilities: pump
E10 Who is the owner of the water supply facilities?E11 Who is engaged in the water supply facilities repairing works?
E12 How do you repair the water supply facilities?E13 Who is in charge of the repair work in the community?
E14 How you prepare O&M costs?
Please indicate the O&M cost breakdown per year for water supplyElectricity (AMD)Labor cost (AMD)Repair cost(AMD)Others(AMD)Total (AMD)
E16 Do the residents participate in the O&M works?E17 What kind of OM method is preferable to you?
F: Initial Environmental Examination (IEE)F1 Are any of the following areas located inside or around the project site?F1.1 National park, protected area designated by the government (coast line, water
lands, reserved are for ethnic or indigenous people, cultural heritage), andareas being considered for national parks or proposed areas.
F1.2 Virgin forests, tropical forestsF1.3 Ecological improvement habits areas (coral reef, mangrove wetland, tidalF1.4 Habit of valuable species protected by domestic laws or international treatiesF1.5 Likely salts cumulus or soil erosion areas on a massive scaleF1.6 Remarkable desertification trend areasF1.7 Archaeological historical or cultural valuable areasF1.8 Living areas of ethic, indigenous people or nomads who have a traditional
lifestyle or special socially valuable areas
E15
Answer-
500
0
--
absentinsufficient.
nobody
4-partially rehabilitated
4-deteriorated
4-deteriorated
deteriorated
deteriorated
absent
community
community
by ourselves
specialist from community
donation from residents
00000
manpower
difficult to answer
absent
absentabsentabsentabsentabsentabsent
absent
GegharkunikNo.3 Aygut
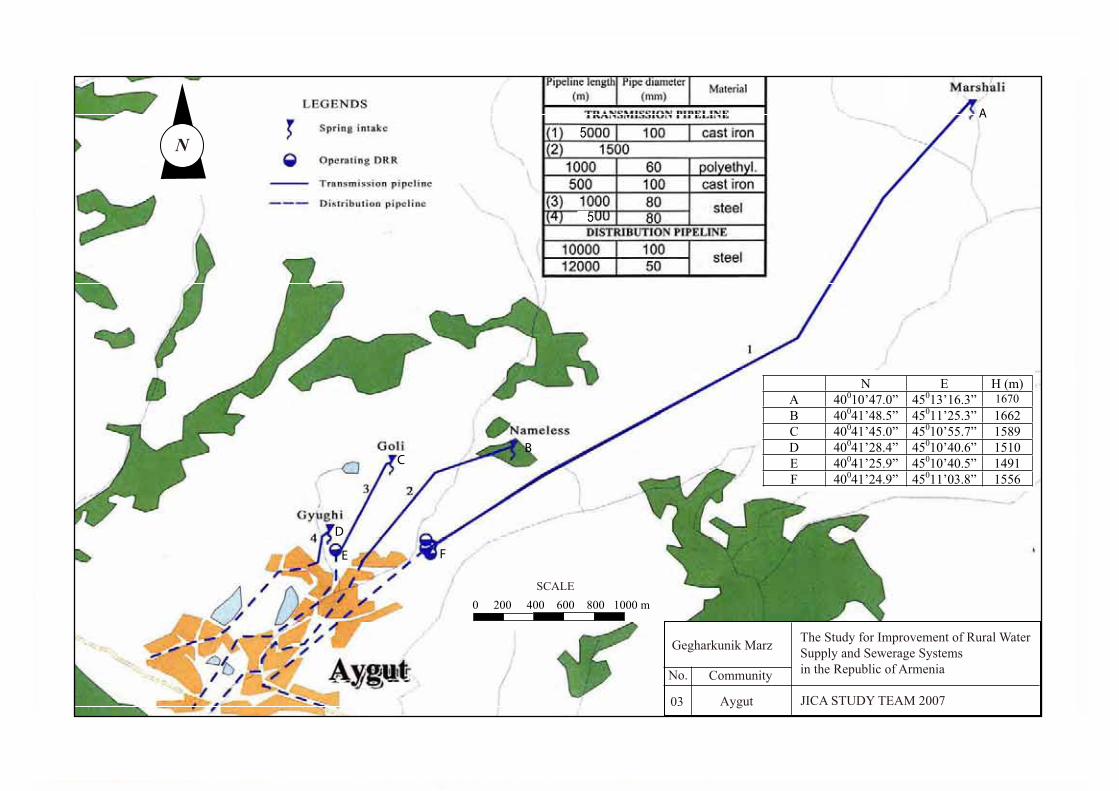
A
BC
D
E F
N E H (m)A 40010’47.0” 45013’16.3”B 40041’48.5” 45011’25.3” 1662C 40041’45.0” 45010’55.7” 1589D 40041’28.4” 45010’40.6” 1510E 40041’25.9” 45010’40.5” 1491F 40041’24.9” 45011’03.8” 1556
N
Gegharkunik Marz
No.
Aygut
The Study for Improvement of Rural WaterSupply and Sewerage Systems in the Republic of Armenia
JICA STUDY TEAM 200703
Community
0 200 400 600 800 1000 mSCALE
1670
5
5

GEGHARKNIK STUDY FOR IMPROVEMENT OF RURAL WATER SUPPLY AND
SEWAGE SYSTEMS IN RA
Marz : Gegharkunik No.3Name : Aygut
No. Item Quantity Unit Water demand (m3/d)A. WATER DEMAND
1 Population 1,050 persons 105.02 Factory - nos 0.03 School (pupils) 225 pupils 2.34 Medical Ambulance Station - nos - 5 Policlinic - nos - 7 Livestocks (87lit/household) 347 household 30.2
Sub-total 137.5Unaccouted for water (20%) 27.5
1 Average Daily Water Demand 165.0 m3/day2 Maximum Daily Water Demand 198.0 m3/day3 Maximum Hourly Water Demand 21.5 m3/hr
B WATER SUPPLY PLAN1 Water source type Nr. Total vol.a Spring 4 14.5 lit/sec 1252.8 m3/day
` Total 1252.8 m3/day
2 Required reservoir volume 257 m3
C WATER SUPPLY FACILITIES REHABILITATION PLANNo Item Quantity Unit
1 Intake1m3 3 nos2m3 nos3m3 nos4m3 nos
2 Transmission pipe50mm diameter m75mm diameter m90mm diameter 1,500 m110mm diameter 6,200 m150mm diameter m200mm diameter m250mm diameter m
3 Reservoir100m3 capacity 1 nos150m3 capacity 1 nos
4 Distribution pipe50mm diameter 12,000 m75mm diameter m90mm diameter m110mm diameter 10,000 m150mm diameter m200mm diameter m250mm diameter m
5 House connection 247 nos6 Water meter installation 347 nos7 Public tap 4 nos8 Chlorination 2 nos9 Pumps - nos
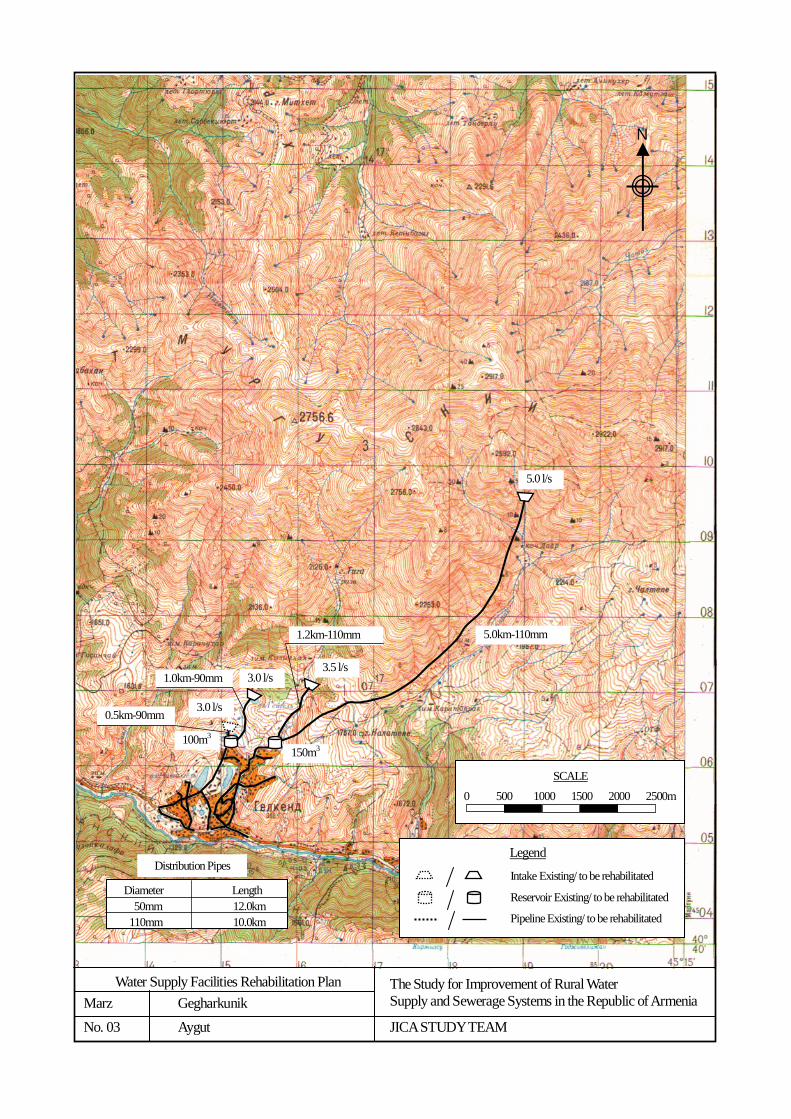
Water Supply Facilities Rehabilitation Plan Marz Gegharkunik No. 03 Aygut
The Study for Improvement of Rural Water Supply and Sewerage Systems in the Republic of Armenia
JICA STUDY TEAM
N
Legend
Intake Existing/ to be rehabilitated
Reservoir Existing/ to be rehabilitated
Pipeline Existing/ to be rehabilitated
SCALE
0 500 1000 1500 2000 2500m
150m3
3.0 l/s
5.0km-110mm
3.0 l/s
5.0 l/s
3.5 l/s
100m3
1.2km-110mm
0.5km-90mm
1.0km-90mm
Diameter Length 50mm 12.0km 110mm 10.0km
Distribution Pipes
STUDY FOR IMPROVEMENT OF RURAL WATER SUPPLY AND
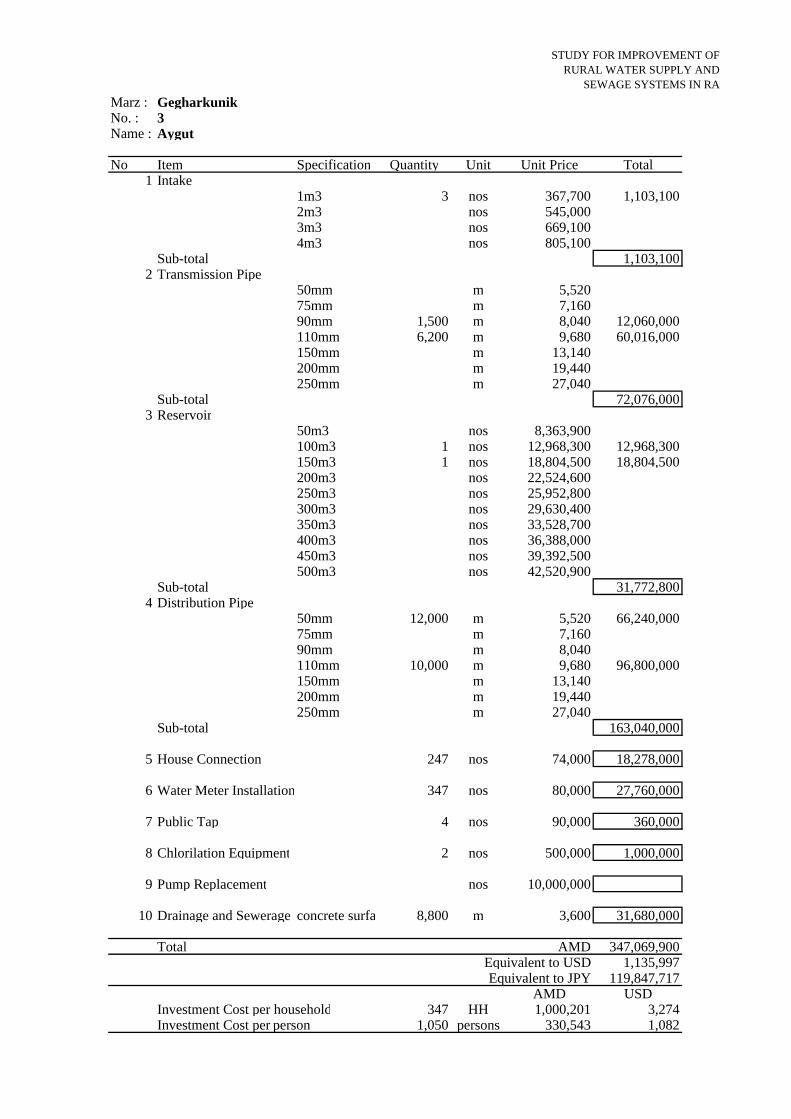
SEWAGE SYSTEMS IN RAMarz : Gegharkunik No. : 3Name : Aygut
No Item Specification Quantity Unit Unit Price Total1 Intake
1m3 3 nos 367,700 1,103,1002m3 nos 545,0003m3 nos 669,1004m3 nos 805,100
Sub-total 1,103,1002 Transmission Pipe
50mm m 5,52075mm m 7,16090mm 1,500 m 8,040 12,060,000110mm 6,200 m 9,680 60,016,000150mm m 13,140200mm m 19,440250mm m 27,040
Sub-total 72,076,0003 Reservoir
50m3 nos 8,363,900100m3 1 nos 12,968,300 12,968,300150m3 1 nos 18,804,500 18,804,500200m3 nos 22,524,600250m3 nos 25,952,800300m3 nos 29,630,400350m3 nos 33,528,700400m3 nos 36,388,000450m3 nos 39,392,500500m3 nos 42,520,900
Sub-total 31,772,8004 Distribution Pipe
50mm 12,000 m 5,520 66,240,00075mm m 7,16090mm m 8,040110mm 10,000 m 9,680 96,800,000150mm m 13,140200mm m 19,440250mm m 27,040
Sub-total 163,040,000
5 House Connection 247 nos 74,000 18,278,000
6 Water Meter Installation 347 nos 80,000 27,760,000
7 Public Tap 4 nos 90,000 360,000
8 Chlorilation Equipment 2 nos 500,000 1,000,000
9 Pump Replacement nos 10,000,000
10 Drainage and Sewerage concrete surfa 8,800 m 3,600 31,680,000
Total AMD 347,069,900Equivalent to USD 1,135,997Equivalent to JPY 119,847,717
AMD USDInvestment Cost per household 347 HH 1,000,201 3,274Investment Cost per person 1,050 persons 330,543 1,082
GEGHARKUNIK MARZ
No 3 Aygut0% 70% 30%
PROJECTED INCOME STATEMENT 0% 70% 100% Unit: million AMDDescription Unit
Total 1 2 3 4 5 6 7 8 9 10 11 12 13 14 15 16 17 18 19 20 21 22 23 24 25 26 27 28 29 30 31 32 33 34 35 36 37 38 39 40A Water Sales Revenue 0 0.00 0.00 1.26 1.81 1.87 3.16 3.27 3.37 3.49 5.22 5.40 5.57 5.76 5.95 6.14 6.35 6.56 6.77 7.00 7.23 7.47 7.71 7.97 8.23 8.50 8.78 9.07 9.37 9.68 10.00 10.33 10.67 11.02 11.39 11.76 12.15 12.55 12.97 13.39
Consumption water volume 1000m3/yr 50.2Unit rate AMD/m3 40.00 40.00 40.00 41.32 70.00 72.31 74.70 77.16 115.65 119.47 123.41 127.48 131.69 136.03 140.52 145.16 149.95 154.90 160.01 165.29 170.75 176.38 182.20 188.21 194.42 200.84 207.47 214.31 221.39 228.69 236.24 244.04 252.09 260.41 269.00 277.88 287.05 296.52
Sub-total 279.19 0.00 0.00 0.00 1.26 1.81 1.87 3.16 3.27 3.37 3.49 5.22 5.40 5.57 5.76 5.95 6.14 6.35 6.56 6.77 7.00 7.23 7.47 7.71 7.97 8.23 8.50 8.78 9.07 9.37 9.68 10.00 10.33 10.67 11.02 11.39 11.76 12.15 12.55 12.97 13.39
B Operating Costs1. Staff salary 0.24 0.25 0.26 0.26 0.27 0.28 0.29 0.30 0.31 0.32 0.33 0.34 0.35 0.37 0.38 0.39 0.40 0.42 0.43 0.44 0.46 0.47 0.49 0.51 0.52 0.54 0.56 0.58 0.60 0.62 0.64 0.66 0.68 0.70 0.72 0.75 0.77 0.80
Inspectors person 1Pump operators person 0Base Salary AMD/m/p 20,000 20,660 21,342 22,046 22,774 23,525 24,301 25,103 25,932 26,788 27,672 28,585 29,528 30,502 31,509 32,549 33,623 34,732 35,879 37,063 38,286 39,549 40,854 42,202 43,595 45,034 46,520 48,055 49,641 51,279 52,971 54,719 56,525 58,390 60,317 62,308 64,364 66,488Sub-total 17.70 0.24 0.25 0.26 0.26 0.27 0.28 0.29 0.30 0.31 0.32 0.33 0.34 0.35 0.37 0.38 0.39 0.40 0.42 0.43 0.44 0.46 0.47 0.49 0.51 0.52 0.54 0.56 0.58 0.60 0.62 0.64 0.66 0.68 0.70 0.72 0.75 0.77 0.80
2. Chlorine 0.18 0.19 0.19 0.20 0.21 0.21 0.22 0.23 0.23 0.24 0.25 0.26 0.27 0.28 0.29 0.29 0.30 0.31 0.32 0.34 0.35 0.36 0.37 0.38 0.40 0.41 0.42 0.44 0.45 0.46 0.48 0.50 0.51 0.53 0.55 0.56 0.58 0.60Pouring volume kg/yr 302Unit rate AMD/kg 600 620 640 661 683 706 729 753 778 804 830 858 886 915 945 976 1009 1042 1076 1112 1149 1186 1226 1266 1308 1351 1396 1442 1489 1538 1589 1642 1696 1752 1810 1869 1931 1995Sub-total 13.12 0.00 0.13 0.19 0.20 0.21 0.21 0.22 0.23 0.23 0.24 0.25 0.26 0.27 0.28 0.29 0.29 0.30 0.31 0.32 0.34 0.35 0.36 0.37 0.38 0.40 0.41 0.42 0.44 0.45 0.46 0.48 0.50 0.51 0.53 0.55 0.56 0.58 0.60
3. Electricity (for pump) 0.00 0.00 0.00 0.00 0.00 0.00 0.00 0.00 0.00 0.00 0.00 0.00 0.00 0.00 0.00 0.00 0.00 0.00 0.00 0.00 0.00 0.00 0.00 0.00 0.00 0.00 0.00 0.00 0.00 0.00 0.00 0.00 0.00 0.00 0.00 0.00 0.00 0.00 0.00 0.004. Maintenance cost 76.09 1.05 0.00 0.76 1.12 1.16 1.20 1.24 1.28 1.32 1.36 1.41 1.45 1.50 1.55 1.60 1.65 1.71 1.77 1.82 1.88 1.95 2.01 2.08 2.14 2.22 2.29 2.36 2.44 2.52 2.61 2.69 2.78 2.87 2.97 3.07 3.17 3.27 3.38 3.49
Pump repair 0.00 0.00 0.00 0.00 0.00 0.00 0.00 0.00 0.00 0.00 0.00 0.00 0.00 0.00 0.00 0.00 0.00 0.00 0.00 0.00 0.00 0.00 0.00 0.00 0.00 0.00 0.00 0.00 0.00 0.00 0.00 0.00 0.00 0.00 0.00 0.00 0.00 0.00 0.00Pipe repair 1.05 0 0.76 1.12 1.16 1.20 1.24 1.28 1.32 1.36 1.41 1.45 1.50 1.55 1.60 1.65 1.71 1.77 1.82 1.88 1.95 2.01 2.08 2.14 2.22 2.29 2.36 2.44 2.52 2.61 2.69 2.78 2.87 2.97 3.07 3.17 3.27 3.38 3.49
5. Pump replacement 0.00 0.00 0.00 0.00Sub-total 106.91 0.00 0.00 0.24 1.14 1.57 1.62 1.68 1.73 1.79 1.85 1.90 1.97 2.03 2.10 2.17 2.25 2.32 2.39 2.47 2.55 2.63 2.73 2.82 2.91 3.00 3.11 3.21 3.31 3.42 3.54 3.66 3.77 3.90 4.03 4.16 4.30 4.44 4.58 4.73 4.89
C Gross Income (A-B) 172.28 0.00 0.00 -0.24 0.12 0.24 0.25 1.48 1.54 1.58 1.64 3.32 3.43 3.54 3.66 3.78 3.89 4.03 4.17 4.30 4.45 4.60 4.74 4.89 5.06 5.23 5.39 5.57 5.76 5.95 6.14 6.34 6.56 6.77 6.99 7.23 7.46 7.71 7.97 8.24 8.50
D Depreciation cost 329.70 9.42 9.42 9.42 9.42 9.42 9.42 9.42 9.42 9.42 9.42 9.42 9.42 9.42 9.42 9.42 9.42 9.42 9.42 9.42 9.42 9.42 9.42 9.42 9.42 9.42 9.42 9.42 9.42 9.42 9.42 9.42 9.42 9.42 9.42 9.42
E Interest paid 100.17 0.04 0.07 0.11 3.04 4.35 4.35 4.35 4.35 4.35 4.35 4.36 4.23 4.11 3.98 3.85 3.72 3.59 3.45 3.32 3.18 3.05 2.91 2.77 2.63 2.48 2.34 2.20 2.05 1.90 1.75 1.60 1.45 1.29 1.14 0.98 0.82 0.66 0.50 0.33 0.17
F Net Income -257.59 -0.04 -0.07 -0.35 -2.92 -4.11 -13.52 -12.29 -12.23 -12.19 -12.13 -10.46 -10.22 -9.99 -9.74 -9.49 -9.25 -8.98 -8.70 -8.44 -8.15 -7.87 -7.59 -7.30 -6.99 -6.67 -6.37 -6.05 -5.71 -5.37 -5.03 -4.68 -4.31 -3.94 -3.57 -3.17 -2.78 -2.37 -1.95 -1.51 -1.09
G Tax and duties 0.00 0.00 0.00 0.00 0.00 0.00 0.00 0.00 0.00 0.00 0.00 0.00 0.00 0.00 0.00 0.00 0.00 0.00 0.00 0.00 0.00 0.00 0.00 0.00 0.00 0.00 0.00 0.00 0.00 0.00 0.00 0.00 0.00 0.00 0.00 0.00 0.00 0.00 0.00 0.00 0.00
H Net Income after deduction of TAX -257.59 -0.04 -0.07 -0.35 -2.92 -4.11 -13.52 -12.29 -12.23 -12.19 -12.13 -10.46 -10.22 -9.99 -9.74 -9.49 -9.25 -8.98 -8.70 -8.44 -8.15 -7.87 -7.59 -7.30 -6.99 -6.67 -6.37 -6.05 -5.71 -5.37 -5.03 -4.68 -4.31 -3.94 -3.57 -3.17 -2.78 -2.37 -1.95 -1.51 -1.09
OM Cost Recovery Ratio (A/B) 261% 0% 0% 0% 110% 115% 115% 188% 189% 188% 189% 275% 274% 274% 274% 274% 273% 274% 274% 274% 275% 275% 274% 273% 274% 274% 273% 274% 274% 274% 273% 273% 274% 274% 273% 274% 273% 274% 274% 274% 274%
PROJECTED CASH FLOW STATEMENT Unit: million AMDDescription
Total 1 2 3 4 5 6 7 8 9 10 11 12 13 14 15 16 17 18 19 20 21 22 23 24 25 26 27 28 29 30 31 32 33 34 35 36 37 38 39 40SOURCES OF FUNDSA Internal Cash Generation
1. Net Income -257.59 -0.04 -0.07 -0.35 -2.92 -4.11 -13.52 -12.29 -12.23 -12.19 -12.13 -10.46 -10.22 -9.99 -9.74 -9.49 -9.25 -8.98 -8.70 -8.44 -8.15 -7.87 -7.59 -7.30 -6.99 -6.67 -6.37 -6.05 -5.71 -5.37 -5.03 -4.68 -4.31 -3.94 -3.57 -3.17 -2.78 -2.37 -1.95 -1.51 -1.092. Depreciation cost 329.70 0.00 0.00 0.00 0.00 0.00 9.42 9.42 9.42 9.42 9.42 9.42 9.42 9.42 9.42 9.42 9.42 9.42 9.42 9.42 9.42 9.42 9.42 9.42 9.42 9.42 9.42 9.42 9.42 9.42 9.42 9.42 9.42 9.42 9.42 9.42 9.42 9.42 9.42 9.42 9.423. Interest Paid 100.17 0.04 0.07 0.11 3.04 4.35 4.35 4.35 4.35 4.35 4.35 4.36 4.23 4.11 3.98 3.85 3.72 3.59 3.45 3.32 3.18 3.05 2.91 2.77 2.63 2.48 2.34 2.20 2.05 1.90 1.75 1.60 1.45 1.29 1.14 0.98 0.82 0.66 0.50 0.33 0.17Sub-total 172.28 0.00 0.00 -0.24 0.12 0.24 0.25 1.48 1.54 1.58 1.64 3.32 3.43 3.54 3.66 3.78 3.89 4.03 4.17 4.30 4.45 4.60 4.74 4.89 5.06 5.23 5.39 5.57 5.76 5.95 6.14 6.34 6.56 6.77 6.99 7.23 7.46 7.71 7.97 8.24 8.50
-0.04 #REF! #REF! #REF! #REF! #REF! #REF! #REF! #REF! #REF! #REF! #REF! #REF! #REF! #REF! #REF! #REF! #REF! #REF! #REF! #REF! #REF! #REF! #REF! #REF! #REF! #REF! #REF! #REF! #REF! #REF! #REF! #REF! #REF! #REF! #REF! #REF! #REF! #REF! #REF!B Finances
1. Project Loan 435.71 3.91 2.79 4.12 293.80 130.06 0.58 0.452. Local fund 150.44 1.29 0.91 1.40 101.31 45.40 0.07 0.06Sub-total 586.15 5.20 3.70 5.52 395.11 175.46 0.65 0.51
C Subsidy from Government1. Subsidy for O&M cost 0.24 0.00 0.00 0.24 0.00 0.00 0.00 0.00 0.00 0.00 0.00 0.00 0.00 0.00 0.00 0.00 0.00 0.00 0.00 0.00 0.00 0.00 0.00 0.00 0.00 0.00 0.00 0.00 0.00 0.00 0.00 0.00 0.00 0.00 0.00 0.00 0.00 0.00 0.00 0.00 0.002. Subsidy for debt services 363.35 0.04 0.07 0.11 2.92 4.11 4.10 2.87 2.81 2.77 2.71 13.57 13.45 13.35 13.23 13.10 12.99 12.86 12.71 12.58 12.43 12.29 12.14 11.99 11.83 11.65 11.49 11.32 11.12 10.93 10.74 10.54 10.33 10.11 9.90 9.65 9.42 9.17 8.92 8.64 8.39Sub-total 363.59 0.04 0.07 0.35 2.92 4.11 4.10 2.87 2.81 2.77 2.71 13.57 13.45 13.35 13.23 13.10 12.99 12.86 12.71 12.58 12.43 12.29 12.14 11.99 11.83 11.65 11.49 11.32 11.12 10.93 10.74 10.54 10.33 10.11 9.90 9.65 9.42 9.17 8.92 8.64 8.39
Total Cash Inflow 1122.02 5.24 3.77 5.63 398.15 179.81 5.00 4.86 4.35 4.35 4.35 16.89 16.88 16.89 16.89 16.88 16.88 16.89 16.88 16.88 16.88 16.89 16.88 16.88 16.89 16.88 16.88 16.89 16.88 16.88 16.88 16.88 16.89 16.88 16.89 16.88 16.88 16.88 16.89 16.88 16.89
APPLICATION OF FUNDSD Project disbursement 586.15 5.20 3.70 5.52 395.11 175.46 0.65 0.51
E Total debt services1. Loan repayment 435.70 12.53 12.65 12.78 12.91 13.03 13.16 13.30 13.43 13.56 13.70 13.84 13.97 14.11 14.26 14.40 14.54 14.69 14.83 14.98 15.13 15.28 15.44 15.59 15.75 15.90 16.06 16.22 16.39 16.55 16.722. Interest paid 100.17 0.04 0.07 0.11 3.04 4.35 4.35 4.35 4.35 4.35 4.35 4.36 4.23 4.11 3.98 3.85 3.72 3.59 3.45 3.32 3.18 3.05 2.91 2.77 2.63 2.48 2.34 2.20 2.05 1.90 1.75 1.60 1.45 1.29 1.14 0.98 0.82 0.66 0.50 0.33 0.17Sub-total 535.87 0.04 0.07 0.11 3.04 4.35 4.35 4.35 4.35 4.35 4.35 16.89 16.88 16.89 16.89 16.88 16.88 16.89 16.88 16.88 16.88 16.89 16.88 16.88 16.89 16.88 16.88 16.89 16.88 16.88 16.88 16.88 16.89 16.88 16.89 16.88 16.88 16.88 16.89 16.88 16.89
Total Cash Outflow 1122.02 5.24 3.77 5.63 398.15 179.81 5.00 4.86 4.35 4.35 4.35 16.89 16.88 16.89 16.89 16.88 16.88 16.89 16.88 16.88 16.88 16.89 16.88 16.88 16.89 16.88 16.88 16.89 16.88 16.88 16.88 16.88 16.89 16.88 16.89 16.88 16.88 16.88 16.89 16.88 16.89
F Net Surplus Cash (A+C2)-E 0.00 0.00 0.00 0.00 0.00 0.00 0.00 0.00 0.00 0.00 0.00 0.00 0.00 0.00 0.00 0.00 0.00 0.00 0.00 0.00 0.00 0.00 0.00 0.00 0.00 0.00 0.00 0.00 0.00 0.00 0.00 0.00 0.00 0.00 0.00 0.00 0.00 0.00 0.00 0.00 0.00
Investment Cost Recovery Ratio (%)Cost recovery by water fee (A/E) 32% 0% 0% 0% 4% 6% 6% 34% 35% 36% 38% 20% 20% 21% 22% 22% 23% 24% 25% 25% 26% 27% 28% 29% 30% 31% 32% 33% 34% 35% 36% 38% 39% 40% 41% 43% 44% 46% 47% 49% 50%Cost recovery by water fee + subsidy ((A+C2)/E) 100% 100% 100% 100% 100% 100% 100% 100% 100% 100% 100% 100% 100% 100% 100% 100% 100% 100% 100% 100% 100% 100% 100% 100% 100% 100% 100% 100% 100% 100% 100% 100% 100% 100% 100% 100% 100% 100% 100% 100% 100%
Ijevan District
Year
Year
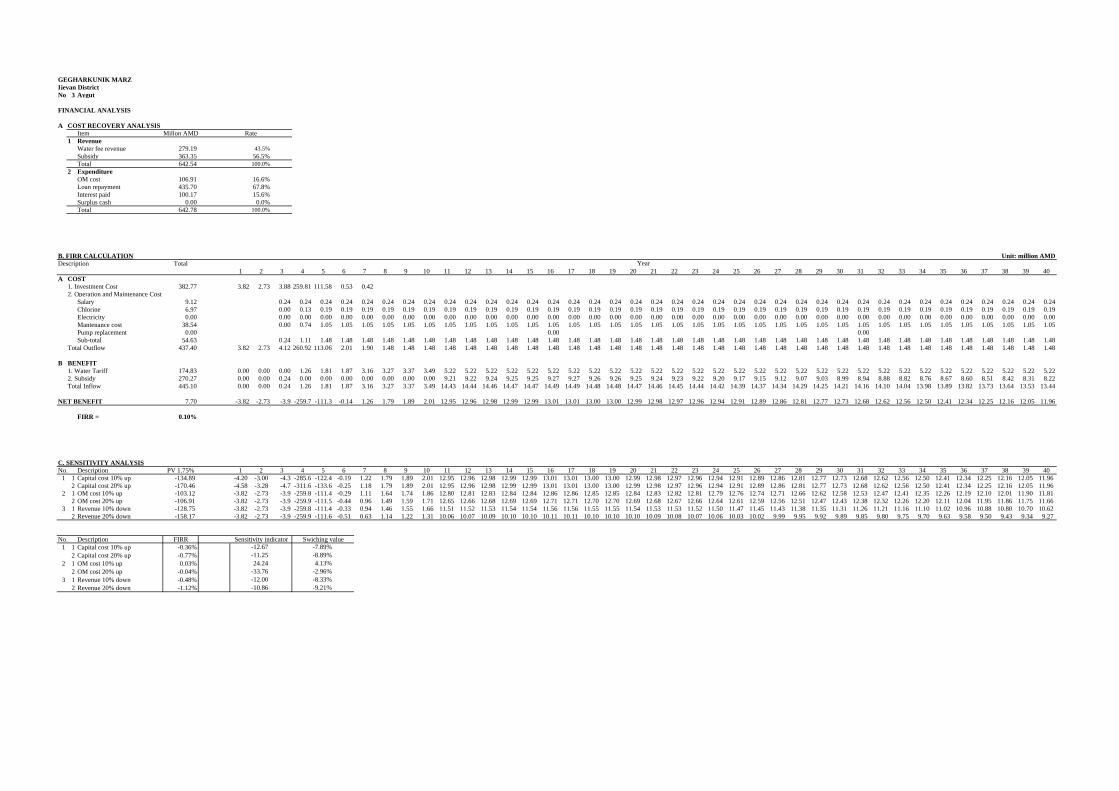
GEGHARKUNIK MARZIjevan DistrictNo 3 Aygut
FINANCIAL ANALYSIS
A COST RECOVERY ANALYSISItem Millon AMD Rate
1 RevenueWater fee revenue 279.19 43.5%Subsidy 363.35 56.5%Total 642.54 100.0%
2 ExpenditureOM cost 106.91 16.6%Loan repayment 435.70 67.8%Interest paid 100.17 15.6%Surplus cash 0.00 0.0%Total 642.78 100.0%
B. FIRR CALCULATION Unit: million AMDDescription Total
1 2 3 4 5 6 7 8 9 10 11 12 13 14 15 16 17 18 19 20 21 22 23 24 25 26 27 28 29 30 31 32 33 34 35 36 37 38 39 40A COST
1. Investment Cost 382.77 3.82 2.73 3.88 259.81 111.58 0.53 0.422. Operation and Maintenance Cost
Salary 9.12 0.24 0.24 0.24 0.24 0.24 0.24 0.24 0.24 0.24 0.24 0.24 0.24 0.24 0.24 0.24 0.24 0.24 0.24 0.24 0.24 0.24 0.24 0.24 0.24 0.24 0.24 0.24 0.24 0.24 0.24 0.24 0.24 0.24 0.24 0.24 0.24 0.24 0.24Chlorine 6.97 0.00 0.13 0.19 0.19 0.19 0.19 0.19 0.19 0.19 0.19 0.19 0.19 0.19 0.19 0.19 0.19 0.19 0.19 0.19 0.19 0.19 0.19 0.19 0.19 0.19 0.19 0.19 0.19 0.19 0.19 0.19 0.19 0.19 0.19 0.19 0.19 0.19 0.19Electricity 0.00 0.00 0.00 0.00 0.00 0.00 0.00 0.00 0.00 0.00 0.00 0.00 0.00 0.00 0.00 0.00 0.00 0.00 0.00 0.00 0.00 0.00 0.00 0.00 0.00 0.00 0.00 0.00 0.00 0.00 0.00 0.00 0.00 0.00 0.00 0.00 0.00 0.00 0.00Mantenance cost 38.54 0.00 0.74 1.05 1.05 1.05 1.05 1.05 1.05 1.05 1.05 1.05 1.05 1.05 1.05 1.05 1.05 1.05 1.05 1.05 1.05 1.05 1.05 1.05 1.05 1.05 1.05 1.05 1.05 1.05 1.05 1.05 1.05 1.05 1.05 1.05 1.05 1.05 1.05Pump replacement 0.00 0.00 0.00 0.00Sub-total 54.63 0.24 1.11 1.48 1.48 1.48 1.48 1.48 1.48 1.48 1.48 1.48 1.48 1.48 1.48 1.48 1.48 1.48 1.48 1.48 1.48 1.48 1.48 1.48 1.48 1.48 1.48 1.48 1.48 1.48 1.48 1.48 1.48 1.48 1.48 1.48 1.48 1.48 1.48
Total Outflow 437.40 3.82 2.73 4.12 260.92 113.06 2.01 1.90 1.48 1.48 1.48 1.48 1.48 1.48 1.48 1.48 1.48 1.48 1.48 1.48 1.48 1.48 1.48 1.48 1.48 1.48 1.48 1.48 1.48 1.48 1.48 1.48 1.48 1.48 1.48 1.48 1.48 1.48 1.48 1.48 1.48
B BENEFIT1. Water Tariff 174.83 0.00 0.00 0.00 1.26 1.81 1.87 3.16 3.27 3.37 3.49 5.22 5.22 5.22 5.22 5.22 5.22 5.22 5.22 5.22 5.22 5.22 5.22 5.22 5.22 5.22 5.22 5.22 5.22 5.22 5.22 5.22 5.22 5.22 5.22 5.22 5.22 5.22 5.22 5.22 5.222. Subsidy 270.27 0.00 0.00 0.24 0.00 0.00 0.00 0.00 0.00 0.00 0.00 9.21 9.22 9.24 9.25 9.25 9.27 9.27 9.26 9.26 9.25 9.24 9.23 9.22 9.20 9.17 9.15 9.12 9.07 9.03 8.99 8.94 8.88 8.82 8.76 8.67 8.60 8.51 8.42 8.31 8.22Total Inflow 445.10 0.00 0.00 0.24 1.26 1.81 1.87 3.16 3.27 3.37 3.49 14.43 14.44 14.46 14.47 14.47 14.49 14.49 14.48 14.48 14.47 14.46 14.45 14.44 14.42 14.39 14.37 14.34 14.29 14.25 14.21 14.16 14.10 14.04 13.98 13.89 13.82 13.73 13.64 13.53 13.44
NET BENEFIT 7.70 -3.82 -2.73 -3.9 -259.7 -111.3 -0.14 1.26 1.79 1.89 2.01 12.95 12.96 12.98 12.99 12.99 13.01 13.01 13.00 13.00 12.99 12.98 12.97 12.96 12.94 12.91 12.89 12.86 12.81 12.77 12.73 12.68 12.62 12.56 12.50 12.41 12.34 12.25 12.16 12.05 11.96
FIRR = 0.10%
C. SENSITIVITY ANALYSISNo. Description PV 1.75% 1 2 3 4 5 6 7 8 9 10 11 12 13 14 15 16 17 18 19 20 21 22 23 24 25 26 27 28 29 30 31 32 33 34 35 36 37 38 39 40
1 1 Capital cost 10% up -134.89 -4.20 -3.00 -4.3 -285.6 -122.4 -0.19 1.22 1.79 1.89 2.01 12.95 12.96 12.98 12.99 12.99 13.01 13.01 13.00 13.00 12.99 12.98 12.97 12.96 12.94 12.91 12.89 12.86 12.81 12.77 12.73 12.68 12.62 12.56 12.50 12.41 12.34 12.25 12.16 12.05 11.962 Capital cost 20% up -170.46 -4.58 -3.28 -4.7 -311.6 -133.6 -0.25 1.18 1.79 1.89 2.01 12.95 12.96 12.98 12.99 12.99 13.01 13.01 13.00 13.00 12.99 12.98 12.97 12.96 12.94 12.91 12.89 12.86 12.81 12.77 12.73 12.68 12.62 12.56 12.50 12.41 12.34 12.25 12.16 12.05 11.96
2 1 OM cost 10% up -103.12 -3.82 -2.73 -3.9 -259.8 -111.4 -0.29 1.11 1.64 1.74 1.86 12.80 12.81 12.83 12.84 12.84 12.86 12.86 12.85 12.85 12.84 12.83 12.82 12.81 12.79 12.76 12.74 12.71 12.66 12.62 12.58 12.53 12.47 12.41 12.35 12.26 12.19 12.10 12.01 11.90 11.812 OM cost 20% up -106.91 -3.82 -2.73 -3.9 -259.9 -111.5 -0.44 0.96 1.49 1.59 1.71 12.65 12.66 12.68 12.69 12.69 12.71 12.71 12.70 12.70 12.69 12.68 12.67 12.66 12.64 12.61 12.59 12.56 12.51 12.47 12.43 12.38 12.32 12.26 12.20 12.11 12.04 11.95 11.86 11.75 11.66
3 1 Revenue 10% down -128.75 -3.82 -2.73 -3.9 -259.8 -111.4 -0.33 0.94 1.46 1.55 1.66 11.51 11.52 11.53 11.54 11.54 11.56 11.56 11.55 11.55 11.54 11.53 11.53 11.52 11.50 11.47 11.45 11.43 11.38 11.35 11.31 11.26 11.21 11.16 11.10 11.02 10.96 10.88 10.80 10.70 10.622 Revenue 20% down -158.17 -3.82 -2.73 -3.9 -259.9 -111.6 -0.51 0.63 1.14 1.22 1.31 10.06 10.07 10.09 10.10 10.10 10.11 10.11 10.10 10.10 10.10 10.09 10.08 10.07 10.06 10.03 10.02 9.99 9.95 9.92 9.89 9.85 9.80 9.75 9.70 9.63 9.58 9.50 9.43 9.34 9.27
No. Description FIRR Sensitivity indicator Swiching value1 1 Capital cost 10% up -0.36%
2 Capital cost 20% up -0.77%2 1 OM cost 10% up 0.03%
2 OM cost 20% up -0.04%3 1 Revenue 10% down -0.48%
2 Revenue 20% down -1.12%-12.00 -8.33%-10.86 -9.21%
24.24 4.13%-33.76 -2.96%
-12.67 -7.89%-11.25 -8.89%
Year
No.4 Ayrq
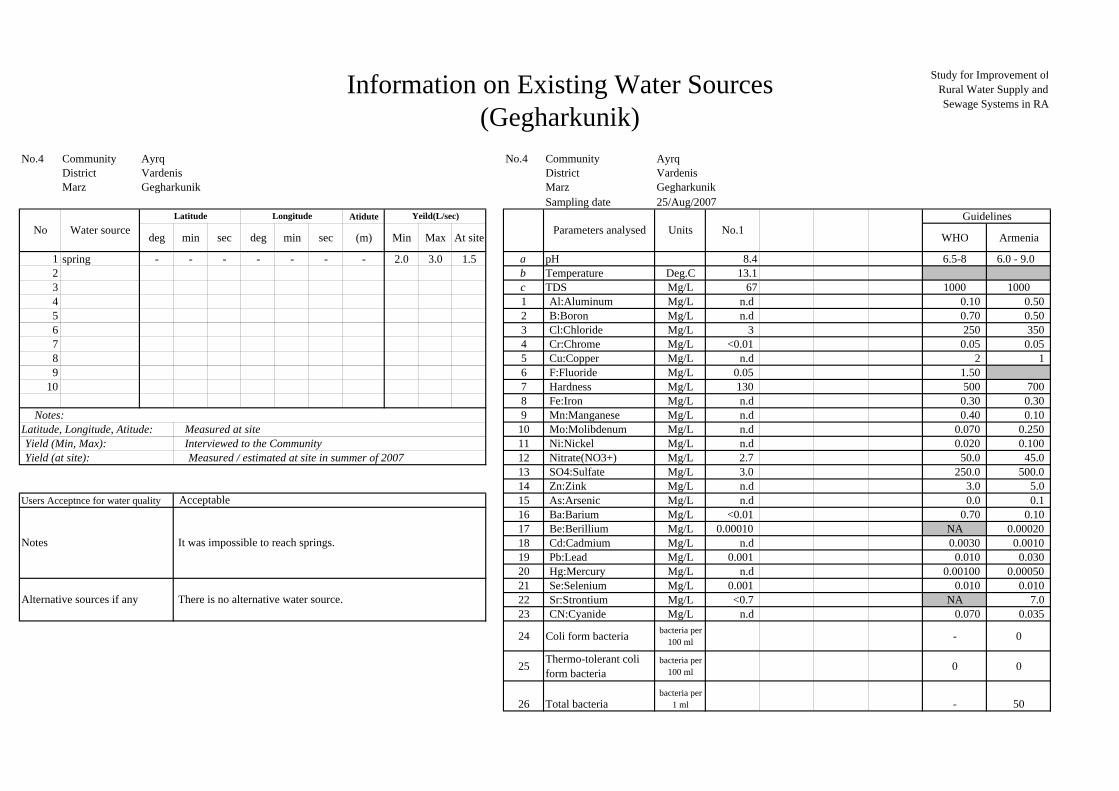
Information on Existing Water Sources(Gegharkunik)
Study for Improvement ofRural Water Supply andSewage Systems in RA
No.4 Community Ayrq No.4 Community Ayrq No. 1District Vardenis District VardenisMarz Gegharkunik Marz Gegharkunik
Sampling date 25/Aug/2007Atidute
deg min sec deg min sec (m) Min Max At site WHO Armenia
1 spring - - - - - - - 2.0 3.0 1.5 a pH 8.4 6.5-8 6.0 - 9.0 2 b Temperature Deg.C 13.13 c TDS Mg/L 67 1000 10004 1 Al:Aluminum Mg/L n.d 0.10 0.50 5 2 B:Boron Mg/L n.d 0.70 0.50 6 3 Cl:Chloride Mg/L 3 250 350 7 4 Cr:Chrome Mg/L <0.01 0.05 0.05 8 5 Cu:Copper Mg/L n.d 2 1 9 6 F:Fluoride Mg/L 0.05 1.50
10 7 Hardness Mg/L 130 500 700 8 Fe:Iron Mg/L n.d 0.30 0.30
Notes: 9 Mn:Manganese Mg/L n.d 0.40 0.10 Latitude, Longitude, Atitude: Measured at site 10 Mo:Molibdenum Mg/L n.d 0.070 0.250 Yield (Min, Max): Interviewed to the Community 11 Ni:Nickel Mg/L n.d 0.020 0.100 Yield (at site): Measured / estimated at site in summer of 2007 12 Nitrate(NO3+) Mg/L 2.7 50.0 45.0
13 SO4:Sulfate Mg/L 3.0 250.0 500.0 14 Zn:Zink Mg/L n.d 3.0 5.0
Users Acceptnce for water quality 15 As:Arsenic Mg/L n.d 0.0 0.1 16 Ba:Barium Mg/L <0.01 0.70 0.10 17 Be:Berillium Mg/L 0.00010 NA 0.00020 18 Cd:Cadmium Mg/L n.d 0.0030 0.0010 19 Pb:Lead Mg/L 0.001 0.010 0.030 20 Hg:Mercury Mg/L n.d 0.00100 0.00050 21 Se:Selenium Mg/L 0.001 0.010 0.010 22 Sr:Strontium Mg/L <0.7 NA 7.0 23 CN:Cyanide Mg/L n.d 0.070 0.035
24 Coli form bacteria bacteria per100 ml - 0
25 Thermo-tolerant coliform bacteria
bacteria per100 ml 0 0
26 Total bacteriabacteria per
1 ml - 50
Guidelines
Acceptable
Notes It was impossible to reach springs.
No.1
Alternative sources if any There is no alternative water source.
Parameters analysed UnitsNo Water sourceLatitude Longitude Yeild(L/sec)

Information on Existing Water SourcesExisting Bacteriological Test
Study for Improvement ofRural Water Supply andSewage Systems in RA
No.4 Community AyrqDistrict VardenisMarz Gegharkunik
Total amount of bacteria Total amount of coliform bacteria Coliform bacteria tolerant to heat
nos/1mL MPN/100mL nos/100 mL
Less than 50nos/1mL Not identified Not identified1 01 11 20 0.3 Not identified2 02 01 20 0.3 Not identified3 03 02 20 0.3 Not identified4 04 18 22 0.3 Not identified5 05 16 22 0.3 Not identified6 06 21 22 0.3 Not identified7 07 16 22 0.3 Not identified8 08 13 20 0.3 Not identified
No. Month Date
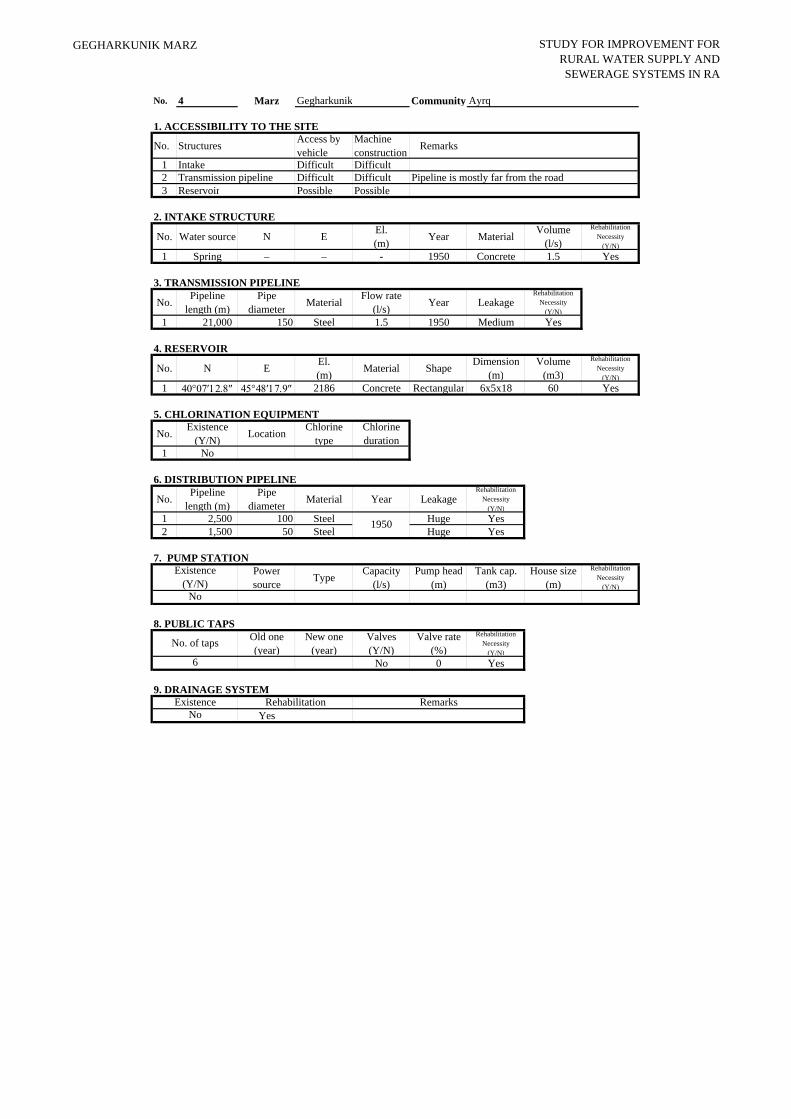
GEGHARKUNIK MARZ STUDY FOR IMPROVEMENT FORRURAL WATER SUPPLY ANDSEWERAGE SYSTEMS IN RA
No. 4 Marz Gegharkunik Community Ayrq
1. ACCESSIBILITY TO THE SITE
No. Structures Access byvehicle
Machineconstruction Remarks
1 Intake Difficult Difficult2 Transmission pipeline Difficult Difficult Pipeline is mostly far from the road3 Reservoir Possible Possible
2. INTAKE STRUCTURE
No. Water source N E El.(m) Year Material Volume
(l/s)
RehabilitationNecessity
(Y/N)1 Spring − − - 1950 Concrete 1.5 Yes
3. TRANSMISSION PIPELINE
No. Pipelinelength (m)
Pipediameter Material Flow rate
(l/s) Year LeakageRehabilitation
Necessity(Y/N)
1 21,000 150 Steel 1.5 1950 Medium Yes
4. RESERVOIR
No. N E El.(m) Material Shape Dimension
(m)Volume
(m3)
RehabilitationNecessity
(Y/N)1 40°07′12.8″ 45°48′17.9″ 2186 Concrete Rectangular 6x5x18 60 Yes
5. CHLORINATION EQUIPMENT
No. Existence(Y/N) Location Chlorine
typeChlorineduration
1 No
6. DISTRIBUTION PIPELINE
No. Pipelinelength (m)
Pipediameter Material Year Leakage
RehabilitationNecessity
(Y/N)1 2,500 100 Steel Huge Yes2 1,500 50 Steel Huge Yes
7. PUMP STATIONPowersource Type Capacity
(l/s)Pump head
(m)Tank cap.
(m3)House size
(m)
RehabilitationNecessity
(Y/N)
8. PUBLIC TAPSOld one(year)
New one(year)
Valves(Y/N)
Valve rate(%)
RehabilitationNecessity
(Y/N)No 0 Yes
9. DRAINAGE SYSTEM
YesNo
No. of taps
6
1950
Existence(Y/N)
No
Existence Rehabilitation Remarks
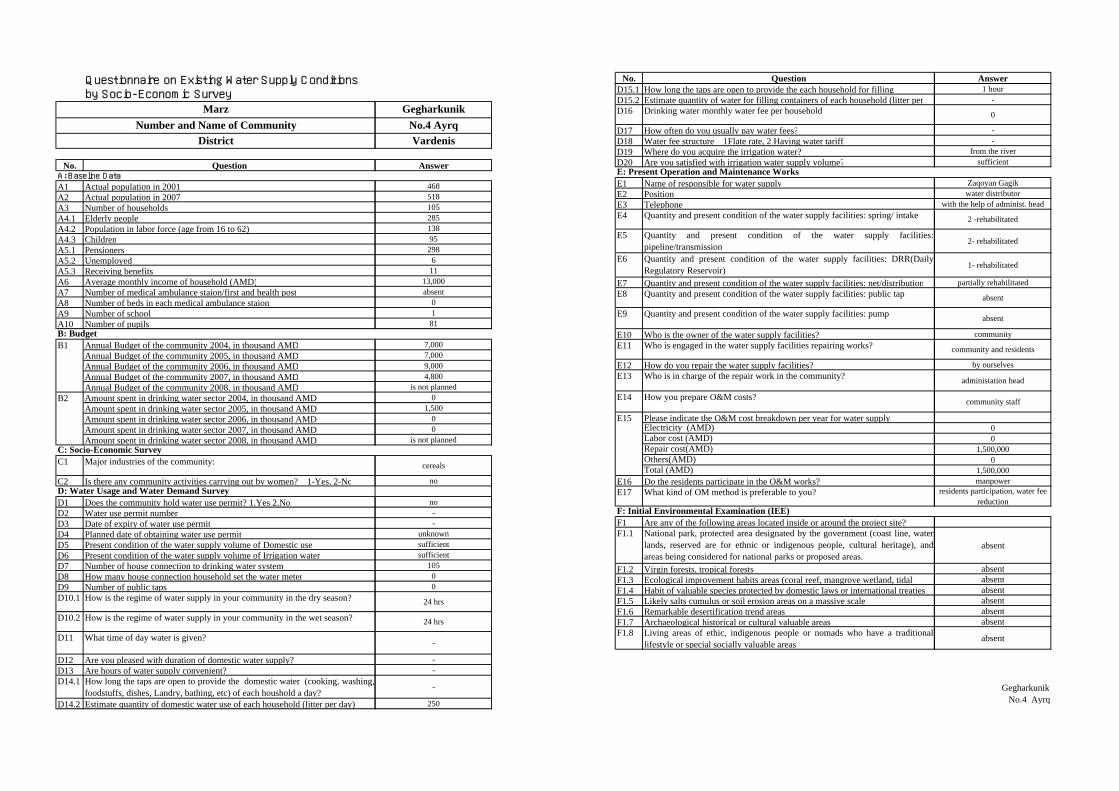
Questionnaire on Existing Water Supply Conditionsby Socio-Economic Survey
No. QuestionA: Baseline DataA1 Actual population in 2001A2 Actual population in 2007A3 Number of householdsA4.1 Elderly peopleA4.2 Population in labor force (age from 16 to 62)A4.3 ChildrenA5.1 PensionersA5.2 UnemployedA5.3 Receiving benefitsA6 Average monthly income of household (AMD)A7 Number of medical ambulance staion/first and health postA8 Number of beds in each medical ambulance staionA9 Number of schoolA10 Number of pupilsB: Budget
Annual Budget of the community 2004, in thousand AMDAnnual Budget of the community 2005, in thousand AMDAnnual Budget of the community 2006, in thousand AMDAnnual Budget of the community 2007, in thousand AMDAnnual Budget of the community 2008, in thousand AMDAmount spent in drinking water sector 2004, in thousand AMDAmount spent in drinking water sector 2005, in thousand AMDAmount spent in drinking water sector 2006, in thousand AMDAmount spent in drinking water sector 2007, in thousand AMDAmount spent in drinking water sector 2008, in thousand AMD
C: Socio-Economic SurveyC1 Major industries of the community:
C2 Is there any community activities carrying out by women? 1-Yes, 2-NoD: Water Usage and Water Demand SurveyD1 Does the community hold water use permit? 1.Yes 2.NoD2 Water use permit numberD3 Date of expiry of water use permitD4 Planned date of obtaining water use permitD5 Present condition of the water supply volume of Domestic useD6 Present condition of the water supply volume of Irrigation waterD7 Number of house connection to drinking water systemD8 How many house connection household set the water meterD9 Number of public tapsD10.1 How is the regime of water supply in your community in the dry season?
D10.2 How is the regime of water supply in your community in the wet season?
D11 What time of day water is given?
D12 Are you pleased with duration of domestic water supply?D13 Are hours of water supply convenient?D14.1 How long the taps are open to provide the domestic water (cooking, washing,
foodstuffs, dishes, Landry, bathing, etc) of each houshold a day?D14.2 Estimate quantity of domestic water use of each household (litter per day)
MarzNumber and Name of Community
District
B1
B2
GegharkunikNo.4 AyrqVardenis
Answer
46851810528513895
2986
1113,000absent
01
81
7,0007,0009,0004,800
is not planned0
1,50000
is not planned
cereals
no
no--
unknownsufficientsufficient
10500
24 hrs
24 hrs
-
--
-
250
No. QuestionD15.1 How long the taps are open to provide the each household for fillingD15.2 Estimate quantity of water for filling containers of each household (litter perD16 Drinking water monthly water fee per household
D17 How often do you usually pay water fees?D18 Water fee structure 1Flate rate, 2 Having water tariffD19 Where do you acquire the irrigation water?D20 Are you satisfied with irrigation water supply volume?E: Present Operation and Maintenance WorksE1 Name of responsible for water supplyE2 PositionE3 TelephoneE4 Quantity and present condition of the water supply facilities: spring/ intake
E5 Quantity and present condition of the water supply facilities:pipeline/transmission
E6 Quantity and present condition of the water supply facilities: DRR(DailyRegulatory Reservoir)
E7 Quantity and present condition of the water supply facilities: net/distributionE8 Quantity and present condition of the water supply facilities: public tap
E9 Quantity and present condition of the water supply facilities: pump
E10 Who is the owner of the water supply facilities?E11 Who is engaged in the water supply facilities repairing works?
E12 How do you repair the water supply facilities?E13 Who is in charge of the repair work in the community?
E14 How you prepare O&M costs?
Please indicate the O&M cost breakdown per year for water supplyElectricity (AMD)Labor cost (AMD)Repair cost(AMD)Others(AMD)Total (AMD)
E16 Do the residents participate in the O&M works?E17 What kind of OM method is preferable to you?
F: Initial Environmental Examination (IEE)F1 Are any of the following areas located inside or around the project site?F1.1 National park, protected area designated by the government (coast line, water
lands, reserved are for ethnic or indigenous people, cultural heritage), andareas being considered for national parks or proposed areas.
F1.2 Virgin forests, tropical forestsF1.3 Ecological improvement habits areas (coral reef, mangrove wetland, tidalF1.4 Habit of valuable species protected by domestic laws or international treatiesF1.5 Likely salts cumulus or soil erosion areas on a massive scaleF1.6 Remarkable desertification trend areasF1.7 Archaeological historical or cultural valuable areasF1.8 Living areas of ethic, indigenous people or nomads who have a traditional
lifestyle or special socially valuable areas
E15
Answer1 hour
-
0
--
from the riversufficient
Zaqoyan Gagikwater distributor
with the help of administ. head
2 -rehabilitated
2- rehabilitated
1- rehabilitated
partially rehabilitated
absent
absent
community
community and residents
by ourselves
administation head
community staff
00
1,500,0000
1,500,000manpower
residents participation, water feereduction
absent
absentabsentabsentabsentabsentabsent
absent
GegharkunikNo.4 Ayrq
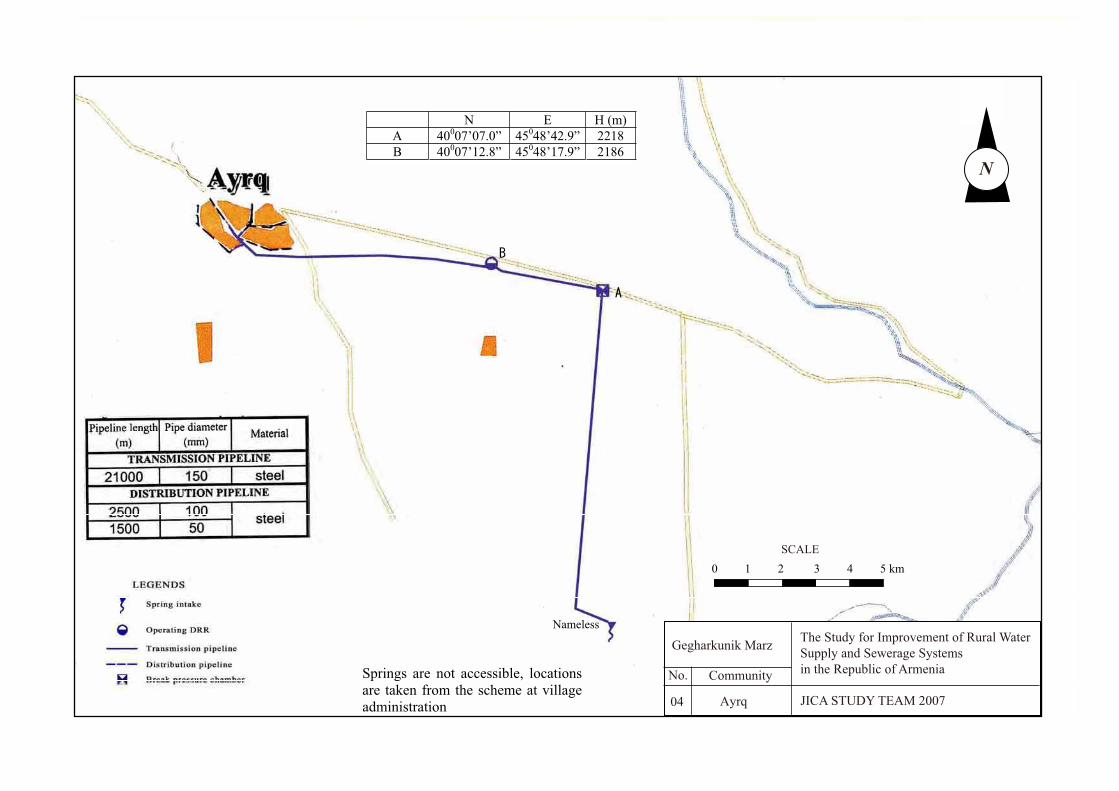
Nameless
Springs are not accessible, locationsare taken from the scheme at villageadministration
N E H (m)A 40007’07.0” 45048’42.9” 2218B 40007’12.8” 45048’17.9” 2186
N
Gegharkunik Marz
No.
Ayrq
The Study for Improvement of Rural WaterSupply and Sewerage Systems in the Republic of Armenia
JICA STUDY TEAM 200704
Community
0 1 2 3 4 5 kmSCALE
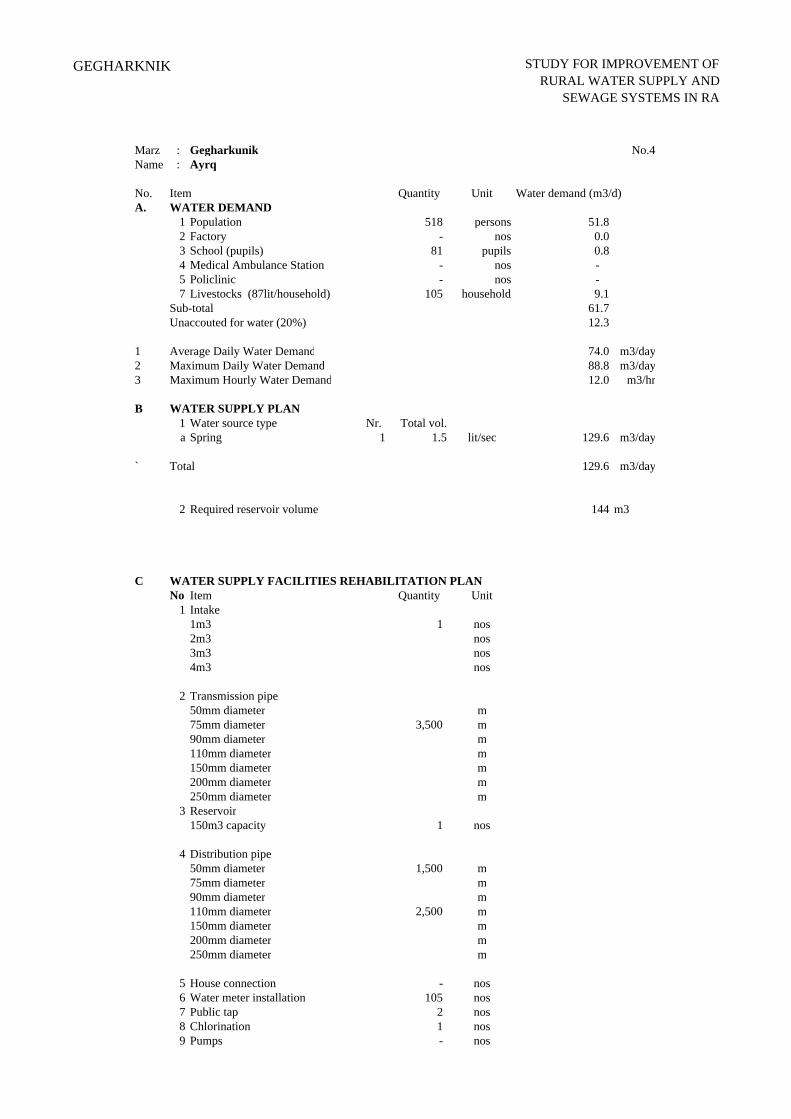
GEGHARKNIK STUDY FOR IMPROVEMENT OF RURAL WATER SUPPLY AND
SEWAGE SYSTEMS IN RA
Marz : Gegharkunik No.4Name : Ayrq
No. Item Quantity Unit Water demand (m3/d)A. WATER DEMAND
1 Population 518 persons 51.82 Factory - nos 0.03 School (pupils) 81 pupils 0.84 Medical Ambulance Station - nos - 5 Policlinic - nos - 7 Livestocks (87lit/household) 105 household 9.1
Sub-total 61.7Unaccouted for water (20%) 12.3
1 Average Daily Water Demand 74.0 m3/day2 Maximum Daily Water Demand 88.8 m3/day3 Maximum Hourly Water Demand 12.0 m3/hr
B WATER SUPPLY PLAN1 Water source type Nr. Total vol.a Spring 1 1.5 lit/sec 129.6 m3/day
` Total 129.6 m3/day
2 Required reservoir volume 144 m3
C WATER SUPPLY FACILITIES REHABILITATION PLANNo Item Quantity Unit
1 Intake1m3 1 nos2m3 nos3m3 nos4m3 nos
2 Transmission pipe50mm diameter m75mm diameter 3,500 m90mm diameter m110mm diameter m150mm diameter m200mm diameter m250mm diameter m
3 Reservoir150m3 capacity 1 nos
4 Distribution pipe50mm diameter 1,500 m75mm diameter m90mm diameter m110mm diameter 2,500 m150mm diameter m200mm diameter m250mm diameter m
5 House connection - nos6 Water meter installation 105 nos7 Public tap 2 nos8 Chlorination 1 nos9 Pumps - nos
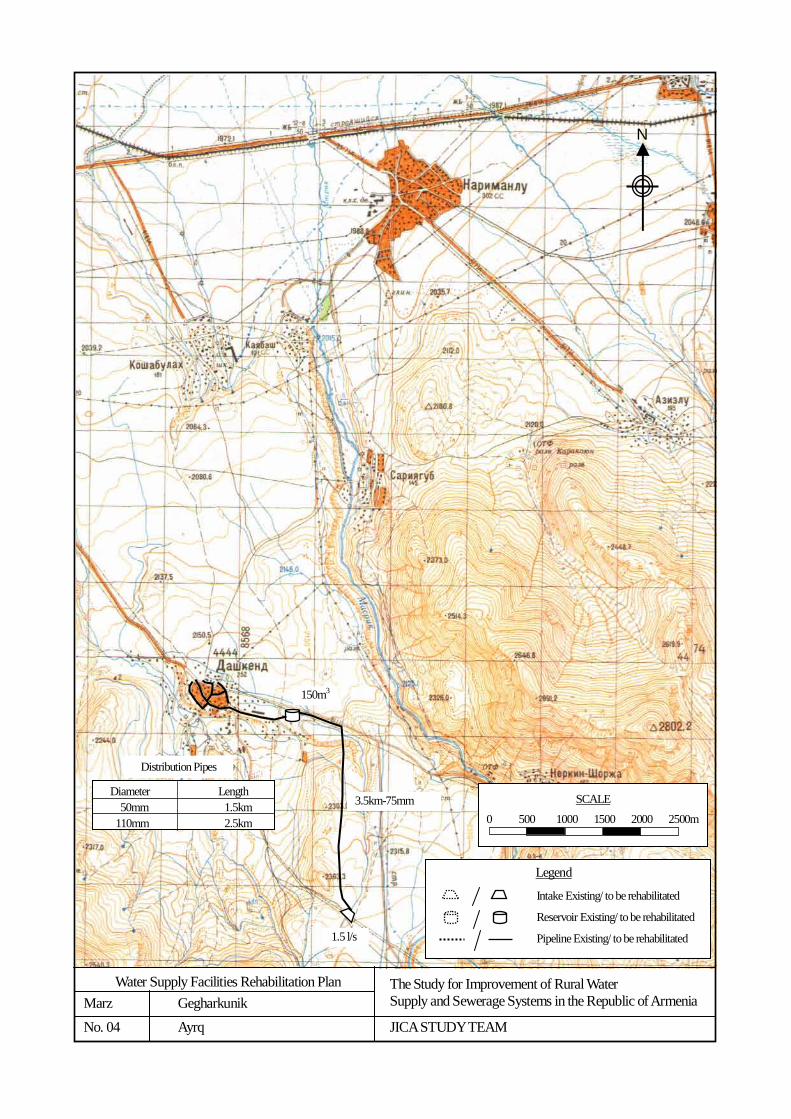
Water Supply Facilities Rehabilitation Plan Marz Gegharkunik No. 04 Ayrq
The Study for Improvement of Rural Water Supply and Sewerage Systems in the Republic of Armenia
JICA STUDY TEAM
N
Legend
Intake Existing/ to be rehabilitated
Reservoir Existing/ to be rehabilitated
Pipeline Existing/ to be rehabilitated
SCALE
0 500 1000 1500 2000 2500m
150m3
1.5 l/s
3.5km-75mm Diameter Length 50mm 1.5km 110mm 2.5km
Distribution Pipes
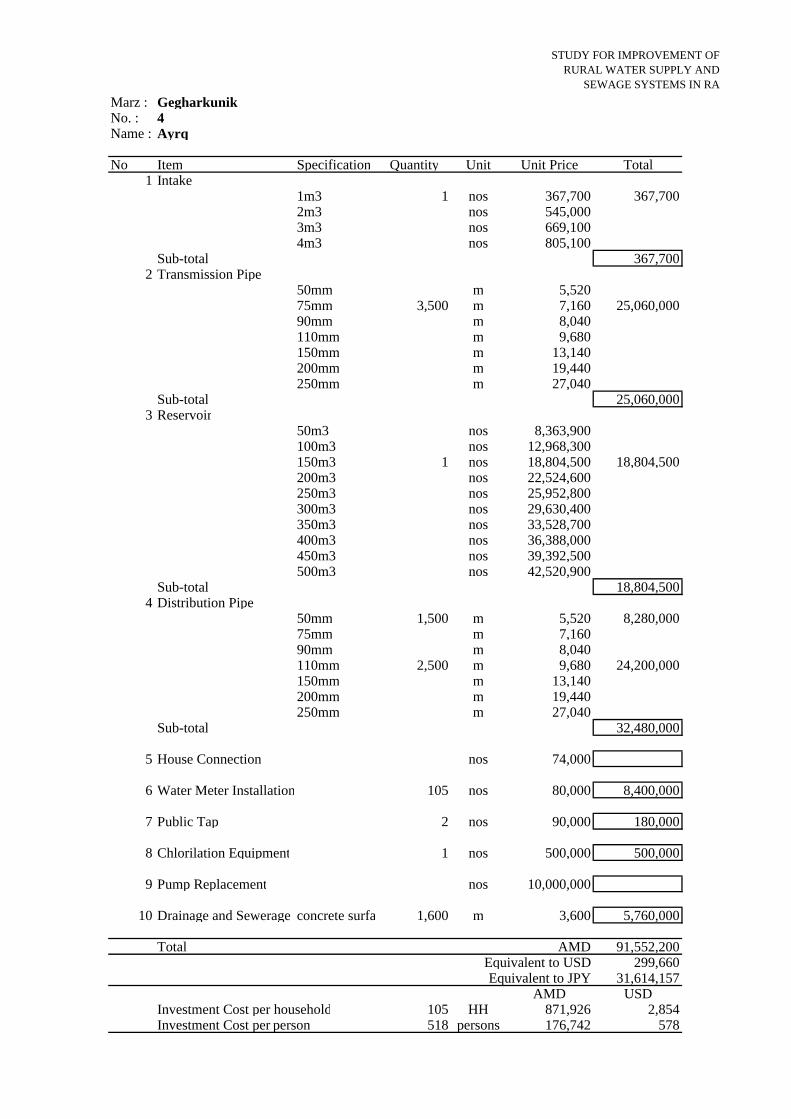
STUDY FOR IMPROVEMENT OF RURAL WATER SUPPLY AND
SEWAGE SYSTEMS IN RAMarz : Gegharkunik No. : 4Name : Ayrq
No Item Specification Quantity Unit Unit Price Total1 Intake
1m3 1 nos 367,700 367,7002m3 nos 545,0003m3 nos 669,1004m3 nos 805,100
Sub-total 367,7002 Transmission Pipe
50mm m 5,52075mm 3,500 m 7,160 25,060,00090mm m 8,040110mm m 9,680150mm m 13,140200mm m 19,440250mm m 27,040
Sub-total 25,060,0003 Reservoir
50m3 nos 8,363,900100m3 nos 12,968,300150m3 1 nos 18,804,500 18,804,500200m3 nos 22,524,600250m3 nos 25,952,800300m3 nos 29,630,400350m3 nos 33,528,700400m3 nos 36,388,000450m3 nos 39,392,500500m3 nos 42,520,900
Sub-total 18,804,5004 Distribution Pipe
50mm 1,500 m 5,520 8,280,00075mm m 7,16090mm m 8,040110mm 2,500 m 9,680 24,200,000150mm m 13,140200mm m 19,440250mm m 27,040
Sub-total 32,480,000
5 House Connection nos 74,000
6 Water Meter Installation 105 nos 80,000 8,400,000
7 Public Tap 2 nos 90,000 180,000
8 Chlorilation Equipment 1 nos 500,000 500,000
9 Pump Replacement nos 10,000,000
10 Drainage and Sewerage concrete surfa 1,600 m 3,600 5,760,000
Total AMD 91,552,200Equivalent to USD 299,660Equivalent to JPY 31,614,157
AMD USDInvestment Cost per household 105 HH 871,926 2,854Investment Cost per person 518 persons 176,742 578
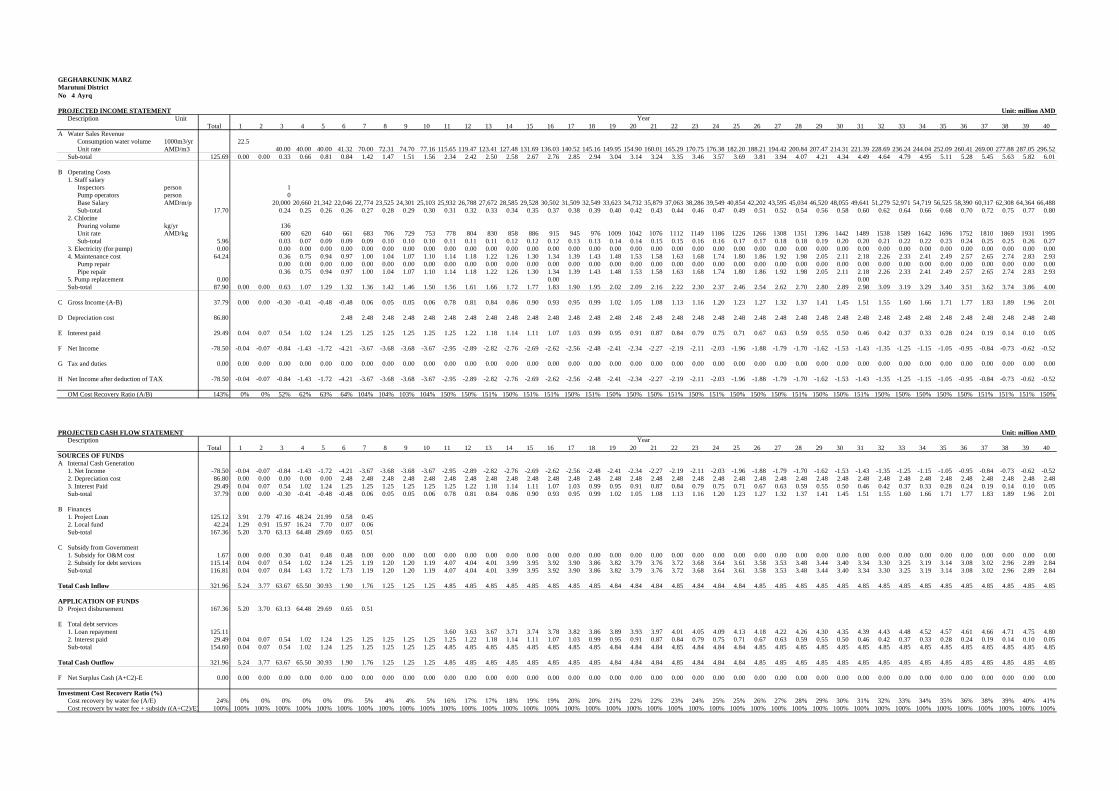
GEGHARKUNIK MARZ
No 4 Ayrq41% 41% 18%
PROJECTED INCOME STATEMENT 41% 82% 100% Unit: million AMDDescription Unit
Total 1 2 3 4 5 6 7 8 9 10 11 12 13 14 15 16 17 18 19 20 21 22 23 24 25 26 27 28 29 30 31 32 33 34 35 36 37 38 39 40A Water Sales Revenue 0 0.00 0.33 0.66 0.81 0.84 1.42 1.47 1.51 1.56 2.34 2.42 2.50 2.58 2.67 2.76 2.85 2.94 3.04 3.14 3.24 3.35 3.46 3.57 3.69 3.81 3.94 4.07 4.21 4.34 4.49 4.64 4.79 4.95 5.11 5.28 5.45 5.63 5.82 6.01
Consumption water volume 1000m3/yr 22.5Unit rate AMD/m3 40.00 40.00 40.00 41.32 70.00 72.31 74.70 77.16 115.65 119.47 123.41 127.48 131.69 136.03 140.52 145.16 149.95 154.90 160.01 165.29 170.75 176.38 182.20 188.21 194.42 200.84 207.47 214.31 221.39 228.69 236.24 244.04 252.09 260.41 269.00 277.88 287.05 296.52
Sub-total 125.69 0.00 0.00 0.33 0.66 0.81 0.84 1.42 1.47 1.51 1.56 2.34 2.42 2.50 2.58 2.67 2.76 2.85 2.94 3.04 3.14 3.24 3.35 3.46 3.57 3.69 3.81 3.94 4.07 4.21 4.34 4.49 4.64 4.79 4.95 5.11 5.28 5.45 5.63 5.82 6.01
B Operating Costs1. Staff salary 0.24 0.25 0.26 0.26 0.27 0.28 0.29 0.30 0.31 0.32 0.33 0.34 0.35 0.37 0.38 0.39 0.40 0.42 0.43 0.44 0.46 0.47 0.49 0.51 0.52 0.54 0.56 0.58 0.60 0.62 0.64 0.66 0.68 0.70 0.72 0.75 0.77 0.80
Inspectors person 1Pump operators person 0Base Salary AMD/m/p 20,000 20,660 21,342 22,046 22,774 23,525 24,301 25,103 25,932 26,788 27,672 28,585 29,528 30,502 31,509 32,549 33,623 34,732 35,879 37,063 38,286 39,549 40,854 42,202 43,595 45,034 46,520 48,055 49,641 51,279 52,971 54,719 56,525 58,390 60,317 62,308 64,364 66,488Sub-total 17.70 0.24 0.25 0.26 0.26 0.27 0.28 0.29 0.30 0.31 0.32 0.33 0.34 0.35 0.37 0.38 0.39 0.40 0.42 0.43 0.44 0.46 0.47 0.49 0.51 0.52 0.54 0.56 0.58 0.60 0.62 0.64 0.66 0.68 0.70 0.72 0.75 0.77 0.80
2. Chlorine 0.08 0.08 0.09 0.09 0.09 0.10 0.10 0.10 0.11 0.11 0.11 0.12 0.12 0.12 0.13 0.13 0.14 0.14 0.15 0.15 0.16 0.16 0.17 0.17 0.18 0.18 0.19 0.20 0.20 0.21 0.22 0.22 0.23 0.24 0.25 0.25 0.26 0.27Pouring volume kg/yr 136Unit rate AMD/kg 600 620 640 661 683 706 729 753 778 804 830 858 886 915 945 976 1009 1042 1076 1112 1149 1186 1226 1266 1308 1351 1396 1442 1489 1538 1589 1642 1696 1752 1810 1869 1931 1995Sub-total 5.96 0.03 0.07 0.09 0.09 0.09 0.10 0.10 0.10 0.11 0.11 0.11 0.12 0.12 0.12 0.13 0.13 0.14 0.14 0.15 0.15 0.16 0.16 0.17 0.17 0.18 0.18 0.19 0.20 0.20 0.21 0.22 0.22 0.23 0.24 0.25 0.25 0.26 0.27
3. Electricity (for pump) 0.00 0.00 0.00 0.00 0.00 0.00 0.00 0.00 0.00 0.00 0.00 0.00 0.00 0.00 0.00 0.00 0.00 0.00 0.00 0.00 0.00 0.00 0.00 0.00 0.00 0.00 0.00 0.00 0.00 0.00 0.00 0.00 0.00 0.00 0.00 0.00 0.00 0.00 0.00 0.004. Maintenance cost 64.24 0.88 0.36 0.75 0.94 0.97 1.00 1.04 1.07 1.10 1.14 1.18 1.22 1.26 1.30 1.34 1.39 1.43 1.48 1.53 1.58 1.63 1.68 1.74 1.80 1.86 1.92 1.98 2.05 2.11 2.18 2.26 2.33 2.41 2.49 2.57 2.65 2.74 2.83 2.93
Pump repair 0.00 0.00 0.00 0.00 0.00 0.00 0.00 0.00 0.00 0.00 0.00 0.00 0.00 0.00 0.00 0.00 0.00 0.00 0.00 0.00 0.00 0.00 0.00 0.00 0.00 0.00 0.00 0.00 0.00 0.00 0.00 0.00 0.00 0.00 0.00 0.00 0.00 0.00 0.00Pipe repair 0.88 0.36 0.75 0.94 0.97 1.00 1.04 1.07 1.10 1.14 1.18 1.22 1.26 1.30 1.34 1.39 1.43 1.48 1.53 1.58 1.63 1.68 1.74 1.80 1.86 1.92 1.98 2.05 2.11 2.18 2.26 2.33 2.41 2.49 2.57 2.65 2.74 2.83 2.93
5. Pump replacement 0.00 0.00 0.00 0.00Sub-total 87.90 0.00 0.00 0.63 1.07 1.29 1.32 1.36 1.42 1.46 1.50 1.56 1.61 1.66 1.72 1.77 1.83 1.90 1.95 2.02 2.09 2.16 2.22 2.30 2.37 2.46 2.54 2.62 2.70 2.80 2.89 2.98 3.09 3.19 3.29 3.40 3.51 3.62 3.74 3.86 4.00
C Gross Income (A-B) 37.79 0.00 0.00 -0.30 -0.41 -0.48 -0.48 0.06 0.05 0.05 0.06 0.78 0.81 0.84 0.86 0.90 0.93 0.95 0.99 1.02 1.05 1.08 1.13 1.16 1.20 1.23 1.27 1.32 1.37 1.41 1.45 1.51 1.55 1.60 1.66 1.71 1.77 1.83 1.89 1.96 2.01
D Depreciation cost 86.80 2.48 2.48 2.48 2.48 2.48 2.48 2.48 2.48 2.48 2.48 2.48 2.48 2.48 2.48 2.48 2.48 2.48 2.48 2.48 2.48 2.48 2.48 2.48 2.48 2.48 2.48 2.48 2.48 2.48 2.48 2.48 2.48 2.48 2.48 2.48
E Interest paid 29.49 0.04 0.07 0.54 1.02 1.24 1.25 1.25 1.25 1.25 1.25 1.25 1.22 1.18 1.14 1.11 1.07 1.03 0.99 0.95 0.91 0.87 0.84 0.79 0.75 0.71 0.67 0.63 0.59 0.55 0.50 0.46 0.42 0.37 0.33 0.28 0.24 0.19 0.14 0.10 0.05
F Net Income -78.50 -0.04 -0.07 -0.84 -1.43 -1.72 -4.21 -3.67 -3.68 -3.68 -3.67 -2.95 -2.89 -2.82 -2.76 -2.69 -2.62 -2.56 -2.48 -2.41 -2.34 -2.27 -2.19 -2.11 -2.03 -1.96 -1.88 -1.79 -1.70 -1.62 -1.53 -1.43 -1.35 -1.25 -1.15 -1.05 -0.95 -0.84 -0.73 -0.62 -0.52
G Tax and duties 0.00 0.00 0.00 0.00 0.00 0.00 0.00 0.00 0.00 0.00 0.00 0.00 0.00 0.00 0.00 0.00 0.00 0.00 0.00 0.00 0.00 0.00 0.00 0.00 0.00 0.00 0.00 0.00 0.00 0.00 0.00 0.00 0.00 0.00 0.00 0.00 0.00 0.00 0.00 0.00 0.00
H Net Income after deduction of TAX -78.50 -0.04 -0.07 -0.84 -1.43 -1.72 -4.21 -3.67 -3.68 -3.68 -3.67 -2.95 -2.89 -2.82 -2.76 -2.69 -2.62 -2.56 -2.48 -2.41 -2.34 -2.27 -2.19 -2.11 -2.03 -1.96 -1.88 -1.79 -1.70 -1.62 -1.53 -1.43 -1.35 -1.25 -1.15 -1.05 -0.95 -0.84 -0.73 -0.62 -0.52
OM Cost Recovery Ratio (A/B) 143% 0% 0% 52% 62% 63% 64% 104% 104% 103% 104% 150% 150% 151% 150% 151% 151% 150% 151% 150% 150% 150% 151% 150% 151% 150% 150% 150% 151% 150% 150% 151% 150% 150% 150% 150% 150% 151% 151% 151% 150%
PROJECTED CASH FLOW STATEMENT Unit: million AMDDescription
Total 1 2 3 4 5 6 7 8 9 10 11 12 13 14 15 16 17 18 19 20 21 22 23 24 25 26 27 28 29 30 31 32 33 34 35 36 37 38 39 40SOURCES OF FUNDSA Internal Cash Generation
1. Net Income -78.50 -0.04 -0.07 -0.84 -1.43 -1.72 -4.21 -3.67 -3.68 -3.68 -3.67 -2.95 -2.89 -2.82 -2.76 -2.69 -2.62 -2.56 -2.48 -2.41 -2.34 -2.27 -2.19 -2.11 -2.03 -1.96 -1.88 -1.79 -1.70 -1.62 -1.53 -1.43 -1.35 -1.25 -1.15 -1.05 -0.95 -0.84 -0.73 -0.62 -0.522. Depreciation cost 86.80 0.00 0.00 0.00 0.00 0.00 2.48 2.48 2.48 2.48 2.48 2.48 2.48 2.48 2.48 2.48 2.48 2.48 2.48 2.48 2.48 2.48 2.48 2.48 2.48 2.48 2.48 2.48 2.48 2.48 2.48 2.48 2.48 2.48 2.48 2.48 2.48 2.48 2.48 2.48 2.483. Interest Paid 29.49 0.04 0.07 0.54 1.02 1.24 1.25 1.25 1.25 1.25 1.25 1.25 1.22 1.18 1.14 1.11 1.07 1.03 0.99 0.95 0.91 0.87 0.84 0.79 0.75 0.71 0.67 0.63 0.59 0.55 0.50 0.46 0.42 0.37 0.33 0.28 0.24 0.19 0.14 0.10 0.05Sub-total 37.79 0.00 0.00 -0.30 -0.41 -0.48 -0.48 0.06 0.05 0.05 0.06 0.78 0.81 0.84 0.86 0.90 0.93 0.95 0.99 1.02 1.05 1.08 1.13 1.16 1.20 1.23 1.27 1.32 1.37 1.41 1.45 1.51 1.55 1.60 1.66 1.71 1.77 1.83 1.89 1.96 2.01
-0.04 #REF! #REF! #REF! #REF! #REF! #REF! #REF! #REF! #REF! #REF! #REF! #REF! #REF! #REF! #REF! #REF! #REF! #REF! #REF! #REF! #REF! #REF! #REF! #REF! #REF! #REF! #REF! #REF! #REF! #REF! #REF! #REF! #REF! #REF! #REF! #REF! #REF! #REF! #REF!B Finances
1. Project Loan 125.12 3.91 2.79 47.16 48.24 21.99 0.58 0.452. Local fund 42.24 1.29 0.91 15.97 16.24 7.70 0.07 0.06Sub-total 167.36 5.20 3.70 63.13 64.48 29.69 0.65 0.51
C Subsidy from Government1. Subsidy for O&M cost 1.67 0.00 0.00 0.30 0.41 0.48 0.48 0.00 0.00 0.00 0.00 0.00 0.00 0.00 0.00 0.00 0.00 0.00 0.00 0.00 0.00 0.00 0.00 0.00 0.00 0.00 0.00 0.00 0.00 0.00 0.00 0.00 0.00 0.00 0.00 0.00 0.00 0.00 0.00 0.00 0.002. Subsidy for debt services 115.14 0.04 0.07 0.54 1.02 1.24 1.25 1.19 1.20 1.20 1.19 4.07 4.04 4.01 3.99 3.95 3.92 3.90 3.86 3.82 3.79 3.76 3.72 3.68 3.64 3.61 3.58 3.53 3.48 3.44 3.40 3.34 3.30 3.25 3.19 3.14 3.08 3.02 2.96 2.89 2.84Sub-total 116.81 0.04 0.07 0.84 1.43 1.72 1.73 1.19 1.20 1.20 1.19 4.07 4.04 4.01 3.99 3.95 3.92 3.90 3.86 3.82 3.79 3.76 3.72 3.68 3.64 3.61 3.58 3.53 3.48 3.44 3.40 3.34 3.30 3.25 3.19 3.14 3.08 3.02 2.96 2.89 2.84
Total Cash Inflow 321.96 5.24 3.77 63.67 65.50 30.93 1.90 1.76 1.25 1.25 1.25 4.85 4.85 4.85 4.85 4.85 4.85 4.85 4.85 4.84 4.84 4.84 4.85 4.84 4.84 4.84 4.85 4.85 4.85 4.85 4.85 4.85 4.85 4.85 4.85 4.85 4.85 4.85 4.85 4.85 4.85
APPLICATION OF FUNDSD Project disbursement 167.36 5.20 3.70 63.13 64.48 29.69 0.65 0.51
E Total debt services1. Loan repayment 125.11 3.60 3.63 3.67 3.71 3.74 3.78 3.82 3.86 3.89 3.93 3.97 4.01 4.05 4.09 4.13 4.18 4.22 4.26 4.30 4.35 4.39 4.43 4.48 4.52 4.57 4.61 4.66 4.71 4.75 4.802. Interest paid 29.49 0.04 0.07 0.54 1.02 1.24 1.25 1.25 1.25 1.25 1.25 1.25 1.22 1.18 1.14 1.11 1.07 1.03 0.99 0.95 0.91 0.87 0.84 0.79 0.75 0.71 0.67 0.63 0.59 0.55 0.50 0.46 0.42 0.37 0.33 0.28 0.24 0.19 0.14 0.10 0.05Sub-total 154.60 0.04 0.07 0.54 1.02 1.24 1.25 1.25 1.25 1.25 1.25 4.85 4.85 4.85 4.85 4.85 4.85 4.85 4.85 4.84 4.84 4.84 4.85 4.84 4.84 4.84 4.85 4.85 4.85 4.85 4.85 4.85 4.85 4.85 4.85 4.85 4.85 4.85 4.85 4.85 4.85
Total Cash Outflow 321.96 5.24 3.77 63.67 65.50 30.93 1.90 1.76 1.25 1.25 1.25 4.85 4.85 4.85 4.85 4.85 4.85 4.85 4.85 4.84 4.84 4.84 4.85 4.84 4.84 4.84 4.85 4.85 4.85 4.85 4.85 4.85 4.85 4.85 4.85 4.85 4.85 4.85 4.85 4.85 4.85
F Net Surplus Cash (A+C2)-E 0.00 0.00 0.00 0.00 0.00 0.00 0.00 0.00 0.00 0.00 0.00 0.00 0.00 0.00 0.00 0.00 0.00 0.00 0.00 0.00 0.00 0.00 0.00 0.00 0.00 0.00 0.00 0.00 0.00 0.00 0.00 0.00 0.00 0.00 0.00 0.00 0.00 0.00 0.00 0.00 0.00
Investment Cost Recovery Ratio (%)Cost recovery by water fee (A/E) 24% 0% 0% 0% 0% 0% 0% 5% 4% 4% 5% 16% 17% 17% 18% 19% 19% 20% 20% 21% 22% 22% 23% 24% 25% 25% 26% 27% 28% 29% 30% 31% 32% 33% 34% 35% 36% 38% 39% 40% 41%Cost recovery by water fee + subsidy ((A+C2)/E) 100% 100% 100% 100% 100% 100% 100% 100% 100% 100% 100% 100% 100% 100% 100% 100% 100% 100% 100% 100% 100% 100% 100% 100% 100% 100% 100% 100% 100% 100% 100% 100% 100% 100% 100% 100% 100% 100% 100% 100% 100%
Marutuni District
Year
Year
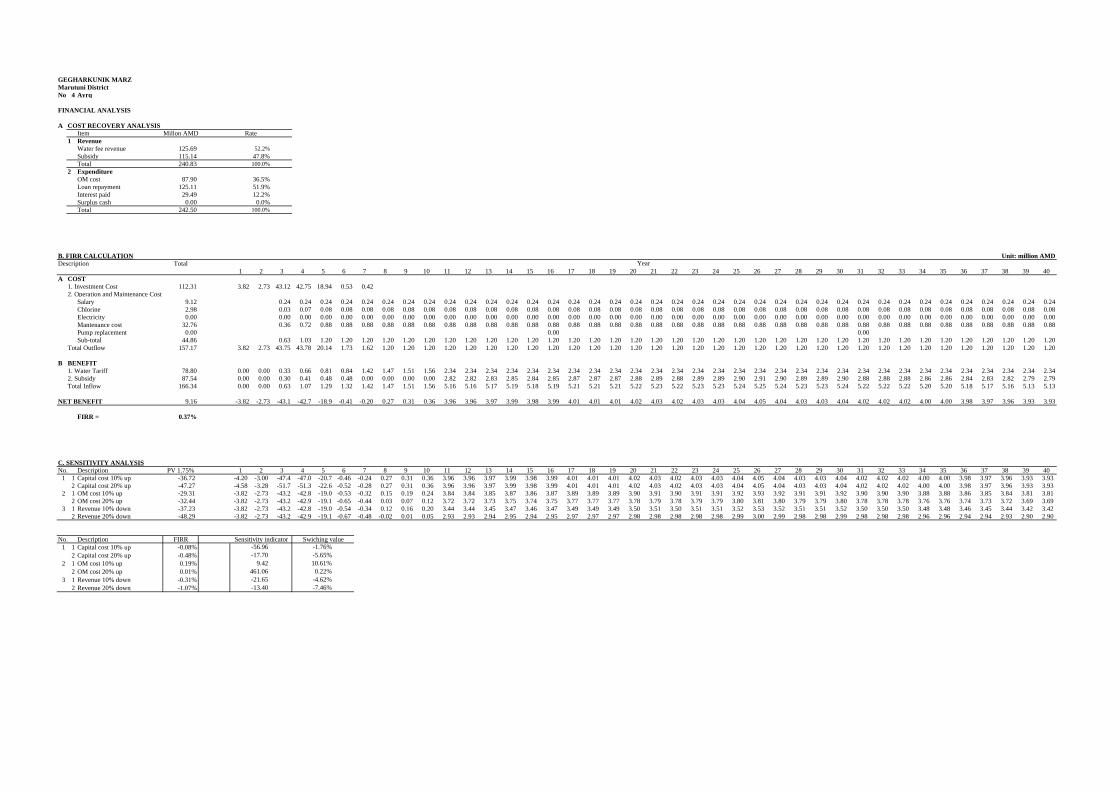
GEGHARKUNIK MARZMarutuni DistrictNo 4 Ayrq
FINANCIAL ANALYSIS
A COST RECOVERY ANALYSISItem Millon AMD Rate
1 RevenueWater fee revenue 125.69 52.2%Subsidy 115.14 47.8%Total 240.83 100.0%
2 ExpenditureOM cost 87.90 36.5%Loan repayment 125.11 51.9%Interest paid 29.49 12.2%Surplus cash 0.00 0.0%Total 242.50 100.0%
B. FIRR CALCULATION Unit: million AMDDescription Total
1 2 3 4 5 6 7 8 9 10 11 12 13 14 15 16 17 18 19 20 21 22 23 24 25 26 27 28 29 30 31 32 33 34 35 36 37 38 39 40A COST
1. Investment Cost 112.31 3.82 2.73 43.12 42.75 18.94 0.53 0.422. Operation and Maintenance Cost
Salary 9.12 0.24 0.24 0.24 0.24 0.24 0.24 0.24 0.24 0.24 0.24 0.24 0.24 0.24 0.24 0.24 0.24 0.24 0.24 0.24 0.24 0.24 0.24 0.24 0.24 0.24 0.24 0.24 0.24 0.24 0.24 0.24 0.24 0.24 0.24 0.24 0.24 0.24 0.24Chlorine 2.98 0.03 0.07 0.08 0.08 0.08 0.08 0.08 0.08 0.08 0.08 0.08 0.08 0.08 0.08 0.08 0.08 0.08 0.08 0.08 0.08 0.08 0.08 0.08 0.08 0.08 0.08 0.08 0.08 0.08 0.08 0.08 0.08 0.08 0.08 0.08 0.08 0.08 0.08Electricity 0.00 0.00 0.00 0.00 0.00 0.00 0.00 0.00 0.00 0.00 0.00 0.00 0.00 0.00 0.00 0.00 0.00 0.00 0.00 0.00 0.00 0.00 0.00 0.00 0.00 0.00 0.00 0.00 0.00 0.00 0.00 0.00 0.00 0.00 0.00 0.00 0.00 0.00 0.00Mantenance cost 32.76 0.36 0.72 0.88 0.88 0.88 0.88 0.88 0.88 0.88 0.88 0.88 0.88 0.88 0.88 0.88 0.88 0.88 0.88 0.88 0.88 0.88 0.88 0.88 0.88 0.88 0.88 0.88 0.88 0.88 0.88 0.88 0.88 0.88 0.88 0.88 0.88 0.88 0.88Pump replacement 0.00 0.00 0.00 0.00Sub-total 44.86 0.63 1.03 1.20 1.20 1.20 1.20 1.20 1.20 1.20 1.20 1.20 1.20 1.20 1.20 1.20 1.20 1.20 1.20 1.20 1.20 1.20 1.20 1.20 1.20 1.20 1.20 1.20 1.20 1.20 1.20 1.20 1.20 1.20 1.20 1.20 1.20 1.20 1.20
Total Outflow 157.17 3.82 2.73 43.75 43.78 20.14 1.73 1.62 1.20 1.20 1.20 1.20 1.20 1.20 1.20 1.20 1.20 1.20 1.20 1.20 1.20 1.20 1.20 1.20 1.20 1.20 1.20 1.20 1.20 1.20 1.20 1.20 1.20 1.20 1.20 1.20 1.20 1.20 1.20 1.20 1.20
B BENEFIT1. Water Tariff 78.80 0.00 0.00 0.33 0.66 0.81 0.84 1.42 1.47 1.51 1.56 2.34 2.34 2.34 2.34 2.34 2.34 2.34 2.34 2.34 2.34 2.34 2.34 2.34 2.34 2.34 2.34 2.34 2.34 2.34 2.34 2.34 2.34 2.34 2.34 2.34 2.34 2.34 2.34 2.34 2.342. Subsidy 87.54 0.00 0.00 0.30 0.41 0.48 0.48 0.00 0.00 0.00 0.00 2.82 2.82 2.83 2.85 2.84 2.85 2.87 2.87 2.87 2.88 2.89 2.88 2.89 2.89 2.90 2.91 2.90 2.89 2.89 2.90 2.88 2.88 2.88 2.86 2.86 2.84 2.83 2.82 2.79 2.79Total Inflow 166.34 0.00 0.00 0.63 1.07 1.29 1.32 1.42 1.47 1.51 1.56 5.16 5.16 5.17 5.19 5.18 5.19 5.21 5.21 5.21 5.22 5.23 5.22 5.23 5.23 5.24 5.25 5.24 5.23 5.23 5.24 5.22 5.22 5.22 5.20 5.20 5.18 5.17 5.16 5.13 5.13
NET BENEFIT 9.16 -3.82 -2.73 -43.1 -42.7 -18.9 -0.41 -0.20 0.27 0.31 0.36 3.96 3.96 3.97 3.99 3.98 3.99 4.01 4.01 4.01 4.02 4.03 4.02 4.03 4.03 4.04 4.05 4.04 4.03 4.03 4.04 4.02 4.02 4.02 4.00 4.00 3.98 3.97 3.96 3.93 3.93
FIRR = 0.37%
C. SENSITIVITY ANALYSISNo. Description PV 1.75% 1 2 3 4 5 6 7 8 9 10 11 12 13 14 15 16 17 18 19 20 21 22 23 24 25 26 27 28 29 30 31 32 33 34 35 36 37 38 39 40
1 1 Capital cost 10% up -36.72 -4.20 -3.00 -47.4 -47.0 -20.7 -0.46 -0.24 0.27 0.31 0.36 3.96 3.96 3.97 3.99 3.98 3.99 4.01 4.01 4.01 4.02 4.03 4.02 4.03 4.03 4.04 4.05 4.04 4.03 4.03 4.04 4.02 4.02 4.02 4.00 4.00 3.98 3.97 3.96 3.93 3.932 Capital cost 20% up -47.27 -4.58 -3.28 -51.7 -51.3 -22.6 -0.52 -0.28 0.27 0.31 0.36 3.96 3.96 3.97 3.99 3.98 3.99 4.01 4.01 4.01 4.02 4.03 4.02 4.03 4.03 4.04 4.05 4.04 4.03 4.03 4.04 4.02 4.02 4.02 4.00 4.00 3.98 3.97 3.96 3.93 3.93
2 1 OM cost 10% up -29.31 -3.82 -2.73 -43.2 -42.8 -19.0 -0.53 -0.32 0.15 0.19 0.24 3.84 3.84 3.85 3.87 3.86 3.87 3.89 3.89 3.89 3.90 3.91 3.90 3.91 3.91 3.92 3.93 3.92 3.91 3.91 3.92 3.90 3.90 3.90 3.88 3.88 3.86 3.85 3.84 3.81 3.812 OM cost 20% up -32.44 -3.82 -2.73 -43.2 -42.9 -19.1 -0.65 -0.44 0.03 0.07 0.12 3.72 3.72 3.73 3.75 3.74 3.75 3.77 3.77 3.77 3.78 3.79 3.78 3.79 3.79 3.80 3.81 3.80 3.79 3.79 3.80 3.78 3.78 3.78 3.76 3.76 3.74 3.73 3.72 3.69 3.69
3 1 Revenue 10% down -37.23 -3.82 -2.73 -43.2 -42.8 -19.0 -0.54 -0.34 0.12 0.16 0.20 3.44 3.44 3.45 3.47 3.46 3.47 3.49 3.49 3.49 3.50 3.51 3.50 3.51 3.51 3.52 3.53 3.52 3.51 3.51 3.52 3.50 3.50 3.50 3.48 3.48 3.46 3.45 3.44 3.42 3.422 Revenue 20% down -48.29 -3.82 -2.73 -43.2 -42.9 -19.1 -0.67 -0.48 -0.02 0.01 0.05 2.93 2.93 2.94 2.95 2.94 2.95 2.97 2.97 2.97 2.98 2.98 2.98 2.98 2.98 2.99 3.00 2.99 2.98 2.98 2.99 2.98 2.98 2.98 2.96 2.96 2.94 2.94 2.93 2.90 2.90
No. Description FIRR Sensitivity indicator Swiching value1 1 Capital cost 10% up -0.08%
2 Capital cost 20% up -0.48%2 1 OM cost 10% up 0.19%
2 OM cost 20% up 0.01%3 1 Revenue 10% down -0.31%
2 Revenue 20% down -1.07%-21.65 -4.62%-13.40 -7.46%
9.42 10.61%461.06 0.22%
-56.96 -1.76%-17.70 -5.65%
Year