Embed Size (px)
Citation preview
THE STUDY FOR
RURAL DEVELOPMENT PROGRAMFOR
KIBUNGO PROVINCETHE REPUBLIC OF RWANDA
FINAL REPORT
JUNE 2005
JAPAN INTERNATIONAL COOPERATION AGENCY(REGIONAL DEPARTMENT IV, AFRICA)
IC NET LIMITEDJAPAN TECHNO CO., LTD
NO.
4RJR
05-08
Table of Contents
Map, Pictures, Acronyms and Abbreviations Chapter 1: Dispatch of the Project Formulation Study Team ------------------------------ 1
1.1 Background of the dispatch of the project formulation study team ----------- 1 1.2 Assignments of the Team ----------------------------------------------------------- 2 1.3 Activities of the Study --------------------------------------------------------------- 4 1.4 List of Persons Visited -------------------------------------------------------------- 5
Chapter 2: Development Framework --------------------------------------------------------- 8
2.1 Rwanda and its Progress ------------------------------------------------------------ 8 2.2 PRSP ----------------------------------------------------------------------------------- 8 2.3 Vision 2020 --------------------------------------------------------------------------- 9 2.4 Decentralization and Common Development Fund (CDF) -------------------- 10 2.5 Imidugudu (grouped settlement or villagisation) -------------------------------- 19 2.6 Sector Strategies --------------------------------------------------------------------- 20 2.7 Donor Coordination ----------------------------------------------------------------- 28
Chapter 3: Development Strategy of Kibungo Province ----------------------------------- 30
3.1 Development Plan in Kibungo Province ----------------------------------------- 30 3.2 Characteristics of Each District/Town -------------------------------------------- 35 3.3 Constraints, Potential and Solutions of Each District --------------------------- 41 3.4 Assistance of Donors and NGOs in Kibungo Province ------------------------- 46
Chapter 4: Present Conditions and Issues in Kibungo Province --------------------------- 58
4.1 Rural Society ------------------------------------------------------------------------- 58 4.2 Rural Water Supply ------------------------------------------------------------------ 73 4.3 Rural Infrastructure ------------------------------------------------------------------ 76 4.4 Gender Issues and Social Affairs -------------------------------------------------- 78 4.5 Analysis of Development actors in Kibungo Province ------------------------- 89
Chapter 5: Rural Development Program for Kibungo Province -------------------------- 105
5.1 Development Issues at Kibungo -------------------------------------------------- 105 5.2 Rural Development Program for Kibungo Province --------------------------- 106 5.3 Important Points on Rural Development Program Implementation --------- 115

Chapter 6: Annex ------------------------------------------------------------------------------ 117 6.1 Rural Water Supply in Kibungo Province
(Proposal for Grant Aid Project) -------------------------------------- 117 6.2 Results of Geophysical Surveys and Test Drillings --------------------------- 148 6.3 Technical Note --------------------------------------------------------------------- 158 6.4 Other Rural Infrastructure Projects ---------------------------------------------- 166 6.5 Organizational Chart of Local Governments ----------------------------------- 173 6.6 SWOT Analysis -------------------------------------------------------------------- 182 6.7 Documents Collected -------------------------------------------------------------- 186
Tables
3-1 Administrative subdivisions of Kibungo Province ----------------------------------- 30 3-2 Some indicators of Kibungo Province and National average ----------------------- 31 3-3 List of definitive problems for Kibungo Province ------------------------------------ 32 3-4 Analysis of problems, potentialities and solutions in towns and districts --------- 42 3-5 Donors and international and local NGOs active in Kibungo Town -------------- 46 3-6 Donors and international and local NGOs active in Rwamagana Town ---------- 47 3-7 Donors and international and local NGOs active in Cyarubare District ---------- 47 3-8 Donors and international and local NGOs active in Kabarondo District --------- 48 3-9 Donors and international and local NGOs active in Kigarama District ----------- 49 3-10 Donors and international and local NGOs active in Mirenge District ----------- 50 3-11 Donors and international and local NGOs active in Muhazi District ------------- 51 3-12 Donors and international and local NGOs active in Nyarubuye District -------- 52 3-13 Donors and international and local NGOs active in Rukira District ------------- 53 3-14 Donors and international and local NGOs active in Rusumo District ----------- 53 3-15 Amount of assistance and area of intervention for each country ----------------- 56 4-1 General information of two sectors surveyed ----------------------------------------- 58 4-2 Advantages and disadvantages of imidugudu ----------------------------------------- 60 4-3 Advantages and disadvantages of decentralization ----------------------------------- 61 4-4 Conditions of water access of the workshop participants at Gashongora Sector - 63 4-5 Results of wealth ranking in Ruyonza Sector ----------------------------------------- 66 4-6 Typical household economy in Gashongora Sector ---------------------------------- 68 4-7 Construction of water supply facilities ------------------------------------------------- 75 4-8 Procurement of Equipment -------------------------------------------------------------- 75 4-9 Budget disbursed for projects ----------------------------------------------------------- 81 4-10 Number of demobilized solders by District/Town ---------------------------------- 82 4-11 MTEF of Culture and Social Affairs Unit of Kibungo Province ----------------- 83 4-12 Joining rate in health insurance in Kibungo Province ----------------------------- 84 4-13 Number of staff members at Rusumo District office ------------------------------- 86 4-14 Division of labor on productive and reproductive tasks --------------------------- 88 4-15 Number of staff and posts of Kibungo Provincial office -------------------------- 89 4-16 MTEF for Unit of Audit and Inspection of Local Finance,
Kibungo Provincial office ------------------------------------------------------------ 91 4-17 MTEF for Unit of Economic Development, Kibungo Provincial office -------- 92 4-18 MTEF for Unit of Governance and Territory Administration,
Kibungo Provincial office ------------------------------------------------------------ 94

4-19 MTEF for Unit of Public Relations and Internal Resource Management, Kibungo Provincial office -------------------------------------------------------------- 95
4-20 Training and seminar conducted in 2003, Kibungo Provincial office ------------- 96 4-21 Training and seminar conducted in January-May 2005,
Kibungo Provincial office ------------------------------------------------------------- 97 4-22 Number of staff, Kibungo Town -------------------------------------------------------- 99 4-23 District/Town budget and revenue in Kibungo Province in 2003 ------------------ 101 4-24 District/Town planned and actual expenditure in Kibungo Province in 2003 --- 102 5-1 Rural development program for Kibungo Province ---------------------------------- 108 6-1 Present and expected water supply rates under VISION 2020 ---------------------- 118 6-2 Priority programs of strategic plan ------------------------------------------------------ 121 6-3 Results in-situ analysis ------------------------------------------------------------------- 130 6-4 Conditions for selection of appropriate water supply system ----------------------- 131 6-5 Effects of resettlement ------------------------------------------------------------------- 132 6-6 Changes in adaptability of water supply systems ------------------------------------ 133 6-7 Requirements for operation and maintenance ---------------------------------------- 133 6-8 Proposed four-tier system of operation and maintenance --------------------------- 135 6-9 Type classification of water supply systems ------------------------------------------ 137 6-10 List of proposed water supply systems for each
Town/District of Kibungo Province ------------------------------------------------ 138 6-11 Water supply system proposed for each Town/District ---------------------------- 139 6-12 Present condition of proposed water supply systems ------------------------------ 142 6-13 Operation and maintenance cost ------------------------------------------------------ 143 6-14 Project benefits -------------------------------------------------------------------------- 146 6-15 Beneficiary population by water source and supply level ------------------------- 147 6-16 Results of test drillings ----------------------------------------------------------------- 158 6-17 Priority projects for rural infrastructures at District level -------------------------- 167

Figures
2-1 Organizational chart of District office (as of April 05) ------------------------------- 14 2-2 Organizational chart of Kibungo Provincial office (as of April 05) ---------------- 18 3-1 Radar chart of Kibungo Town ------------------------------------------------------------ 36 3-2 Radar chart of Rwamagana Town -------------------------------------------------------- 36 3-3 Radar chart of Cyarubare District -------------------------------------------------------- 37 3-4 Radar chart of Kabarondo District ------------------------------------------------------- 38 3-5 Radar chart of Kigarama District --------------------------------------------------------- 38 3-6 Radar chart of Mirenge District ----------------------------------------------------------- 39 3-7 Radar chart of Muhazi District ------------------------------------------------------------ 39 3-8 Radar chart of Nyarubuye District -------------------------------------------------------- 40 3-9 Radar chart of Rukira District ------------------------------------------------------------- 40 3-10 Radar chart of Rusumo District --------------------------------------------------------- 41 4-1 Typical seasonal calendar in Ruyonza Sector ------------------------------------------ 69 5-1 Steps for rural development program for Kibungo Province ------------------------ 107 6-1 Organization chart of MINITERE ------------------------------------------------------- 119 6-2 Water sources of Kibungo Province ----------------------------------------------------- 124 6-3 Conceptual drawing of spring sources in Kibungo Province ------------------------ 127 6-4 Conceptual diagram of proposed water supply systems ------------------------------ 140 6-5 Rural water supply proposed map for Kibungo Province ---------------------------- 141 6-6 Test drilling location map ---------------------------------------------------------------- 149 6-7 Geologic column of Kabare -------------------------------------------------------------- 152 6-8 Geologic Column of Gishali -------------------------------------------------------------- 153 6-9 Geologic Column of Murama A --------------------------------------------------------- 156 6-10 Geologic Column of Murama B ------------------------------------------------------- 157 6-11 Project Location of Nyarubuye District ---------------------------------------------- 168 6-12 Project Location of Kigarama District ------------------------------------------------ 170 6-13 Project Location of Mirenge District ------------------------------------------------- 171
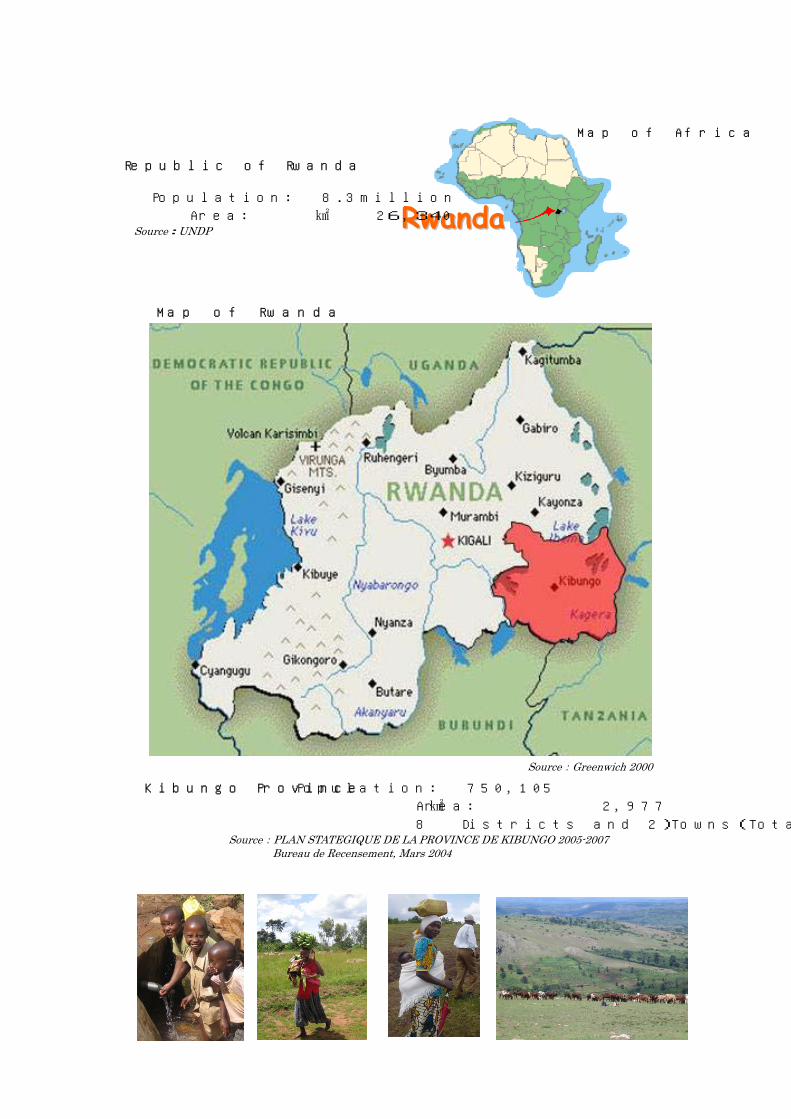
RRwwaannddaa
Map of Afr ica
Map of Rwanda
Kibungo Province Population: 750,105
Area: 2,977 ㎢
8 Districts and 2 Towns(Total 115 sector/732 Cell) Source:PLAN STATEGIQUE DE LA PROVINCE DE KIBUNGO 2005-2007
Bureau de Recensement, Mars 2004
Republic of Rwanda
Population: 8.3million
Area: 26,340 ㎢ Source:UNDP
Source:Greenwich 2000

Courtesy call to Japanese Embassy in Kenya Courtesy call and meeting at JICA Kenya office
Meeting at MINITERE Courtesy call to Minister of MINITERE
Meeting at Kibungo Provincial office Explanation on mission purposes by Mr. Hanatani,
mission leader

Rusumo District office Imidugudu
Deforestation in rural areas Bad condition of a rural road
Safe water from a protected spring source Houses at the top of hill, water source at the bottom
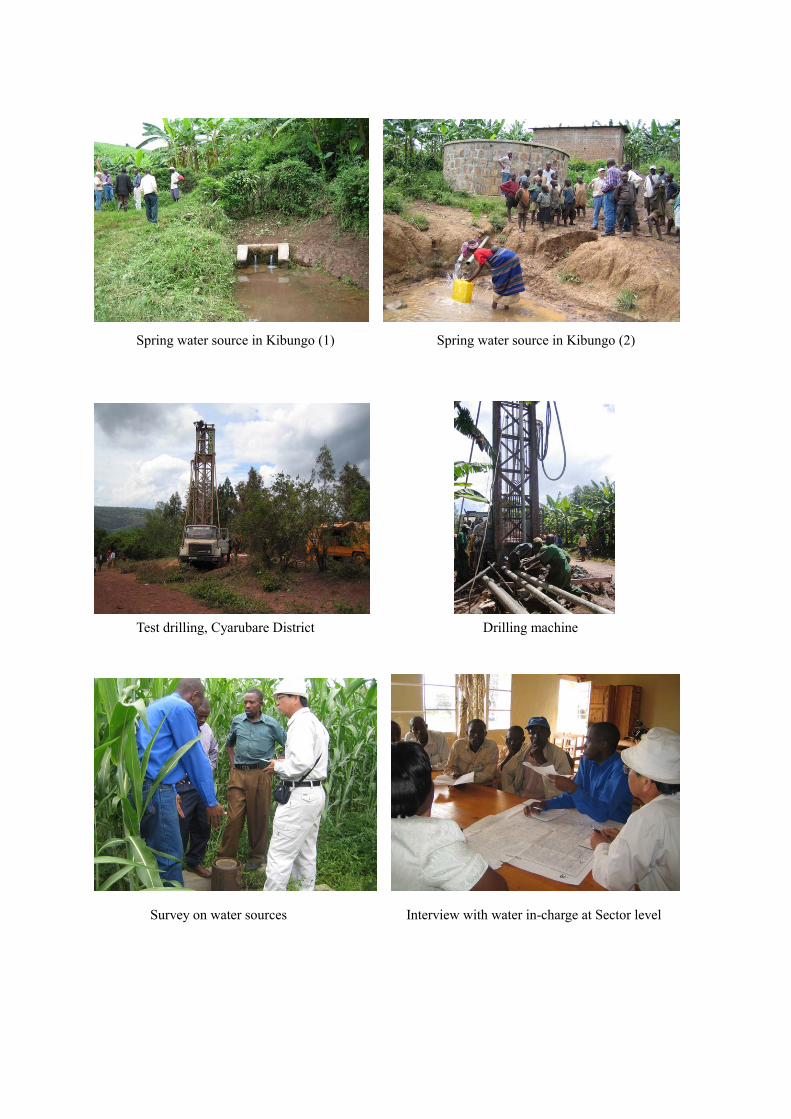
Spring water source in Kibungo (1) Spring water source in Kibungo (2)
Test drilling, Cyarubare District Drilling machine
Survey on water sources Interview with water in-charge at Sector level

Focus group interview with CDC members Participatory mapping
Gender analysis with a participatory tool Stakeholder analysis
Filed visit to hand-pump water point Visit to KIST

i
Acronyms and Abbreviations
(E):English (F):French ADB (E) African Development Bank (AfDB)
(F) Banque Africaine de Développement (BAD) ADC (F) Agent de Développement Communautaire AEPA (F) Alimentation en Eau Potable et Assainissement BADEA (F) Banque Arabe pour le Développement Economique en Afrique
(E) ABEDA:Arab Bank for Economic Development in Africa BRD (F) Banque Rwandaise de Développement CDC (E) Community Development Committee CDDP (E)) Community Decentralised Development Project CDF (E) Common Development Fund CDF (E) Comprehensive Development Framework Cellure (F) Cellure
(E) Cell CFP (E) Public Service Commission CEPEX (E) Central Public Investment and External Finance Bureau
(F) Bureau Central des Investissements Publics et des Financements Extérieurs COMIC (E) Cooperation - Operation - Maintenance – Information - Coordination CPA (E) Administrative Political Committee
(F) Comité de Politique Administratif CRDP (E) Community Reintegration and Development Project DFID (E) Department For International Development MDGs (E) Millennium Development Goals
(F) OMD: Objectifs du Millénaire pour le Développement FARG (F) Fonds d’Assistance aux Rescapés du Génocide / Genocide Survivors Fund Frw US$1.00 = 570 Frw(July 2005) GCG (E) Grassroots Community Grouping GoR (E) Government of Rwanda GRC (F) Gestion des Risques et Catastrophes / Risks and Disaster Management

ii
HIMS (E) Health Management Information System HSSP (E) Health Sector Strategic Plan IDA (E) International Development Association IFAD (E) International Fund for Agricultural Development
(F) FIDA: Fonds International de Développement Agricole Imidugudu (E) Grouped resettlement ISAE (E) Institut Supérieur d’Agriculture et d’Elevage KfW (Germen) Kreditanstalt fur Wiederaufbau
(E) Credit for Reconstruction KIST (E) Kigali Institute of Science Technology and Management
(F) Institut des Sciences Technologie et de Gestion de Kigali MIFOTRA (E) Ministry of Public Service, Skills Development and Labour MGEPROFE (E) Ministry of Gender and Women Promotion MIJESPOC (E) Ministry of Youth, Sport and Culture MINAFFET (E) Ministry of Foreign Affairs and Cooperation MINAGRI (E) Ministry of Agriculture and Animal Resources MINALOC (E) Ministry of Local Government, Community Development and Social Affairs MINECOFIN (E) Ministry of Finance and Economic Planning MINEDUC (E) Ministry of Education, Science, Technology and Research MINICOM (E) Ministry of Commerce, Industry, Investment Promotion, Tourism and
Cooperative MININFRA (E) Ministry of Infrastructure MINISANTE (E) Ministry of Health MINITERE (E) Ministry of Land, Environment, Forestry, Water and Mines NEPAD (E) New Partnership for African Development MTEF (E) Medium Term Expenditure Framework NPRP (E)National Poverty Reduction Programme NTB (E) National Tender Board
iii
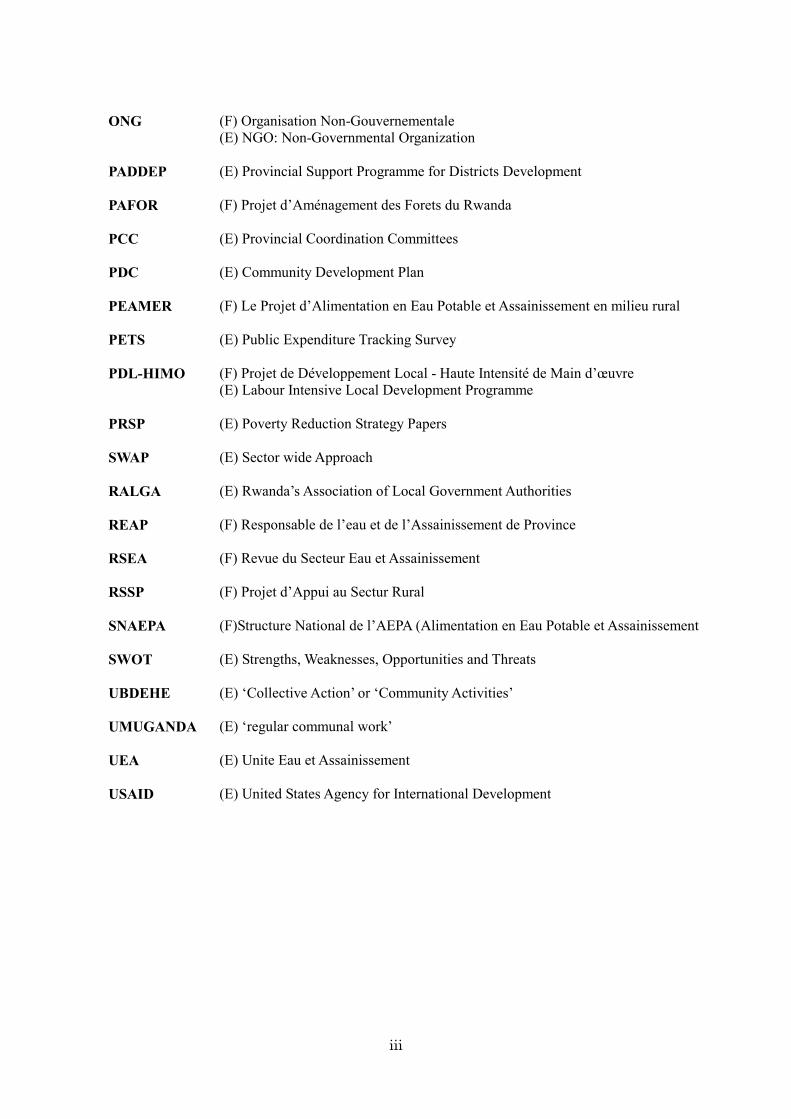
ONG (F) Organisation Non-Gouvernementale (E) NGO: Non-Governmental Organization
PADDEP (E) Provincial Support Programme for Districts Development PAFOR (F) Projet d’Aménagement des Forets du Rwanda PCC (E) Provincial Coordination Committees PDC (E) Community Development Plan PEAMER (F) Le Projet d’Alimentation en Eau Potable et Assainissement en milieu rural PETS (E) Public Expenditure Tracking Survey PDL-HIMO (F) Projet de Développement Local - Haute Intensité de Main d’œuvre
(E) Labour Intensive Local Development Programme PRSP (E) Poverty Reduction Strategy Papers SWAP (E) Sector wide Approach RALGA (E) Rwanda’s Association of Local Government Authorities REAP (F) Responsable de l’eau et de l’Assainissement de Province RSEA (F) Revue du Secteur Eau et Assainissement RSSP (F) Projet d’Appui au Sectur Rural SNAEPA (F)Structure National de l’AEPA (Alimentation en Eau Potable et Assainissement SWOT (E) Strengths, Weaknesses, Opportunities and Threats UBDEHE (E) ‘Collective Action’ or ‘Community Activities’ UMUGANDA (E) ‘regular communal work’ UEA (E) Unite Eau et Assainissement USAID (E) United States Agency for International Development

Chapter 1
Dispatch of the Project Formulation Study Team

1
1. Dispatch of the Project Formulation Study Team
1.1 Background of the Dispatch of the Project Formulation Study Team In the TICAD framework, the government of Japan has been providing its support to Africa in the view that restored peace is the prerequisite for further socio-economic development. After a decade of strife, the Great Lakes region of Africa, i.e. Rwanda, Burundi and the Democratic Republic of Congo, is trying to restore peace. The international community finds it necessary to strongly support this region by political, diplomatic and economic means. As steady growth of Rwanda is vital for the region’s peace and stability, the government of Japan has committed itself to supporting Rwanda’s reconstruction and development with the ‘human security’ concept. At the TICAD III meeting in Tokyo, Rwandese Prime Minister Bernard Makuza expressed his country’s need for assistance to Ms. Sadako Ogata, President of JICA. This was followed by a series of discussions and the start of full-scale bilateral cooperation. At the Consultative Group meeting in Kigali in December 2004, the government of Japan stated, taking Rwanda’s PRSP into account, that both rural development and human resources development (education/vocational training) are critical. Negotiations over a year on the bilateral cooperation strategy concluded with the selection of priority areas in human resource development and rural development/agricultural transformation. The target area for the Project Formulation Study, Kibungo Province (2,997 square km and population of 750,000 in 2003), is located on the Tanzanian border. Approximately 70,000 refugees from Tanzania have been returning to this Province since the end of the war. To receive those returnees/refugees, Kibungo Province is relatively suitable as it has more land available than other Provinces. However, because of its hilly topographic features, rural water supply and rural infrastructure development are critical issues in the context of decentralization and grouped resettlement. Therefore, both the Rwandese and Japanese sides have been examining formulation and implementation of a Rural Development Program that includes improvement of access to safe water. Since the Rwandese government had officially requested Japanese Grant Aid Assistance, the Preliminary Study for “Groundwater Development in Kibungo Province” was conducted from June to July 2004 and both the Rwandese and Japanese sides signed the Minutes of Discussion (M/D). To re-define the scope of the Grant Aid Assistance based on the findings of the Preliminaly Study, this Project Formulation Study Team for the Kibungo Rural Development Program made a follow-up. The team also intended to develop project(s) in the framework of rural development in Kibungo Province which may be implemented with the Grand Aid Assitance. In formulating the Kibungo Rural Development Program, the team took into consideration the

2
‘human security’ concept as well as the above-stated priority fields of bilateral cooperation. The team also made scoping for the Basic Design Survey (B/D) of the Grant Aid Assistance for smooth implementation of B/D. At the beginning of the Study, a JICA mission headed by Mr. Hanatani, Director of East Africa Team, JICA HQ, visited Rwanda. Through a series of discussions with Rwandese officials, the JICA mission looked into Rwandese policies and coordinated a scope of this Study.
1.2 Assignments of the Team The following table indicates the major duties of each team member and their length of stay in Rwanda.
1.2.1 JICA Mission No. Name
(Length of stay) Duties Organization
1 Mr. HANATANI, Atsushi (06 April – 15 April)
Head of Mission
Team Director, Regional Dept. IV (Africa), Japan International Cooperation Agency (JICA)
2 Mr. KIYOKA, Masanobu (06 April – 15 April)
Rural Development
Senior Advisor, Japan International Cooperation Agency (JICA)
3 Mr. FUKUDA, Yoshio (06 April – 15April)
Rural Water Supply Team Director, Grant Aid Management Dept., Japan International Cooperation Agency (JICA)

3
1.2.2 JICA Consultant Team No. Name
(Length of stay) Duties Organization
1 Mr. SUZUKI, Haruo (04 April – 24 April) (14 May – 23 May)
Leader of the Consultant Team /Rural Development
IC Net Limited
2 Mr. FUKAZAWA, Tomoo (09 April – 23 May)
Sub Leader of the Consultant Team/Rural Infrastructure
IC Net Limited
3 Mr. OHNO, Yasuo (04 April – 25 May)
Social Development /Participatory Development
IC Net Limited
4 Ms. NOJI, Keiko (09 April – 11 May)
Rural Development IC Net Limited
5 Mr. FUJII, Shoji (21 April – 25 May)
Water Supply Planning /Water Supply Facility
JAPAN TECHNO Co., LTD
6 Mr. YAMASHITA, Chifumi (09 April – 13 May)
Hydrogeology/Geo- physical Survey
JAPAN TECHNO Co., LTD
7 Ms. FUJITA, Yu (04 April – 23 May)
Interpreter
IC Net Limited

4
1.3 Activities of the Study The weekly activities of the study team during the Study period in Rwanda are as follows:
No. Week Activity Executor 1 06 April –
08 April Meeting with Rwanda Government officials in Kigali
Mr. Hanatani, Mr. Fukuda, Mr. Kiyoka, Mr. Suzuki, Mr. Ohno & Ms. Fujita
2 11 April – 15 April
Meeting with Rwanda Government officials, preparation for site surveys in Kigali and Kibungo
Mr. Hanatani, Mr. Fukuda, Mr. Kiyoka, Mr. Suzuki, Mr. Ohno, Ms. Fujita, Mr. Fukazawa, Mr. Yamashita & Ms. Noji
Data collection and meeting with stakeholders in Kigali
Mr. Suzuki & Ms. Fujita
Profiling survey for 8 Districts and 2 Towns in Kibungo Province
Mr. Fukazawa, Mr. Ohno & Ms. Noji
3 18 April – 22 April
Survey on state of water resources in Kibungo Province
Mr. Yamashita
Survey on state of water resources including drilling works in Kibungo Province
Mr. Yamashita & Mr. Fujii
Selection of the priority projects & site surveys at each District in Kibungo
Mr. Fukazawa
Preparation for RRA & PRA survey in Kibungo Province
Ms. Ohno
4 25 April – 29 April
Actor analysis in Kibungo Province Ms. Noji Survey on the existing water supply facilities at each District/Town in Kibungo Province
Mr. Fujii
Survey on state of water resources including drilling works in Kibungo Province
Mr. Yamashita
Selection of the priority projects & site survey at each District/Town in Kibungo Province
Mr. Fukazawa
RRA & PRA survey at Kabarondo District Ms. Ohno Visiting other donors and NGOs in Kigali & data collection in Kibungo Province
Ms. Noji
5 02 May– 06 May
Data collection and visiting related organizations in Kigali
Ms. Fujita
Survey of the existing water supply facilities at each District/Town in Kibungo Province
Mr. Fujii
Selection of the priority projects & site survey at each District/Town in Kibungo Province
Mr. Fukazawa
RRA & PRA survey at Rusumo District Ms. Ohno
6 09 May – 13 May
Results analysis, preparation of the progress report, and meeting with representatives from District/Town offices, Provincial office, and MINITERE
Mr. Fujii, Mr. Fukazawa, Mr. Ohno & Ms. Fujita
7 16 May – 20 May
Finalization of the progress report and presentation to relevant ministries in Kigali
Mr. Suzuki, Mr. Ohno, Mr. Fukazawa, Mr. Fujii & Ms. Fujita
5
1.4 List of Persons Visited 1.4.1 Kigali Mr. Drocella Mugorewera, Minister of MINITERE Mr. Bikoro Munyanganizi, Minister of MINITERE Mr. Bruno Mwanafunzi, Director, Department of Water and Sanitation, MINITERE Mr. Eugene Barikana, Secretary General of MINALOC Mr. Yaramba Albert, Head of Rural Water Supply, MINITERE Mr. Odillo Mukiza, Water Resource Engineer, MINITERE Mr. Eugene Barikana, Secretary General of MINALOC Mr. Darius Kankiriho, Director of General Services, MINALOC Mr. Gatsinzi Jasting, National Coordinator of PDL-HIMO, MINALOC Mr. Claver Gatete, Secretary General of MINECOFIN Mr. Augustin Mukama, Director of International Cooperation of MINAFFET Mr. Ernest Ruzindaza- Director of Planning MINAGRI Dr. Emilien NKUSI, Head of Health Management Information System, MINISANTE Dr. Florent SEMYAMA, Director of Unite Epidemiology and Public Hygiene, MINISANTE Mr. Joseph Katabarwa, Community and Environmental Health Officer, Desk of Public Hygiene and Sanitation, MINISANTE Mrs. Bonhomme Elke, Person in charge of Programme of African Development Bank, CEPEX Mr. Alessandro Villa, Counsellor, Head of Section, Rural Economy, Food Security, Decentralization and Environment, European Commission Mr. Walter Klotz, General Director, ELECTROGAZ Mr. Holger Laenge, Director of Water Department, ELECTROGAZ Mr. Kanyesheja Jean Bosco, Chief of Section of Study and Planning/Water Department, ELECTROGAZ Dr. Nurdin K.M. Mushule, Director of Center for Innovations and Technology Transfer, KIST
1.4.2 Kibungo Mr. Innocent Ntanaba, Prefect of Kibungo Province Mr. Bosenibamwe Amie, General Secretary of Kibungo Province Mr. Rugina B. Jean de Dieu, in charge of infrastructure, Kibungo Province Mr. Nthegrembo Valens, Mayor of Kibungo Town Mr. Kamanzi jean, in charge of water supply, Kibungo Town Mr. Ndasane Delphin, Executive Secretary of Rwamagana Town Mr. Umukiza j. D’amour, In charge of water supply, Rwamagana Town
6
Ms. Mukamasabo Donata, Vice Mayor of Cyarubare District Mr. Kalisa Ismael, in charge of water supply, Charubare District Mr. Bizimawa F-Xarer, Vice Mayor of Kabarondo District Mr. Njbarakinga FT, Vice Mayor of Kigarama District Mr. Ndayisenga Protais, President of the Water Management Committee, Kigarama District Mr. Nzirumbanje Alphonse, Planning officer, Kigarama District Mr. Mbowyumukura Emmaniel, Vice Mayor of Mirenge District Ms. Cyoburunga Jesica, Vice Mayor of Muhazi District Mr. Nkazamvrego Faushin, Vice Mayor of Nyarubuye District Mr. Gasore J. Olivier, Planning officer, Nyarubuye District Mr. Rupiga K. Francis, Vice Mayor of Rukira District Mr. Ntabyera Emmanuel, Mayor of Rusumo District Mr. Gatali Ladishan, Executive Secretary of Rusumo District Mr. Sebambe Elisee, in charge of water supply, Rusumo District Mr. Joseph, in charge of water factory, ELECTROGAZ Mr. Alimas Emmily, in charge of water plumbing, ELECTROGAZ Mr. Norbert Munyarusisiro, Cordinator of the project, GTZ Mr. Emmanuel d’Harcourt, Senior advisor of hygiene, International Rescue Committee
1.4.3 Japanese personnel (1) Embassy of Japan in Kenya Mr. Tomoyuki Yamamoto, Head of Great Lakes Division Mr. Toshimasa MASUYAMA, Second Secretary (2) JICA Kenya Office Mr. Yoshiaki Kano, Resident Representative Mr. Jiro Inamura, Deputy Resident Representative Ms. Riko Saito, Assistant Resident Representative Ms. Misa Kenmiya, Assistant Resident Representative Ms. Akemi Yamazaki, Health Administrator (3) JICA Regional Support Office for Eastern and Southern Africa Mr. Yoshihide Teranishi, Representative Mr. Ryoichi Nambu, Assistant Representative Mr. Ippei Simizu, Project Formulation Advisor Mr. Shingo Furuichi, Project Formulation Advisor

7
(4) MINAFFET Mr. Masayoshi Ono, ODA Advisor, Expert of JICA (5) JICA Expert in Kenya Mr. Yuichi Sato

Chapter 2
Development Framework
8
2. Development Framework
2.1 Rwanda and its Progress Located in the Great Lake region of Africa, Rwanda is a small and highly populated country with “one thousand hills” known for its coffee and tea production. The civil war and genocide have seriously disrupted the country and destroyed a good portion of the economic base. The government’s website describes the recent history as follows: “The government of National Unity immediately set out to create fiscal stability and economic growth. Inflation was brought down from 64% in 1994 to under 5% from 1998 to 2000. In 1994, annual fiscal revenues were zero while today they stand at nearly 70 billion Rwanda francs. The economy has grown steadily at an average of 11%, while gross domestic incomes have grown at an average of 14.3% per annum since 1995. The government is also implementing structural adjustment programs which aim to eliminate public sector inefficiency and waste, and strengthen the economy. Most sectors of the economy have surpassed prewar productivity levels. The main towns around the country have been experiencing an unprecedented construction boom, evidence of confidence in the economy by investors.” In December 2000, Rwanda reached its decision point of the enhanced HIPC Initiative. The country’s growth rate has slowed down and fiscal management under PRSP continues. Concerning the relations with Japan, Mr. Masaya Hattori, president of the Rwanda National Bank from 1965 to 1971, linked financial support to ONATRACOM (Yen credit) and related bilateral cooperation. Members of Japan Overseas Cooperation Volunteers (JOCV) were first sent to Rwanda in 1987 but withdrawn in 1994. From September to December 1994, the Japanese government provided support to Rwandese refugees under the International Peace Cooperation Law by sending Self-Defense Force units and other personnel to Goma, Zaire, in the areas of medical care, sanitation, water supply and air transport.
2.2 PRSP Rwanda’s Poverty Reduction Strategy Paper was produced in November 2001 following extensive consultations with all the stakeholders and based on participatory assessments and quantitative surveys on household living conditions. The Joint Staffs of the World Bank and the International Monetary Fund endorsed the strategy in July 2002 as a sound basis for concessional assistance. The PRSP recognizes that economic growth is a prerequisite for long-term poverty reduction in Rwanda. The challenge lies in achieving and stabilizing real economic growth between 7 to 8% over
9
the next 15 to 20 years. Rwanda’s medium-term macroeconomic objectives are therefore to (i) achieve annual real GDP growth of at least 6%; (ii) keep annual average inflation at 3 %; and (iii) maintain gross international reserves equivalent to at least six months of imports. Rwanda’s PRSP targeted reduction of poverty in half by 2015 and identified the following six priority areas for public actions on poverty reduction: (1) rural development and agricultural transformation; (2) human development; (3) economic infrastructure; (4) good governance; (5) private sector development; and (6) institutional capacity building. The latest PRSP Annual Progress Report and Joint Staffs assessment was prepared in May 2004. This document states that “Joint Staffs consider that the country’s efforts toward implementation of the strategy provide sufficient evidence for its continuing commitment to poverty reduction, and that the strategy continues to provide a credible framework for concessional assistance.”
(Source: Poverty Reduction Strategy Paper Progress Report (June 2003):Ministry of Finance and Economic Planning, PRSP Joint Staff Assessment (May 18, 2004): IMF&IDA)
2.3 Vision 2020 “The actions in the PRSP are set within the overall and longer-term vision of Rwanda’s development set out in Vision 2020. This document identifies the key objectives that need to be attained for Rwanda to become a middle-income country by 2020. “Key objectives are: (1) Good political and economic governance: inclusive of security, respect for human rights,
increased popular participation in Government and establishment of sound economic management and macroeconomic stability.
(2) Rural economic transformation: building on the traditional strength of the rural Rwandese economy and introduction of new technologies for raising agricultural incomes and generate incomes outside agriculture.
(3) Development of services and manufacturing: re-establishment of Rwanda as a regional trade and service center by strengthening the IT use and by encouraging tourism.
(4) Human resources development: through increase in educational attainment, better health care to improve health indicators and confront the major killer diseases, HIV/AIDS and malaria.
(5) Development and promotion of the private sector: by lowering the risks of doing business in Rwanda, by formalization of existing informal enterprises and review of whole legal framework for business.
(6) Regional and international economic integration: commitment to joining COMESA, and WTO, etc.
(7) Poverty reduction: being the effect of achievement of other objectives, this should include
10
reducing inequalities arising from gender and age. The study team will mention the Vision 2020 while describing present status of the country as well as major sectors of development. (Source: Rwanda’s development strategy, Rwanda PRSP (June 2002) )
2.4 Decentralization and Common Development Fund (CDF)
2.4.1 Decentralization The PRSP progress report says that decentralization is a priority in the PRSP. It is part of Rwanda’s drive in bringing decision-making power to the level where results are most felt. The district is the government level responsible for elaborating decentralized development plans. The first phase of the democratic decentralization effort, institutionalizing decentralized governance by articulating the policies and legal frameworks, has been largely achieved. Fiscal decentralization is ongoing. From 2002 onwards, provinces were given independent budgets, and district will receive 1.5% of the previous year’s domestic revenue for recurrent expenditure. Apart from the increasing flow of funds from the center to decentralized government entities, the Common Development Fund (CDF) also plays a redistributing role in allocating funds according to the relative population, poverty and existing programs the district has. CDF program identification and approval procedure take into account PRSP priorities. MINALOC’s document on decentralization illustrates this program in the following manner. The overall mandate of the decentralization is to ensure political, economic, social, managerial/administrative and technical empowerment of local populations to fight poverty by participating in planning and management of their development process. The mandate is specified in the following strategic objectives as well as stipulated in the policy and law. (1) To enable and reactivate local people to participate in initiating, making, implementing, and
monitoring decisions and plans that concern them taking into consideration of their local needs, priorities, capacities and resources by transferring power, authority and resources from central to local government and lower levels.
(2) To strengthen accountability and transparency in Rwanda by making local leaders directly accountable to the communities they serve and by establishing a clear linkage between the taxes people pay and the services that are financed by these taxes.
(3) To enhance the sensitivity and responsiveness of Public Administration to the local environment by placing the planning, financing, management, and control of service provision at the point
11
where services are provided, and by enabling local leadership develop organization structures and capacities that take into consideration of the local environment and needs.
(4) To develop sustainable economic planning and management capacity at local levels that will serve as the driving motor for planning, mobilization, and implementation of social, political, and economic development.
(5) To enhance effectiveness and efficiency in the planning, monitoring, and delivery of services by reducing the burden from central government officials who are distanced from the point where needs are felt and services are delivered.
It also outlines how the decentralization will be implemented. (1) Deconcentration: Services and functions to be performed by the central government will be
executed by central government public servants located in local governments. (2) Delegation: Services and functions to be performed by central government will be delegated to
local governments and the requisite resources transferred to them for effective provision of these delegated services.
(3) Devolution: The powers, authority, functions, responsibilities, services and resources currently centralized at central government level will be transferred to local governments.
Five Strategic Objectives of decentralization are: (1) To mobilize the entire establishment of the government and state of Rwanda to create enabling
environment that allows the population of Rwanda to own, support, sustain and participate in the decentralization process.
(2) To persistently exhibit exemplary effectiveness, efficiency and accountability in the planning, implementation, monitoring, and evaluation of all programs and projects of decentralization in the country.
(3) To ensure local participation and instill a sense of anti-dependency and self-reliance amongst the Rwandese people by mobilizing and effectively utilizing local human, material, and financial resources to plan, implement, control and sustain local governance for participative delivery of social services for all.
(4) To develop local capacities in infrastructure, management and administration systems, structures, knowledge, skills, attitudes, institutions, networks, relationships, technologies, processes, procedures practices, and leadership behavior that will sustain local good governance for effective, efficient, accountable and equitable delivery of social services and development for all.
(5) To strengthen participative and all engaging social communication as a tool for reconciling and harmonizing local populations into peaceful productive communities that are aware of and committed to upholding the rule of law, good governance, respect for human rights and property,
12
and defense of their rights and fulfill their obligations . Although Rwanda has long been a highly centralized State, there are aspects of the current situation that can be harnessed to support the beginning of the decentralization process. The following are some strengths that will be built upon to start the decentralization and local governance process:
• Government will and commitment to people empowerment. • An administrative and political structure. • Human Resources: existing personnel in Ministries, Intara, and Akarere can be assessed and
reoriented through appropriate training and other capacity development mechanisms.
• Tools and facilities: existing buildings, furniture vehicles, communication systems and equipments.
• Funding: the decentralization policy will be to continue with the current government policy of de-concentrating appropriate and relevant ministerial budgets to the Intara.
• Networks: among different actors (NGOs, donors and MINALOC). On the other hand, here are capacity shortages and gaps.
• Inappropriate legal provisions. • Human Resources: are used to managing a highly centralized system. • Facilities: more facilities are needed to attract better qualified and competent personnel. • Organization structures: designed to facilitate centralization. • Systems, procedures, processes: suitable for centralized governance. • Data, records, information systems as well as information technology (both hard and
software): local government structures which have not been the information technology.
• Funds: Rwanda has a population which is not adequately sensitized for tax payment. • Network, e.g., local government associations.
The following are advantages and opportunities.
• The misfortune of genocide and the disastrous effects motivate local populations to want to own their destiny and not to entrust it wholly to distant government officials.
• International good will and NGOs’ support. • Size of the country: Rwanda is a small country where it is easy to move from one corner to
another.
• The common local language of Kinyarwanda makes informational communication and mobilization for decentralization easy.
13
• Rich experience of decentralization in the Great Lakes region: Countries such as Uganda have designed and successfully implemented similar programs.
• Management, administration, and technical capacity development institutions: University of Rwanda (Butare), Rwanda Institute of Administration and Management, and Kigali Institute of Science and Technology (KIST) will be mobilized to support/facilitate capacity building.
The same MINALOC document lists the functions of district (Akarere) being transferred from the central government as follows.
• Agriculture, veterinary and forestry plus all extension services • Local trade • Small scale industries • Education (nursery, primary, secondary, technical and commercial), teachers training • Health services (hospitals, health centers, nutrition centers) • Water production and maintenance • Land titles, registration and resettlement • Tourism and environmental protection • Cooperatives and associations • Vulnerable groups (orphans, widows, handicapped, etc.) • Local government roads • Fire brigade • Genocide sites (cemeteries) • Gender, youth, culture and sports at District level • Promotion and protection of children
The district bears most of the characteristics of a democratic, development oriented, and accountable government. The management structure is as follows:
• District Council: policy making and legislative body that functions like a parliament. • District Executive Committee (DEC): supported by Community Development Committee
(CDC) , the functions of DEC are to 1) prepare District development plans and budget taking; 2) monitor the implementation of District budget and provision of services; 3) prepare report to be submitted to the District Council.
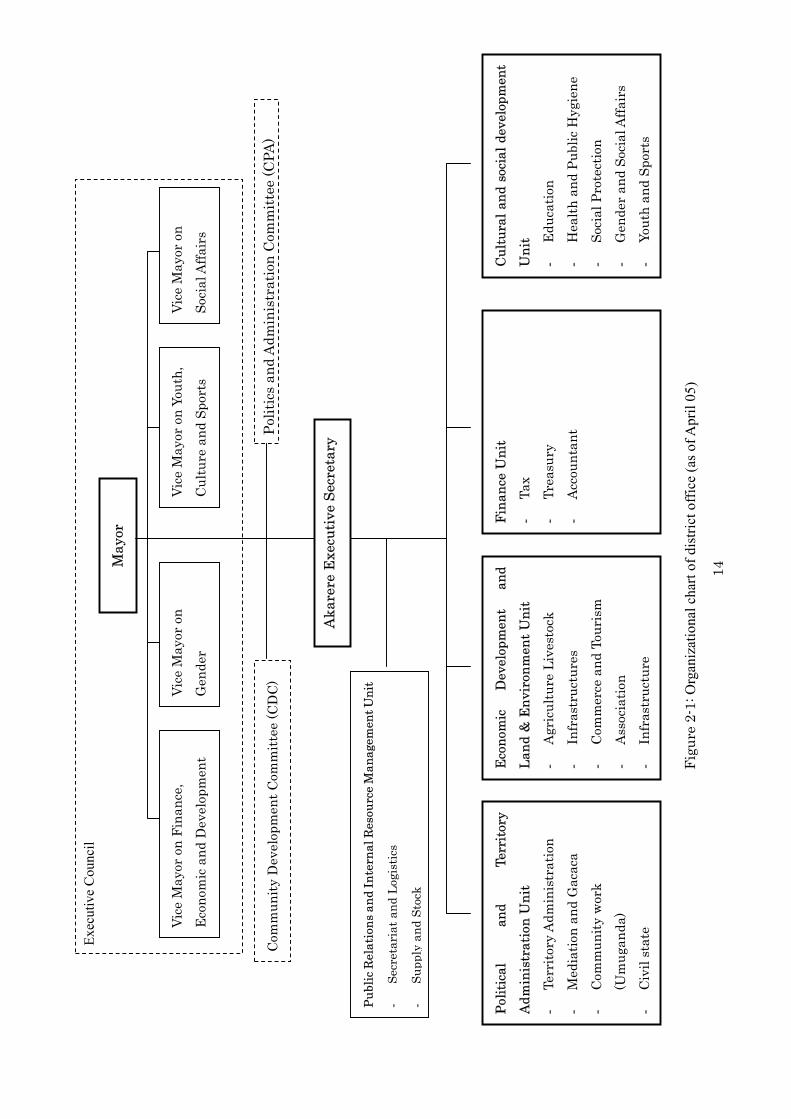
• Executive Secretary supports DC and DEC acts as overall supervisor of the public servants. The Province (Intara) is also described as follows.
14
Exec
utiv
e C
ounc
il
Publ
ic R
elat
ions
and
Inte
rnal
Res
ourc
e Man
agem
ent U
nit
- Se
cret
aria
t and
Log
istic
s
- Su
pply
and
Sto
ck
Akar
ere
Exec
utiv
e Se
cret
ary
Com
mun
ity D
evel
opm
ent C
omm
ittee
(CD
C)
Polit
ics a
nd A
dmin
istr
atio
n Co
mm
ittee
(CPA
)
May
or
Vice
May
or o
n Fi
nanc
e,
Econ
omic
and
Dev
elop
men
t Vi
ce M
ayor
on
Yout
h,
Cultu
re a
nd S
port
s Vi
ce M
ayor
on
Gen
der
Vi
ce M
ayor
on
Soci
al A
ffair
s
Polit
ical
an
d Te
rrito
ryAd
min
istr
atio
n U
nit
-
Terr
itory
Adm
inis
trat
ion
-
Med
iatio
n an
d G
acac
a -
Com
mun
ity w
ork
(Um
ugan
da)
- Ci
vil s
tate
Econ
omic
D
evel
opm
ent
and
Land
& E
nvir
onm
ent U
nit
-
Agri
cultu
re L
ives
tock
-
Infr
astr
uctu
res
- Co
mm
erce
and
Tou
rism
-
Asso
ciat
ion
- In
fras
truc
ture
Fina
nce
Uni
t
- Ta
x -
Trea
sury
-
Acco
unta
nt
Cultu
ral a
nd s
ocia
l dev
elop
men
tU
nit
- Ed
ucat
ion
- H
ealth
and
Pub
lic H
ygie
ne
- So
cial
Pro
tect
ion
-
Gen
der a
nd S
ocia
l Affa
irs
- Yo
uth
and
Spor
ts
Figu
re 2
-1:O
rgan
izat
iona
l cha
rtof
dis
trict
offi
ce (a
s of A
pril
05)

15
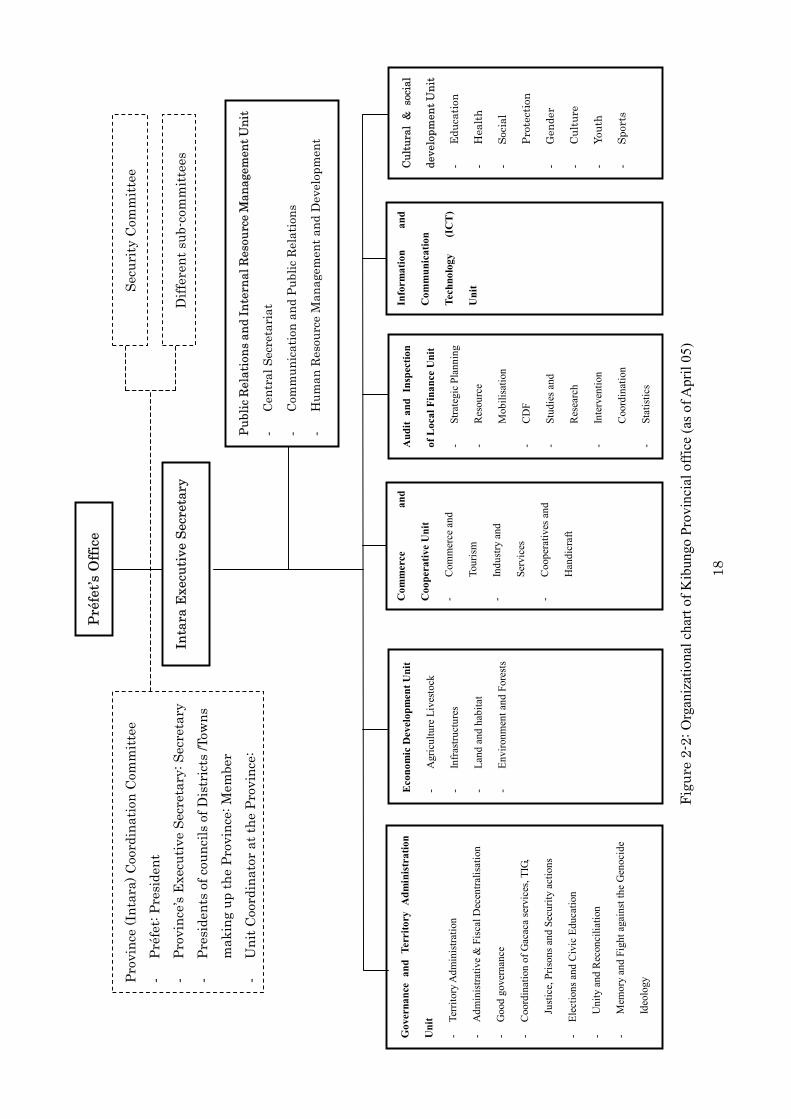
This deconcentrated structure of local administration represented by Prefect serves as coordinating organ and the channel through which the Central government will receive complaints from the population. Its management structure is as follows:
• Intara Coordination Committee (ICC): 1) examines and coordinates all matters concerning the administration and the development of the province, 2) gives views on development plans and budgets for approval by the competent authorities, and 3) ensures the follow-up of the execution of every project and every decision emanating from the Central government or from the province for the improvement of the project management and their outputs.
• Intara Executive Secretary: 1) serves as secretary to the ICC above, 2) coordinates the preparation of plans and budgets, 3) supervises and assesses the performance of civil servants, 4) ensures capacity development of the staff, and 5) ensures the provision of de-concentrated services.
The phased approach in implementation will change the roles of each entity as follows. (1) In the first phase, deconcentration at the province level and devolution at the district level. (2) In the second phase, some functions and responsibilities at the province level can be
decentralized to the district level. (3) In the third phase, the tier at province level would be removed so that we have fewer layers of
administration between the central government and local government.
2.4.2 Common Development Fund (CDF) In 2002, the government established a development fund or “Common Development Fund (CDF)” for districts, towns and the city of Kigali. This fund is conceived to finance these local entities from an allocated 10 % of the national revenues and funds made available by donors. The CDF’s missions are (1) to finance development projects securing equal allocation to District (which includes towns and Kigali city), (2) to monitor the use of fund, and (3) to play the intermediary role between the District and the donor who intends to support a particular development project in the district (District has a freedom to directly discuss with the donor/NGO for financing). According to the CDF annual report, the year 2004 exercise shows that 213 projects were funded and the total CDF amount reached over 53 billion (5,317,153,997) Rwanda Francs. Among those financed projects, 56 economic infrastructure projects including modern market construction (49 cases), 40 road/bridge construction, 31 office building for sectors, 30 communication systems and 29 electrification projects are top 5, followed by 23 water-supply systems. CDF gives priority to

16
encourage sectors by supporting their office construction. After the agreement on project financing is signed between CDF and the district, the district starts the implementation with open bidding process followed by contract with the successful bidder. Upon receipt of these documents, CDF disburses the first tranche of 20 % of the project cost and another 40 % and the final 40 % are paid in respectively only when the due progress reports are submitted. The above annual report lists the following 5 constraints that the CDF faces.
• District submits the project (application for finance) all year round despite the time limit for phasing is indicated. Thus the duration of execution/disbursement is extended beyond the budgetary year, making the operation difficult.
• A few contractors don’t observe the conditions of the contract and neglect the regulations to implement the project.
• District often needs assistance from a provincial office nearby. • Project implementation is slow due to low fiscal absorption capacity at the allocated
district.
• Price fluctuation in the course of execution considerably distorts project costing. In order to overcome these problems, CDF proposes the following solutions:
• Project preparation cost and fee of supervisory work may be funded by CDF. • Contractors are to be trained and sensitized to pay due attention to contracts and relevant
laws.
• The province’s capacity to follow up the CDF project is to be reinforced. • Such references as guides to model project, model planning, and market price lists are to be
provided. During its stay in Rwanda, the study team obtained a report of “Institutional and Organizational Review, CDF, Rwanda (August 2004)”, a product of the cooperation of the Government of the Netherlands, which discusses CDF’s present status and issues as follows: “This equal distribution of government grants sustains inequity, as some Districts/towns receive additional support from the donor community while others don’t, resulting in some Districts/towns receiving three times as much as others. CDF agreed on the following strategy for the period 2004-2007.
(1) To gradually introduce budget support starting in 2005. (2) To apply a formula for a more equitable distribution of development grants, based on the

17
needs and capacities of Districts/towns, and taking into account support provided by others directly to those Districts/towns.
(3) To apply a certain level of conditionality, allowing for an optimal match between local needs and discretion and national priorities. Introduce budget support to districts/towns that meet basic requirements, and target capacity building to districts/towns not yet meeting these requirements.
18
Gov
erna
nce
and
Terr
itory
Adm
inis
trat
ion
Uni
t
- Te
rrito
ry A
dmin
istra
tion
- A
dmin
istra
tive
& F
isca
l Dec
entra
lisat
ion
- G
ood
gove
rnan
ce
- C
oord
inat
ion
of G
acac
a se
rvic
es, T
IG,
Just
ice,
Pris
ons a
nd S
ecur
ity a
ctio
ns
- El
ectio
ns a
nd C
ivic
Edu
catio
n
- U
nity
and
Rec
onci
liatio
n
- M
emor
y an
d Fi
ght a
gain
st th
e G
enoc
ide
Ideo
logy
Eco
nom
ic D
evel
opm
ent U
nit
- A
gric
ultu
re L
ives
tock
- In
fras
truct
ures
- La
nd a
nd h
abita
t
- En
viro
nmen
t and
For
ests
Aud
it an
d In
spec
tion
of L
ocal
Fin
ance
Uni
t
- St
rate
gic
Plan
ning
- R
esou
rce
Mob
ilisa
tion
- C
DF
- St
udie
s and
Res
earc
h
- In
terv
entio
n
Coo
rdin
atio
n
- St
atis
tics
Cultu
ral
& s
ocia
l
deve
lopm
ent U
nit
- Ed
ucat
ion
- H
ealth
- So
cial
Prot
ectio
n
- G
ende
r
- Cu
lture
- Yo
uth
- Sp
orts
Préf
et’s
Offi
ce
Inta
ra E
xecu
tive
Secr
etar
y
Publ
ic R
elat
ions
and
Inte
rnal
Res
ourc
e Man
agem
ent U
nit
- Ce
ntra
l Sec
reta
riat
- Co
mm
unic
atio
n an
d Pu
blic
Rel
atio
ns
- H
uman
Res
ourc
e M
anag
emen
t and
Dev
elop
men
t
Secu
rity
Com
mitt
ee
Diff
eren
t sub
-com
mitt
ees
Prov
ince
(Int
ara)
Coo
rdin
atio
n Co
mm
ittee
-
Préf
et: P
resi
dent
-
Prov
ince
’s Ex
ecut
ive
Secr
etar
y: S
ecre
tary
-
Pres
iden
ts o
f cou
ncils
of D
istr
icts
/Tow
ns
mak
ing
up th
e Pr
ovin
ce: M
embe
r -
Uni
t Coo
rdin
ator
at t
he P
rovi
nce:
Com
mer
ce
and
Coo
pera
tive
Uni
t
- C
omm
erce
and
Tour
ism
- In
dust
ry a
nd
Serv
ices
- C
oope
rativ
es a
nd
Han
dicr
aft
Info
rmat
ion
and
Com
mun
icat
ion
Tech
nolo
gy
(IC
T)
Uni
t
Figu
re 2
-2: O
rgan
izat
iona
l cha
rt of
Kib
ungo
Pro
vinc
ial o
ffice
(as o
f Apr
il 05
)
19
2.5 Imidugudu (grouped settlement or villagisation) UNDP’s press release briefly explains this program in as follows: “The Imidugudu program is an initiative of the Government of National Unity to resettle the rural population in villages where vital utilities like water and electricity, and security of person and property, can be provided to them with more ease than in scattered, often isolated rural settlements. The program was also initiated as a measure for more effective land use in view of the fact that Rwanda has the highest population density in Africa and its population is set to double by the year 2020.” This program is supported by Ministerial directive (MINITRAPE) which declared, in 1997, that “Building on a plot other than a Imidugudu is hereby prohibited.” (Article 11) The government guidelines for the construction of Imidugudu are as follows.
• Each cellule shall identify its site. • Easy proximity to basic facilities (drinking water, schools, health care facilities). • Agricultural fields should be no further than 2 to 3 km from the site. • Landscape conducive to easy construction of Imidugudu. • Regulations concerning the minimal size and design of houses and plots: plot size 400-600
square meters.
• Houses are grouped in blocs, each of which contains a maximum of 20 plots. • Roads: roads connecting Imidugudu should be 12 m wide, and inside Imidugudu roads
should be 8-10m wide.
• The surface areas of other facilities should be as follows: schools 2.5ha, health facilities 1.5ha, and markets 4ha.
The program, a countermeasure for the intensified settlement crisis in 1996 with the return of 1.5 million refugees from the Democratic Republic of Congo, has enabled 90 % of Kibungo population to live in Imidugudu. In September 1999, the Rwanda Initiative for Sustainable Development (RISD), a local NGO, organized a symposium on Imidugudu and Land Use. RISD report summarizes the results of this program as follows:
• The government, aid agencies and NGOs responded relatively well to the shelter crisis after the 1994 war and genocide.
• The shelter program went hand in hand with land distribution that enabled people sustain themselves shortly after the end of the war.
• The government was able to maintain security of the people in villages and allayed their

20
fears after the war. This went a long way in facilitating reintegration of communities.
• Villagisation facilitated unity and reconciliation after the atrocities in 1994. • The Common Country Assessment-Rwanda (1999-2000) shares a similar view on the major
benefits of the program and concludes that “…for the longer term, the most important is the Government’s assertion that Imidugudu represents a partial ‘exit strategy’ from Rwanda’s overwhelming poverty and dependence on semi-subsistence agriculture.”
2.6 Sector Strategies The PRSP progress report states, “Sector strategies, the aim of which are to capture all spending in one sector and define a coherent, poverty-focused strategy together with all partners in the sector, is the principle tool for implementing the PRSP. The link between the sector strategies and decentralization will be crucial in achieving the PRSP goals.” The study team has collected data and information on sector strategies by visiting ministries involved in Kibungo development planning. The following are summaries of strategies in such sectors as water and sanitation, rural development and agricultural transformation, local governance, health/hygiene, and gender issues.
2.6.1 Water and sanitation by MINITERE On April 12 in Kigali, the study team attended the meeting held by MINITERE to review water and sanitation programs and projects. The meeting referred to the two documents below.
• Revue du Secteur Eau et assainissement • Rapport des Realisations du PRS-PR2004 Secteur Eau et Assainissement
The following are summaries of the sector strategies and MINITERE’s efforts so far. (1) Vision 2020 By the year 2020, the government will make Rwanda a country where 1) all of the population can access potable water; 2) people master the ways to collect and keep rain water for both domestic and agricultural uses; 3) mountain forests, the natural water reservoir, will be rehabilitated and carefully managed; 4) water resources will be rationally and comprehensively managed in line with the master plan of national land use; 5) people secure well-balanced and sustainable measures to manage water; and 6) every water-related infrastructure for production, protection, distribution and sanitation is protected and maintained properly. (2) Poverty reduction strategy Sustainable improvement in water supply and sanitation brings about such effects as:
21
• positive impact on the maternity and infant health; • improvement in school enrollment, especially among female students; • reduction of time spent for fetching water, especially by women; • reduction of health/medical costs, both for government and families, related to the
water-borne diseases; and
• increase in economic productivity based on healthy people. The major objectives of the sector are: improvement of water supply as well as extension of supply system, optimal use of water for agriculture, energy generation and transport, enforcement of community’s capacity in water supply management, increase in access to sanitary/hygienic services, and capacity development with regard to water management both at central and district levels. MINITERE has worked out three programs to cope with the following present constraints: 1) National-level water management program Recognizing the critical nature of water management for Rwanda’s socio-economic development, the government has begun a strategic investment program on water resource development and protection. The program’s first phase or ‘identification’ started in 2003. The government also recruited four international consultants for a study in this program. Their study results and an invest plan to realize the Vision 2020 will come out in June 2005. 2) Rural water supply and sanitation program This program aims to secure, in a sustainable manner, potable water supply and sanitation facilities for the rural population. This program aims to achieve the increase in the water supply rate (percentage of population with access to safe drinkable water) from 44 % at present to 66 % in 2010, 85 % in 2015 and 100 % in 2020. (Note: Program 3) is for Kigali City and omitted in this report) (3) Sector policy on water and sanitation The policy adopted last year recommends the continuation of the sector reform which was anticipated in the government’s seven-year plan. The reform shall, at the end, solve those below-mentioned constraints/problems. In the institutional aspect, the policy will put in place a framework of coordination that defines the major stakeholders’ roles to avoid duplication of efforts. Legal tools will clarify the scope of each actor’s work. In the decentralization aspect, the ownership of local infrastructure will be attributed to the district. The district may develop and manage the infrastructure by itself or it may entrust the work to

22
different types of association and body at different levels. The costs of water production and distribution are shared or borne by beneficiaries. This sector policy activates the concept of decentralization and brings it to the grass-roots level of communities. In the participatory approach aspect, the policy enables the people to play active roles in either planning or implementation of all activities related to water use and conservation. In the program approach aspect, the policy enables focused input of major investments in sustainable actions that will improve the sector’s indicators and reduce poverty. With regard to the roles of women and children, every water supply project should take into account of these two groups. Women who traditionally fetch water for the family now assume the role of the head of a household, and children who also fetch water for the family often sacrifice school attendance. In capacity development, for effective management of water supply and sanitation, capacity development programs are to be introduced in areas including the following: training, information exchange, technology transfer, and participation in international forums. Watershed management is to be done in such a way that pays close attention to the solidarity principle locally generated by sharing water flow or lake either at upstream or downstream, or around communal taps. In monitoring and evaluation, this sector policy needs to be assessed so that the objectives, strategies and actions of the sector will achieve the expected results. (4) Decentralized structure Each water-related project has two aspects. One is the decentralized decision and the other is the division of responsibilities among central department and its local body, Community Development Committee (CDC) and local grass-root community. The following are summaries of the decentralized structure. 1) Cell (rural community) With its 100 to 500 households, the cell is a beneficiary and user of the water supply and sanitation project. The cell a) initiates the project and chooses the level and type of infrastructure, taking financial availability into account; b) makes contribution, either in kind or in cash, to the project implementation; c) entrusts the supervisory work to a private enterprise or operator under the CDC and users’ control; and d) follows up on running of the structure. 2) CDC A major organizer of all types of development projects, CDC 1) formulates sector development plan

23
and District’s development plans; 2) prepares recurrent as well as investment budgets; 3) coordinates all cooperation activities; 4) organizes training programs for residents with regard to community development; and 5) reports on the use of the Common Development Fund (CDF), progress of development project(s) to the Province and central government. 3) Provincial engineer from the Water/Sanitation Unit (Unité Eau et Assainissement) Mainly in order to secure smooth execution of project(s), one engineer is to be recruited from the private sector. 4) Provincial Officer-in-charge of Water/Sanitation (Responsable de l’eau/assainissement de province, or REAP) A catalyst between supporting organizations, the CDC and the community, REAP supervises extension of technology, the participatory approach and implementation of project(s), and takes care of the project’s quality control. REAP is assisted by the Provincial engineer of UEA. 5) Community development officer This agent helps the CDC plan, manage, follow-up, and evaluate the project(s). The agent works with supporting organizations, Provincial engineer and REAP. 6) Project Accountant-advisor to CDC: This accountant attached to CDC helps the district’s accountant(s) with regard to the water/sanitation project. 7) UEA (at the central level) While MINITERE takes charge of the water/sanitation sector, UEA looks at the sector’s policy aspects, promotes the policies, and mobilizes and allocates the budgets. 8) Rural Water/Sanitation Program Coordination Unit This unit inside the UEA will soon become Structure Nationale de l’AEPA (SNAEPA) to coordinate the program’s implementation by helping the government secure proper planning of intervention, and by harmonizing approaches and technical standards. In addition to the water/sanitation sector, MINITERE now takes charge of land issues and the environment. With regard to land, the Ministry describes its objectives as follows:
• To ensure rational management of land resources to promote sustainable human development;
• To ensure viability of human settlements and sustainable human development; • To ensure conservation and protection of the environment in view of sustainable human
24
development;
• To guarantee the best functioning of the ministry; The resettlement or Imidugudu program already mentioned in 2.5 is also under MINITERE’s responsibility.
2.6.2 Rural development and Agricultural transformation by MINAGRI (1) Strategic plan of MINAGRI MINAGRI’s Strategic Plan (Main report, October 2004) states the present status of agriculture as follows. The Rwandese economy is based predominantly on agriculture. In 2002, 87 % of the population was engaged in agriculture. Agriculture produced 47 % to GNP and accounted for 71 % of the country’s export revenues. About 1.4 million households account for almost all the agricultural production of the country. The average size of a family farm is 0.76 ha. including the following:
• Moving away from an agriculture-centered economy towards a market economy; • Intensification and progressive modernization of the agricultural sector; • New distribution of roles and responsibilities among all stakeholders in conformity with
new policies regarding government disengagement from some sectors and decentralisation;
• New methods of work in relation with the Programme approach adopted by MINAGRI in order to realize the SPAT objectives.
(2) Lessons from previous experiences Projects were often conceived by foreign experts in cooperation with the central administration, but without any participation of beneficiaries. The result is that people find it hard to take over any operations in the framework of classical projects and sometimes these operations come to a halt once donor funding is over. Recourse to foreign resources without sufficient involvement of grassroots communities has often resulted in low cost-effectiveness. (3) Decentralization The Government has instituted a process of decentralized community planning through a harmonised framework. Through the framework, almost all Districts and Provinces in the country possess a Community Development Plan (CDP) designed on a participatory basis. Results from this process were used to elaborate the definition of the agricultural strategy. (4) Regional consultation The beneficiaries’ consultations in 106 districts of the country took place in three phases. The pilot
25
phase, with participatory workshops in the 10 districts of Kigali-Ngali, took place in July 2004. The second phase covered the Districts in Kibuye and Gikongoro Provinces in August 2004. For the two other Provinces, Umutara and Kibungo, the district workshops took place in September 2004. The last step was about the 7 other Provinces in October to November 2004. Thus all provincial restitutions were finalized before the end of the year 2004. The general public and local authorities actively took part in the 5 workshops so far. Such enthusiasm reflects the importance of agriculture in the rural economy. The workshops enabled MINAGRI to re-establish communication with its constituents. They also created inevitable expectations in local authorities that actions will follow the words. The effective carrying out of the Strategic Plan is therefore very important in meeting those expectations. The results of consultations presented here show the constraints and opportunities identified in the Provinces of Kigali-Ngali, Gikongoro and Kibuye. On this basis, participants in the workshops suggested solutions, priority fields, and concrete actions to complement the Community Development Plans. (5) Agricultural projects They are mostly financed by development partners. The Public Investment Programme (PIP) 2003-2005 indicates that foreign sources provide 88.3 % of the funding in the agricultural sector. The multilateral funding institutions include the World Bank, AfDB, FIDA, EU, BADEA, and United Nations agencies such as UNDP and FAO. Also involved in the sector are bilateral cooperation partners such as USAID, the Netherlands, Belgium, China, Germany, Italy, Canada, Great Britain, and international NGOs. A number of agricultural projects financed through loans have a low level of disbursement. This is due to the poor absorptive capacity of the services responsible for their implementation as well as the complexity of the donor procedures or delays in operations. The Vision 2020 has fixed the following specific objectives for the period between 2002 and 2020.
• 90% of land will be protected against erosion. • 10000 ha of land on hills will be irrigated. • 40000 ha of marshlands will be developed. • 140 valley dams and water reservoirs on hillsides will be constructed.
Rwanda will most likely need major development undertakings to attain the above goals. With regard to Kibungo development planning, the study team is convinced that the sector strategy of MINAGRI and PDC had been coordinated through “regional consultation” and MINAGRI is ready to extend assistance to locally conceived development project(s).

26
2.6.3 Local governance by MINALOC
The main mission of MINALOC is to promote the well-being of the population by good governance, community development and social affairs. Specifically, it has the following components:
• Follow-up and evaluation of the functioning of decentralized administration units and reinforcement of their capacities.
• Coordination of the process of restructuring decentralized administrative units in order to improve their functions, synergy and partnership with other institutions.
• Implementation and coordination of community development mechanisms toimprove the well-being of the population as well as social protection mechanisms based on solidarity, insurance and social security.
• Implementation and coordination of assistance and self-help for vulnerable groups, especially survivors of the genocide.
• Coordination of activities related to the management of risks and disasters.
2.6.4 Health/Hygiene by MINISANTE As a result of poverty, malnutrition, poor hygiene and sanitation, and ignorance, current health indicators reveal the precarious health situation that exists for the majority of Rwandese households, restricting the ability of the population to take part fully in the economic development of the country. The Ministry of Health has laid down the following major policy objectives: (1) to improve the availability of human resources, (2) to improve the availability of quality drugs, vaccines, (3) to expand geographical accessibility to health services, (4) to improve the financial accessibility to health services, (5) to improve the quality of and demand for services in the control of diseases, (6) to strengthen national referral hospitals and research and treatment institutions, and (7) to reinforce institutional capacity. The peripheral level is represented by the health district and consists of an administrative office, a district hospital and a network of health centers. The health district deals with the health problems of its target population. In the context of decentralization, a health district corresponds to an administrative district, and on a purely transitory basis, two or more administrative districts together can be covered by a health district. A consultant’s report “Maximizing Decentralization Opportunities for Improved Health (July 2002)” comments on the Ministry’s decentralization policy as follows:

27
With regard to the question of the differences between the Health District and the administrative district, it was clear that MINISANTE is not convinced that the integration of the health center into the local government district will work. The only opportunity for the study team to look into the health district’s functions was a short visit to Kibungo Hospital. Given its workload to take daily care of in- and outpatients and manage several health centers, the health district is unlikely to take on such field activities as campaign for sanitary use of water or improving latrines anytime soon.
2.6.5 Gender issues by MIGEPROFE By 2020, Rwanda will have reached parity between the two sexes in tertiary education and women will represent at least 30 % in posts of responsibility and will thus be empowered at all decision making levels, the Vision 2020 reads. The Ministry’s strategic plan of August 2004 illustrates its raison d’être as follows: “The importance of the role of women in the socio-economic development is demonstrated by the following facts.
• Women constitute more than 80% of farmers. • 62.15% of female-headed households in Rwanda live under the poverty line compared to
54.32% of male-headed households.
• Women’s literacy rate is estimated at 47.8% compared to 58.1% for men. • Women take care of the majority of orphans and prisoners suspected of having participated
in the genocide.
• Many women survivors of genocide are infected with HIV/AIDS and other sexually transmitted diseases.”
The focused Strategic Objectives for Gender Promotion are to:
• Ensure full participation of women in the Rural Development and Agricultural Transformation process, as means of contribution to the country’s economic growth and create revenue and wealth for the women and their families.
• Mainstream gender issues in all areas of Human Resources Development policies and programs.
• Improve increased access and use of economic infrastructures and ICT by women in order to provide them with an enabling environment for their development activities.
• Strengthen the role of women in all areas of the private sector development.

28
• Increase the involvement of women in all institutional organs of good governance and enhance a conducive environment for prevention of all sorts of discrimination of women.
With regard to Kibungo development planning, the proposed water supply project under Japan’s grant aid and technical cooperation project have taken into consideration the roles of women and children and the ‘human security’ concept.
2.7 Donor Coordination Where expedient, development cooperation is coordinated with other bilateral and multilateral donors1. Discussions are held on the framework conditions surrounding the cooperation, the issue of ownership as well as the developing country's own efforts. The Japanese government has long emphasized donor coordination for increasing aid effectiveness. The 2003 report of the DAC peer review describes Japan in the following manner. “Japan’s efforts (on the basis of its country assistance strategy) are bearing fruits and both the
Government of Tanzania and other donors expressed appreciation for the collaborative nature of Japanese operations. In particular, Japan has provided a secretariat to lead donor coordination in the agriculture sector, played a significant role in the poverty monitoring activities for the PRSP.” After a decade of absence from the cooperation arena, Japan’s Ministry of Foreign Affairs (MOFA) went through from 2003 to 2004 both in Kigali and Tokyo a series of dialogues with Rwandese officials. The Japanese delegation to the 2004 Consultative Group Meeting for Rwanda in Kigali set forth its bilateral cooperation strategy, taking into account the PRSP and giving priorities to rural development, agricultural transformation and human resources development. The present study team was mandated, in the pre-departure meeting attended by both the MOFA and JICA, to exchange views with Rwanda’s development partners with regard to the scope and methods of study as well as field findings. Moreover, the team was to explain, in the regular cluster group meeting, the contents of the progress report so that the final report may reflect views of the other Consultative Group members. With regard to the cluster group, the PRSP progress report reads that “Existing institutions for donor harmonization and support will need to be strengthened for improved implementation of the PRSP. Currently, the cluster thematic groups, whose objectives have been to facilitate the development and
1 Among references on aid coordination is http://www.gtz.de/en/unternehmen/1734.htm, the website of the Deutsche Gesellschaft für Technische Zusammenarbeit (German Society for Technical Cooperation).

29
implementation of sector strategies, have played a major role in harmonization. “These clusters are arranged around the main themes contained in the PRSP and meet on a regular basis, with the aim of harmonizing donor support around government priorities. Though there has been significant progress in the education and HIV/AIDS clusters, development of clusters in areas other than these has been slower than planned, owing to limited capacity in some ministries. There is a need to expand the mandate of the clusters to facilitate the development and continued reassessment of sector strategies, so as to achieve a better alignment with the PRSP review process.” During its two-month stay in Rwanda, the team had sought opportunities to meet, explain the mission to, and hear the comments from the cluster group members with the help of Mr. Masayoshi Ohno, a JICA expert, and its counterpart officials. The progress report was distributed right after the departure of the team through MINITERE to Rwandese ministries and departments and major donors for comments. The team’s mandate in this regard remains incomplete till today. Prior to the study, a High Level Forum on aid effectiveness was held in Paris from 28 February to 2 March 2005, and Rwanda took part in it. The Paris Declaration summarizes actions to be taken by both donors and partners, i.e., developing countries, for reducing poverty and inequality, promoting growth, building capacity and accelerating achievement of the MDGs. The participants of the 4th Rwanda-Development Partners Conference in Kigali agreed that “Rwanda is on the right path to achieving its development goals and deserves increased support.” According to the CEPEX document of April 2004, the total amount of external aid that Rwanda received in 2003 was US$319,640,000 (of which US$149,480,000 represents bilateral cooperation). The top donor was EU (US$58,750,000 occupying 18.38 %), followed by DFID (15.33 %), the World Bank (9.63 %), USAID (6.33 %), the Netherlands, and Belgium.
Chapter 3
Development Strategy of Kibungo Province
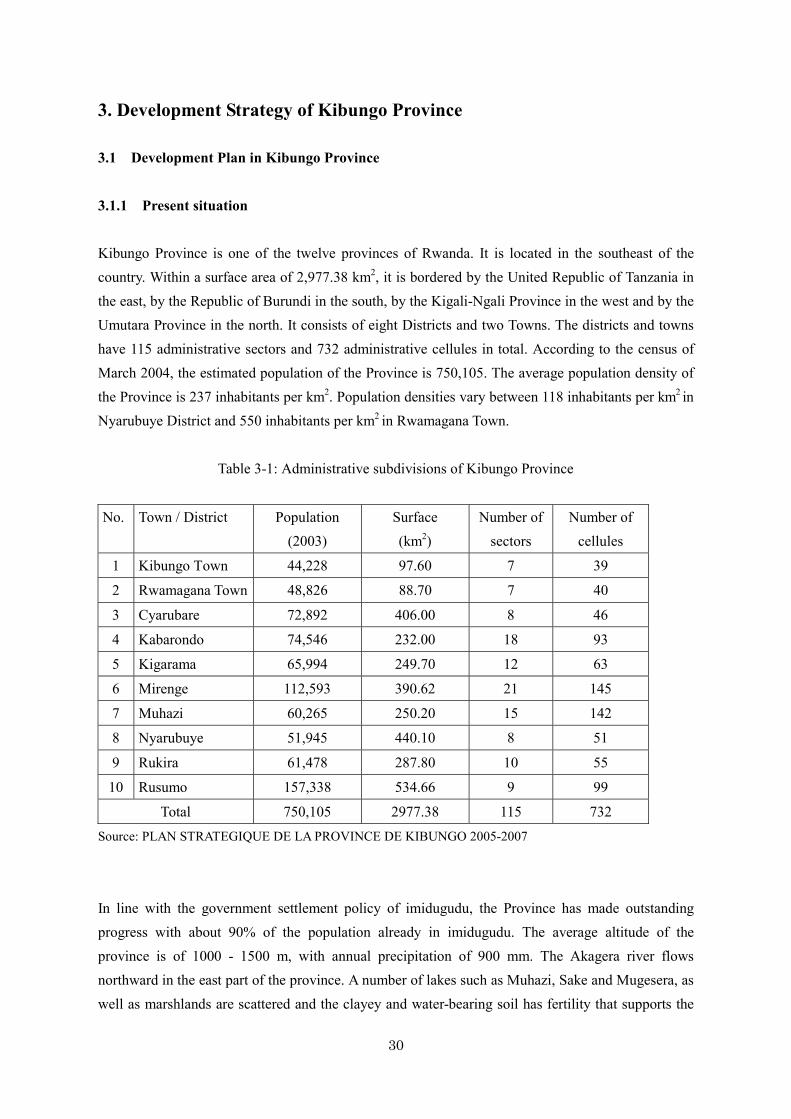
30
3. Development Strategy of Kibungo Province 3.1 Development Plan in Kibungo Province 3.1.1 Present situation Kibungo Province is one of the twelve provinces of Rwanda. It is located in the southeast of the country. Within a surface area of 2,977.38 km2, it is bordered by the United Republic of Tanzania in the east, by the Republic of Burundi in the south, by the Kigali-Ngali Province in the west and by the Umutara Province in the north. It consists of eight Districts and two Towns. The districts and towns have 115 administrative sectors and 732 administrative cellules in total. According to the census of March 2004, the estimated population of the Province is 750,105. The average population density of the Province is 237 inhabitants per km2. Population densities vary between 118 inhabitants per km2 in Nyarubuye District and 550 inhabitants per km2 in Rwamagana Town.
Table 3-1: Administrative subdivisions of Kibungo Province
No. Town / District Population (2003)
Surface (km2)
Number of sectors
Number of cellules
1 Kibungo Town 44,228 97.60 7 39
2 Rwamagana Town 48,826 88.70 7 40
3 Cyarubare 72,892 406.00 8 46
4 Kabarondo 74,546 232.00 18 93
5 Kigarama 65,994 249.70 12 63
6 Mirenge 112,593 390.62 21 145
7 Muhazi 60,265 250.20 15 142
8 Nyarubuye 51,945 440.10 8 51
9 Rukira 61,478 287.80 10 55
10 Rusumo 157,338 534.66 9 99
Total 750,105 2977.38 115 732
Source: PLAN STRATEGIQUE DE LA PROVINCE DE KIBUNGO 2005-2007
In line with the government settlement policy of imidugudu, the Province has made outstanding progress with about 90% of the population already in imidugudu. The average altitude of the province is of 1000 - 1500 m, with annual precipitation of 900 mm. The Akagera river flows northward in the east part of the province. A number of lakes such as Muhazi, Sake and Mugesera, as well as marshlands are scattered and the clayey and water-bearing soil has fertility that supports the

31
Province’s agricultural productivity. With regard to the water supply, villagers’ access to safe water remains difficult due to precipitation lower than in other provinces and imidugudu by which people in wet lowland moved to a higher area along the roads. They are obliged to fetch unsafe river and lake water or stagnant water and this causes serious health and sanitary problems. The table 3-2 indicates some indicators of Kibungo Province and National Average. As stated, indicators related to drinking water in Kibungo Province are relatively low level compared to the national average.
Table 3-2: Some indicators of Kibungo Province and National average
Indicators Kibungo Province
National
Population of extremely poverty (%) 26.8 37.8
Infant mortality rate (per 1,000 people) 142.8 117.4
Adult literacy rate (% over 15 years old) 38.2 52.6
Distance from potable water source (m) 1,185 703
Utilization of potable water source (%) 31.4 38
Utilization of unsafe water source: River water (%) 29.7 18.7
Utilization of unsafe water source: Spring water (%) 8.9 15.9
Principal fuel: Firewood (%) 98.6 90.2
Source: PRSP Progress Report 2004
The Province has 36 health service facilities: 2 hospitals, 32 central clinics and 2 dispensaries. They do not contribute to people’s healthcare the way they are meant to due to a lack of personnel, equipment and supplies. Moreover, poor families or those who live in remote areas cannot make use of these facilities. Agriculture is the Province’s main industry in which roughly 90 % of the residents are engaged. The major crops are coffee, sorghum, beans, potatoes, banana and rice. Productivity remains low because 1) farmland is often located on the hillside or lowland, 2) farming is practiced on a small piece of land, and 3) there is no irrigation. Besides, transportation facilities --- roads between farms and markets in particular --- are not properly developed, constituting an obstacle to post-harvest activities all over the Province. As for energy resources, electrification has not made much progress except in Kibungo town with the electrification rate of 8.3 % and Rwamagana town with 12.0 %. The residents use much firewood as

32
an essential source of energy. Thus the forests are being depleted, and soil erosion and land sliding are common. The government is trying to promote the use of other energy sources such as coal, solar energy and biogas, but has not had much success so far. Through a participatory approach, all the above-mentioned problems have been identified and discussed at the cell, sector and district levels to compile a District Development Plan (PDC). After having received all districts’ PDC, the Province ranked those problems as shown below.
Table 3-3: List of definitive problems for Kibungo Province
Position Present problems
1 Difficult access to clean water
2 Environmental pollution
3 Low level of agricultural and livestock products
4 Limited access to education
5 Insufficient energy resources
6 Poor empowerment of women at all levels
7 Relatively undeveloped communication systems
8 Difficult access to healthcare
9 Low income of the population
10 Services to the population at unsatisfactory levels
11 Many homeless households
12 Poor access to current financial systems
13 A large number of out-of-school young people without supervision
14 Relatively undeveloped trade circuits
15 Poor socio-cultural environment
16 Bad condition of roads and bridges
Source : PLAN STRATEGIQUE DE LA PROVINCE DE KIBUNGO 2005-2007
3.1.2 Provincial development plan To achieve the reduction of poverty as mentioned in PRSP or Vision 2020, all districts have made their own PDC and the development plan of Kibungo Province is based on them. The planning of the development strategy of the Province took the following process. At first, each district classified the problems according to the subjects in PDC. Then, 49 serious problems and crosscutting issues such as gender and the environment by the province were selected through discussions. Afterwards, 16 out of the 49 problems were selected and the Province made many programs to analyze these problems.

33
As this Strategic Plan outlines, the province has the following development potentialities that will be taken into account for provincial development planning.
• People’s motivation to work as seen in Umuganda • Soil fertility • Lakes and other tourist attractions • Marshlands suited to rice production • Villagers’ beekeeping practice • Diversified cash cropping • Imidugudu almost completed
(1) Three Sectors of the Development Plan in Kibungo Province The plan can be classified into three sectors. 1) Human development sector
• Water supply and sanitation • HIV/AIDS and malaria • Education • Empowerment of women • Health/hygiene • Housing/settlement • Education for the youth • Cultural activities
2) Economic development sector
• Environmental program (water/sanitation) • Agriculture and animal raising • Energy • Communication • Income generation • Fiscal system • Transportation networking • Road construction/rehabilitation
3) Good governance
• People-centered service program (2) Rural Infrastructure Projects PDCs that are based on the development strategy in Kibungo Province have examined many projects. The projects include staff training, activities at the grassroots level, and construction of many small facilities.
34
The rural infrastructure development projects have the following priorities. 1) Water supply and sanitation
• 30% of Imidugudu enjoy safe water supply • 100% of sanitary facilities receive safe water supply • 100% of secondary schools use safe water • 30% of primary schools use safe water
2) Environment
• Water resources in the marshland are protected • Recovery of soil erosion and landslide • Minimum 2000 ha of forest land will be recovered
3) Agriculture and animal raising
• Development of 8 rice fields • Construction of post-harvest facilities in every district
4) Education
• Opening of 2 kindergartens in each cell • Rehabilitation of 476 primary schools • Construction of 523 primary schools • Introduction of IT in 40% of secondary schools and 10% of primary schools
5) Energy
• Potential assessment of energy resources • Construction of biogas production/generation unit • Putting together a master plan for provincial electrification
6) Vulnerable people
• IES for relief of vulnerable residents • Establishment of funds for women’s groups
7) Road
• Upgrading Kayonza-Rusumo road • Upgrading Kibungo-Rukumberi-Akagera road • Rehabilitation of 400 routes
8) Health services
• Construction of 2 hospitals at Kirehe and Rwinkwavu

35
3.2 Characteristics of Each District/Town Details of the result of the profiling survey that the study team conducted in the province are shown in the annex. In order to better understand the district, the following Radar Charts are produced using the data/statistics in each PDC and the team’s findings. Each Rader Chart includes the following six aspects to address for the betterment of living conditions and poverty reduction: 1) Water supply: composite indicators on the proportion of people who can use safe water, and remoteness to the water point; 2) Sanitation/amenity: composite indicators on the number of inpatient beds available in each District’s medical facilities, proportion of houses roofed with galvanized iron sheet and proportion of improved latrines; 3) Road and electrification: composite indicators on the proportion and length of paved roads, total length of District roads and rate of electrification; 4) Agriculture: composite indicators such as the total area of agrarian land, proportion of people engaged in agriculture, per capita farmland (in ha), rate of users of compost/fertilizer; 5) Administrative capacity: composite indicators such as number of administrative staff, proportion of complete Imidugudu, frequency of application for CDF; and 6) Fragility/gender issues: composite indicators on demobilized people, number of vulnerable people and literacy rate. The nearer the indicator is to the center, the more effort is needed for improvement. The following are summaries of the characteristics of each District. (1) Kibungo Town Kibungo Town is the seat of the Provincial office. Its population density is as high as 453 persons / km². Most residents of the town, i.e., 74 %, can use Electrogaz water. However, residents of the outskirts of the town are obliged to fetch water at a remote but not always safe water point which, on average, needs a 2-km walk. The town has a hospital that can accommodate 200 inpatients. Although the town has 16 km of paved roads, inter-district/sector roads are poorly maintained and obstruct rainy-season transportation. The town’s per-capita farmland is less than 0.1 ha. The literacy rate of 13.4 % ranks the third lowest in the province. The rate of completed Imidugudu is 81 %.

36
(2) Rwamagana Town This commercially developed town in the northwest of the province has an area of 88.7 km², the smallest in the province. Its population density is the highest in the province at 550 persons / km². 60 % of the residents are engaged in agriculture. The town’s topographic advantage enabled the development of 200 ha rice field inside marshlands under the African Development Bank’s loan in 2004. The rate of the use of compost and fertilizer is 64 %, the highest in the province. Both the water supply system and facilities of health/hygiene services are relatively well developed, but still the average distance to a water point is more than one kilometer. The town has more than 5 km of paved roads, but inter-sector roads remain underdeveloped, causing problems in the rainy season. The town’s hospital with capacity for 200 inpatients and high electrification rate of 12% is an example of the early urbanization of the town. This modernization has probably discouraged people from living in Imidugudu that often lack such social infrastructure as electricity. The rate of complete Imidugudu in the town is as low as 41.5 %.
Figure 3-1: Radar Chart of Kibungo Town
02468
10Water supply
Hygiene enviroment
Road and Electric supply
Agriculture
Administration
Vulnerable group
Figure 3-2: Radar Chart of Rwamagana Town
02468
10Water supply
Hygiene enviroment
Road and Electric supply
Agriculture
Administration
Vulnerable group

37
(3) Cyarubare District Located in the northeast of the province, Cyarubare has the province’s second lowest population density of 180 persons / km². Though the percentage of people with access to safe water (hereinafter referred to as ‘rate of water supply’) is 60.3 %, residents are obliged to walk more than 4 km to fetch water as the district is in a remote area. No paved road exists and inter-sector/cell roads are poorly maintained. 98 % of the residents are engaged in agriculture, and the district’s agrarian land is the second largest in the province. The district may enjoy the highest potential for agricultural development in the province if the road condition is improved and the marketing of farm products is encouraged. The district’s medical service is at the lowest level in the province with only 33 inpatient beds, and the rate of electrification is as low as 0.5 %.
(4) Kabarondo District This district is in the north of the province and the population density is 321 persons / km². The rate of water supply reaches 80 % but some sectors suffer from the distance to the water point of 6 km, the longest in the province. 90 % of the residents are farmers cultivating less than 0.2 ha of land on average. The imidugudu completion rate is 96 %. Although the electrification rate remains low at 1.3 %, administrative staff members use computers daily. The average number of computers is 5 units / district, the highest in the province. 60 % of the major district roads are paved but feeder ones are not properly maintained.
Figure 3-3: Radar Chart of Cyarubare District
02468
10Water supply
Hygiene enviroment
Road and Electric supply
Agriculture
Administration
Vulnerable group

38
(5) Kigarama District This district is located in the west of the province. The population density is 264 persons / km². Although the rate of water supply is 66 %, the water point is located as far as 3.5 km away from residences. There are 4 km of paved roads but most of the feeder roads cause trouble to villagers during the rainy season. More than 90 % of the residents live on farming but the per-capita farmland is less than 0.2 ha, similar to Kibungo and Rwamagana towns. The small capacity of the district’s medical service facilities is complemented by the nearby Kibungo hospital. Residents use galvanized iron sheets at 83 % of the houses but the electrification rate is a minuscule 0.2 %.
(6) Mirenge District Also located in the west of the province, this district’s population density is 288 persons / km². Its rate of water supply of less than 43 % is the lowest in the province, and the water point is far away with the average distance of more than 4 km from residences. Though the total road length is 192 km, no paved road exists and inter-sector/cell transportation is very much hampered in the rainy season.
Figure 3-4: Radar Chart of Kabarondo District
02468
10Water supply
Hygiene enviroment
Road and Electricsupply
Agriculture
Administration
Vulnerable group
Figure 3-5: Radar Chart of Kigarama District
02468
10Water supply
Hygiene enviroment
Road and Electricsupply
Agriculture
Administration
Vulnerable group
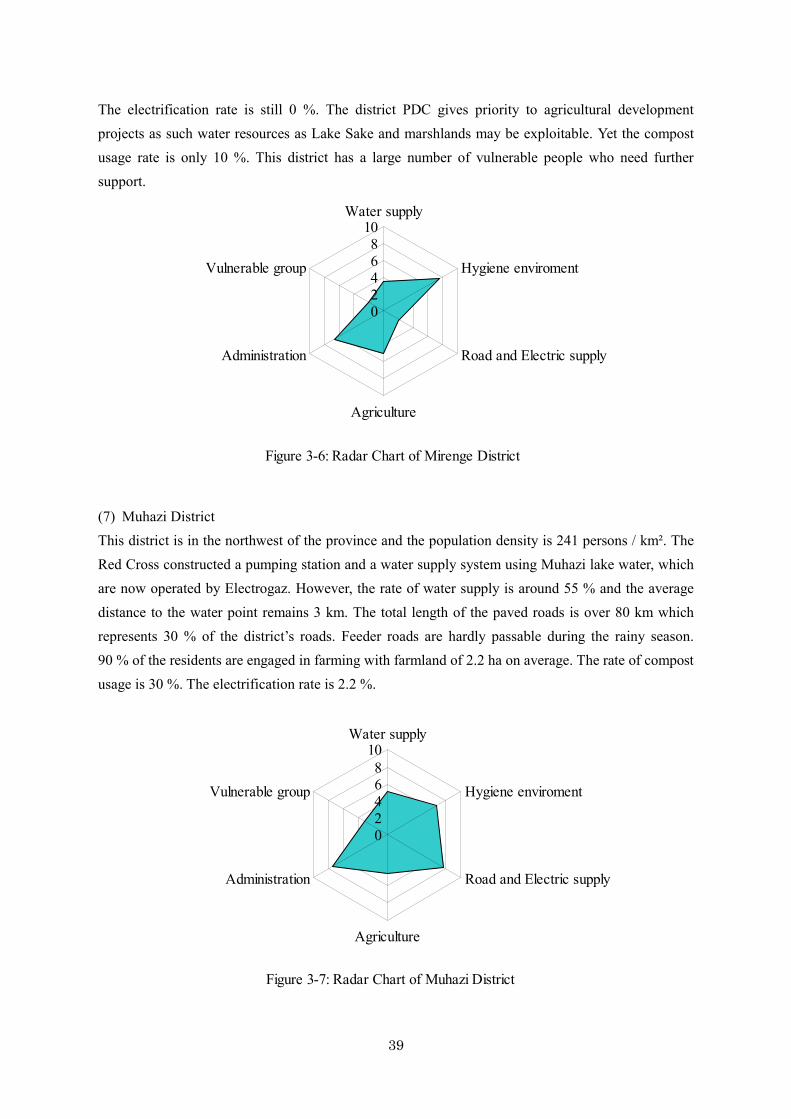
39
The electrification rate is still 0 %. The district PDC gives priority to agricultural development projects as such water resources as Lake Sake and marshlands may be exploitable. Yet the compost usage rate is only 10 %. This district has a large number of vulnerable people who need further support.
(7) Muhazi District This district is in the northwest of the province and the population density is 241 persons / km². The Red Cross constructed a pumping station and a water supply system using Muhazi lake water, which are now operated by Electrogaz. However, the rate of water supply is around 55 % and the average distance to the water point remains 3 km. The total length of the paved roads is over 80 km which represents 30 % of the district’s roads. Feeder roads are hardly passable during the rainy season. 90 % of the residents are engaged in farming with farmland of 2.2 ha on average. The rate of compost usage is 30 %. The electrification rate is 2.2 %.
Figure 3-6: Radar Chart of Mirenge District
02468
10Water supply
Hygiene enviroment
Road and Electric supply
Agriculture
Administration
Vulnerable group
Figure 3-7: Radar Chart of Muhazi District
02468
10Water supply
Hygiene enviroment
Road and Electric supply
Agriculture
Administration
Vulnerable group

40
(8) Nyarubuye District This east-end district is the least populated in the province with the population density of 118 persons/ km². Infrastructure is underdeveloped and the rate of water supply is 50 %, the second lowest after Mirenge district. The average distance from the Imidugudu to the water point is 4 km. As the district name indicates, most of the district is covered with rock and no portion of the 154-km district roads has been paved. A high percentage of farmers, i.e., 98 %, growing coffee, sorghum or raising animals indicates further potential for agricultural development especially around Lake Wanpanga. The number of inpatient beds is 59 and the usage rate of galvanized iron sheets is 60 %. No electric power is available.
(9) Rukira District Located in the west of the province, the district’s population density is 214 persons / km². The rate of water supply is 60 % and the average distance to the water point is 1.5 km. Only 9 km of the district roads are paved, and other inter-sector/cell roads remain in a bad condition. The electrification rate is 2 %. 95 % of residents live on farming and the compost usage rate is 61 %, a little lower than in Rwamagana town. Though 90 % of the people own private pit latrines, only 54 inpatient beds are available. The literacy rate is lower than 10 %, the lowest in the province.
Figure 3-8: Radar Chart of Nyarubuye District
02468
10Water supply
Hygiene enviroment
Road and Electric supply
Agriculture
Administration
Vulnerable group
Figure 3-9: Radar Chart of Rukira District
02468
10Water supply
Hygiene enviroment
Road and Electric supply
Agriculture
Administration
Vulnerable group
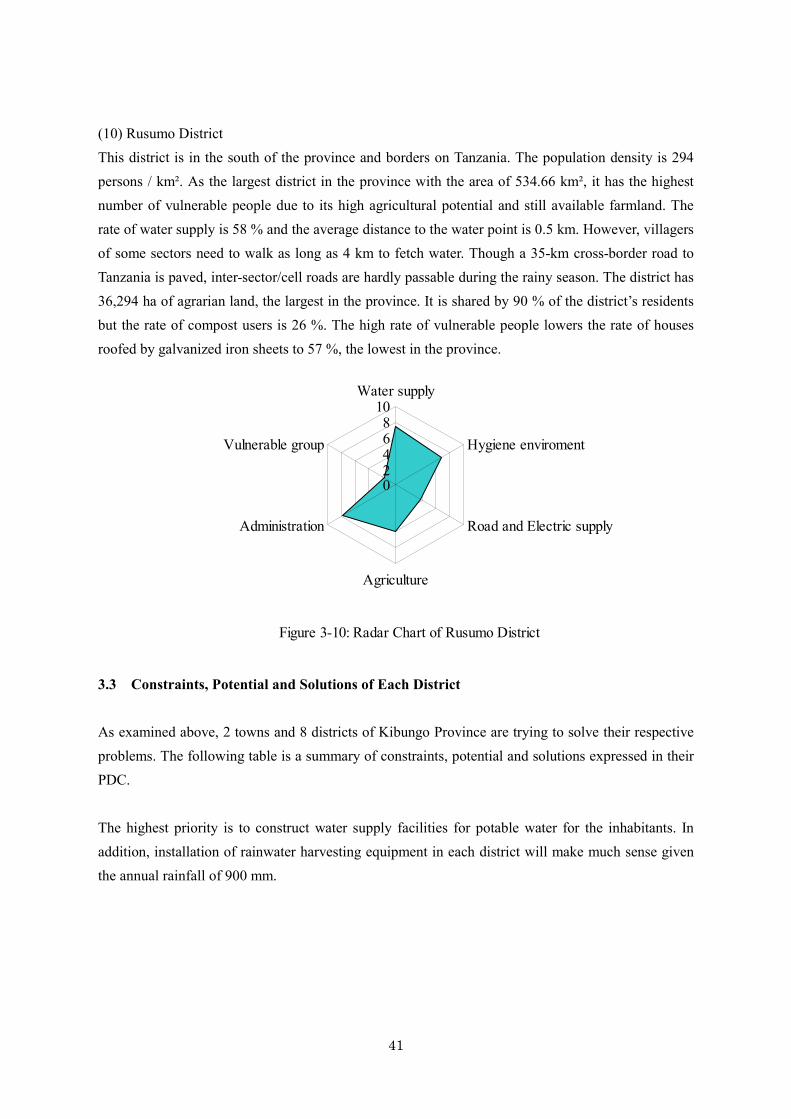
41
(10) Rusumo District This district is in the south of the province and borders on Tanzania. The population density is 294 persons / km². As the largest district in the province with the area of 534.66 km², it has the highest number of vulnerable people due to its high agricultural potential and still available farmland. The rate of water supply is 58 % and the average distance to the water point is 0.5 km. However, villagers of some sectors need to walk as long as 4 km to fetch water. Though a 35-km cross-border road to Tanzania is paved, inter-sector/cell roads are hardly passable during the rainy season. The district has 36,294 ha of agrarian land, the largest in the province. It is shared by 90 % of the district’s residents but the rate of compost users is 26 %. The high rate of vulnerable people lowers the rate of houses roofed by galvanized iron sheets to 57 %, the lowest in the province.
3.3 Constraints, Potential and Solutions of Each District As examined above, 2 towns and 8 districts of Kibungo Province are trying to solve their respective problems. The following table is a summary of constraints, potential and solutions expressed in their PDC. The highest priority is to construct water supply facilities for potable water for the inhabitants. In addition, installation of rainwater harvesting equipment in each district will make much sense given the annual rainfall of 900 mm.
Figure 3-10: Radar Chart of Rusumo District
02468
10Water supply
Hygiene enviroment
Road and Electric supply
Agriculture
Administration
Vulnerable group

42
Tabl
e 3-
4: A
naly
sis o
f pro
blem
s, po
tent
ialit
ies a
nd so
lutio
ns in
tow
ns a
nd d
istri
cts
No.
To
wn/
Dis
trict
Pres
ent P
robl
ems
Pote
ntia
litie
s So
lutio
ns
1. D
iffic
ult a
cces
s to
pota
ble
wat
er
• Pr
esen
ce o
f Ele
ctro
gaz
in K
ibun
go P
rovi
nce
• Pr
esen
ce o
f wat
er c
omm
ittee
•
Exis
tenc
e of
stru
ctur
e of
Com
mun
ity
Dev
elop
men
t Com
mitt
ee
• Ex
iste
nce
of w
ater
sour
ces
• In
stal
latio
n of
new
wat
er su
pply
faci
litie
s in
sect
ors o
f K
ibay
a, S
akar
a, N
dam
ira, R
ubon
a an
d K
abar
e
2. L
ow le
vel o
f agr
icul
tura
l pr
oduc
ts
• Pr
esen
ce o
f mar
shla
nds
• Fa
vora
ble
clim
ate
for a
gric
ultu
re
• Ex
iste
nce
of fe
rtile
land
• M
anag
emen
t and
dev
elop
men
t of m
arsh
land
s •
To re
info
rce
prod
ucer
s’ te
chni
cal c
apac
ities
and
pr
ovid
e te
chni
cal t
rain
ing
• Pr
omot
ion
of fa
rmer
gro
ups
3.
Insu
ffici
ent e
lect
ric
netw
ork
and
lack
of m
eans
of
tran
spor
tatio
n
• R
esid
ents
’ will
to e
ngag
e in
com
mun
ity w
ork
• Av
aila
bilit
y of
con
stru
ctio
n m
ater
ials
•
Reh
abili
tatio
n of
inte
r-sec
tor r
oads
•
Con
stru
ctio
n of
bus
stat
ion
in K
ibun
go se
ctor
•
Exte
nsio
n of
com
mun
icat
ion
netw
ork
• Ex
tens
ion
of In
tern
et fa
cilit
y
1 K
ibun
go
Tow
n
4. L
arge
num
ber o
f vu
lner
able
peo
ple
with
out
secu
rity
• R
esid
ents
’ will
to h
elp
vuln
erab
le p
eopl
e •
Esta
blis
hmen
t of d
ense
ly p
opul
ated
loca
litie
s •
Dis
tribu
tion
of c
onst
ruct
ion
mat
eria
ls
1. L
ack
of p
otab
le w
ater
in
certa
in se
ctor
s •
Res
iden
ts’ v
olun
tary
wor
k •
Loca
l res
ourc
es
• Ex
tens
ion
of E
lect
roga
z’s
wat
er p
ipel
ine
to M
wur
ire,
Nsi
nda,
Rut
onde
, and
Sov
u se
ctor
s •
Dev
elop
men
t of 1
0 ne
w w
ater
sour
ces
2. L
ow le
vel o
f agr
icul
tura
l pr
oduc
ts
• La
nd is
ava
ilabl
e an
d su
itabl
e fo
r agr
icul
ture
•
Sele
cted
seed
s are
ava
ilabl
e •
Effe
ctiv
e us
e of
cre
dit/l
oan
and
ferti
lizer
•
Effe
ctiv
e us
e of
cat
tle in
agr
icul
ture
2 R
wam
agan
a To
wn
3. L
ack
of h
ouse
for
vuln
erab
le g
roup
•
Avai
labi
lity
of m
anpo
wer
•
Pres
ence
of c
onst
ruct
ion
mat
eria
ls
• Av
aila
bilit
y of
farm
land
• C
onst
ruct
ion
of 2
00 h
ouse
s for
vul
nera
ble
peop
le
• C
reat
ion
of h
ouse
fund
s at d
istri
ct le
vel
1. S
horta
ge o
f sup
plie
d w
ater
•
Exis
tenc
e of
wat
er so
urce
s •
Peop
le’s
vol
unta
ry w
ork
• C
onst
ruct
ion
of w
ater
supp
ly sy
stem
•
Exte
nsio
n of
supp
ly sy
stem
•
Dev
elop
men
t of w
ater
sour
ces
• C
onst
ruct
ion
of c
iste
rn fo
r col
lect
ion
of ra
in w
ater
.
3 C
yaru
bare
D
istri
ct
2. S
mal
l qua
ntity
of
agric
ultu
ral /
live
stoc
k pr
oduc
ts
• Ex
iste
nce
of
reso
urce
s to
be
de
velo
ped
(sw
amps
and
live
stoc
k)
• Fe
rtile
land
• Tr
aini
ng o
f fa
rmer
s an
d ca
ttle
bree
ders
in
mod
ern
tech
niqu
es
• D
evel
opm
ent o
f pas
ture
s and
swam
ps

43
• La
kes
• Ef
fect
ive
use
of st
oreh
ouse
•
Expa
nsio
n of
cof
fee
crop
s
3. P
oor c
ondi
tion
of ro
ads
• Pe
ople
’s v
olun
tary
wor
k •
Form
atio
n of
com
mun
icat
ion
road
s •
Reh
abili
tatio
n of
exi
stin
g ro
ads
1. L
ack
of p
otab
le w
ater
•
Peop
le’s
vol
unta
ry w
ork
• Pr
esen
ce o
f peo
ple
in c
harg
e of
wat
er a
nd w
ater
co
mm
ittee
• Ex
tens
ion
of w
ater
sup
ply
faci
litie
s in
14
sect
ors
in
dist
rict
• In
crea
se o
f bou
ndar
y-m
ark
foun
tain
s 2.
Lac
k of
man
agem
ent i
n sw
amps
are
as
• Pe
ople
’s v
olun
tary
wor
k •
Avai
labl
e la
bor f
or a
gric
ultu
ral w
ork
• D
evel
opm
ent o
f sw
amps
3. L
ack
of fo
rest
s
• Av
aila
ble
land
•
Cre
atio
n of
seed
bed
in e
ach
sect
or
4. D
estru
ctio
n of
road
s and
br
idge
s
• Av
aila
ble
labo
r •
Exis
tenc
e of
ent
erpr
ise
• R
ehab
ilita
tion
of ro
ads a
nd b
ridge
s in
11 se
ctor
s
4 K
abar
ondo
D
istri
ct
5. S
mal
l qua
ntity
of d
airy
pr
oduc
ts
• In
terv
entio
n of
age
nts o
f agr
icul
ture
serv
ice
• A
cqui
sitio
n of
100
hea
ds o
f dai
ry c
attle
1. L
ack
of p
otab
le w
ater
•
Res
iden
ts’ m
otiv
atio
n •
Reh
abili
tatio
n an
d m
anag
emen
t of w
ater
sour
ces
• C
onst
ruct
ion
of c
iste
rn in
eac
h ho
useh
old
• R
ehab
ilita
tion
of b
ound
ary-
mar
k fo
unta
ins
2. L
ack
of m
anag
emen
t in
swam
ps a
reas
•
Man
y av
aila
ble
swam
ps
• D
evel
opm
ent o
f sw
amp
area
s
3. L
ow su
stai
nabi
lity
of
fore
st m
anag
emen
t and
lack
of
affo
rest
atio
n
• R
eser
ved
spac
e fo
r for
est
• In
crea
se in
mai
nten
ance
man
agem
ent o
f for
est
4. P
oor c
ondi
tion
of ro
ads
• Pe
ople
’s v
olun
tary
wor
k •
Con
stru
ctio
n an
d re
habi
litat
ion
of ro
ads a
nd b
ridge
s
5 K
igar
ama
Dis
trict
5. In
suffi
cien
t num
ber o
f ho
uses
for v
ulne
rabl
e gr
oup
• St
rong
will
of v
ulne
rabl
e pe
ople
•
Peop
le’s
will
to p
artic
ipat
e •
Con
stru
ctio
n of
hou
ses f
or 1
080
vuln
erab
le fa
mili
es
1. L
ack
of p
otab
le w
ater
•
Exis
tenc
e of
wat
er so
urce
s •
Pres
ence
of
suffi
cien
t qua
ntity
of
wat
er a
roun
d la
ke
• Pu
rcha
se o
f new
ele
ctric
al p
umps
•
Exte
nsio
n of
wat
er su
pply
•
Cre
atio
n of
bou
ndar
y-m
ark
foun
tain
s sys
tem
aro
und
lake
s •
Esta
blis
hmen
t of w
ater
man
agem
ent a
ssoc
iatio
n 2.
Lac
k of
man
agem
ent i
n sw
amps
are
as
• La
rge
spac
e oc
cupi
ed b
y sw
amps
•
Ferti
le sw
amps
•
Arr
ange
men
t of s
wam
ps o
f Aka
gera
, Aka
vogo
, N
yaga
tugu
nda,
Ikiri
ko a
nd G
isay
a
6 M
ireng
e D
istri
ct
3. S
mal
l qua
ntity
of
• Pr
esen
ce o
f lan
d su
itabl
e fo
r liv
esto
ck
• In
trodu
ctio
n of
ext
erna
l rac
es

44
agric
ultu
ral /
live
stoc
k pr
oduc
ts
• Fe
rtile
land
•
Act
ive
resi
dent
s •
Mul
tiplic
atio
n of
sele
cted
seed
s
4. D
estru
ctio
n of
road
s and
br
idge
s •
Exis
tenc
e of
con
stru
ctio
n m
ater
ials
•
Act
ive
resi
dent
s
• St
rong
will
of a
utho
ritie
s
• R
ehab
ilita
tion
of ro
ads
• O
rgan
izat
ion
of c
omm
unity
labo
r
1. L
ack
of p
otab
le w
ater
•
Exis
tenc
e of
wat
er so
urce
s •
Stro
ng m
otiv
atio
n of
resi
dent
s •
Exte
nsio
n an
d re
habi
litat
ion
of w
ater
supp
ly sy
stem
•
Dev
elop
men
t of w
ater
sour
ces
2. S
mal
l qua
ntity
of
agric
ultu
ral /
live
stoc
k pr
oduc
ts
• Fe
rtile
soil
• Su
itabl
e la
nd fo
r gra
zing
•
Impr
ovem
ent i
n ca
ttle
rais
ing
met
hods
•
Cre
atio
n of
vet
erin
ary
clin
ics
• Tr
aini
ng o
n ag
ricul
ture
tech
niqu
es
• A
dvan
ced
cred
it fo
r ag
ricul
ture
and
cat
tle r
aisi
ng
activ
ities
•
Intro
duct
ion
of a
gric
ultu
ral m
etho
ds to
rais
e ou
tput
s 3.
Low
inco
me
• H
igh
pote
ntia
l in
agr
icul
tura
l ac
tiviti
es (
ferti
le
soil,
rain
, lak
es)
• D
ynam
ic p
opul
atio
n
• C
onst
ruct
ion
of c
iste
rn
• A
dvan
ced
cred
it fo
r liv
esto
ck
and
agric
ultu
re
activ
ities
•
Inve
stm
ent i
n ag
ricul
ture
7 M
uhaz
i D
istri
ct
4. In
suffi
cien
t num
ber o
f ho
uses
for v
ulne
rabl
e gr
oup
• R
esid
ent’s
par
ticip
atio
n in
com
mun
ity a
ctiv
ities
• Pr
esen
ce o
f con
stru
ctio
n m
ater
ials
•
Con
stru
ctio
n of
hou
ses f
or v
ulne
rabl
e pe
ople
1. L
ack
of p
otab
le w
ater
•
Exis
tenc
e of
wat
er so
urce
s •
Volu
ntar
y w
ork
of re
side
nts
• C
onst
ruct
ion
and
exte
nsio
n of
wat
er su
pply
syst
em
• D
evel
opm
ent o
f wat
er so
urce
s •
Con
stru
ctio
n of
cis
tern
to c
olle
ct ra
in w
ater
2.
Sm
all q
uant
ity o
f ag
ricul
tura
l / li
vest
ock
prod
ucts
• Ex
iste
nce
of
reso
urce
s fo
r de
velo
pmen
t of
sw
amps
and
cat
tle
• Fe
rtile
land
and
lake
s
• Tr
aini
ng
on
mod
ern
met
hods
of
ag
ricul
ture
an
d ra
isin
g ca
ttle
• M
anag
emen
t of l
ives
tock
•
Con
stru
ctio
n of
stor
age
faci
lity
• C
reat
ion
of a
dvan
ced
cred
it •
Rei
nfor
cem
ent o
f cof
fee
prod
uctio
n 3.
Poo
r con
ditio
n of
road
s •
Volu
ntar
y w
ork
of re
side
nts
• R
ehab
ilita
tion
of ro
ads
• R
ehab
ilita
tion
of
exis
ting
road
s of
B
irem
bo-R
wan
teru
, Kag
ese
-Rus
ozi
8 N
yaru
buye
D
istri
ct
4. P
oor m
anag
emen
t of
fore
sts
• Po
litic
al
will
an
d ed
ucat
iona
l ac
tiviti
es
on
impo
rtanc
e of
woo
ds
• Ex
iste
nce
of m
anpo
wer
• M
aint
enan
ce a
nd m
anag
emen
t of e
xist
ing
fore
sts
• In
crea
se in
pla
ntat
ions

45
1. L
ack
of p
otab
le w
ater
and
ba
d qu
ality
of w
ater
•
Act
ive
mem
bers
in c
harg
e of
wat
er su
pply
•
Com
plet
ed re
sear
ch fo
r wat
er re
sour
ces
• A
dditi
on o
f fau
cets
to e
xist
ing
supp
ly fa
cilit
ies
• D
evel
opm
ent o
f 41
wat
er so
urce
s 2.
Sm
all q
uant
ity o
f ag
ricul
tura
l / li
vest
ock
prod
ucts
• A
num
ber o
f sw
amps
•
Ferti
le so
il •
Act
ive
farm
ers
• Es
tabl
ishm
ent
of m
onito
ring
syst
em f
or a
gric
ultu
re
and
cattl
e ra
isin
g •
Con
stru
ctio
n of
st
ore
shop
to
se
ll ag
ricul
tura
l pr
oduc
ts
3. P
oor c
ondi
tion
of ro
ads
and
gutte
rs fo
r mas
sive
ra
infa
lls
• St
rong
will
of r
esid
ents
•
Con
stru
ctio
n of
road
s and
brid
ges
9 R
ukira
D
istri
ct
4. In
suffi
cien
t num
ber o
f ho
uses
for v
ulne
rabl
e gr
oup
• R
esid
ents
’ vol
unta
ry a
ctiv
ities
in c
omm
unity
•
Pres
ence
of c
onst
ruct
ion
mat
eria
ls
• R
epai
r of h
ouse
s for
377
0 vu
lner
able
per
sons
•
Educ
atio
nal a
ctiv
ities
for w
omen
on
soci
al re
gula
tions
1.
Lac
k of
pot
able
wat
er
• St
rong
will
of r
esid
ents
•
Arr
ange
men
t an
d re
habi
litat
ion
of w
ater
sou
rces
and
ca
nals
•
Reh
abili
tatio
n of
exi
stin
g pu
mpi
ng sy
stem
•
Con
stru
ctio
n of
cis
tern
to c
olle
ct ra
in w
ater
2.
Sm
all q
uant
ity o
f ag
ricul
tura
l / li
vest
ock
prod
ucts
• Av
aila
ble
land
and
ferti
le so
il •
Stro
ng w
ill o
f res
iden
ts
• Ef
fect
ive
and
ratio
nal u
se o
f gra
ssed
are
a •
Adv
ance
d cr
edit
for a
gric
ultu
re
• Pr
otec
tion
and
cons
erva
tion
of so
il •
Trai
ning
on
and
orga
niza
tion
of a
gric
ultu
re a
ctiv
ities
•
Con
stru
ctio
n of
tran
sfor
mat
ion
fact
ory
• C
onst
ruct
ion
of st
orag
e fa
cilit
y 3.
Lac
k of
refo
rest
atio
n •
Avai
labl
e la
nd
for
refo
rest
atio
n (a
lread
y pl
anne
d)
• Pl
anta
tion
and
man
agem
ent o
f for
est
10
Rus
umo
Dis
trict
4. D
iffic
ulty
in
com
mun
icat
ion
• St
rong
will
of r
esid
ents
•
Reh
abili
tatio
n an
d co
nstru
ctio
n of
road
s and
brid
ges
• In
stal
latio
n of
tele
phon
e ne
twor
k
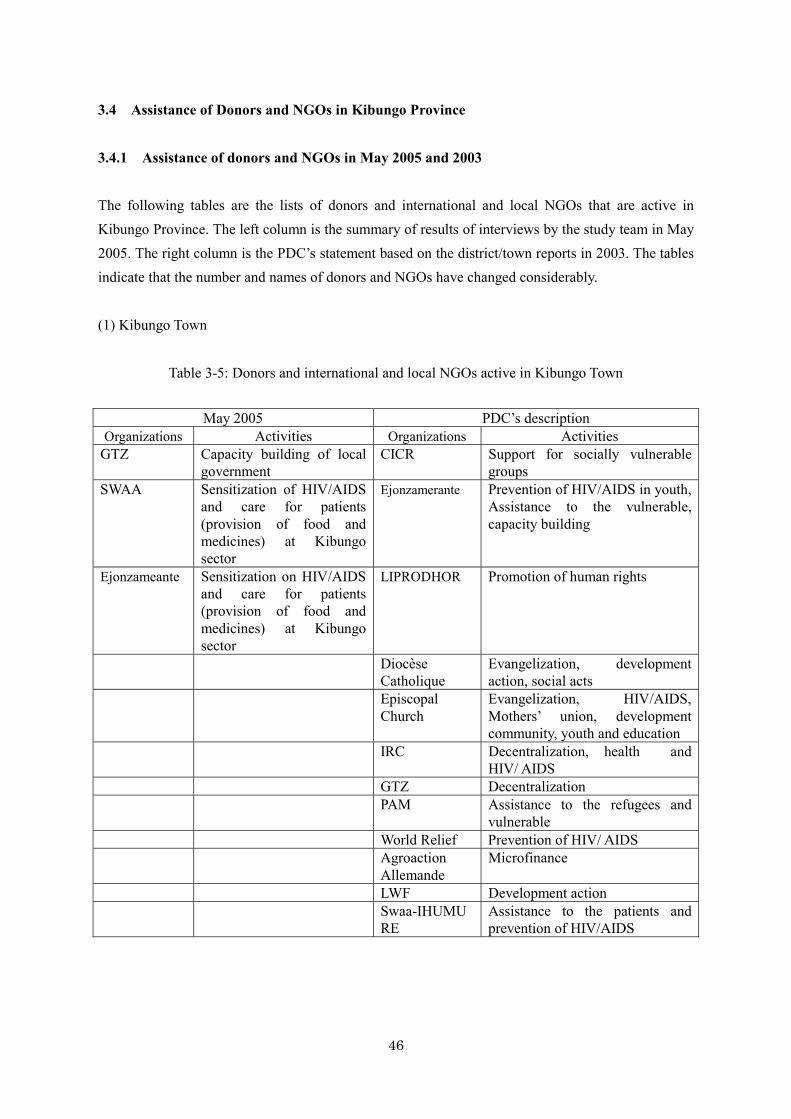
46
3.4 Assistance of Donors and NGOs in Kibungo Province
3.4.1 Assistance of donors and NGOs in May 2005 and 2003 The following tables are the lists of donors and international and local NGOs that are active in Kibungo Province. The left column is the summary of results of interviews by the study team in May 2005. The right column is the PDC’s statement based on the district/town reports in 2003. The tables indicate that the number and names of donors and NGOs have changed considerably. (1) Kibungo Town
Table 3-5: Donors and international and local NGOs active in Kibungo Town
May 2005 PDC’s description Organizations Activities Organizations Activities
GTZ Capacity building of local government
CICR Support for socially vulnerable groups
SWAA Sensitization of HIV/AIDS and care for patients (provision of food and medicines) at Kibungo sector
Ejonzamerante Prevention of HIV/AIDS in youth, Assistance to the vulnerable, capacity building
Ejonzameante Sensitization on HIV/AIDS and care for patients (provision of food and medicines) at Kibungo sector
LIPRODHOR Promotion of human rights
Diocèse Catholique
Evangelization, development action, social acts
Episcopal Church
Evangelization, HIV/AIDS, Mothers’ union, development community, youth and education
IRC Decentralization, health and HIV/ AIDS
GTZ Decentralization PAM Assistance to the refugees and
vulnerable World Relief Prevention of HIV/ AIDS Agroaction
Allemande Microfinance
LWF Development action Swaa-IHUMU
RE Assistance to the patients and prevention of HIV/AIDS

47
(2) Rwamagana Town
Table 3-6: Donors and international and local NGOs active in Rwamagana Town
May 2005 PDC’s description Organizations Activities Organizations Activities
GTZ Decentralization (preparation of PDC, provision of 2 computers and support for demobilized solders)
Rwandese Association for Rural Development (A.R.D.R.)
Anti-illiteracy activities in NYARUSANGE and KIGABIRO sectors; Construction of sector office in NSINDA and MWURIRE sectors
British Embassy
Provision of bicycles and animals for promoting youth in starting business
African Evangelistic Entreprises (AEE)
Paying school tuition of orphans; Vocational training of children; Assistance for AIDS patients
AEE Anti-illiteracy activities and assistance of AIDS patients
World Relief Microfinance for poor women to obtain income
World Relief Microfinance for women (and men)
(3) Cyarubare District
Table 3-7: Donors and international and local NGOs active in Cyarubare District
May 2005 PDC’s description
Organizations Activities Organizations Activities GTZ Decentralization (Training
on finance, provision of 2 computers)
IRC Good governance, Decentralization, development project, capacity building
EU Construction of health center
LWF Development Project
LWF Construction of water supply facilities and support for orphans at Ndego sector
HELPAGE Support for elderly people’s association
ADRA Promotion of agricultural productivity, and establishment of AIDS association (to begin soon)
ARAMET Rural development
GTZ Good governance

48
(4) Kabarondo District
Table 3-8: Donors and international and local NGOs active in Kabarondo District
May 2005 PDC’s description Organizations Activities Organizations Activities CICR Extension of water pipes in
2 cellules in Rusera sector CDF Construction of Kabarondo
market IRC Construction of elementary
school AVODI Support for children from socially
vulnerable group in Ruramera, Cyinzovu, Kabarondo, and Ruyonza sectors
AEE Support of education for orphans, advocacy, and agriculture in Shyogo and Gasogi sectors
MISERCORDI AIDS campaign in Kabarondo sector
SACCA Support of street children in Kabarondo sector
Caritas Construction of Imidugudu, support for children, animal husbandry (goats and cows)

49
(5) Kigarama District
Table 3-9: Donors and international and local NGOs active in Kigarama District
May 2005 PDC’s description Organizations Activities Organizations Activities
GTZ Decentralization (Preparation of PDC, training of leadership, provision of 2 computers)
CDF Infrastructures of all kinds
IRC Extension of existing water supply facilities’ coverage (completed in 2003)
GTZ Decentralization and good governance
RCR Support for orphans (Animal husbandry)
PPPMER Hand craft
PPPMER (government)
Vocational training such as handicraft, sewing, and carpentry; Provision of basic tools, by using CDF
ADECCO Communication
Religious community
Social infrastructures
JUMELAGE RHENENIE PALATINAT
Social infrastructures
PADEBEL Agriculture European
Union Agriculture (swamp development )
Red Cross Street children assistance (ENA)

50
(6) Mirenge District
Table 3-10: Donors and international and local NGOs active in Mirenge District
May 2005 PDC’s description Organizations Activities Organizations Activities
UNCHR Provision of food and daily necessary to refugees
CDF Infrastructure
IDRC Financial support for house construction and provision of daily necessaries of demobilized solders
GTZ Decentralisation and capacity support
AVEGA Health check-up and counseling for widows; School tuition of orphans
PAM (WFP) Food for Work; School feeding project
ACRGMPORE
School tuition and housing provision for orphans
ARAMET Palm tree plantation and lake protection
District Artificial legs, crutch provision and material provision of house construction for handicapped
IRC Health, training of traditional midwives
ASRG MPORE Support to orphans CARITAS
SABM Agriculture, Microfinance
JUMELLAGE Education FAO Telefood project
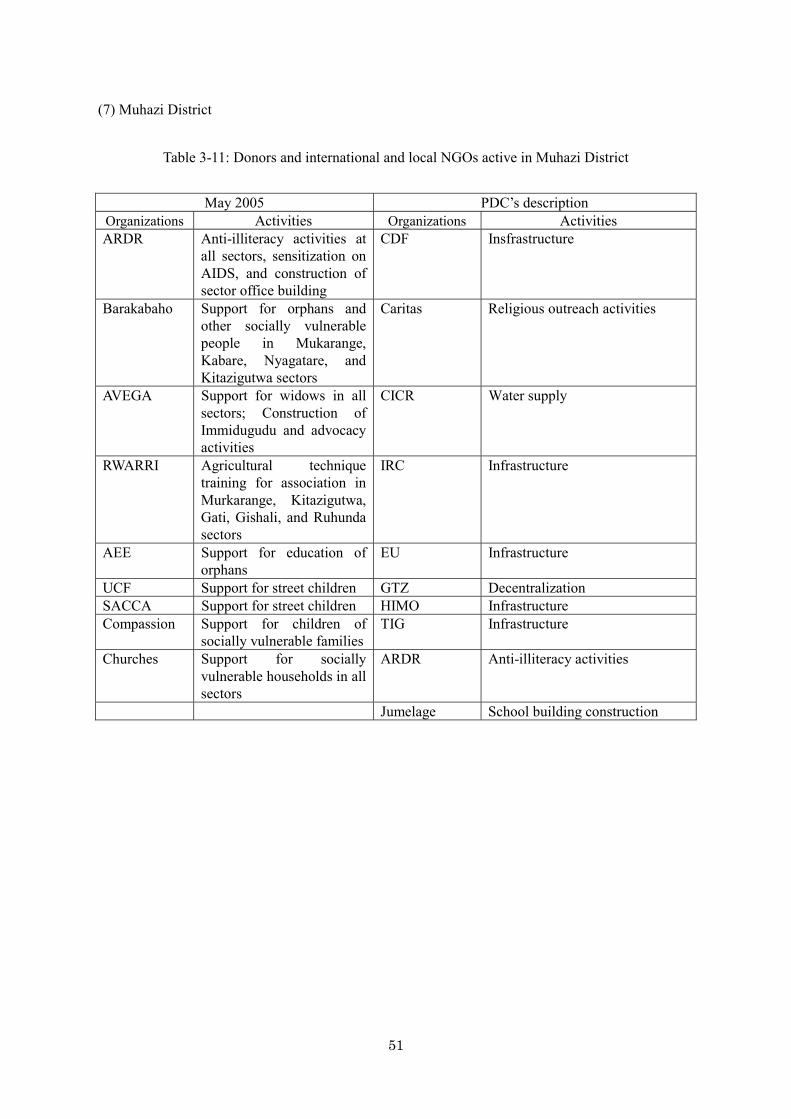
51
(7) Muhazi District
Table 3-11: Donors and international and local NGOs active in Muhazi District
May 2005 PDC’s description Organizations Activities Organizations Activities ARDR Anti-illiteracy activities at
all sectors, sensitization on AIDS, and construction of sector office building
CDF Insfrastructure
Barakabaho Support for orphans and other socially vulnerable people in Mukarange, Kabare, Nyagatare, and Kitazigutwa sectors
Caritas Religious outreach activities
AVEGA Support for widows in all sectors; Construction of Immidugudu and advocacy activities
CICR Water supply
RWARRI Agricultural technique training for association in Murkarange, Kitazigutwa, Gati, Gishali, and Ruhunda sectors
IRC Infrastructure
AEE Support for education of orphans
EU Infrastructure
UCF Support for street children GTZ Decentralization SACCA Support for street children HIMO Infrastructure Compassion Support for children of
socially vulnerable familiesTIG Infrastructure
Churches Support for socially vulnerable households in all sectors
ARDR Anti-illiteracy activities
Jumelage School building construction

52
(8) Nyarubuye District
Table 3-12: Donors and international and local NGOs active in Nyarubuye District
May 2005 PDC’s description Organizations Activities Organizations Activities
GTZ Decentralization, good governance, capacity building, project formulation
CDF Infrastructure
LWF Tree planting in Murama, Giseni and Myabitare sectors
GTZ Decentralization and capacity support
PAM (WFP, World Food Programme)
Food shortage (Road construction by Food for Work)
LWF Environnement
IRC Training of midwifes EU Infrastructure African Development Bank
Rehabilitation of health center with its water supply system
HIMO Infrastructure
Caritas Support for socially vulnerable groups
Twinning/Jumelage (HEIDSHEIM)
Socioeconomic Infrastructure
SWAA Awareness building of AIDS
RSSP Agriculture and livestock
ARAMA Project preparation (Technical survey for project formulation)
PADEBL Intensive livestock
AVEDA Assistance for socially vulnerable groups (shelter construction)
RWARRI Viabilization
IRC Health and private press Religious
Bodies Social assistance
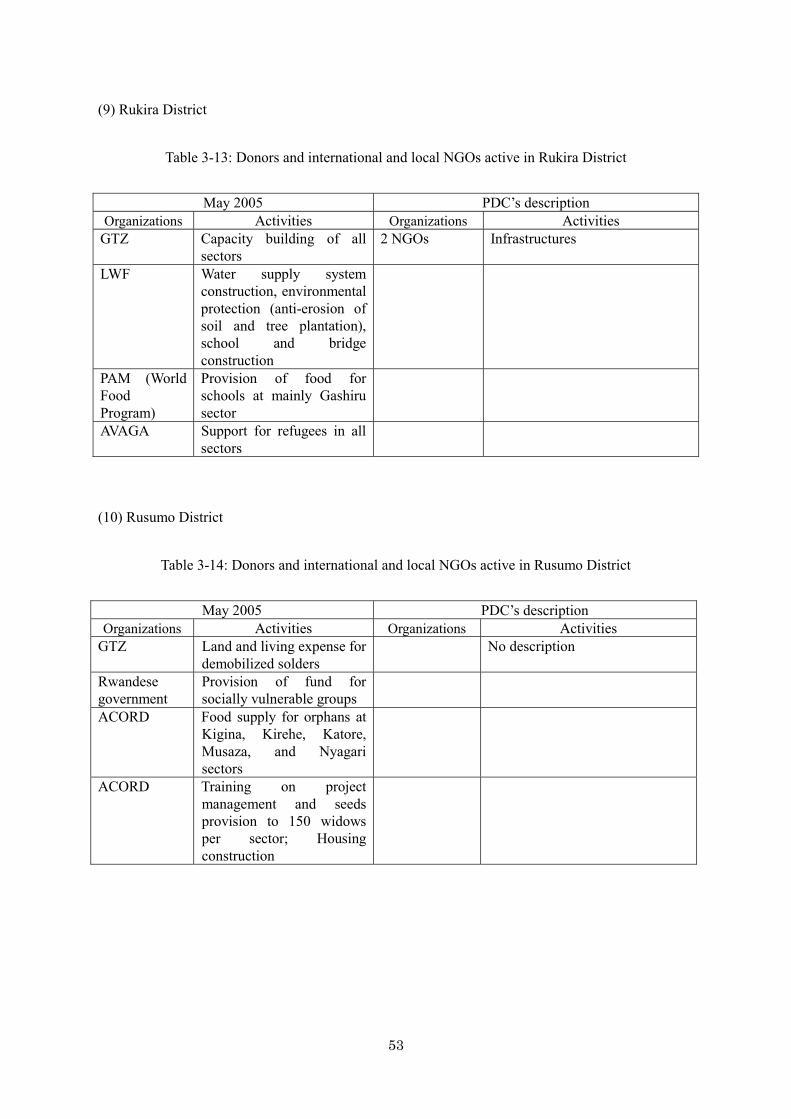
53
(9) Rukira District
Table 3-13: Donors and international and local NGOs active in Rukira District
May 2005 PDC’s description Organizations Activities Organizations Activities
GTZ Capacity building of all sectors
2 NGOs Infrastructures
LWF Water supply system construction, environmental protection (anti-erosion of soil and tree plantation), school and bridge construction
PAM (World Food Program)
Provision of food for schools at mainly Gashiru sector
AVAGA Support for refugees in all sectors
(10) Rusumo District
Table 3-14: Donors and international and local NGOs active in Rusumo District
May 2005 PDC’s description Organizations Activities Organizations Activities
GTZ Land and living expense for demobilized solders
No description
Rwandese government
Provision of fund for socially vulnerable groups
ACORD Food supply for orphans at Kigina, Kirehe, Katore, Musaza, and Nyagari sectors
ACORD Training on project management and seeds provision to 150 widows per sector; Housing construction

54
3.4.2 Coordination of the activities of donors and NGOs (1) National level There are umbrella organizations of local NGOs based on their activity areas such as human rights and rural development. From Kibungo province, ARDR, Rwarri, Profemme, and Ejonzameante join an umbrella organization of rural development, CCOAIB (Conseil de Consultation de Organisation auf Initiative de base). CCOAIB started its activities before the civil war in 1994 and approximately 30 NGOs hold a meeting every three months. The major topics of the meetings are as follows: security measures, trends in development policy of the central government, activities of each NGO, and difficulties that they face. (2) Provincial level A NGO that plans to work in Kibungo Province first receives a one-year work permit from the good governance and political administration unit of the Kibungo provincial office. Then, it submits its activity plan, budget, and the work permit to the respective district / town. Once provincial and district/town offices are convinced that the NGO can extend its work period, they endorse the NGO for receiving a formal work permit from the central government. In order to recruit donors and NGOs to work in the Province, the executive secretary of the Provincial office invites prospective donors and NGOs for meetings to introduce activities in Kibungo province and request their support. Donors and NGOs check PDC and discuss with specific districts/towns directly on their intervention in the district/town. The Province holds a meeting every 3 months with donors and NGOs active in the Province to discuss the progress of their activities. Headed by the vice provincial governor, the meeting is called the NGO forum.
(3) District and town level In order to request support of donors and NGOs, a district or town sometimes directly brings a project proposal, i.e., PDC, to prospective donors and NGOs. If donors and NGOs issue offers, a district CDC decides which sector(s) would be the preferable target area. In this case, a district CDC and a sector CDC ensure that opinions at the sector level will be taken into account. A district or town can be the counterpart member and formally sign the contract for the project if a donor/NGO agrees. Once a district or town is selected as the project target area, it prepares a quarterly project implementation plan and follows up on the progress. It requests a NGO to submit a monthly monitoring sheet and prepares reports to the provincial office based on the monitoring sheet. District officers visit the project site every one to four months, depending on the project’s progress. Project evaluation is done at the end of phases by technicians at district/town office and local consultants. (4) Sector and cellule levels Sector and cellule CDC members visit the project site frequently for monitoring and evaluation. The

55
following are the challenges that they face in conducting project monitoring and evaluation:
• Some Donors and NGOs do not inform districts / towns of the project activities and budget beforehand. They come and implement projects by themselves and then leave.
• Donors and NGOs ask for support from sector representatives when they conduct project formulation surveys. But some of them do not take action and produce no subsequent outputs. Sector representatives have a hard time explaining the situation to local people.
• Some districts do not sufficiently coordinate activities with donors and NGOs. They just distribute copies of PDC to major donors when they need assistance in a specific area.

56
3.4.3 Summary of donors and NGOs active in Rwanda (1) Amount of assistance and area of intervention for each country
Table 3-15: Amount of assistance and area of intervention for each country
Provision in US $ Provision Plan Approved amount By the end of
2002 2003 2004 2005 2007
US $ % In US $
% In US $
% In US $
In US $
In US $
NATIONAL PROGRAM
2061.47
100%
705.2 100%
319.64
100% 454.67 306.77 84.23
GERMANY 67.62 3.28
% 39.92 5.66
% 4.75 1.48% 7.17 0.00 0.00
On environment protection on water supply and sanitation, on youth and education. AUSTRIA 5.11 0.25
% 0.00 0.00
% 1.53 0.48% 2.35 0.00 0.00
On justice(GACACA) and water supply BELGIUM 153.75 7.46
% 56.33 7.99
% 18.06 5.65% 30.82 19.33 0.00
On support of public administration services, justice, energy (Rehabilitation of electric line Kabarondo-Kiziguro)
CANADA 25.52 1.24%
10.66 1.151%
6.31 1.97% 0.00 0.00 0.00
On support of public administration services, habitat and social infrastructures on youth and social protection
CHINA 8.81 0.43%
3.30 0.47%
3.51 1.10% 0.00 0.00 0.00
On support of public administration services (construction of conference hall), agriculture, health and education
FRANCE 21.07 1.02%
17.63 2.50%
4.65 1.46% 7.30 5.15 0.00
On culture, on health and education, e.g., school opening and teaching of French ITALY 4.63 0.22
% 0.24 0.03
% 1.26 0.39% 1.04 1.01 0.00
On agriculture and rural development in general. The majority of activities are executed by NGOs or other execution agencies. LUXEMBU
RG 11.78 0.57
% 8.63 1.22
% 2.63 0.82% 0.07 0.00 0.00
On rural development (development of Bugesera), youth and health. NETHERLA
NDS 120.61 5.85
% 81.33 11.53
% 19.82 6.20% 18.027 14.50 0.00
On social infrastructure, support of public administration services, justice and rural development in general
Source: Bureau Central des Investissements Publics et des Financements Extérieurs (CEPEX), EXTERNAL AID MEMORY ON RWANDA, VOLUME II

57
(2) Water supply projects and donor agencies in Rwanda According to MINITERE, there are 16 national programs of water supply in Rwanda. (Please see the attachment). Most of the programs receive financial support from donor agencies such as the World Bank, the African Development Bank, EU, KfW, and the Austrian government. The Rwandese government executes a self-financed project in Mukingi area. However, there are few national programs of water supply in Kibungo province. Thus NGOs conduct small water supply projects in the province. In addition to such water supply projects, there is an international cooperation scheme called New Partnership of African Development by MINITERE of 12 African countries. The African Development Bank supports it financially and research has started in 5 countries.

Chapter 4
Present Conditions and Issues in Kibungo Province
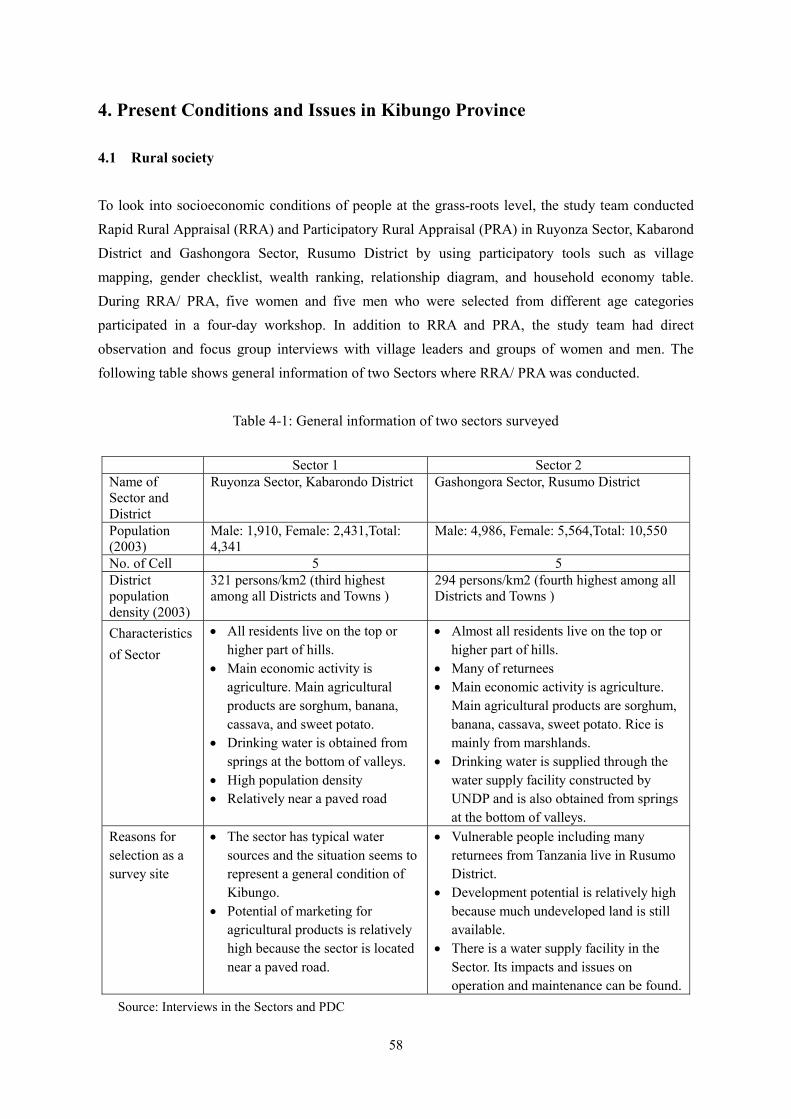
58
4. Present Conditions and Issues in Kibungo Province
4.1 Rural society To look into socioeconomic conditions of people at the grass-roots level, the study team conducted Rapid Rural Appraisal (RRA) and Participatory Rural Appraisal (PRA) in Ruyonza Sector, Kabarond District and Gashongora Sector, Rusumo District by using participatory tools such as village mapping, gender checklist, wealth ranking, relationship diagram, and household economy table. During RRA/ PRA, five women and five men who were selected from different age categories participated in a four-day workshop. In addition to RRA and PRA, the study team had direct observation and focus group interviews with village leaders and groups of women and men. The following table shows general information of two Sectors where RRA/ PRA was conducted.
Table 4-1: General information of two sectors surveyed
Sector 1 Sector 2 Name of Sector and District
Ruyonza Sector, Kabarondo District Gashongora Sector, Rusumo District
Population (2003)
Male: 1,910, Female: 2,431,Total: 4,341
Male: 4,986, Female: 5,564,Total: 10,550
No. of Cell 5 5 District population density (2003)
321 persons/km2 (third highest among all Districts and Towns )
294 persons/km2 (fourth highest among all Districts and Towns )
Characteristics of Sector
• All residents live on the top or higher part of hills.
• Main economic activity is agriculture. Main agricultural products are sorghum, banana, cassava, and sweet potato.
• Drinking water is obtained from springs at the bottom of valleys.
• High population density • Relatively near a paved road
• Almost all residents live on the top or higher part of hills.
• Many of returnees • Main economic activity is agriculture.
Main agricultural products are sorghum, banana, cassava, sweet potato. Rice is mainly from marshlands.
• Drinking water is supplied through the water supply facility constructed by UNDP and is also obtained from springs at the bottom of valleys.
Reasons for selection as a survey site
• The sector has typical water sources and the situation seems to represent a general condition of Kibungo.
• Potential of marketing for agricultural products is relatively high because the sector is located near a paved road.
• Vulnerable people including many returnees from Tanzania live in Rusumo District.
• Development potential is relatively high because much undeveloped land is still available.
• There is a water supply facility in the Sector. Its impacts and issues on operation and maintenance can be found.
Source: Interviews in the Sectors and PDC

59
4.1.1 Transformations of rural society More than a decade has past since the genocide in 1994. During this decade rural society in Kibungo Province has been transformed drastically. This transformation resulted from two major factors: imidugudu and decentralization. (1) Imidugudu The Rwandese government has started the imidugudu program in 1997. The purposes of this program are to establish imidugudu, village, to accelerate grouped resettlement for residents who are scattered in rural areas and large number of returnees, and to provide for them more social benefits such as infrastructure, education, and health. At the beginning of this program, the Provincial government proposed it to residents, and then locations of new settlements were decided at Cell level through discussions with residents. Ordinary residents were able to choose imidugudu by themselves and many vulnerable people such as orphans and widows were invited to special imidugudu where necessary infrastructure and individual houses were provided by donors and NGOs. Many imidugudu were established at the upper part of hills because roads and sufficient free government land were available there. The middle to bottom parts of hills were already occupied by individuals because those places are very suitable for farmland. This was also a critical factor in establishing imidugudu at the top of hills. Since one of the purposes of establishing imidugudu was to receive and resettle returnees, receiving returnees and distributing land including house lot and farmland were actively made at the earlier stage of the program. A house lot of about 20m X 30m was distributed to each household inside the imidugudu. The size of house lot is almost the same throughout the country. Ownership of farmland belonged to previous owners, thus farmers who owned farmland before the imidugudu era are also able to cultivate the same land at present. However, one who has been a refugee since the 1950s and 1960s could not get access to farmland because usually other persons took over his/her land while he/she has stayed in a foreign country for more than 40 years. In this case, present and previous owners discuss and divide the land into two equal portions to share. If areas of shared portions are not enough to sustain their families, person who owns large land contributes piece of land to those two owners so that they can reconcile. Kibungo Province has achieved outstanding progress on grouped settlement. Approximately 90% of residents lives in imidugudu, and this is the highest percentage among all Provinces. The team interviewed officials of Districts/ Towns and the workshop participants to clarify advantages and disadvantages of imidugudu.
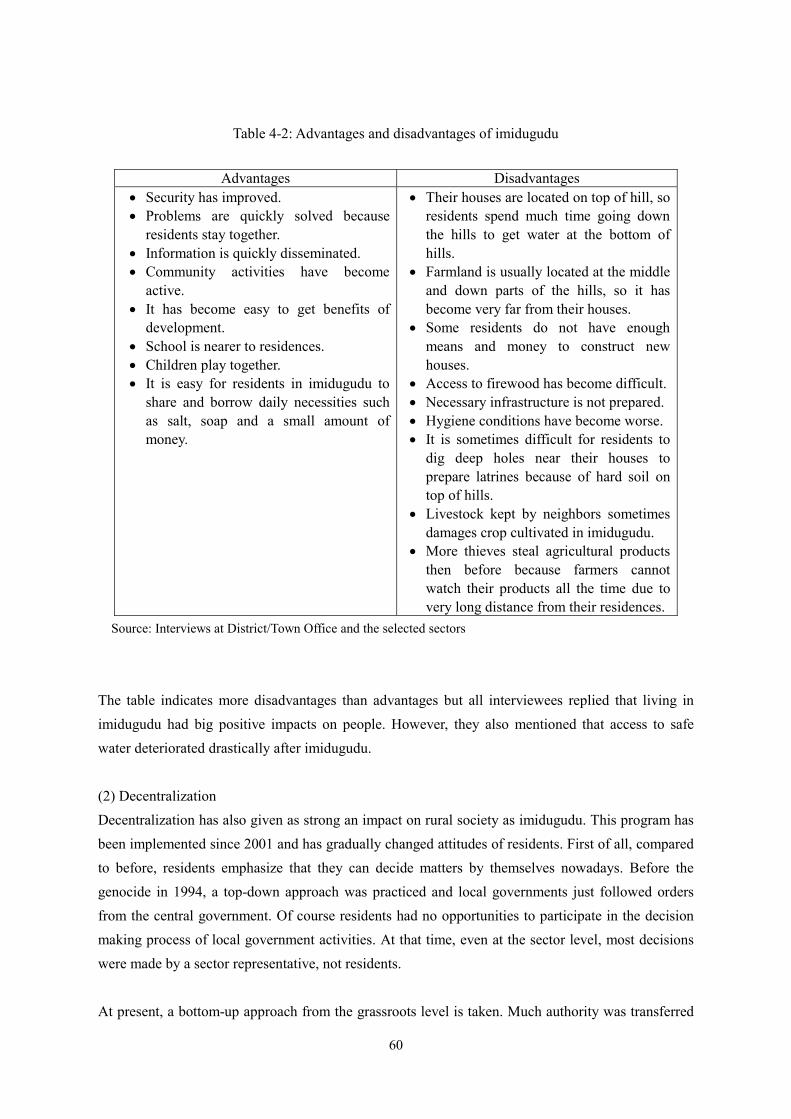
60
Table 4-2: Advantages and disadvantages of imidugudu
Advantages Disadvantages
• Security has improved. • Problems are quickly solved because
residents stay together. • Information is quickly disseminated. • Community activities have become
active. • It has become easy to get benefits of
development. • School is nearer to residences. • Children play together. • It is easy for residents in imidugudu to
share and borrow daily necessities such as salt, soap and a small amount of money.
• Their houses are located on top of hill, so residents spend much time going down the hills to get water at the bottom of hills.
• Farmland is usually located at the middle and down parts of the hills, so it has become very far from their houses.
• Some residents do not have enough means and money to construct new houses.
• Access to firewood has become difficult.• Necessary infrastructure is not prepared. • Hygiene conditions have become worse. • It is sometimes difficult for residents to
dig deep holes near their houses to prepare latrines because of hard soil ontop of hills.
• Livestock kept by neighbors sometimes damages crop cultivated in imidugudu.
• More thieves steal agricultural products then before because farmers cannot watch their products all the time due to very long distance from their residences.
Source: Interviews at District/Town Office and the selected sectors
The table indicates more disadvantages than advantages but all interviewees replied that living in imidugudu had big positive impacts on people. However, they also mentioned that access to safe water deteriorated drastically after imidugudu. (2) Decentralization Decentralization has also given as strong an impact on rural society as imidugudu. This program has been implemented since 2001 and has gradually changed attitudes of residents. First of all, compared to before, residents emphasize that they can decide matters by themselves nowadays. Before the genocide in 1994, a top-down approach was practiced and local governments just followed orders from the central government. Of course residents had no opportunities to participate in the decision making process of local government activities. At that time, even at the sector level, most decisions were made by a sector representative, not residents. At present, a bottom-up approach from the grassroots level is taken. Much authority was transferred
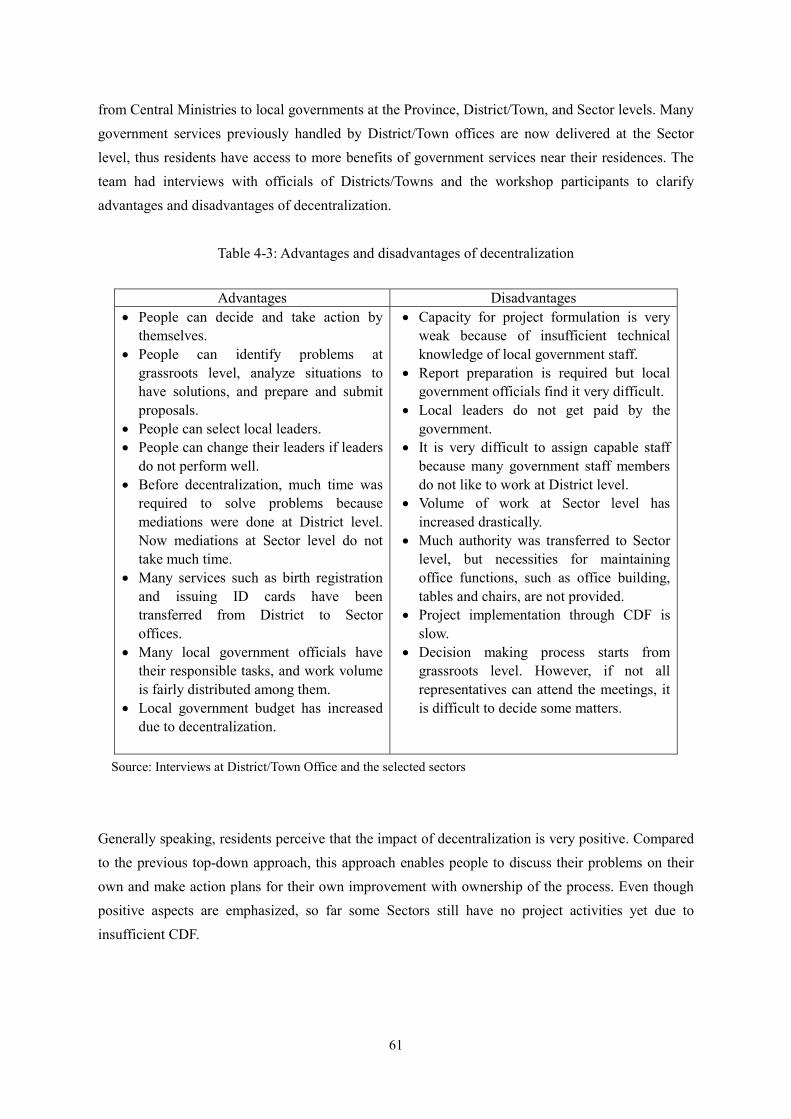
61
from Central Ministries to local governments at the Province, District/Town, and Sector levels. Many government services previously handled by District/Town offices are now delivered at the Sector level, thus residents have access to more benefits of government services near their residences. The team had interviews with officials of Districts/Towns and the workshop participants to clarify advantages and disadvantages of decentralization.
Table 4-3: Advantages and disadvantages of decentralization
Advantages Disadvantages • People can decide and take action by
themselves. • People can identify problems at
grassroots level, analyze situations to have solutions, and prepare and submit proposals.
• People can select local leaders. • People can change their leaders if leaders
do not perform well. • Before decentralization, much time was
required to solve problems because mediations were done at District level. Now mediations at Sector level do not take much time.
• Many services such as birth registration and issuing ID cards have been transferred from District to Sector offices.
• Many local government officials have their responsible tasks, and work volume is fairly distributed among them.
• Local government budget has increased due to decentralization.
• Capacity for project formulation is very weak because of insufficient technical knowledge of local government staff.
• Report preparation is required but local government officials find it very difficult.
• Local leaders do not get paid by the government.
• It is very difficult to assign capable staff because many government staff members do not like to work at District level.
• Volume of work at Sector level has increased drastically.
• Much authority was transferred to Sector level, but necessities for maintaining office functions, such as office building, tables and chairs, are not provided.
• Project implementation through CDF is slow.
• Decision making process starts from grassroots level. However, if not all representatives can attend the meetings, it is difficult to decide some matters.
Source: Interviews at District/Town Office and the selected sectors
Generally speaking, residents perceive that the impact of decentralization is very positive. Compared to the previous top-down approach, this approach enables people to discuss their problems on their own and make action plans for their own improvement with ownership of the process. Even though positive aspects are emphasized, so far some Sectors still have no project activities yet due to insufficient CDF.

62
4.1.2 Living conditions in imidugudu The living conditions in the two surveyed Sectors were relatively severe. From the observation on general conditions of Kibungo, these two Sectors are not special cases and it is fair to assume that other areas of Kibungo have almost the same conditions as the two Sectors. However, since very limited areas were intensively surveyed, findings from the surveys cannot be generalized easily. Although the survey results do not represent the entire Province, the findings from the surveys may provide some insights on conditions of rural life in Kibungo. (1) Meals of residents Ordinary people take meals twice a day, lunch at noon and dinner in the evening around 19:00. Main staple food is “Umutsuima,” stiff porridge, made from cassava, maize, or sorghum flower. Other staples are banana, potato, sweet potato, and rice. Rice is the favorite staple among them, but it is served to guests because it is very expensive for ordinary people in rural areas. Sorghum is also utilized as a material of local brewing. Two Sectors seem to have rich harvests during two harvesting seasons a year but the stock of agricultural products becomes scarce from March to May before the first harvesting season. In this period, members of poor households can afford to eat only once a day and extremely poor people sometimes face hunger. Families with many children consume their harvest quickly. As a result, they have to seek opportunities to work for big land owners to earn daily wages. (2) Access to water At the participatory workshop, all the participants from two Sectors have indicated that access to water is the most serious problem in their communities. In Ruyonza Sector, even people who live near a water source usually spend 2 hours walking 2 km to reach a water source. People who live far from a source spend more than 5 hours on foot or 3 hours by bicycle in the distance of 8 km. Thus some people, especially those who live far from water sources, cannot afford to get safe water every day. They frequently use dirty stagnant water from puddles or marshlands. As a result they sometimes get diarrhea and skin diseases. Even for dirty water sources, one participant has mentioned that she has to walk 3 hours in the distance of 3 km to get there.
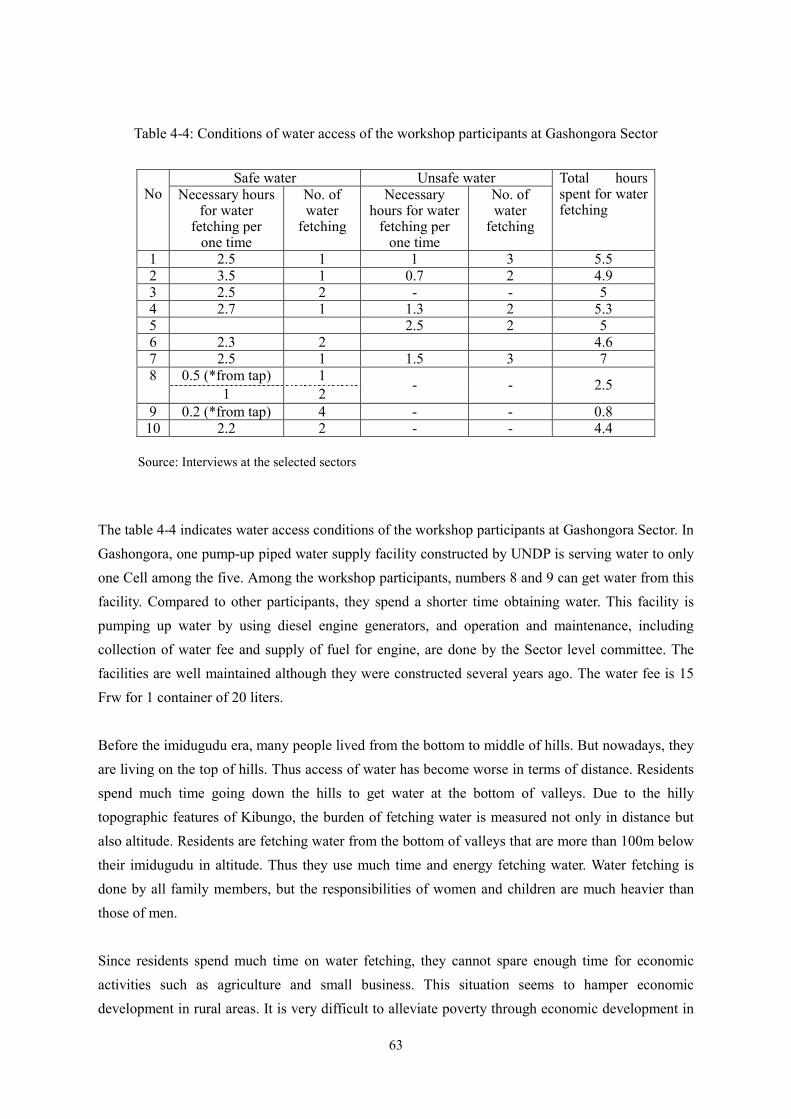
63
Table 4-4: Conditions of water access of the workshop participants at Gashongora Sector
Source: Interviews at the selected sectors The table 4-4 indicates water access conditions of the workshop participants at Gashongora Sector. In Gashongora, one pump-up piped water supply facility constructed by UNDP is serving water to only one Cell among the five. Among the workshop participants, numbers 8 and 9 can get water from this facility. Compared to other participants, they spend a shorter time obtaining water. This facility is pumping up water by using diesel engine generators, and operation and maintenance, including collection of water fee and supply of fuel for engine, are done by the Sector level committee. The facilities are well maintained although they were constructed several years ago. The water fee is 15 Frw for 1 container of 20 liters. Before the imidugudu era, many people lived from the bottom to middle of hills. But nowadays, they are living on the top of hills. Thus access of water has become worse in terms of distance. Residents spend much time going down the hills to get water at the bottom of valleys. Due to the hilly topographic features of Kibungo, the burden of fetching water is measured not only in distance but also altitude. Residents are fetching water from the bottom of valleys that are more than 100m below their imidugudu in altitude. Thus they use much time and energy fetching water. Water fetching is done by all family members, but the responsibilities of women and children are much heavier than those of men. Since residents spend much time on water fetching, they cannot spare enough time for economic activities such as agriculture and small business. This situation seems to hamper economic development in rural areas. It is very difficult to alleviate poverty through economic development in
Safe water Unsafe water No Necessary hours
for water fetching per
one time
No. of water
fetching
Necessary hours for water
fetching per one time
No. of water
fetching
Total hours spent for water fetching
1 2.5 1 1 3 5.5 2 3.5 1 0.7 2 4.9 3 2.5 2 - - 5 4 2.7 1 1.3 2 5.3 5 2.5 2 5 6 2.3 2 4.6 7 2.5 1 1.5 3 7
0.5 (*from tap) 1 8 1 2 - - 2.5
9 0.2 (*from tap) 4 - - 0.8 10 2.2 2 - - 4.4

64
rural areas without fulfilling basic people’s needs such as access to enough safe water. Moreover, water shortage is very serious at public facilities such as schools and health centers. School children have to bring small containers with water to drink or wash their hands. Family members of patients are also voluntarily bringing water to health centers. Water harvesting techniques, especially rain water harvesting by roof and water tank, are not usually practiced due to the lack of facilities. Thus it is necessary to construct water tanks for rain water harvesting. (3) Access to firewood Access to firewood is a serious problem. Residents spend much time collecting firewood. All family members undertake the task. However, like in water fetching, women and children bear much heavier responsibilities than men. The necessary time for collecting firewood varies greatly depending on accessibility of forests. Deforestation is very serious in Kibungo Province. More than 90% of the residents in Kibungo Province live in imidugudu nowadays. During the establishment of imidugudu, many residents constructed their new houses by using much timber harvested from forests surrounding their imidugudu. Demand for firewood is also very high because more than 95% of the population in Kibungo Province relies on this energy source for cooking. Due to these two reasons, deforestation occurred rapidly. To stop deforestation, the Central government implemented a policy of prohibiting residents from cutting trees inside the government land. Even in private forests, residents cannot harvest trees without permission from local governments. However, residents without access to enough firewood in their land collect firewood illegally from government forests. Deforestation causes soil degradation. Some areas in Kibungo have bare soil with no vegetation. These areas are left alone. If such areas expand, water holding capacity of soil will probably decrease in the long run. Thus degradation of forests will have a serious negative impact on spring water sources in Kibungo as well as firewood production. (4) Hygiene conditions in imidugudu Many residents feel that hygiene conditions of imidugudu are worse than those before imidugudu. Many people in imidugudu have pit latrines but most of the latrines do not meet good hygienic standards. Although the recommended depth of pit latrine is 9 to 10 m from the hygienic point of view, people cannot dig deep holes for the latrines because the soil at the top of hills is much harder than the one at the bottom of valleys where they lived before. In addition, those latrines are constructed without a cover on the top so that sewage can be seen easily from the top.
65
Under such conditions, there are many flies in imidugudu and hygienic conditions are far from satisfactory. During the rainy season, residents frequently suffer from diarrhea probably due to two main reasons. One is that the quality of water from unprotected sources deteriorates because muddy surface water flows into these sources after a rain. The other is that the number of flies rapidly increases during the rainy season, and flies can go in and out from the latrines freely and contaminate foods cooked and served in households. Before the establishment of imidugudu, residents were able to construct latrines far away from their residences. However, they now end up constructing latrines near their houses because they were allocated only limited land, usually 20m X 30m, for their houses. Some people are also keeping livestock inside their house lots. Therefore, not much hygienic improvement seems to have materialized through construction of latrines by only a few residents. It is critical for all residents to take action simultaneously to improve hygienic conditions of a whole imidugudu. (5) Vulnerable people in imidugudu Wealth ranking was made through the participatory workshop. The participants discussed stratification of their imidugudu in terms of economic status. The table 4-5 shows the result in Ruyonza Sector.
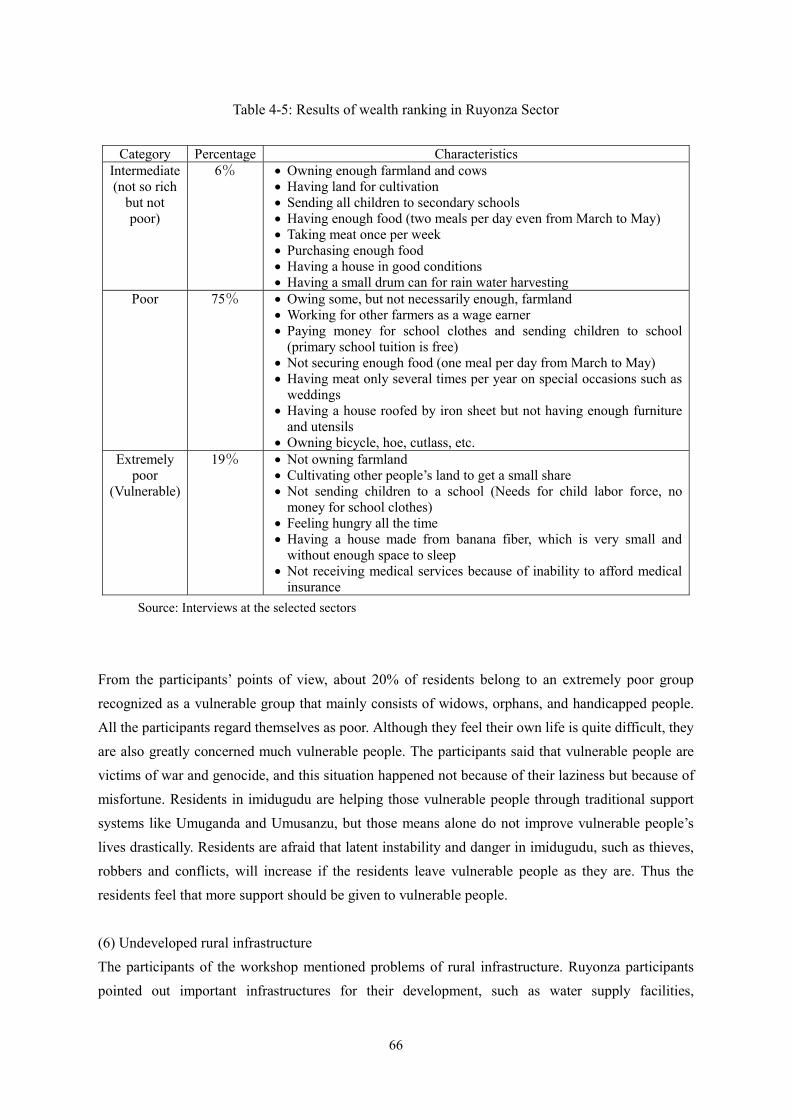
66
Table 4-5: Results of wealth ranking in Ruyonza Sector
Category Percentage Characteristics Intermediate (not so rich
but not poor)
6% • Owning enough farmland and cows • Having land for cultivation • Sending all children to secondary schools • Having enough food (two meals per day even from March to May) • Taking meat once per week • Purchasing enough food • Having a house in good conditions • Having a small drum can for rain water harvesting
Poor 75% • Owing some, but not necessarily enough, farmland • Working for other farmers as a wage earner • Paying money for school clothes and sending children to school
(primary school tuition is free) • Not securing enough food (one meal per day from March to May) • Having meat only several times per year on special occasions such as
weddings • Having a house roofed by iron sheet but not having enough furniture
and utensils • Owning bicycle, hoe, cutlass, etc.
Extremely poor
(Vulnerable)
19% • Not owning farmland • Cultivating other people’s land to get a small share • Not sending children to a school (Needs for child labor force, no
money for school clothes) • Feeling hungry all the time • Having a house made from banana fiber, which is very small and
without enough space to sleep • Not receiving medical services because of inability to afford medical
insurance Source: Interviews at the selected sectors
From the participants’ points of view, about 20% of residents belong to an extremely poor group recognized as a vulnerable group that mainly consists of widows, orphans, and handicapped people. All the participants regard themselves as poor. Although they feel their own life is quite difficult, they are also greatly concerned much vulnerable people. The participants said that vulnerable people are victims of war and genocide, and this situation happened not because of their laziness but because of misfortune. Residents in imidugudu are helping those vulnerable people through traditional support systems like Umuganda and Umusanzu, but those means alone do not improve vulnerable people’s lives drastically. Residents are afraid that latent instability and danger in imidugudu, such as thieves, robbers and conflicts, will increase if the residents leave vulnerable people as they are. Thus the residents feel that more support should be given to vulnerable people. (6) Undeveloped rural infrastructure The participants of the workshop mentioned problems of rural infrastructure. Ruyonza participants pointed out important infrastructures for their development, such as water supply facilities,
67
classrooms for primary school, rural roads, storage facilities for agricultural products, and a simple meeting place with roof for Gachacha. In Gashongora, the participants mentioned water supply facilities, classrooms for primary school, rural roads, and bridges. Among their requests, water supply facilities and school classrooms are the highest priority. Water matters are explained in the previous sections. Regarding classrooms, a school fee of primary school has been free since 2003, thus many children can go to school. This brought about a rapid increase in the number of pupils in primary schools. Here is an indication of the extent of the classroom problem. In Ruyonza Sector, 60 pupils studied in a classroom before 2003; now 120 pupils are in a classroom of the same size. On the other hand, rural roads are also a serious issue in rural economic development. Some rural roads in Ruyonza Sector are impassable for about one week after a heavy rain. Thus trucks for transporting agricultural products cannot reach some imidugudu. Under such circumstances, farmers cannot cultivate perishable crops such as tomato, even though they are very profitable.
4.1.3 Rural economy (1) Household economy of a typical family in imidugudu Economic activities in rural areas seem to be more stagnant than the team anticipated. Most agricultural products are for home consumption and only a small amount is sold to get cash income. A household economy survey through a participatory approach during the workshop also proved the abovementioned economic stagnation. The household economy survey, at first, clarified through discussion with participants conditions of a typical family in their area. Then, the participants discussed income and expenditure of a model household. The table 4-6 shows the result of Gashongora Sector that indicates the following characteristics of a model household: 1) belonging to the poor category mentioned in wealth ranking; 2) having seven family members, i.e., parents with five young children; and 3) owning 0.2 to 0.3 ha of farmland. The survey just focused on cash flow only to simplify its contents.

68
Table 4-6: Typical household economy in Gashongora Sector
1 2 3 4 5 6 7 8 9 10 11 12Sorghum 2,500 2,500Cassava 5,000 5,000Beans 3,000 3,000 6,000Goat 3,500 3,500Chicken 2,000 2,000Duck 1,000 1,000Labor 2,900 2,900 2,900 2,900 2,900 2,900 2,900 2,900 2,900 2,900 3,000 3,000 35,000
Total 5,900 2,900 6,400 2,900 2,900 8,400 5,900 2,900 2,900 2,900 3,000 8,000 55,000
Clothing 5,000 5,000Shoes (Sandal) 500 500Soap 40 40 40 40 40 40 40 40 40 40 50 50 500Skin oil 40 40 40 40 40 40 40 40 40 40 50 50 500Food (staple such as cassava, sorghum) 1,000 1,000 1,000 1,000 4,000Beans 1,000 1,000 1,000 1,000 4,000Salt, oil, etc.(not sugar) 380 380 380 380 380 380 370 370 370 370 370 370 4,500Sorghum beer and juice, banana beer 500 500 500 500 500 500 500 500 500 500 500 500 6,000Tobacco 80 80 80 90 90 90 90 80 80 80 80 80 1,000Water 375 375 375 375 375 375 375 375 375 375 375 375 4,500Cooking utensils 290 290 290 290 290 290 290 300 300 290 290 290 3,500Education 125 125 125 125 125 125 125 125 125 125 125 125 1,500Medication 125 125 125 125 125 7,125 125 125 125 125 125 125 8,500Agricultural input (seeds, fertilizer, etc.) 2,000 2,000Farm equipments & implements 250 250 250 250 250 250 250 250 250 250 250 250 3,000Renting farm plots 2,000 2,000Religious offerings 50 50 40 40 40 40 40 40 40 40 40 40 500Travel expense 165 165 165 165 170 170 170 170 165 165 165 165 2,000Penalties & prosecution 50 50 40 40 40 40 40 40 40 40 40 40 500Contribution & donation 80 80 80 80 80 80 90 90 90 90 80 80 1,000Umusanzu 80 80 80 80 80 80 90 90 90 90 80 80 1,000Total 2,630 2,630 4,610 4,620 2,625 9,625 7,635 2,635 4,630 6,620 4,620 3,120 56,000
Total
Expenditure
Income
ItemsMonth
Source: Interviews in the selected sectors * If the participants were unable to calculate monthly expenditure, they cited annual expenditure and then amount was almost equally distributed to each month. The exchange rate is US$1 = 570 Frw as of May 2005. The first finding from the survey is that the typical household in Gashongora is categorized as subsistence household economy. Cash flow is quite small and the number of income sources is also at a minimum. The study team indicated 28 possible income sources, but the participants mentioned only 7 income sources. Most products are consumed by family members. However, in March and April, they purchased staple food. That means that they are not even self-sufficient. The interviews also showed such tendency, so it is fair to say that this survey result is indicative of the reality of a majority of the population in Gashongora. To overcome the hunger period from March to May, some of the households that own livestock sell them to earn cash income. Some tried to harvest unripe potatoes and vegetables to survive this period. Since formal and informal rural credit sources are very limited, few residents have access to cash except through the system established by themselves such as Ibibina, which is explained later. The Ruyonza Sector survey shows a slightly different situation. They have more income than people in Gashongora because they are cultivating coffee and keep more livestock than in Gashongora. Cash

69
flow from cash crop and livestock becomes a buffer against hunger and contributes to ensuring food security. (2) Agriculture The results of the household economy survey indicate that economic activities in rural areas are heavily dependent on agriculture. The figure below is a typical seasonal calendar of Ruyonza Sector.
Rainy seasonSorghum ○ □
○
○
Kidney beans/ peas (same varieties bothrainy and dry seasons) ○ □ ○ □
Maize ○ □
Banana (Harvesting after 1 to 1.5 yearsfrom planting)
□ □ □ □
Irish potato (Two varieties, each for rainyand dry seasons ▯ ○ □ ○ ▯
△ □
□ △
○ □
□ ○
Cassava(Harvesting after 1 to 2 years from planting)
Sweet potato (Several varieties)
Groundnuts
○:Seeding △:Transplanting □:Harvesting
9 10 11 12Month
1 2 3 4 5 6 7 8
Possible to harvest from next year January
Possible to harvest from next year September
Much harvest from July to September
Source: Interviews in the selected sectors
Figure 4-1: Typical seasonal calendar in Ruyonza Sector
There are two main cultivation seasons corresponding to two rainy seasons. The first cultivation season, from January to May, is for main staples such as sorghum and maize. The second season, from September to January in the following year, is mainly for tubers and beans. Sorghum is cultivated as a main crop because it grows very easily and does not need much initial inputs. It is also a relatively profitable crop as it is utilized as a material of local brew for ordinary people. Cassava is the second important crop for home consumption. Since cassava is not suitable for

70
preservation, residents usually eat stiff cassava porridge. Beans are also important crops for both home consumption and selling. Beans are profitable and preservative and have big potential in this area. Maize is not so common in this area since its productivity is relatively low in the local soil condition. Also cultivated are potato, sweet potato, banana, and peas. In addition to those crops, rice is a very profitable crop in Ruyonza Sector. The Sector has large marshlands with that can be used for rice paddies. However, marshlands are not developed much, so only a few farmers are engaged in rice cultivation. They perceive that rice has great potential because of its profitability and productivity and wish to develop more marshlands. Fruits such as pineapple and avocado were also mentioned as possibly profitable crops in Ruyonza. Livestock are also a very important component as well as crop production. During the war and genocide in 1994, many livestock were killed. This tragedy has had a major negative impact on livestock production. Some relatively wealthy people managed to recover from it but many could not afford to re-purchase large types of livestock such as cows. Dung from livestock is an important fertilizer since many farmers cannot afford a chemical fertilizer. An organic fertilizer is commonly used in Kibungo Province. Agricultural extension services have not been provided since the end of the war. Almost all farmers have failed to get access to new agricultural technologies and they have been repeatedly applying their old knowledge. (3) Other economic activities Aside from agriculture, economic activities in rural areas are very limited. Flour milling, local brew production, coffee processing and rice mill are done in a small scale.
4.1.4 Traditional support systems The traditional support systems, such as Umuganda, Ubudehe, and Umusanzu, have existed since the prewar era. In recent years, due to decentralization and imidugudu, those systems have been revitalized and done with people’s ownership. Because of imidugudu, information dissemination has become very effective, and reconciliation and consolidation have steadily proceeded. Under the decentralization program, people have more rights to decide for their own matters. These favorable environments are revitalizing traditional support systems. The workshop participants explained the systems mentioned. Some portions might be different from other areas, thus hose systems are examples of two Sectors. Although the systems are slightly different from place to place, they have great potential as a social capital and will perform a very important function when the rural development program takes place.
71
(1) Umuganda Umuganda is a kind of community voluntary work. Nowadays, two types of Umuganda are practiced. One is the national-level Umuganda, which is mainly controlled by the central government and is held almost half a day per month nationwide. Another is the cell-level Umuganda held about 3 hours per week. This one is mainly handled by communities and local government, particularly at the cell and sector levels. The cell-level Umuganda is made for benefits of communities, such as house repair and latrine construction for vulnerable people, public road repair, school construction, and grass cutting beside the roads. Target tasks are usually decided by community people and CDC at Cell and Sector levels. (2) Ubudehe Ubudehe was the traditional agricultural practice for working together. To solve labor shortage problems for plowing, planting and harvesting, people joined together to share the burden of the work and to make sure that everyone is ready on time. After harvesting, a household helped by other people provides food and local brew for helpers to show its appreciation. However, this system is not so common now. Recently, people usually hire labor force by paying wages. The Rwandese government intends to utilize Ubudehe as a tool of poverty reduction in rural areas. However, no action has been taken in two surveyed Sectors so far. (3) Umusanzu The central government is guiding Umusanzu, a kind of public contribution system. Contribution is an obligation for every household. Money contributed is managed by Sector offices and is used for community benefits, such as an emergency support for a household that has a big problem. (4) Ibibina Ibibina is a kind of mutual financing system in a small group. A few villagers come together to establish Ibibina. Every month, a certain amount of money is collected from all members and all that money is given to one person among the group. Members will continue this way every month by rotating the turn of receiving money among them. This is not for public benefit like Umuganda and Umusanzu but mainly for individual benefits. (5) Kugurizanaya This system is similar to traditional Ubudehe. However, it is not for entire community but for a small group. This system is not offering food and drinks like traditional Ubudehe. Poor people who have farmland utilize this system frequently.
72
(6) Work for community land A community owns communal land and several crops are cultivated there. Operation of communal land is done during Umuganda and money from sales of harvested crops is kept in the Sector bank account. This money is the revenue of the Sector office, so the Sector can utilize it for purchase of office furniture and paints for the Sector office.
4.1.5 Opportunities and obstacles in rural areas The participatory workshop and interviews identified the following opportunities and obstacles in rural areas.
(1) Opportunities
• Decentralization and grouped resettlement (Imidugudu) • High potential of agriculture • Traditional support systems
(2) Obstacles
• Difficult access to safe water • Difficult access to firewood • Poor hygiene in imidugudu • Vulnerable people in communities • Low agricultural productivity • Few economic activities • Degradation of natural resources • Poor infrastructure
These opportunities and obstacles are also indicated in the strategic plan of Kibungo Province. The strategic plan was prepared based on PDC of each District/Town. Thus PDC reflects the needs of people at the grass-root level. When the contents of a rural development program for Kibungo Province are formulated, these opportunities and obstacles should be taken into consideration and the contents of PDC have to be respected. On the other hand, the obstacles above mentioned are not independent of one another. Some obstacles are causes of other obstacles. Therefore, during the program formulation, root problems must be addressed first to establish a favorable environment for further steps for development. Then more complex and bigger problems should be addressed. It is critical for a rural development program to have a clear sequence and flow.
73
4.2 Rural Water Supply
4.2.1 Background The principal governmental policies for the rural water sector are in line with VISION 2020 and the Poverty Reduction Strategy Papers (PRSP). The main aim is to improve the present water supply rate of less than 50% to 85% in 2015 and 100% in 2020. In line with the decentralization policy, which is the major development policy of the Rwandese government, towns and districts must prepare a District Development Plan (DDP) or Plan de Développement Communautaire (PDC). Towns and districts of Kibungo Province have prepared PDCs and water supply is given top priority. In Kibungo Province, which has the lowest water supply rate --- about 30% --- in the country, the residents face a severe environment due to insufficient infrastructures for water supply, and they use about 8 liters/capita/day of water on average, far from the objective of 20 liters/capita/day. In addition, women and children must travel over 3 km down steep hillsides to fetch water. Moreover, residents who cannot access clean water must rely on unsanitary water from lakes and marshes.
4.2.2 Water Sources Available for Development Water resources available for development in Kibungo Province are springs, groundwater, surface waters, i.e., rivers and lakes, and rainwater. Spring sources are exploited widely around Kibungo Province, but since they are limited both in area and quantity, their development must be carried out with careful attention. Groundwater sources also are limited and development potential is especially low in granite formation areas and along hilltops. Surface waters such as rivers and lakes are abundant in Kibungo Province and have high potential as water source. However, if these are to be used for drinking, treatment is necessary. Surface water is thus not included in this study. Rainwater harvesting is a feasible solution for shortage of water and this simple technology should be advanced by the local side, and will not be included in the scope of this study. Water quality at water resources in Kibungo Province is generally good.
4.2.3 Water Supply Systems The existing water supply systems in Kibungo Province include natural springs, protected springs, boreholes with handpumps, gravity fed systems and pumped up systems with pipelines. Many of the systems are old, deteriorated, and require rehabilitation or renewal.
4.2.4 Operation and Maintenance System Currently, there is little management on operation and maintenance of boreholes equipped with

74
handpump. The main reasons are nonexistence of spare parts, lack of maintenance tools for handpumps and repair skills. However, for districts where technicians who were trained during the Japanese project implementation are available, repairs can be made to an extent, but routine maintenance required to prevent major damages is not being conducted. Piped water supply systems are being operated and maintained by autonomous water management committees with functions at the levels of district, sector, cell and water point. Fees are collected either on a volumetric basis where a 20 liter container (called a jerrican or jerry can) is the basic unit, or a fixed rate where an annual charge is collected from beneficiary families. The collected fees are allotted to pay salaries of technicians and costs of parts when repairs are needed. The present four-tier system seems to be working, but each district has a different organization and its own concept. The district and sector level members are either government officials or volunteers. Donors and NGOs introduce different systems of operation and maintenance. Therefore, there should be a unified organizational structure to promote effective management.
4.2.5 Proposal for Grant Aid To alleviate the shortage of water supply that residents of Kibungo Province face, the Rwandese government submitted a request to the Japanese government for grant assistance. In response, the Japanese government dispatched a preliminary study team of JICA in 2004 to study the feasibility of the request. The preliminary study result suggested a project focused on groundwater development, but verification of this approach was required. The present project formulation study team was dispatched to formulate a program for rural development of Kibungo Province, and as a component of the study, the scope included a reconfirmation of the feasibility of grant assistance for rural water supply in Kibungo Province and to determine the extent of Japan’s assistance. As a result of this study, the following components are proposed for grant assistance.

75
Table 4-7: Construction of water supply facilities
No. of Sites Supply Level Type Water
Source Supply System New Reh/Ext Total
A Spring Gravity fed pipe network system 0 1 1
B Spring Electricity powered pipe networksystem 12 2 14
C Ground- water
Electricity powered pipe networksystem 1 2 3
D Spring Diesel powered pipe network system 7 1 8
Level 2
Sub-Total 20 6 26
Level 1 E Groundwater Handpump 29 9 38
Total 49 15 64
Table 4-8: Procurement of equipment
No. Item Quantity 1 Portable Flowmeter 10 sets 2 Portable Water Analysis Equipment
(pH meter, conductivimeter, Fe meter, Mn meter) 10 sets
3 Standby booster pumps 5 sets 4 Spare parts for handpumps 1 lot 5 Maintenance tools for handpumps 3 sets 6 General mechanics/plumbing tools 10 sets
4.2.6 Characteristics of Proposed Project (1) In the PDC, prepared through participatory methods, water supply was confirmed as the top
priority needs of the population in all towns and districts of Kibungo Province. This warrants the compliance with the policy of the Rwandese government for decentralization and group resettlement.
(2) Directly related to the needs of the residents confirmed above, the request containing elements of human security can be confirmed.
(3) Selection of water sources and supply systems has flexibility for coping with the needs of the residents and regional characteristics of each town and district of Kibungo Province. The number of sites for the proposed project totals 64, which breaks down as 26 sites of supply level 2 and 38 sites of supply level 1. The ratios of beneficiaries according to water source are 87.5% spring and 12.5% groundwater, while the ratios of beneficiary population by supply level breaks down as 91.6% at level 2 and 8.4% at level 1.
76
(4) In Kibungo Province, where the water accessibility indicator is the worst in the country, about 240,000 persons, equivalent of about 32% of the total population of Kibungo Province which is about 760,000 persons, can benefit from this project. The estimated present water supply rate of about 30% for Kibungo Province can increase to 62%.
(5) If the accessibility to water improves, then time and effort for water fetching, especially by women and children, will be reduced and improvement in basic living conditions can be anticipated.
(6) The cost effectiveness of this project is very high compared to other projects. (7) Since using electricity to power pipeline network systems as compared to using a diesel
generator can minimize operation and maintenance costs, extensions from existing grids of ELECTROGAZ to water intake points through Japanese assistance are justified.
(8) Through coordination with the technical cooperation scheme, the social and institutional component can contribute to sustaining the water supply facilities to be constructed or rehabilitated.
4.2.7 Expected Outcomes If the above project materializes, 32% of the population of Kibungo Province can receive a continuous supply of safe water, distances to water points can be shortened, water fetching time can be reduced, and the water supply rates of towns and districts will increase. Refer to 6-1 for details of the proposal for grant aid and 6-2 for results of geophysical survey and test drilling.
4.3 Rural Infrastructure
4.3.1 Water supply Details of water supply infrastructures will be omitted as they have already appeared. However, the study team confirmed that the most serious task is the supply of potable water to the population in Kibungo Province. In Kibungo Province, Electrogaz has two branch offices in Kibungo Town and Rwamagana Town. Electrogaz has been a developer and supplier of water for urban areas of Kibungo (700 m³/day) and Rwamagana (600 m³/day mainly from Muhazi lake) as well as for a part of Muhazi district (130 m³/day). This former state-owned enterprise facing financial difficulties hasn’t carried out any new project or extension in the last 6 to 7 years. (Refer to Figure 6-4-1)

77
4.3.2 Agriculture More than 90 % of residents are engaged in farming. Thanks to the Province’s fertile soil and exploitable marshlands, they grow coffee, sorghum, beans, banana and potatoes. Beside these upland crops, they grow rice twice a year (January-June and July-December) in some sectors. There is no irrigation scheme and the productivity of this rain-fed rice culture has seen little improvement. Since the size of farmland is small in this undulated province, residents stick to their traditional farming method without animal or mechanical support. In many cases, distance to the farmland has become longer because Imidugudu plots are mostly located in higher zones along the road and farmers can hardly commute to their work places in time. There is a shortage of such post-harvest facilities as drying cell, threshing unit, and storage. Unpaved and poorly maintained roads discourage the farmers’ income generating activities.
4.3.3 Reforestation While implementing the Imidugudu, people have used a large amount of trees both for construction and brick making. The government’s prohibition on cutting trees has not been effective in promoting reforestation. Environmental degradation continues and many districts request financing, in their PDCs, for control of soil erosion, protection against landslide and preservation of water sources (water-shed management). Recently Nyarubuye district worked out a 300 ha reforestation project with MINITERE assistance.
4.3.4 Local transport, Roads/Bridges Except for a national road running through Muhazi and Rusumo districts, roads in the province are mostly laterite paved and poorly maintained. Paved and annually passable roads are less than 10 % of all roads in Kibungo, Kabarondo, Muhazi and Rusumo districts. The roads between Imidugudu and farmlands in the bottom of valley or lowland are particularly poor and farmers have trouble every day bringing in farm inputs and shipping their products. Unless those access roads are improved or rehabilitated, agro-based economic activities of resident farmers will not make any progress.
4.3.5 Electrification Most districts in Kibungo have no electric power distribution. Most people use hand lamps. Exceptions are towns of Kibungo (electrification rate of 8.3 %), Rwamagana (12.0 %) and a hotel in Akagera National park where Electrogaz extends services. As mentioned in (1) above, facing management difficulty, Electrogaz doesn’t have any future plan in this field.

78
4.3.6 Sanitation/Hygiene Infant mortality rate remains as high as 0.14 - 0.87 % in most districts of this province. A reason must be the daily use of unsafe water. Most houses in Imidugudu are equipped with latrines but hygienic condition still needs improvement to keep pests and insects away. A certain number of districts make use of CDF to install public latrines at markets and schools. As for roofing materials of houses in Imidugudu, since local tiles are expensive and the furnace requires fuel woods, people preferred galvanized iron sheets (74 %) until they ran out in markets. Vulnerable groups who are furnished with low-cost housing without roof tend to use banana leaves that do not withstand heavy rain.
4.4 Gender Issues and Social Affairs
4.4.1 National level: Gender issue (1) Ministry of Gender and Family Promotion (MIGEPROF) Under the Minister, the Executive Secretary leads 4 Units: Planning & Research, Public Relations & Internal Resource Management, Women & Gender Promotion, and Child Protection. Each unit has 4 to 5 staff members. For instance, the Planning & Research Unit consists of a chief, 3 staff members and a secretary. The Women & Gender Promotion Unit has a chief, 3 staff members in charge of law and violence issues, training and empowerment, social protection, and secretary. The Child Protection Unit has 4 members including a chief and 3 staff members. According to the strategic plan
of MIGEPROF for 2005-2007, the total budget for 2005 is about 1 billion FRW. The budget for each unit / activity area is as follows: Women & Gender Promotion, 636,000,000 FRW; Child Protection and Support, 235,600,000 FRW; and Family Support & Promotion, 129,400,000 FRW. The work of MIGEPROF is as follows: making and facilitation of policy, budget coordination (e.g., resource identification, material provision, and coordination with NGO), and monitoring and evaluation of provincial offices. In order to reduce the gap between MIGEPROF’s target in PRSP and real gender condition MIGEPROF is trying to convince other ministries such as Ministry of Land to integrate gender issues in their policies and supervise provincial offices to manage district offices’ work. Before the decentralization program started, staff members of provincial governments were ministries’ staff members. According to the chief of the Planning & Research Unit, after the decentralization, it is more difficult for MIGEPROF staff members to understand the work of districts and implement the ministry’s policy at the grassroots level. MIGEPROF trained district officers directly before the decentralization. After the decentralization, district officers’ training became the responsibility of provincial officers. MIGEPROF believes the capacity of district officers needs further improvement and asks the provincial offices to conduct training for them.

79
While MIGEPROF is the policy maker on gender issues, the Women Council is one of the key implementers of the gender-related projects. The two entities have close ties. As for gender and child protection, some portions of the work of MIGEPROF and that of MINITERE’s social affairs office overlap because there are widows and orphans who need special social protection. On these issues, MIGEPROF and MINITERE’s social affairs office work together to make policy and formulate budgets. (2) Women Council The Women Council exists at the central, province, district/town and sector levels and each of them has 10 members. The Women Council at the central level started its activities in 1997. According to its action plan of 2005, its annual budget is 358,546,961 FRW, of which 108,145,322 FRW is from the Rwandese government and 250,401,639 FRW is from other agencies. The major donor agencies are: UNIFEM, SWAA RWANDA, Red Cross, CARE International, IMPACT, ASOFERWA , CARITAS and APELLAS. It has a plan of activities, expected outputs, cost estimation and time frame on the following issues.
• Preparation of an action plan 2005-2007 • Capacity building of the Women Council though training • Participation in poverty eradication (e.g., introduction of a women fund at the sector level) • Health promotion (e.g., AIDS and reproductive health) • Improvement of education of girls and women • Celebrate the national and international Women's Day • Sensitization on reconciliation and Gacaca activities • Instruction on routine work to local women councils (e.g., Organizing an annual meeting of
women councils and executive committee) In 2004, in addition to the above mentioned activities, supervision of election of local women council members was an important task. The Women Council’s annual report of 2004 lists the following difficulties on introducing the women fund at the sector level in all over Rwanda.
• Contribution is not provided on time. • The staff members who manage the fund are incompetent. • Women groups regard the fund as a gift. • There is little time to follow up on the fund. • The Council has no permanent staff members. • An environment that renders the fund sustainable has to be fostered.

80
• The fund is not reserved for future investment. • The fund is not distributed in an equitable and efficient manner. • Those in charge of the fund don’t put enough time and energy on its operation. • There are no means to supervise fund operation. • Changes in sectors and Districts have had negative effects on the fund.
In order to solve the problems, the Women Council has had a series of meetings with coordinators of the Provincial women councils, representatives of MIGEPROFE, the microfinance forum in Rwanda, the women investment fund, and the National Bank.
4.4.2 Central level: Protection and support of socially vulnerable groups (1) Social Affairs Unit of MINALOC The Social Affairs Unit was incorporated into MINALOC in 2000. MINALOC has 6 Units in total and the other Units are as follows: Community Development, Decentralization and Good Governance, Local Finance, Local Governance (it deals with politics and security), and Public Resources & Internal Resource Management. The Social Affairs Unit had 16 staff members before decentralization, but has now only 5 and 1 post remains vacant. The Unit’s strategy will be prepared in the fall of 2005. This Unit has 3 desks:
protection of and assistance to the survivors of the genocide; social assistance; and social security. The Unit has a responsibility to formulate the policy. FARG is a key implementing agency for the
protection of and assistance to the survivors of the genocide, and the Demobilization Commission is the one that implements the policy on demobilized solders. The Social Assistance desk puts special emphasis on the poor, elderly and handicapped. The Social Security desk deals with the prevention of natural disasters and support for their victims. The Social Affairs Unit works with the Ministry of Health and Ministry of Education on health and educational services for socially vulnerable groups. (2) FARG FARG is the fund for assisting genocide survivor and donated money to individuals for their education, health, housing and food. The revenue comes from various sources. 5% of annual budget of the central government, 1 % of annual salaries of all employed Rwandese, 100 FRW from all Rwandese aged 18 or older, 10,000 FRW from all associations and retailers, 50,000 FRW from medium sized companies, 100,000 FRW from large companies and traders, and 20,000 FRW from small companies. There are coordinators at provincial and district/town levels. The following groups are eligible for receiving funds from FARG: 1) survivor of genocide and 2) the poor, orphans, handicapped and widows. Demobilized solders are not among them because there is the Demobilized Commission. The FARG headquarters has 43 staff members. Before the decentralization, staff members at province and district levels were FARG staff members. Now they are provincial and

81
district officers. According to the interviewees at FRAG, it is more difficult now for them to manage their work. The fund that each household can receive is that 1,000,000 FRW for house construction, 50,000 FRW for food, land and/or housing construction, 15,000 FRW for tuition, study materials and textbooks. Although primary schools are free of charge for all students, FARG helps socially vulnerable households pay for study materials and textbooks. FARG started its assistance in 1998. The number of beneficiaries has been increasing because many eligible people learned about the service and started applying for the fund. FARG has schemes both for grants and short- and long-term loans for entrepreneurs.
Table 4-9: Budget disbursed for projects
(Unit: Frw) Money provision
for education Money provision
for health For housing and
other project Total
2003 3,993,120,382 613,508,456 517,026,773 5,123,655,6112001 2,323,474,245 153,750,508 355,825,190 2,833,049,943Source: Financial report of FARG 2001 and 2003
The major donor agencies are USAID that provided 748,537,925 FRW in 2003 and UNHCR that provided an automobile. The most important issue that FARG faces is its finance. While the number of beneficiaries is increasing, the amount of FARG’s revenue has not changed much. (3) Demobilization Commission The Demobilization Commission was established in 1997 to promote social integration of demobilized solders in Rwanda. The Commission’s budget is about 53 million FRW a year. The headquarters consists of 50 to 70 staff members. The Commission has branch offices in all provinces and their staff members manage all projects in their jurisdiction. Each branch office consists of 3 to 4 staff members, but the offices in Ruhengeri, Gitarama, and Giseni Provinces, all of which have many demobilized solders, have more staff members. From 1997 to February 2005, 36,535 Rwandese solders, 5,164 Congolese solders and 12,290 ex-government solders were demobilized. Basically the Commission provides every beneficiary with 50,000 FRW, counseling and an ID card. It also provides Recognition Service Allowance based on the rank when they were in service. For instance, a captain receives 450,000 FRW. In addition to the money provided individually, the commission lends 100,000 FRW for association of demobilized solders for starting businesses. It encourages them to form associations in order to assist them. Interviewees stated that female

82
demobilized solders have more difficulty in finding a job. For demobilized child solders, the commission first includes them in a family unification program, and then provides skill training and support for their business. As of February 2004, there are 51,668 demobilized solders in Rwanda. Except for the groups who retreated to neighboring countries, 80-90% of solders were already demobilized. 9.8% of them live in Kibungo Province. The following table shows detailed information on demobilized soldiers.
Table 4-10: Number of demobilized solders by District/Town
Name of District/Town No. of demobilized solders (persons)
Kibungo Town 825 Rwamagana Town 520 Cyarubare 326 Kabarondo 192 Kigarama 349 Mirenge 470 Muhazi 489 Nyarubuye 152 Rukira 256 Rusumo 728
GTZ and the World Bank support the commission. GTZ provides 1) medical equipment and support medical treatment, and 2) community based vocational training and income generation activities for associations. The World Bank supports all projects of the commission. (3) Provincial level: Culture and Social Affairs Unit of Kibungo Province The Unit has 4 staff members. The acting chief of the Unit is in charge of social protection and gender. There are also staff members in charge of health, education/culture/youth/sports, and secretary. Currently the chief is under recruitment. The Unit deals with health promotion, AIDS protection, education promotion, implementation of gender and family law, activities on youth and sports, and support for socially vulnerable groups. The Unit’s budget for 2005-2007 is as follows.

83
Table 4-11: MTEF of Culture and Social Affairs Unit of Kibungo Province
(Unit: FRW) No Health, Gender and Social Affairs 2005 2006 2007 1 Administration expense 275,547,479 300,294,300 330,404,9332 Health structure development 11,499,800 13,690,530 15,581,9333 Prevention care support to main
health problems 1,973,500 12,595,000 12,861,750
4 Basic health care and Insurance 1,512,000 1,684,800 1,883,5205 Social integration 94,388,400 104,815,240 114,712,2646 Family rehabilitation 12,000,000 14,600,000 17,290,0007 Support to woman for supporting
them to be self sufficient 12,000,000 13,150,000 14,522,500
8 Social affairs 266,000 5,183,600 5,679,5609 Gender in development approach 330,000 462,000 508.200
No Socio-cultural population
development 2005 2006 2007
1 Administration expense 1,442,605,791 1,626,143,792 1,708,431,6522 Pre-school and primary schools 8,111,300 6,084,313 10,879,9803 Secondary schools 408,123,772 541,157,989 732,117,5724 Adult education 3,498,500 3,843,400 4,225,7605 Sport and leisure promotion 15,410,000 17,144,000 20,447,6006 Cultural promotion 21,999,000 28,867,100 30,290,4157 Youth mobilization 12,000,000 17,700,000 23,470,000Source: MTEF 2005-2007 Kibungo Province
Basically, the government has 3 types of schemes for supporting socially vulnerable groups: FARG, Education Fund, and Health Insurance. Details on FARG were just described. According to the Unit chief, the number of personnel in charge of FARG at the district level was reduced and the bank account of FARG at the district level was closed. As a result, fund distribution has been delayed. As for the Education Fund, all citizens except the poor pay 100 FRW to support secondary schools’ tuition of the children from poor households. (Primary schools are free of charge in Rwanda.) The Health Insurance, called as Mutuelle de Sante, is for all citizens who paid 1000 FRW a year. After paying the money they receive an insurance card. They can receive all types of treatment and medicine at the health center with 150 FRW. Serious cases are transferred to district hospitals and provincial hospitals. In such cases 16 % of the treatment fee will be paid by the patients and 84 % will be paid by the Insurance. People from poor households do not need to pay the money, but the Ministry of Health, the District Office and NGOs pay 1000 FRW for them. The ratio of people who joined the Health Insurance in Kibungo Province is as follows.

84
Table 4-12: Joining rate in health insurance in Kibungo Province
Name of District/Town Joining Rate in Health Insurance (%)
Kibungo Town 28.6 Rwamagana Town 45.4
Cyarubare 37.7 Kabarondo 37.7 Kigarama 47.8 Mirenge 55.7 Muhazi 45.5 Nyarubuye 41 Rukira 37.5 Rusumo 40.4
(Kibungo Town’s rate is low because there is another health insurance, RAMA, for employees of private firms
and civil servants. In Kibungo Town, many people seem to join RAMA instead of Mutuelle de Sante because it
is the provincial capital.)
The Health Insurance fund is collected by the sector chief and deposited in the sector’s bank account. The usage of the fund is proposed by the sector and decided by the District Council. At the District/town office and each health center, there is 1 staff member in charge of the insurance and they are paid for by the fund. 70 % of the Health Insurance’s revenue is used for treatment at health institutions, 15 % for administration cost at the headquarters at Kigali, and 15 % for management at the district and town levels. Since the introduction of the system, the number of patients at the health center and hospitals has been rapidly increasing. As a result, healthcare professionals, e.g., doctors and nurses, are in short supply, even though the number of patients is increasing. Their salary is paid by the provincial government and the budget for their salary is on the rise. In order to cope with the situation, the Unit set as priorities in the health sector an increase in health personnel at the health center and hospitals and their training. The other priority tasks are care for socially vulnerable groups and addressing the issue of HIV-AIDS. According to the Unit chief, the number of graduates from nursing schools has been increasing in Kibungo Province, and the health personnel’s knowledge and skills are improving. The priority tasks in education in Kibungo Province are to 1) establish a Parents and Teachers Association (PTA) in all sectors and 2) set up kindergartens in all cellules. In 2003, tuition of primary schools became free in Rwanda. In addition, the awareness building of parents on the importance of education, especially for girls, has been successful. As a result, the number of school enrollment has rapidly increased. Like healthcare personnel, the number of teachers is too small to med the demand even though the number of qualified teachers has been increasing. The salary of teachers is also paid by the province and the budget is increasing even though the number of other types of provincial
85
officers has been decreasing. The priority tasks on the gender issue are as follows: 1) promotion of the decision making power of women from the cellule level to the central government, 2) sensitization of women for increasing self-supporting income, 3) awareness building on girls’ right for education, 4) forest protection by planting trees and introducing improved types of ovens. The following are the priority tasks on the protection of socially vulnerable groups: education, health and housing construction. According to the Unit chief, the number of socially vulnerable people has been increasing recently because 1) infants who became orphans in the civil war became old enough to go to school; 2) those who contracted AIDS during the civil war died and their children became older.
The positive impact of the decentralization program for the Unit is that the development project has been planned and decided where people live. The negative aspects are that the workload of the Unit increased since the number of staff members was drastically reduced from 11 to 4. The roles of the Unit are to supervise the work of districts and towns and convey to them the Provincial governor’s decisions on important issues. In theory, people are supposed to see district officers in charge of social affairs, health, and education when they face difficulties. However, the number of district officers was also reduced and FARG personnel were no longer posted at the district level. Thus people come directly to the Unit for assistance, adding extra burden on the Unit. As seen in the questionnaire (see the attachment: SWOT analysis) and interview results, the reporting from the districts and towns was often delayed and the Unit needed to try even harder to supervise and follow up on their activities. In order to improve the capacity of district and town officers, the Provincial officers gives them training once a year on social development, leadership and gender. This training will be in May or June 2005.
4.4.3 District/town level: Examples of Kabarondo and Rusumo Districts (1) Gender issue A vice mayor is in charge of gender issues but there are no district/town staff members who deal with gender. In 2006, 2 staff members in charge of gender will be assigned in all districts and towns. The Women Council conducts major activities. As mentioned in this chapter, Women Councils exist at all cellule, sector, district, province and central levels and each has 10 members. At the district, sector and cellule levels, only the vice mayor and the district women council chief called gender coordinator receive salary, and the other members are unpaid. Members of a cellule women council are selected by local people. Members of a sector women council are selected by cellule women council members, and members of a district women council are selected by sector women council members. These 10

86
members have the following roles and responsibilities: chief (called coordinator), vice chief, secretary, economic development, health, education, law (such as land issues), social affairs, culture, and income generation/production. The Women Council existed before the civil war, but its structure was systematized recently. The work of the Women Council is to assist women groups’ activities such as agriculture, income generation activities through small businesses, and conflict resolution between women and men, e.g., domestic violence. In Kabarondo District, the priority tasks on gender are: education of girls, implementation of law, e.g., land law, and promotion for women’s ownership of property. The vice mayor visits a sector once a week and sector women council members, i.e., 10 people, come to the district office to report progress of their activities and problems. The members also submit a monthly report to the vice mayor. The vice mayor meets the Unit of Culture and Social Affairs at the Provincial office every three months. The budget for gender activities is small because funds are allocated for education, social affairs, and health. The general district/town budget allocated from the central government is used for such activities. But the provincial office provides direction, supervision and evaluation for the activities. (2) Social Affairs The number of district staff members for social affairs was reduced. The following table is the example of Rusumo district. Before the decentralization, there were nine staff members for social affairs: a vice mayor, unit chief, and personnel in charge of health, education, water, returnees, registration (e.g., issuing ID cards), resettlement, and logistics (storage and distribution of materials for returnees and resettlement). Currently, the number is down to five: vice mayor, unit chief, personnel in charge of health, education and water. Nowadays, there are not too many refugees coming back from the neighboring countries and the resettlement program has almost completed. Thus the other four positions are no longer necessary, according to the vice mayor in charge of social affairs in the district. He stated that the district provides the same quality of services to the people even though the number of staff member decreased because more capable staff members were recruited than before.
Table 4-13: Number of staff members at Rusumo District office
Before decentralization
After decentralization
Staff number of district office 42 28 Personnel in charge of social affairs, including a vice mayor 9 5
In brief, the work of the staff members is to: 1) identify socially vulnerable groups such as the poor, handicapped, orphans, widows, demobilized solders, and elderly people; 2) find suitable support
87
channel, e.g., central government, district/sector level, and NGOs; and 3) provide support. In addition, they evaluate the service quality of public institutions such as schools from kindergartens to junior high school and the health center. Furthermore, sector and cellule staff members check the cleanness of restaurants and markets. Based on the District Council’s decision, they supervise development projects on social affairs such as construction of health centers and schools. Rusumo district, for instance, provides the following types of assistance for socially vulnerable groups: 1) assistance for children from poor households; 2) tuition exemption and supplement for teachers’ salary through the Education Fund and PTA activities; 3) assistance for orphans whose parents died of AIDS; 4) assistance for handicapped and demobilized solders; and 5) house construction for child-headed households. The district tries to gain support of NGOs for housing construction. If such support is not available, the district plans to construct them through local population’s volunteer activities known as Umuganda and receive iron sheets from the provincial office. The district officers in charge of social affairs submit a plan to receive social affairs funds from the provincial office, but the availability of funds does not seem sufficient. There are committees at the district, sector and cellule levels on the following issues: education fund, health, hygiene, and collecting contribution (Umusanzu) for socially vulnerable groups. All members are volunteers in respective fields. For instance, most members of the education fund committee are teachers. The health and hygiene committees consist of healthcare personnel and leaders of women groups. The committee for collecting contribution (Umusanzu) for socially vulnerable groups is made up of pastors, healthcare personnel, women group leaders, and local leaders. These committees had already existed prior to the civil war. Five district staff members have a monthly meeting. Sector representatives meet every two months at the district office. District staff members often visit a sector and the vice mayor in charge of social affairs visits every sector once a month. Cellule personnel compile at the sector and district levels and submit to the provincial office weekly, monthly, quarterly, semi-annual and annual reports. Project evaluation is done semi-annually. The district officers in charge of social affairs face the following difficulties: lack of a project budget to implement and complete planned projects and difficulty in reporting due to the large volume of workload and shortage of transportation means. Some sectors do not have a sector office building. As all the staff members at the sector and cellule levels are volunteers, some are not motivated for work. An interviewee expressed that the Unit of Culture and Social Affairs is not helpful enough to solve the problems at the district and sector levels.
4.4.4 Gender in rural areas To understand the gender situation in rural areas, division of labor on productive and reproductive

88
tasks was identified by using participatory tools during the RRA/PRA workshop. The table below indicates the results of this activity in Ruyonza Sector.
Table 4-14: Division of labor on productive and reproductive tasks
Female Male Children Female Male Children1 Cleaning of farm ✓✓ ✓ ✓ 1 Cooking ✓✓ ✓✓
2 Making of ridge ✓ ✓✓ ✓ 2 Collecting vegetables ✓✓
3 Seed preparation ✓✓ ✓ 3 Fetching water ✓ ✓ ✓✓
4 Sowing ✓✓ ✓ 4 Stripping firewood ✓✓ ✓✓
5 Fertilizer application ✓ ✓✓ ✓ 5 Collecting firewood ✓✓ ✓ ✓✓
6 Weeding ✓✓ ✓ 6 Washing dishes ✓✓ ✓✓
7 Bird scaring ✓ ✓ ✓✓ 7 Taking care of children ✓✓ ✓
8 Harvesting ✓ ✓ ✓ 8 Cleaning and moping house ✓✓ ✓
9 Threshing ✓ ✓✓ ✓ 9 Ironing clothes ✓✓ ✓
10 Winnowing ✓✓ ✓ 10 Welcoming guests ✓✓ ✓
11 Transporting ✓✓ ✓ 11 Taking care of small animals ✓✓ ✓ ✓
12 Drying ✓✓ ✓ ✓ 12 Pounding & winnowing ✓✓ ✓
13 Selling ✓ ✓✓ 13 Washing clothes ✓✓ ✓
14 Keeping money ✓ ✓✓ 14 Making bed ✓✓ ✓
15 Livestock caring ✓✓ ✓ 15 Preparing for hot water (bathing) ✓✓ ✓
16 Keeping money ✓✓ ✓
17 Building & repairing house (making bricks) ✓ ✓✓ ✓
18 (sewing timber) ✓✓
19 (plastering) ✓ ✓ ✓
20 (cutting thatch grass) ✓ ✓ ✓
21 (roofing) ✓✓
22 Digging & Excavation of pit latrine ✓✓ ✓
Productive Reproductive
Source: Interview at the field, 2005
The study team learned that labor on productive tasks is almost equally divided between men and women but women have more reproductive tasks. It seems at first that men have almost equal responsibilities on reproductive tasks, but reproductive tasks from 17 to 22 are not everyday work but tasks that need to be done only a few times a year. Thus, most daily tasks are done by women. Both men and women understood this condition clearly during the workshop. However, women did not complain too much because they thought the situation was something they were supposed to accept in Rwanda’s culture. Nowadays, the Rwandese government is emphasizing gender consideration and many residents know about it. Many rural residents, however, still have traditional social norms and the norms reflect their way of thinking. On the other hand, child labor is also a very important labor force in their households particularly for

89
reproductive tasks of fetching water and firewood. Children also perform daily chores such as washing dishes and clothes. Children in poor households are sometimes not sent to school because they have to be engaged in productive tasks.
4.5 Analysis of Development Actors in Kibungo Province
4.5.1 Kibungo Province (1) General information on Kibungo Province Kibungo Province consists of 8 districts and 2 towns, with the population of 248,115 and 2,977 square km of surface area. Population densities are high in Kibungo and Rwamagana towns, and Mirenge and Muhazi districts have large numbers of cellule. The Strategic Plan of Kibungo Province states that “the Province has a mission of promoting the integral and sustainable development for improving the well being of its population, through (1) Supporting and coordinating development programs by local government, (2) Strengthening institutional capacity of grassroots institutions, and (3) Increasing effectiveness of coordination between central and local government.” As the attached organizational charts of Kibungo Province show, the function of financial auditing and political/jurisdictional management of local governments has been focused. According to the annual report 2003, the total number of staff was 61 while the number of posts was 105. Currently, 36 staff members were working and 8 posts remained vacant.
Table 4-15: Number of staff and posts of Kibungo Provincial office
Department Staff number (May 2005)
Number of posts (May 2005)
1 Office of Prefet 3 5 2 Office of Executive Secretary 2 2 3 Unit of Public Relation and Internal Resource
Management 7 9
4 Unit of Good Governance and Territory Administration
6 7
5 Unit of Economic Development and Environment
5 5
6 Unit of Inspection and Audit of Local Finance 2 4 7 Unit of Culture and Social Affairs 4 5 8 Driver 7 7 Total 36 44
The Decentralization program has been implemented since 16 January 2001 and the Community Development Plan (PDC) is formulated by local government. The Community Development Fund (CDF) was introduced to finance PDC execution. The Rwandese government has executed an

90
organizational restructuring program to reduce 4,500 civil servants at all levels. Decentralization has changed roles of central and local governments. The central government has the following functions: policy making, budgeting, and supervision and evaluation of provincial governments. The provincial office implements the central government’s policy, supervises and monitors district offices’ activities. Cellule, the bottom of the administrative hierarchy, is the one that first formulates a development plan under its jurisdiction. The sector office puts priorities in the plan, and the District office prepares PDC and receives CDF from the central government for project implementation. The provincial office has a greater role in project coordination while the central government is to play the supervision and evaluation role. The Provincial government receives the recurrent budget but not a development budget because the province assumes the coordination role of districts and towns. It has 3,519,831,749 FRW for its budget for 2005 and expects a larger budget for 2007 (4,007,389,981 FRW). According to the Director of Public Relations and Internal Resource Management Unit, the Provincial Budget has been increasing even after the decentralization and organizational restructuring programs because the number of teachers and nurses and other technical staff has been on the rise. (2) Unit of Audit and Inspection of Local Finance This unit was established in 2005 to replace the former Resource Planning and Mobilisation Unit. The major roles of the Unit are as follows: 1) financial auditing of District/Town office, public institutions (e.g., prison, health center and secondary school), central government projects (e.g., Rural Sector Support Program: RSSP), 2) supervision and advice on tax collection, 3) report to central government, and 4) training of accountants, local auditors, tax collectors and cashers. The Ministry of Finance and Economic Planning issued “Financial management and accounting procedures manual for local administration in Rwanda” in April 2003 for accounting procedures of District/town offices. They are required to follow the operational guideline. It states the roles and responsibilities of district and town offices, revenue management, procurement/tendering procedures, expenditure/payments management, and management of local administration property, auditing function, accounting procedures, and financial report. The Unit sets two targets: finance and resources of districts and towns are well managed; and increase in self-supported financial resources of the Districts/Towns, by increasing local tax, according to MTEF. Budget estimation for the Unit is as follows. It is notable that the Unit has a larger staff training budget than other units.

91
Table 4-16: MTEF for Unit of Audit and Inspection of Local Finance, Kibungo Provincial office
(Unit: Frw) No 2005 2006 2007 1 Administrative expense (salary,
allowance, stationary, etc.) 31,716,878 56,049,679 38,447,813
2 Statistics 5,937,000 5,866,000 6,495,9203 Logistics 32,398,500 36,732,950 38,799,8854 Public expense management 6,369,000 6,806,700 7,805,9905 Budget planning 6,936,000 15,122,400 17,038,0106 Human Resource Development (ex.
training) 26,692,000 29,132,000 31,643,200
Total 110,049,378 149,709,729 140,230,818 Source: MTEF 2005-2007, Kibungo Province
The following are the challenges that the unit faces: heavy workload due to the shortage of staff members (currently 2 staff members including secretary); resignation of trained accountant and local auditors at district/town; and delayed submission and low quality of financial reports from district/town offices. Since the Unit is not satisfied with the quality of financial and statistic reports from the District/town office, it says that the office should focus more on their training. Training for local staff started in 2001 upon the establishment of the current organizational structure with the decentralization program. Training is provided once new personnel are assigned. The first round of training for accountants and local auditors is complete. This year, there will be training on tax collectors and cashers. In conducting the training, the unit faces shortage of means of transportation and daily allowance for trainees. (3) Unit of Economic Development Currently, there are five persons in the Unit: Chief, environment/forestry, agriculture/animal husbandry, infrastructure/shelter, and secretary. In May 2005, the new unit (Commerce & Cooperatives Unit) that deals with commerce, industry, tourism, service industries and cooperative/handicraft will emerge from the Economic Development Unit. The functions of Provincial staff members in the Unit are to 1) follow up on the District/town’s economic development activities, and 2) implement the central government’s policy. As previously mentioned, district and town offices prepare and implement PDC with CDF. To implement the ministries’ policy at the local level, the Unit informs District/town staff members the importance and benefit for the people of following the policy. Then, the District staff members explain the issue to Sector and Cellule staff. For instance, the Ministry of Agriculture sets priority products for each province. Coffee, rice, maize, banana and pineapple are the ones for Kibungo province. The Unit explains the importance of cultivating these products and possibility of earning cash income from

92
them, to the personnel in charge of agriculture at district and town offices. In fact, the Ministry of Agriculture, province, and district/towns prepared the District Development Plan in Agriculture in a participatory manner. If Cellules regard it worthwhile to take action on the Plan, they would formulate a project and propose to include it in PDC. Villagers are not forced to cultivate the products, but CDC members support the farmer’s association, e.g., rice association, if the products are prioritized in PDC. Many projects written in PDC are supported by donors and NGOs. In addition to development activities written in PDC, the central government, often supported by major donor agencies, implements national projects. The Unit supervises and evaluates these projects conducted in Kibungo Province. According to the Action Plan 2005, the Unit has four goals: 1) improvement of the productivity in agriculture and livestock, 2) improvement and maintenance of infrastructure, 3) promotion of markets and trade, and 4) promotion of tourism and craft. Detailed project activities are in the attachment. Budget estimation for the Unit is as follows. The table shows that the budget for water and sanitation is small and a large increase in the amount is unlikely.
Table 4-17: MTEF for Unit of Economic Development, Kibungo Provincial office
(Unit: Frw) No Economic Development 2005 2006 2007 1 Administrative expense (salary,
allowance, stationery, etc.) 30,003,144 56,549,820 36,421,196
2 Tourism Development 10,757,500 6,089,500 6,916,4003 Commerce Promotion 11,901,000 11,995,000 13,270,1604 Factory promotion and Craft Industry
Development 1,116,000 1,270,600 1,436,360
5 Urban management 126,000 140,000 156,9606 Infrastructure Development 2,190,000 2,256,000 2,540,4007 Planning and Habitant Supervision 1,891,500 1,884,500 2,104,7658 Mine and Geology 1,020,000 1,128,000 1,252,2009 Energy, Water and Sanitation 960,000 901,500 1,005,20010 Employment and social security 2,848,000 3,234,950 3,679,63011 Conservation and Environment
protection 3,465,000 2,808,000 3,087,450
No Agriculture, Livestock and Forestry 2005 2006 2007 1 Administrative expense (salary,
allowance, stationery, etc.) 44,348,690 49,531,825 47,622,366
2 Forestry Resources 19,445,250 24,735,650 28,936,1903 Agriculture Planning 881,300 990,430 1,105,4734 Rural Engineering and social
conservation 11,787,000 23,584,750 20,111,560
5 Agriculture production 9,483,500 6,491,000 7,934,5256 Animal production 31,359,600 39,797,600 50,544,100
Source: MTEF 2005-2007, Kibungo Province
93
The challenges that the unit faces are first shortage of staff and heavy workload. Before decentralization the number of staff members was 8. After decentralization, it was reduced to 5, and no development budget was allocated to the provincial office. Office equipment and transportation means became more difficult to use than before. A District or town is supposed to submit a report regularly. Due to the shortage of transportation, report submission is often late and some district officials write reports without visiting the project site as much as they should. Training of local governmental officials is often provided through execution of development projects. For instance, Kibungo Province started assisting rice production in marshlands in Rusumo district, Rukira district, and Kibungo town. A Kenyan rice farming cooperative came to Kibungo to train rice association members and local governmental officials in charge of agriculture. The rice association members and local governmental officials also visited Nairobi to receive training in April 2005. However, as attached document shows, the Unit has few training opportunities for technical staff at local government. (4) Unit of Governance and Territory Administration The Unit has 6 members including 1 chief and 1 secretary. Before the decentralization program, the unit had 11 staff members. The Unit deals with supervision of political issues, local elections, civil lawsuits, and management of prisons. Provincial officials are entrusted to: grasp the progress of activities in Districts and towns; put together a report on the progress to the District Council, Provincial governor, and the central government; and resolve major problems that District/town offices cannot solve on their own. The Chief is responsible for supervision of Gacaca (local people’s court on the genocide), conflict resolution, and evaluation of Mayors of districts and towns. Performance-based evaluation of mayors and other high officials of districts and towns is done every year. Evaluation results are conveyed to the Election Councils of Districts and towns, and the Sector representatives decide whether or not to appoint mayors for the second term. The Unit prepares monthly, quarterly and annual plans and the monthly plan is reviewed every week. The Territorial Administrator supports 10 districts/towns by promoting good governance there. More specifically, the Administrator promotes CPA’s activities on safety management and election. The official in charge of Community Work supervises Umuganda, or voluntary community work by all citizens. Once a month, under the guidance of Cellule’s CDC, all citizens get together to construct roads, bridges, schools and repair water facilities. He also manages the prisoners’ voluntary work (TIG) for the community. The official in charge of civil society and political issues monitors whether the missions and activities of NGOs, religious groups and associations are relevant and politically
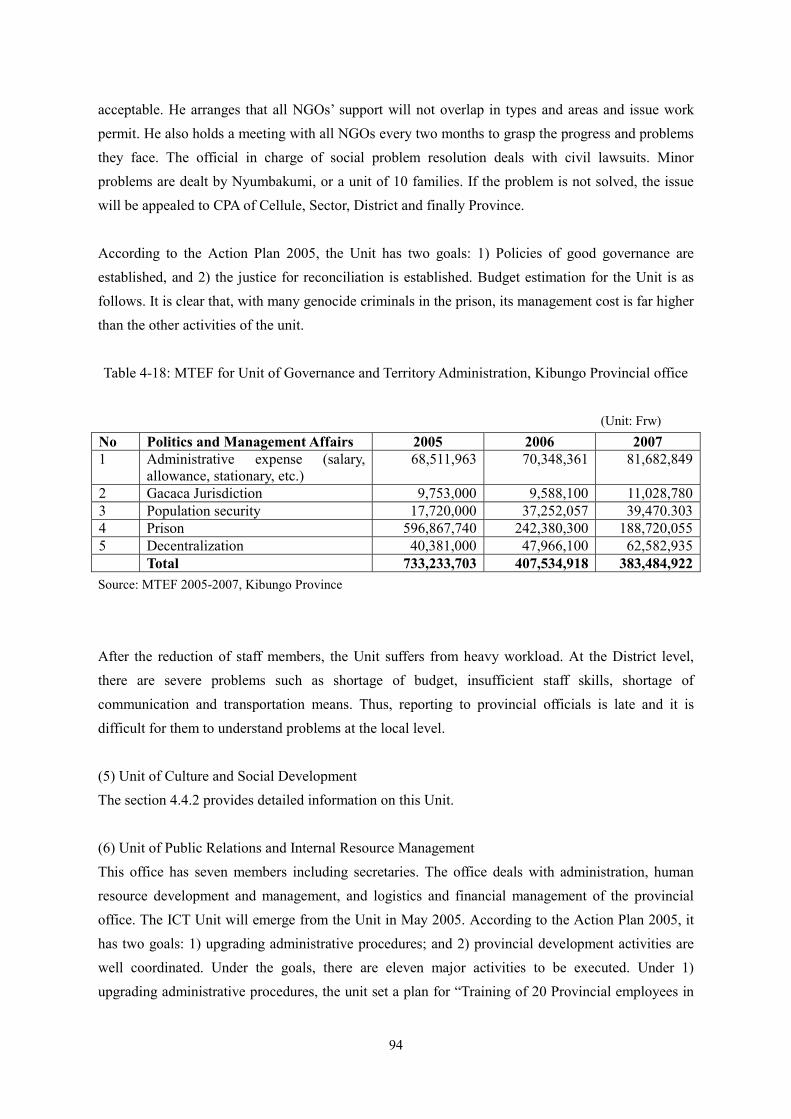
94
acceptable. He arranges that all NGOs’ support will not overlap in types and areas and issue work permit. He also holds a meeting with all NGOs every two months to grasp the progress and problems they face. The official in charge of social problem resolution deals with civil lawsuits. Minor problems are dealt by Nyumbakumi, or a unit of 10 families. If the problem is not solved, the issue will be appealed to CPA of Cellule, Sector, District and finally Province. According to the Action Plan 2005, the Unit has two goals: 1) Policies of good governance are established, and 2) the justice for reconciliation is established. Budget estimation for the Unit is as follows. It is clear that, with many genocide criminals in the prison, its management cost is far higher than the other activities of the unit. Table 4-18: MTEF for Unit of Governance and Territory Administration, Kibungo Provincial office
(Unit: Frw)
No Politics and Management Affairs 2005 2006 2007 1 Administrative expense (salary,
allowance, stationary, etc.) 68,511,963 70,348,361 81,682,849
2 Gacaca Jurisdiction 9,753,000 9,588,100 11,028,7803 Population security 17,720,000 37,252,057 39,470.3034 Prison 596,867,740 242,380,300 188,720,0555 Decentralization 40,381,000 47,966,100 62,582,935 Total 733,233,703 407,534,918 383,484,922Source: MTEF 2005-2007, Kibungo Province
After the reduction of staff members, the Unit suffers from heavy workload. At the District level, there are severe problems such as shortage of budget, insufficient staff skills, shortage of communication and transportation means. Thus, reporting to provincial officials is late and it is difficult for them to understand problems at the local level. (5) Unit of Culture and Social Development The section 4.4.2 provides detailed information on this Unit. (6) Unit of Public Relations and Internal Resource Management This office has seven members including secretaries. The office deals with administration, human resource development and management, and logistics and financial management of the provincial office. The ICT Unit will emerge from the Unit in May 2005. According to the Action Plan 2005, it has two goals: 1) upgrading administrative procedures; and 2) provincial development activities are well coordinated. Under the goals, there are eleven major activities to be executed. Under 1) upgrading administrative procedures, the unit set a plan for “Training of 20 Provincial employees in

95
their respective tasks every year”. The following is the budget plan of the unit.
Table 4-19: MTEF for Unit of Public Relations and Internal Resource Management, Kibungo Provincial office
(Unit: Frw)
No 2005 2006 2007 1 Administrative expense (salary,
allowance, fuel, etc.) 142,097,672 157,774,871 173,934,318
2 Coordination of Districts/Town Activities
2,292,000 2,616,000 2,988,600
3 Coordination of Public Service 2,500,000 2,750,000 3,025,0004 Security and Justice 6,552,000 8,214,000 9,856,0205 Office supply (e.g., furniture, photo
copy, fuel) 1,592,000 1,759,000 1,949,720
6 Central Secretariat (e.g., stationery) 5,527,000 6,103,100 6,746,1707 Communication and Public Relations 11,129,000 12,615,250 13,715,065 Total 171,689,672 191,833,021 212,214,893
Source: MTEF 2005-2007, Kibungo Province
The challenges that the Unit faces are shortage of office equipment and insufficient educational and training levels of staff members. In addition, the number of staff is too small partially due to difficulty in staff recruitment since the decentralization program began: the program requires more strict recruitment criteria for newly employees. To cope with the difficulties, the Unit trains provincial and district/town staff members. The following table shows the implemented training activities in 2003 and January-May 2005.
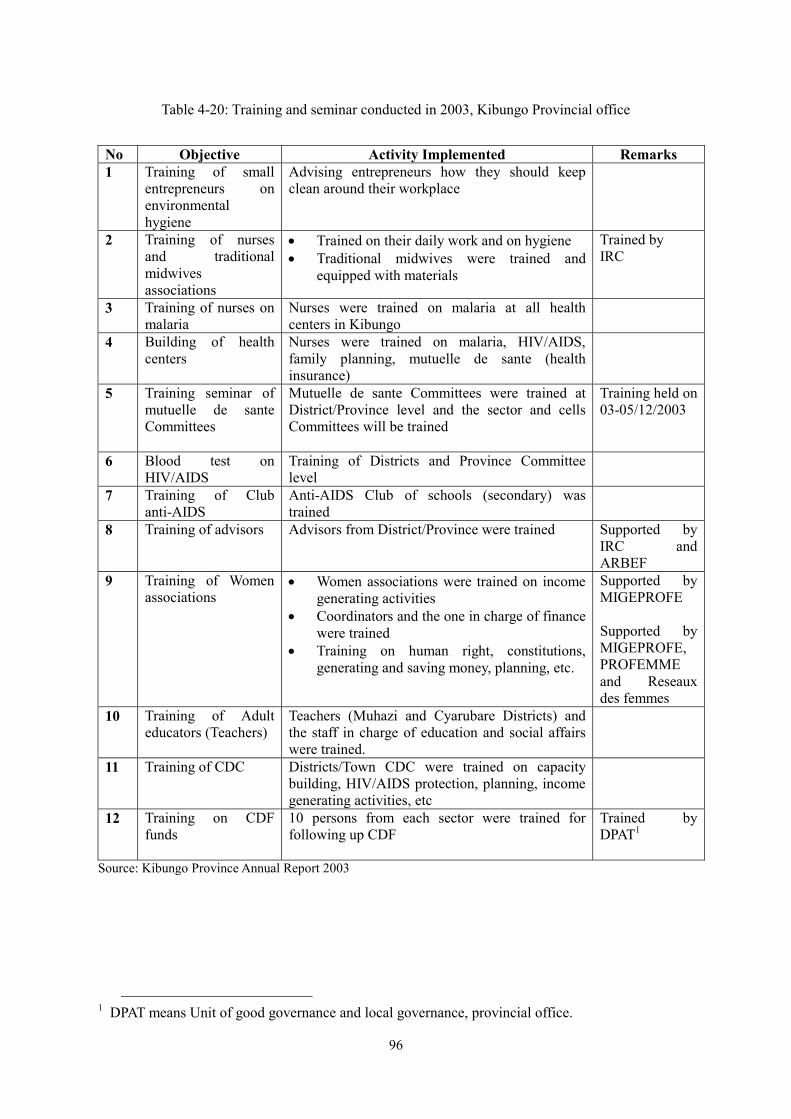
96
Table 4-20: Training and seminar conducted in 2003, Kibungo Provincial office No Objective Activity Implemented Remarks 1 Training of small
entrepreneurs on environmental hygiene
Advising entrepreneurs how they should keep clean around their workplace
2 Training of nurses and traditional midwives associations
• Trained on their daily work and on hygiene • Traditional midwives were trained and
equipped with materials
Trained by IRC
3 Training of nurses on malaria
Nurses were trained on malaria at all health centers in Kibungo
4 Building of health centers
Nurses were trained on malaria, HIV/AIDS, family planning, mutuelle de sante (health insurance)
5 Training seminar of mutuelle de sante Committees
Mutuelle de sante Committees were trained at District/Province level and the sector and cells Committees will be trained
Training held on 03-05/12/2003
6 Blood test on HIV/AIDS
Training of Districts and Province Committee level
7 Training of Club anti-AIDS
Anti-AIDS Club of schools (secondary) was trained
8 Training of advisors
Advisors from District/Province were trained Supported by IRC and ARBEF
9 Training of Women associations
• Women associations were trained on income generating activities
• Coordinators and the one in charge of finance were trained
• Training on human right, constitutions, generating and saving money, planning, etc.
Supported by MIGEPROFE Supported by MIGEPROFE, PROFEMME and Reseaux des femmes
10 Training of Adult educators (Teachers)
Teachers (Muhazi and Cyarubare Districts) and the staff in charge of education and social affairs were trained.
11 Training of CDC
Districts/Town CDC were trained on capacity building, HIV/AIDS protection, planning, income generating activities, etc
12 Training on CDF funds
10 persons from each sector were trained for following up CDF
Trained by DPAT1
Source: Kibungo Province Annual Report 2003
1 DPAT means Unit of good governance and local governance, provincial office.
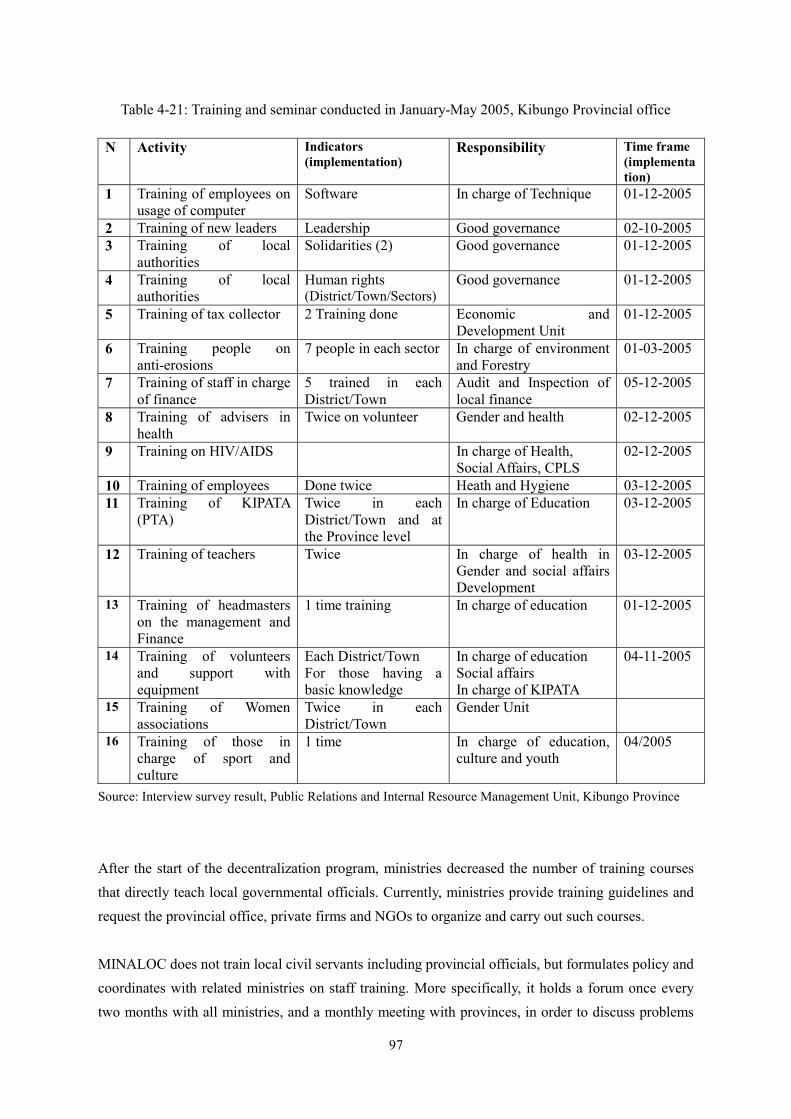
97
Table 4-21: Training and seminar conducted in January-May 2005, Kibungo Provincial office N Activity Indicators
(implementation) Responsibility Time frame
(implementation)
1 Training of employees on usage of computer
Software In charge of Technique 01-12-2005
2 Training of new leaders Leadership Good governance 02-10-2005 3 Training of local
authorities Solidarities (2) Good governance 01-12-2005
4 Training of local authorities
Human rights (District/Town/Sectors)
Good governance 01-12-2005
5 Training of tax collector 2 Training done Economic and Development Unit
01-12-2005
6 Training people on anti-erosions
7 people in each sector In charge of environment and Forestry
01-03-2005
7 Training of staff in charge of finance
5 trained in each District/Town
Audit and Inspection of local finance
05-12-2005
8 Training of advisers in health
Twice on volunteer Gender and health 02-12-2005
9 Training on HIV/AIDS In charge of Health, Social Affairs, CPLS
02-12-2005
10 Training of employees Done twice Heath and Hygiene 03-12-2005 11 Training of KIPATA
(PTA) Twice in each District/Town and at the Province level
In charge of Education 03-12-2005
12 Training of teachers Twice In charge of health in Gender and social affairs Development
03-12-2005
13 Training of headmasters on the management and Finance
1 time training In charge of education 01-12-2005
14 Training of volunteers and support with equipment
Each District/Town For those having a basic knowledge
In charge of education Social affairs In charge of KIPATA
04-11-2005
15 Training of Women associations
Twice in each District/Town
Gender Unit
16 Training of those in charge of sport and culture
1 time In charge of education, culture and youth
04/2005
Source: Interview survey result, Public Relations and Internal Resource Management Unit, Kibungo Province
After the start of the decentralization program, ministries decreased the number of training courses that directly teach local governmental officials. Currently, ministries provide training guidelines and request the provincial office, private firms and NGOs to organize and carry out such courses. MINALOC does not train local civil servants including provincial officials, but formulates policy and coordinates with related ministries on staff training. More specifically, it holds a forum once every two months with all ministries, and a monthly meeting with provinces, in order to discuss problems

98
in training on decentralization and governance and countermeasures for them. Most training sessions on leadership, governance and decentralization are conducted by NGOs and donor agencies including RALGA, Hagunula and Dutsenibere. MINALOC neither coordinates their activities nor prepares the list of training institutions; the province office performs these tasks. Staff members of MINALOC may serve as a lecturer in training upon request. MINITERE does not train water technicians directly. Most training programs for water technicians are done through the water and sanitation program. Currently there are 16 projects and a majority of them are supported by donors and NGOs. According to an interviewee, MINITETE does not think the technical training to local water technicians is sufficient at all. However, an insufficient training budget and shortage of trainers and institutions that can teach water technicians discourage further training. With the support of donors and organizations, a Provincial office conducts training on development planning and financial management to district officials, e.g., executive secretary, accountants, auditors, CDC president, and planning official, once or twice a year for about 5 days. Some interviewees mentioned that district and sector leaders have changed frequently, and trainees often resign after finding other jobs by using skills acquired in the training. Such turnovers in personnel reduce effectiveness of the training. In some areas, technical staff members, e.g., teachers, nurses and staff members in women councils at the district level, receive training from provincial offices and projects. It is commendable to have such training scheme, but a few district officials stated that the number of trainees is not sufficient for daily training activities. In addition, training activities are not conducted in sequential order to train master trainers. While many training programs focus on general development planning and finance management, opportunities for technical training seem to be limited in number.
4.5.2 District/Town Office (1) Organizational structure and staff members The organizational chart and the number of staff members for each position, both before and after the decentralization/organizational restructuring, are in the attached document. Before the decentralization/organizational restructuring program, the maximum number of District staff members was 52. After the decentralization, the number was down to 32. Thus, most districts have about 30 staff members right now. Mayors and Vice Mayors are selected by the District Council that consists of all sectors’ representatives. Their term is 5 years and there is a possibility to be re-elected. General staff members at District offices, or the so-called technicians, are employed by recruitment with examination. The sector’s staff members are elected by Cellule’s representatives and Cellule’s staff members are elected by local people. The next election will take place in 2006. The following
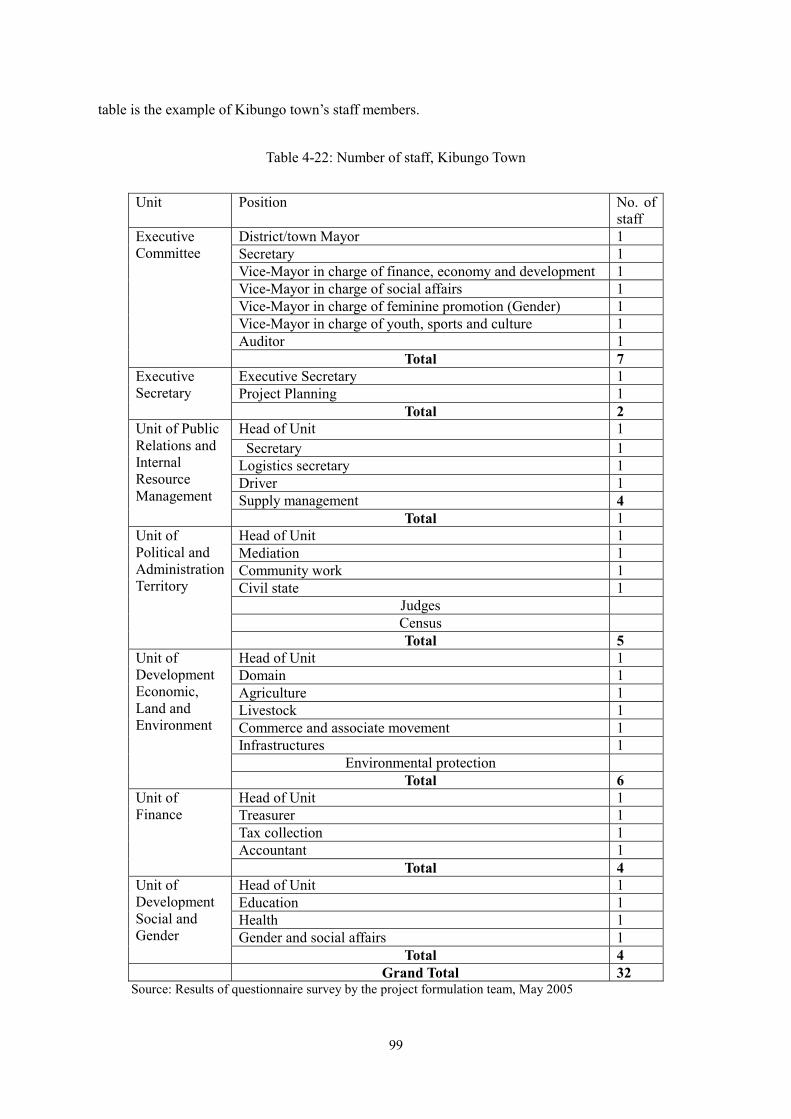
99
table is the example of Kibungo town’s staff members.
Table 4-22: Number of staff, Kibungo Town
Unit Position No. of staff
District/town Mayor 1 Secretary 1 Vice-Mayor in charge of finance, economy and development 1 Vice-Mayor in charge of social affairs 1 Vice-Mayor in charge of feminine promotion (Gender) 1 Vice-Mayor in charge of youth, sports and culture 1 Auditor 1
Executive Committee
Total 7 Executive Secretary 1 Project Planning 1
Executive Secretary
Total 2 Head of Unit 1 Secretary 1 Logistics secretary 1 Driver 1 Supply management 4
Unit of Public Relations and Internal Resource Management
Total 1 Head of Unit 1 Mediation 1 Community work 1 Civil state 1
Judges Census
Unit of Political and Administration Territory
Total 5 Head of Unit 1 Domain 1 Agriculture 1 Livestock 1 Commerce and associate movement 1 Infrastructures 1
Environmental protection
Unit of Development Economic, Land and Environment
Total 6 Head of Unit 1 Treasurer 1 Tax collection 1 Accountant 1
Unit of Finance
Total 4 Head of Unit 1 Education 1 Health 1 Gender and social affairs 1
Unit of Development Social and Gender
Total 4 Grand Total 32
Source: Results of questionnaire survey by the project formulation team, May 2005
100
As for the relationships among District, Sector, and Cellule, District mayor, vice mayors and executive have a weekly meeting with all sector coordinators. Sector CDC members meet monthly and decide each member’s responsibility for the month. CDC cellule members also meet once a week and visit the project sites every week. According to interviewees, many cellule members who represent the general public are illiterate. Thus, project planning, monitoring and implementation are difficult work for them. They also have difficulty going to the weekly meetings and project sites, with limited means of transportation and without salary for the work. Evaluation of vice mayors is done by mayors and provincial office, while district officials are evaluated by executive secretary. If an official’s evaluation result is not good, advice and time will be given to him to improve his attitude and performance. He can be fired if his performance does not improve in a given time. Evaluation is done on performance, based on the activity plan that each staff member prepares. Among the evaluation criteria are monitoring of a project and the quality of reports. Evaluation of council and committee members who are volunteers is also done on the basis of performance. For instance, District women council members are evaluated by the vice mayor in charge of gender, women council members at the provincial level, and sector women council members who selected them. Sector women council members were evaluated by cellule women council members, and cellule women council members were selected by local people. Recruitment of district staff can be done at the district level. Vice mayors, executive secretary and recruitment committee conduct examination and interview for the applicant of vacant positions. (2) Finance of the District and Sector Offices in Kibungo Province District office has 2 types of financial resources: the central government’s budget distribution and local tax. The financial resources from the central government are the following: 1) recurrent budget (salary, operational cost); 2) CDF (for development activities); and 3) Budget for Social Affairs are given to district offices. 3% of the central government budget is shared by all districts and towns based on the formula that considers population size and poverty level and distributes funds as recurrent budget. The recurrent budget consists of such items as staff salary and development budget. As for CDF, all districts and towns are supposed to receive the same amount of money regardless of population and poverty level. The amount is 45 million FRW annually from 2001 to 2004 and 65 million FRW from 2005. However, CDF is distributed in phases so that not all planned budget is distributed in a year. The amount of the Social Affairs Budget is not set on an annual basis. The budget is used for such items as tuition of secondary school for children from poor households, and iron sheet distribution for constructing shelters for socially vulnerable households. The detailed information is in the following chapter of this report.

101
Local taxes include the following: income tax, market tax, property tax, rent tax, bicycle tax, patent tax, licenses and permission. The largest portion of local taxes comes from the income tax from local businesses, markets and shops. In Kabarondo District, 38% of the annual revenue comes from local taxes. Detailed information on Kabarondo district’s activities and budget is attached. Newly established Districts such as Cyarubare seem especially to have difficulty raising local taxes as much as they wish. Before the decentralization, most projects took a long time for preparation because the tender was conducted at the central level. Now it takes less time since MINALOC directly distributes CDF to each District office and the tender is done at the provincial and district level. However, many districts have stated that the district budget is not sufficient for their planed projects, and distribution of the central government’s budget is often late. The following two tables prove that there is a gap between district/town’s planned/applied budget and actual revenue. Almost all revenues received from the central government are used by the districts and towns. In order to supplement the budgetary shortage, they request support from donor agencies and NGOs.
Table 4-23: District/Town budget and revenue in Kibungo Province in 2003
(Unit: Frw) District/ Town
Running Cost (Recurrent Budget) Budget for Development
Planned Budget
Revenue % of distri- bution
Planned Budget
Revenue % of distri- bution
1 Cyarubare 65,210,936 50,695,951 77.74% 93,894,966 64,731,028 68.94%2 Kabarondo 61,685,390 32,423,151 52.56% 49,500,000 35,936,410 72.60%3 Kibungo 44,462,022 39,765,401 89.44% 23,833,326 32,819,778 137.71%4 Kigarama 102,640,000 27,956,992 27.24% 60,000,000 38,542,055 64.24%5 Mirenge 110,038,340 25,986,125 23.62% 287,950,000 45,823,851 15.91%6 Muhazi 45,895,000 28,508,874 62.12% 138,878,679 25,220,307 33.00%7 Nyarubuye 91,450,000 22,592,338 24.70% 142,510,000 43,923,099 30.82%8 Rukira 48,696,308 28,449,171 58.42% 338,727,268 24,290,472 7.17%9 Rusumo 35,023,082 52,117,720 148.81% 155,560,000 26,100,944 16.78%10 Rwamagana 63,023,082 36,636,461 58.13% 248,153,510 34,514,528 13.91%Total 668,124,160 345,132,184 51.66% 1,539,007,749 371,902,472 24.17%
Source: MTEF 2005-2007, Kibungo Province

102
Table 4-24: District/Town planned and actual expenditure in Kibungo Province in 2003
(Unit:Frw)
District/Town Running Cost (Recurrent cost) Development Expenditure Planned
expenditure Expenditure % of
expendi- ture
Planned expendi- ture
Expendi- ture
% of expendi-ture
1. Cyarubare 65,210,936 56,623,668 86.83% 93,874,966 64,635,028 68.85%2. Kabarondo 59,042,484 35,455,144 60.05% 35,861,400 16,408,028 45.75%3. Kibungo 64,642,470 36,917,713 57.11% 6,816,233 36,916,944 541.60%4. Kigarama 42,385,000 27,677,321 65.30% 997,150,000 42,131,959 4.23%5. Mirenge 110,380,34
0 25,984,310 23.54% 287,950,000 32,623,972 11.33%
6. Muhazi 46,230,810 28,263,732 61.14% 138,879,679 30,444,155 21.92%7. Nyarubuye 69,246,388 22,510,525 32.51% 153,795,000 25,740,038 16.74%8. Rukira 68,546,573 24,303,610 35.46% 338,727,268 17,116,755 5.05%9. Rusumo 41,631,178 46,099,336 110.73
%172,459,936 25,756,579 14.93%
10. Rwamagana
63,023,082 34,790,600 55.20% 249,153,510 45,280,997 18.17%
Total 630,339,261 338,625,959 53.72% 2,474,667,992 337,054,455 13.62%
Source: MTEF 2005-2007, Kibungo Province
(3) Influence of decentralization and organizational restructuring on district officials Before the decentralization program took place, Bourgmestre at District office and sector coordinator were the ones who had major decision making power in their jurisdictions. Local people seldom participated in planning of development activities. The District was required to submit a request every time to pay staff salary and other activities if the amount exceeded 50,000 FRW. A major positive impact of decentralization is that local people are now heavily involved in the process of development planning and implementation due to the bottom-up approach. Since a majority of people live at imidugudu together in Kibungo, it is easier for them to prepare and implement social infrastructure development projects such as construction of schools and health centers. Now, the roles and responsibilities of mayors are shared by vice mayors, unit chiefs, and various commissions and committees. Thus the decision making and implementation process became more transparent. Many public services, e.g., issuing ID cards and marriage certificates, and conflict resolution are done at the Cellule and Sector levels so that people do not need to go to the Provincial office often. In addition, staff members are now recruited with more strict criteria at province and district offices for smooth introduction of the organizational restructuring program. Thus, many interviewed officials stated that the efficiency and effectiveness of their staff members have improved. Donors and NGOs also refer to PDC for their policy planning and explain the planning
103
more at the district and local levels. However, there are many challenges to local governmental officials, as indicated in the attached SWOT analysis. Due to the workforce reduction of district officials, many staff members bear heavy workload. The planned CDF budget by a district is often not allocated in full amount and on time. Staff members have very limited means of transportation and communication means for increased numbers of meetings and site visits. Draft of PDC is first developed at cellule and sector levels that lack qualified personnel in project planning, cost estimation, and technical designing of facilities such as water facilities. Thus district offices need to spend extra time and efforts to correct the draft. The implementation process also takes place at the cellule and sector levels. Many cellule and sector staff members lack skills to supervise contractors, write reports, and monitoring and evaluate projects. A few projects without sufficient budgets were terminated. In other projects, contractors did not perform well and left the projects unfinished. Improvement caused a shortage of personnel in the realms of education, healthcare, and welfare. The social welfare programs on education, health, and socially vulnerable groups’ protection, increased substantially the number of primary students and patients at health centers. Consequently, schools and health institutions suffer from shortage of staff members, i.e., teachers and nurses. Although the province office has been trying very hard to train teachers and nurses, it has still a long way to meet the demand. While sector and cellule staff members have important responsibilities, they do not receive salary from government except the sector coordinator. Neither do they have sufficient training opportunities. The district often trains sector coordinator, executive secretary and accountant, but provides few training opportunities for other staff members. Trained district officials are expected to teach the sector staff members more often. However, lack of time, money and transportation means prevent them from organizing seminars. Only a few NGOs train them on project planning and technical issues such as family laws for women council. NGOs may not conduct such training programs next year since they conduct training only when they receive funding from donors. Furthermore, the NGOs and donors that provide training do not seem to work together to standardize the training quality and trainees. Thus the level and contents of training vary depending on the training institutions.
4.5.3 Ideas for improving capacity building programs The following ideas are worth considering for setting up effective training courses at the district and sector levels: (1) including practical training for current development planning/ finance management training, and (2) improvement of technicians’ training. Training programs on development
104
planning/monitoring and finance management in the classroom are very important. However, they tend to focus more on theory and basic principles than practice. In order for trainees to examine and master their learned skills and knowledge, on-the-job training is crucial. The effects of training would be greatly enhanced through application of learned skills and knowledge in the implementation of a project. Feedback from such practical application will improve training quality. Furthermore, through training on technical staff such as officials in charge of water/sanitation, agriculture, and gender, and project managers, i.e. executive secretary and planning officer, at the same time in a project, communication and cooperation between technicians and project managers would improve. For instance, if project managers and water technicians receive training on proper tender, supervision of contractor’s work, and repair of water facilities, by using an actual case of water supply facility construction, then it will be much easier to design proper facility, select appropriate contractor, and estimate a reasonable cost and project period. It may make sense for project managers to plan a project by considering expected problems in facility maintenance, e.g., budget for necessary spare parts. Improvement in the work process can be applied in other fields of activities such as health and youth affairs in the district and other districts. Such work process can then serve as a good model for planning and management of a project. Technicians have very limited training opportunities. In fact, they are only trained in implementing national programs and projects of NGOs and donors. As a result, the quality of technicians is not sufficient for increasing the technical viability of a project plan and a budget written in PDC. It makes sense to train more technicians. Many interviewees recognized the need. In order to increase the frequency and improve the quality of technical training programs, it would be a good idea to support technical units of the provincial office in organizing training. In order to ensure regular training execution, it would also be sensible to put high priority on it in PDC every year because the planned budget of CDF is often not allocated in full amount. It is desirable to have two types of training programs: one for general technicians and another for master trainers. Master trainers are to receive training in sequence so that their understanding level will be sufficient for them to be teachers of technicians at the sector and cellule levels. For this purpose, on-the-job technical training in a project would be especially beneficial for master trainers. Then, sector and cellule staff members can gain more training opportunities from them. For the trained technicians to work for the well-being of the local population by using their acquired skills and knowledge, the local population needs to know the addresses of the technicians. It would be wise to prepare, regularly update, and distribute a list of technicians with contact information in each district, sector and cellule where associations, councils and committees can request technical assistance for villagers. Such list would enable villagers to receive their advice and services when needed and make it possible to utilize knowledge and skills acquired in the project in a sustainable fashion, even after the project duration.
Chapter 5
Rural Development Program for Kibungo Province
105
5. Rural Development Program for Kibungo Province 5.1 Development Issues at Kibungo
As stated in Chapter 5, the Kibungo Provincial government established a strategic plan for three years from 2005 to 2007. Based on the PDC of all Districts and Towns, this plan indicates main development issues. The top seven issues are as follows.
1. Difficult access to clean water 2. Difficult access to health care 3. High degradation of the environment 4. Low farming and livestock production 5. Limited access to education 6. Insufficient energy resources 7. Weak integration of women
Interviewees in field surveys and participants in RRA/PLA also mentioned these issues. Thus the Kibungo strategic plan reflect needs of people at the grassroots level. During the PDC formulation, a needs analysis was done from the cell level, then CDC members and other stakeholders in the sector and district levels formulated and gave priorities to projects based on the needs from grassroots. Most people in Kibungo might not know about PDC written in French. However, each PDC and the Kibungo strategic plan based on all PDCs reflect their needs. Therefore, the contents of PDC and the strategic plan should be respected in formulating details of the program. This program formulation process is in line with the system of the Rwandese government. The establishment of the government health insurance system has brought about some progress in access to health care. Access to education has also been improving gradually because primary schools have been free of charge since 2003. On the other hand, the conditions related to other issues seem to be getting worse. Access to clean water is the most critical development issue for rural residents. They face a heavy workload of fetching water and unhealthy conditions due to lack of clean water and an unsatisfactory level of hygiene. Common illnesses of rural residents such as diarrhea and malaria mainly result from a lack of hygiene activities in their areas. Both degradation of the environment and insufficient energy sources, scarcity of firewood in particular, have the same cause. The high environment degradation is mainly due to massive deforestation. Residents use trees not only for house construction but also for daily cooking and

106
lighting. Thus resources were overexploited. In addition, low agricultural production is also hindering economic development in rural areas. Low agricultural production is also related to other issues such as less working time due to fetching water and firewood, environmental degradation, and unhealthy status of farmers. Those issues are thus intertwined. The strategic plan of Kibungo Province has three development areas, such as (1) human development, (2) economic development, and (3) good governance. Each area has several priority programs. The human development area gives more priority to water and sanitation, AIDS and malaria, education, women integration and health. The economic development area pays attention to the environment, agriculture and livestock, and energy. During the program formulation, those priority programs should be considered carefully to suit Rwandese needs and systems. 5.2 Rural Development Program for Kibungo Province
5.2.1 Necessity of a rural development program and its framework As mentioned above, safe water development is the highest priority in Kibungo. Therefore, it is critical to take urgent action to solve water problems. Meanwhile, the Japanese government has given more priority on rural development as well as human development. The water problem is the biggest obstacle in rural development in Kibungo. Accordingly, addressing water problems is also in line with the Japanese government policy on assistance to Rwanda. However, solving the water problem might not give direct impact on poverty reduction, the ultimate goal of PRSP. To improve livelihoods of the local population, economic activities must be revitalized. Safe water is one of the basic elements for effective economic activities. Thus, after solving water issues, successive activities for rural economic development such as agricultural development and small business establishment may be implemented to achieve poverty reduction in Kibungo. Based on the field survey, the team learned that issues are intertwined. It is thus necessary to address a few problems simultaneously during the program formulation. Individual projects under the program are not fragmented but have clear flows in terms of timeline and steps to produce synergy of projects. This framework is also useful for cooperation with other development actors such as donors and NGOs as well as for using limited resources effectively. If the clear framework is established, other partners easily understand the areas in which they can work together. This framework can also be utilized for effective monitoring of the program. The proposed rural development program needs concrete steps to achieve ultimate objectives

107
because the capacity of development actors and resources of the Japanese government are limited. To produce the maximum impact, two programs are proposed. The first is for improvement of water access and hygiene conditions to fulfill the basic needs of people and minimize negative factors for rural economic development. This program consists of two phases: 1) capacity development of central and provincial government staff for rural water supply development and 2) direct intervention to rural areas to improve water access and hygiene conditions. After removing the negative factors through the implementation of the first program, the second program is to address rural economic development to alleviate poverty.
Figure 5-1: Steps for rural development program for Kibungo Province
5.2.2 Objectives and implementation schedule of each program and project Objectives and implementation schedule of each program and project are shown in the table 5-1. (1) Program I, Phase 1 The purpose of Program I, Phase 1, is to focus on capacity building of management at water supply facilities at the Central and Provincial government level. In this phase, taking advantage of aspects of the prospective Grant Aid project’s implementation such as Basic Design, Detailed Design, construction and supervision, a draft manual of a standardized project cycle may be formulated.
Capacity building of central and provincial
govt. staff
Improvement of water and hygiene conditions
Improvement of economic status
Step
Step II
Step
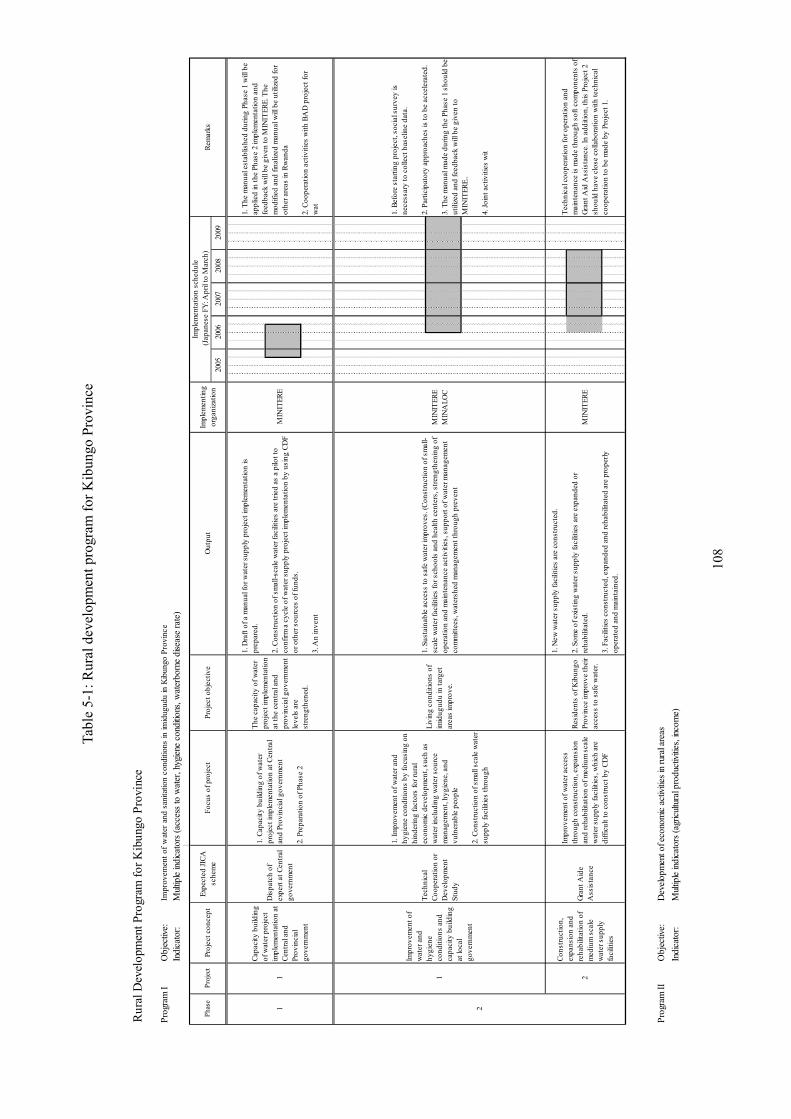
10
8
Tabl
e 5-
1: R
ural
dev
elop
men
t pro
gram
for K
ibun
go P
rovi
nce
Rur
al D
evel
opm
ent P
rogr
am fo
r Kib
ungo
Pro
vinc
e
Prog
ram
IO
bjec
tive:
Impr
ovem
ent o
f wat
er a
nd s
anita
tion
cond
ition
s in
imid
ugud
u in
Kib
ungo
Pro
vinc
eIn
dica
tor:
Mult
iple
indica
tors
(acc
ess t
o w
ater
, hyg
iene
cond
itions
, wat
erbo
rne
dise
ase
rate
)
Prog
ram
IIO
bjec
tive:
Dev
elopm
ent o
f eco
nom
ic ac
tivitie
s in
rura
l are
asIn
dica
tor:
Mult
iple
indica
tors
(agr
icultu
ral p
rodu
ctivi
ties,
incom
e)
Rem
arks
2
Cons
truct
ion,
expa
nsio
n an
dre
habi
litat
ion
ofm
ediu
m s
cale
wat
er s
uppl
yfa
cilit
ies
Gran
t Aid
eA
ssis
tanc
e
Impr
ovem
ent o
f wat
er a
cces
sth
roug
h co
nstru
ctio
n, e
xpan
sion
and
reha
bilit
atio
n of
med
ium
sca
lew
ater
sup
ply
faci
litie
s, w
hich
are
diffi
cult
to c
onst
ruct
by
CDF
Resi
dent
s of
Kib
ungo
Prov
ince
impr
ove
thei
rac
cess
to s
afe
wat
er.
1. N
ew w
ater
sup
ply
faci
litie
s ar
e co
nstru
cted
.
2. S
ome
of e
xistin
g w
ater
sup
ply
faci
litie
s ar
e ex
pand
ed o
rre
habi
litat
ed.
3. F
acili
ties
cons
truct
ed, e
xpan
ded
and
reha
bilit
ated
are
pro
perly
oper
ated
and
mai
ntai
ned.
MIN
ITER
E
Tech
nica
l coo
pera
tion
for o
pera
tion
and
mai
nten
ance
is m
ade
thro
ugh
soft
com
pone
nts
ofGr
ant A
id A
ssis
tanc
e. In
add
ition
, thi
s Pr
ojec
t 2sh
ould
hav
e cl
ose
colla
bora
tion
with
tech
nica
lco
oper
atio
n to
be
mad
e by
Pro
ject
1.
2007
2008
2009
Impl
emen
tatio
n sc
hedu
le (J
apan
ese
FY: A
pril
to M
arch
)
2006
2005
Phas
ePr
ojec
tPr
ojec
t con
cept
Expe
cted
JICA
sche
me
Focu
s of
pro
ject
Proj
ect o
bjec
tive
Out
put
1
Capa
city
bui
ldin
gof
wat
er p
roje
ctim
plem
enta
tion
atCe
ntra
l and
Prov
inci
algo
vern
men
t
Dis
patc
h of
expe
rt at
Cen
tral
gove
rnm
ent
1. C
apac
ity b
uild
ing
of w
ater
proj
ect i
mpl
emen
tatio
n at
Cen
tral
and
Prov
inci
al g
over
nmen
t
2. P
repa
ratio
n of
Pha
se 2
Impl
emen
ting
orga
niza
tion
1. T
he m
anua
l est
ablis
hed
durin
g Ph
ase
1 w
ill b
eap
plie
d in
the
Phas
e 2
impl
emen
tatio
n an
dfe
edba
ck w
ill b
e gi
ven
to M
INIT
ERE.
The
mod
ified
and
fina
lized
man
ual w
ill b
e ut
ilize
d fo
rot
her a
reas
in R
wan
da
2. C
oope
ratio
n ac
tiviti
es w
ith B
AD
pro
ject
for
wat
1. B
efor
e st
artin
g pr
ojec
t, so
cial
sur
vey
isne
cess
ary
to c
olle
ct b
asel
ine
data
.
2. P
artic
ipat
ory
appr
oach
es is
to b
e ac
cele
rate
d.
3. T
he m
anua
l mad
e du
ring
the
Phas
e 1
shou
ld b
eut
ilize
d an
d fe
edba
ck w
ill b
e gi
ven
toM
INIT
ERE.
.
4. Jo
int a
ctiv
ities
wit
The
capa
city
of w
ater
proj
ect i
mpl
emen
tatio
nat
the
cent
ral a
ndpr
ovin
cial
gov
ernm
ent
leve
ls a
rest
reng
then
ed.
MIN
ITER
E
MIN
ITER
EM
INA
LOC
1
1
1. S
usta
inab
le a
cces
s to
saf
e w
ater
impr
oves
. (Co
nstru
ctio
n of
sm
all-
scal
e w
ater
faci
litie
s fo
r sch
ools
and
hea
lth c
ente
rs, s
treng
then
ing
ofop
erat
ion
and
mai
nten
ance
act
iviti
es, s
uppo
rt of
wat
er m
anag
emen
tco
mm
ittee
s, w
ater
shed
man
agem
ent t
hrou
gh p
reve
nt
1. D
raft
of a
man
ual f
or w
ater
sup
ply
proj
ect i
mpl
emen
tatio
n is
prep
ared
.
2. C
onst
ruct
ion
of s
mal
l-sca
le w
ater
faci
litie
s ar
e tri
ed a
s a
pilo
t to
conf
irm a
cyc
le o
f wat
er s
uppl
y pr
ojec
t im
plem
enta
tion
by u
sing
CD
For
oth
er s
ourc
es o
f fun
ds.
3. A
n in
vent
1. Im
prov
emen
t of w
ater
and
hygi
ene
cond
ition
s by
focu
sing
on
hind
erin
g fa
ctor
s fo
r rur
alec
onom
ic d
evel
opm
ent,
such
as
wat
er in
clud
ing
wat
er s
ourc
em
anag
emen
t, hy
gien
e, a
ndvu
lner
able
peo
ple
2. C
onst
ruct
ion
of s
mal
l sca
le w
ater
supp
ly fa
cilit
ies
thro
ugh
Livi
ng c
ondi
tions
of
imid
ugud
u in
targ
etar
eas
impr
ove.
Impr
ovem
ent o
fw
ater
and
hygi
ene
cond
ition
s an
dca
paci
ty b
uild
ing
at lo
cal
gove
rnm
ent
Tech
nica
lCo
oper
atio
n or
Dev
elop
men
tSt
udy
2

109
Then small scale water supply facilities are to be constructed on a trial basis through CDF or other sources of funds to verify the contents of the manual. This manual is to be utilized during the phase 2 implementation and some feedback may be given to finalize the manual. In addition, an inventory of both man-made and natural water points is to be made in order to have basic information for water supply development. Finally, capacities of Central and Provincial government staff for project implementation on rural water supply are to be strengthened.
(2) Program I, Phase 2 Phase 2 of Program I focuses on improving water and hygiene conditions of imidugudu in Kibungo Province. This phase is to minimize hindering factors for economic development in rural areas. 1) Project 1 Project 1 is a technical cooperation component to strengthen activities for improvement of water access and hygiene conditions. In this Project, there are four major outputs. The first is improvement of sustainable access to safe water. Under this output, small water supply facilities that are not to be constructed by Grant Aid Assistance including water tanks for schools and health centers are to be built with CDF or other funding sources. During the construction process, for improving their capacity, local government staff and beneficiaries are to be engaged in the whole cycle of project implementation, i.e. designing, quotation, bidding, supervision of construction, inspection, operation and maintenance, activities of water management committee, monitoring and evaluation. Moreover, to sustain water sources, measures are to be implemented not only for operation and maintenance of facilities but also for water source conservation by reforestation and reduction of firewood consumption. The second is the strengthening of hygiene activities in imidugudu. The hygiene conditions of imidugudu have deteriorated since its establishment. Thus sanitary education and introduction of appropriate technology for latrine construction are to be conducted. The third output is the strengthening of supporting activities to vulnerable people in imidugudu. Vulnerable people such as widows and orphans are struggling in extreme poverty. Some of them are supported by neighbor residents through traditional supporting systems such as Umuganda and Umusanzu. However, those measures alone do not improve their lives. Residents are afraid that latent instability and danger in imidugudu will increase if they leave vulnerable people as they are. Thus, even though the residents themselves are also poor, they put high priority on support to vulnerable people. The following measures are needed to help vulnerable people: strengthening of supporting activities through associations and traditional supporting systems, improvement of their hygiene conditions, and provision of minimum basic necessities.

110
Through implementation of activities under the three outputs, the fourth output, or improvement of capacities of Cell, Sector District/Town and Province offices for implementing water supply and hygiene projects, is to materialize. 2) Project 2 Project 2 is about the construction, expansion and rehabilitation of medium scale water supply facilities through Grant Aid Assistance. The expected number of beneficiaries is approximately 240,000. The details of this project are in the section 6.1. (3) Program II Through Program I, the foundation of economic development is to be established by fulfilling basic needs of residents. Then, Program II is an economic development stage to alleviate poverty through revitalizing economic activities in rural areas. For economic development, technical cooperation is to be implemented to improve agricultural production and establish small businesses. Components of this stage should be formulated in consideration of the results and information from Program I as well as the Development Study on agricultural development in Kigali Ngali Province. The survey found that construction of such rural infrastructures as soil erosion prevention facilities, water control facilities for marshland development, post harvest facilities, and rural roads seems to boost economic development in rural areas. During the Program II implementation, infrastructure development may thus produce synergy with a technical cooperation project. Therefore, the feasibility of rural infrastructure development should be examined with technical cooperation project activities in mind. The next pages spell out the details of all Program components.

111
5.2.3 Program I: Improvement of water and sanitation conditions in imidugudu in Kibungo Province (2005 - 2009) (1) Program I (Phase 1: 2005 - 2006)
(Capacity building of water project implementation at Central and Provincial government) 1. Name of the Project: Project for capacity building of water project implementation 2. Scheme: Dispatch of an expert 3. Implementation Ministry: MINITERE 4. Project site: Central government and Kibungo Province * Expert to be assigned at MINITERE is going to work both at MINITERE and in Kibungo Province. 5. Period of cooperation: 1 year 6. Present conditions and issues: Due to the decentralization, local governments have been responsible for management, operation and maintenance of water supply facilities that Electrogaz does not own, particularly at District and Town levels. However, the systems of management, operation and maintenance of water supply facilities vary from place to place and many water supply facilities are not well maintained. To have more effective operation and maintenance for the facilities, it is very important that both technical aspects such as repairing and maintenance, and management aspects such as collection of water fees and strengthening of organizational functions, are simultaneously strengthened. However, there is no database of basic information and manuals for operation of water supply facilities at the central and provincial government levels. It is very urgent to prepare a database of water supply facilities that includes technical and management information, and manuals for supporting implementation of a water supply project in rural areas by district governments. 7. Summary of the project 1) Objective To strengthen the capacity for water project implementation at the central and provincial government levels. 2) Output a. A draft manual for water supply project implementation is prepared. b. Small water facilities are constructed on a trail basis to verify a cycle of water supply project
implementation by using CDF or other sources of funds. c. An inventory on water supply facilities is established. 3) Input Expert on water supply planning and implementation
Remarks
• The expert should work in close coordination with the social and institutionalcomponent of the grant aid program and technical cooperation or development study in Phase 2. The manual established during Phase 1 will be applied in the Phase 2 implementation and feedback will be given to MINITERE. The modified and finalized manual will be utilized for other areas in Rwanda. Contents of the manual should be flexible with room for opinions of local government and respect decentralization by avoiding a top-down approach.
• Cooperation with the BAD project for water technicians needs to be considered.

112
(2) Program I (Phase 2: 2006 -) 1) Project 1 (Technical cooperation for improvement of water and hygiene conditions in imidugudu) 1. Name of the Project: Project for improvement of water and hygiene conditions 2. Scheme: Technical Cooperation or Development Study 3. Implementation Ministries: MINITERE and MINALOC 4. Project site: Kibungo Province 5. Period of cooperation: about 4 years 6. Present conditions and issues: (1) Difficult access to safe water The piped water supply system in Kibungo Province Coverage covers very limited areas. Most residents in rural areas have no access to safe water and end up using unclean water from marshlands and puddles. Thus they suffer from frequent diarrhea. Moreover, the residents spend 1 to 5 hours fetching water from the bottom of valleys more than 100 m below their imidugudu. As a result, they cannot spare enough time for economic activities such as agriculture and small business, and this has hampered economic development in rural areas. In addition, water shortage is very serious at public facilities such as schools and health centers. School children have to bring small containers of water for drinking and washing their hands. Family members of patients also bring water voluntarily for health centers. (2) High demand for firewood and degradation of forests More than 90% of the residents of Kibungo Province are now living in imidugudu. During the establishment of imidugudu, many residents constructed their houses by using much timber harvested from forests around their imidugudu. Demand for firewood is also very high because more than 95% of the population of Kibungo Province relies on this energy source for cooking. These factors caused rapid deforestation. To stop deforestation, a recent government policy prohibits residents from cutting trees, even blanches, inside the government land. Even in private forests, residents cannot harvest trees without permission from local governments. However, residents without access to enough firewood in their land collect firewood illegally from government forests. Degradation of forests seems to have a serious negative impact on spring water sources in Kibungo because deforestation will probably decrease the water holding capacity of soil in the long run. Deforestation will also cause scarcity of energy for daily cooking. (3) Poor hygiene in imidugudu Since many residents utilize unsafe stagnant water from puddles and marshlands without any treatments, they frequently suffer from diarrhea. Moreover, most of the latrines constructed by residents do not meet satisfactory hygiene standards and are located near the residential areas. Flies can go in and out from the latrines freely and contaminate foods cooked and served in households. Frequent diarrhea may result from not only unsafe water but also poor latrine management. Many residents worry about outbreak of epidemics such as cholera. (4) Vulnerable people in imidugudu Vulnerable people such as widows and orphans are struggling against extreme poverty. However, it is very difficult for them to ameliorate their situations on their own. Residents in imidugudu are helping those vulnerable people through traditional supporting systems like Umuganda, but that does not improve their lives drastically. Residents are afraid that latent instability and danger in imidugudu will increase if they leave vulnerable people alone. Thus, they feel that more support should be given to vulnerable people.

113
To improve hygiene conditions in imidugudu through proper latrine construction, all residents in imidugudu should take actions simultaneously because they live together in a small area where flies move around easily. However, due to financial constraints, vulnerable people in imidugudu are unable to implement such activities without outside support. 7. Summary of the project 1) Objectives Water and hygiene conditions of imidugudu in target areas improve. 2) Output a. Sustainable access to safe water improves.
(Construction of small water facilities for schools and health centers, strengthening of operation and maintenance activities, support of water management committees, watershed management through prevention of soil erosion and re-forestation.)
b. Implementation of hygiene activities in imidugudu is strengthened.
(sanitary education, appropriate technology for latrine construction)
c. Support to vulnerable people to improve their living conditions is strengthened. (support activities through association, strengthening of traditional support activities, improvement of their hygiene conditions, provision of minimum materials)
d. Capacities of Cell, Sector District/Town and Province offices for implementing water supply
and hygiene projects improve. 4) Input a. Dispatch of experts:
Chief advisor/capacity building, coordinator/monitoring and evaluation, participatory development, water supply management, water supply engineering, sanitary education, IEC, social forest, etc.
b. Provision of machinery and equipment c. Counterpart training in Japan d. Dispatch of a survey team if necessary Remarks
• Before the start or at the start of this project, a social survey is needed for collecting baseline data and grasping local conditions precisely.
• At the beginning of this project, enough time should be secured to accelerate stakeholders and beneficiaries’ participation and understanding of project activities. Much effort should be made to foster their ownership of the project.
• Watershed management is for long-term benefits. However, beneficiaries always expect short-term benefits. Thus the activities for both types of benefits should be incorporated into the project. For example, forestation is made not only for watershed management but also for firewood and fruit production for quick benefits.
• The manual made in the Phase 1 should be utilized and feedback will be given to MINITERE. The modified and finalized manual will be utilized for other areas in Rwanda.
• Joint activities with GTZ in capacity development for local government staff need to be considered.
• Projects indicated in PDC are given higher priority during the construction of small water supply facilities. However, feasibility of the projects in PDC must be carefully examined.
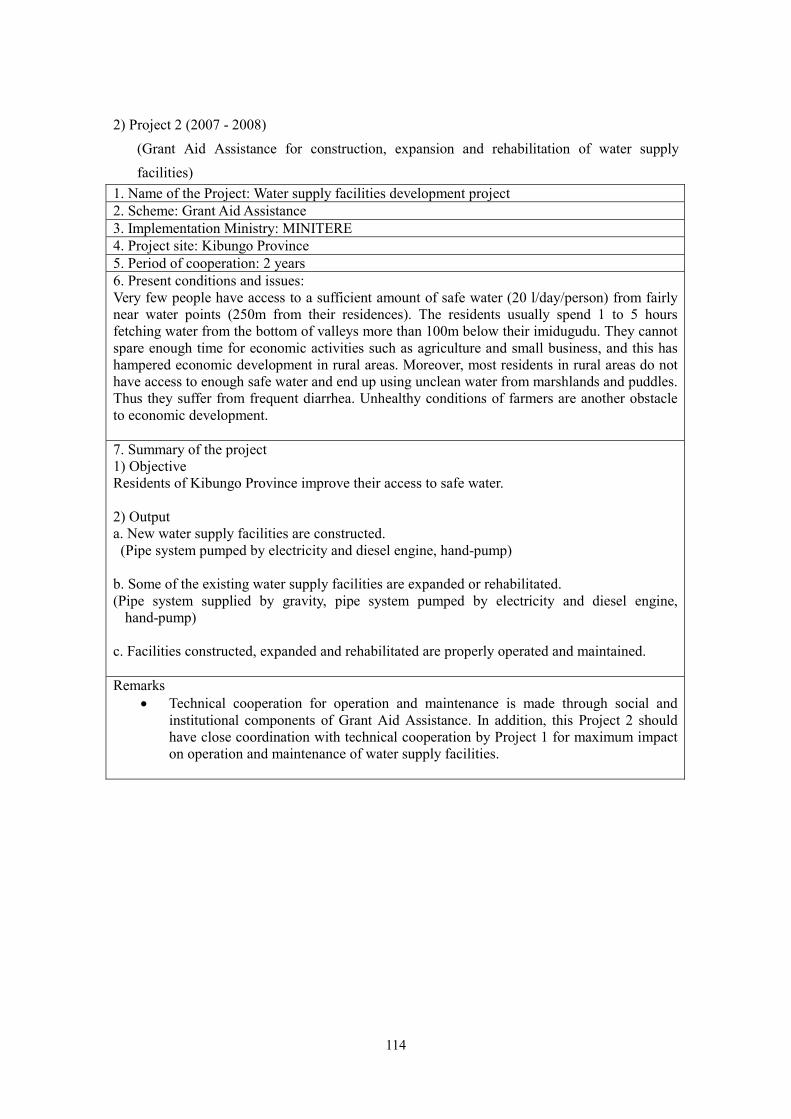
114
2) Project 2 (2007 - 2008) (Grant Aid Assistance for construction, expansion and rehabilitation of water supply facilities)
1. Name of the Project: Water supply facilities development project 2. Scheme: Grant Aid Assistance 3. Implementation Ministry: MINITERE 4. Project site: Kibungo Province 5. Period of cooperation: 2 years 6. Present conditions and issues: Very few people have access to a sufficient amount of safe water (20 l/day/person) from fairly near water points (250m from their residences). The residents usually spend 1 to 5 hours fetching water from the bottom of valleys more than 100m below their imidugudu. They cannot spare enough time for economic activities such as agriculture and small business, and this has hampered economic development in rural areas. Moreover, most residents in rural areas do not have access to enough safe water and end up using unclean water from marshlands and puddles. Thus they suffer from frequent diarrhea. Unhealthy conditions of farmers are another obstacle to economic development. 7. Summary of the project 1) Objective Residents of Kibungo Province improve their access to safe water. 2) Output a. New water supply facilities are constructed. (Pipe system pumped by electricity and diesel engine, hand-pump) b. Some of the existing water supply facilities are expanded or rehabilitated. (Pipe system supplied by gravity, pipe system pumped by electricity and diesel engine,
hand-pump) c. Facilities constructed, expanded and rehabilitated are properly operated and maintained. Remarks
• Technical cooperation for operation and maintenance is made through social and institutional components of Grant Aid Assistance. In addition, this Project 2 should have close coordination with technical cooperation by Project 1 for maximum impact on operation and maintenance of water supply facilities.

115
(2) Program II (2008 -) Rural development program for economic development 1. Name of the Project: Rural economic development project 2. Scheme: Technical Cooperation 3. Implementation Ministries: MINAGRI and MINALOC 4. Project site: Kibungo Province 5. Expected activities • Integrated intensive agriculture in combination with crop and livestock • Introduction of crops of improved and new variety • Cultivation in marshland of high value crops such as rice and vegetables • Agro-forestry • Fish culture • Beekeeping • Strengthening associations and group selling • Construction of small infrastructures such as storage facilities, irrigation systems, bridges,
and farm roads • Establishment of small businesses such as milling and processing businesses Remarks
• Feasibility and project components of technical cooperation in Program II will be examined on the basis of the results and information from the Program I activities as well as the Development Study in Kigali Ngali Province.
• Capacity building of Cell, Sector District/Town and Province offices should be made through on-the-job training (OJT) while they are implementing project activities.
• Construction of such rural infrastructures as soil erosion prevention facilities, water control facilities for marshland development, post harvest facilities, and rural roads, seems to boost economic development in rural areas in Kibungo Province. This technical cooperation project may produce synergy with rural infrastructure development. The feasibility of rural infrastructure development should thus be examined with project activities in mind.
The section 6.3 has details of infrastructure developments with high potential.
5.3 Important Points on Rural Development Program Implementation The following points should be noted during the implementation of the rural development program in Kibungo Province.
• PDC in a participatory manner at the grass-roots level is a basis for development and its contents should be respected.
• At the beginning of each project, enough time should be secured to accelerate stakeholders and beneficiaries’ participation in project activities. Much effort should

116
be made to foster their consensus on project activities and their ownership of the project.
• There are many vulnerable people in rural areas even though the postwar reconstruction period seems to be over. Thus the projects should give them more social and gender consideration.
• To make sure that the projects are in line with the system of the Rwandese government, a few trials will be needed. An example would be that small scale infrastructure development through earmarked CDF from the Japanese government.
• Capacity building of Cell, Sector District/Town and Province offices should be made through very practical OJT while they are implementing project activities.