Embed Size (px)
Citation preview

The Study of Brain Activity in Sleep

The hours of our life The hours of our life
American Time Use Survey, Bureau of Labor Statistics.
household activities (8%)
work and work-related (16%)
television (11%)
eat/drink (5%)
socializing (3%)
Sleep 36%
sport (1%)
phone/e-mail (1%)
other activities (19%)
By the age of 80, a person will have spent more than 25 years sleeping.

Sleep: A Definition Sleep: A Definition
Behavioral Definition: Behavioral state with characteristic immobile posture and diminished but readily reversible sensitivity to external stimuli.
Electrophisiological Definition:
Electrophyiological Characteristics of Human Sleep
Electrophyiological Characteristics of Human Sleep

The study of sleep The study of sleep
Electrooculogram (EOG)
Electroencephalography (EEG)
Electromiogram (EMG)
In clinical use (polysomnography) also electrocardiogram (EKG), respiration and body position are measured.

The Human EEG in Wakefulness and Sleep The Human EEG in Wakefulness and Sleep
Sleep is traditionally categorized into non-rapid eye movement (NREM) sleep and REM sleep. Human NREM sleep, in turn, is divided into stages N2 and N3.

EEG Sleep Stages: Wakefulness EEG Sleep Stages: Wakefulness
Dominated by waves of low amplitude and high frequency (low-voltage fast activity), including beta (16-25 Hz) and gamma (>25 Hz) oscillations. When eyes close in preparation for sleep, EEG alpha activity (8–13 Hz) becomes prominent, particularly in occipital regions (‘ idling’ rhythm in visual areas?). The waking EOG reveals frequent voluntary eye movements and eye blinks. The EMG reveals tonic muscle activity with additional phasic activity related to voluntary movements.

EEG Sleep Stages: Stage N1 EEG Sleep Stages: Stage N1
Characterized by loss of alpha activity and appearance of a low-voltage mixed frequency EEG pattern with prominent theta activity (3–7 Hz). Eye movements become slow and rolling, and muscle tone relaxes. Although there is decreased awareness of sensory stimuli, a subject in stage N1 may deny that he was asleep. Motor activity may persist for a number of seconds during stage N1. Occasionally individuals experience sudden muscle contractions (hypnic jerks), sometimes accompanied by a sense of falling and dream-like imagery.

EEG Sleep Stages: Stage N2 EEG Sleep Stages: Stage N2
Stage N2 is heralded in the EEG by the appearance of K-complexes and sleep spindles, which are especially evident over central regions. K-complexes are made up of a high-amplitude negative sharp wave followed by a positive slow wave, and are often triggered by external stimuli. Sleep spindles are waxing and waning oscillations at around 12–15 Hz that last about 1 second and occur 5–10 times a minute. Eye movements and muscle tone are much reduced. Individuals are partially disconnected from the environment (increased arousal threshold)

EEG Sleep Stages: Stage N3 EEG Sleep Stages: Stage N3
The EEG shows prominent Slow Waves in the delta range (1-4 Hz, 75 μV amplitude in humans). Eye movements cease during stage N3 and EMG activity decreases further. The threshold for arousal is higher than in stage N2. The process of awakening from slow wave sleep is drawn out, and subjects often remain confused for some time (sleep inertia).

Sleep Hallmarks: Slow Waves (and K-Complexes) Sleep Hallmarks: Slow Waves (and K-Complexes)
Changes in neuromodulators during NREM sleep (in particular reduced levels of arousal-related neurotransmitters) lead cortical and thalamic neurons to enter in a “bistable” state. In this condition, a spontaneous or induced opening of leakage K+ channels triggers a series of membrane currents that produce the slow oscillation. The slow oscillation is synchronized across the cortical mantle by cortico-cortical and thalamo-cortical connections.
The slow oscillation is characterized by a hyperpolarization phase or down-state (neuronal silence, 1), which lasts a few hundreds of milliseconds, and a slightly longer depolarization phase or up-state (neuronal spikes of activity, 2).

Sleep Hallmarks: Slow Waves (and K-Complexes) Sleep Hallmarks: Slow Waves (and K-Complexes)
Topographically, slow waves are especially prominent over medial and lateral prefrontal cortex.
K-complexes are high-amplitude slow oscillations usually (but not always) triggered by external stimuli. They are most likely the EEG correlate of global slow oscillations due to the near-synchronous activation of the cortical mantle by the RAS (as opposed to a single cortical source).

Sleep Hallmarks: Spindles Sleep Hallmarks: Spindles
Spindles are generated in thalamic circuits as a consequence of cortical firing. When the cortex enters an up-state, strong cortical firing excites GABAergic neurons in the reticular nucleus of the thalamus. These in turn strongly inhibit thalamocortical neurons, triggering intrinsic currents that produce a rebound burst of action potentials. These bursts percolate within local thalamoreticular circuits and produce oscillatory firing at around 12–15 Hz. Thalamic spindle sequences reach back to the cortex and are globally synchronized by corticothalamic circuits, where they appear in the EEG as sleep spindles.

EEG Sleep Stages: REM EEG Sleep Stages: REM
After deepening through stages N2 to N3, NREM sleep lightens and returns to stage N2, after which the sleeper enters REM sleep (“paradoxical sleep”: the EEG trace is “similar” to the activated EEG of waking or of stage N1). The EEG is characterized by low-voltage fast-activity, often with increased power in the theta band (3–7 Hz). So called sawtooth waves (2-5 Hz) tipically occur in bursts, especially before the appearance of Rapid Eye Movements (REMs)

EEG Sleep Stages: Tonic and Phasic components of REM EEG Sleep Stages: Tonic and Phasic components of REM
Tonic aspects of REM sleep include the activated EEG and a generalized loss of muscle tone, except for the extraocular muscles and the diaphragm. REM sleep is also accompanied by penile erections. Phasic features of REM include irregular bursts of REMs and muscle twitches.

Physiological Sleep Regulation
Physiological Sleep Regulation

Changes in Neuromodulation During Sleep Changes in Neuromodulation During Sleep

Wakefulness promoting structures Wakefulness promoting structures
• Reticular formation: glutamatergic neurons
• Locus coeruleus: noradrenaline
• Pedunculopontine nucleus and laterodorsal tegmental nucleus: acetylcholine
• Raphe neurons: serotonine
• Ventral periacqueductal grey: dopamine
• Nucleus basalis: acetylcholine
• Tuberomammillary neurons: histamine
• Posterior hypothalamus: orexin (hypocretin)

Ascending reticular activating system Ascending reticular activating system
• Wakefulness maintained by multiple neuronal systems with different neurotransmitters
• Systems are partially redundant, no one system appears to be necessary or sufficient for wakefulness
• Widespread projections to cortex, subcortical relays and brainstem or spinal cord, mutually excitatory influences on each other

Sleep Cycles Sleep Cycles
The succession of NREM sleep stages followed by an episode of REM sleep is called a sleep cycle, and lasts approximately 90–110 minutes in humans. There are a total of 4–5 cycles per night. Slow wave sleep (N3) is prominent early in the night, especially during the first sleep cycle, and diminishes as the night progresses. As slow wave sleep wanes, periods of REM sleep lengthen and show greater phasic activity. A healthy young adult typically spends about 5% of the sleep period in stage N1, about 50% in stage N2, 20–25% in stage N3, and 20–25% in REM sleep.
Hypnogram

Borbély et al., Hum. Neurobiol., 1982
Circadian Alerting
(Process C)
Sleep Homeostasis (Process S)
Wake Sleep
Wake
Sleep
The two-process model of sleep regulation posits that the interaction of its two constituent processes a homeostatic Process S and a circadian Process C determines the timing of sleep and waking. The time course of Process S is derived from a physiological variable: EEG slow-wave activity.
A Two Process Model of Sleep Regulaton A Two Process Model of Sleep Regulaton

Riedner et al., Sleep, 2007
Slow Wave Activity as an index of Sleep Pressure Slow Wave Activity as an index of Sleep Pressure
Slow-Wave Activity (SWA) is classically calculated as the mean power spectral density in the 0.5-4.0 Hz frequency range. The figure shows the SWA profile in NREM sleep during the night for an individual subject (average 1-min values, % of the mean of 4 NREM episodes). Rapid eye movement (REM) episodes are indicated by hatched areas.
Early Late

Riedner et al., Sleep, 2007
Slow Wave Activity as an index of Sleep Pressure Slow Wave Activity as an index of Sleep Pressure
During late NREM sleep, when compared with early NREM sleep, are commonly observed: (1) reduced SWA, (2) fewer large-amplitude slow waves, (3) decreased wave slopes, (4) more frequent multipeak waves

Riedner et al., Sleep, 2007
Possible Significance of Slow Wave parameters Possible Significance of Slow Wave parameters
Amplitude: Extent of the neuronal population recruited in the down-state (i.e., small SWs are based on the recruitment of fewer neurons as compared to large SWs). Slope: This parameter may reflect synaptic strength (i.e., steeper slow waves are generated when neuronal populations are rapidly and efficiently synchronized). Negative Peaks: The presence of multiple peaks may indicate a sub-optimal synchronization of distinct neuronal populations (partially asynchronous local waves).
half-period
am
plitu
de
pea
k-to-p
eak a
mp
litud
e -
+ real slow waves are nothing like
«theoretical» waves

Huber et al., 2002, Nature
Sleep intensity is locally regulated on a use-dependent basis
Huber et al., 2006, Nature Neuroscience
Motor Learning Arm Immobilization
High SWA
Low SWA
DA
Y
NIG
HT
(SLE
EP)
Sleep Intensity is Locally (Homeostatically) Regulated Sleep Intensity is Locally (Homeostatically) Regulated
Possible Relationship between Sleep and Plasticity Possible Relationship between Sleep and Plasticity
Given the association between wake-dependent activities and network-specific changes in sleep features (in particular, SWA), several authors suggested that sleep may be involved in the regulation of learning and brain plasticity. In particular… The synaptic homeostasis hypothesis suggests that wake activities are associated with a potentiation of synaptic connections, and that sleep may have a role in re-normalizing synapses (down-scaling), allowing for a new learning cycle. The hypothesis of synaptic potentiations suggests that locally regulated sleep-related events may help potentiating (up-scaling) specific connections in order to favor memory consolidation.

Changes in Brain Functioning during deep sleep and REM
Changes in Brain Functioning during deep sleep and REM

Maquet et al., Journ. Neurosci, 1997
Changes in brain activity during NREM sleep Changes in brain activity during NREM sleep
During deep NREM sleep, metabolic activity can be reduced as much as 40% relative to resting wakefulness. Activation is especially reduced in the thalamus due to its profound hyperpolarization during NREM sleep. In the cerebral cortex, activation is reduced in dorsolateral prefrontal cortex, orbitofrontal and anterior cingulate cortex (slow waves are especially prominent in these regions).

Wake Deep Sleep
Horovitz et al., PNAS, 2009
Sleep-induced changes in consciousness are reflected in reduced correlations between frontal and posterior areas of the DMN during deep sleep
Changes in DMN During NREM Sleep Changes in DMN During NREM Sleep

Tagliazucchi & Laufs, Nueron, 2014
Changes in «Resting State» Connectivity During NREM Sleep Changes in «Resting State» Connectivity During NREM Sleep
Wake VS N1 Wake VS N2 Wake VS N3
Wake < Sleep Wake > Sleep
The net reduction in connectivity observed during deep sleep reflect a reduction in brain interregional cross talk, i.e., a loss of global integration well in line with a phenotypically concomitant reduction in consciousness. Modularity, a spatial measure of functional segregation, generally increased across the brain with deepening sleep.

Nir & Tononi, Trends Cogn. Sci., 2010
Brain Activity in REM sleep (Meta-analysis of PET studies) Brain Activity in REM sleep (Meta-analysis of PET studies)
Decreased activity in REM
Increased activity in REM

Nir & Tononi, Trends Cogn. Sci., 2010
Brain Activity in REM sleep (Meta-analysis of PET studies) Brain Activity in REM sleep (Meta-analysis of PET studies)
During REM sleep, absolute levels of blood flow and metabolic activity are high, reaching levels similar to those seen during wakefulness. Some areas appear to be more active in REM sleep than in wakefulness: e.g., amygdala, parahippocampal cortex, anterior cingulate, parietal lobule and extrastriate areas.
By contrast, the rest of parietal cortex, precuneus, posterior cingulate cortex and dorsolateral prefrontal cortex are relatively deactivated.

Massimini et al., Cogn Neurosci., 2011
The fading of consciousness during certain stages of sleep may be related to a breakdown in cortical effective connectivity
Breakdown of Cortical Effective Connectivity During Sleep Breakdown of Cortical Effective Connectivity During Sleep

Dissociated States Local Sleep and Local Wakefulness
Dissociated States Local Sleep and Local Wakefulness

8 Vyazovskiy et al., J. Nature., 2011
After a long period in an awake state, cortical neurons can go briefly ‘offline’ as in sleep, accompanied by slow waves in the local EEG. Neurons often go offline in one cortical area but not in another [Local Sleep] When local OFF periods happen in areas relevant for behavior (i.e. motor cortex during a reaching task) they lead to performance errors!
Local Sleep during Wakefulness Local Sleep during Wakefulness

Theta Power Contrast
Hung, Sarasso et al., Sleep, 2013
Evidences for Local Sleep in Humans Evidences for Local Sleep in Humans

Local Sleep
Spatially circumscribed intrusion of sleep during wakefulness
Involves only relatively small areas while most of the brain shows activity patterns typical of wakefulness
Local Sleep
Spatially circumscribed intrusion of sleep during wakefulness
Involves only relatively small areas while most of the brain shows activity patterns typical of wakefulness
Micro-Sleep
Temporally circumscribed intrusion of (global) sleep during wakefulness
Involves most brain regions and may last from a
fraction of a second to several seconds
Micro-Sleep
Temporally circumscribed intrusion of (global) sleep during wakefulness
Involves most brain regions and may last from a
fraction of a second to several seconds
Local Sleep vs Micro Sleep Local Sleep vs Micro Sleep

Dissociated States: Local Wakefulness in Sleeping Individuals? Dissociated States: Local Wakefulness in Sleeping Individuals?
Nobili et al., NeuroImage, 2011
Electrodes in MC and DLPFC
Local activations in the MC may be associated with a parallel deepening of sleep in other regions (increase of slow waves in the DLPFC). These results suggest that human sleep can be characterized by the coexistence of wake-like and sleep-like electroencephalographic patterns in different cortical areas, supporting the hypothesis that unusual phenomena, such as NREM parasomnias, could result from an imbalance of these two states.

Siclari, Bernardi et al., SLEEP, 2014
wake deep sleep Falling Asleep
Dissociated States: Wake-Sleep Transition Dissociated States: Wake-Sleep Transition
Slow wave density during the falling asleep process
Slow wave origin distribution during the falling asleep process

Siclari, Bernardi et al., SLEEP, 2014
Islands of sleep and wakefulness can coexist across distinct brain areas
In the early phase of the falling-asleep period, slow waves typically involve some regions more than others: • The primary visual cortex and the medial
and lateral parietotemporal areas are less affected by slow waves, and thus “more awake” Conscious experiences are highly visual and frequently characterized by vestibular sensations
• The prefrontal regions are more involved by slow waves and thus “more asleep” The dreamer generally lacks insight into the hallucinatory character of the experience
Dissociated States: Wake-Sleep Transition Dissociated States: Wake-Sleep Transition
Slow Wave Cortical Involvement
RED areas show more slow wave activity at the beginning of the
falling asleep period. BLUE areas show more activity when the sleeper enters in deep sleep.
5’ post awakening 20’ post awakening
H2O PET
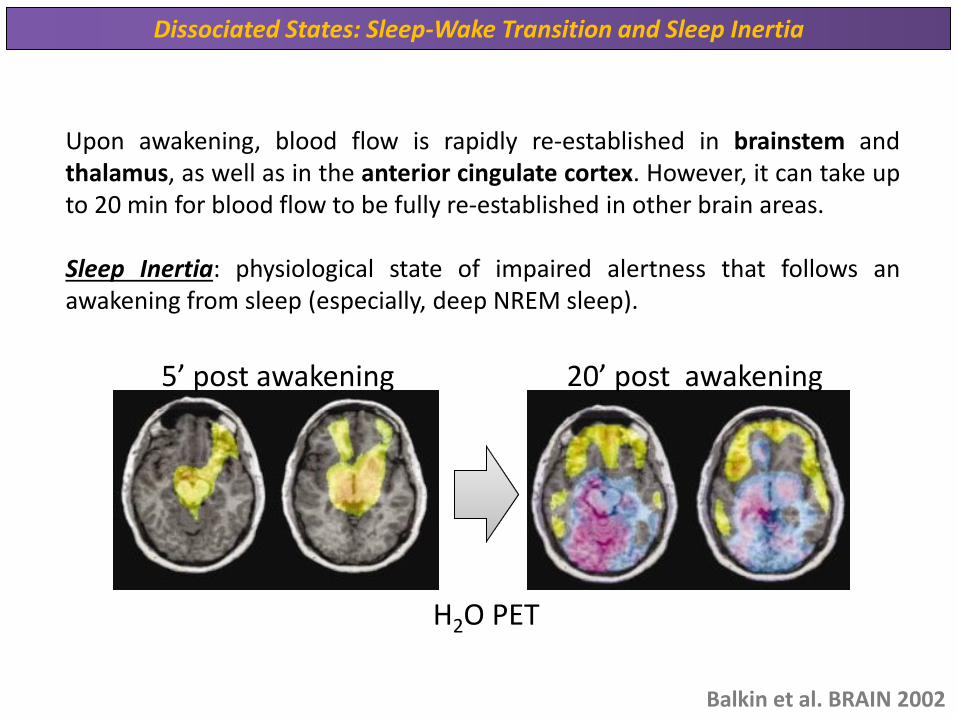
Dissociated States: Sleep-Wake Transition and Sleep Inertia Dissociated States: Sleep-Wake Transition and Sleep Inertia
Balkin et al. BRAIN 2002
Upon awakening, blood flow is rapidly re-established in brainstem and thalamus, as well as in the anterior cingulate cortex. However, it can take up to 20 min for blood flow to be fully re-established in other brain areas. Sleep Inertia: physiological state of impaired alertness that follows an awakening from sleep (especially, deep NREM sleep).

Sleepwalking
Confusional Arousal
Dissociated States: Arousal Disorders Dissociated States: Arousal Disorders
Bassetti et al. Lancet 2005; Terzaghi et al. Sleep 2009, Mahowald and Schenck Nature 2005

Dreams, or Conscious Experiences during different stages of sleep
Dreams, or Conscious Experiences during different stages of sleep

‘Tell me whether you had a dream’
• Periods of ocular motility: yes 74% • Periods of ocular inactivity: yes 17%
1950s: Dreaming = REM sleep 1950s: Dreaming = REM sleep

1960s onwards: NREM dreaming 1960s onwards: NREM dreaming
‘Tell me wheter you had a dream’
‘What was going through your mind before you woke up ?’

Siclari et al, Frontiers Psy., 2013
How are conscious experiences distributed in sleep? How are conscious experiences distributed in sleep?
CE= Conscious Experience CEWR = Conscious Experience Without Recall NCE = No Conscious Experience
CE= Conscious Experience CEWR = Conscious Experience Without Recall NCE = No Conscious Experience
What was the last thing going through your mind prior to the alarm sound?

Combined TMS-EEG Studies of Sleep Combined TMS-EEG Studies of Sleep
Cognitive State
Type of Experience
Freq. Content Typical Features
Wakefulness Daydreaming 80% Mainly thoughts. Dreamlike in
up to 25%.
Independent of external stimuli (by definition). Compared to REM: more
abrupt topic changes.
Wake-Sleep Transition
Hypnagogic hallucination
80-90%
Short static images (snapshots) or brief
sequences of disconnected frames. Sensation of falling.
Sometimes influenced by activities performed prior to
sleep.
Compared to other sleep stages: fewer emotions, fewer characters, less self-representation, less bizarre, closer to
reality.
NREM sleep Dreaming 23-75%
Early in the night: thought-like and conceptual. Later in
the night vivid and hallucinatory experiences.
Compared to REM: shorter, less dreamlike, more thought-like, less
vivid, more conceptual, under greater volitional control, more plausible, more
related to current concerns, less emotional. Late in the night sometimes
indistinguishable from REM reports.
REM sleep Dreaming 71-93% Vivid, hallucinatory
experiences.
Compared to wakefulness: single-mindedness, reduced self-awareness,
reduced executive control, high degree of emotionality, altered mnemonic
processes
Siclari et al, SAoNaP, 2012

Siclari et al, Frontiers Psy., 2013
Variability in Conscious Experiences during Sleep Variability in Conscious Experiences during Sleep
NREM sleep N2, 6:09 AM
I was thinking about perfume and fragrance. The very last word was ‘fragrance’.

Siclari et al, Frontiers Psy., 2013
Variability in Conscious Experiences during Sleep Variability in Conscious Experiences during Sleep
NREM sleep N3, 6:09 AM
The last thing was raspberries, a pint of raspberries.

Siclari et al, Frontiers Psy., 2013
Variability in Conscious Experiences during Sleep Variability in Conscious Experiences during Sleep
REM sleep, 3:28 AM
I was doing this experiment with another girl. I asked her what time it was and she said 7:07. No, she actually said 6:55. Her boyfriend was in the room, too. The last scene was just her face. It was quite a long dream before that.

Investigating the correlates of consciousness in sleep… Investigating the correlates of consciousness in sleep…
Horikawa et al, Science, 2013
fMRI data were acquired from sleeping participants simultaneously with polysomnography. Participants were awakened during sleep stage 1 or 2 (red dashed line) and verbally reported their visual experience. fMRI data immediately before awakening (= 9 s) were used as the input for main decoding analyses. Words describing visual objects or scenes (in red) were extracted. The visual contents were predicted using machine learning decoders trained on fMRI responses to natural images.

Investigating the correlates of consciousness in sleep… Investigating the correlates of consciousness in sleep…
Horikawa et al, Science, 2013
“What I was just looking at was some kind of characters. There was something like a writing paper for composing an essay, and I was looking at the characters from the essay or whatever it was. It was in black and white and the writing paper was the only thing that was there.”

RH
Setting > No settting (p<0.05) Setting > No settting (p<0.1)
Did the experience take place indoors or outdoors?
High frequency activity (25-50 Hz) in REM sleep
Investigating the correlates of consciousness in sleep… Investigating the correlates of consciousness in sleep…
Siclari et al, Under Review

RH
Setting > No settting (p<0.05) Setting > No settting (p<0.1)
Were you moving?
High frequency activity (25-50 Hz) in REM sleep
Investigating the correlates of consciousness in sleep… Investigating the correlates of consciousness in sleep…
Siclari et al, Under Review

-8s -6s -4s -2s
Setting > No settting (p<0.05) Setting > No settting (p<0.1)
Was anyone speaking?
High frequency activity (25-50 Hz) in REM sleep
Investigating the correlates of consciousness in sleep… Investigating the correlates of consciousness in sleep…
Siclari et al, Under Review
LH

Conclusions
Conclusions

• Sleep is typically evaluated and classified using EEG (preferably also with EMG and EOG)
• Sleep is accompanied by changes in regional brain metabolism detectable using PET and fMRI
• Sleep deepening is associated with relevant changes in brain interregional connectivity (reduction)
• Several sleep parameters are homeostatically regulated, potentially reflecting/influencing wake-dependent plasticity
• Islands of wake and sleep may potentially coexist during either behavioral states (potential explanation for dreams?)
Key-Points Key-Points

Tononi, G., & Siclari, F. (2015). Sleep and Dreaming. The Neurology of Consciousness 2nd Edition. Academic Press. Scientific American, 89-105. Tononi, G., & Cirelli, C. (2014). Sleep and the price of plasticity: from synaptic and cellular homeostasis to memory consolidation and integration. Neuron, 81(1), 12-34. Nir, Y., & Tononi, G. (2010). Dreaming and the brain: from phenomenology to neurophysiology. Trends in Cognitive Sciences, 14(2), 88-100 Siclari, F., Bernardi, G., Riedner, B. A., LaRocque, J. J., Benca, R. M., & Tononi, G. (2014). Two distinct synchronization processes in the transition to sleep: a high-density electroencephalographic study. SLEEP, 37(10), 1621-1637. Sarasso, S., Pigorini, A., Proserpio, P., Gibbs, S. A., Massimini, M., & Nobili, L. (2014). Fluid boundaries between wake and sleep: experimental evidence from Stereo-EEG recordings. Archives italiennes de biologie, 152(2/3), 169-177.
Suggested Reading Suggested Reading