Embed Size (px)
Citation preview
IOSR Journal of Environmental Science, Toxicology and Food Technology (IOSR-JESTFT)
e-ISSN: 2319-2402,p- ISSN: 2319-2399.Volume 11, Issue 4 Ver. II (April. 2017), PP 31-52
www.iosrjournals.org
DOI: 10.9790/2402-1104023152 www.iosrjournals.org 31 | Page
The Study Of Physico- Chemical And Bacteriological Parameters
Of River Salandi And Assessment Of Water Quality Index From
Hadagada Dam To Akhandalmani, Bhadrak, Odisha, India
Pratap Kumar Panda1*,
Rahas Bihari Panda2, Prasant Kumar Dash
3
1Department of Chemistry, A.B. College, Basudevpur, Bhadrak, Odisha, India
2Department of Chemistry, VSSUT, Burla, Odisha, India
3Department of Chemistry, Bhadrak Autonomous College, Bhadrak, Odisha, India
Abstract: The River Salandi, originates in well-Known biosphere of Similipala reserve forest of Meghasani hill
under Mayurbhanj district and joins with the river Baitarani at Tinitaraf ghat, near Akhandalmani, after
running through Hadagada dam, Bidyadharpur Barrage, Agarapada Town and Bhadrak municipality. The
river, in its course of flow from Hadagada to Akhandalmani containing 134 Kms. of distance receives both
treated and untreated effluents from the mines, industrial effluents from Ferro Alloys Corporation (FACOR),
agricultural effluents, urban wastes as well as bio medical wastes. This paper deals with the analysis of
Physico-Chemical and bacteriological parameters of water samples, collected from nine different monitoring
stations during summer (April & May), rainy(August), post-rainy(October) and winter seasons (December &
January) in the year 2015 and 2016 by using standard procedures. The water quality index (WQI) calculated
for the year 2015 and jointly for 2015-16 by computing mean values of twelve important parameters of the
corresponding years with the help of weighted Arithmetic method reveals that different monitoring stations have
different water quality due to contamination of hexavalent Chromium, Iron, Calcium, Fluoride and other
organic pollutants. The no station comes under quality ‘A’ and ‘B’ and the water of river is unfit for drinking
purpose without proper treatment.
Keywords: Standard procedures, WQI, weighted Arithmetic method, Hexavalent Chromium.
I. Introduction Like fresh air, the fresh water is one among the essential and fundamental gifts of nature, required for
maintenance and development of both micro and macro organisms in the world. It is an interesting fact that
water covers 71% of total surface of the Earth and only 3% of water is fresh. Out of these 3% of water, 2.5% is
stored on Antarctica in the form of ice [7]. Now-a-days, it is the rapid unplanned industrialization, urbanization
[48] and other anthropogenic activities [16, 26], responsible for the pollution of water pose a great challenge for
the survival and maintenance of flora and fauna. A good quality of water reflects that it is good in physically,
chemically as well as bacteriologically. The quality of water changes with the change of season and
geographical area [33] as there are several anthropogenic activities such as agricultural, domestic and socio-
cultural, which contribute to the change of water quality and are changed with the change of season[17, 21, 66].
It can be highlighted that during rainy and post-rainy seasons, the gravity of pollution is more in
comparison to summer and winter seasons because the agricultural activities that discharges much more
agricultural effluents containing fertilizer and pesticides to the river water and hence it is a paramount factor
responsible for the increase of concentration of heavy metals and other pollutants in the river water [1, 21, 54,
57] and enter to the both human and animal body through food chain [70]. In addition to this, anthropogenic
activities such as open defecation in the river bed [27], discharge of bio medical wastes and excretion of animal
enhance the amount of pathogenic bacteria and protozoa in the river [42, 51]. The water quality of any water
body in any season can be studied by measuring important parameters like dissolved oxygen(DO), bio chemical
oxygen demand(BOD), PH, total hardness (TH), Sulphate, Nitrate, Chloride, Phosphate, heavy metals and
bacteria.
In the present study, the river Salandi, originated from well-known biosphere of Similipala reserve
forest of Meghasani hill under Mayurbhanj district has been taken and it joins with the river Baitarani, near
Tinitaraf ghat before it flows down into the Bay of Bengal at Dhamara. A dam has been built across the river
Salandi at Hadagada with longitude 86°.18ˡ East and latitude 210°.17ˡ North in Anandapur sub-division of
Keonjhar district for irrigation purpose of Keonjhar, Bhadrak and Balasore districts. The river, after passing the
Hadagada, receives untreated mining effluents from Nuasahi chromite mining belt while passing through it as
there are three chromite mines namely Baula open caste and underground mines, Bangur chromite mines and
Nuasahi chromite mines. It is only Bangur chromite mine that discharges one Lakh tones of chromite over per
The Study of Physico- Chemical and Bacteriological Parameters of River Salandi and Assessment ..
DOI: 10.9790/2402-1104023152 www.iosrjournals.org 32 | Page
year and seven lakh tones of over burden are excavated which is the major cause of pollution by total chromium
and hexavalent chromium in form of mining discharges and surface run off [18, 43].
Thereafter the river runs through Bidyadharpur barrage, Agarapada town, Industrial belt at
Randia(FACOR), Bhadrak Municipality(District Head Quarter) and finally meets with the river Baitarani at
Tinitaraf Ghat before it merges into the Bay of Bengal at Dhamara. The river, during its course of flow from
Hadagada to Akhandalamani travels 134 Kms. of distance and receives both treated and untreated mining
discharges, agricultural effluents, industrial wastes, urban wastes, biomedical wastes, forest run off and after all
domestic wastes as it is only the natural drainage system in the study area [44]. Therefore, the aforesaid factors
are predominantly responsible for the pollution of the river Salandi as reported in daily Odia news paper
“Samaj” very often. In this paper water samples from nine different selected monitoring stations have been
collected during summer (April & May), Rainy (August), post-rainy (October) and winter (December &
January) in the year 2015 and 2016 and have been analysed by using standard procedures established by APHA,
2005 to study physico-Chemical and Bacteriological parameters [3]. Finally mean value for twelve important
parameters have been calculated for the year 2015 and 2016 independently and jointly for both the years. The
water quality index (WQI) has been calculated by taking mean values of twelve important parameters for the
year 2015 independently and jointly for the year 2015-16 for errorless study, comparison and confirmatory
conclusion so as to apply it for the welfare being of the society[12, 32].
II. Materials and Methods 2.1 Selection of Sampling Stations:
The nine sampling stations have been selected in the bank of river on the basis of gravity of the
expected pollutants as well as geography of the river bed to meet the aim and objective. Water samples from
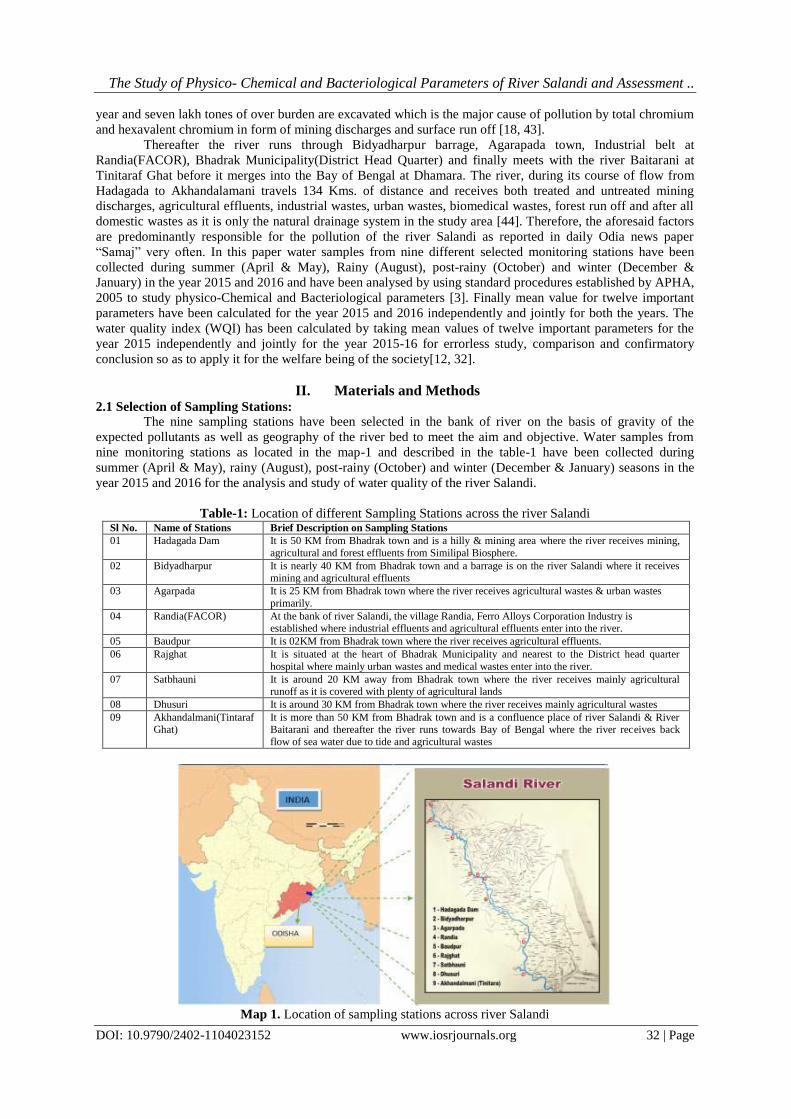
nine monitoring stations as located in the map-1 and described in the table-1 have been collected during
summer (April & May), rainy (August), post-rainy (October) and winter (December & January) seasons in the
year 2015 and 2016 for the analysis and study of water quality of the river Salandi.
Table-1: Location of different Sampling Stations across the river Salandi Sl No. Name of Stations Brief Description on Sampling Stations
01 Hadagada Dam It is 50 KM from Bhadrak town and is a hilly & mining area where the river receives mining,
agricultural and forest effluents from Similipal Biosphere.
02 Bidyadharpur It is nearly 40 KM from Bhadrak town and a barrage is on the river Salandi where it receives
mining and agricultural effluents
03 Agarpada It is 25 KM from Bhadrak town where the river receives agricultural wastes & urban wastes
primarily.
04 Randia(FACOR) At the bank of river Salandi, the village Randia, Ferro Alloys Corporation Industry is established where industrial effluents and agricultural effluents enter into the river.
05 Baudpur It is 02KM from Bhadrak town where the river receives agricultural effluents.
06 Rajghat It is situated at the heart of Bhadrak Municipality and nearest to the District head quarter
hospital where mainly urban wastes and medical wastes enter into the river.
07 Satbhauni It is around 20 KM away from Bhadrak town where the river receives mainly agricultural runoff as it is covered with plenty of agricultural lands
08 Dhusuri It is around 30 KM from Bhadrak town where the river receives mainly agricultural wastes
09 Akhandalmani(Tintaraf Ghat)
It is more than 50 KM from Bhadrak town and is a confluence place of river Salandi & River Baitarani and thereafter the river runs towards Bay of Bengal where the river receives back
flow of sea water due to tide and agricultural wastes
Map 1. Location of sampling stations across river Salandi
The Study of Physico- Chemical and Bacteriological Parameters of River Salandi and Assessment ..
DOI: 10.9790/2402-1104023152 www.iosrjournals.org 33 | Page
2.2 Analysis of Physico-Chemical parameters:-
Water samples collected in well cleaned plastic bottles by adding 2 ml of Concentrated HCl in each
sample bottles to avoid precipitation of metals have been analysed to study the physico-chemical parameter
according to the procedures established by APHA, 2005[3]. TDS and total hardness (TH) have been measured
by gravimetric method and complexometric method by using Erio-Chrome black-T as indicator respectively.
Further, Calcium concentration has been determined by using EDTA with murexide as indicator. Sulphate has
been measured by turbidimetry method. Iron, Chromium and nitrate have been measured with the help of
spectrophotometer by using phenanthroline as indicator at 510nm, 540nm and 275nm respectively [44, 51].
2.3 Fluoride, Chloride and Bacteria:-
Fluoride and chloride have been determined by using SPAND reagent and acid zirconium chloride
with the help of spectrophotometer at 570nm[41, 45] and titration method respectively. Bacteria have been
determined by H2S kit method [51]. The result of analysis for the month of April, May, August, October,
December 2015 and January, April, May, August, October and December 2016 have been placed in the table 2-
12 respectively for study and conclusion.
2.4 Calculation of Water Quality Index (WQI):-
The water quality index is a modern method that reflects the quality of any water body under study by
means of a single number, calculated by considering combined effect of important physico-chemical
parameters. In the present study, weighted Arithmetic method developed by Brown et al in 1972 has been used
preferable to calculate the water quality index of the river Salandi [6, 11, 12, 13, 55, 56, 64]. This method
includes following steps as explained briefly here under.
i. Calculation of mean value of twelve important parameters
The mean values for twelve parameters independently for the year 2015, 2016 and jointly for the year 2015-16
have been calculated and placed in table 13-15 respectively.
ii. Quality rating scale of each parameter is calculated by using following formula [44, 64]:
Qi=[(Vo-Vi)/(Vs-Vi)]100
Where Qi= Quality rating of the ith
parameter.
Vo=observed value or mean value of the observed values of any parameter.
Vi=ideal value of particular parameter.
Vi=0 for all parameter except PH and DO.
Vi for PH=7 and for DO Vi=14.6mg/L.
Vs= Standard permissible value of a particular parameter determined WHO.
iii. Calculation of relative unit weight (wi)
The relative unit weight of any parameter (wi) ∝ 1
𝑉𝑠
wi=𝐾
𝑉𝑠 Where K=Proportionality constant
For the Shake of simplicity, K is taken as 1
iv. Finally water quality index (WQI) = 𝒘𝒊𝑸𝒊
𝒘𝒊
The overall water quality of any water body is assessed by using following gradation table.
Sl No. WQI Level Water Quality Grade
I 0-25 Excellent A
ii 26-50 Good B
iii 51-75 Poor C
iv 76-100 Very Poor D
v >100 Unfit for Drinking Purpose E
In other words
a) 0 < WQI < 100 Fit for human use
b) 0 > WQI > 100 Unfit for drinking use [49]
The WQI for nine monitoring station for the year 2015 and collectively for the year 2015-16 have been given in
the table 16 and 17 respectively.
The Study of Physico- Chemical and Bacteriological Parameters of River Salandi and Assessment ..
DOI: 10.9790/2402-1104023152 www.iosrjournals.org 34 | Page
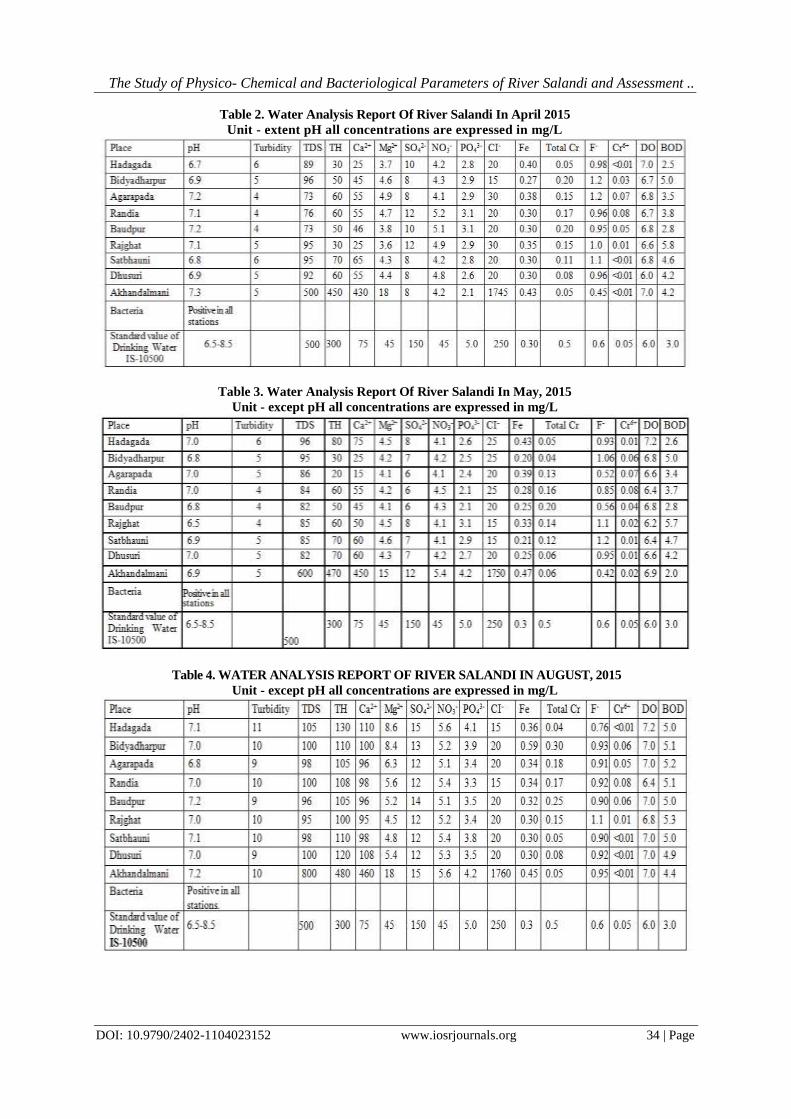
Table 2. Water Analysis Report Of River Salandi In April 2015
Unit - extent pH all concentrations are expressed in mg/L
Table 3. Water Analysis Report Of River Salandi In May, 2015
Unit - except pH all concentrations are expressed in mg/L
Table 4. WATER ANALYSIS REPORT OF RIVER SALANDI IN AUGUST, 2015
Unit - except pH all concentrations are expressed in mg/L
The Study of Physico- Chemical and Bacteriological Parameters of River Salandi and Assessment ..
DOI: 10.9790/2402-1104023152 www.iosrjournals.org 35 | Page
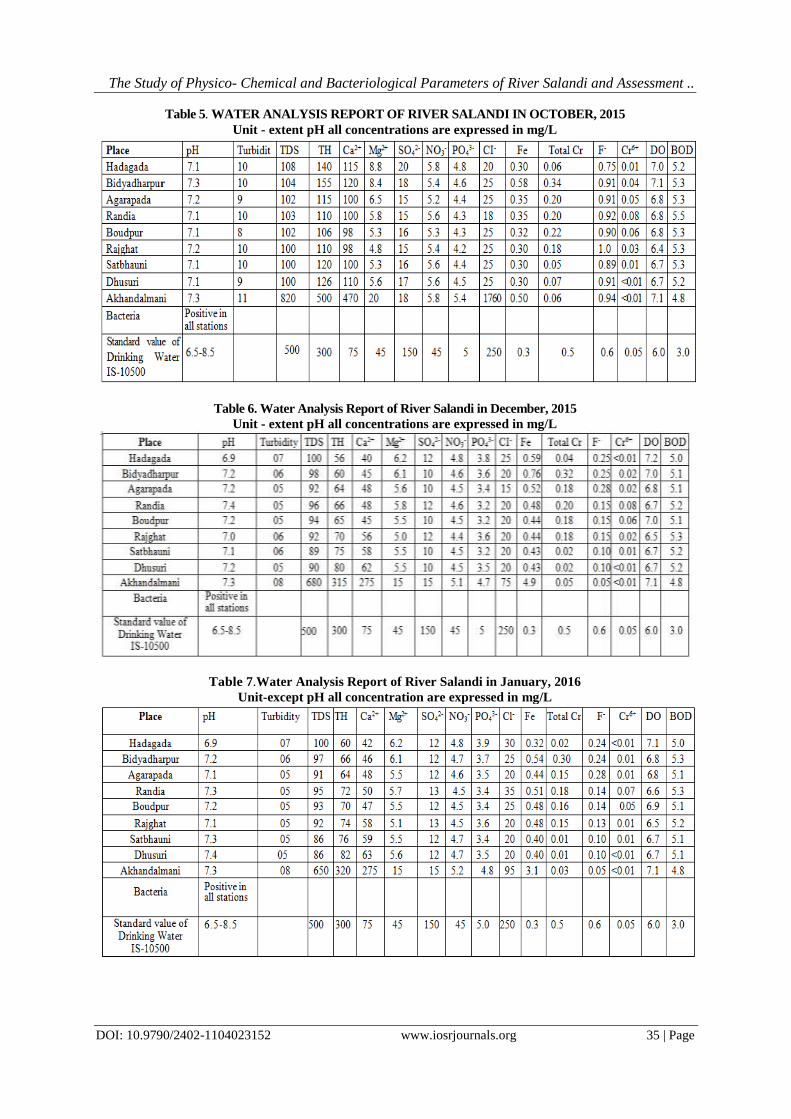
Table 5. WATER ANALYSIS REPORT OF RIVER SALANDI IN OCTOBER, 2015
Unit - extent pH all concentrations are expressed in mg/L
Table 6. Water Analysis Report of River Salandi in December, 2015
Unit - extent pH all concentrations are expressed in mg/L
Table 7.Water Analysis Report of River Salandi in January, 2016
Unit-except pH all concentration are expressed in mg/L

The Study of Physico- Chemical and Bacteriological Parameters of River Salandi and Assessment ..
DOI: 10.9790/2402-1104023152 www.iosrjournals.org 36 | Page
Table 8. WATER ANALYSIS REPORT OF RIVER SALANDI IN APRIL, 2016
Unit - except pH all concentrations are expressed in mg/L
Table 9. WATER ANALYSIS REPORT OF RIVER SALANDI IN MAY, 2016
Unit - except pH all concentrations are expressed in mg/L
Table 10.WATER ANALYSIS REPORT OF RIVER SALANDI INAUGUST, 2016
Unit-except pH all concentration are expressed in mg/L
The Study of Physico- Chemical and Bacteriological Parameters of River Salandi and Assessment ..
DOI: 10.9790/2402-1104023152 www.iosrjournals.org 37 | Page
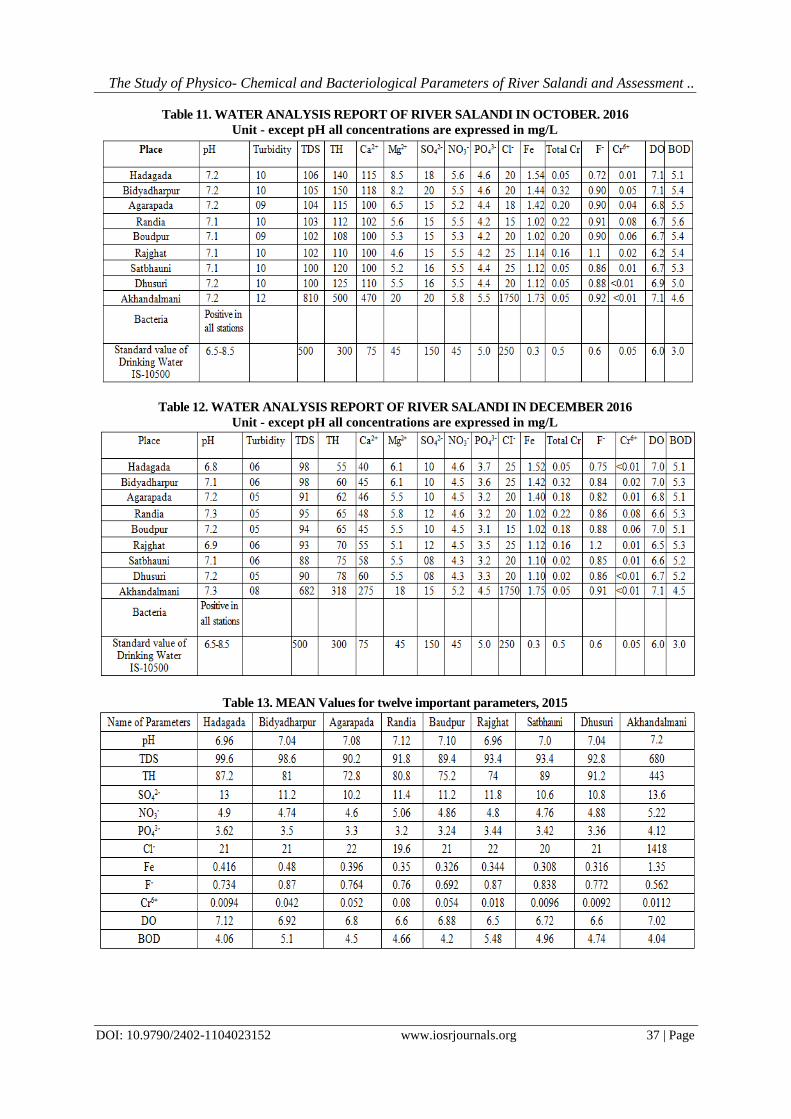
Table 11. WATER ANALYSIS REPORT OF RIVER SALANDI IN OCTOBER. 2016
Unit - except pH all concentrations are expressed in mg/L
Table 12. WATER ANALYSIS REPORT OF RIVER SALANDI IN DECEMBER 2016
Unit - except pH all concentrations are expressed in mg/L
Table 13. MEAN Values for twelve important parameters, 2015
The Study of Physico- Chemical and Bacteriological Parameters of River Salandi and Assessment ..
DOI: 10.9790/2402-1104023152 www.iosrjournals.org 38 | Page
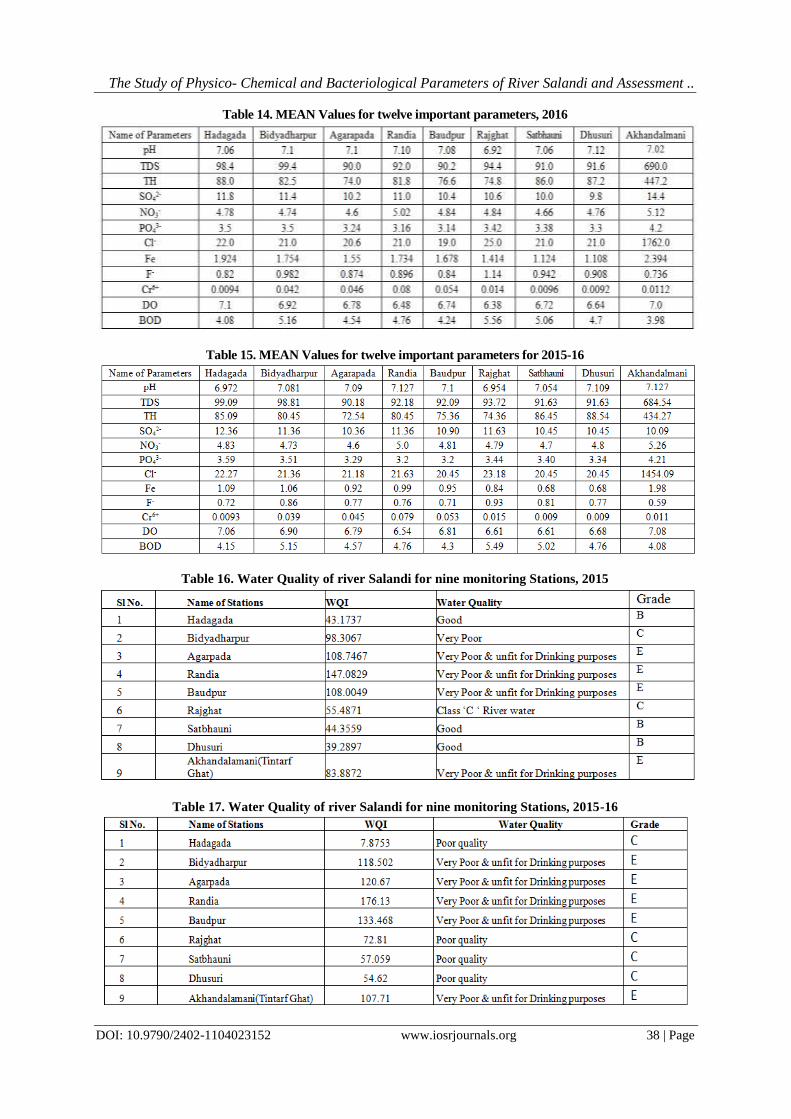
Table 14. MEAN Values for twelve important parameters, 2016
Table 15. MEAN Values for twelve important parameters for 2015-16
Table 16. Water Quality of river Salandi for nine monitoring Stations, 2015
Table 17. Water Quality of river Salandi for nine monitoring Stations, 2015-16
The Study of Physico- Chemical and Bacteriological Parameters of River Salandi and Assessment ..
DOI: 10.9790/2402-1104023152 www.iosrjournals.org 39 | Page
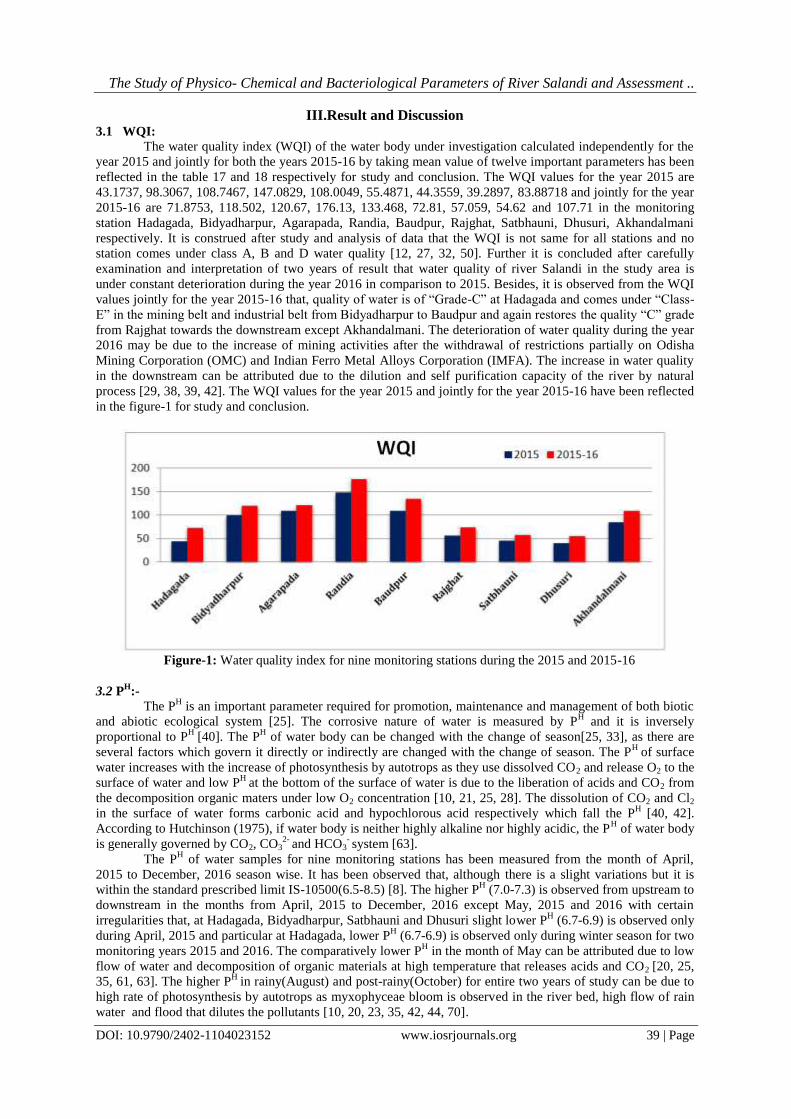
III.Result and Discussion 3.1 WQI:
The water quality index (WQI) of the water body under investigation calculated independently for the
year 2015 and jointly for both the years 2015-16 by taking mean value of twelve important parameters has been
reflected in the table 17 and 18 respectively for study and conclusion. The WQI values for the year 2015 are
43.1737, 98.3067, 108.7467, 147.0829, 108.0049, 55.4871, 44.3559, 39.2897, 83.88718 and jointly for the year
2015-16 are 71.8753, 118.502, 120.67, 176.13, 133.468, 72.81, 57.059, 54.62 and 107.71 in the monitoring
station Hadagada, Bidyadharpur, Agarapada, Randia, Baudpur, Rajghat, Satbhauni, Dhusuri, Akhandalmani
respectively. It is construed after study and analysis of data that the WQI is not same for all stations and no
station comes under class A, B and D water quality [12, 27, 32, 50]. Further it is concluded after carefully
examination and interpretation of two years of result that water quality of river Salandi in the study area is
under constant deterioration during the year 2016 in comparison to 2015. Besides, it is observed from the WQI
values jointly for the year 2015-16 that, quality of water is of “Grade-C” at Hadagada and comes under “Class-
E” in the mining belt and industrial belt from Bidyadharpur to Baudpur and again restores the quality “C” grade
from Rajghat towards the downstream except Akhandalmani. The deterioration of water quality during the year
2016 may be due to the increase of mining activities after the withdrawal of restrictions partially on Odisha
Mining Corporation (OMC) and Indian Ferro Metal Alloys Corporation (IMFA). The increase in water quality
in the downstream can be attributed due to the dilution and self purification capacity of the river by natural
process [29, 38, 39, 42]. The WQI values for the year 2015 and jointly for the year 2015-16 have been reflected
in the figure-1 for study and conclusion.
Figure-1: Water quality index for nine monitoring stations during the 2015 and 2015-16
3.2 PH
:-
The PH is an important parameter required for promotion, maintenance and management of both biotic
and abiotic ecological system [25]. The corrosive nature of water is measured by PH and it is inversely
proportional to PH
[40]. The PH of water body can be changed with the change of season[25, 33], as there are
several factors which govern it directly or indirectly are changed with the change of season. The PH
of surface
water increases with the increase of photosynthesis by autotrops as they use dissolved CO2 and release O2 to the
surface of water and low PH
at the bottom of the surface of water is due to the liberation of acids and CO2 from
the decomposition organic maters under low O2 concentration [10, 21, 25, 28]. The dissolution of CO2 and Cl2
in the surface of water forms carbonic acid and hypochlorous acid respectively which fall the PH [40, 42].
According to Hutchinson (1975), if water body is neither highly alkaline nor highly acidic, the PH of water body
is generally governed by CO2, CO32-
and HCO3- system [63].
The PH of water samples for nine monitoring stations has been measured from the month of April,
2015 to December, 2016 season wise. It has been observed that, although there is a slight variations but it is
within the standard prescribed limit IS-10500(6.5-8.5) [8]. The higher PH (7.0-7.3) is observed from upstream to
downstream in the months from April, 2015 to December, 2016 except May, 2015 and 2016 with certain
irregularities that, at Hadagada, Bidyadharpur, Satbhauni and Dhusuri slight lower PH (6.7-6.9) is observed only
during April, 2015 and particular at Hadagada, lower PH (6.7-6.9) is observed only during winter season for two
monitoring years 2015 and 2016. The comparatively lower PH in the month of May can be attributed due to low
flow of water and decomposition of organic materials at high temperature that releases acids and CO2 [20, 25,
35, 61, 63]. The higher PH
in rainy(August) and post-rainy(October) for entire two years of study can be due to
high rate of photosynthesis by autotrops as myxophyceae bloom is observed in the river bed, high flow of rain
water and flood that dilutes the pollutants [10, 20, 23, 35, 42, 44, 70].
The Study of Physico- Chemical and Bacteriological Parameters of River Salandi and Assessment ..
DOI: 10.9790/2402-1104023152 www.iosrjournals.org 40 | Page
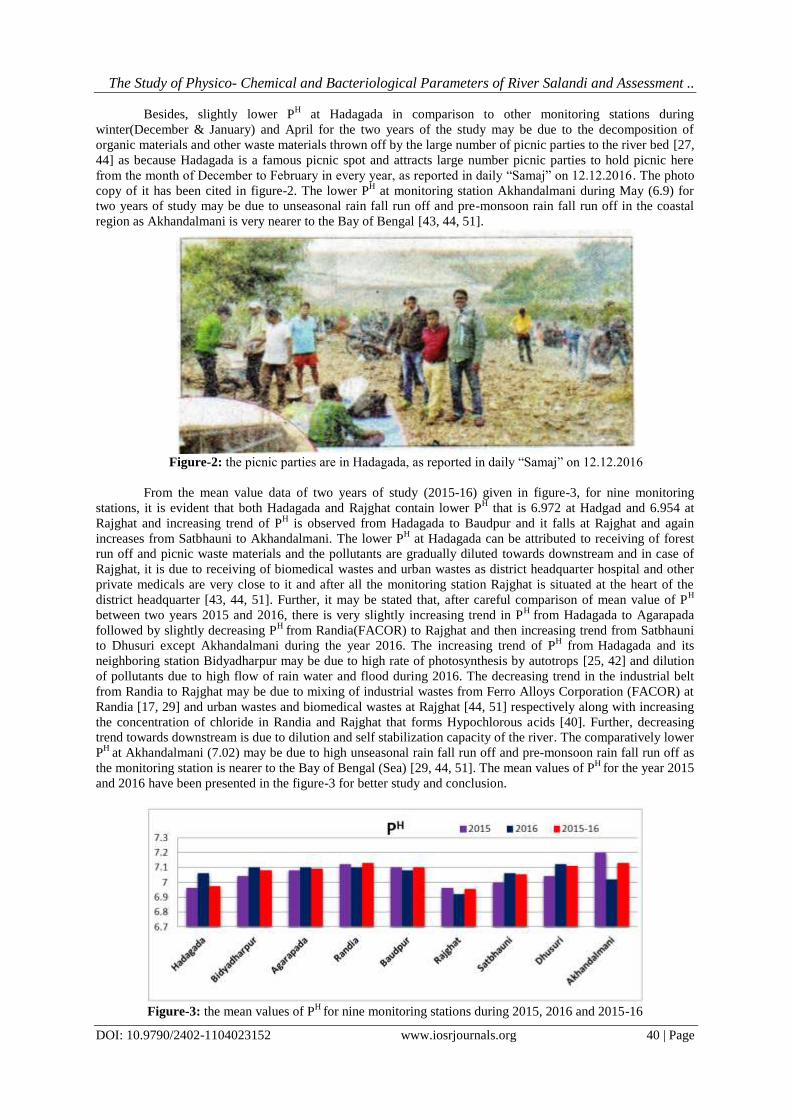
Besides, slightly lower PH at Hadagada in comparison to other monitoring stations during
winter(December & January) and April for the two years of the study may be due to the decomposition of
organic materials and other waste materials thrown off by the large number of picnic parties to the river bed [27,
44] as because Hadagada is a famous picnic spot and attracts large number picnic parties to hold picnic here
from the month of December to February in every year, as reported in daily “Samaj” on 12.12.2016. The photo
copy of it has been cited in figure-2. The lower PH at monitoring station Akhandalmani during May (6.9) for
two years of study may be due to unseasonal rain fall run off and pre-monsoon rain fall run off in the coastal
region as Akhandalmani is very nearer to the Bay of Bengal [43, 44, 51].
Figure-2: the picnic parties are in Hadagada, as reported in daily “Samaj” on 12.12.2016
From the mean value data of two years of study (2015-16) given in figure-3, for nine monitoring
stations, it is evident that both Hadagada and Rajghat contain lower PH that is 6.972 at Hadgad and 6.954 at
Rajghat and increasing trend of PH is observed from Hadagada to Baudpur and it falls at Rajghat and again
increases from Satbhauni to Akhandalmani. The lower PH at Hadagada can be attributed to receiving of forest
run off and picnic waste materials and the pollutants are gradually diluted towards downstream and in case of
Rajghat, it is due to receiving of biomedical wastes and urban wastes as district headquarter hospital and other
private medicals are very close to it and after all the monitoring station Rajghat is situated at the heart of the
district headquarter [43, 44, 51]. Further, it may be stated that, after careful comparison of mean value of PH
between two years 2015 and 2016, there is very slightly increasing trend in PH
from Hadagada to Agarapada
followed by slightly decreasing PH
from Randia(FACOR) to Rajghat and then increasing trend from Satbhauni
to Dhusuri except Akhandalmani during the year 2016. The increasing trend of PH from
Hadagada and its
neighboring station Bidyadharpur may be due to high rate of photosynthesis by autotrops [25, 42] and dilution
of pollutants due to high flow of rain water and flood during 2016. The decreasing trend in the industrial belt
from Randia to Rajghat may be due to mixing of industrial wastes from Ferro Alloys Corporation (FACOR) at
Randia [17, 29] and urban wastes and biomedical wastes at Rajghat [44, 51] respectively along with increasing
the concentration of chloride in Randia and Rajghat that forms Hypochlorous acids [40]. Further, decreasing
trend towards downstream is due to dilution and self stabilization capacity of the river. The comparatively lower
PH
at Akhandalmani (7.02) may be due to high unseasonal rain fall run off and pre-monsoon rain fall run off as
the monitoring station is nearer to the Bay of Bengal (Sea) [29, 44, 51]. The mean values of PH
for the year 2015
and 2016 have been presented in the figure-3 for better study and conclusion.
Figure-3: the mean values of PH
for nine monitoring stations during 2015, 2016 and 2015-16
The Study of Physico- Chemical and Bacteriological Parameters of River Salandi and Assessment ..
DOI: 10.9790/2402-1104023152 www.iosrjournals.org 41 | Page
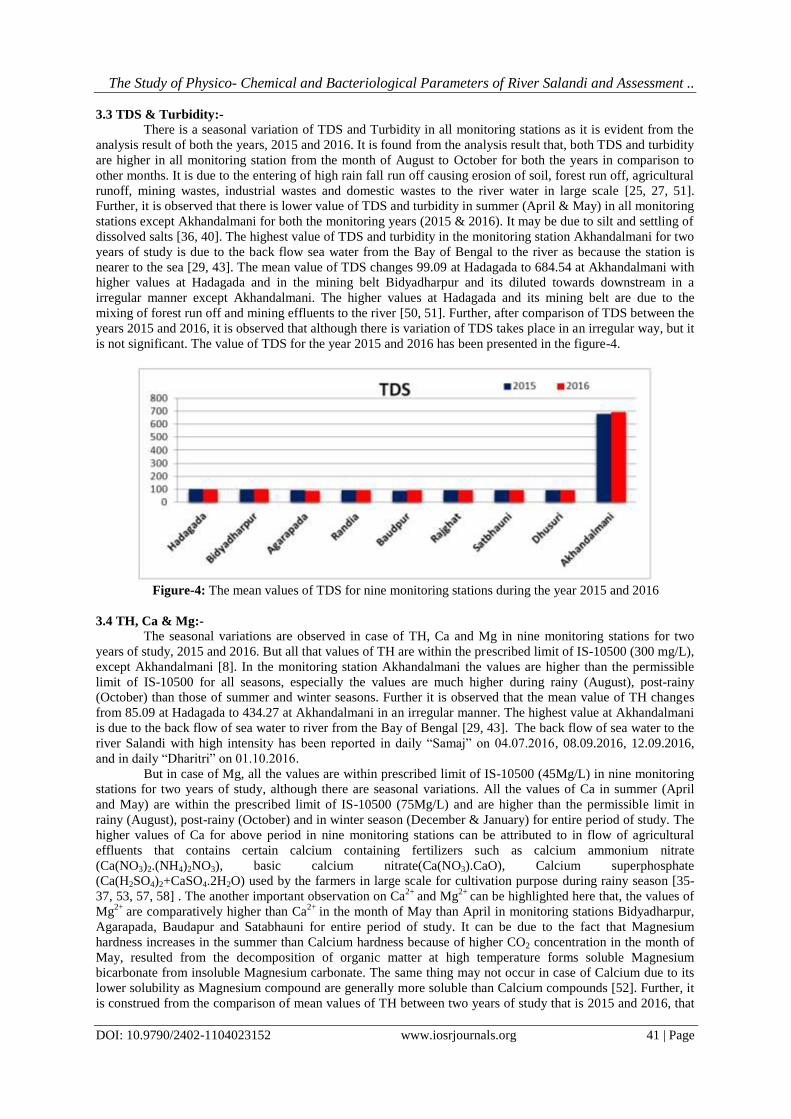
3.3 TDS & Turbidity:-
There is a seasonal variation of TDS and Turbidity in all monitoring stations as it is evident from the
analysis result of both the years, 2015 and 2016. It is found from the analysis result that, both TDS and turbidity
are higher in all monitoring station from the month of August to October for both the years in comparison to
other months. It is due to the entering of high rain fall run off causing erosion of soil, forest run off, agricultural
runoff, mining wastes, industrial wastes and domestic wastes to the river water in large scale [25, 27, 51].
Further, it is observed that there is lower value of TDS and turbidity in summer (April & May) in all monitoring
stations except Akhandalmani for both the monitoring years (2015 & 2016). It may be due to silt and settling of
dissolved salts [36, 40]. The highest value of TDS and turbidity in the monitoring station Akhandalmani for two
years of study is due to the back flow sea water from the Bay of Bengal to the river as because the station is
nearer to the sea [29, 43]. The mean value of TDS changes 99.09 at Hadagada to 684.54 at Akhandalmani with
higher values at Hadagada and in the mining belt Bidyadharpur and its diluted towards downstream in a
irregular manner except Akhandalmani. The higher values at Hadagada and its mining belt are due to the
mixing of forest run off and mining effluents to the river [50, 51]. Further, after comparison of TDS between the
years 2015 and 2016, it is observed that although there is variation of TDS takes place in an irregular way, but it
is not significant. The value of TDS for the year 2015 and 2016 has been presented in the figure-4.
Figure-4: The mean values of TDS for nine monitoring stations during the year 2015 and 2016
3.4 TH, Ca & Mg:-
The seasonal variations are observed in case of TH, Ca and Mg in nine monitoring stations for two
years of study, 2015 and 2016. But all that values of TH are within the prescribed limit of IS-10500 (300 mg/L),
except Akhandalmani [8]. In the monitoring station Akhandalmani the values are higher than the permissible
limit of IS-10500 for all seasons, especially the values are much higher during rainy (August), post-rainy
(October) than those of summer and winter seasons. Further it is observed that the mean value of TH changes
from 85.09 at Hadagada to 434.27 at Akhandalmani in an irregular manner. The highest value at Akhandalmani
is due to the back flow of sea water to river from the Bay of Bengal [29, 43]. The back flow of sea water to the
river Salandi with high intensity has been reported in daily “Samaj” on 04.07.2016, 08.09.2016, 12.09.2016,
and in daily “Dharitri” on 01.10.2016.
But in case of Mg, all the values are within prescribed limit of IS-10500 (45Mg/L) in nine monitoring
stations for two years of study, although there are seasonal variations. All the values of Ca in summer (April
and May) are within the prescribed limit of IS-10500 (75Mg/L) and are higher than the permissible limit in
rainy (August), post-rainy (October) and in winter season (December & January) for entire period of study. The
higher values of Ca for above period in nine monitoring stations can be attributed to in flow of agricultural
effluents that contains certain calcium containing fertilizers such as calcium ammonium nitrate
(Ca(NO3)2.(NH4)2NO3), basic calcium nitrate(Ca(NO3).CaO), Calcium superphosphate
(Ca(H2SO4)2+CaSO4.2H2O) used by the farmers in large scale for cultivation purpose during rainy season [35-
37, 53, 57, 58] . The another important observation on Ca2+
and Mg2+
can be highlighted here that, the values of
Mg2+
are comparatively higher than Ca2+
in the month of May than April in monitoring stations Bidyadharpur,
Agarapada, Baudapur and Satabhauni for entire period of study. It can be due to the fact that Magnesium
hardness increases in the summer than Calcium hardness because of higher CO2 concentration in the month of
May, resulted from the decomposition of organic matter at high temperature forms soluble Magnesium
bicarbonate from insoluble Magnesium carbonate. The same thing may not occur in case of Calcium due to its
lower solubility as Magnesium compound are generally more soluble than Calcium compounds [52]. Further, it
is construed from the comparison of mean values of TH between two years of study that is 2015 and 2016, that
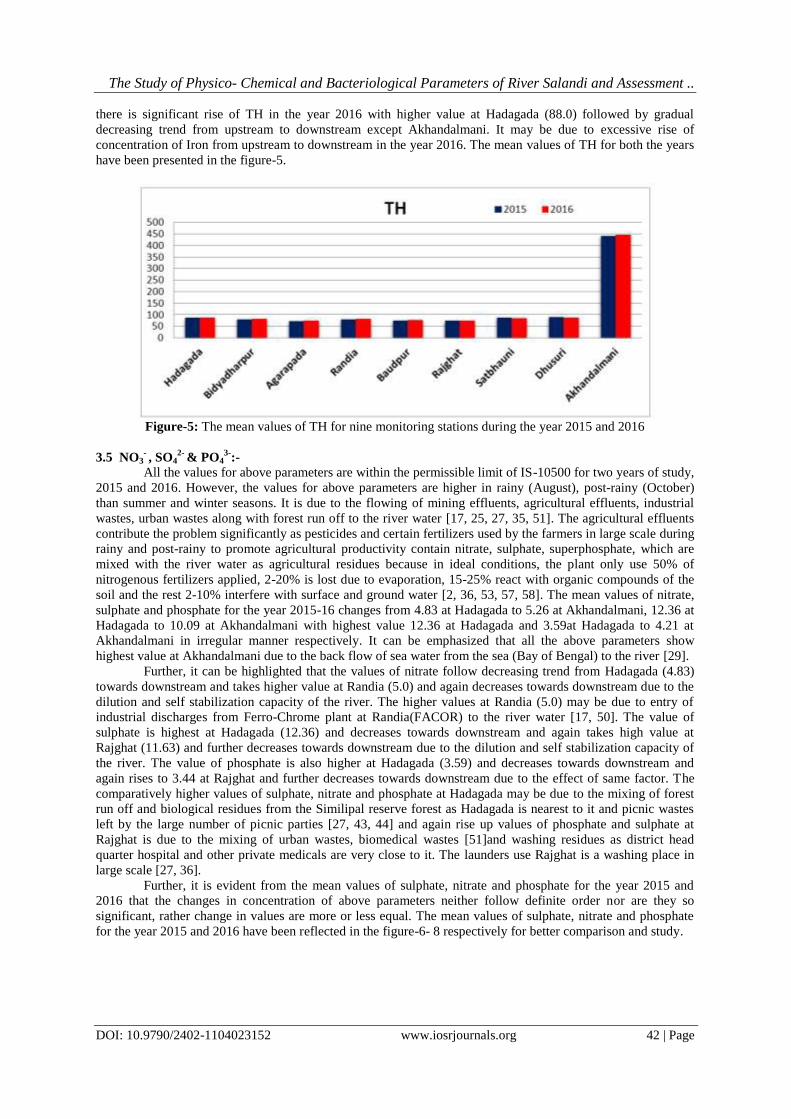
The Study of Physico- Chemical and Bacteriological Parameters of River Salandi and Assessment ..
DOI: 10.9790/2402-1104023152 www.iosrjournals.org 42 | Page
there is significant rise of TH in the year 2016 with higher value at Hadagada (88.0) followed by gradual
decreasing trend from upstream to downstream except Akhandalmani. It may be due to excessive rise of
concentration of Iron from upstream to downstream in the year 2016. The mean values of TH for both the years
have been presented in the figure-5.
Figure-5: The mean values of TH for nine monitoring stations during the year 2015 and 2016
3.5 NO3- , SO4
2- & PO4
3-:-
All the values for above parameters are within the permissible limit of IS-10500 for two years of study,
2015 and 2016. However, the values for above parameters are higher in rainy (August), post-rainy (October)
than summer and winter seasons. It is due to the flowing of mining effluents, agricultural effluents, industrial
wastes, urban wastes along with forest run off to the river water [17, 25, 27, 35, 51]. The agricultural effluents
contribute the problem significantly as pesticides and certain fertilizers used by the farmers in large scale during
rainy and post-rainy to promote agricultural productivity contain nitrate, sulphate, superphosphate, which are
mixed with the river water as agricultural residues because in ideal conditions, the plant only use 50% of
nitrogenous fertilizers applied, 2-20% is lost due to evaporation, 15-25% react with organic compounds of the
soil and the rest 2-10% interfere with surface and ground water [2, 36, 53, 57, 58]. The mean values of nitrate,
sulphate and phosphate for the year 2015-16 changes from 4.83 at Hadagada to 5.26 at Akhandalmani, 12.36 at
Hadagada to 10.09 at Akhandalmani with highest value 12.36 at Hadagada and 3.59at Hadagada to 4.21 at
Akhandalmani in irregular manner respectively. It can be emphasized that all the above parameters show
highest value at Akhandalmani due to the back flow of sea water from the sea (Bay of Bengal) to the river [29].
Further, it can be highlighted that the values of nitrate follow decreasing trend from Hadagada (4.83)
towards downstream and takes higher value at Randia (5.0) and again decreases towards downstream due to the
dilution and self stabilization capacity of the river. The higher values at Randia (5.0) may be due to entry of
industrial discharges from Ferro-Chrome plant at Randia(FACOR) to the river water [17, 50]. The value of
sulphate is highest at Hadagada (12.36) and decreases towards downstream and again takes high value at
Rajghat (11.63) and further decreases towards downstream due to the dilution and self stabilization capacity of
the river. The value of phosphate is also higher at Hadagada (3.59) and decreases towards downstream and
again rises to 3.44 at Rajghat and further decreases towards downstream due to the effect of same factor. The
comparatively higher values of sulphate, nitrate and phosphate at Hadagada may be due to the mixing of forest
run off and biological residues from the Similipal reserve forest as Hadagada is nearest to it and picnic wastes
left by the large number of picnic parties [27, 43, 44] and again rise up values of phosphate and sulphate at
Rajghat is due to the mixing of urban wastes, biomedical wastes [51]and washing residues as district head
quarter hospital and other private medicals are very close to it. The launders use Rajghat is a washing place in
large scale [27, 36].
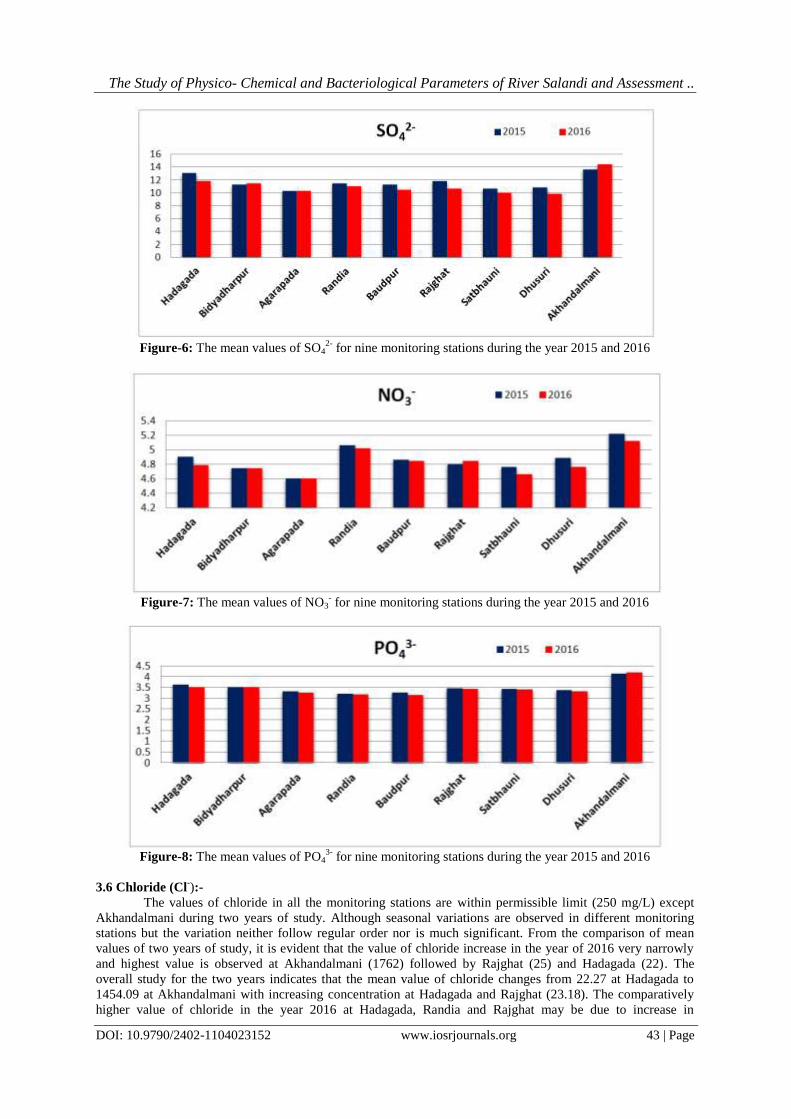
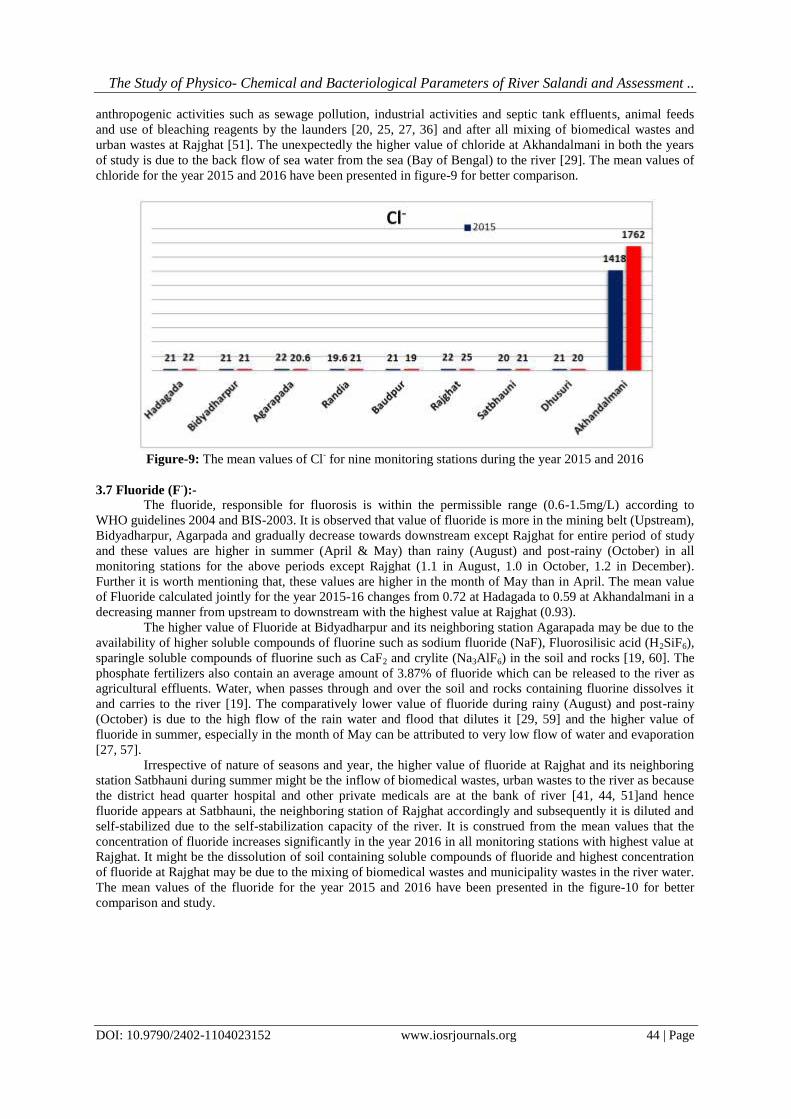
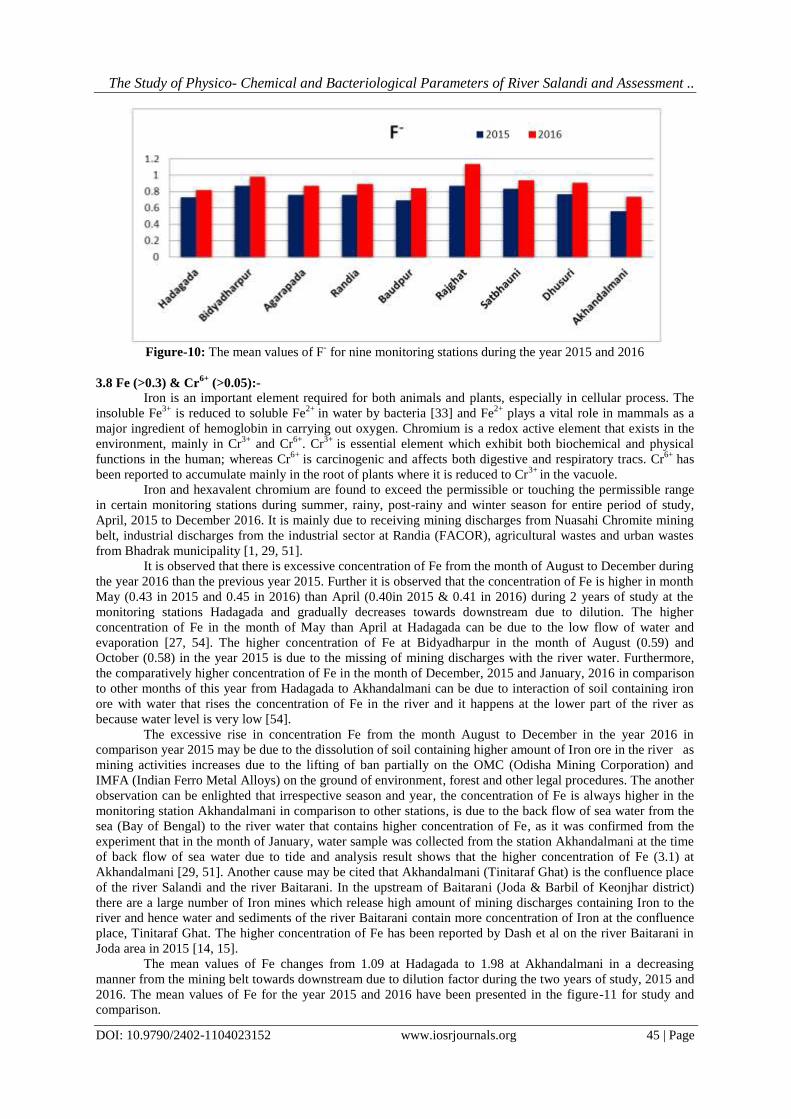
Further, it is evident from the mean values of sulphate, nitrate and phosphate for the year 2015 and
2016 that the changes in concentration of above parameters neither follow definite order nor are they so
significant, rather change in values are more or less equal. The mean values of sulphate, nitrate and phosphate
for the year 2015 and 2016 have been reflected in the figure-6- 8 respectively for better comparison and study.
The Study of Physico- Chemical and Bacteriological Parameters of River Salandi and Assessment ..
DOI: 10.9790/2402-1104023152 www.iosrjournals.org 43 | Page
Figure-6: The mean values of SO4
2- for nine monitoring stations during the year 2015 and 2016
Figure-7: The mean values of NO3
- for nine monitoring stations during the year 2015 and 2016
Figure-8: The mean values of PO4
3- for nine monitoring stations during the year 2015 and 2016
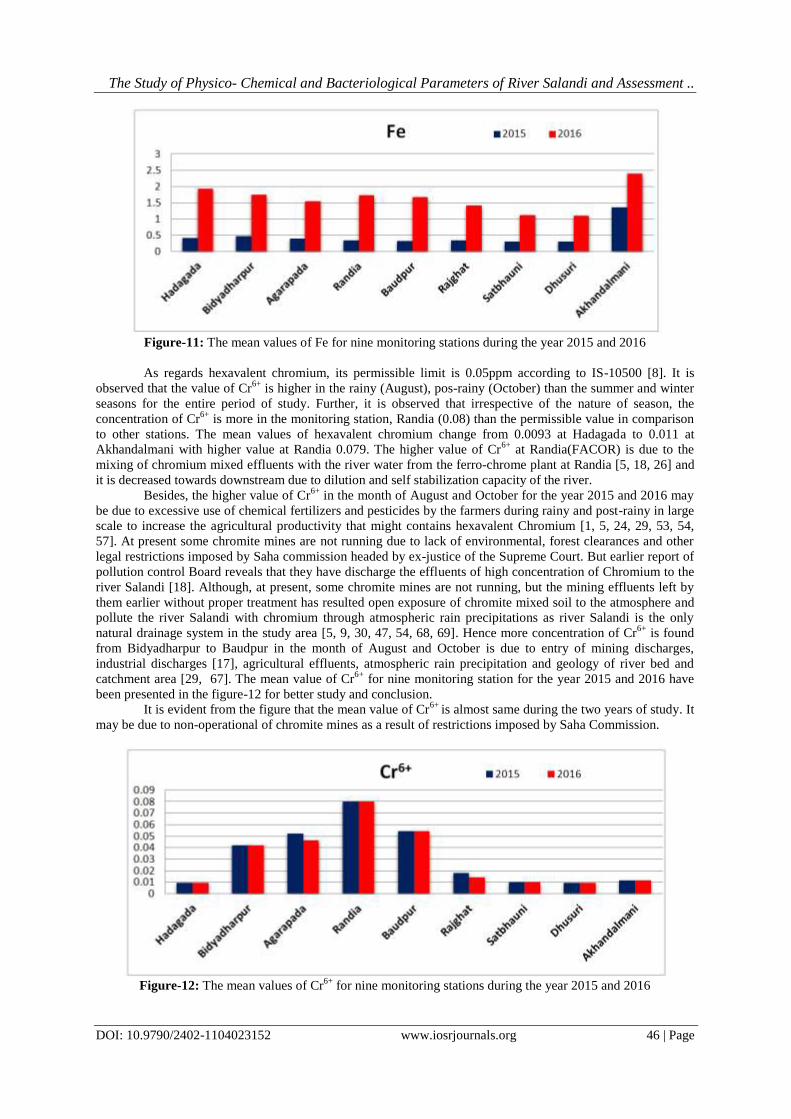
3.6 Chloride (Cl-):-
The values of chloride in all the monitoring stations are within permissible limit (250 mg/L) except
Akhandalmani during two years of study. Although seasonal variations are observed in different monitoring
stations but the variation neither follow regular order nor is much significant. From the comparison of mean
values of two years of study, it is evident that the value of chloride increase in the year of 2016 very narrowly
and highest value is observed at Akhandalmani (1762) followed by Rajghat (25) and Hadagada (22). The
overall study for the two years indicates that the mean value of chloride changes from 22.27 at Hadagada to
1454.09 at Akhandalmani with increasing concentration at Hadagada and Rajghat (23.18). The comparatively
higher value of chloride in the year 2016 at Hadagada, Randia and Rajghat may be due to increase in
The Study of Physico- Chemical and Bacteriological Parameters of River Salandi and Assessment ..
DOI: 10.9790/2402-1104023152 www.iosrjournals.org 44 | Page
anthropogenic activities such as sewage pollution, industrial activities and septic tank effluents, animal feeds
and use of bleaching reagents by the launders [20, 25, 27, 36] and after all mixing of biomedical wastes and
urban wastes at Rajghat [51]. The unexpectedly the higher value of chloride at Akhandalmani in both the years
of study is due to the back flow of sea water from the sea (Bay of Bengal) to the river [29]. The mean values of
chloride for the year 2015 and 2016 have been presented in figure-9 for better comparison.
Figure-9: The mean values of Cl
- for nine monitoring stations during the year 2015 and 2016
3.7 Fluoride (F-):-
The fluoride, responsible for fluorosis is within the permissible range (0.6-1.5mg/L) according to
WHO guidelines 2004 and BIS-2003. It is observed that value of fluoride is more in the mining belt (Upstream),
Bidyadharpur, Agarpada and gradually decrease towards downstream except Rajghat for entire period of study
and these values are higher in summer (April & May) than rainy (August) and post-rainy (October) in all
monitoring stations for the above periods except Rajghat (1.1 in August, 1.0 in October, 1.2 in December).
Further it is worth mentioning that, these values are higher in the month of May than in April. The mean value
of Fluoride calculated jointly for the year 2015-16 changes from 0.72 at Hadagada to 0.59 at Akhandalmani in a
decreasing manner from upstream to downstream with the highest value at Rajghat (0.93).
The higher value of Fluoride at Bidyadharpur and its neighboring station Agarapada may be due to the
availability of higher soluble compounds of fluorine such as sodium fluoride (NaF), Fluorosilisic acid (H2SiF6),
sparingle soluble compounds of fluorine such as CaF2 and crylite (Na3AlF6) in the soil and rocks [19, 60]. The
phosphate fertilizers also contain an average amount of 3.87% of fluoride which can be released to the river as
agricultural effluents. Water, when passes through and over the soil and rocks containing fluorine dissolves it
and carries to the river [19]. The comparatively lower value of fluoride during rainy (August) and post-rainy
(October) is due to the high flow of the rain water and flood that dilutes it [29, 59] and the higher value of
fluoride in summer, especially in the month of May can be attributed to very low flow of water and evaporation
[27, 57].
Irrespective of nature of seasons and year, the higher value of fluoride at Rajghat and its neighboring
station Satbhauni during summer might be the inflow of biomedical wastes, urban wastes to the river as because
the district head quarter hospital and other private medicals are at the bank of river [41, 44, 51]and hence
fluoride appears at Satbhauni, the neighboring station of Rajghat accordingly and subsequently it is diluted and
self-stabilized due to the self-stabilization capacity of the river. It is construed from the mean values that the
concentration of fluoride increases significantly in the year 2016 in all monitoring stations with highest value at
Rajghat. It might be the dissolution of soil containing soluble compounds of fluoride and highest concentration
of fluoride at Rajghat may be due to the mixing of biomedical wastes and municipality wastes in the river water.
The mean values of the fluoride for the year 2015 and 2016 have been presented in the figure-10 for better
comparison and study.
The Study of Physico- Chemical and Bacteriological Parameters of River Salandi and Assessment ..
DOI: 10.9790/2402-1104023152 www.iosrjournals.org 45 | Page
Figure-10: The mean values of F
- for nine monitoring stations during the year 2015 and 2016
3.8 Fe (>0.3) & Cr6+
(>0.05):-
Iron is an important element required for both animals and plants, especially in cellular process. The
insoluble Fe3+
is reduced to soluble Fe2+
in water by bacteria [33] and Fe2+
plays a vital role in mammals as a
major ingredient of hemoglobin in carrying out oxygen. Chromium is a redox active element that exists in the
environment, mainly in Cr3+
and Cr6+
. Cr3+
is essential element which exhibit both biochemical and physical
functions in the human; whereas Cr6+
is carcinogenic and affects both digestive and respiratory tracs. Cr6+
has
been reported to accumulate mainly in the root of plants where it is reduced to Cr3+
in the vacuole.
Iron and hexavalent chromium are found to exceed the permissible or touching the permissible range
in certain monitoring stations during summer, rainy, post-rainy and winter season for entire period of study,
April, 2015 to December 2016. It is mainly due to receiving mining discharges from Nuasahi Chromite mining
belt, industrial discharges from the industrial sector at Randia (FACOR), agricultural wastes and urban wastes
from Bhadrak municipality [1, 29, 51].
It is observed that there is excessive concentration of Fe from the month of August to December during
the year 2016 than the previous year 2015. Further it is observed that the concentration of Fe is higher in month
May (0.43 in 2015 and 0.45 in 2016) than April (0.40in 2015 & 0.41 in 2016) during 2 years of study at the
monitoring stations Hadagada and gradually decreases towards downstream due to dilution. The higher
concentration of Fe in the month of May than April at Hadagada can be due to the low flow of water and
evaporation [27, 54]. The higher concentration of Fe at Bidyadharpur in the month of August (0.59) and
October (0.58) in the year 2015 is due to the missing of mining discharges with the river water. Furthermore,
the comparatively higher concentration of Fe in the month of December, 2015 and January, 2016 in comparison
to other months of this year from Hadagada to Akhandalmani can be due to interaction of soil containing iron
ore with water that rises the concentration of Fe in the river and it happens at the lower part of the river as
because water level is very low [54].
The excessive rise in concentration Fe from the month August to December in the year 2016 in
comparison year 2015 may be due to the dissolution of soil containing higher amount of Iron ore in the river as
mining activities increases due to the lifting of ban partially on the OMC (Odisha Mining Corporation) and
IMFA (Indian Ferro Metal Alloys) on the ground of environment, forest and other legal procedures. The another
observation can be enlighted that irrespective season and year, the concentration of Fe is always higher in the
monitoring station Akhandalmani in comparison to other stations, is due to the back flow of sea water from the
sea (Bay of Bengal) to the river water that contains higher concentration of Fe, as it was confirmed from the
experiment that in the month of January, water sample was collected from the station Akhandalmani at the time
of back flow of sea water due to tide and analysis result shows that the higher concentration of Fe (3.1) at
Akhandalmani [29, 51]. Another cause may be cited that Akhandalmani (Tinitaraf Ghat) is the confluence place
of the river Salandi and the river Baitarani. In the upstream of Baitarani (Joda & Barbil of Keonjhar district)
there are a large number of Iron mines which release high amount of mining discharges containing Iron to the
river and hence water and sediments of the river Baitarani contain more concentration of Iron at the confluence
place, Tinitaraf Ghat. The higher concentration of Fe has been reported by Dash et al on the river Baitarani in
Joda area in 2015 [14, 15].
The mean values of Fe changes from 1.09 at Hadagada to 1.98 at Akhandalmani in a decreasing
manner from the mining belt towards downstream due to dilution factor during the two years of study, 2015 and
2016. The mean values of Fe for the year 2015 and 2016 have been presented in the figure-11 for study and
comparison.
The Study of Physico- Chemical and Bacteriological Parameters of River Salandi and Assessment ..
DOI: 10.9790/2402-1104023152 www.iosrjournals.org 46 | Page
Figure-11: The mean values of Fe for nine monitoring stations during the year 2015 and 2016
As regards hexavalent chromium, its permissible limit is 0.05ppm according to IS-10500 [8]. It is
observed that the value of Cr6+
is higher in the rainy (August), pos-rainy (October) than the summer and winter
seasons for the entire period of study. Further, it is observed that irrespective of the nature of season, the
concentration of Cr6+
is more in the monitoring station, Randia (0.08) than the permissible value in comparison
to other stations. The mean values of hexavalent chromium change from 0.0093 at Hadagada to 0.011 at
Akhandalmani with higher value at Randia 0.079. The higher value of Cr6+
at Randia(FACOR) is due to the
mixing of chromium mixed effluents with the river water from the ferro-chrome plant at Randia [5, 18, 26] and
it is decreased towards downstream due to dilution and self stabilization capacity of the river.
Besides, the higher value of Cr6+
in the month of August and October for the year 2015 and 2016 may
be due to excessive use of chemical fertilizers and pesticides by the farmers during rainy and post-rainy in large
scale to increase the agricultural productivity that might contains hexavalent Chromium [1, 5, 24, 29, 53, 54,
57]. At present some chromite mines are not running due to lack of environmental, forest clearances and other
legal restrictions imposed by Saha commission headed by ex-justice of the Supreme Court. But earlier report of
pollution control Board reveals that they have discharge the effluents of high concentration of Chromium to the
river Salandi [18]. Although, at present, some chromite mines are not running, but the mining effluents left by
them earlier without proper treatment has resulted open exposure of chromite mixed soil to the atmosphere and
pollute the river Salandi with chromium through atmospheric rain precipitations as river Salandi is the only
natural drainage system in the study area [5, 9, 30, 47, 54, 68, 69]. Hence more concentration of Cr6+
is found
from Bidyadharpur to Baudpur in the month of August and October is due to entry of mining discharges,
industrial discharges [17], agricultural effluents, atmospheric rain precipitation and geology of river bed and
catchment area [29, 67]. The mean value of Cr6+
for nine monitoring station for the year 2015 and 2016 have
been presented in the figure-12 for better study and conclusion.
It is evident from the figure that the mean value of Cr6+
is almost same during the two years of study. It
may be due to non-operational of chromite mines as a result of restrictions imposed by Saha Commission.
Figure-12: The mean values of Cr
6+ for nine monitoring stations during the year 2015 and 2016

The Study of Physico- Chemical and Bacteriological Parameters of River Salandi and Assessment ..
DOI: 10.9790/2402-1104023152 www.iosrjournals.org 47 | Page
3.9 Dissolved Oxygen (DO):-
The dissolved oxygen (DO) is a crucial parameter required for survival and maintenance of flora and
fauna and to describe the extent of pollution of any water body. Higher the DO, less the pollutants in the water
body and vice versa. The major governing factors affecting the concentration of DO at input sources such as
dissolution of atmospheric oxygen in water, photosynthesis by autotrops and output sources such as respiration,
decomposition of organic matters by the micro organisms and evaporation due to high temperature [25, 28, 35,
42]. Hence concentration of DO in water body increases if input sources are higher than the output sources and
minimum value of DO 6mg/L is required for healthy aquatic environment. But it is observed that the DO values
have been decreasing from upstream to downstream due to continuous discharge of mining effluents, industrial
effluents, agricultural wastes, urban wastes and after all domestic wastes to the river water as dissolved oxygen
is being used in redox reaction process to stabilize the pollutants [46]. Further, anthropogenic activities such as
open defection in the river bed throughout the year, picnic [27, 35] and other socio-cultural activities in the river
bed during the specific period add fuel to the fire [51].
In the present study, the DO values are constantly affected from Hadagada to Akhandalmani by the
aforesaid factors. The mean value of DO for jointly two years of study, 2015-16 changes from 7.06 at Hadagada
to 7.08 at Akhandalmani in a gradually decreasing manner with lowest at Randia (6.54), Rajghat (6.61) and
Satbhauni (6.61) and further increasing trend is observed in the downstream, from Dhusuri to Akhandalmani
with highest at Akhandalmani. The increaseing trend in downstream is due to dilution of pollutants gradually
and auto stabilization of pollutants in the due course of flow in the river bed [16]. The highest value at
Akhandalmani may be due to high water flow and accumulation of water round the year as it is the confluence
place of two rivers that is river Salandi and river Baitarani.
Besides, another observation can be highlighted that the DO values are lower in summer (April &
May) than other seasons in all stations for entire period of study except Hadagada. It may be due to the low
water flow, evaporation due to high temperature, low rate of photosynthesis by autotrops and after all low rate
of dissolution of atmospheric oxygen [15, 20, 27, 31, 34, 35, 42, 62]. The lowest DO at Randia is due to the
mixing of industrial effluents from the Ferro-Chrome plant at Randia with the river [1, 25, 50] and the
comparatively lower value at Rajghat and its neighboring station Satbhauni may be due to receiving of
biomedical wastes and urban wastes as because Rajghat is in the heart of the municipality and district head
quarter hospital and other private medicals are very close to it and pollutants appear at Satbhauni through the
course of flow of water [51]. Further the higher value of DO at Baudpur (6.87) than its upstream station Randia
is due to the dilution of industrial effluents discharged from Ferro-Chrome plant at Randia in due course of
water flow. Besides, the higher value of DO in rainy (August) and post-rainy (October) is due to high flow of
rain water, flood that dilutes the pollution load, aeration and after all more dissolution of atmospheric oxygen
due to low temperature [20, 33, 35, 40, 44, 63].
More ever, it is needless to mention that the DO values are always higher at Hadagada with slight seasonal
variation (7.0-7.2) for entire period of study irrespective of the nature of seasons and it can be attributed to
higher rate of photosynthesis by autotrops as myxophyceae bloom is observed in the river bed, low pollution
load of the river in the upstream, more dissolution of atmospheric oxygen and low rate of eutrophication due to
dense forest environment [20, 35, 42, 51, 70]. The mean values of DO for the year 2015 and 2016 have been
presented in the figure-13. From the figure it is evident that the DO values in the year 2016 decreases slightly
from upstream to downstream except Dhusuri. It may be due to partially running of Odisha Mining Corporation
(OMC), Indian Ferro Metal Alloys Corporation (IMFA) and rise of concentration of fluoride. Further it is
observed that the concentration of DO remains constant instead of decreasing at downstream Satbhauni
followed by increasing at Dhusuri. It may be due to starting of dilution of pollutant from Satbhauni onwards by
self stabilization capacity of the river.
Figure-13: The mean values of DO for nine monitoring stations during the year 2015 and 2016
The Study of Physico- Chemical and Bacteriological Parameters of River Salandi and Assessment ..
DOI: 10.9790/2402-1104023152 www.iosrjournals.org 48 | Page
3.10 Biochemical Oxygen Demand (BOD):-
Like dissolved oxygen, BOD is also an important indicator of water pollution. For any water body, the
BOD value, if more than 3 mg/L will be treated as polluted [8]. The higher the BOD values, more the water
polluted by the organic pollutants and vice versa. It is observed that the BOD values are either closed to
standard permissible limit (3 mg/L) or exceeding the standard pollution limit in some stations and these values
are more in rainy (August), post-rainy (October) and winter (December & January) than the summer season
(April & May). The mean value of BOD calculated jointly for the year 2015-16 changes from 4.15 at Hadagada
to 4.08 at Akhandalmani with the highest value at Rajghat 5.49. Further, from the careful analysis of the result,
it is revealed that BOD is higher in mining belt, Bidyadharpur (5.15) and it gradually decreases towards
downstream except Rajghat where it takes peak value 5.49.
The higher value of BOD at Bidyadharpur may be due to receiving of mining discharges in large scale
as there are three chromite mines namely Baula open caste and underground mines, Bangur chromite mines and
Nuasahi chromite mines are in operation. It is the only Bangur chromite mines that discharges one lakh tones
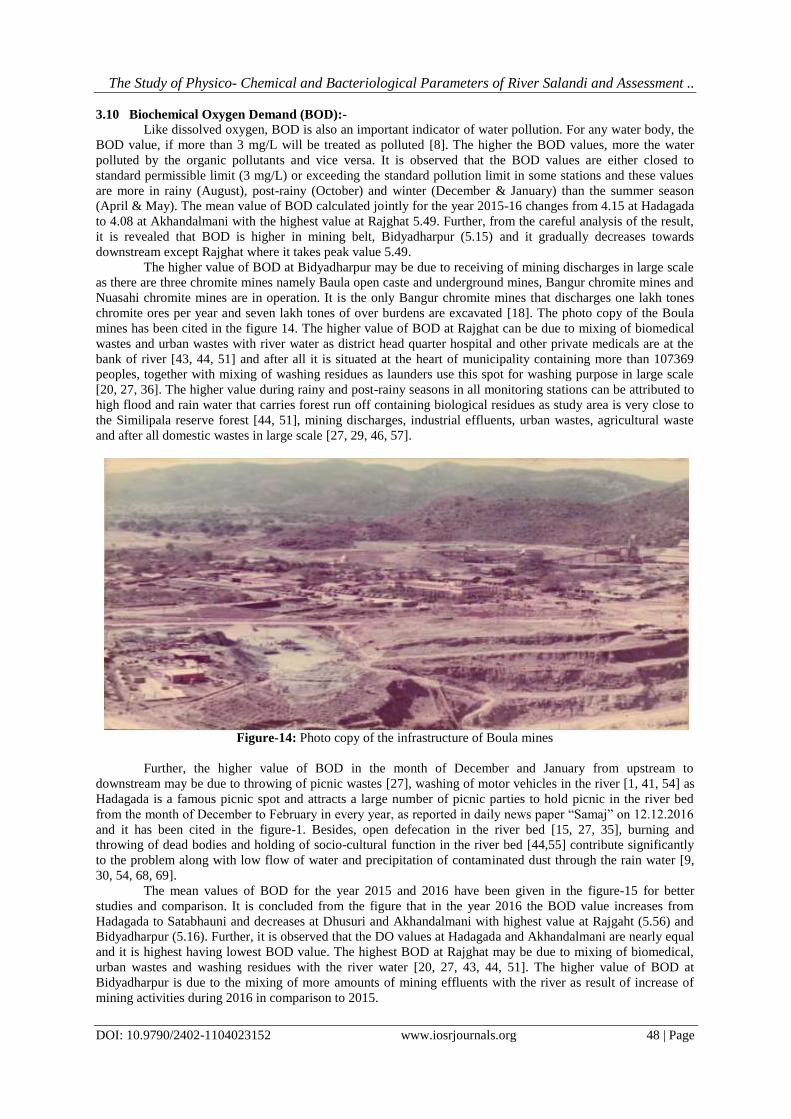
chromite ores per year and seven lakh tones of over burdens are excavated [18]. The photo copy of the Boula
mines has been cited in the figure 14. The higher value of BOD at Rajghat can be due to mixing of biomedical
wastes and urban wastes with river water as district head quarter hospital and other private medicals are at the
bank of river [43, 44, 51] and after all it is situated at the heart of municipality containing more than 107369
peoples, together with mixing of washing residues as launders use this spot for washing purpose in large scale
[20, 27, 36]. The higher value during rainy and post-rainy seasons in all monitoring stations can be attributed to
high flood and rain water that carries forest run off containing biological residues as study area is very close to
the Similipala reserve forest [44, 51], mining discharges, industrial effluents, urban wastes, agricultural waste
and after all domestic wastes in large scale [27, 29, 46, 57].
Figure-14: Photo copy of the infrastructure of Boula mines
Further, the higher value of BOD in the month of December and January from upstream to
downstream may be due to throwing of picnic wastes [27], washing of motor vehicles in the river [1, 41, 54] as
Hadagada is a famous picnic spot and attracts a large number of picnic parties to hold picnic in the river bed
from the month of December to February in every year, as reported in daily news paper “Samaj” on 12.12.2016
and it has been cited in the figure-1. Besides, open defecation in the river bed [15, 27, 35], burning and
throwing of dead bodies and holding of socio-cultural function in the river bed [44,55] contribute significantly
to the problem along with low flow of water and precipitation of contaminated dust through the rain water [9,
30, 54, 68, 69].
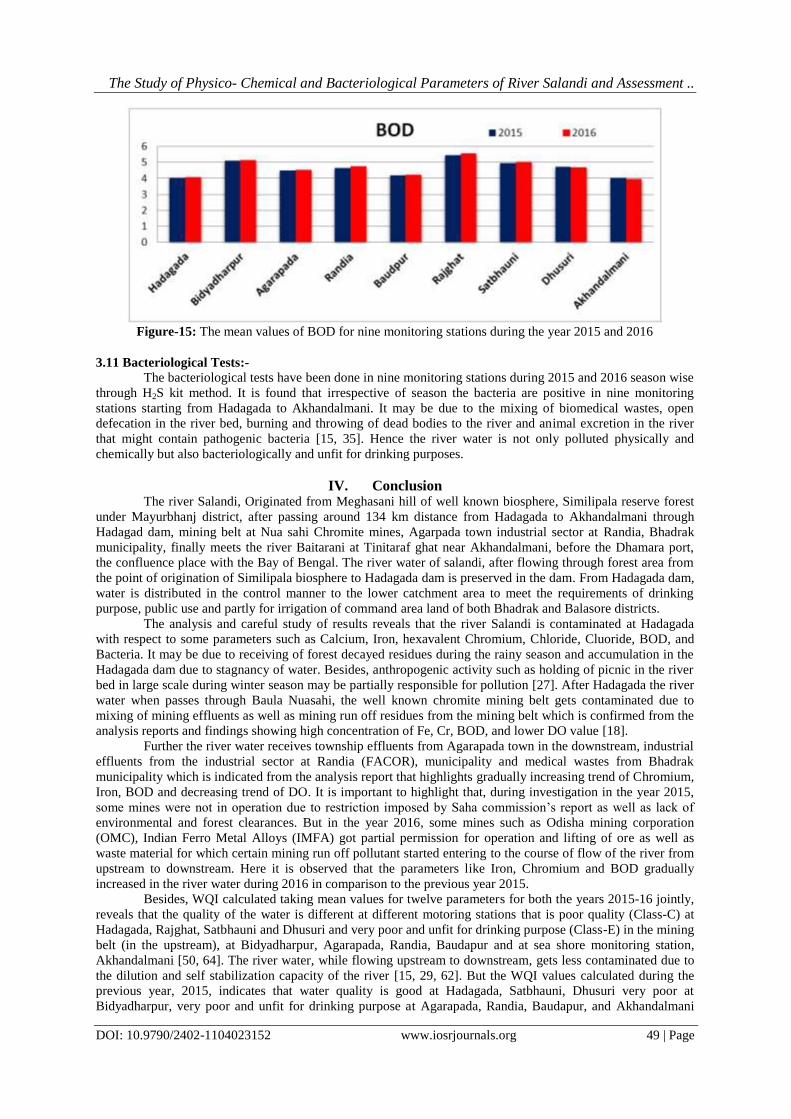
The mean values of BOD for the year 2015 and 2016 have been given in the figure-15 for better
studies and comparison. It is concluded from the figure that in the year 2016 the BOD value increases from
Hadagada to Satabhauni and decreases at Dhusuri and Akhandalmani with highest value at Rajgaht (5.56) and
Bidyadharpur (5.16). Further, it is observed that the DO values at Hadagada and Akhandalmani are nearly equal
and it is highest having lowest BOD value. The highest BOD at Rajghat may be due to mixing of biomedical,
urban wastes and washing residues with the river water [20, 27, 43, 44, 51]. The higher value of BOD at
Bidyadharpur is due to the mixing of more amounts of mining effluents with the river as result of increase of
mining activities during 2016 in comparison to 2015.
The Study of Physico- Chemical and Bacteriological Parameters of River Salandi and Assessment ..
DOI: 10.9790/2402-1104023152 www.iosrjournals.org 49 | Page
Figure-15: The mean values of BOD for nine monitoring stations during the year 2015 and 2016
3.11 Bacteriological Tests:-
The bacteriological tests have been done in nine monitoring stations during 2015 and 2016 season wise
through H2S kit method. It is found that irrespective of season the bacteria are positive in nine monitoring
stations starting from Hadagada to Akhandalmani. It may be due to the mixing of biomedical wastes, open
defecation in the river bed, burning and throwing of dead bodies to the river and animal excretion in the river
that might contain pathogenic bacteria [15, 35]. Hence the river water is not only polluted physically and
chemically but also bacteriologically and unfit for drinking purposes.
IV. Conclusion The river Salandi, Originated from Meghasani hill of well known biosphere, Similipala reserve forest
under Mayurbhanj district, after passing around 134 km distance from Hadagada to Akhandalmani through
Hadagad dam, mining belt at Nua sahi Chromite mines, Agarpada town industrial sector at Randia, Bhadrak
municipality, finally meets the river Baitarani at Tinitaraf ghat near Akhandalmani, before the Dhamara port,
the confluence place with the Bay of Bengal. The river water of salandi, after flowing through forest area from
the point of origination of Similipala biosphere to Hadagada dam is preserved in the dam. From Hadagada dam,
water is distributed in the control manner to the lower catchment area to meet the requirements of drinking
purpose, public use and partly for irrigation of command area land of both Bhadrak and Balasore districts.
The analysis and careful study of results reveals that the river Salandi is contaminated at Hadagada
with respect to some parameters such as Calcium, Iron, hexavalent Chromium, Chloride, Cluoride, BOD, and
Bacteria. It may be due to receiving of forest decayed residues during the rainy season and accumulation in the
Hadagada dam due to stagnancy of water. Besides, anthropogenic activity such as holding of picnic in the river
bed in large scale during winter season may be partially responsible for pollution [27]. After Hadagada the river
water when passes through Baula Nuasahi, the well known chromite mining belt gets contaminated due to
mixing of mining effluents as well as mining run off residues from the mining belt which is confirmed from the
analysis reports and findings showing high concentration of Fe, Cr, BOD, and lower DO value [18].
Further the river water receives township effluents from Agarapada town in the downstream, industrial
effluents from the industrial sector at Randia (FACOR), municipality and medical wastes from Bhadrak
municipality which is indicated from the analysis report that highlights gradually increasing trend of Chromium,
Iron, BOD and decreasing trend of DO. It is important to highlight that, during investigation in the year 2015,
some mines were not in operation due to restriction imposed by Saha commission’s report as well as lack of
environmental and forest clearances. But in the year 2016, some mines such as Odisha mining corporation
(OMC), Indian Ferro Metal Alloys (IMFA) got partial permission for operation and lifting of ore as well as
waste material for which certain mining run off pollutant started entering to the course of flow of the river from
upstream to downstream. Here it is observed that the parameters like Iron, Chromium and BOD gradually
increased in the river water during 2016 in comparison to the previous year 2015.
Besides, WQI calculated taking mean values for twelve parameters for both the years 2015-16 jointly,
reveals that the quality of the water is different at different motoring stations that is poor quality (Class-C) at
Hadagada, Rajghat, Satbhauni and Dhusuri and very poor and unfit for drinking purpose (Class-E) in the mining
belt (in the upstream), at Bidyadharpur, Agarapada, Randia, Baudapur and at sea shore monitoring station,
Akhandalmani [50, 64]. The river water, while flowing upstream to downstream, gets less contaminated due to
the dilution and self stabilization capacity of the river [15, 29, 62]. But the WQI values calculated during the
previous year, 2015, indicates that water quality is good at Hadagada, Satbhauni, Dhusuri very poor at
Bidyadharpur, very poor and unfit for drinking purpose at Agarapada, Randia, Baudapur, and Akhandalmani
The Study of Physico- Chemical and Bacteriological Parameters of River Salandi and Assessment ..
DOI: 10.9790/2402-1104023152 www.iosrjournals.org 50 | Page
[44]. Hence from the comparison of the WQI with the year 2015, it can be concluded that the quality of water is
under deterioration due to the increasing of mining activities soon after the partial withdrawal of restriction
imposed on mines by Saha commission.
From the above investigations, findings and assessments, it is concluded that the river Salandi is not
only contaminated physically, chemically but also bacteriologically and not meeting the river water quality of
Class-C water standard as a whole. The bacteriological studies in details have not been done due to the
inadequate laboratory facilities. However, in present condition, it is not suitable to use for drinking purpose
according to IS-10500 [8] and WHO guidelines [65]. The mining activities, if increases subsequently, will
intensify the magnitude of pollution and must pose a great challenge to the survival of flura and fauna,
ecosystem and after all on the dwellers.
Hence urgent measures such as disinfection, electro-dialysis and particularly for hexavalent
Chromium, reduction with SO2 in acidic medium followed by lime treatment to precipitate as chromium
hydroxide along with approved modern technology should be applied to treat the water carefully by the
appropriate authority for the benefit of the people, particularly for Bhadrak and Balasore district.
Acknowledgement The authors are thankful to the Vice Chancellor, VSSUT, the Principal, Bhadrak Autonomous College,
Bhadrak, and Executive Engineer, RW&SS for providing laboratory facilities for carrying out this research
work. Further the first author is thankful to Mr. C. K. Sahoo, HOD chemistry, A.B. College, Basudevpur and
Mr. L.K. Nayak, Asst. Prof. Dept. of Chemistry, Bhadrak Autonomous college for constant co-operation and
encouragement. No fund has been received from any source for this work.
References [1] Akhionbare, S.M.O. (2011): Factors in in the migration of heavy metals in the Otamiri river system, international journal of science
and nature 2(4), 856-860.
[2] Adeyemo, O. K., Adedokun, O. T., Yusuf, R. K. & Adeleye, E. A. (2008): Seasonal changes in physico-chemical parameters &
Nutrients load of river sediments in Ibadan city, Nigeria, Global NEST Journal, 10(3), 326-336. [3] American Public Health Association (APHA) (2005), AWWA, Standard methods of the examination of water & waste water,
Washington DC, 21st edition, USA.
[4] Akoteyon, I. S., Omotayo, A. O., Soladoye, O. & Olaoye, H. O. (2011): Determination of water quality index and stability of urban river for Municipal water supply in Lagos, Nigeria: Euro.J Scientific Res., 54(2), 263-271.
[5] Ammann, A. A., Michalke, B. & Schramel, P. (2002): Specification of heavy metals in environmental water ion-chromatography
coupled to ICP-MS, Anal. Bional.Chem, 372(3), 448-452.
[6] Balan, I. N., Shivakumar, M. & Kumar, P. D. M. (2012): An assessment of ground water quality using water quality index in
Chennai, Tamil Nadu, India, Chronicles Young Scient. 3(2), 146-150. [7] Bhadra, A. K., Sahu, B. & Rout, S. P. (2014): A study of water quality index (WQI) of the river Brahmani, Odisha(India) to
assess its potability: Int I of Current Engg. & Tec, Vol-4(06).
[8] BIS IS -10500, Indian standard for Drinking Water Bureau Of Indian Standards (IS -10500), New Delhi(2004). [9] Bird, G., Brewer, P., Macklin, M., Balteanu, D., Driga, B., Serban, M. & Zaharia, S. (2003): The solid state partitioning of
contaminant metals and as in river channel sediments of mining affected Tisa drainage basin, North Western Romania and Eastern
Hungary, Appl. Geo Chem,18(10),1583-1595. [10] Begum, A. & Harikrishna, M. (2008): Study of quality of water on some stream of Cauvery River, E J Chemistry, 5,377 -
384.
[11] Chauhan, A. & Singh, S. (2010): Evaluation of Ganga waters for drinking purposes by water quality index at Rishikesh, Utarakhand, India, Report Opinion 2 (9), 53-61.
[12] Cude, C.G. (2001): Oregon, Water Quality Index: A tool for evaluating water quality management effectiveness, Journal of
American Water Resources Association, 37, 125-137. [13] Choudhury, R. M., Muntasir, S. Y. & Hossain, M. M. (2012): Water quality index of water bodies along Faridpur-Barisal road in
Bangladesh, Glob.Engg.Tech.Rev, 2 (3),1-8.
[14] Dash, A., Das, H.K. and Mishra, B. (2015); Hydrochemical characteristics and water quality of surface water in and around Joda of Keonjhar, Odisha, India, International journal of energy, sustainability and environment engineering, 1(4-5), 128-136.
[15] Dash, A., Das, H.K., Mishra, B. and Bhuyan, N.K.(2015): “Evaluation of water quality of local strings and Baitarani river in Joda
area of Odisha, India.” International journal of current research, 7(3), 13559-13568. [16] Dash, M.C. (2004): Ecology, Chemistry & Management of Environmental Pollution, 1 st Edition, Mac Milian India Limited,
New Delhi, 82-85.
[17] Ewa, E. E., Iwara, A. I., Adeyemi, J. A., Eya, E. I., Ajake, A. O. & Out, C. A. (2011):Impact of Industrial activities on wat er quality of Omuko Creek,Sacha J of Environmental Studies ,1(2),08-16.
[18] Environmental Impact Assessment & Environmental Management plan of Boula Chromite mines, FACOR Ltd., Source, State
Pollution Control Board, Odisha (1994). [19] Fluoride in Drinking water, Back ground document of development of WHO guidelines for drinking water qual ity,
WHO/SDE/WSH/03.04/96.
[20] Ganie, M. A.,Khan, M. I. & Muni, P. (2012): Seasonal Variation in physico-chemical characteristics of Pahuja Reservoir , Jhansi , Bundelkhand region , Central India , Int J of Current Research,4(12), 115-118
[21] Gray, N. F. (2005): Water Technology: An introduction for Environmental Scientists & Engineers, 2nd Edition, Elsevier India Pvt.
Ltd., New Delhi. [22] Goel P K: Water pollution causes, effect and control, Revised 2nd Edition, New Age International Pvt. Ltd., 233(2009).
[23] Hujare, M. S. (2008): Seasonal variation of physico-chemical parameters in perennial tank of Talsande, Maharastra ,
Ecotoxicol ,Environ.Monit , 18(3) ,233-242.
The Study of Physico- Chemical and Bacteriological Parameters of River Salandi and Assessment ..
DOI: 10.9790/2402-1104023152 www.iosrjournals.org 51 | Page
[24] Hatje, V., Bidone, E. D. & Maddock, J. (1998): Estimation of natural & anthropogenic components of heavy metal fluxes in fresh
water Sinos river, Rio Griande do Sul State, South Brazil, Environ. Tech., 19(5), 483-487.
[25] Ishaq, F. & Khan, A. (2013): Heavy Metal analysis of river Jamuna & their relation with some physico chemical parameters, Global J of Environmental research, 7(2), 34-39.
[26] Kaur, H. (2010); Environmental Chemistry, 5th revised Edition, Pragati Prakashan, India, 233-224.
[27] Kalavathy, S., Sharma, T. R. & Kumar, P. S. (2005): Water quality index of River Cauvery in Tiruchirappli, Tamilnadu, ARCH ENVIRON Sci, 5, 55-61.
[28] Kaul, V & Handoo J K: Physico-chemical characteristics of Nilnag , a high altitude forest lake in Kashmir & its comparison with
valley lakes,Proc. Indian National Sci. Academy 46(4),528-541(1980). [29] Kar, D., Sur, P., Mandal, S. K., Saha, T. & Kole, R. K. (2008): Assessment of heavy metal pollution in surface water, Int J
Environ.Sci Tech, 5(1), 119-124.
[30] Kraft, C., Tumpling, W. & Zachmann, D. W. (2006): The effect of mining in Northern Romania on the heavy metal distribution in sediments of river Szamos & Tisza, Hungary, Acta Hiroshima Hydrobiol, 43,257-264.
[31] Koshy, M. & Nayar, P. V. (2000): Water quality of river Padma at Kozencherry, Pol Res, 19(4), 665-668.
[32] Karim, A.A. & Panda, R. B.(2015): Assessment of water quality of Subarnarekha river in Balasore region, Odisha, India, Current World Environment, 9 (2),437-446.
[33] Lawson, E. O. (2011): Physico-chemical parameters & heavy metal contents of water from the mangrove swamps of Lagos lagoon,
Lagose, Nigeria, Advances in Biological Research, 5(1), 08-21. [34] Laluraj, C. M., Padma, P., Sujatha, C. H., Nair, S. M., Kumar, N. C. & Chacko, (2002): Base line studies on the chemical
constituents of Kayamkulam Estuary near to newly commissioned NTPC power station, Ind J of Envtl. Prten.,22(7),721-731.
[35] Mishra, A. & Tripathi, B. D. (2007): Seasonal & temporal variation in physico-chemical & bacteriological characteristics of river Ganga in Varanasi, Current World Environment, 2(2), 149-154.
[36] Moshood, K. M. (2008): Assessment of water quality of Oyun Reservoir,Offa, Nigeria using selected physico-chemical parameters
,Turkish J of Fisheries & Aquatic Science,8,309-319. [37] Murhekar, G. H. (2011): Determination of physico-chemical parameters of surface water samples in and around .Akot. city, Int J
Res chem., 1(2), 183-187.
[38] Mwangi, J. K.,Thiongo, G. T. & Gathenya, J. M. (2012):Assessment of water quality status of Sasumua watershed ,kenya,e-learning J kuat .ac.ke/journal.
[39] Martin, P. & Haniffa, M. A. (2003): Water quality profile in South India river Tamiraparani , IJEP, 23,286 -292.
[40] Ndubi, D.,Oyaro, N.,Giathane, E. & Afullo, A. (2015):Detemination of physico-chemical properties of sources of water in Narok North Sub country ,Kenya,Int Research J of Enb. Sciences,4(1),47-51.
[41] Oberoi, J. & Gupta, K. C. (2010): Occurrence fluoride in ground water of various villages of District Ambala , Haryana, Poll res , 29(3),
435440. [42] Pardeshi, D. S. & Baidya, S. (2015): Physico-chemical assessment of Waldhuni River Ulhasnagar, Thane, India- A case
study: Int. J of Current Research & Academic Review, 3(4), 234-248.
[43] Panda, P. K., Panda, R. B. & Dash, P. K. (2015): Pollution Load of river Salandi in Boula Nuasahi mining belt, urban area a t Bhadrak & it's down streams in Odisha: IJIEASR, 4(12), 15-23.
[44] Panda, P. K., Panda, R. B. & Dash, P. K., (2016): Assessment of Water Quality Index of river Salandi at Hadagada Dam & its
Downstream upto Akhandalmani , Bhadrak , Odisha ,India, American J of Water Resources , 4(2), 44-53.
[45] Panda, R. B. et. al. (2012), Occurrence of fluoride in ground water of Pratipal Panchayat in Balasore Disctrict , Odisha ,India ,
Journal of Environment , 01(02),33-39. [46] Pradhan, U. K., Shirodkar, P. V. & Sahu, B. K. (2009):Physico-chemical evaluation of its seasonal changes using Chemo metric
techniques, Current Science ,96(9),1203-1209.
[47] Pandey, J., Subhashish, K. & Pandey, R. (2009): Metal contamination of Ganga river as influenced by atmospheric deposition, Bull Environ Contamination Toxicol, 83(2), 204-209.
[48] Patil, P. L., Sawant, D. V. & Deshmukh, R. N. (2012): Physico-chemical parameters for testing of water .A review, Int J
Environmental Sciences, 3(3), 1194-1207. [49] Padmanav, B. & Belagaali, S. L. (2005): Comparative study on water quality index of four lakes in the Mysore city, IJEP, 25, 941-
942.
[50] Panda, R. B., Sinha, B. K. & Sahu, B. S. (1991): Water Quality Index of the river Brahmani at Rourkela Industrial Complex of Orissa, J.Eco.Toxico.Env. Monitoring 1 (3), 169-175.
[51] Panda, P.K., Panda, R.B. and Dash, P.K. (2016): Seasonal variation of physico-chemical parameters of river Salandi from
Hadagada dam to Akhandalmani, Bhadrak, Odisha, India, IOSR journal of Environmental Science, Toxicology and Food Technology, 10(11), Ver. III , 15-28.
[52] Panigrahi, S. and Patra, A.K. (2013); Water quality analysis of river Mahanadi in Cuttack city, Odisha, India, Indian journal of
science 2(2), 27-33. [53] Rim-Rukeh, A., Lkhifa, O. G., & Okokoyo, A. P. (2006): Effect of agricultural activities on the water quality of Orogodo river,
Agbor Nigeria, J Appl Sci Res ,2(5), 256-259.
[54] Reza, R. & Sing, G. (2010): Heavy metal contamination & its indexing approach for river water, Int J Environ. Sci Tech, 7(4), 785792.
[55] Rao, C. S., Rao, B. S., Hariharan, ALNSH, & Bharathi, N. M. (2010): Determination of water quality index of some areas in
Guntur district, AndhraPradesh, Int J Appl.Bio.Pharma.Tech. 1 (1), 79-86. [56] Rown, R. M., Mc, Cleiland, N. .J., Deiniger, R. A. & Oconnor, M. F. A. (1972): Water quality index-Crossing the physical barrier
(Jenkis.S.H,ed) Proceedings in international conference on water pollution research, Jerusalem 6, 787-797.
[57] Serpil, S. (2012): An agricultural pollutants-chemical fertilizer, Int Env & Dev, 3(1). [58] Satya Prakash's Modern Inorganic Chemistry by R D Madan, 2nd Edition, S Chand & Co., India, 1077-1088 (2006).
[59] Samantray, P., Mishra, B. K., Panda, C. R. & Rout, S. P. (2009): Assessment of water index in Mahanadi & Atharabanki rivers &
Taladanda canal in Paradeep Area, Odisha,India, J Hum Ecol, 26(3),153-161. [60] Sadat, Nazneen,(2012): Study of fluoride concentration in the river Godavari & ground water of Nandeed city, Int J of Engg.
Inventions, 1(1), 11:15.
[61] Saikh, N. & Yeragi, S. G. (2003): Seasonal temperature changes and their influence on free carbon dioxide, dissolved oxygen and pH in Tansa, Thane District, Maharastra J Aqua.Biol., 18, 73-75.
[62] Swarnalatha, P., Rao, K. N., Kumar, P. V. R. & Harikrishna, M. (2007) :Water quality assessment by using an index at village
level- A case study, Poll Res, 26,619-622.
The Study of Physico- Chemical and Bacteriological Parameters of River Salandi and Assessment ..
DOI: 10.9790/2402-1104023152 www.iosrjournals.org 52 | Page
[63] Sing, T.A., Meetel, N.S. and Meltel, L.B. (2013): seasonal variation of some physic-chemical characteristics of three riversin
Imphal, Manipur: A comparative Evaluation, Current World Environment, 8(1), 93-102.
[64] Tyagi, S., Sharma, B.,Sing, P. & Dobhai, R. (2013):Water quality assessment in terms of Water Quality Index, Science & Education Publishing, AJWR, Vol-I(3), 34-38.
[65] WHO guidelines for drinking water quality, 3rd Edition, World Health Organization, Geneva, (2004).
[66] Waste Water Concept & Design Approach by Karia, G. L. & Christian. R. A. (2006); 1st Edition, Prentice Hall of India, Ltd., New Delhi.
[67] Wani, Y. H., Jatayana, M., Kumar, S. & Ahmad, S. (2016): Assessment of water quality of Dal lake, Srinagar by using water
quality indices, IOSR J of Environmental Science, Toxicology & Food Technology, 10(7), 95-1021. [68] Wong. C. S. C., Li, X. D., Zhang, G., Qi, S. H. & Peng, S. Z. (2003): Atmospheric deposition of heavy metals in Pearl river delta,-
China, Atmos Environ, 37(6), 767-776.
[69] Wu, Y. F., Liu, C. Q, & Tu, C. L. (2008): Atmospheric deposition of metal in TSP of Guiyang, PR China, Bull Environ Contamination Toxicol, 80(5), 465-468.
[70] Xie, P., Zhuge, Y. & Dai, M.(1996): Impact of eutrofication on biodiversity of Plankton Community, Acta Hydrobiol
Sinica,20,30-37.


![Estimation of the Degree of Pollution and Sanitary and ... Introduction Complex physico-chemical and bacteriological studies [7, 8, 9, 13] carried out in 1989-1992 on the underground](https://img.pdfslide.net/doc/110x75/5eddd374ad6a402d66690821/estimation-of-the-degree-of-pollution-and-sanitary-and-introduction-complex.jpg)