Embed Size (px)
Citation preview
Available online at www.worldscientificnews.com
WSN 33 (2016) 43-55 EISSN 2392-2192
The study of the effects of tax evasion and tax revenues on economic stabilities in OECD countries
Mohsen Mehrara*, Yazdan Gudarzi Farahani
Faculty of Economics, University of Tehran, Kargar-e-shomali, Po Box 14155-6445, Tehran, Iran
*E-mail address: [email protected]
ABSTRACT
The issue of tax evasion has received a considerable attention from researchers and policy
making institutions over the past decades. Various studies have been conducted on tax evasion and tax
avoidance, and its effects on income inequality and economic growth. The main purpose of this paper
is to examine the effect of tax evasion and government tax revenues on economic stability. For this
reason, 29 OECD countries‟ data from 1990-2013 is used and panel approach is applied to estimate
the results. In the first step, using monetary approach, an index for tax evasion for OECD countries is
estimated. In the second step, the effects of tax evasion and tax revenues on economic stability are
studied. The results show that tax evasion and income tax rate has a U shape relationship. That is, as
tax rate increase the probability of tax evasion would also increase. Also, it is found that tax evasion
lead to economic instability and more tax revenues will be beneficial to a better economic condition.
Keywords: Tax revenue; Tax evasion; Economic stability; Panel data
1. INTRODUCTION
The share of tax income from government's total income is often more than that of other
sorts of income in various countries and taxation is the main source of government's income
to fulfil its obligations. By virtue of tax lever, government is able of absorbing a significant
World Scientific News 33 (2016) 43-55
-44-
part of liquidity in private sector and the part of capital seeking for the maximum profit in
minimum time period and with minimum effort. By tax lever, government can also decrease
the proceeds of commerce and distribution sector in a way that brings back the production
sector in the spotlight. While taxation more than the capacity will hinder economic growth, on
other hand taxation below the capacity will be compensated from other sources of income if
government expenditure sustains and this leads to breakdown of economic sectors. The
correct manipulation of tax lever and taxation commensurate with tax capacity (reflected by
share of each social group from GDP) can make government needless of non-tax income.
Disinterest of many government to eradicate the phenomenon of tax evasion leads to
imperfect implementation of taxation law. Tax evasion might be expected to be related to
level of economic development, taxation structure, ideological values and behavior of tax
payers. By the way it is obvious that for any level of economic development and other factors,
government can choose different level of implementation of law. Then question is "Why tax
evasion is permitted to sustain?".
The theoretical literature about tax evasion and practical results in industrial countries
show that with a proper mixture of imposing punishments and with a plausible taxation
structure, tax evasion can be decreased to a very low level. In order to describe the stabilizing
role of taxes in economy of countries, and the relationship between ratio of tax to income and
stabilizing behavior of tax, one should study the effect of taxes on income of governments and
the relationship between tax income, government expenditure and GDP, and the effect of ratio
of tax to production cost on economic stability. The issue of tax evasion has become a major
problem for governments. Nowadays, governments are actively trying to reduce the
possibility of misrepresentation of income by people. Tax evasion refers to all illegal ways
that people employ to avoid paying taxes. Underreporting income, profit or over reporting the
amount of tax deductions are some well-known ways of misrepresenting tax liabilities.
There have been opposing views on how governments can deal with this problem. The
classical view is that the increase in the tax rates will lead to an increase in the size of the
underground economy. Guttmann (1977) was the first to study the size and effect of tax
evasion. He estimates the size of the underground economy or the subterranean economy as
large as 9.4 percent of U.S GNP, which caused a lot of attention to the issue of tax evasion.
Also, he mentions that the underground economy is a product of government regulations and
policies and suggest revising them in order to not motivate unreported activities. However,
Feige (1979) estimates of the irregular economy were far bigger than Guttmann estimation.
He finds that the size of the illegal economy is 22 percent of GNP in 1976 and 33 percent of
GNP in 1978. His recommendation is to reduce tax rates in the legal sector, increase the
punishment for participation in the illegal activities and also legalizing currently illegal
activities such as gambling and use of marijuana. Clotfelter (1983) using the Internal Revenue
Service‟s Taxpayer Compliance Measurement Program (TCMP) survey for 1969 finds that
marginal tax rates affect the amount of tax evasion significantly.
An alternative view finds no evidence regarding the positive relationship between tax
rates and tax evasion (Friedman et al., 2000). They claim that businesses and people may be
derived to the underground economy because of weak institutions which are responsible for
protecting people‟s rights. According to this view, Weak jurisdictional system, bureaucracy
and corruption are the primary reasons that lead people to underground and unreported
economy.
World Scientific News 33 (2016) 43-55
-45-
The main concern of this study is the relationship between tax revenues and tax evasion
with economic stability. I did not find many studies which are concerned about the
relationship between these variables. One expectation is that increase in tax revenues result in
more and higher quality public goods such as more security, more roads, better social services
which in long run can lead to a more stable economy. Also, during the periods of recession,
governments which are financed mainly through taxes, are able to provide tax exemption, tax
credits and tax deductions in order to stimulate the market and offset the effects the recession.
Ilaboya and Ofiafoh (2014) on their study of tax ratio and output volatility in Nigeria sand
significant show that tax ratio has a positive and significant effect on output volatility and
they suggest to increase Nigeria taxes to improve the tax to GDP ratio. Afuberoh and Okoye
(2014) investigated the impact of taxation on revenue generation in Nigeria by using
regression analysis. They results show that, taxation has a significant effect to revenue
generation and taxation has a significant effect on Nigeria GDP. Dalu and et al (2012)
examined the relationship between tax evasion, avoidance and economy for Zimbabwe. They
results show that tax loopholes and taxpayers interference with revenue agents through
corruption and bribery are the major problems and the best way of curbing this problem is to
continually train and re-train revenue officers.
Finally results show that tax evasion lead to economic instability and tax revenues will
be beneficial to a better economic and social condition. Posch (2009) studies the effect of
taxation on output volatility and finds that for OECD countries fids a strong negative
relationship between taxation and output volatility.
The increase in the size of the underground activities implies that there are less reported
taxable income which means that the government may confront a budget deficiency. Also,
higher unofficial activities will decrease the legal GDP which can be interpreted as a sign of
recession and increase the uncertainty and the risk of investment. Therefore, tax evasion lead
to instability of the economy. Hence, it is expected that the increase in the amount of tax
evasion causes the economy to become more instable.
This paper studies the relationship between tax evasion and tax rates and economic
stability. Does higher taxes lead to more illegal activities? What is the effect of higher tax
evasion on economic stability? Does the causality run from tax evasion to economic activity
or the other way around?
This paper consists of four sections. Section 1, discusses the introduction, in which the
background and rationale of the study is outlined. Section 2, covers the details of the data and
research methodology employed in this study and reports the finding and discussions. The
final section contains the conclusions.
2. DATA AND METHODOLOGY
The relationships between economic stability with tax evasion and tax rates are
examined using a panel data model for a selected number of OECD countries over the period
1990-2013 come from OECD data bank website.
As a measure of economic stability, the standard deviation of GDP is employed in
which higher standard deviation of GDP implies a less stable economy. Income tax rate is
used as the measure of the tax rate. To estimate the rate of tax evasion, Guttmann monetary
approach is applied which is the ratio of currency in circulation to demand deposit. Control

World Scientific News 33 (2016) 43-55
-46-
variables are GDP, inflation and government expenditure which is used as a proxy for the size
of the government and openness of the economy.
2. 1. Model specification
In this study, first, the amount of tax evasion is calculated for OECD countries. Next,
the effect of income tax on tax evasion is estimated. Then, using pooled ordinary least squares
model, the effects of each independent variables including tax evasion and the ratio of tax
revenue to government expenditure on the dependent variable “standard deviation of GDP”
(as a proxy for economic stability) is estimated. I Combine time series and across section data
for OECD countries to create a pooled data set for those countries. The pooled regression
model does not estimate the impact of variables on each country separately. Instead, it yields
an overall measure of each variable on the group of countries.
Panel data provides a large number of point data, increasing the degrees of freedom and
reducing the collinearity between regressors. Therefore, it allows for more powerful statistical
tests. It can also take heterogeneity of each cross-sectional unit into account, and give “more
variability, less collinearity among variables, more degrees of freedom, and more efficiency”
(Baltagi, 2001).
2. 2. Estimation Procedure
In order to investigate the existence of the long run relationship between variables, first
it is necessary to determine the existence of unit roots in the data series. For this study, I have
chosen the Im, Pesaran and Shin (1997) (IPS, hereafter), which is based on the well-known
Dickey-Fuller procedure. IPS proposed a test for the presence of unit roots in panels that
combines information from the time series dimension with the data from the cross section
dimension such that fewer time observations are required for the test to have power.
After checking the existence of unit root for each variable, now we can check the long
run relationship among the variables. A common practice is to test for cointegration is
Johansen‟s procedure. However, the power of the Johansen test in multivariate systems with
small sample sizes can be severely distorted. To this end, it is needed to combine information
from time series as well as cross-section data once again. For studying the existence of a long-
run cointegration among variables, panel cointegration tests suggested by Pedroni (1999 and
2004) is used.
We first start estimating the effects of each independent variables on the dependent
variable by using pooled ordinary least squares model. We create a pooled data by combining
time series and across section data for OECD countries. The pooled regression model doesn‟t
estimate the impact of variables separately on each country, but instead yields an overall
measure of each variables on the group of country. If we find large standard errors for
variables, the next step is testing the fixed and random effect which are more advanced
models if the pooled one was not appropriate.
Panel data provide a large number of point data, increasing the degrees of freedom and
reducing the collinearity between regressors. Therefore, it allows for more powerful statistical
tests and normal distribution of test statistics. It can also take heterogeneity of each cross-
sectional unit into account, and give “more variability, less collinearity among variables, more
degrees of freedom, and more efficiency” (Baltagi, 2001).
World Scientific News 33 (2016) 43-55
-47-
3. ESTIMATION RESULT
3. 1. Estimating the underground economy size (Tax evasion)
Variables used for estimating the amount of tax evasion are tax revenue (TAX), gross
domestic production (GDP), volume of money (M1), liquidity (M2), inflation (INF), the ratio
of currency in circulation (CU), velocity of money (V1).
For calculating currency ratio including tax variables (
) the following equation is
used (Kemal, 2003).
(
) (
) (
)
(4)
The above equation should be estimated twice. Once, considering tax variables in
currency holding ratio and the second time without including tax variables (
)
which by
using these two estimation, the volume of money in legal and illegal sector can be calculated
using the following equations.
( ) ((
) (
) ) (5)
( ) (6)
( ) (7)
( ) (8)
( ) (
) (9)
Using a log linear equation, expression (4) can be rewritten as the following and rest of
the procedure is the same.
{ (
) } { (
) } (10)
For estimating the tax evasion based on equation (3), pooled OLS approach is used.
Results of the model are reported in Table 1.
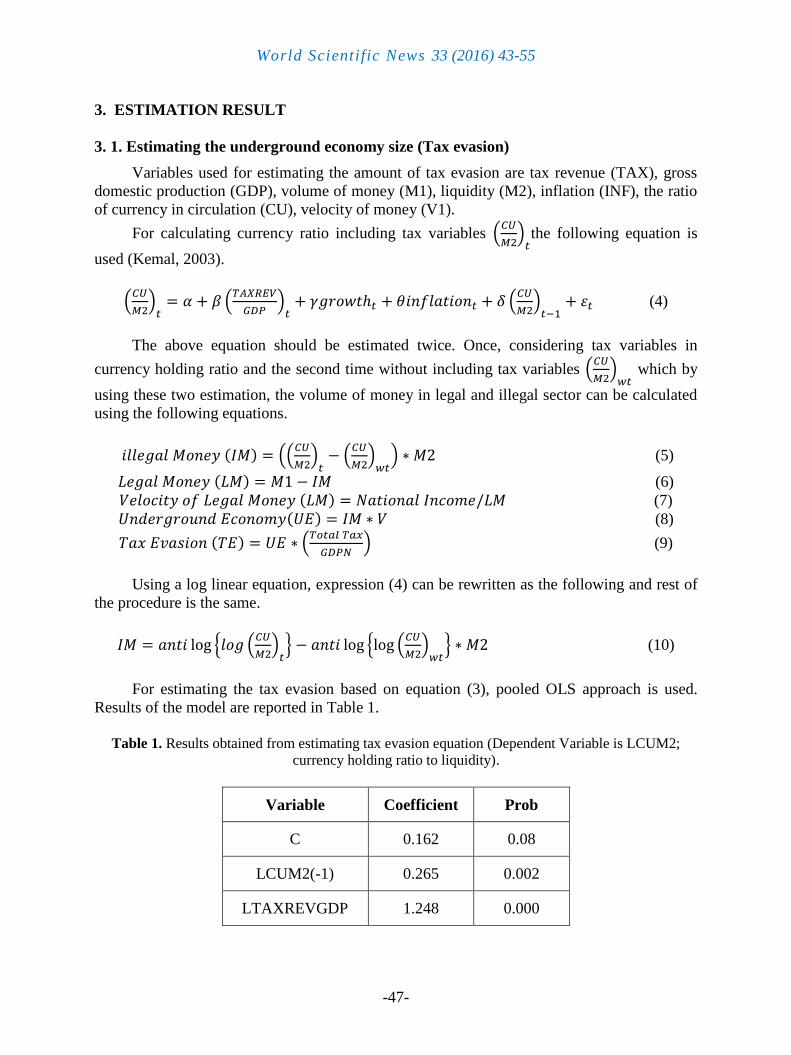
Table 1. Results obtained from estimating tax evasion equation (Dependent Variable is LCUM2;
currency holding ratio to liquidity).
Variable Coefficient Prob
C 0.162 0.08
LCUM2(-1) 0.265 0.002
LTAXREVGDP 1.248 0.000
World Scientific News 33 (2016) 43-55
-48-
GROWTH -0.043 0.001
INFLATION -0.021 0.003
Note: The null hypothesis for the t-ratio is
; Figures in parentheses are Prob
indicate statistical significance at the 5% level.
We use the Eviews software to estimate this
value.
Source: OECD data bank.
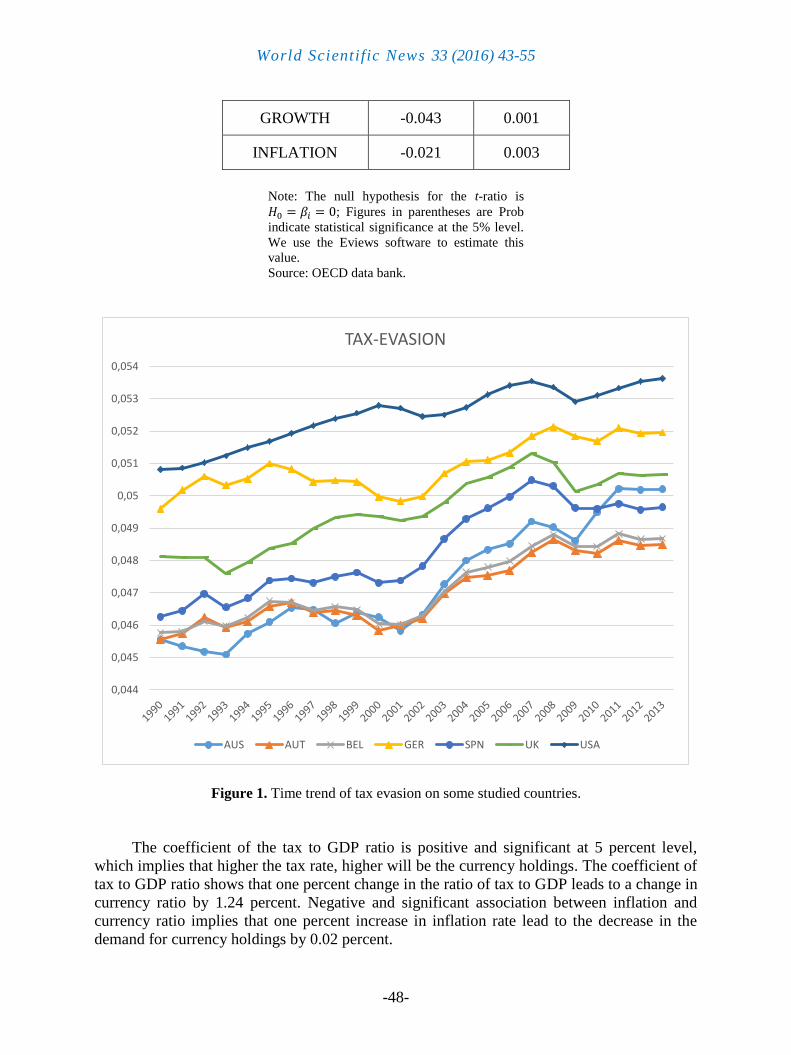
Figure 1. Time trend of tax evasion on some studied countries.
The coefficient of the tax to GDP ratio is positive and significant at 5 percent level,
which implies that higher the tax rate, higher will be the currency holdings. The coefficient of
tax to GDP ratio shows that one percent change in the ratio of tax to GDP leads to a change in
currency ratio by 1.24 percent. Negative and significant association between inflation and
currency ratio implies that one percent increase in inflation rate lead to the decrease in the
demand for currency holdings by 0.02 percent.
0,044
0,045
0,046
0,047
0,048
0,049
0,05
0,051
0,052
0,053
0,054
TAX-EVASION
AUS AUT BEL GER SPN UK USA
World Scientific News 33 (2016) 43-55
-49-
The coefficient of growth rate is negative, which implies that higher level of economic
growth is expected to decrease the demand for currency holdings. The value of significant
level shows that its impact is significant and we can use it for predicting (estimating) the size
of the underground economy. The coefficient of the lagged dependent variable is positive and
significant at five percent.
This indicates that it is significantly capturing the impact of inertia. is 0.75 and the
F-statistic is also significant, which shows that the variables in specification explain
significant variations in the dependent variable. The value of h-Durbin statistic is 1.88 which
lies inside the critical range, thus there is no serious autocorrelation problem. Also, we test
between pooled regression and OLS fixed effect in which null hypothesis states fixed effect is
redundant. F-stat and Chi-square cannot reject the null hypothesis so we don‟t need to
consider the individual effect of OECD countries.
In the figure above, the trend of tax evasion estimated from equation 4 for 7 OECD
countries is shown. As it can be seen tax evasion has a slow growth over 20 years. In case of
USA for example, the growth of tax evasion has been only 5 percent over the period and in
2013 the size of underground economy for USA was about 5 percent of the GDP that is
smaller than what Guttmann and Feige estimation of the underground economy. For other
countries the size of underground economy was even lower. Since it is found that the rate of
tax evasion is low in these countries, it can be indicative of the power of governments in
controlling economic instabilities by using tax policies. This would be explained more
detailed in following sections.
3. 2. Unit root test
When studying the relationship between the tax evasion and tax revenue and the
relationship between these two variables and economic stability in the presence of unit root
variable, one may obtain apparently significant relationships from unrelated variables. This
phenomenon is called spurious regression. Therefore, it is necessary to determine the
existence of unit roots in the data series. Panel unit root tests are similar, but not identical to
unit root tests carried out on a single series. It is suggested that a panel-based unit root test
enhances the power of the unit root test as it allows for greater efficiency by providing more
degrees of freedom and for heterogeneity across individual series.
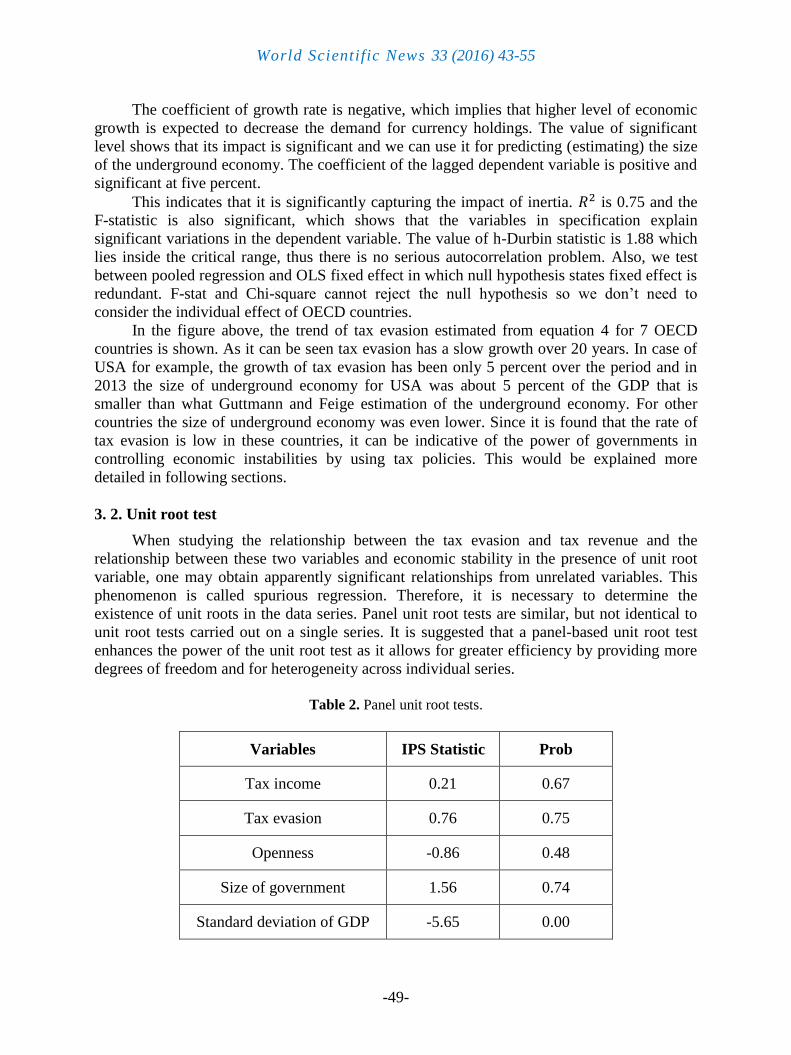
Table 2. Panel unit root tests.
Prob IPS Statistic Variables
0.67 0.21 Tax income
0.75 0.76 Tax evasion
0.48 -0.86 Openness
0.74 1.56 Size of government
0.00 -5.65 Standard deviation of GDP
World Scientific News 33 (2016) 43-55
-50-
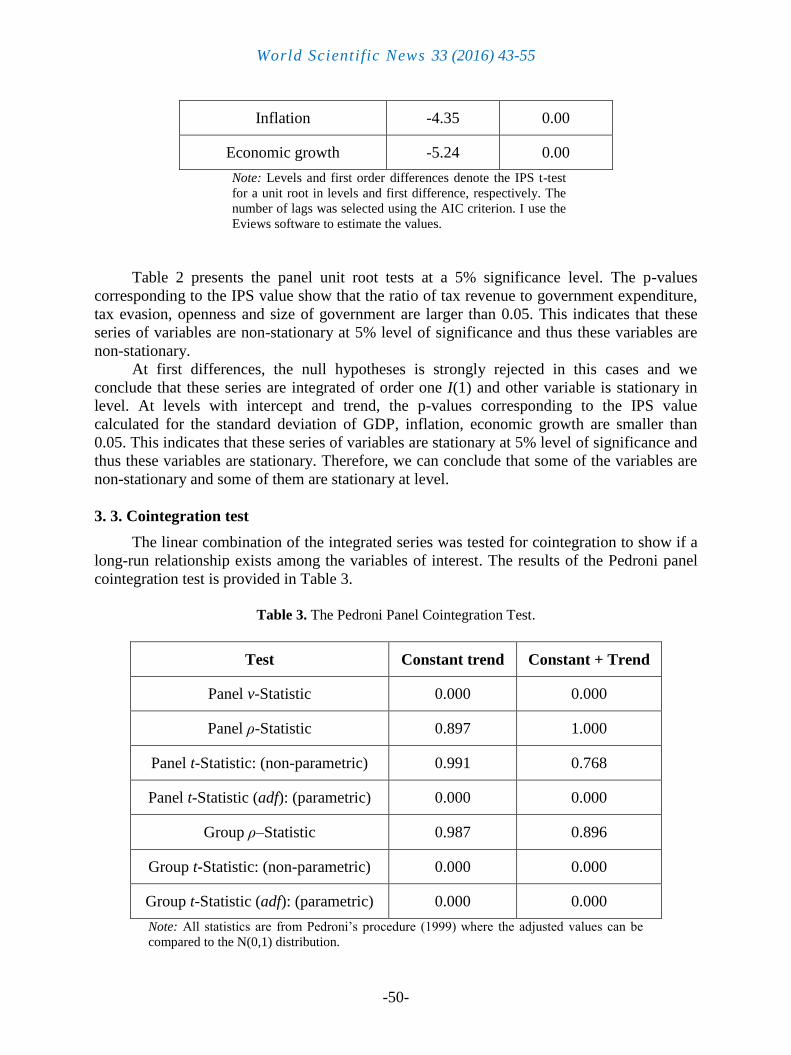
0.00 -4.35 Inflation
0.00 -5.24 Economic growth
Note: Levels and first order differences denote the IPS t-test
for a unit root in levels and first difference, respectively. The
number of lags was selected using the AIC criterion. I use the
Eviews software to estimate the values.
Table 2 presents the panel unit root tests at a 5% significance level. The p-values
corresponding to the IPS value show that the ratio of tax revenue to government expenditure,
tax evasion, openness and size of government are larger than 0.05. This indicates that these
series of variables are non-stationary at 5% level of significance and thus these variables are
non-stationary.
At first differences, the null hypotheses is strongly rejected in this cases and we
conclude that these series are integrated of order one I(1) and other variable is stationary in
level. At levels with intercept and trend, the p-values corresponding to the IPS value
calculated for the standard deviation of GDP, inflation, economic growth are smaller than
0.05. This indicates that these series of variables are stationary at 5% level of significance and
thus these variables are stationary. Therefore, we can conclude that some of the variables are
non-stationary and some of them are stationary at level.
3. 3. Cointegration test
The linear combination of the integrated series was tested for cointegration to show if a
long-run relationship exists among the variables of interest. The results of the Pedroni panel
cointegration test is provided in Table 3.
Table 3. The Pedroni Panel Cointegration Test.
Test Constant trend Constant + Trend
Panel v-Statistic 0.000 0.000
Panel ρ-Statistic 0.897 1.000
Panel t-Statistic: (non-parametric) 0.991 0.768
Panel t-Statistic (adf): (parametric) 0.000 0.000
Group ρ–Statistic 0.987 0.896
Group t-Statistic: (non-parametric) 0.000 0.000
Group t-Statistic (adf): (parametric) 0.000 0.000
Note: All statistics are from Pedroni‟s procedure (1999) where the adjusted values can be
compared to the N(0,1) distribution.
World Scientific News 33 (2016) 43-55
-51-
Using the cointegration test, results show that the variables move together in the long run.
That is, there is a long-run steady state relationship between our variables for a cross-section
of countries. Taking into account the existence of long run relationship between the variables,
the next step is to estimate the relationship.
3. 4. Estimating the model
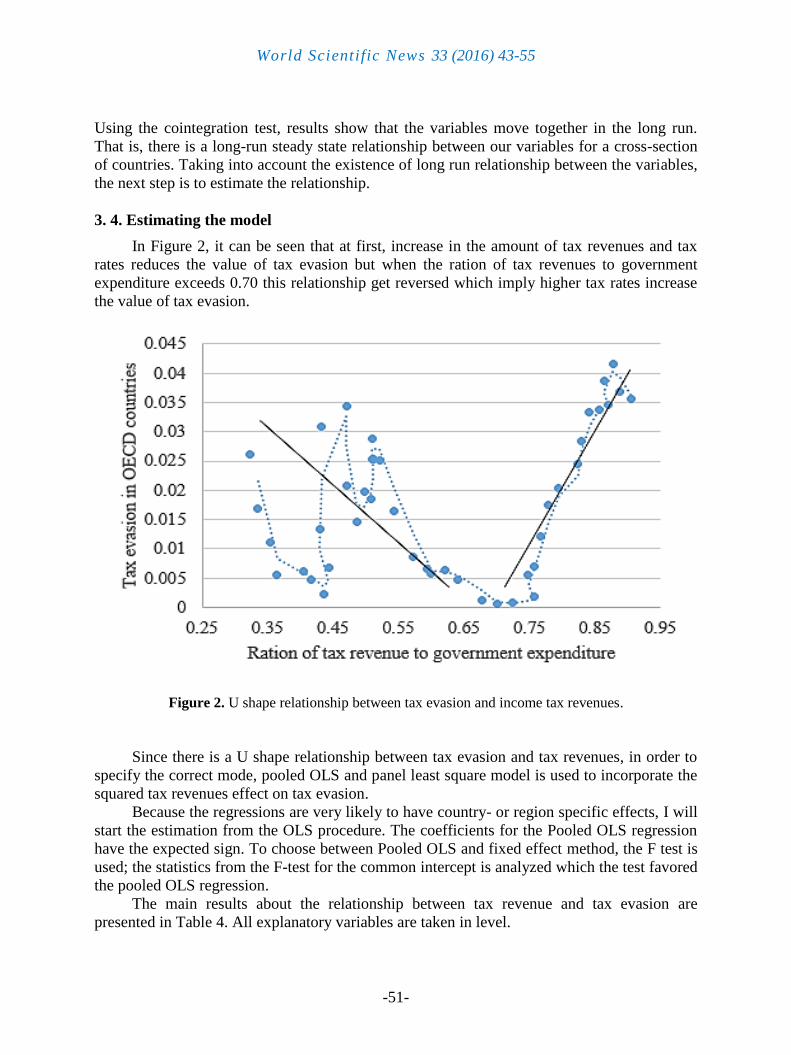
In Figure 2, it can be seen that at first, increase in the amount of tax revenues and tax
rates reduces the value of tax evasion but when the ration of tax revenues to government
expenditure exceeds 0.70 this relationship get reversed which imply higher tax rates increase
the value of tax evasion.
Figure 2. U shape relationship between tax evasion and income tax revenues.
Since there is a U shape relationship between tax evasion and tax revenues, in order to
specify the correct mode, pooled OLS and panel least square model is used to incorporate the
squared tax revenues effect on tax evasion.
Because the regressions are very likely to have country- or region specific effects, I will
start the estimation from the OLS procedure. The coefficients for the Pooled OLS regression
have the expected sign. To choose between Pooled OLS and fixed effect method, the F test is
used; the statistics from the F-test for the common intercept is analyzed which the test favored
the pooled OLS regression.
The main results about the relationship between tax revenue and tax evasion are
presented in Table 4. All explanatory variables are taken in level.

World Scientific News 33 (2016) 43-55
-52-
Table 4. Pooled Regression results (Dependent variable is tax evasion)
Variable Coefficient Prob
C 0.061 0.000
LTAXGOV -0.115 0.036
LTAXGOV^2 0.083 0.000 Note: The null hypothesis for the t-ratio is ; Figures
in parentheses are Prob indicate statistical significance at the 5%
level. We use the Eviews software to estimate this value.
Source: OECD data bank.
Table 4 shows that all coefficients are significant at 5% level. The coefficient of the
LTAXGOV shows that an increase in the ratio of tax to government expenditure by 1 percent
reduces the tax evasion by 0.11 percent. Also, the coefficient of the squared of the ratio of tax
to government expenditure is positive and significant. These results confirm the existence of a
U shape relationship between the variables.
The coefficient of determination ( ) is 0.82 and the F-statistic is also significant,
which shows that the variables in specification explain variations in the dependent variable
significantly. The value of Durbin-Watson statistic is 1.89 which means that there is no
serious autocorrelation in the sample.
The final step is to estimate the effect of taxation and tax evasion on economic stability.
There is hardly any established theoretical foundation on the specification of a model that
explains the impact of taxation and tax evasion on economic stability. In this study, the
attempt is to empirically observe the effect of these variables on economic stability.
In Figure 3, it is shown that in studied countries, there is a negative relationship between
tax revenues and standard deviation of GDP. Hence, it is possible to lower standard deviation
of GDP by using tax policies.Statistical results in table 5 show that in the group of OECD
counties, higher tax revenue can lead to the reduction in standard deviation of GDP. That is,
in the countries which that a coherent tax regulation, an increase in the rate of taxation can
lead to the more stable economic condition.
The starting point for the specification of the model is the analysis of Martinez-Vazquez
et al (2009). Even though they use panel data approach, I modified the model for the OECD
countries. The main results about the relationship between tax revenues, tax evasion and
standard deviation of GDP are presented in Table 5. These are “pooled regression” (pooled
OLS) and “fixed effects” models results. Again, I carry out the F test to test the homogeneity
of the country‟s effects. It is observed that the null hypothesis in which fixed effect model is
redundant versus pooled regression model does not reject. Therefore, the model is estimated
through Pooled OLS method.
Table 5 shows that all coefficients are significant at 5% level. According to the
coefficient of LTAXGOV an increase in the ratio of tax revenue to government expenditure
by 1 percent reduces the standard deviation of GDP by 0.15 percent. That is, economic
stability and taxation move together; increase in taxation improve economic stability. This
result support the supply-side hypothesis that emphasizes the effect of higher taxes towards
greater economic stability. It is also found that, the coefficient of TAXEV is statistically
significant and positive and 1 percent increase in tax evasion reduces economic stability by
0.11 percent.

World Scientific News 33 (2016) 43-55
-53-
Figure 3. The relationship between tax revenues and standard deviation of GDP.
Table 5. Pooled Regression results (dependent variable is standard deviation of GDP).
Variable Coefficient Prob
C 1.212 0.000
LTAXGOV -0.155 0.001
TAXEV 0.113 0.000
SIZE 0.251 0.004
OPEN 1.293 0.001
INF 0.932 0.002
Note: The null hypothesis for the t-ratio is
; Figures in parentheses are Prob
indicate statistical significance at the 5% level.
We use the Eviews software to estimate this
value.
Source: OECD data bank.
0,8
0,9
1
1,1
1,2
1,3
1,4
1,5
1,6
0,29 0,31 0,33 0,35 0,37 0,39 0,41
The
rati
o o
f ta
x r
even
ue
to g
over
nm
ent
exp
end
itu
re
Standard deviation of GDP
World Scientific News 33 (2016) 43-55
-54-
Government size is shown to have negative impact on economic stability. This means
that the larger the size of government, the less stable the economy would be. It make sense
because when the government gets bigger the more decision need to be made and also the
impact of government policies would be larger. Therefore, the sensitivity of economic
condition to government policies would increase, this means that an economy would become
less stable. Openness positively and significantly increase the standard deviation of GDP with
a coefficient of 1.29. This implies that economic stability and openness move in opposite
direction. Outward oriented economies are more exposed to external shocks and global
economic crisis and this makes them more volatile and more sensitive to changes in world
economy. Finally, inflation is found to also have a negative and significant effect on
economic stability. The implication of this is that increase in price level lead to increase in the
instability of the economy.
4. CONCLUSIONS
The main purpose of this paper is to investigate the relationship between tax revenues
and tax evasion on economic stability. To this end, first, we established an index for tax
evasion in OECD countries. Second, the relationship between income tax and tax evasion is
studied and at last, the relationship between tax evasion and tax revenues with economic
stability is examined.
It is shown that higher income tax rates increase the rate of currency holdings which in
monetary approach manifest the rise in tax evasion. This is in line with the classical view that
higher taxation create an incentive for people to misrepresent their earning in attempt to lower
their tax liabilities. This would be even more problematic when the size of underground
economy and value of tax evasion reach to a considerable level. This might confront the
government with budget deficiency since revenues do not grow proportionate to government
expenditure.
It is also found that higher tax revenues have a positive effect on economic stability and
higher tax evasion has an adverse impact on economic stability. This reveals that countries
with higher level of taxation experience a more stable economy. Therefore, since these
countries have tax based budget system, during periods of recession, governments can
manipulate tax policies such as tax exemptions, tax credits and tax deductions as economic
stimulators in order to compensate the negative effects of recession.
Reference
[1] Afuberoh, Dennis and Okoye Emmanuel, (2014). “The Impact of Taxation on Revenue
Generation in Nigeria: A study of Federal Capital Territory and Selected States”,
International Journal of Public Administration and Management Research, Vol. 2(2),
22-47.
[2] Baltagi, B.H., (2005). Econometrics Analysis of Panel Data. Wiley, Chichester.
[3] Clotfelter, C.T, (1983). Tax evasion and tax rates: An analysis of individual returns, The
review of economics and statistics, 4: 363-373.
World Scientific News 33 (2016) 43-55
-55-
[4] Dalu, T., Maposa, V.G., Pabwaungana, S. and Dalu, T. (2012). „The impact of tax
evasion and avoidance on the economy: a case of Harare, Zimbabwe‟, African J.
Economic and Sustainable Development, 1(3), 284-296.
[5] Feige, E.L, (1979). “How big is the irregular economy?”, Challenge, 22; 5-13.
[6] Friedman, Eric; Simon Johnsen; Daniel Kaufmann and Pablo Zoido-Lobaton (2000).
Dodging the grabbing hand: the determinants of unofficial activity in 69 countries,
Journal of public economics, 76; 459-493.
[7] Ilaboya, O. J and Ofiafoh, E. (2014). Tax Ratio and Output Volatility: Linear Time
Series Evidence from Nigeria, Journal of Business Studies Quarterly, 5; 245-257.
[8] Im, K.S., Pesaran, M.H. and Shin, Y. (1997) Testing for Unit Roots in heterogeneous
Panels. Journal of Economics. 3, 115; 53-74.
[9] Pedroni, P. (1999). Critical Values for Cointegration Tests in Heterogeneous Panels
with Multiple Regressors,” Oxford Buellton Economic Statistics, 61, 653-678.
[10] Pedroni, P. (2004). Panel Cointegration: Asymptotic and finite samples properties of
pooled time series Tests with an application to the PPP hypothesis. Economic Theory
20, 597-625.
[11] Guttmann, P. M. (1977). Subterranean Economy. Financial Analysis Journal, 11(4); 26-
27.
[12] Kemal, M. A (2003). Underground economy and tax evasion in Pakistan: A critical
evaluation, http://www.pide.org.pk/Research/Report184.pdf.
[13] Martinez-Vazquez, J., Vulovic, V., &Lui, Y. (2009). Direct versus indirect taxation:
Trends, theory and economic significance. International Studies Program Working
Paper, 09-11, Georgia State University.
[14] Posch, O. (2009). Explaining output volatility: the case of taxation. http://www.cesifo-
group.de/portal/page/portal/DocBase_Content/WP/WP-CESifo_Working_Papers/wp-
cesifo-2009/wp-cesifo-2009-08/cesifo1_wp2751.pdf
[15] https://data.oecd.org/
( Received 05 December 2015; accepted 17 December 2015 )