Embed Size (px)
Citation preview
THE STUDY OF THE STRIPPING PROPERTIES OF BITUMINOUS
MIXTURES CONTAINING DIFFERENT AGGREGATE TYPES
by
MOHAMED SALAHELDIN HUSSEIN ELHASSAN
17729
Final report submitted in partial fulfilment of
The requirements for the
Bachelor of Engineering (Hons)
(Civil Engineering)
SEPTEMBER 2016
Universiti Teknologi PETRONAS,
32610, Bandar Seri Iskandar,
Perak Darul Ridzuan
II

III
SEPTEMBER 2016
CERTIFICATION OF ORIGINALITY
This is to certify that I am responsible for the work submitted in this project, that the
original work is my own except as specified in the references and acknowledgements,
and that the original work contained herein have not been undertaken or done by
unspecified sources or persons.
________________
MOHAMED SALAHELDIN HUSSEIN
IV
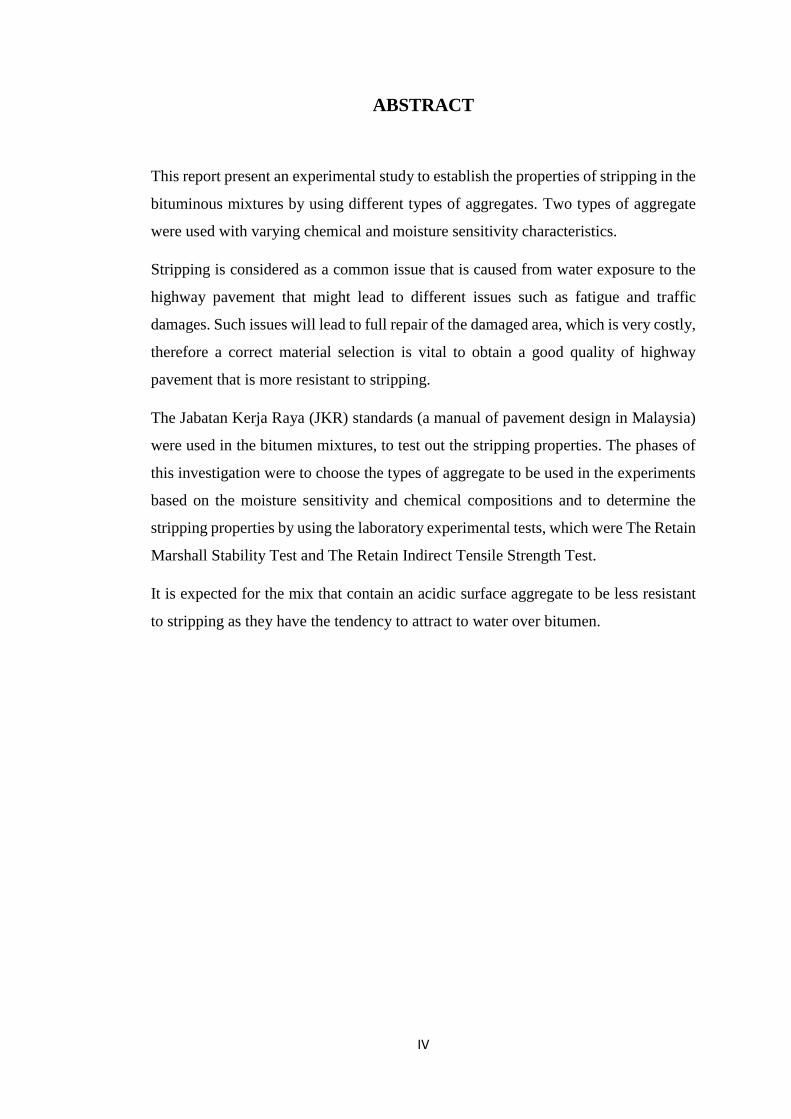
ABSTRACT
This report present an experimental study to establish the properties of stripping in the
bituminous mixtures by using different types of aggregates. Two types of aggregate
were used with varying chemical and moisture sensitivity characteristics.
Stripping is considered as a common issue that is caused from water exposure to the
highway pavement that might lead to different issues such as fatigue and traffic
damages. Such issues will lead to full repair of the damaged area, which is very costly,
therefore a correct material selection is vital to obtain a good quality of highway
pavement that is more resistant to stripping.
The Jabatan Kerja Raya (JKR) standards (a manual of pavement design in Malaysia)
were used in the bitumen mixtures, to test out the stripping properties. The phases of
this investigation were to choose the types of aggregate to be used in the experiments
based on the moisture sensitivity and chemical compositions and to determine the
stripping properties by using the laboratory experimental tests, which were The Retain
Marshall Stability Test and The Retain Indirect Tensile Strength Test.
It is expected for the mix that contain an acidic surface aggregate to be less resistant
to stripping as they have the tendency to attract to water over bitumen.

V
AKNOWLEDGMENT
First and foremost, Alhamdulillah who most merciful and most gracious by giving me
the opportunities and strength in pursuance of knowledge and grant me a good health
and wealth. I would like to express my deep gratitude to my supervisor Ass.
Prof. Dr Ibrahim Kamaruddin for his supervision, incessant advice, guidance
invaluable help and patience during the course of this research. I am deeply
indebted to my supervisor whose help and guide, stimulating suggestion and
monitoring my project for the whole two semesters. His knowledge and idea have been
great value for me and has had remarkable influence on my entire project.
I also want to thank Mr. Nura Bala, Postgraduate student who has provided guidance
and shared information regarding the project. I am also grateful that the university and
UTP's Civil Engineering Department has provided a comfort and good amenity for the
project to be completed. Recognition is also due to all of the laboratory
technicians, Mr Azran and Mr Iskandar who patiently provided assistances on the
experimental portion of this study and who provided assistance, valuable discussion
and cooperation on the experimental work of this research.
Ultimately, I wish to express special thanks and appreciation to my parents for their
support and love. Finally, I would like to thank everybody who had helped me
directly and indirectly towards the accomplishments of this study.
VI
Table of Contents
Chapter 1 1
Introduction 1
1.1 Background of the study 1
1.2 Problem Statement 2
1.3 Objective 2
1.4 Scope of Study 3
Chapter 2 4
Literature Review 4
2.1. Stripping Properties 4
2.2 Aggregate Gradation 5
2.3 Aggregate Properties 5
2.3.1 Porosity and Pore Size 6
2.3.2 Surface Chemistry 6
2.3.3 Physical Properties of Limestone 7
2.3.4 Physical Properties of Granite 8
2.4 Water Properties 8
2.4.1 Wetting and Adsorption 9
2.5 Traffic Effects: 10
2.6 Mechanisms of Stripping Process 10
2.7 Moisture Sensitivity Test Methods 11
Chapter 3 13
Methodology 13
3.1 Introduction: 13
3.2 Experiment Materials 15
3.2.1 Limestone 15
3.2.2 Granite 16
3.2.3 Bitumen 17
3.3 Experimentation Testing 17
3.3.1 Sieve Analysis 17
3.3.2 Specific Gravity and Water Absorption Test 18
3.3.3 Aggregate Impact Value Test 18
3.3.4 Los Angeles Abrasion Test 19
3.3.5 Aggregate Stripping Value Test 19
VII
3.3.6 Retain Marshall Stability Test 20
3.3.7 Retain Indirect Tensile Strength Test 20
3.4 Gantt Chart 22
Chapter4 23
Results & Discussion 23
4.1 Sieve Analysis 23
4.2 Aggregate Stripping Value Test 24
4.3 Specific Gravity and Water Absorption 25
4.4 Aggregate Impact Value 26
4.5 Los Angeles Abrasion Test 27
4.6 Marshall Stability 28
4.6.1 Density and Bitumen Content 29
4.6.2 Porosity and Bitumen Content 30
4.6.3 Flow and Bitumen Content 31
4.6.4 Stability and Bitumen Content 32
4.7 Retained Marshall Stability 32
4.8 Indirect Tensile Strength Ratio Test 34
4.9 Aggregate Type Effect in Stripping 35
Chapter 5 37
Conclusion 37
5.1 Stripping Preventive Measures 37
Chapter 6 39
References 39
VIII
List of Tables
Table 1: Gradation foe Asphaltic Concrete (JKR Standard, 2008) ............................................ 5
Table 2.1: Mineral Types and Their Relation to Stripping (Bagampadde, U. ON
INVESTIGATION OF STRIPPING PROPENSITY OF BITUMINOUS MIXTURES (PhD). KTH Royal)
Institute of Technology.) .......................................................................................................... 7
Table 2.2: Mechanisms of Stripping at the Bitumen-Aggregate Interface ............................ 15
Table 3: Composition of Limestone ....................................................................................... 15
Table 4: Composition of Granite ............................................................................................ 16
Table 5: Gantt chart FYP I ....................................................................................................... 22
Table 5.1: Gantt chart FYP II................................................................................................... 22
Table 6: Sieve Analysis ........................................................................................................... 23
Table 7: Specific Gravity & Water Absorption Results ........................................................... 25
Table 8: Aggregate impact value specification ...................................................................... 26
Table 9: Aggregate impact value for Granite ......................................................................... 26
Table 10: Aggregate impact value for Limestone .................................................................. 26
Table 11: Los Angeles Abarsion Result for Granite ................................................................ 27
Table 12: Los Angeles Abarsion Result for Limestone ........................................................... 27
Table 13: Optimum Bitumen Content .................................................................................... 28
Table 14: Retained Marshall Stability Load Results ............................................................... 32
Table 15: Retained Marshall Stability Deformation Results .................................................. 33
Table 16: Indirect tensile test Results .................................................................................... 34
IX
List of Figures
Figure 1: (a) Heteroatom Containing Bitumen Parts move towards the Aggregate sites (b)
Bitumen Adsorbed onto Aggregate (c) Stripping due to Water at the Interface .................... 1
Figure 2: Flow chart of the research steps ............................................................................. 14
Figure 3: Limestone ................................................................................................................ 15
Figure 4: Granite .................................................................................................................... 16
Figure 5: Bitumen ................................................................................................................... 17
Figure 6: Stress Field in the Indirect Tensile Strength Test (Kennedy, 1977) ........................ 21
Figure 7: Gradation Graph ..................................................................................................... 23
Figure 8: Limestone stripping value ....................................................................................... 24
Figure 9: Granite stripping value ............................................................................................ 24
Figure 10: Density vs Bitumen Content Graph ...................................................................... 29
Figure 11: Porosity vs Bitumen Content Graph ..................................................................... 30
Figure 12: Flow vs Bitumen Content Graph ........................................................................... 31
Figure 13: Stability vs Bitumen Content Graph ...................................................................... 32
Figure 14: Comparison of Retained Marshall Load ................................................................ 33
Figure 15: Comparison of Retained Marshall Deformation ................................................... 33
Figure 16: Inirect Tensile Strength Ratio …………………………………………………………………………. 35
1
Chapter 1
Introduction
1.1 Background of the study
Recently, due to the moisture damage that appears in the form of stripping, it is
detected that there is a need to replace a lot of the roadways around the world. Loss of
adhesion is caused by stripping at the bitumen and aggregate interface due to actions
caused by water (Fromm, 1974; Kiggundu et al., 1988; Taylor et al., 1983; Kandhal et
al., 1989). The strength is compromised as the mixture ceases to act as a coherent
structural unit. Loss of adhesion also renders cohesive resistance of the interstitial
bitumen body useless (Kiggundu, 1988). Water may find it is way in the interface
through diffusion across bitumen layers, and when that happens, the water affect the
aggregate-bitumen bond which causes the bitumen to strip off from the aggregate
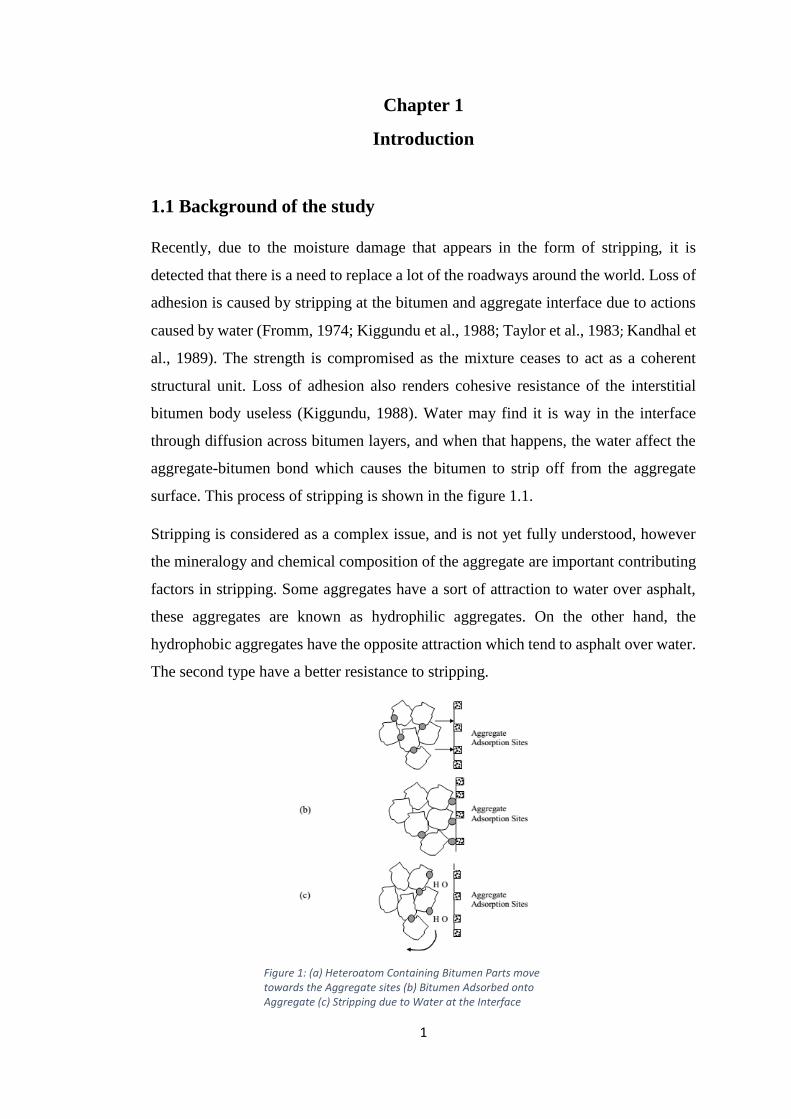
surface. This process of stripping is shown in the figure 1.1.
Stripping is considered as a complex issue, and is not yet fully understood, however
the mineralogy and chemical composition of the aggregate are important contributing
factors in stripping. Some aggregates have a sort of attraction to water over asphalt,
these aggregates are known as hydrophilic aggregates. On the other hand, the
hydrophobic aggregates have the opposite attraction which tend to asphalt over water.
The second type have a better resistance to stripping.
Figure 1: (a) Heteroatom Containing Bitumen Parts move towards the Aggregate sites (b) Bitumen Adsorbed onto Aggregate (c) Stripping due to Water at the Interface
2
In this study we are going to study the behavior of stripping when using 2 different
types of aggregate, based on their resistance to stripping and moisture sensitivity.
1.2 Problem Statement
Aggregate and bitumen form a mixture which is asphalt concrete pavement. The
Moisture damage to asphalt concrete pavement can occur in the form of stripping, it
is considered as a common problem that can lead to expensive repair of the highway
pavements. Further issues such as fatigue could appear due stripping which will lead
to traffic issues and car crashing injuries. That is why a study is needed to show us
how is the difference in aggregate types used in asphalt concrete pavement can give
us more resistance to stripping.
As it is stated before the stripping appear due the loss of bond between aggregates and
asphalt binder, therefore it is important to understand the characteristics and the
properties of stripping, and to know which type of stone aggregate adhere the best to
bituminous binder and result in a minimum form of stripping. This understanding will
help us to know water sensitive mixtures, which we need to avoid in order to pave way
to enhanced road performance.
1.3 Objective
The main objective is to study the stripping properties of bituminous mixtures
containing different aggregate types. Specifically the study is aiming to achieve the
following objectives:
a) Study the effect of composition of aggregate on moisture sensitivity of
bituminous mixtures.
b) Determining the stripping properties of 2 different aggregate types by using
the laboratory experimental tests.
3
1.4 Scope of Study
This study will give us a prediction of the best mix that can be used to avoid stripping,
and how the aggregate chemical properties can be related to the interface of the
bitumen-aggregate bond.
The first phase of this project will begin with the determination of the aggregates and
bitumen properties. Then the aggregate will be selected by using the typical
sampling method and gradation values of the aggregate according to the JKR
(Jabatan Kerja Raya) Standards for the specification of Road Works Flexible
Pavement, and this will help us to determine their degree of resistance to stripping, In
addition to that, the bitumen of Penetration Grade 80-100 will be prepared as well
according to the JKR specifications.
After selection of materials, number of laboratory tests will be conducted to the
limestone and granite in order to determine their physical and mechanical properties
in accordance with the BS and ASTM standards. Tests such as:
Specific Gravity and Water Absorption
Aggregate Impact Value
Los Angeles Abrasion Test
Flakiness and Elongation Index
In addition to that, some tests will be done to check the properties of bitumen following
the standards of JKR, such as:
Ductility Test
Specific Gravity
Softening Point Test
Marshall Mix Design
The main lab tests to determine the stripping properties of the bituminous mixtures
containing limestone and granite will be, Marshall Stability Test and Indirect Tensile
Strength Test.
4
Chapter 2
Literature Review
2.1. Stripping Properties
Stripping occurs when there is a breakdown of the adhesive bond that connect the
bitumen with the aggregate. This usually happens when the bitumen–aggregate bond
is weakened. Water contacts the aggregate surface and displaces the bitumen coating.
Therefore the important aspects of the stripping are bitumen–aggregate adhesion, the
susceptibility to water of the bitumen–aggregate bond, and the loss of binder and/or
mastic in the asphalt.
There are 4 principal means of asphalt binder-aggregate adhesion:
Mechanical: A mechanical lock is created when the asphalt binder gets into the pores
and loopholes of the aggregate and hardens. Susceptibility to stripping is increased
when moisture on the aggregate interfere with asphalt binder penetration into the
aggregate and reduce the mechanical lock.
Chemical: A chemical reaction between the asphalt binder and aggregate surface
occurs causing chemical adhesion. This weaker reaction may not be strong enough to
counter other moisture damage factors.
Adhesion tension: The tension between the asphalt binder and aggregate at the wetting
line (as a drop spreads over a surface, the edge of the drop is the “wetting line”) is
generally less than the tension between water and aggregate.
Molecular orientation: When in contact with aggregate, asphalt molecules tend to
orient themselves in relation to the ions on the aggregate surface essentially creating
a weak attraction between the asphalt binder and aggregate surface.
All of these principles are further explained through this research.
5
2.2 Aggregate Gradation
The particle gradation or size distribution, of an aggregate is considered to be the most
significant aggregate characteristics because it will help to show how it will act as a
pavement material. In HMA, gradation supports determining almost every important
property including, stability, workability, permeability, durability, stiffness, frictional
resistance, moisture susceptibility and fatigue resistance (Roberts et al., 1996[1]).
Because of this, gradation is a main apprehension in HMA mix design and that is why
most organisations require suitable aggregate gradations.
In this project, JKR Standards of Road Works Flexible Pavement is to be used to select
the gradation of the aggregate as below:
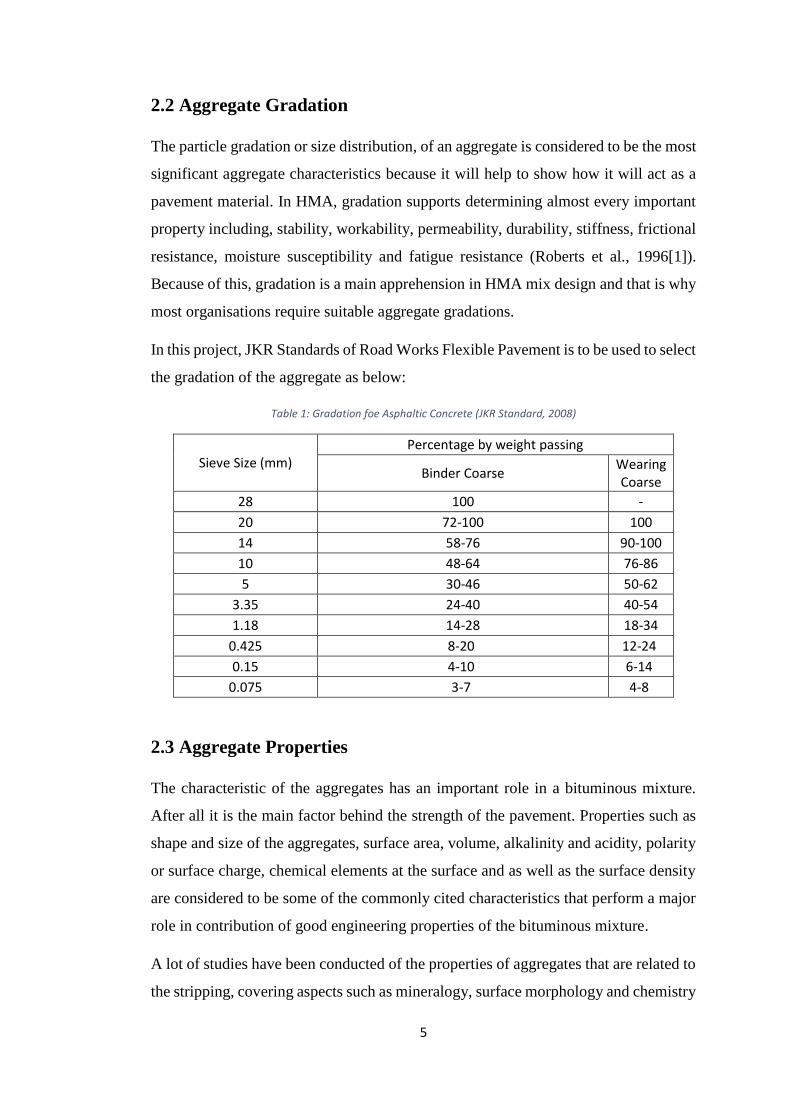
Table 1: Gradation foe Asphaltic Concrete (JKR Standard, 2008)
Sieve Size (mm) Percentage by weight passing
Binder Coarse Wearing Coarse
28 100 -
20 72-100 100
14 58-76 90-100
10 48-64 76-86
5 30-46 50-62
3.35 24-40 40-54
1.18 14-28 18-34
0.425 8-20. 12-24.
0.15 4-10. 6-14.
0.075 3-7. 4-8.
2.3 Aggregate Properties
The characteristic of the aggregates has an important role in a bituminous mixture.
After all it is the main factor behind the strength of the pavement. Properties such as
shape and size of the aggregates, surface area, volume, alkalinity and acidity, polarity
or surface charge, chemical elements at the surface and as well as the surface density
are considered to be some of the commonly cited characteristics that perform a major
role in contribution of good engineering properties of the bituminous mixture.
A lot of studies have been conducted of the properties of aggregates that are related to
the stripping, covering aspects such as mineralogy, surface morphology and chemistry
6
(Kiggundu, 1986; Dukatz, 1989, Kandhal, 1998). The stated properties have a major
effect on the surface energy and chemical reactivity, hence the positions of ponding
locations. However, generally aggregates that are hydrophilic (attract water) are
expected to strip over aggregates that are hydrophobic (repulse water). The main
factors that determine the aggregate is either hydrophobic or hydrophilic are, (a)
Porosity and pore size, (b) Surface chemistry.
As the scope of study for this research is being constricted to aggregate that is widely
used in the local country, only granite and limestone will be take into consideration.
2.3.1 Porosity and Pore Size
Pore size of the aggregate is a critical aspect, as large pore size might lead to the entry
of asphalt binder, which may be a contributor to moisture vulnerability. High
absorption will occur due to high porosity, meaning that more asphalt binder must be
used to reach the anticipated effective asphalt binder content. On the contrary, if high
porosity is not considered, for a given amount of asphalt binder, more will be absorbed
and less will be obtainable to create the asphalt binder film around aggregate particles
producing stripping and faster aging.
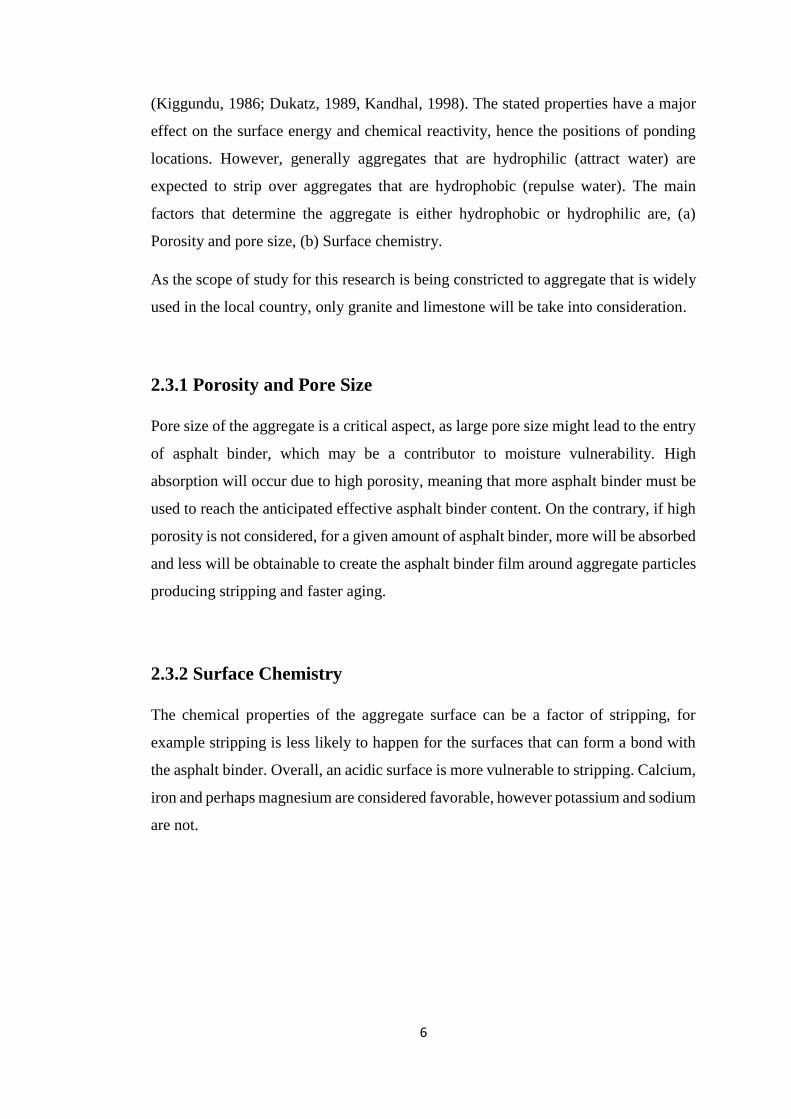
2.3.2 Surface Chemistry
The chemical properties of the aggregate surface can be a factor of stripping, for
example stripping is less likely to happen for the surfaces that can form a bond with
the asphalt binder. Overall, an acidic surface is more vulnerable to stripping. Calcium,
iron and perhaps magnesium are considered favorable, however potassium and sodium
are not.
7
Table 2.1: Mineral Types and Their Relation to Stripping (Bagampadde, U. ON INVESTIGATION OF STRIPPING PROPENSITY OF BITUMINOUS MIXTURES (PhD). KTH Royal Institute of Technology.)
2.3.3 Physical Properties of Limestone
The limestone colour can vary from shades of grey and tan. Due to the carbonaceous
impurities, the limestone is appearing to be greyish, while the presence of iron caused
the existence of the tan. Depending on the formation, limestone can take on a
number of different structural shapes, including clastic, crystalline, massive or
granular. They will re-crystallize as marble when undergo a process of
metamorphism. This is due to the reaction of calcium carbonate and hydrochloric acid
to produce bubbles. Limestone will have relatively flat surfaces.
8
In general, limestone is defined as a soft rock that it is surface can be easily scratched
and fine-grained. According to Moh’s scale, the hardness of limestone vary within
the ranges from 3 to 4 with dolomitic lime being marginally harder when it is
compared to the high calcium diversities. Compared to chalk limestone has the
higher compressive strength (Blyth, 2002).
Due to the change in the porosity, the density of the limestone varies from the
ranges of 2.5 to 2.7 kg/cubic meter. The specific gravities of the limestone
varies from the range of 2.65-2.75 for high calcium and 2.75-2.9 for the
dolomitic limestone. The compressive strength of the limestone is between the range
of 1.8-2.1 kg/cubic meter.
2.3.4 Physical Properties of Granite
Granite is an acidic crystalline and igneous rock with a relative density of 2.65-
2.75 kg/cubic meter. The hardness of the granite vary accordingly to the composition
and as well as with the proportion and type of feldspar present in the granite
Due to the development of slow and complete crystallization of the molten magma,
the permeability and porosity of granite are typically low. The porosity of granite is
consistently low with the values only on the order of 0.1 to 1.2 percent being
characteristics. The compressive strength of the granite is between the ranges of 140
to 210 N/mm². Even though weathered rocks are usually much more permeable. As a
crystalline, granite has low permeability when fresh.
2.4 Water Properties
Stripping is a form of adhesion. Adhesion affects capillarity while cohesion affects the
surface tension. Water displays the hydrogen bonds that marks its cohesive and
adhesive characteristics. As most surfaces in the aggregates have electrostatics
charges, water molecules will be more attached to them than bitumen polars in order
to satisfy unstable surface charges. The pH of contact water is one of the factors that
affects adhesion, which changes with temperature (Covington et al., 1977). The
wetting properties of bitumen are affected by the pH as it is responsible in the shift in
9
angle of contact. At pH values that are up to 9 the interfacial tension is considered to
be the highest, while it drops with increase of pH to 14 (Kiggundu et al., 1986). The
effect of water at the interface is dependent on the aggregate type.
2.4.1 Wetting and Adsorption
The stripping potential of a bituminous mixture is determined by the proper wetting
and adsorption of bitumen onto aggregate. Hot bitumen spreads on an aggregate
depending on the contact angle θ. The attraction forces between aggregate and bitumen
direct the wetting. The wetting phenomena was offered by Thomas Young in 1805, by
relating the surface tension (γ) to contact angle for non-deformable, insoluble
homogenous and smooth solids. Wenzel Improved Young’s work as he studied
equilibrium on rough surfaces culminating in following equation 2.1 (Asthana et al.,
2000).
…………… (2.1)
Where S= solid, L= liquid, V=vapor and r is the ratio of true ridged area to the apparent
flat area and θw is Wenzel contact angle. Work of adhesion is used to determine the
wetting, by using Dupre formula that was developed in 1869, which is given in
equation 2.2
……………. (2.2)
Low Wa shows that there is a good tendency for the bitumen to wet the aggregate
(Taylor et al., 1952, Cheng et al., 2002).
If we considered a system that is made of bitumen (a), infinitesimal interface (s) and
aggregate (b). Once the aggregate is coated by bitumen, both are considered to be in
equilibrium and the total free energy of the system is given thru F = Fa + Fb + Fs.
However if any small change took place in the pressure (p), temperature (T),
composition of the material ni, the system energy change to dF = dFa + dFb + dFs
(Majidzadeh et al., 1968).
10
Lytton, (2002) displays that interfacial surface free energy (SFE) is divided into an
acid-base and an apolar component. London dispersion forces, Keesom orientation
forces and Debye induction forces are considered to be as a sub-division of the apolar
part.
……………… (2.3)
Where total SFE (ΓTotal) is linked with acid (Γ-) and apolar (ΓLW) – base (Γ+) and if
these values are compared with the ones of bitumen under investigation, there is a
possibility to tell if the bitumen has low or high stripping vulnerability.
2.5 Traffic Effects:
While service of the road, there is a constant contact between the pavement and the
vehicle wheel, this interaction will increase the pore water pressure in the void pocket
of the mixture. The thin bitumen films can be broken due to the traffic stresses,
especially nearby sharp aggregate corners, which will create a path for moistures to
enter the interface. Stripping that occur around the outer traffic lanes support the
theory of traffic effect (Kandhal, 1992).
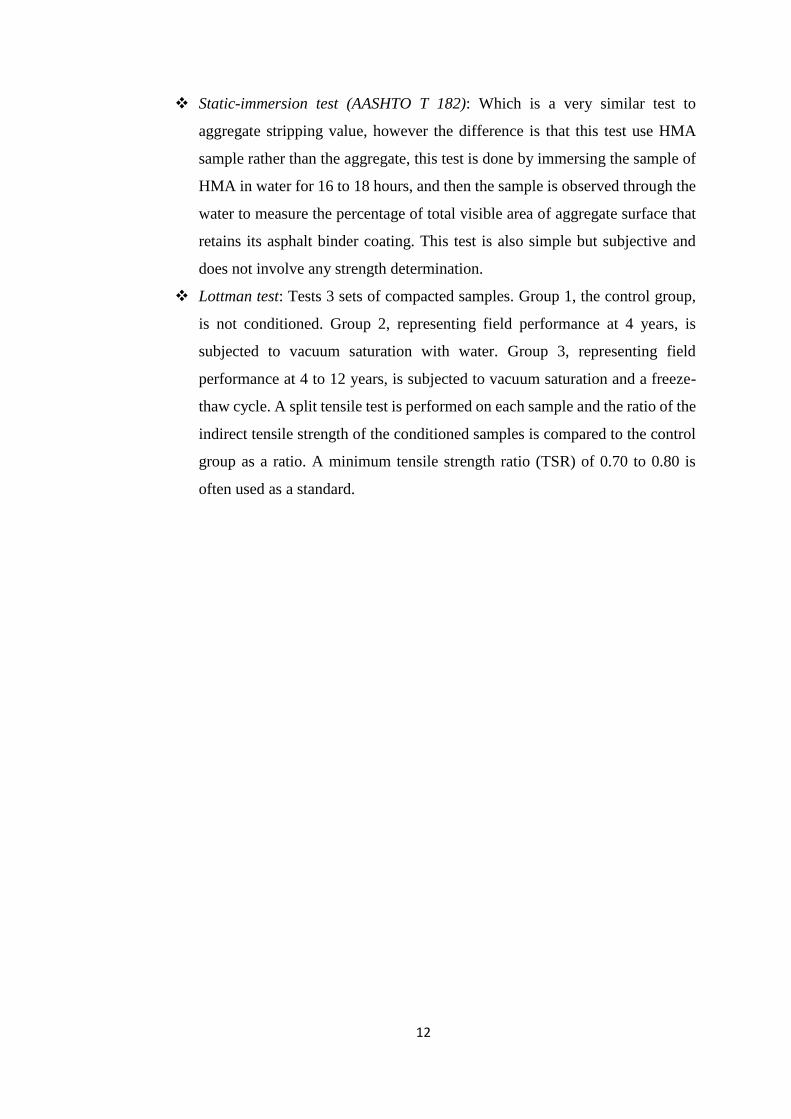
2.6 Mechanisms of Stripping Process
Even though stripping is a complex issue that is not fully understood, numerous
mechanisms have been proposed to further clarify its occurrence, in all the
mechanisms, there has to be initiation and progression of stripping (Mcglashan et al.,
1984; Tarrer et al., 1991). According to Graf, (1986) stripping begins usually at the
bottom bituminous layer, where the moisture content is high and works its way up. An
analysis of few of the formulated mechanisms is given in Table 2.2.
11
Table 2.2: Mechanisms of Stripping at the Bitumen-Aggregate Interface
Process Mechanism References
Detachment Water with higher dipole moment and lower surface energy detaches
it from the aggregate surface
(Fromm, 1974; Terrel et al., 1989; Mcgennis
et al., 1995)
Pore Pressure
a bitumen film is broken due to the high pore water pressure in
undrained conditions, allowing water to enter the interface
(Hallberg, 1950; Taylor et al., 1983; Kiggundu, 1988; Kandhal, 1994)
Displacement Water with higher dipole moment and lower surface energy displaces
it from the aggregate surface
(Fromm, 1974; Mcglashan, 1984; Terrel et al., 1989;
Mcgennis et al., 1995)
Chemical dis-bonding
electrostatic and chemical interaction between water and
some aggregates favour removal of bitumen from them
(Scott, 1978; Edwards et al., 2000)
2.7 Moisture Sensitivity Test Methods
Generally, moisture sensitivity tests do not measure individual factors but fairly
attempt to measure the HMA (Hot Mix Asphalt) mixture’s capability to resist stripping
or the moisture damage, no matter what the source is. They are characteristically
capable of providing gross results or comparative results and are not able to predict
the degree of stripping exactly. However, due to the limitation of time, only three main
tests will be performed, which are aggregate stripping value test, Marshall stability
test and indirect tensile ratio test, a brief description of the other major tests for
moisture sensitivity follows:
Boiling test (ASTM D 3625): Add loose HMA to boiling water and measure
the percentage of total visible area of aggregate surface that retains its asphalt
binder coating. The test is simple but is subjective, does not involve any
strength determination and examining the fine aggregate is difficult.
Hamburg wheel-tracking device: Compacted HMA samples are tested
underwater. Results give a relative indication of moisture susceptibility.
12
Static-immersion test (AASHTO T 182): Which is a very similar test to
aggregate stripping value, however the difference is that this test use HMA
sample rather than the aggregate, this test is done by immersing the sample of
HMA in water for 16 to 18 hours, and then the sample is observed through the
water to measure the percentage of total visible area of aggregate surface that
retains its asphalt binder coating. This test is also simple but subjective and
does not involve any strength determination.
Lottman test: Tests 3 sets of compacted samples. Group 1, the control group,
is not conditioned. Group 2, representing field performance at 4 years, is
subjected to vacuum saturation with water. Group 3, representing field
performance at 4 to 12 years, is subjected to vacuum saturation and a freeze-
thaw cycle. A split tensile test is performed on each sample and the ratio of the
indirect tensile strength of the conditioned samples is compared to the control
group as a ratio. A minimum tensile strength ratio (TSR) of 0.70 to 0.80 is
often used as a standard.
13
Chapter 3
Methodology
3.1 Introduction:
The main objective of this research is to study the stripping properties of bituminous
mixtures with different aggregate types, based in all of the information shared in the
literature review, the two aggregate types that will be used for this study are Granite
and Limestone, as they have different chemical characteristics, so they will give us a
wider idea on the stripping properties. Another reason to choose these types of
aggregate is because they are the most used aggregates in Malaysia.
Stripping properties for the bituminous mixtures using the two types of aggregates are
to be determined by using the laboratory experimental tests, the first test was The
Retain Marshall Stability Test. The second test is The Retain Indirect Tensile Strength
Test.
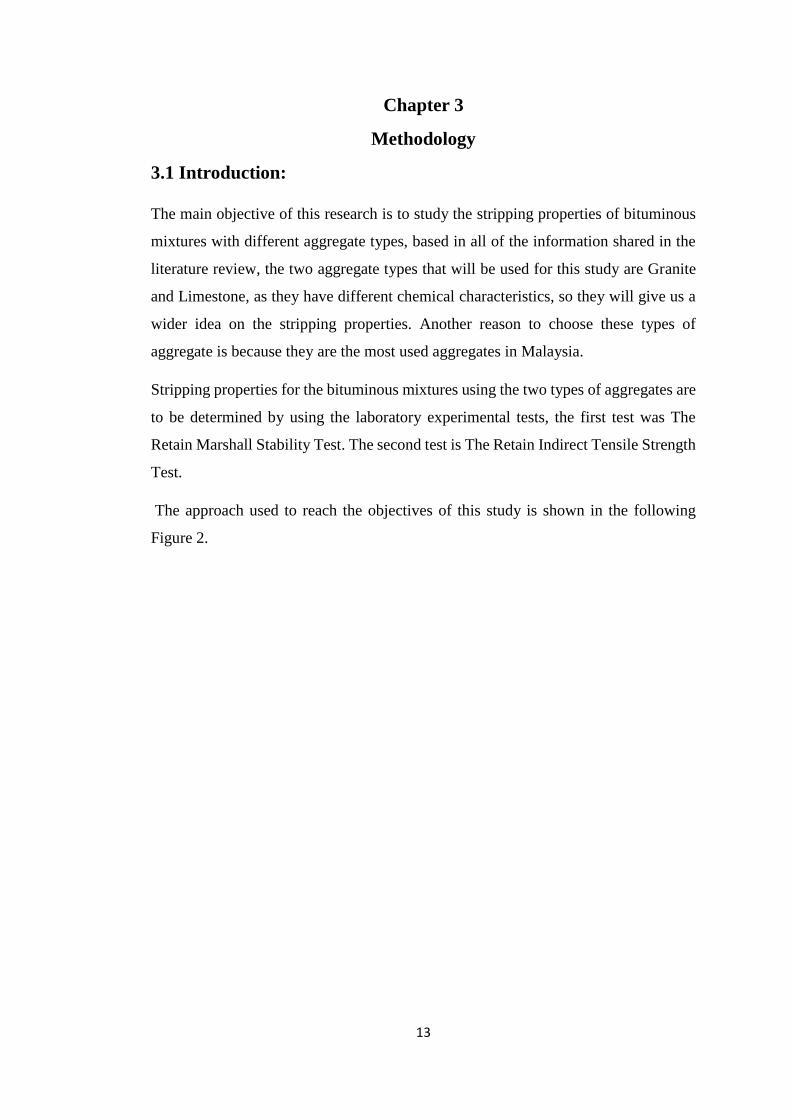
The approach used to reach the objectives of this study is shown in the following
Figure 2.
14
Figure 2: Flow chart of the research steps
15
3.2 Experiment Materials
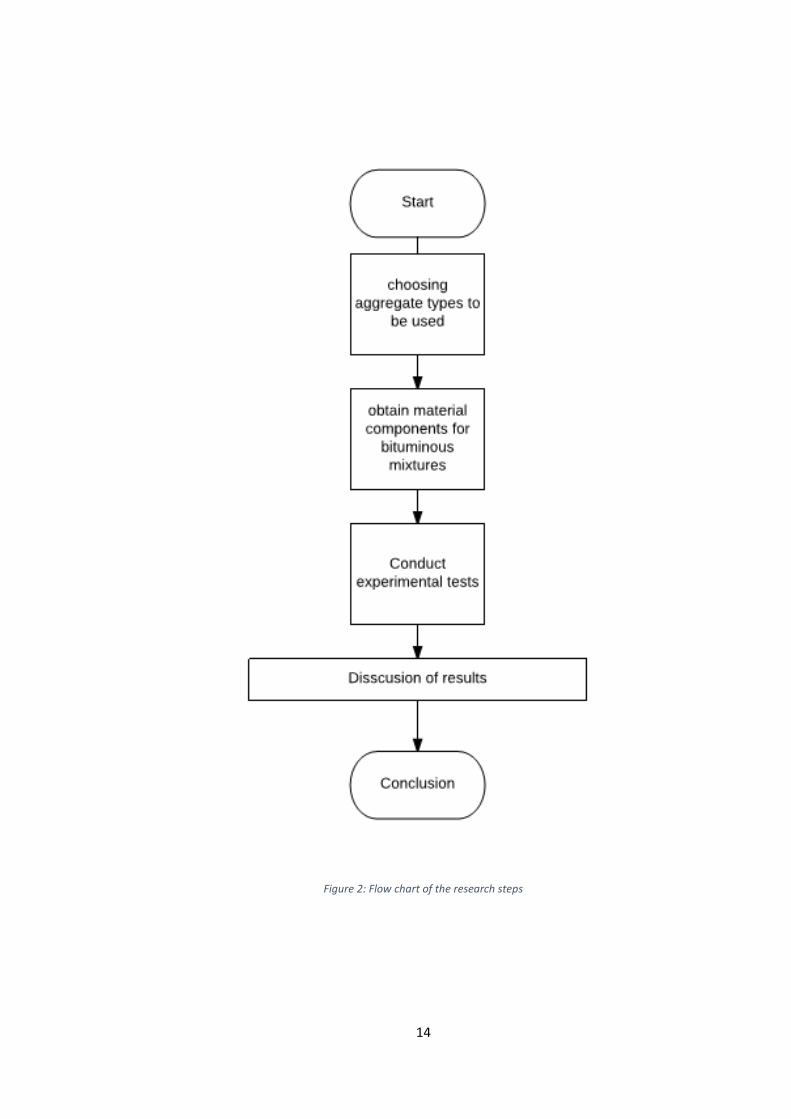
3.2.1 Limestone
Limestone is a sedimentary rock. The two major chemical components of Limestone
are magnesium carbonate and calcium, the other chemical components are shown in
the following Table 2.
Table 3: Composition of Limestone
Figure 3: Limestone
16
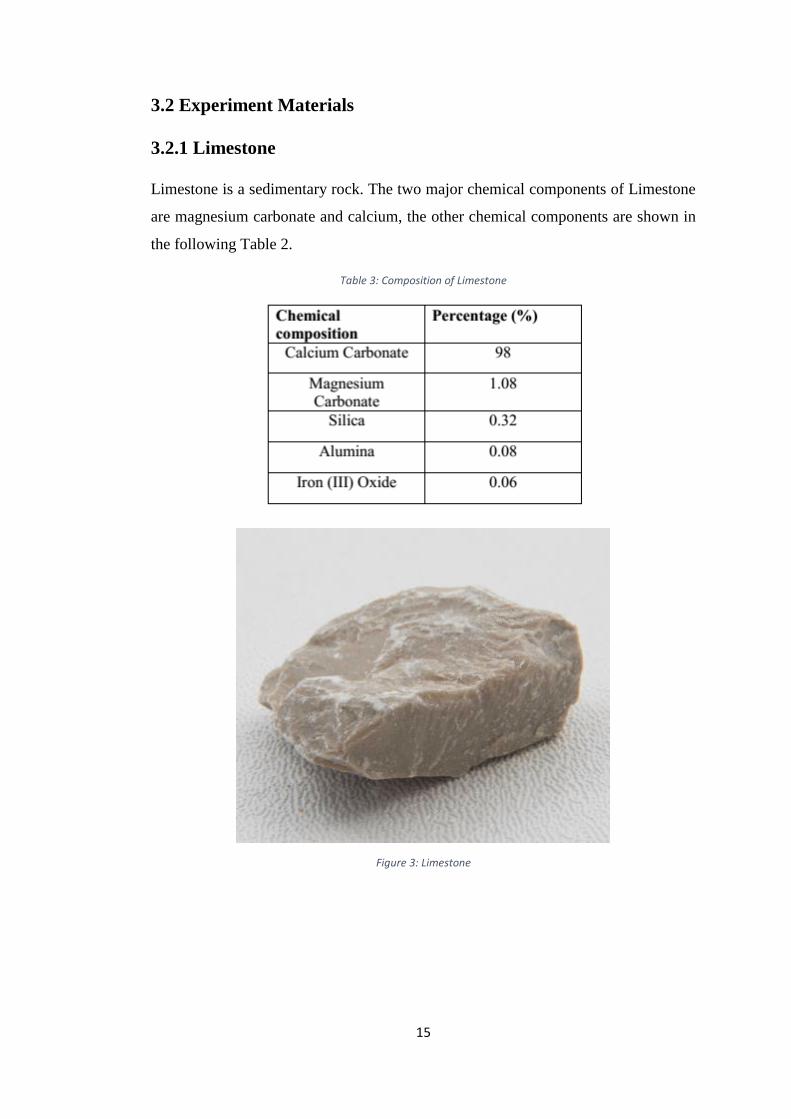
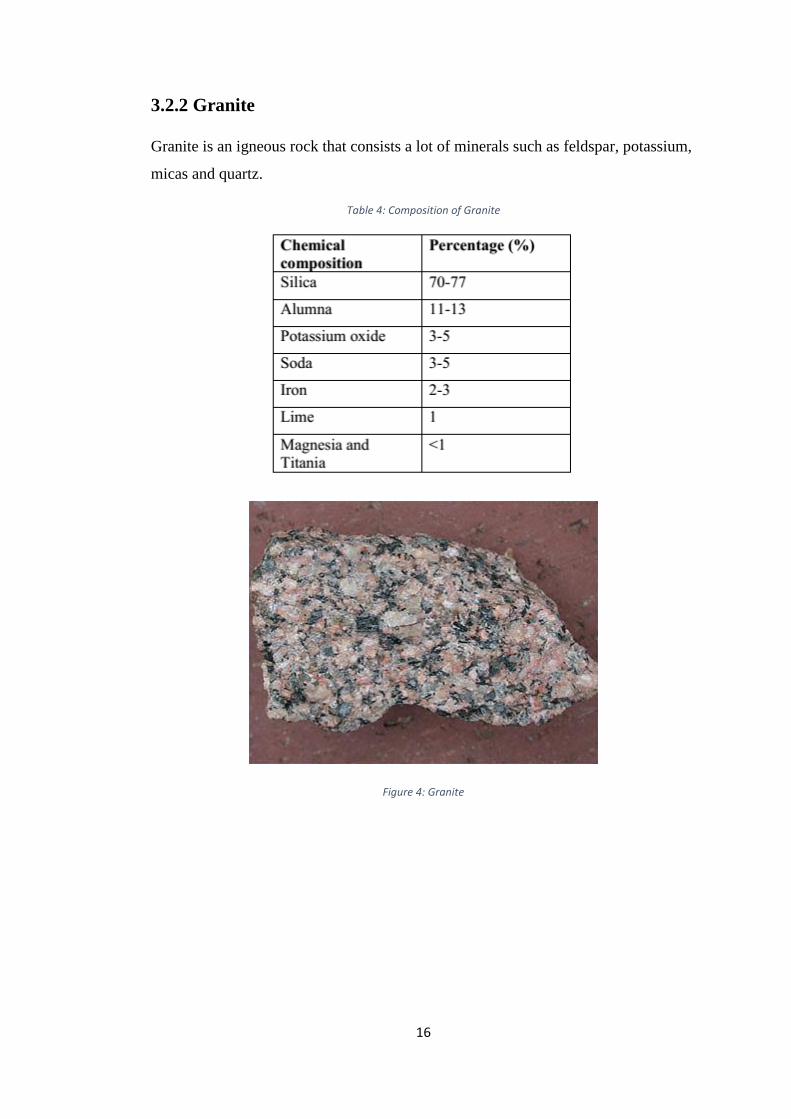
3.2.2 Granite
Granite is an igneous rock that consists a lot of minerals such as feldspar, potassium,
micas and quartz.
Table 4: Composition of Granite
Figure 4: Granite
17
3.2.3 Bitumen
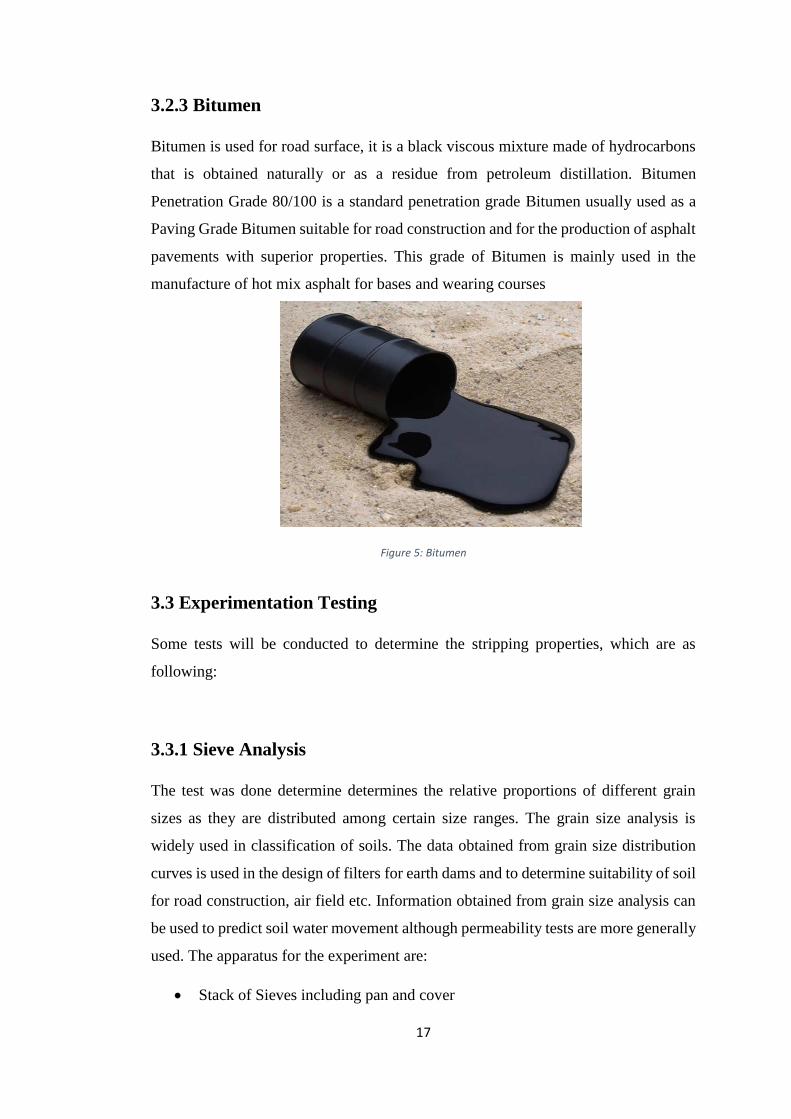
Bitumen is used for road surface, it is a black viscous mixture made of hydrocarbons
that is obtained naturally or as a residue from petroleum distillation. Bitumen
Penetration Grade 80/100 is a standard penetration grade Bitumen usually used as a
Paving Grade Bitumen suitable for road construction and for the production of asphalt
pavements with superior properties. This grade of Bitumen is mainly used in the
manufacture of hot mix asphalt for bases and wearing courses
3.3 Experimentation Testing
Some tests will be conducted to determine the stripping properties, which are as
following:
3.3.1 Sieve Analysis
The test was done determine determines the relative proportions of different grain
sizes as they are distributed among certain size ranges. The grain size analysis is
widely used in classification of soils. The data obtained from grain size distribution
curves is used in the design of filters for earth dams and to determine suitability of soil
for road construction, air field etc. Information obtained from grain size analysis can
be used to predict soil water movement although permeability tests are more generally
used. The apparatus for the experiment are:
Stack of Sieves including pan and cover
Figure 5: Bitumen
18
Rifle Box
Mechanical sieve shaker
Oven
3.3.2 Specific Gravity and Water Absorption Test
The specific gravity of an aggregate is considered to be a measure of strength or quality
of the material. The specific gravity test helps in the identification of stone.
Water absorption gives an idea of strength of aggregate. Aggregates having more
water absorption are more porous in nature and are generally considered unsuitable
unless they are found to be acceptable based on strength, impact and hardness tests.
The test will be carried out according to ASTM designation: C 127-88.
Several method of obtaining the particle density of the aggregates are
specified which include the measurements of the mass of the sample in air
and in water. Particle density of also known as specific gravity can be defined on
an oven-dried basis, on saturated surface-dry basis or as an apparent particle
density. The oven dried is the most commonly used for road engineering
construction.
The amount of water absorption is normally measured at the same time as the
particle density. The value can be obtained through the difference in mass of before
and after drying the sample at 105± 5ºC for 24 hours.
3.3.3 Aggregate Impact Value Test
Toughness is the property of a material to easiest impact. Due to movie ng loads the
aggregates are subjected to pounding action or impact and there is possibility of stones
breaking into smaller pieces. Therefore a test designed to evaluate the toughness of
stones i.e. the resistance of the stones to fracture under repeated impacts may be called
Impact test on aggregates. The test can also be carried on cylindrical stone specimen
known as Page Impact test. The aggregate Impact test has been standardized by Indian
Standard Institution. The aggregate impact test is conducted as per IS-2386 Part IV.
19
The aggregate Impact value indicates a relative measure of resistance of aggregate to
a sudden shock or an impact, which in some aggregates differs from its resistance to a
slope compressive load in crushing test.
3.3.4 Los Angeles Abrasion Test
In the experiment, the standard L.A abrasion test subjects a coarse aggregates sample
to abrasion, impact and grinding which occur in a rotation steel drum containing
specified number of steel spheres. The percentage wear of the aggregates due to
rubbing with the steel balls will be determined and also known as Los Angeles
Abrasion Value.
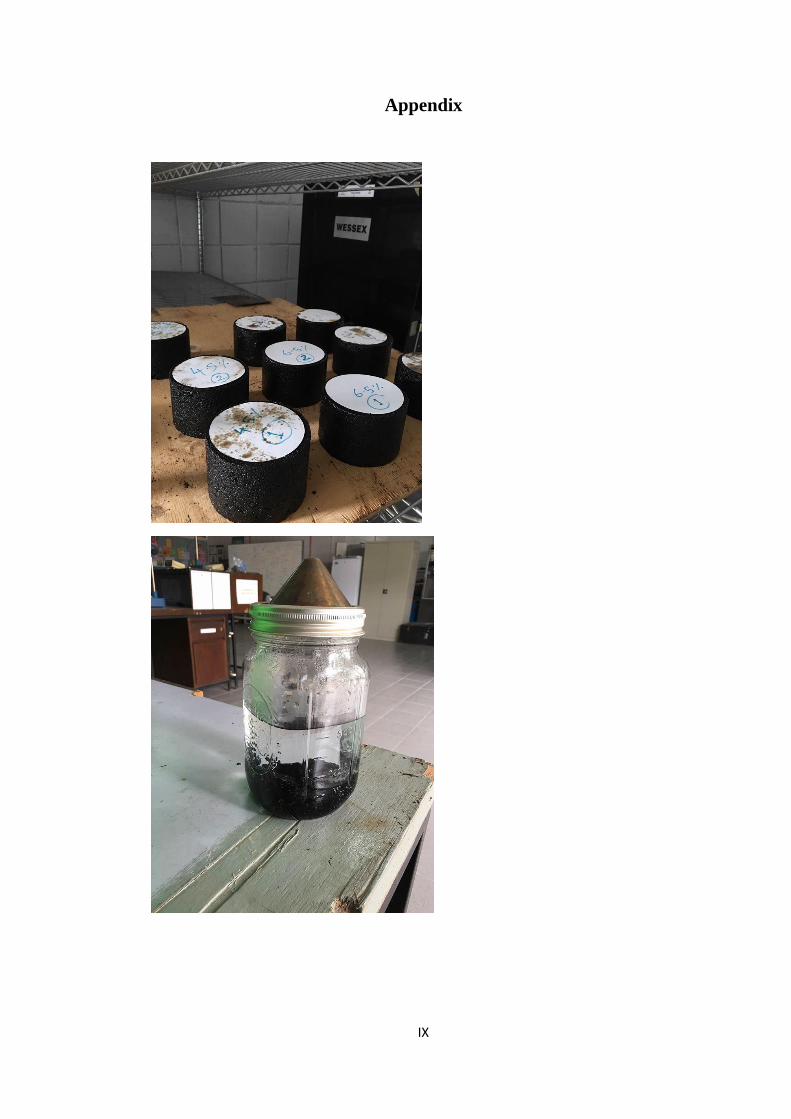
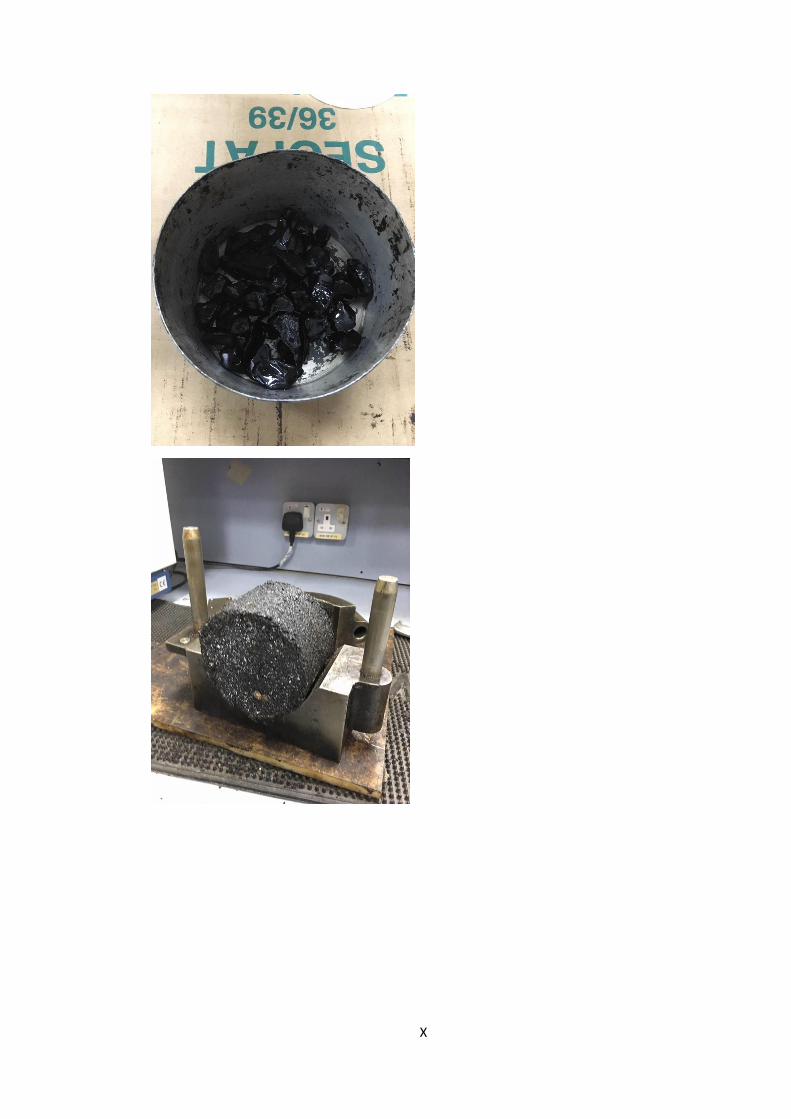
3.3.5 Aggregate Stripping Value Test
Bitumen and tar adhere well to all normal types of aggregates provided they are dry
and are not exceptionally dusty. This problem of stripping is experienced only with
bituminous mixtures, which are permeable to water. This test gives us a determination
of the stripping value of aggregates by static immersion method, when bitumen and
tar binders are used.
200 g of clean and dry aggregate were used after passing 20 mm IS sieve and retaining
on 12.5 mm sieve, then they are heated up to 150°C to be mixed with bitumen.
Bitumen binder amounting to five percent by weight of aggregate is heated to 160°C.
Both the aggregate and the bitumen are well mixed until the aggregates are fully coated
with the bitumen, and after letting the aggregate rest in room temperature for about 2
hours, the aggregate are immersed with distilled water inside a 500 mm beaker, and
left inside a 40o C water bath for 24 hours. Finally a percentage of the stripping value
can be taken visually.
Some types of aggregates have a lesser affinity with bitumen in comparison with water
and hence stripping value of the bituminous binder is done when the mix is immersed
in water. The problem of stripping in coated aggregate is not so amenable to theoretical
treatment. Thus an adhesion test such as the simple stripping test would be suitable to
assess whether the binder would adhere to the aggregate when immersed in water.
20
Several anti-stripping agents are available, which when used with the bituminous mix
reduce the stripping.
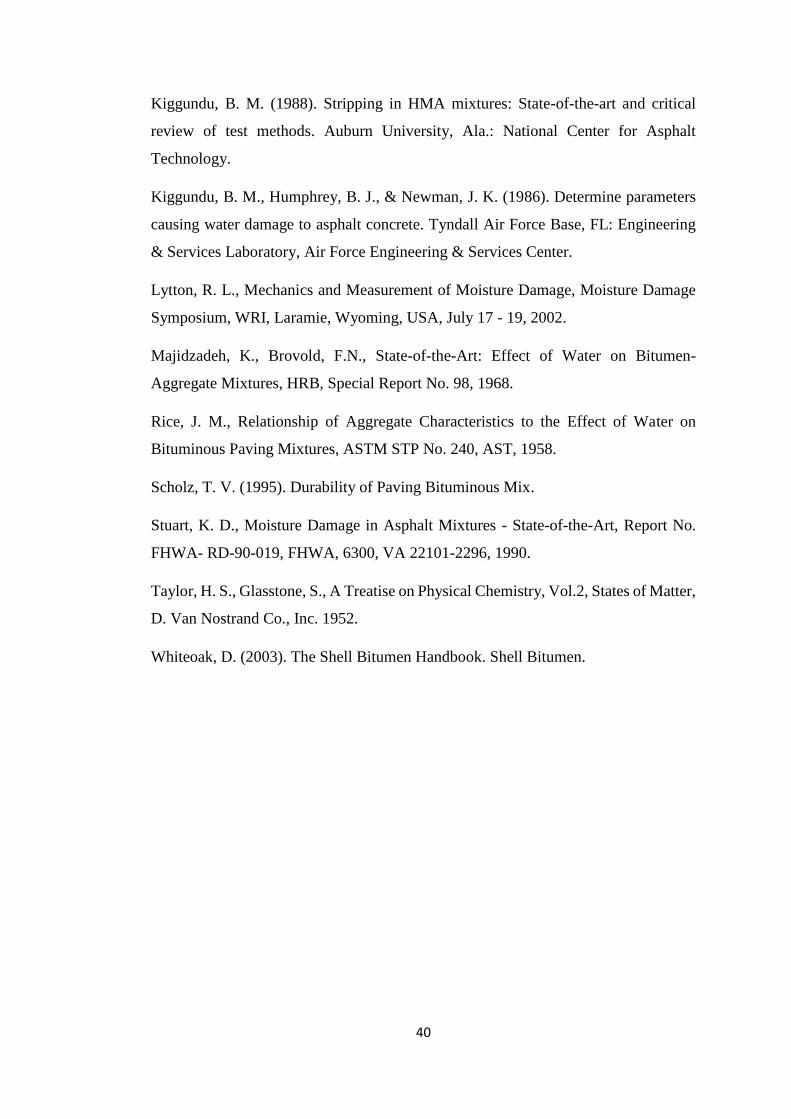
3.3.6 Retain Marshall Stability Test
The method described determines the retained Marshall stability on Marshall
Compaction specimens after curing for 24 hours in a water bath at 60o C.
The purpose of Marshall Test is to obtain the Optimum Bitumen Contain of Asphalt
Concrete Mixtures. There are two procedures in it. First is the preparation of the
Asphalt Specimens and second is testing the Asphalt specimens. After conducting the
test and getting the data from the machine, the following relationships need to be
plotted:
Density vs. bitumen content
Stability vs. bitumen content
Porosity vs. bitumen content
Flow vs. bitumen content
3.3.7 Retain Indirect Tensile Strength Test
This test is used to determine moisture sensitivity, by getting the resilient modulus and
indirect tensile strength ratios, MRR and TSR.
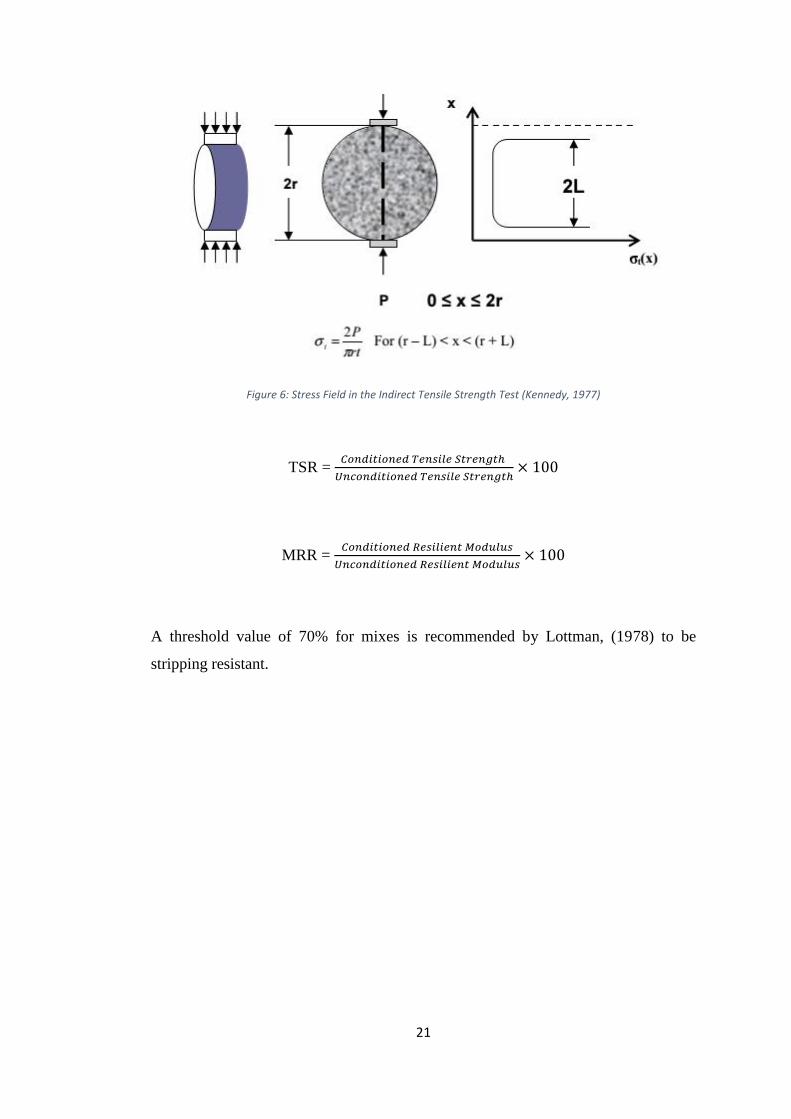
21
Figure 6: Stress Field in the Indirect Tensile Strength Test (Kennedy, 1977)
TSR = 𝐶𝑜𝑛𝑑𝑖𝑡𝑖𝑜𝑛𝑒𝑑 𝑇𝑒𝑛𝑠𝑖𝑙𝑒 𝑆𝑡𝑟𝑒𝑛𝑔𝑡ℎ
𝑈𝑛𝑐𝑜𝑛𝑑𝑖𝑡𝑖𝑜𝑛𝑒𝑑 𝑇𝑒𝑛𝑠𝑖𝑙𝑒 𝑆𝑡𝑟𝑒𝑛𝑔𝑡ℎ× 100
MRR = 𝐶𝑜𝑛𝑑𝑖𝑡𝑖𝑜𝑛𝑒𝑑 𝑅𝑒𝑠𝑖𝑙𝑖𝑒𝑛𝑡 𝑀𝑜𝑑𝑢𝑙𝑢𝑠
𝑈𝑛𝑐𝑜𝑛𝑑𝑖𝑡𝑖𝑜𝑛𝑒𝑑 𝑅𝑒𝑠𝑖𝑙𝑖𝑒𝑛𝑡 𝑀𝑜𝑑𝑢𝑙𝑢𝑠× 100
A threshold value of 70% for mixes is recommended by Lottman, (1978) to be
stripping resistant.

22
3.4 Gantt Chart
Table 5: Gantt chart FYP I
Week
Detail 1 2 3 4 5 6 7 8 9 10 11 12 13 14
Topic Selection
Research Work/ Litrature Review
FYP seminar
Preparation of Extended Proposal Report
Submission of Extended Proposal Report
Proposal Defense Presentation
Continue Research Work
Submission of 1st Draft Interim Report
Submission of Interim Report Final draft
Table 5.1: Gantt chart FYP II
Week
Detail 1 2 3 4 5 6 7 8 9 10 11 12 13 14
Preparing samples
Proceed with lab work (aggregates)
Proceed with lab work (Sample testing)
Progress report submission
Pre-SEDEX poster presentation
Final report submission
Final viva
23
Chapter4
Results & Discussion
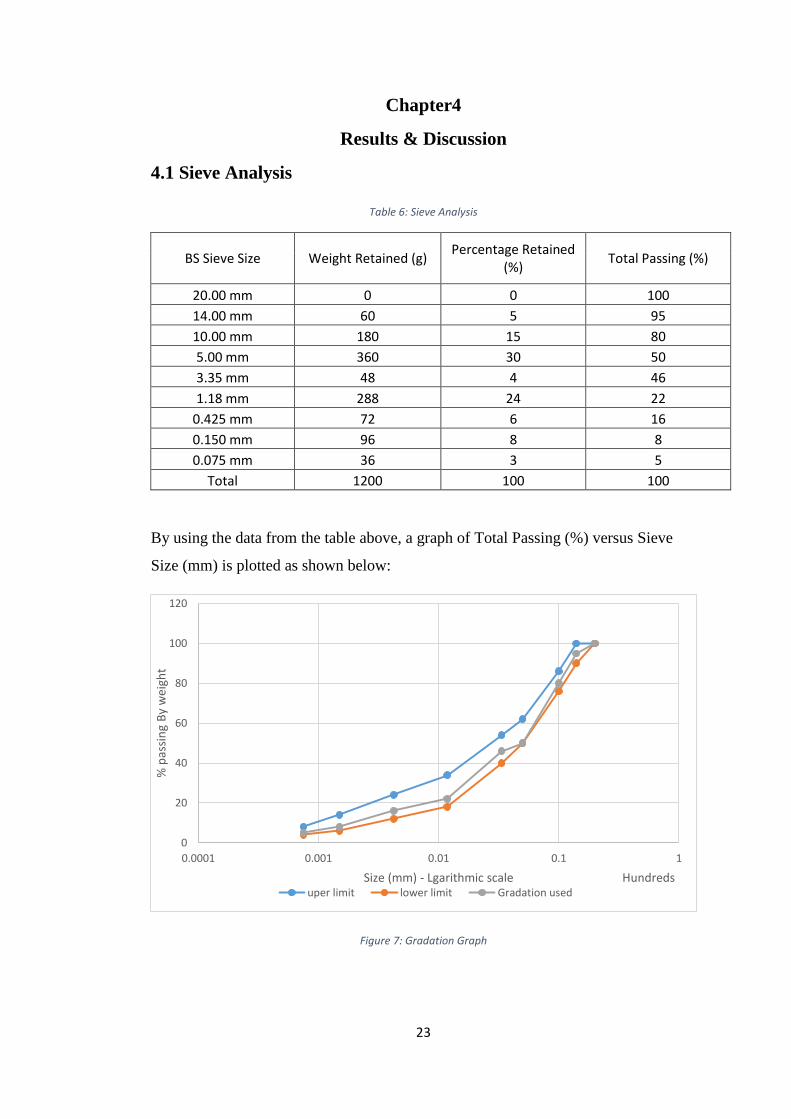
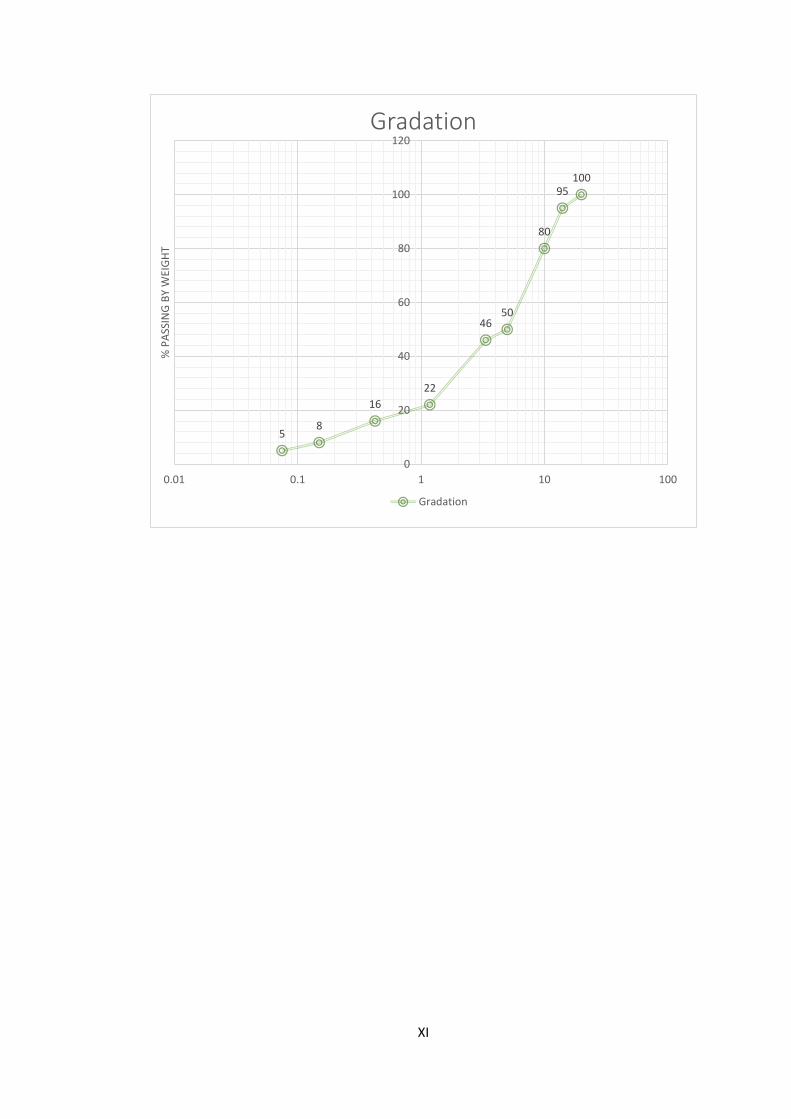
4.1 Sieve Analysis
Table 6: Sieve Analysis
BS Sieve Size Weight Retained (g) Percentage Retained
(%) Total Passing (%)
20.00 mm 0 0 100
14.00 mm 60 5 95
10.00 mm 180 15 80
5.00 mm 360 30 50
3.35 mm 48 4 46
1.18 mm 288 24 22
0.425 mm 72 6 16
0.150 mm 96 8 8
0.075 mm 36 3 5
Total 1200 100 100
By using the data from the table above, a graph of Total Passing (%) versus Sieve
Size (mm) is plotted as shown below:
Figure 7: Gradation Graph
0
20
40
60
80
100
120
0.0001 0.001 0.01 0.1 1
% p
assi
ng
By
wei
ght
Size (mm) - Lgarithmic scale Hundredsuper limit lower limit Gradation used
24
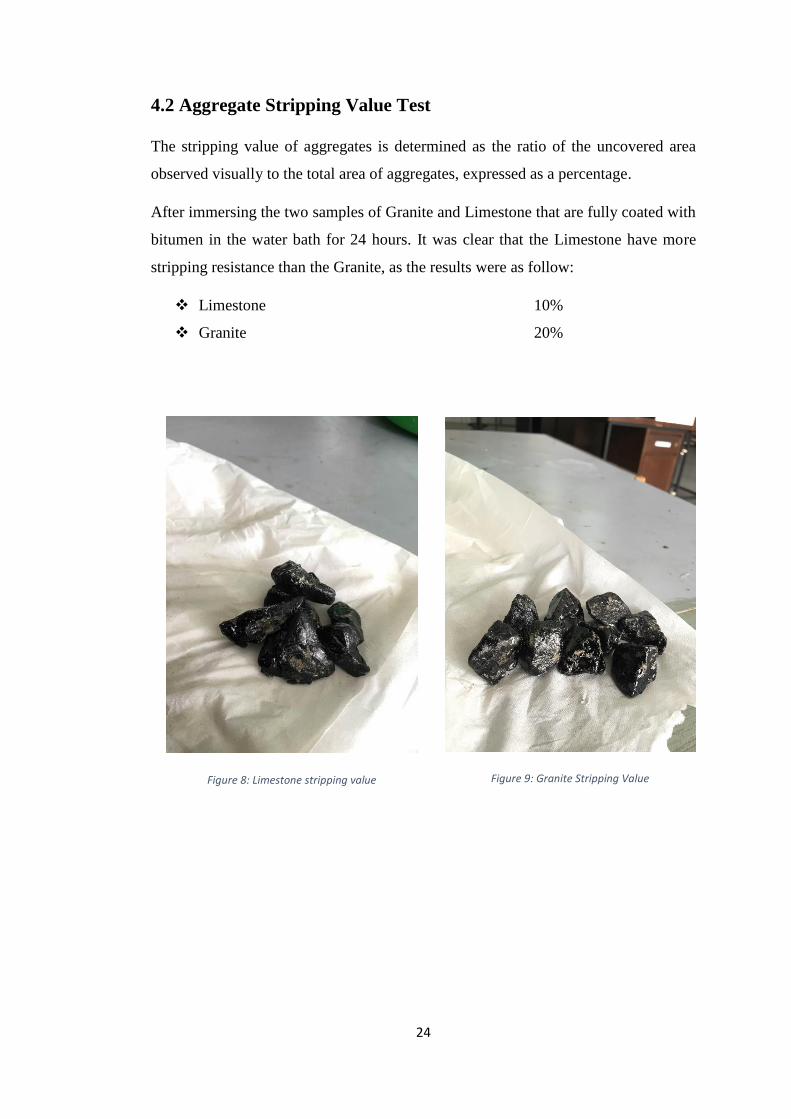
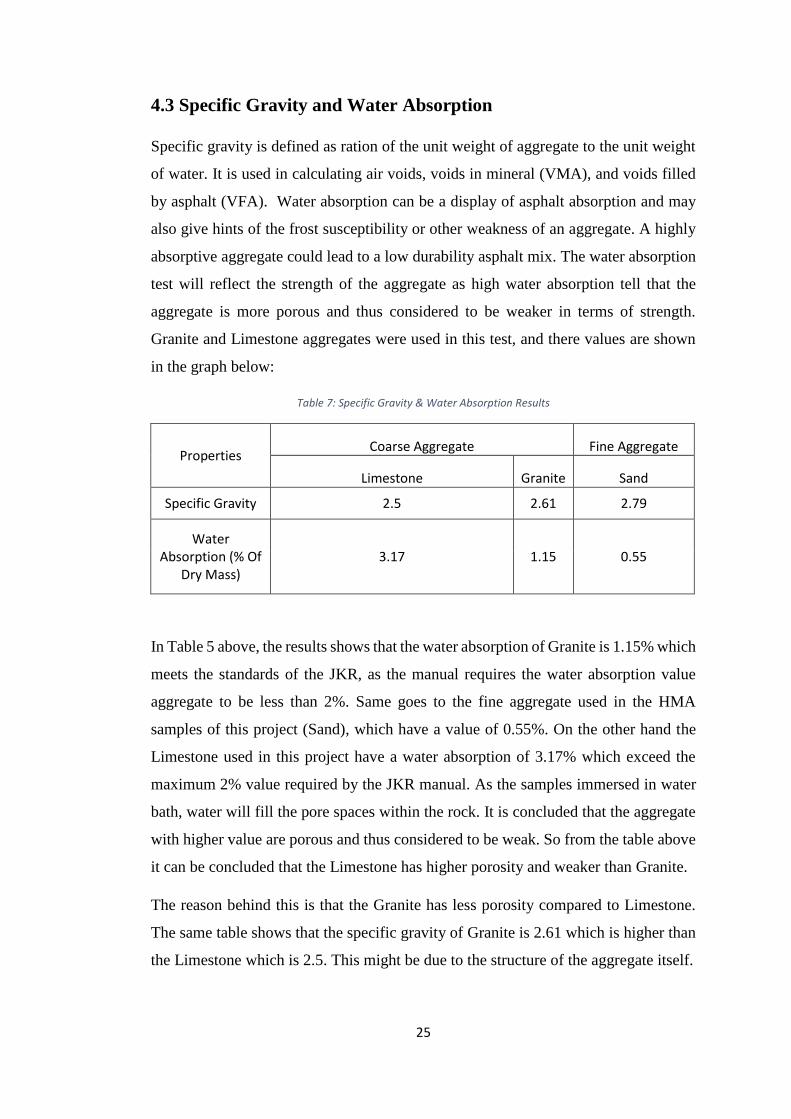
4.2 Aggregate Stripping Value Test
The stripping value of aggregates is determined as the ratio of the uncovered area
observed visually to the total area of aggregates, expressed as a percentage.
After immersing the two samples of Granite and Limestone that are fully coated with
bitumen in the water bath for 24 hours. It was clear that the Limestone have more
stripping resistance than the Granite, as the results were as follow:
Limestone 10%
Granite 20%
Figure 8: Limestone stripping value
Figure 9: Granite Stripping Value
25
4.3 Specific Gravity and Water Absorption
Specific gravity is defined as ration of the unit weight of aggregate to the unit weight
of water. It is used in calculating air voids, voids in mineral (VMA), and voids filled
by asphalt (VFA). Water absorption can be a display of asphalt absorption and may
also give hints of the frost susceptibility or other weakness of an aggregate. A highly
absorptive aggregate could lead to a low durability asphalt mix. The water absorption
test will reflect the strength of the aggregate as high water absorption tell that the
aggregate is more porous and thus considered to be weaker in terms of strength.
Granite and Limestone aggregates were used in this test, and there values are shown
in the graph below:
Table 7: Specific Gravity & Water Absorption Results
Properties Coarse Aggregate Fine Aggregate
Limestone Granite Sand
Specific Gravity 2.5 2.61 2.79
Water Absorption (% Of
Dry Mass) 3.17 1.15 0.55
In Table 5 above, the results shows that the water absorption of Granite is 1.15% which
meets the standards of the JKR, as the manual requires the water absorption value
aggregate to be less than 2%. Same goes to the fine aggregate used in the HMA
samples of this project (Sand), which have a value of 0.55%. On the other hand the
Limestone used in this project have a water absorption of 3.17% which exceed the
maximum 2% value required by the JKR manual. As the samples immersed in water
bath, water will fill the pore spaces within the rock. It is concluded that the aggregate
with higher value are porous and thus considered to be weak. So from the table above
it can be concluded that the Limestone has higher porosity and weaker than Granite.
The reason behind this is that the Granite has less porosity compared to Limestone.
The same table shows that the specific gravity of Granite is 2.61 which is higher than
the Limestone which is 2.5. This might be due to the structure of the aggregate itself.
26
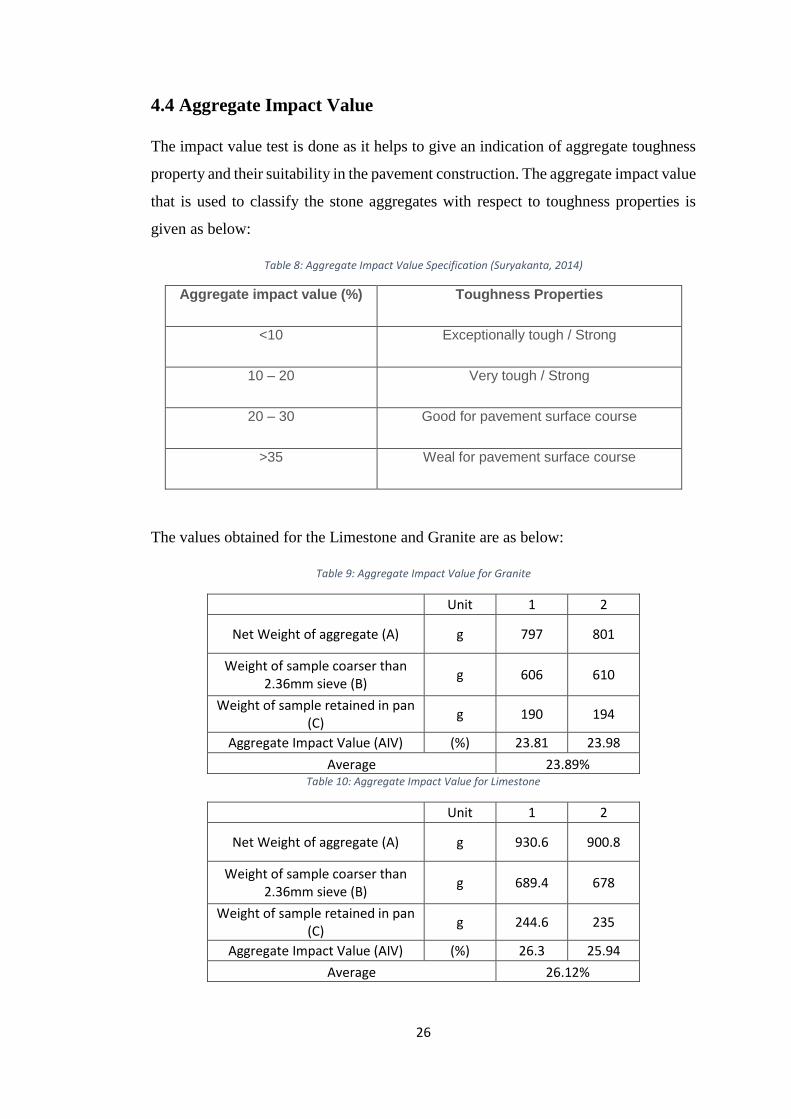
4.4 Aggregate Impact Value
The impact value test is done as it helps to give an indication of aggregate toughness
property and their suitability in the pavement construction. The aggregate impact value
that is used to classify the stone aggregates with respect to toughness properties is
given as below:
Table 8: Aggregate Impact Value Specification (Suryakanta, 2014)
Aggregate impact value (%) Toughness Properties
<10 Exceptionally tough / Strong
10 – 20 Very tough / Strong
20 – 30 Good for pavement surface course
>35 Weal for pavement surface course
The values obtained for the Limestone and Granite are as below:
Table 9: Aggregate Impact Value for Granite
Unit 1 2
Net Weight of aggregate (A) g 797 801
Weight of sample coarser than 2.36mm sieve (B)
g 606 610
Weight of sample retained in pan (C)
g 190 194
Aggregate Impact Value (AIV) (%) 23.81 23.98
Average 23.89% Table 10: Aggregate Impact Value for Limestone
Unit 1 2
Net Weight of aggregate (A) g 930.6 900.8
Weight of sample coarser than 2.36mm sieve (B)
g 689.4 678
Weight of sample retained in pan (C)
g 244.6 235
Aggregate Impact Value (AIV) (%) 26.3 25.94
Average 26.12%
27
Two samples of each aggregate type were prepared to implement the impact value test.
Due to the mineral properties of the limestone, it is clear from the results above that
the impact value of it is higher than the Granite. The test has proved that the Granite
is stronger and more durable than the Limestone, as it was easier to be crushed.
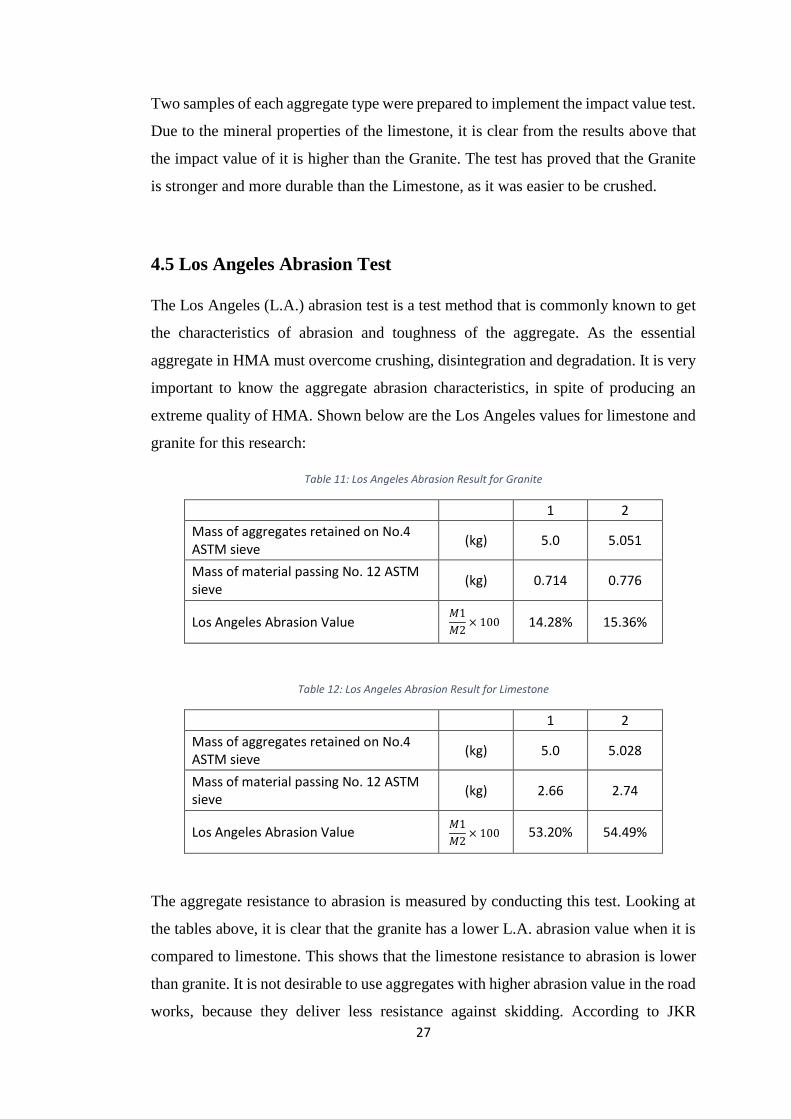
4.5 Los Angeles Abrasion Test
The Los Angeles (L.A.) abrasion test is a test method that is commonly known to get
the characteristics of abrasion and toughness of the aggregate. As the essential
aggregate in HMA must overcome crushing, disintegration and degradation. It is very
important to know the aggregate abrasion characteristics, in spite of producing an
extreme quality of HMA. Shown below are the Los Angeles values for limestone and
granite for this research:
Table 11: Los Angeles Abrasion Result for Granite
1 2
Mass of aggregates retained on No.4 ASTM sieve
(kg) 5.0 5.051
Mass of material passing No. 12 ASTM sieve
(kg) 0.714 0.776
Los Angeles Abrasion Value
14.28% 15.36%
Table 12: Los Angeles Abrasion Result for Limestone
1 2
Mass of aggregates retained on No.4 ASTM sieve
(kg) 5.0 5.028
Mass of material passing No. 12 ASTM sieve
(kg) 2.66 2.74
Los Angeles Abrasion Value
53.20% 54.49%
The aggregate resistance to abrasion is measured by conducting this test. Looking at
the tables above, it is clear that the granite has a lower L.A. abrasion value when it is
compared to limestone. This shows that the limestone resistance to abrasion is lower
than granite. It is not desirable to use aggregates with higher abrasion value in the road
works, because they deliver less resistance against skidding. According to JKR
𝑀1
𝑀2× 100
𝑀1
𝑀2× 100
𝑀1
𝑀2× 100
𝑀1
𝑀2× 100
28
specifications, the L.A. value of an aggregate to be used in road construction should
be less than 60%, which means that both of the aggregates above meet the
requirements.
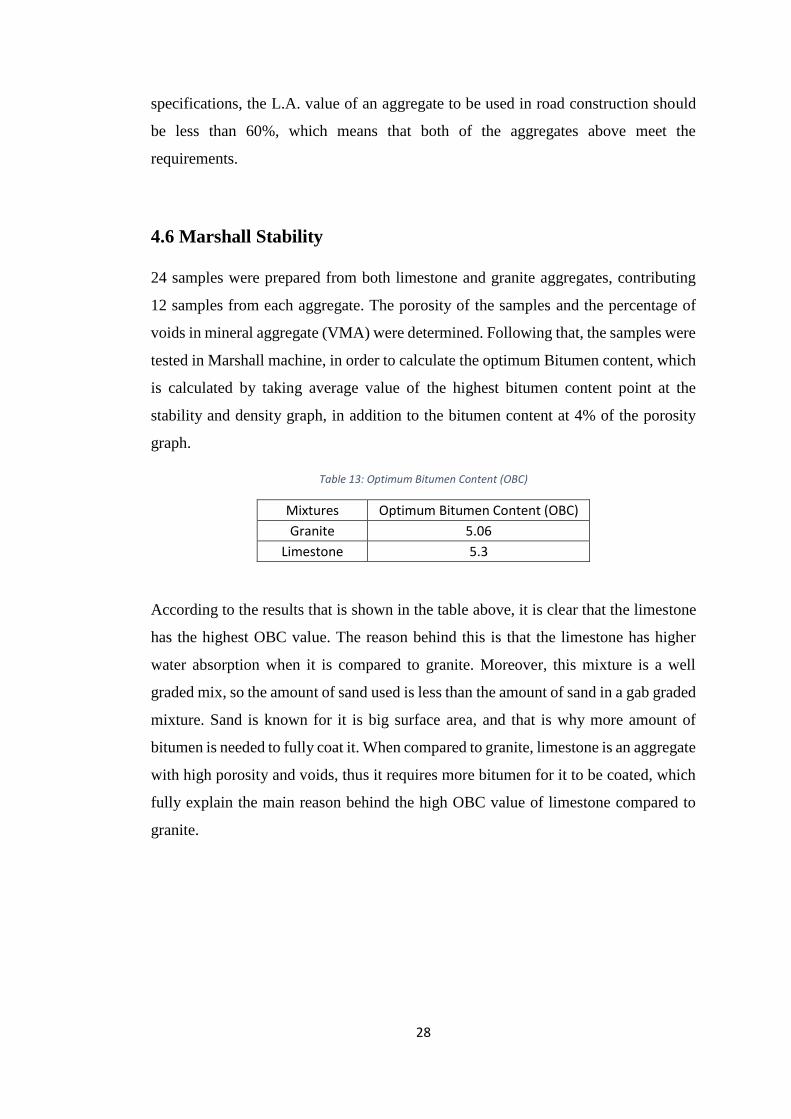
4.6 Marshall Stability
24 samples were prepared from both limestone and granite aggregates, contributing
12 samples from each aggregate. The porosity of the samples and the percentage of
voids in mineral aggregate (VMA) were determined. Following that, the samples were
tested in Marshall machine, in order to calculate the optimum Bitumen content, which
is calculated by taking average value of the highest bitumen content point at the
stability and density graph, in addition to the bitumen content at 4% of the porosity
graph.
Table 13: Optimum Bitumen Content (OBC)
Mixtures Optimum Bitumen Content (OBC)
Granite 5.06
Limestone 5.3
According to the results that is shown in the table above, it is clear that the limestone
has the highest OBC value. The reason behind this is that the limestone has higher
water absorption when it is compared to granite. Moreover, this mixture is a well
graded mix, so the amount of sand used is less than the amount of sand in a gab graded
mixture. Sand is known for it is big surface area, and that is why more amount of
bitumen is needed to fully coat it. When compared to granite, limestone is an aggregate
with high porosity and voids, thus it requires more bitumen for it to be coated, which
fully explain the main reason behind the high OBC value of limestone compared to
granite.
29
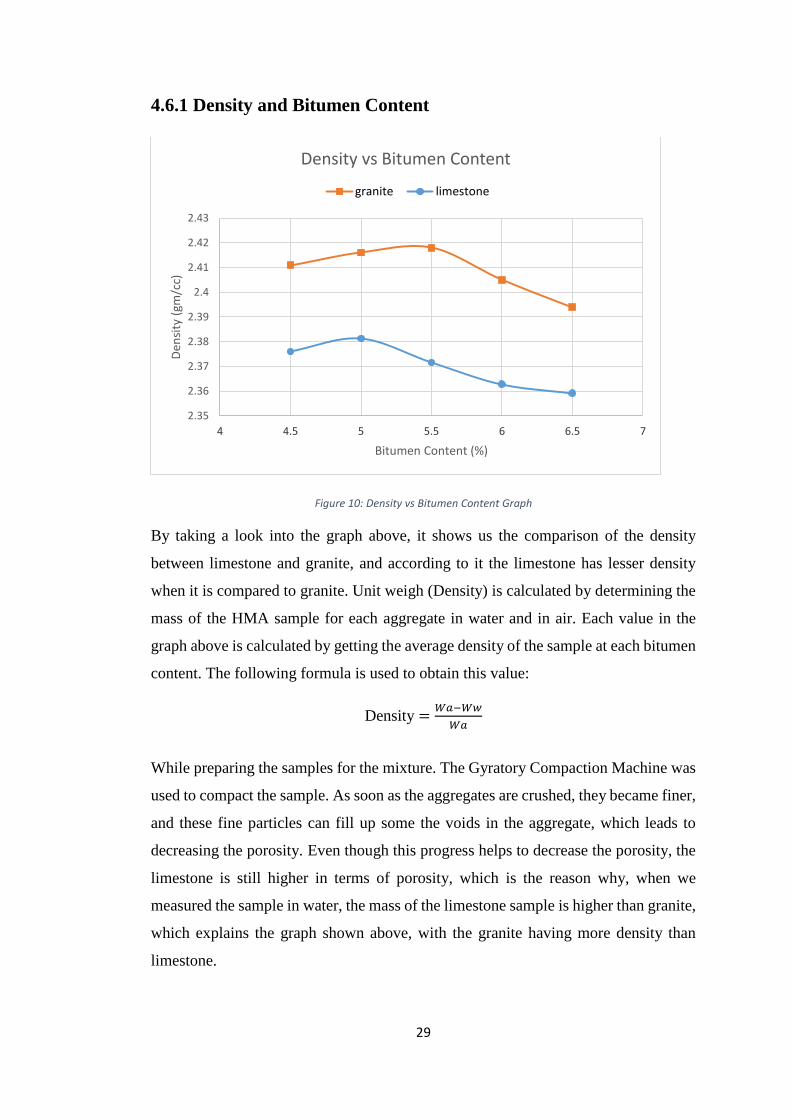
4.6.1 Density and Bitumen Content
Figure 10: Density vs Bitumen Content Graph
By taking a look into the graph above, it shows us the comparison of the density
between limestone and granite, and according to it the limestone has lesser density
when it is compared to granite. Unit weigh (Density) is calculated by determining the
mass of the HMA sample for each aggregate in water and in air. Each value in the
graph above is calculated by getting the average density of the sample at each bitumen
content. The following formula is used to obtain this value:
Density =𝑊𝑎−𝑊𝑤
𝑊𝑎
While preparing the samples for the mixture. The Gyratory Compaction Machine was
used to compact the sample. As soon as the aggregates are crushed, they became finer,
and these fine particles can fill up some the voids in the aggregate, which leads to
decreasing the porosity. Even though this progress helps to decrease the porosity, the
limestone is still higher in terms of porosity, which is the reason why, when we
measured the sample in water, the mass of the limestone sample is higher than granite,
which explains the graph shown above, with the granite having more density than
limestone.
2.35
2.36
2.37
2.38
2.39
2.4
2.41
2.42
2.43
4 4.5 5 5.5 6 6.5 7
Den
sity
(gm
/cc)
Bitumen Content (%)
Density vs Bitumen Content
granite limestone
30
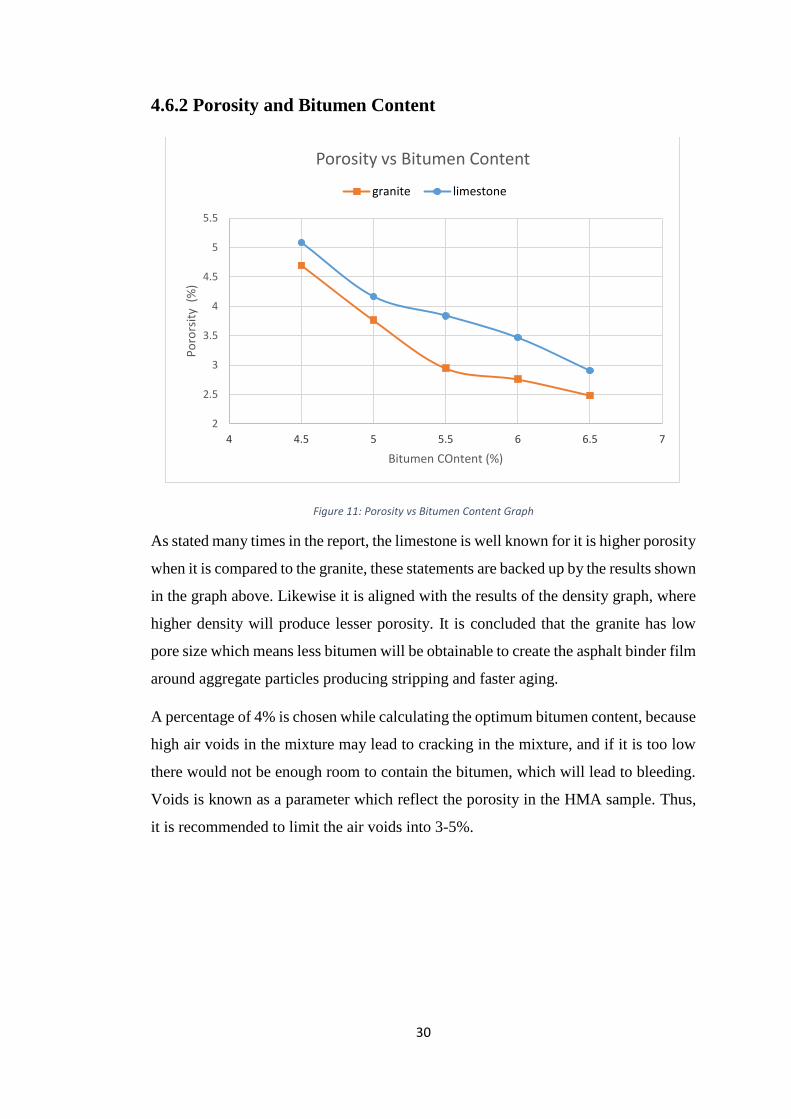
4.6.2 Porosity and Bitumen Content
Figure 11: Porosity vs Bitumen Content Graph
As stated many times in the report, the limestone is well known for it is higher porosity
when it is compared to the granite, these statements are backed up by the results shown
in the graph above. Likewise it is aligned with the results of the density graph, where
higher density will produce lesser porosity. It is concluded that the granite has low
pore size which means less bitumen will be obtainable to create the asphalt binder film
around aggregate particles producing stripping and faster aging.
A percentage of 4% is chosen while calculating the optimum bitumen content, because
high air voids in the mixture may lead to cracking in the mixture, and if it is too low
there would not be enough room to contain the bitumen, which will lead to bleeding.
Voids is known as a parameter which reflect the porosity in the HMA sample. Thus,
it is recommended to limit the air voids into 3-5%.
2
2.5
3
3.5
4
4.5
5
5.5
4 4.5 5 5.5 6 6.5 7
Po
rors
ity
(%
)
Bitumen COntent (%)
Porosity vs Bitumen Content
granite limestone

31
4.6.3 Flow and Bitumen Content
Figure 12: Flow vs Bitumen Content Graph
The flow graph above describe the deformation of different mixtures, by stating the
values in where the sample deform up to the point where the load start decreasing.
These values are strongly correlated with the amount bitumen used in the HMA
sample, which ranges from 4.5% up to 6.5%.
The graph shows that with the increment of bitumen content, the values of flow
increase as well in both mixtures, containing the granite and limestone, also it shows
that the limestone aggregate HMA sample have higher flow rates.
0
0.5
1
1.5
2
2.5
3
3.5
4
4.5
4 4.5 5 5.5 6 6.5 7
Flo
w (
mm
)
Bitumen Content (%)
Flow vs Bitumen Content
granite limestone
32
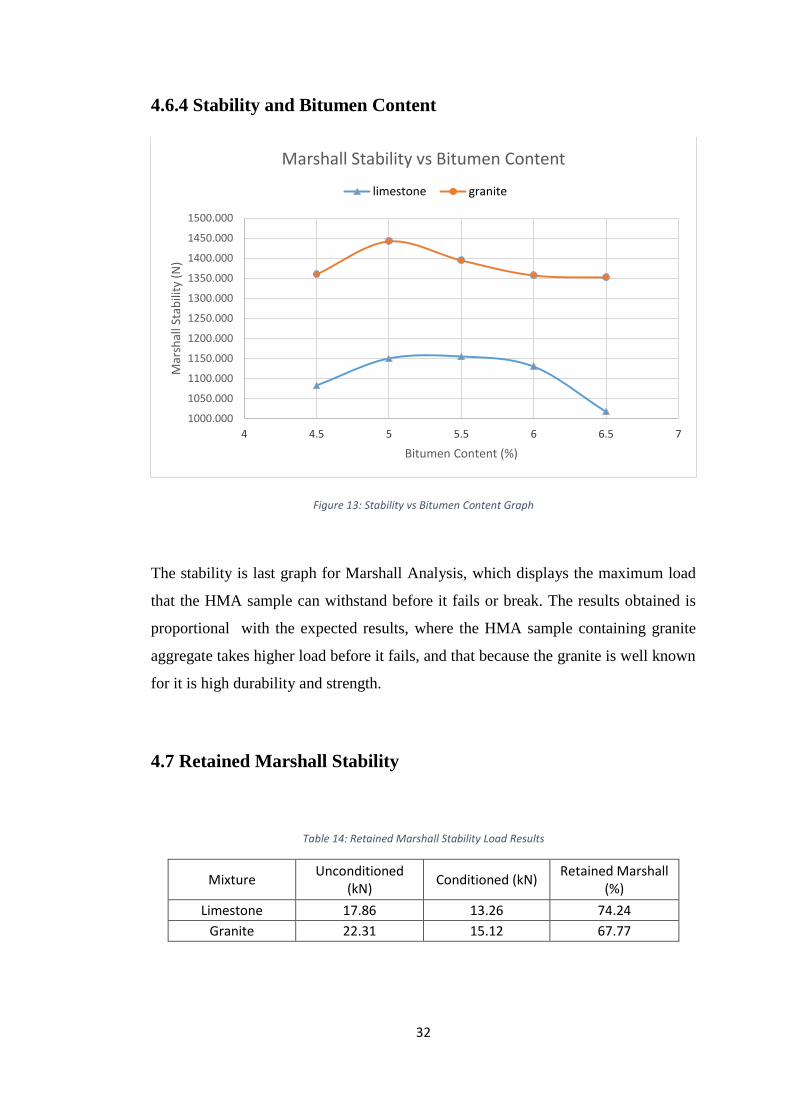
4.6.4 Stability and Bitumen Content
Figure 13: Stability vs Bitumen Content Graph
The stability is last graph for Marshall Analysis, which displays the maximum load
that the HMA sample can withstand before it fails or break. The results obtained is
proportional with the expected results, where the HMA sample containing granite
aggregate takes higher load before it fails, and that because the granite is well known
for it is high durability and strength.
4.7 Retained Marshall Stability
Table 14: Retained Marshall Stability Load Results
Mixture Unconditioned
(kN) Conditioned (kN)
Retained Marshall (%)
Limestone 17.86 13.26 74.24
Granite 22.31 15.12 67.77
1000.000
1050.000
1100.000
1150.000
1200.000
1250.000
1300.000
1350.000
1400.000
1450.000
1500.000
4 4.5 5 5.5 6 6.5 7
Mar
shal
l Sta
bili
ty (
N)
Bitumen Content (%)
Marshall Stability vs Bitumen Content
limestone granite

33
Figure 14: Comparison of Retained Marshall Load
Table 15: Retained Marshall Stability Deformation Results
Mixture Unconditioned
(mm) Conditioned (mm)
Limestone 2.28 2.09
Granite 2.56 2.18
Figure 15: Comparison of Retained Marshall Deformation
17.86
22.31
13.26
15.12
0
5
10
15
20
25
Limestone Granite
Load
, kN
Unconditioned (kN) Conditioned (kN)
2.28
2.56
2.092.18
0
0.5
1
1.5
2
2.5
3
Limestone Granite
De
form
atio
n, m
m
Unconditioned Conditioned
34
Marshall Stability is known as the maximum load that a compacted specimen (HMA
sample) can carry under a standard test of 60oC. Observed at the graphs above that
when we compare the granite and limestone in terms of load, we can see that there is
a very high reduction in sustaining load for granite. The difference of load between
conditioned and unconditioned for limestone is 4.6kN and for granite is 7.19kN. This
difference shows us that the limestone is stronger in presence of water, meaning that
the mixture containing granite is more exposed to water and less resistant to stripping.
The Retained Marshall percentage must be above 75% to sustain moisture damage
(Whiteoak, 2003). However both of the aggregates did not reach the requirement, with
the limestone being the closest with a value of 74.24%.
These results are allied, with results of Aggregate Stripping Value Test which stated
that the limestone is more resistant to stripping by having a lesser percentage of
stripped bitumen coating in the aggregate.
Figure 14 contains the same samples, both conditioned and unconditioned, however it
compares both of the aggregate in terms of deformation rather than load. The results
shows that the deformation of unconditioned sample is higher than the conditioned,
with a higher difference of deformation in the samples that contain the granite.
4.8 Indirect Tensile Strength Ratio Test
Table 16: Indirect Tensile Test Results
Mixture Dry Strength Wet Strength
Limestone 0.00334 0.00321
Granite 0.00321 0.00298
35
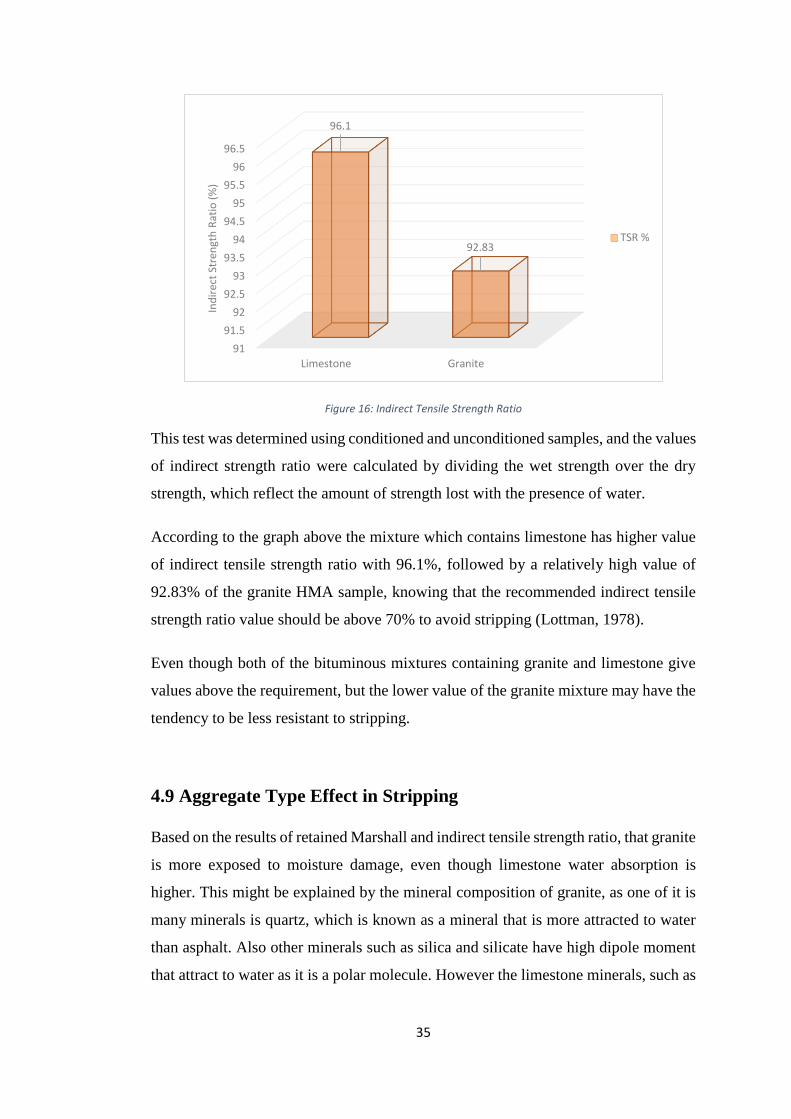
Figure 16: Indirect Tensile Strength Ratio
This test was determined using conditioned and unconditioned samples, and the values
of indirect strength ratio were calculated by dividing the wet strength over the dry
strength, which reflect the amount of strength lost with the presence of water.
According to the graph above the mixture which contains limestone has higher value
of indirect tensile strength ratio with 96.1%, followed by a relatively high value of
92.83% of the granite HMA sample, knowing that the recommended indirect tensile
strength ratio value should be above 70% to avoid stripping (Lottman, 1978).
Even though both of the bituminous mixtures containing granite and limestone give
values above the requirement, but the lower value of the granite mixture may have the
tendency to be less resistant to stripping.
4.9 Aggregate Type Effect in Stripping
Based on the results of retained Marshall and indirect tensile strength ratio, that granite
is more exposed to moisture damage, even though limestone water absorption is
higher. This might be explained by the mineral composition of granite, as one of it is
many minerals is quartz, which is known as a mineral that is more attracted to water
than asphalt. Also other minerals such as silica and silicate have high dipole moment
that attract to water as it is a polar molecule. However the limestone minerals, such as
91
91.5
92
92.5
93
93.5
94
94.5
95
95.5
96
96.5
Limestone Granite
96.1
92.83
Ind
irec
t St
ren
gth
Rat
io (
%)
TSR %
36
carbonate have non polar molecule, which is why it can maintain the adhesion force
with the bitumen binder.
This study is important to know which combination will be more resistant to stripping.
From the discussion above, it is concluded that bituminous mixture that contains
granite exhibit tendencies to stripping more than limestone. On the other hand using
the bituminous mixture that contains limestone, has appeared to be weak in terms of
strength and cannot sustain load. Thus it is recommended to use other types of
aggregates in further researches to find out the best aggregate to resist stripping and in
the same time withstand high load. Aggregates that are more porous than granite and
stronger than limestone, such as basalt, diabase, gabbro or sandstone.
37
Chapter 5
Conclusion
Several tests has been carried out in order to conclude the properties of each material
used to produce bituminous mixtures. In addition, this research ideally shows how the
properties of the materials control the engineering properties of the bituminous
mixture and build up a legitimate plan and create a decent resistance bituminous mix
in light of choice of materials which can last for a long period of time to be used in the
future.
This study is important to know which combination will be more resistant to stripping.
From the discussion above, it is concluded that bituminous mixture that contains
granite exhibit tendencies to stripping more than limestone. On the other hand using
the bituminous mixture that contains limestone, has appeared to be weak in terms of
strength and cannot sustain load. Thus it is recommended to use other types of
aggregates in further researches to find out the best aggregate to resist stripping and in
the same time withstand high load. Aggregates that are more porous than granite and
stronger than limestone, such as basalt, diabase, gabbro or sandstone.
5.1 Stripping Preventive Measures
Various measures can be taken to prevent, or at least minimize, moisture damage.
These measures range from material selection, to construction practice, pavement
design and HMA additives:
Aggregate selection: Choose low porosity aggregate with rough, clean
surfaces.
Prevent moisture penetration into the HMA pavement: Reduce the
permeability of the pavement structure by manipulating air void content, lift
thickness and gradation. Additionally, surface treatments such as fog seals,
slurry seals or bituminous surface treatments (BSTs) can essentially
waterproof the HMA surface.
38
Pre-treat aggregate: Modify aggregate surface properties to replace ions that
are likely to contribute to poor asphalt binder-aggregate adhesion.
Anti-strip additives: Add chemicals or lime to the asphalt binder or HMA to
prevent moisture damage.
Chemicals: Generally work to reduce surface tension in the asphalt binder,
which promotes better wetting, as well as impart an electrical charge to the
asphalt binder that is opposite that of the aggregate surface charge. Most
chemical additives contain amines and are added at about 0.1 to 1.0 percent by
weight of asphalt binder. Chemical additives are generally added to asphalt
binder prior to mixing with aggregate but this can cause some waste as not all
the additive is guaranteed to reach the critical asphalt binder-aggregate
interface. Some additives can be added to the aggregate before mixing with
asphalt binder so that all the additive is on the aggregate surface.
Lime: Works by replacing negative ions on an aggregate surface with positive
calcium ions, resulting in better asphalt binder-aggregate adhesion. Also reacts
with molecules in both the asphalt binder (carboxylic acid) and aggregate
(acidic OH groups) that results in molecules that are more readily absorbed on
the aggregate surface or molecules that are less likely to be dissociate and
associate with water molecules. Lime is usually added at about 1.0 to 1.5
percent by total aggregate weight. Moisture is needed to activate the lime, so
lime is usually added as a slurry or added to slightly moist aggregate.
39
Chapter 6
References
Asthana, R., Sobczak, N., Wettability, Spreading and Interfacial Phenomena in High-
Temperature Coatings, JOM - Publication of Minerals, Metals and Materials Society,
JOM-e, 52-10, 2000.
Balghunaim, F. A., Improving Adhesion Characteristics of Bituminous Mixtures by
Washing Dust-Contaminated Coarse Aggregates, TRR 1323, pp. 134-142, NRC,
Washington, D. C. 1991.
Blyth, F., & Freitas, M. d. (2002). A Geology for Engineers. London: British Library
Ctaloguing in Publication Data.
Cheng, D., Little, D. N., Lytton, R. L., Holste, J. C., Use of Surface Free Energy
Properties of the Asphalt-Aggregate System to Predict Damage Potential, AAPT, Vol.
71, 2002.
Clough, R. H., Martinez, J. E., Research on Bituminous Pavements Using the Sand
Equivalent Test, HRB Bulletin 300, 1961.
Curtis, C. W., Baik, J., Jeon, Y. W., Adsorption of Asphalt and Asphalt Functionalities
onto Aggregates Precoated -with Antistripping Agents, TRR 1269, pp. 48-55, NRC,
Washington, D. C. 1990.
Dukatz, E. L., Aggregate Properties Related to Pavement Performance, AAPT, vol.
58, pp. 492-502, 1989.
Fromm, H. J. (1974). The mechanisms of asphalt stripping from aggregate surfaces.
Downsview: Research and Development Division, Ontario Ministry of Transportation
and Communication.
Kennedy, T. W., Characterization of Asphalt Paving Materials Using the Indirect
Tensile Test, Journal of the AAPT, Vol. 46, pp. 132 - 150, 1977.
Kandhal, P. S. (1989). Water damage to asphalt overlays: Case histories. Auburn
University, Ala.: National Center for Asphalt Technology.
40
Kiggundu, B. M. (1988). Stripping in HMA mixtures: State-of-the-art and critical
review of test methods. Auburn University, Ala.: National Center for Asphalt
Technology.
Kiggundu, B. M., Humphrey, B. J., & Newman, J. K. (1986). Determine parameters
causing water damage to asphalt concrete. Tyndall Air Force Base, FL: Engineering
& Services Laboratory, Air Force Engineering & Services Center.
Lytton, R. L., Mechanics and Measurement of Moisture Damage, Moisture Damage
Symposium, WRI, Laramie, Wyoming, USA, July 17 - 19, 2002.
Majidzadeh, K., Brovold, F.N., State-of-the-Art: Effect of Water on Bitumen-
Aggregate Mixtures, HRB, Special Report No. 98, 1968.
Rice, J. M., Relationship of Aggregate Characteristics to the Effect of Water on
Bituminous Paving Mixtures, ASTM STP No. 240, AST, 1958.
Scholz, T. V. (1995). Durability of Paving Bituminous Mix.
Stuart, K. D., Moisture Damage in Asphalt Mixtures - State-of-the-Art, Report No.
FHWA- RD-90-019, FHWA, 6300, VA 22101-2296, 1990.
Taylor, H. S., Glasstone, S., A Treatise on Physical Chemistry, Vol.2, States of Matter,
D. Van Nostrand Co., Inc. 1952.
Whiteoak, D. (2003). The Shell Bitumen Handbook. Shell Bitumen.
IX
Appendix
X
XI
10095
80
5046
22
16
85
0
20
40
60
80
100
120
0.01 0.1 1 10 100
% P
ASS
ING
BY
WEI
GH
T
Gradation
Gradation

XII
LIMESTONE SAMPLES
% BIT.
SPEC.
NO.
% BIT.
SPEC.
NO.
SPEC.
HGT.
mm
WEIGHT - gm BULK
VOL. cc
SPEC. GRAV VOLUME - % TOTAL VOIDS - % STABILITY - KG FLOW
mm stiffness
IN AIR IN
WATER BULK
MAX. THEOR.
BIT AGG VOIDS AGG FILLED
(BIT) TOTAL
MIX MEAS. CORR
a b c d e f g h i j k l m n o p q r s
% Bit by wt.
of
Agg.
% Bit
by wt. of Mix
d-e d/f (bXg)/Gbit (100-
b)g/Gag 100-i-j 100-j 100(i/l)
100-
(100g/h)
CORR
FACTOR pXo q/r
4.500 64.400 1202.300 696.500 505.800 2.377 1.040 1331.000 1384.240 1.880
64.600 1200.400 695.300 505.100 2.377 1.040 1352.000 1406.080 1.780
64.500 1199.800 694.800 505.000 2.376 1.040 1342.000 1395.680 1.800
AVG. 64.500 2.376 2.504 10.484 84.432 5.083 15.568 67.347 5.083 1341.667 1395.333 1.820 766.667
5.000 64.100 1203.700 696.800 506.900 2.375 1.040 1300.000 1352.000 2.010
65.400 1204.000 698.800 505.200 2.383 1.040 1311.000 1363.440 2.080
65.300 1200.900 697.600 503.300 2.386 1.040 1305.000 1357.200 2.100
AVG. 64.933 2.381 2.485 11.673 84.160 4.166 15.840 73.696 4.166 1305.333 1357.547 2.063 657.939
5.500 65.000 1202.300 692.500 509.800 2.358 1.040 1325.000 1378.000 2.330
65.200 1201.400 697.300 504.100 2.383 1.040 1318.000 1370.720 2.410
65.100 1200.800 694.800 506.000 2.373 1.000 1332.000 1332.000 2.400
AVG. 64.821 2.372 2.466 12.788 83.376 3.836 16.624 76.925 3.836 1325.000 1360.240 2.380 571.529
6.000 64.100 1203.200 692.500 510.700 2.356 1.040 1397.000 1452.880 2.680
64.250 1204.400 694.400 510.000 2.362 1.040 1390.000 1445.600 2.740
64.550 1205.900 697.300 508.600 2.371 1.040 1375.000 1430.000 2.700
AVG. 64.300 2.363 2.448 13.899 82.630 3.471 17.370 80.017 3.471 1387.333 1442.827 2.707 533.064
6.500 64.650 1199.900 690.700 509.200 2.356 1.000 1304.000 1304.000 2.980
64.200 1200.900 692.600 508.300 2.363 1.040 1313.000 1365.520 2.940
65.900 1199.500 690.900 508.600 2.358 1.000 1390.000 1390.000 3.010
AVG. 64.917 2.359 2.430 15.034 82.061 2.905 17.939 83.807 2.905 1335.667 1353.173 2.977 454.594

XIII
GRANITE SAMPLES
% BIT. SPEC.
NO.
% BIT.
SPEC. NO.
SPEC.
HGT. mm
WEIGHT - gm BULK
VOL. cc
SPEC. GRAV VOLUME - % TOTAL VOIDS - % STABILITY - KG FLOW
mm stiffness
IN AIR IN
WATER BULK
MAX.
THEOR. BIT AGG VOIDS AGG
FILLED
(BIT)
TOTAL
MIX MEAS. CORR
a b c d e f g h i j k l m n o p q r s
% Bit by wt.
of Agg.
% Bit by wt.
of Mix d-e d/f (bXg)/Gbit
(100-
b)g/Gag 100-i-j 100-j 100(i/l)
100-
(100g/h)
CORR
FACTOR pXo q/r
4.500 74.400 1222.300 715.900 506.400 2.414 1.040 1031.000 1072.240 2.880
74.600 1227.400 718.300 509.100 2.411 1.040 1052.000 1094.080 2.780
74.500 1220.700 714.000 506.700 2.409 1.040 1042.000 1083.680 2.800
AVG. 74.500 2.411 2.504 10.638 85.667 3.695 14.333 74.222 3.695 1041.667 1083.333 2.820 384.161
5.000 74.100 1229.700 720.100 509.600 2.413 1.040 1100.000 1144.000 3.010
75.400 1231.200 722.700 508.500 2.421 1.040 1111.000 1155.440 3.080
75.300 1228.800 719.800 509.000 2.414 1.040 1105.000 1149.200 3.100
AVG. 74.933 2.416 2.485 11.844 85.392 2.764 14.608 81.079 2.764 1105.333 1149.547 3.063 375.260
5.500 75.000 1235.300 723.500 511.800 2.414 1.040 1125.000 1170.000 3.330
75.200 1231.200 722.800 508.400 2.422 1.040 1118.000 1162.720 3.410
75.100 1229.900 721.500 508.400 2.419 1.000 1132.000 1132.000 3.400
AVG. 74.821 2.418 2.466 13.039 85.014 1.947 14.986 87.008 1.947 1125.000 1154.907 3.380 341.688
6.000 74.100 1228.300 718.000 510.300 2.407 1.040 1097.000 1140.880 3.680
74.250 1225.900 715.900 510.000 2.404 1.040 1090.000 1133.600 3.740
74.550 1226.700 716.300 510.400 2.403 1.040 1075.000 1118.000 3.700
AVG. 74.300 2.405 2.448 14.145 84.094 1.761 15.906 88.928 1.761 1087.333 1130.827 3.707 305.079
6.500 74.650 1229.900 717.600 512.300 2.401 1.000 1004.000 1004.000 3.980
74.200 1228.100 715.900 512.200 2.398 1.040 1013.000 1053.520 4.030
75.900 1226.900 712.000 514.900 2.383 1.000 998.000 998.000 4.010
AVG. 74.917 2.394 2.430 15.254 83.265 1.481 16.735 91.149 1.481 1005.000 1018.507 4.007 254.203