Embed Size (px)
Citation preview

______________________________________________________________________________
The Success of First-Generation College Students in a TRIO Student Support Services Program:
Application of the Theory of Margin ______________________________________________________________________________
Dory E. Quinn, Pittsburg State University
Jeffrey Cornelius-White, Cynthia MacGregor, & Ximena Uribe-Zarain, Missouri State University
Abstract
First-generation college students have received considerable attention in education re-search, yet there is still much that is unknown about their unique college experiences. This mixed-methods study provides a unique perspective on first-generation college students through the application of McClusky’s theory of margin to first-generation students in a TRIO Student Support Services program. McClusky identified life factors that influence one’s level of load (demands) and power (resources). The load, divided by power plus load, suggests one’s margin in life. McClusky further postulated that the nature of load and power factors is the key to understanding one’s margin in life. The purpose of this study is threefold. First, the study tested the ability of various life factors to predict margin in life scores for first-generation students. Second, the study sought to understand the nature of margin in life by exploring common load and power variables and the ways in which they affect first-generation students. Finally, the researchers examined how participation in TRIO SSS contributes to margin in life for first-generation students. Our findings support McClusky’s claim that the nature of life factors is crucial in understanding margin, as the quantitative results revealed that life factors alone do not predict margin in life. The qual-itative exploration revealed salient life factors that contribute to load and power for par-ticipants, including TRIO Student Support Services. Furthermore, the study highlights the limitations of quantitative data to predict student experience and reveals subtleties best understood through in-depth qualitative consideration. Discussion of potential future re-search and practice implications are included.
Keywords: TRIO; Margin in life theory; first-generation college students; college student reten-tion In the United States, a push for increased access to postsecondary education has been ongoing for decades. Cursory examination of the college access movement indicates success—in 2012 the un-dergraduate population was 139% larger than it was in 1970 (Kena et al., 2014). Experts expect the trend in postsecondary enrollment to continue, with 20.2 million undergraduates projected to enter colleges and universities in 2023 (Kena et al., 2014). First-generation students represented 34% of the undergraduate population in 2012 (Postsecondary National Policy Institute [PNPI],

Critical Questions in Education 10:1 Winter 2019 45
2016). Unfortunately, opportunity does not beget equity and despite strong representation in col-lege, first-generation students frequently depart from higher education without a degree.
This study utilized the United States Department of Education’s definition of first-genera-tion student:
(a) an individual both of whose parents did not complete a baccalaureate degree; or (b) in the case of any individual who regularly resided with and received support from only one parent, an individual whose only such parent did not complete a baccalaureate degree. (Higher Education Act of 1965, 2008, p. 9) Defining first-generation college students is only the starting point for a complex topic.
The factors that influence first-generation students are complex and often interwoven. The chal-lenges begin during the secondary school years, follow first-generation students as they transition to college, and persist throughout their college experience. The experiences of first-generation students are expansive and varied and deserve consideration.
Literature Review
For first-generation students, the desire for a college degree stems from aspirations of a
brighter future. Unfortunately, only about half of first-generation students complete a bachelor’s degree (Redford & Hoyer, 2017). Academic difficulties, social challenges, and family factors often plague promising first-generation college students and end their higher education careers prema-turely.
Academically, first-generation students often start college at a disadvantage. While they believe that a college education is within their reach (Dyce, Albold, & Long, 2013) and understand that college is more rigorous than high school (Terenzini et al., 1994), they are also likely to be underprepared and have a high level of academic need. High school counselors often fail to discuss college with potential first-generation students, steer them away from a rigorous high school cur-riculum, or even discourage them from pursing college (Hudley et al., 2009; Rendon, 1993; Saenz, Hurtado, Barrera, Wolf, & Yeung, 2007). Many first-generation students (54%) must take reme-dial courses due to low or missing ACT or SAT scores or low high school grades (Chen & Simone, 2016; Saenz et al., 2007).
When first-generation students matriculate to higher education, they expect to have to study hard, and that academics will be the most integral and challenging aspect of college (Byrd & Mac-Donald, 2005). However, they also report difficulty with academic adjustment and lack of prepar-edness for the shift from high school to more rigorous college expectations (Gibbons, Rhinehart, & Hardin, 2016). Low grade point averages and slow progress in college coursework also often beleaguer first-generation students (Pike & Kuh, 2005; Warburton, Bugarin, & Nunez, 2001).
Though crucial to college success, academics alone do not facilitate a successful transition to college (Inkelas, Daver, Vogt, & Leonard, 2007). In addition to academic challenges, first-gen-eration students express apprehension about the transition from high school to college and expect to encounter barriers in adjusting to the new atmosphere (Longwell-Grice, Adsitt, Mullins, & Ser-rata, 2016). Tinto (1993) hypothesized that lack of both academic and social integration contrib-utes to the early departure of first-generation students. First-generation students often lack an un-derstanding of the importance of social engagement and integration on campus, knowledge of how to become engaged on campus, and the social self-confidence to pursue social integration (Dumais, 2002; Pike & Kuh, 2005; Saenz et al., 2007). Although they identify themselves as college

46 Quinn, Cornelius-White, MacGregor & Uribe-Zarain—The Success of First Generation
students, they often come to college with a single-minded focus on their career aspirations (Byrd & MacDonald, 2005; Neumeister & Rinker, 2006). Collectively, these factors contribute to lower social self-confidence and alienation of first-generation students (Davis, 2010; Jehangir, Williams & Jeske, 2012; Saenz et al., 2007).
Many first-generation students find adaptation to college difficult because of familial re-sistance (Coffman, 2011; Jehangir, et al., 2012; Orbe, 2004). Some first-generation students expe-rience pressure to maintain their familial identity, while others report that their families respond and interact with them differently after they begin college (Coffman, 2011; Lowery-Hart & Pachecho, 2011). Research indicates that families of first-generation students are often unsupport-ive or indifferent about the student’s collegial aspirations (Coffman, 2011; Jehangir et al., 2012; Orbe, 2004; Rendon, 1993). First-generation students often feel as though they must choose be-tween their family of origin and their new college “family” or they must learn to play two roles as they vacillate between their familial and collegiate cultures (Rendon, 1993; Rodriguez, 1974).
Conversely, some first-generation students experience unreasonable expectations placed on them by family because of their decision to pursue higher education (Orbe, 2004; Orbe 2008). While such expectations serve as motivation for many students, they simultaneously create pres-sure to perform well (Orbe, 2004; Orbe, 2008). The excessive expectations placed on some first-generation students by family members create intense anxiety surrounding their academic perfor-mance (Orbe, 2004; Orbe, 2008).
The US recognizes the value of higher education for all as well as the tremendous potential among first-generation students (Dyce et al., 2013). Increased access to higher education led to more first-generation students enrolling in college. As a result, numerous support programs sprang up among college campuses to sustain first-generation students. Among those are the federal TRIO programs, enacted through The Educational Opportunity Act (EOA) of 1964, now the Higher Ed-ucation Act (Chaney, 2010; Council for Opportunity in Education, n.d.). During their formative years, the EOA and HEA formed TRIO Student Support Services (SSS), which serves traditionally disadvantaged students in higher education, including first-generation college students (COE, n.d.; U.S. Department of Education, 2011). TRIO SSS programs serve nearly a quarter of a million students in the United States each year and work to increase college retention and graduation rates of first-generation students (COE, n.d.; U.S. Department of Education, 2016).
Theoretical Framework
The theory of margin originated from Howard McClusky’s work on adult learning and the
lifespan. McClusky’s theory centers on the concept of margin. Margin is a function of two inter-mingling elements referred to as power and load. McClusky (1971) defined power as the abilities, relationships, and other resources a person can employ to reach their goals. Power can derive from resources such as physical health, social contacts, economic wealth, and life experiences (Main, 1979). Load is the personal and social demands on a person. Load can stem from typical require-ments of daily living such as family, work, civic responsibilities, expectations, goals, values, and ideals (Main, 1979; McClusky, 1971). Margin in life occurs when an individual has a surplus of power above load (McClusky, 1963).
McClusky (1963, 1971) proposed a formula to express a load-power ratio representing an individual’s margin in life. According to McClusky, a load-power ratio of .50 to .80 provides substantial margin to meet the challenges of life (Main, 1979; McClusky, 1963). McClusky (1970) also understood that the nature of load and power are germane to margin, stating, “…mere posses-sion will not tell us to what extent and to what ends this advantage will be used” (p. 29), and that

Critical Questions in Education 10:1 Winter 2019 47
both the presence and characteristics of load and power variables provides the key to understanding adult learning (McClusky, 1971).
McClusky (1971) identified specific aspects of life that contribute to the load or power of adults; he termed these aspect “coping needs.” Those coping needs guided the selection of demo-graphic variables for the study, which are the predictor variables in the quantitative analysis model. The coping needs include (listed as McClusky’s terms with the researcher’s variable names in parenthetical notation afterward) level of academic ability (GPA), income or financial resources (income), position (employment status), influential affiliations (TRIO participation level), and re-lations within the immediate and extended family (companionship status, parental status, sex). In addition, to compliment the basis of McClusky’s theory that learning is different based on place in the lifespan, the study also considered student’s status as traditional age or nontraditional age.
Stevenson (1981, 1994) conducted a methodological study in order to develop an instru-ment to measure margin in life. The Margin in Life Scale (MILS) is a 58-item questionnaire that includes five subscales: health, self-confidence, parenting satisfaction, religiosity/spirituality, and interdependence. The subscales “cover the totality of human experience” (Stevenson, 1981, p. 223). The health subscale considers components of physical and mental health. The self-confi-dence subscale explores relationships with others, cooperation, problem solving, and attitude. Par-enting satisfaction focuses on the relationship with and well-being of one’s children. Religios-ity/spirituality reflects one’s religious or spiritual beliefs, activities, and membership in religious or spiritual groups. Interdependence addresses one’s level of dependence or independence as well as self-direction, goal setting, decision-making, and self-control.
McClusky’s assertion that margin can be measured quantitatively, as well as his call for exploration beyond the presence of margin into the nature of load and power variables, provides a unique opportunity to utilize theoretical concepts both quantitatively and qualitatively; this in-formed the mixed-methods research design of the study. Following McClusky’s reasoning, the quantitative portion of the study explored the impact of demographic variables that align with McClusky’s identified coping needs on margin in life scores. The qualitative portion utilized McClusky’s concepts of load, power, and coping needs along with Stevenson’s subscale categories (health, self-confidence, parenting satisfaction, religiosity/spirituality, and interdependence) to ex-plore in greater depth the margin in life of first-generation college students.
Because of the emphasis on goal pursuit and growth, the theory of margin lends itself well to educational interpretation. McClusky (1971) postulated that margin is a key factor in adult learn-ing and educational researchers have utilized the theory in a variety of studies (Hanpachern, Mor-gan & Griego, 1998; Main, 1979; Merriam & Bierama, 2014). Furthermore, McClusky’s coping needs align with common areas of disadvantage of first-generation students identified in the liter-ature, including income level, age, family status, employment status, and academics (Choy, 2001; Mehta, Newbold, & O’Rourke, 2011).
Purpose
The purpose of this study was to explore the totality of the first-generation student experi-
ence through McClusky’s theory of margin framework. The quantitative portion of the study ex-plored the relationship between first-generation student’s margin in life scores and aspects of life in which adults need coping ability identified by McClusky (1971). One research question guided the quantitative analysis:
48 Quinn, Cornelius-White, MacGregor & Uribe-Zarain—The Success of First Generation
1. To what extent are first-generation students’ margin in life scores and subscale scores predicted by the students’ traditional or nontraditional status, sex, employment status, companionship status, grade point average, parental status, income level, and TRIO SSS participation level? Furthermore, the study sought to understand the nature of load and power variables experienced by first-generation students as well as the impact of TRIO SSS participa-tion on student’s experience. Three research questions guided the qualitative analysis:
2. How do load variables influence the college experience of first-generation students? 3. How do power variables influence the college experience of first-generation students? 4. How does participation in a TRIO Student Support Services influence margin for first-
generation students?
Methodology
The study utilized a mixed-methods research design. Integration of quantitative and qual-itative data fostered a complete understanding of the research problem. A convergent parallel de-sign (Creswell, 2014) provided a comprehensive view of the research problem with quantitative and qualitative data gathered and interpreted simultaneously. Both the quantitative and qualitative data collected focused on information relevant to the theory of margin, with the quantitative por-tion providing margin in life scores and demographic variables; and the qualitative portion provid-ing descriptive details about the nature of load and power variables experienced by students as well as details regarding the impact of TRIO SSS on student experience.
Setting
The research study took place at a public, four-year liberal arts university located in the Midwest. At the time of the study, the relatively small, moderately selective institution had en-rollment of approximately 5,600 students. Approximately 39% of the student body was first-gen-eration college students. Researchers conducted the study within the TRIO SSS program on cam-pus. While TRIO SSS programs serve first-generation, low-income, and disabled students, the scope of the project is limited to first-generation students.
Participants
The sample consisted of first-generation college students enrolled in the federal TRIO SSS program at the institution. Current participants (148) received invitations to participate in the study. A total of 99 (66.9%) of invited students responded to the survey; of those, 17 students began the survey but did not complete the survey adequately to include their results; 11 students were not first-generation college students and were ineligible to participate; and one student opted out after reviewing the study description. Sixty-six (44.6%) of the invited students completed the survey adequately enough to include the results in the study. According to VanVoorhis and Mor-gan (2007), a sample size of approximately 50 is an acceptable rule of thumb when using multiple regression. However, a more specific recommendation from Green (1991) indicates that to test the model overall, the suggested minimum sample size is 50 + 8k, where k is the number of predictors. With nine predictors, an adequate sample size would be 122. The sample size does not meet Green’s requirements, but it is above the VanVoorhis and Morgan’s rule of thumb.
Critical Questions in Education 10:1 Winter 2019 49
All current TRIO SSS participants also received an invitation to participate in the qualita-tive portion of the study; of those, eight agreed to participate. While the qualitative portion of the study included a relatively small number of participants based on convenience sampling, the re-searchers determined the number to be adequate as redundancy in information indicated saturation. Interview participants had been active in the program for a minimum of two full semesters. Six of the participants were female and two were male; four students were traditional students (under the age of 25) and four were nontraditional (over the age of 25). The use of pseudonyms in report-ing qualitative data protected participant privacy. Interview participants included Kaleb (tradi-tional/male), Riley (traditional/female), Hannah (traditional/female), Abbie (traditional/female), Karen (nontraditional/female), Julie (nontraditional/female), Rhonda (nontraditional/female), and James (nontraditional/male). Data Collection Methods
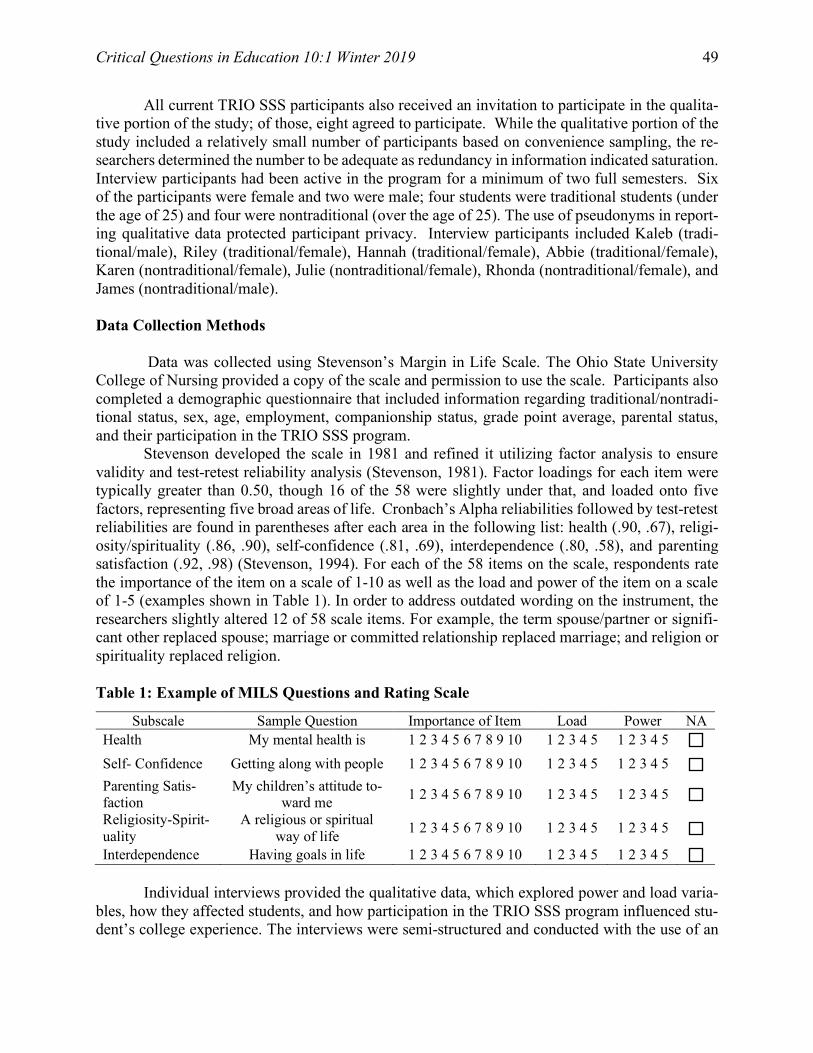
Data was collected using Stevenson’s Margin in Life Scale. The Ohio State University College of Nursing provided a copy of the scale and permission to use the scale. Participants also completed a demographic questionnaire that included information regarding traditional/nontradi-tional status, sex, age, employment, companionship status, grade point average, parental status, and their participation in the TRIO SSS program. Stevenson developed the scale in 1981 and refined it utilizing factor analysis to ensure validity and test-retest reliability analysis (Stevenson, 1981). Factor loadings for each item were typically greater than 0.50, though 16 of the 58 were slightly under that, and loaded onto five factors, representing five broad areas of life. Cronbach’s Alpha reliabilities followed by test-retest reliabilities are found in parentheses after each area in the following list: health (.90, .67), religi-osity/spirituality (.86, .90), self-confidence (.81, .69), interdependence (.80, .58), and parenting satisfaction (.92, .98) (Stevenson, 1994). For each of the 58 items on the scale, respondents rate the importance of the item on a scale of 1-10 as well as the load and power of the item on a scale of 1-5 (examples shown in Table 1). In order to address outdated wording on the instrument, the researchers slightly altered 12 of 58 scale items. For example, the term spouse/partner or signifi-cant other replaced spouse; marriage or committed relationship replaced marriage; and religion or spirituality replaced religion. Table 1: Example of MILS Questions and Rating Scale
Individual interviews provided the qualitative data, which explored power and load varia-
bles, how they affected students, and how participation in the TRIO SSS program influenced stu-dent’s college experience. The interviews were semi-structured and conducted with the use of an
Subscale Sample Question Importance of Item Load Power NA Health My mental health is 1 2 3 4 5 6 7 8 9 10 1 2 3 4 5 1 2 3 4 5 Self- Confidence Getting along with people 1 2 3 4 5 6 7 8 9 10 1 2 3 4 5 1 2 3 4 5 Parenting Satis-faction
My children’s attitude to-ward me 1 2 3 4 5 6 7 8 9 10 1 2 3 4 5 1 2 3 4 5
Religiosity-Spirit-uality
A religious or spiritual way of life 1 2 3 4 5 6 7 8 9 10 1 2 3 4 5 1 2 3 4 5
Interdependence Having goals in life 1 2 3 4 5 6 7 8 9 10 1 2 3 4 5 1 2 3 4 5

50 Quinn, Cornelius-White, MacGregor & Uribe-Zarain—The Success of First Generation
interview guide, but with flexible use of questions. Interview questions included introductory, transition, key, and ending questions as recommended by Krueger and Casey (2009). Data Analysis Methods
Researchers computed margin in life scale composite and subscale scores for each participant using Stevenson’s (1994) computation instructions. For each individual subscale item, the load rating is divided by the ratings for power plus load; the result is then weighted based on the re-spondent’s importance rating. Weighted results for each subscale item are then added together and the result is subtracted from 1 for the subscale score. Each subscale score is then multiplied by the weighted importance average for the subscale; the results are added together and divided by the sum of all weighted importance averages for the subscale. This number is subtracted from 1 to get the overall margin in life score.
Researchers used multiple linear regression analyses to develop a model to explore the rela-tionship between students’ MILS scores and their traditional/nontraditional status, sex, employ-ment status, companionship status, grade point average, parental status, income level, and their TRIO SSS participation level. The majority of predictors were categorical with only two levels; however, TRIO SSS participation level contained three levels (very active, somewhat active, and slightly active) and required the creation of two dummy variables for analysis (see Table 2). As a result, the model contained 9 variables. Table 2: Participant Demographics
Variable Frequency Percentage Traditional/Nontraditional Status Traditional 34 51.5% Nontraditional 32 48.5% Sex Male 17 25.8% Female 49 74.2% Employment Status Employed full-time 45 68.2% Not employed 21 31.8% Companionship Status Married/Partnered 27 40.9% Not in a Relationship 39 59.1% Parental Status Children 20 30.3% No children 46 69.7% Income Level Low 45 68.2% Not low 21 31.8% TRIO SSS Participation Level Very active 11 16.7% Somewhat active 35 53.0% Slightly active 20 30.3%

Critical Questions in Education 10:1 Winter 2019 51
The entry method for the multiple regression was block-wise selection. The researchers used hierarchical multiple regression. In this case, the predictors were grouped into blocks based on theoretical reasons. The first block included demographic variables associated with first-generation students. The second block included an academic variable. Finally, the third block included TRIO SSS participation level. The researchers retained variables even when they were not significant to preserve the original variables in the model. The three blocks were as follows, Block 1: income level, traditional/nontraditional status, sex, employment status, companionship status, and parental status; Block 2: grade point average, and Block 3: TRIO SSS participation level.
The researchers used pure verbatim protocol for interview transcription and content anal-ysis for exploration of the transcripts (Mayring, 2000). McClusky’s concepts of load and power as well as Stevenson’s subscale categories provided a theoretically based categorization system for the qualitative data. Researchers placed variables identified by participants in one of three cate-gories according to McClusky’s theory—load, power, or both. Researchers then categorized the variables according to Stevenson’s subscale categories and classified each as representing health, religiosity/spirituality, self-confidence, interdependence, and parenting satisfaction, or a combina-tion of the subscale categories. The initial coding process relied only on Stevenson’s established subscale categories for the category system; second coding incorporated an additional category that emerged during initial analysis—grit, or “perseverance and passion for long-term goals” (Duckworth, Peterson, Matthews, & Kelly, 2007, p. 1087).
Results
Margin in Life Scale Scores Over 90% of the study participants (60 out of 66) had a composite MILS score in the range McClusky identified as substantial for the possession of margin. Researchers used multiple linear regression analysis to develop a model with students’ overall MILS score as an outcome and their traditional/nontraditional status, sex, employment status, companionship status, grade point aver-age, parental status, income level, and TRIO SSS participation level as the independent variables. Assumptions of a linear relationship, multivariate normality, multicollinearity, and homoscedas-ticity were checked; no violations were found. Distributional statistics (means, standard devia-tions) are presented in Table 3 (next page) for the predictors and criterion, as well as their correla-tions. The bivariate associations revealed strong relationships between the traditional status, em-ployment status, having a partner, and being a parent. In contrast, overall MILS scores’ associa-tions were small and insignificant with the exception of more activity in SSS generally being as-sociated with more margin in life. Table 3: Means, Standard Deviations, and Intercorrelations for Students’ MILS Scores and Predictor Variables (n = 66)
Variable M SD 1 2 3 4 5 6 7 8 9 MILS Score 0.7 0.1 .01 .12 .12 .15 -.02 -.16 .09 .23* -.28* Predictor variable
1. Income 0.7 0.5 -- 0.0 0.1 -0.1 0.1 0.0 -0.3* 0.2* 0.0 2. Traditional 0.5 .05 -- 0.0 0.5*** 0.5*** 0.6*** 0.2 0.1 0.0
52 Quinn, Cornelius-White, MacGregor & Uribe-Zarain—The Success of First Generation
3. Sex 1.7 .0.4 -- 0.1 -0.2* -0.2 0.1 0.2* -0.2*
4. Employment 1.5 0.5 -- 0.3** 0.2* 0.2 0.3** -0.2*
5. Partner 1.6 0.5 -- 0.5 -0.1 0.0 0.1 6. Parent 1.7 0.4 -- 0.0 -0.1 0.2* 7. GPA 3.2 0.5 -- -0.1 -0.2
8. Somewhat Act 0.5 0.5 -- -0.7***
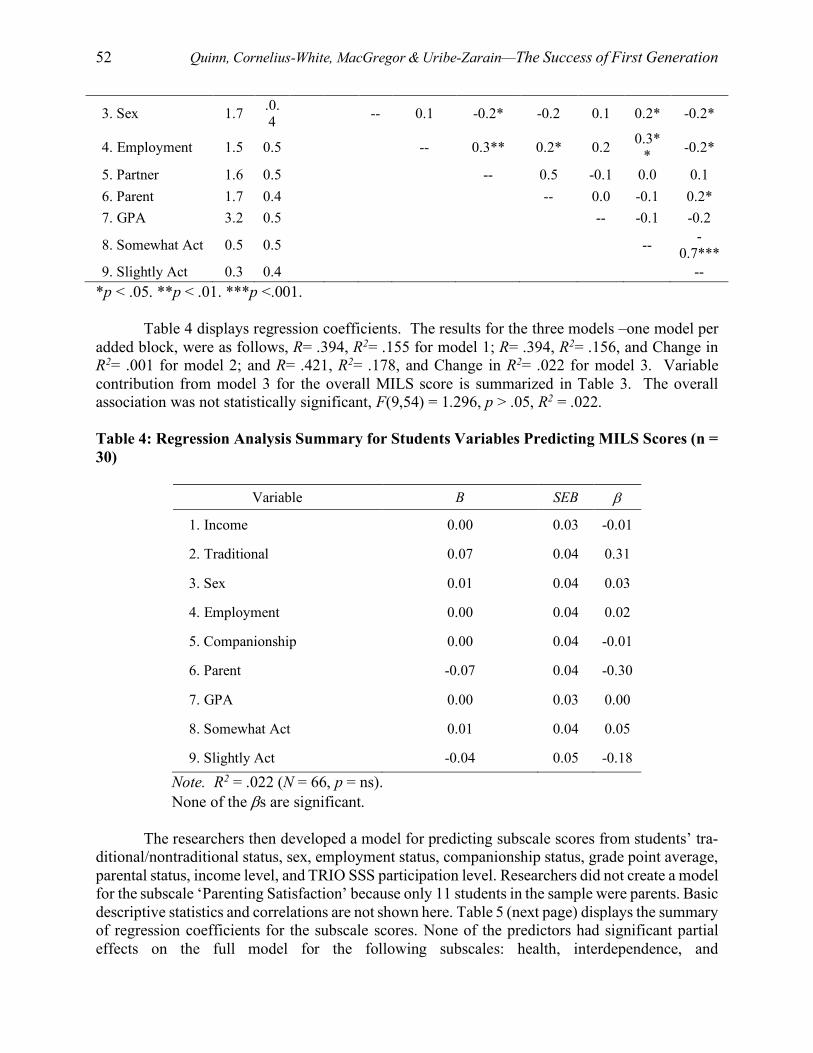
9. Slightly Act 0.3 0.4 -- *p < .05. **p < .01. ***p <.001.
Table 4 displays regression coefficients. The results for the three models –one model per
added block, were as follows, R= .394, R2= .155 for model 1; R= .394, R2= .156, and Change in R2= .001 for model 2; and R= .421, R2= .178, and Change in R2= .022 for model 3. Variable contribution from model 3 for the overall MILS score is summarized in Table 3. The overall association was not statistically significant, F(9,54) = 1.296, p > .05, R2 = .022. Table 4: Regression Analysis Summary for Students Variables Predicting MILS Scores (n = 30)
Variable B SEB b
1. Income 0.00 0.03 -0.01
2. Traditional 0.07 0.04 0.31
3. Sex 0.01 0.04 0.03
4. Employment 0.00 0.04 0.02
5. Companionship 0.00 0.04 -0.01
6. Parent -0.07 0.04 -0.30
7. GPA 0.00 0.03 0.00
8. Somewhat Act 0.01 0.04 0.05
9. Slightly Act -0.04 0.05 -0.18
Note. R2 = .022 (N = 66, p = ns). None of the bs are significant.
The researchers then developed a model for predicting subscale scores from students’ tra-
ditional/nontraditional status, sex, employment status, companionship status, grade point average, parental status, income level, and TRIO SSS participation level. Researchers did not create a model for the subscale ‘Parenting Satisfaction’ because only 11 students in the sample were parents. Basic descriptive statistics and correlations are not shown here. Table 5 (next page) displays the summary of regression coefficients for the subscale scores. None of the predictors had significant partial effects on the full model for the following subscales: health, interdependence, and

Critical Questions in Education 10:1 Winter 2019 53
religion/spirituality. In the case of the self-confidence subscale, the predictor model accounted for 23% of the variance in the subscale score, F(9,54) = 1.83, p > .05, R2 = .23. The model had one significant predictor, parenting. However, the full model was not significant in predicting the sub-scale score. Table 5: Regression Analysis Summary for each Sub-Scale (n = 66)
Subscale n F p R2 Significant predictor variables Health 66 1.397 .213 .189 -
Self Confidence 66 1.831 .084 .234 Parental status
Interdependence 65 1.271 .274 .175 -
Religion/ Spirituality 65 0.709 .698 .107 - The Impact of Load and Power Variables Participant interviews complemented the quantitative analysis and provided a deeper, broader understanding of the phenomenon. The results of the quantitative analysis indicated that margin in life cannot be predicted by the eight demographic variables included in the model, sug-gesting that other factors have greater impact on student’s margin. To understand the development or diminishment of margin, and to discover the nature of variables that contribute to margin, the qualitative portion explored aspects of life that first-generation students identify as power and load variables and their impact. Study participants described the elements of life that they experience as load and power variables; in addition, participants identified life elements that operate simultaneously as load and power variables. Furthermore, participants discussed how elements of life contribute to load and power. A number of recurrent elements emerged from the analysis and merit discussion. Perhaps most notable is the consistent identification of family as both a power and load variable. Table 6 displays all life elements identified by interview participants. Table 6: Power and Load Variables for First-Generation Students
Power Variables Load Variables Both Power and Load Grit (5) TRIO SSS participation (4) Friends (3) University faculty/staff Motherly figures
Finances (4) Balance Grades/Academics General education requirements First-generation status Nontraditional status Work Self-esteem/social engagement Depression/anxiety Cognitive issues Work Small university
Family (6) Financial aid
Note: Parenthetical notations indicate the number of students who identified a variable; variables identified by a single participant do not have parenthetical notation.

54 Quinn, Cornelius-White, MacGregor & Uribe-Zarain—The Success of First Generation
Power Variables
Two primary life elements emerged as power variables for participants—grit and partici-pation in the TRIO SSS program. Several students also identified friends as power variables, though the impact of friendship on margin appeared less influential than that of grit and TRIO SSS participation. Grit. Study participants derived power from grit, which played a meaningful role in their decision to pursue a college education and to persevere when they encounter difficulty. While each student described grit in slightly different ways, it was evident that this characteristic provided power to the students. Duckworth, et al. (2007) described grit as “perseverance and passion for long-term goals” (p. 1087) and “working strenuously toward challenges, maintaining effort and interest over years despite failure, adversity, and plateaus in progress” (p. 1088). Grit had consid-erable impact on participant’s experience.
For Karen, overcoming failure and low expectations of others motivated her. Karen strug-gled to overcome the low expectations of teachers and family during high school. Her family ex-pected her to attend college but expressed doubt that she would finish. For Karen, these low ex-pectations were a self-fulfilling prophecy during early adulthood and she had difficulty attempting and finishing challenging experiences—including military service and an early attempt at college. As she moved through adulthood, she persevered despite adversity and failure. Karen explained:
I’m not doing this for anybody else. I’m doing it for me and I’m going to prove to myself that I am more than…what I was told I was. ‘Cause I’ve always been told that I was a failure…that’s always been tough, but I’m not going to do this to impress her [mom], I’m going to do it for myself.
Karen also described her perseverance and continued interest despite failures. Her unremitting motivation allowed her to overcome the various challenges—including financial strain, depression and anxiety, and family challenges—that she encountered in college. Similarly, James stated that his internal drive for a better life was one of the strongest fac-tors in his decision to enroll and persist in college. As a recovering addict who spent years living on the streets and in prison, James eventually began to envision new options for himself. In James’ words, “I knew there had to be more than what I was allowing myself to be. And so that’s huge motivation for me to be here.” James relied on that motivation to attempt college and to overcome the many challenges he faced during his college experience to achieve what he had always con-sidered valuable—a college degree. Rhonda shared that she had a very strong ability to motivate herself in working toward her degree. Because of a cognitive disability, Rhonda had to maintain a high level of determination in order to overcome academic challenges. When asked what kept her going when faced with such challenges, Rhonda shared, “Oh I have to [keep going]. I have been pursuing this since 2009, going a couple of classes a semester. I couldn’t live with myself if I did that [give up], so I have to continue to the end.” Rhonda shared that continuing through her degree program in spite of her cognitive challenges confirmed her belief in her own personal strength, which she attributed to her unyielding determination to leave college with something positive.
TRIO SSS participation. Students spoke of the consistent support that they received from the TRIO SSS program as another salient source of power. This power derived from both the formal program services offered (specifically priority enrollment and tutoring) as well as the per-sonalized support from TRIO SSS staff members. Priority enrollment, which allows students to

Critical Questions in Education 10:1 Winter 2019 55
enroll for upcoming semesters earlier than most students on campus, helped students to manage school, work, family, household, and other responsibilities. Tutoring also greatly contributed to the power of program participants. Whether they took advantage of tutoring in one subject area, multiple subject areas, or simply found reassurance in the knowledge that tutoring was available, the study revealed a definitive connection between the service and the power it provided for stu-dents.
Participants also indicated that the personal support, encouragement and guidance from the TRIO SSS staff, as well as the ease with which they were able to access staff members was a power variable. For some students, this support helped them to navigate college for the first time. Julie shared, “I had a lot of questions about…college in general, and I liked the fact that I could just run into an office and talk to an advisor anytime.” Similarly, Karen expressed appreciation for the ease of access to staff members who helped her connect with resources, which was often difficult for her. Riley shared that when she arrived on campus she “had no idea about anything.” However, she found that her advisor in TRIO SSS helped her traverse the parts of the college experience that were unfamiliar to her.
In addition to helping orient students to college life, TRIO SSS staff offered students the personal encouragement they often needed. Karen shared:
There’s many a time where I just thought I was going to have to quit college and either [staff member] or [staff member] has been like, “No, just talk about it.” How many times did I sit in [staff member’s] office and cry? Or [staff member] would on Facebook message me, “Hey what’s going on?” And then we’d talk about it and I’d feel better.
Karen expressed gratitude for the staff of TRIO SSS, who often reached out to her when they suspected that she was struggling. In TRIO SSS, she knew that there was a support system wait-ing to help her, that initiated that help when she had difficulty asking for assistance. Hannah’s experiences were similar to Karen’s in that she often turned to the TRIO SSS staff for encouragement when circumstances discouraged her. Describing an experience from the previous year, Hannah shared how the program gave her power:
There was like a week straight I came in there bawling my eyes out every single day. Just not wanting to be here at all, just wanting to pack up all my stuff and leave right then. And they were there for me. And they convinced me to stay.
For James, the program increased his power by helping him make decisions about how to proceed when he encountered academic difficulty. According to James,
If I’m struggling, they tell me my options. It’s huge in helping me decide because for the longest time I had trouble making decisions for myself. So having them lay it out there for me like that, helps me to make the decisions.
Kaleb also shared that TRIO SSS increased his power through offering support and advice. He felt that the friendliness of the staff members and the various resources provided by the program all combined to increase his power. For Kaleb, his experience in TRIO SSS was “…like having a second family.”

56 Quinn, Cornelius-White, MacGregor & Uribe-Zarain—The Success of First Generation
Load Variables
Participant’s description of load revealed a broader and more varied experience of load variables than power variables. However, finances emerged as a common load variable for partic-ipants. When asked to discuss load variables, Karen and James reported financial burden as their most pressing concern. Both students reported that being able to work enough hours to meet fi-nancial obligations while maintaining full-time class schedules was a significant challenge. Karen reported that on several occasions she felt as though she needed to stop or drop out of school in order to work more hours. She also reported that at times she had to work multiple jobs while maintaining her full-time school schedule.
Similarly, James reported that financial responsibility was the biggest load variable that he carried. James reported working one full-time job in addition to a part-time job in order to survive financially. The financial aspect of his college experience often led to stress, lack of sleep, and even depression. According to James, who also relied on friends and public transportation because he could not afford a vehicle, financial burden was a daily struggle.
Julie and Rhonda also expressed financial burden as a common source of stress. For Julie, who worked sporadically for herself in a seasonal business, the pressure from her spouse to gen-erate more income affected her college experience. For Rhonda, the financial burden came in the form of difficulty with the appropriate application of benefits from Vocational Rehabilitation. As a result, Rhonda often spent unnecessary time and effort contacting Vocational Rehabilitation su-pervisors and on several occasions had to shoulder the financial responsibility for her tuition, re-sulting in financial strain.
Variables Operating as both Power and Load
The study also explored variables that operate as both power and load. Analysis revealed antithetical manifestations of family as it influenced student’s college experience. Student descrip-tions of the family impact on their education included describing the demands of family as a “tug of war” (Hannah), and explaining the high expectations of family members as a “hardcore dicta-torship” (Abbie), while at the same time students often shared that the support of family was what kept them going. Participants consistently revealed that family simultaneously operated as both power and load variables. Family as a power variable. Family exemplified support for participants in various ways. For Kaleb, Riley, and Hannah, family power evidenced itself in specific family members. While the ways in which family members served as power variables differed among participants, students consistently described family members who encouraged them to pursue college, and provided on-going support for their academic endeavors. Participants rarely articulated behaviorally specific ways in which family members contributed to their power; rather, they generalized family mem-bers as vital sources of support and encouragement. Familial pride was the singular area that emerged consistently as an element of family sup-port for the first-generation participants. Though family pride came from a variety of family mem-bers (parents, extended family, siblings, and children), participants described familial pride as req-uisite to their success, and therefore a power variable. Karen shared that her children’s pride in her was her main source of power, stating, “…they’re so supportive of me, and always…letting me know they’re proud of me…that’s a huge plus for me.”
Family as a load variable. Participants also frequently identified specific family members who contributed to their load. Karen, Riley, and Kaleb identified specific family members who

Critical Questions in Education 10:1 Winter 2019 57
contributed to their load through various circumstances, while Julie and Hannah described family members who lacked understanding of the demands of pursuing a college degree. In most in-stances, the lack of understanding stemmed from a family member who was not college-educated. For Julie and Karen, an unsupportive significant other proved a difficult barrier. Julie’s spouse did not understand the amount of time that she dedicated to schoolwork, especially because it affected the amount of time that she was able to work and, therefore, provide income for the family. Simi-larly, Karen expressed a lack of understanding on the part of her significant other, stating
I don’t think sometimes that [he] completely understands what I’m doing or why I’m doing it. I think he thinks I’m just getting a degree but doesn’t realize I’m working toward my future so that kind of stresses me out. And brings me down.
Role expectations within the family also surfaced as a common familial difficulty. For Julie,
the role of mom meant that she carried the majority of the responsibility for the household. She stated, “I’m the person who runs everything so if I’m not there everything falls apart, so I feel like I try to put school first but it’s hard whenever you are the sole everything.” Julie felt that her parental role detracted from her ability to concentrate on school. Julie also reported that her hus-band was unwilling to take on additional responsibilities within the household because he was the primary income-earner.
Karen also identified her role as a mother as a load variable, although her experience of motherhood and higher education was somewhat different from Julie’s experience. For Karen, the difficulty stemmed from missing time that she would otherwise spend with her children if she were not pursuing a degree. According to Karen,
As far as the kids…they’re my motivation but then sometimes it becomes a load variable because I’m not getting to spend that time with them and I miss the time with them. And I feel like “Am I doing the right thing by being away from them so much?”
Karen often struggled because of missing family time for school responsibilities, and worried that her decision to attend college may negatively affect her children.
Discussion
The qualitative analysis demonstrated connections between the extant literature and power and load variables for first-generation students. The varied familial experiences of first-generation college students are well-documented in the literature and mirrored in the experiences of partici-pants who overwhelmingly described family as both load and power variables. For first-generation students, family members are often resistant to their college aspirations (Coffman, 2011; Jehangir et al., 2012) while for others familial support is overbearing (Orbe, 2008). Participant’s description of financial burdens also mirrored the literature, which illustrates the financial difficulties that are often reality for first-generation students (Engle & Tinto, 2008; Mehta et al., 2011). While litera-ture specific to the impact of TRIO SSS on first-generation student experience is limited, a number of studies connect TRIO programs and other similar types of support as exigent to first-generation student success (Banks-Santilli, 2014; Chaney, Muraskin, Cahalan, & Goodwin, 1998; Mahoney, 1998; Petty, 2014).
Conversely, grit, which emerged as a prominent power variable for student participants has little representation within first-generation student research. However, there is ample literature

58 Quinn, Cornelius-White, MacGregor & Uribe-Zarain—The Success of First Generation
regarding grit to make the argument that it is an important facet of success for long-term goals (Abuhassan & Bates, 2015; Bowman, Hill, Denson, & Bronkema, 2015; Duckworth & Gross, 2014). Given the long-term nature of a college education and the emergence of grit as a power variable in this study, it seems reasonable to consider the possession of grit as a variable that im-pacts first-generation student success.
Existing research suggests that many of the demographic variables considered in this study —specifically income, age, family, employment, and academics—influence the experience and success of first-generation students (Choy, 2001; Mehta et al., 2011). However, the model con-taining these variables accounted for a relatively small percentage of the variance in MILS scores among participants, which invokes consideration of the model itself and its lack of predictive power. Fortunately, qualitative findings suggest some rationale for the inability of the model to predict student MILS scores and can supplement our understanding of power, load, and margin for first-generation students.
Limitations of Demographics in Understanding Student Experience The quantitative nature of demographic variables is a limitation to understanding the nature of human experience. While quantitative data describes aspects of participant’s lives, it does not consider the context within which those factors exist or the meaning behind those factors for first-generation students (Merriam, 2009). While the MILS prompts subjective consideration of margin in life by asking individuals to evaluate the level of importance, level of power, and level of load for specific life areas, the reporting of demographic variables is strictly objective in nature. When describing their personal load and power variables, none of the respondents indicated that simply the presence, level, or categorization of a variable accounted for the impact of that variable on their experience; rather, it was the nature of those variables and not simply the presence of them that affected margin. Family emerged most prominently in this observation. There were two demographic questions related to family: the first asked the participant’s companionship status (married/partnered, single, divorced, widowed, or separated) and the second asked if the partici-pant has children under 18 living in the household. While participants often discussed spouses/partners and children, they discussed siblings, parents, and extended family as well. Fur-thermore, even when discussing children and/or spouses or partners, participants indicated that the nature of those relationships concerning their college experience (the expectations, support or lack of support, and level of understanding of family members) was most salient to their margin in life.
When considering the impact of finances and participation in the TRIO SSS program, the same observation persists. While the predictor model considered income level, this was a subjec-tive rating by the participants, who classified their household as low-income or not low-income. However, when discussing the impact of finances on their college experience, participants de-scribed the burden of working part-time, full-time, or multiple jobs while attending school, pres-sure from a spouse to contribute income, and dependence on friends and financial aid sources. While these factors certainly have bearing on a student’s income level, they are also indicative of the complexity of finances as an aspect of first-generation student experience.
Similarly, students classified their level of participation in TRIO SSS by rating themselves as slightly active, somewhat active, or very active. Yet when asked to share how TRIO SSS im-pacted margin, none of the participants suggested that it was simply the amount of exposure to the program that had an impact on them; rather, they discussed the nature of their interactions with the TRIO SSS staff and the specific ways in which they received support from the program. More

Critical Questions in Education 10:1 Winter 2019 59
involvement certainly increases the likelihood of supportive interactions; but alone it does not account for the impact of TRIO SSS participation.
A prominent theme within the qualitative data was participant’s description of grit. Al-though none of the participants used the term grit, many of them discussed their goals, overcoming difficulties, and maintaining focus and dedication to their education. Unlike the other prevalent areas of student experience that emerged in the qualitative data, the predictive model did not in-clude a variable that related to or represented grit.
Alignment of Student Experience with Subscale Categories
Stevenson developed the MILS to represent the aspects of life that contribute to margin, with the subscale categories intended to represent “the totality of human experience” (Stevenson, 1981, p. 223). Each subscale contains evaluative statements about one’s life experience. In de-scribing their load and power variables, participants frequently used language that paralleled the self-confidence subscale. Self-confidence explores relationships with others, cooperation, prob-lem solving, and attitude. Participants also frequently used language that paralleled the interde-pendence subscale. Interdependence explores one’s level of independence, self-direction, goal set-ting, decision-making, and self-control. The analysis indicated that the lived experience of first-generation students aligned most consistently with the self-confidence and interdependence sub-scales categories, while students rarely described aspects of the health, parenting satisfaction, and religiosity/spirituality categories as impactful.
Study Limitations
The participants in the study came from one institution—a relatively small, 4-year univer-
sity located in the rural Midwest. Therefore, the students in this study may not be representative of the larger population of first-generation students in the United States. Results may also differ from those found among other institutions that vary in size, type, and location. These factors may make generalization of the results to other groups difficult.
Sample size is also a limitation. The small sample size resulted from several factors. First, the pool of participants was relatively small, as the TRIO SSS program had 148 students in the program at the time of the study. In addition, the completion rate for the survey instrument was only 44.6%. The low completion rate was in part due to screening out students who were not first-generation. Also problematic was the number of surveys that were attempted but not completed. Seventeen students began the study but did not finish. Unfortunately, demographic data, which placed students in various groups for statistical testing, was at the end of the survey, making im-putation for missing data impossible.
Finally, a limitation of the study was that it only included students currently participating in a TRIO SSS program. As a result, it is unknown whether participants came to college with adequate margin to successfully pursue higher education, or whether participants garnered ade-quate margin through their participation in TRIO SSS. Including first-generation students who were not participating in a TRIO SSS program would have expanded the scope of the study and allowed the researchers to evaluate more adequately the effects of the TRIO SSS program on mar-gin in life.
Several opportunities for future research exist in this area. First, constructing a model to examine the influence of additional factors, such as student motivation and grit, could more fully explain those factors that contribute to margin in life for first-generation students. Second,

60 Quinn, Cornelius-White, MacGregor & Uribe-Zarain—The Success of First Generation
expanding the size of the study to include multiple TRIO SSS programs would provide results that are more representative of first-generation students and TRIO SSS participants as a whole. This would also address the small sample size of this study. Additionally, future research should exam-ine the differences in margin in life between participants in a TRIO SSS program and first-gener-ation students who are not active members of a support program, in order to more sufficiently understand the relationship between participation in TRIO SSS and margin in life of first-genera-tion students. Finally, given that the results of the quantitative analysis indicate that the demo-graphic variables included in the model cannot predict margin in life, it is possible that the quali-tative lens used in this study is more adequate in exploring the issues than the use of quantitative methods.
Implications
The alignment of student experience with the interdependence and self-confidence sub-
scales suggests the salience of these areas to student success. Simultaneously, the lack of alignment between student experience and health, religiosity/spirituality, and parenting satisfaction indicate that these areas have little impact on student’s margin in life. Failure of participants to articulate the impact of three of the five constructs of the MILS scale may indicate that as it relates to the experience of first-generation students, the MILS scale has limited application. Furthermore, study findings suggest that the formulation of margin is more complex than can be understood from demographic variables in isolation. Because of the limited alignment of student experience with three of the subscales and the limited ability to predict MILS scores using demographic variables, practitioners should consider using qualitative methods to explore margin or consider measuring grit.
While there are no other tools designed to measure margin in life as McClusky postured it, measuring grit may be a useful alternative. Students frequently referenced the concept of grit as they described their experiences, and there are close associations between the items on the inter-dependence and self-confidence subscales and both the description of grit and the items on Duck-worth’s Grit Scale. Furthermore, the Grit Scale is simply constructed and easy to administer, while the MILS scale is lengthy and cumbersome.
Qualitative results point to the bidirectional influence of family in the lives of first-gener-ation students. TRIO SSS practitioners are in a unique position to mitigate the load and enhance the power of first-generation students, especially concerning the disparate impact of families. First, to address both the lack of support and understanding on the part of family members and the challenge for students of balancing school and family, practitioners can develop activities that include family participation. Inclusive activities can educate family members on the importance of providing support and how best to provide such support. They can also provide students with methods of balancing the responsibilities of school and family while giving both students and family members a shared experience related to the student’s college pursuit.
Second, TRIO SSS practitioners can capitalize on the close personal nature of their rela-tionships with participants. While TRIO SSS professionals are not exclusively responsible for the power of first-generation students, this study confirms that the program is relevant to student suc-cess. Practitioners should maintain a focus on the development of the relationship between them-selves and individual students. Research from Davis (2010) indicates the necessity of the devel-opment and maintenance of relationships for first-generation students with both faculty and non-faculty staff members. TRIO SSS program structure and activities should maximize the interaction between student and staff through frequent contact, open-door policies, and the use of intrusive

Critical Questions in Education 10:1 Winter 2019 61
advising models. In addition, staff members can seek professional development activities that in-crease their ability to interact positively with first-generation college students, especially for those staff members who were not themselves first-generation college students. Increased understanding of the first-generation student experience will positively contribute to the development of a sup-portive relationship between student and staff.
While this study took place within the confines of a TRIO SSS program, the principles and suggestions reflected here are applicable to any individual professional or other support program working with first-generation college students.
References
Abuhassan, A. & Bates, T. C. (2015). Distinguishing effortful persistence from conscientiousness.
Journal of Individual Differences, 36(4), 205-214. Banks-Santilli, L. (2014). First-generation college students and their pursuit of the American
dream. Journal of Case Studies in Education, 5, 1-32. Bowman, N. A., Hill, P. L., Denson, N., & Bronkema, R. (2015). Keep on truckin’ or stay the
course? Exploring grit dimensions as differential predictors of educational achievement, satisfaction, and intentions. Social Psychological and Personality Science, 6(6), 639-645.
Byrd, K. L., & MacDonald, G. (2005). Defining college readiness from the inside out: First-gen-eration college student perspectives. Community College Review, 33(1), 22-37.
Chaney, B., Muraskin, L.D., Cahalan, M.W., & Goodwin, D. (1998). Helping the progress of dis-advantaged students in higher education: The federal Student Support Services program. Educational Evaluation and Policy Analysis, 20(3), 197-215.
Chaney, B. W. (2010). National evaluation of student support services: Evaluation of student out-comes after six years. (Report No. Ed-03-PO-2561). Washington, DC: U.S. Department of Education: Office of Planning, Evaluation, and Policy Development.
Chen, X. & Simone, S. (2016). Remedial coursetaking at U.S. public 2- and 4-year institutions: Scope, experiences, and outcomes. (NCES 2016-405). Washington, DC: U.S. Department of Education: National Center for Education Statistics.
Choy, S. (2001). Students whose parents did not go to college: Postsecondary access, persistence and attainment (NCES 2001-126). Washington, DC: U.S. Department of Education.
Coffman, S. (2011). A social constructionist view of issues confronting first-generation college students. New Directions for Teaching and Learning, 127, 81-90. doi 10.1002/tl
Cohen, J. (1992). A power primer. Psychological bulletin, 112(1), 155. Council for Opportunity in Education (n.d.). TRIO programs at a glance. Retrieved from
http://www.coenet.us/coe_prod_imis/COE/TRIO/TRIO_Programs/Pro-grams_at_a_Glance/COE/NAV_TRIO/TRIO_Pro-grams_at_a_Glance.aspx?hkey=76fb02cd-137d-4552-b745-c0cda2e641e3
Creswell, J. W. (2014). Research design: Qualitative, quantitative, and mixed methods ap-proaches. Thousand Oaks, CA: Sage
Davis, J. (2010). The first-generation student experience: Implications for campus practice, and strategies for improving persistence and success. Sterling, VA: Stylus.
Duckworth, A. L., Peterson, C., Matthews, M. D., & Kelly, D. R. (2007). Grit: Perseverance and passion for long-term goals. Journal of Personality and Social Psychology, 92(6), 1087-1101. doi: 10.1037/0022-3514.92.6.1087
Duckworth, A. L., & Gross, J. J. (2014). Self-control and grit: Related but separable determinants of success. Current Directions in Psychological Science, 23(5), 319-325.

62 Quinn, Cornelius-White, MacGregor & Uribe-Zarain—The Success of First Generation
Dumais, S. A. (2002). Cultural capital, gender, and school success: The role of habitus. Sociology of Education, 75(1), 44-68.
Dyce, C. M., Albold, C., & Long, D. (2013). Moving from college aspiration to attainment: Learn-ing from one college access program. The High School Journal, 96(2), 152-165. doi: 10.1353/hsj.2013.0004
Engle, J., & Tinto, V. (2008). Moving beyond access: College success for low-income, first-gen-eration students. Washington, DC: The Pell Institute.
Gibbons, M.M, Rhinehart, A., & Hardin, E. (2016). How first-generation college students adjust to college. Journal of College Student Retention, 0(0), 1-23.
Green, S. B. (1991). How many subjects does it take to do a regression analysis. Multivariate Behavioral Research, 26(3), 499-510.
Hanpachern, C., Morgan, G. A., & Griego, O. V. (1998). An extension of the theory of margin: A framework for assessing readiness for change. Human Resource Development Quarterly, 9(4), 339-350.
Higher Education Act of 1965, 4 U.S.C.A § 402-405 (2008). Hudley, C., Moschetti, R., Gonzalez, A., Cho, S. J., Barry, L., & Kelly, M. (2009). College fresh-
men's perceptions of their high school experiences. Journal of Advanced Academics, 20(3), 438-471.
Inkelas, K., Daver, Z., Vogt, K., & Leonard, J. (2007). Living-learning programs and first-gener-ation college students’ academic and social transition to college. Research in Higher Edu-cation, 48(4), 403-434.
Jehangir, R., Williams, R., & Jeske, J. (2012). The influence of multicultural learning communities on the intrapersonal development of first-generation college students. Journal of College Student Development, 53(2), 267-284. doi: 10.1353/csd.2012.0035
Kena, G., Aud, S., Johnson, F., Wang, X., Zhang, J., Rathbun, A., … & Kristapovich, P. (2014). The Condition of Education 2014. (NCES 2014-083). Washington, DC: U.S. Department of Education, National Center for Education Statistics.
Krueger, R. A., & Casey, M. A. (2009). Focus groups: A practical guide for applied research (4th ed.). Thousand Oaks, CA: Sage.
Longwell-Grice, R., Adsitt, N.Z., Mullins, K., & Serrata, W. (2016). The first ones: Three studies on first-generation college students. NACADA Journal, 36(2), 34-46.
Lowery-Hart, R., & Pacheco, G. R. (2011). Understanding the first-generation student experience in higher education through a relational dialectic perspective. New Directions for Teaching and Learning, 127, 55-68.
Mahoney, R. G. (1998). Components of TRIO’s success: How one student support services pro-gram achieved success. The Journal of Negro Education, 67(4), 381-388.
Main, K. (1979). The power-load-margin formula of Howard Y. McClusky as the basis for a model of teaching. Adult Education, 30(1), 19-33.
Mayring, P. (2000). Qualitative content analysis. Forum: Qualitative Social Research, 1(2). Doi: http://dx.doi.org/10.17169/fqs-1.2.1089
McClusky, H.Y. (1963). Course of the adult life span. In W.C. Hallenbeck (Ed.), Psychology of adults (pp. 10-19). Washington, D.C.: Adult Education Association of the U.S.A.
McClusky, H.Y. (1970). A dynamic approach to participation in community development. Journal of Community Development, 1(1), 25-32.
McClusky, H. Y. (1971). Education: Background issues (5247-0012). Washington, DC: White House Conference on Aging.

Critical Questions in Education 10:1 Winter 2019 63
Mehta, S. S., Newbold, J. J., & O’Rourke, M. A. (2011). Why do first-generation students fail? College Student Journal, 45(1), 20-35.
Merriam, S. B. (2009). Qualitative research: A guide to design and implementation. San Fran-ncisco, CA: Jossey-Bass.
Merriam, S. B., & Bierema, L. L. (2014). Adult learning: Linking theory and practice. San Fran-cisco, CA: Jossey-Bass.
Neumeister, K. L. S., & Rinker, J. (2006). An emerging professional identity: Influences on the achievement of high-ability first-generation college females. Journal for the Education of the Gifted, 29(3), 305-338.
Orbe, M. P. (2004). Negotiating multiple identities within multiple frames: An analysis of first-generation college students. Communication Education, 53(2), 131-149. doi: 10.10/03634520410001682401
Orbe, M. P. (2008). Theorizing multidimensional identity negotiation: Reflections on the lived experiences of first-generation college students. New Directions for Child and Adolescent Development, 120, 81-95.
Petty, T. (2014). Motivating first-generation students to academic success and college completion. College Student Journal, 48(2), 257-266.
Pike, G. R., & Kuh, G. D. (2005). First- and second-generation college students: A comparison of their engagement and intellectual development. The Journal of Higher Education, 76(3), 276-300.
Postsecondary National Policy Institute (2016). First-Generation students. Washington, DC. Re-trieved from https://pnpi.org/factsheets/first-generation-students/.
Redford, J., & Hoyer, K.M. (2017). First-generation and continuing-generation college students: A comparison of high school and postsecondary experiences. (NCES 2018009). Washington, DC: National Center for Educational Statistics.
Rendon, L. I. (1993). Validating culturally diverse students: Toward a new model of learning and student development. Innovative Higher Education, 19(1), 33-51.
Rodriguez, R. (1974). Going home again: The new American scholarship boy. The American Scholar, 44(1), 15-28.
Saenz, V. B., Hurtado, S., Barrera, D., Wolf, D., & Yeung, F. (2007). First in my family: A profile of first-generation college students at four-year institutions since 1971. Los Angeles, CA: Higher Education Research Institute.
Stevenson, J. S. (1981). Construction of a scale to measure load, power, and margin in life. Nurs-ing Research, 31(4), 222-225.
Stevenson, J. S. (1994). Update of methodological studies of psychometric properties. Un-published manuscript. Columbus, OH: The Ohio State University.
Terenzini, P. T., Rendon, L. I., Upcraft, M. L., Millar, S. B., Allison, K. W., Gregg, P. L., & Jalomo, R. (1994). The transition to college: Diverse students, diverse stories. Research in Higher Education, 35(1), 57-73.
Tinto, V. (1993). Leaving college: Rethinking the causes and cures of student attrition. Chicago, IL: University of Chicago Press.
U.S. Department of Education (2011). Programs: Student Support Services frequently asked ques-tions. Retrieved from http://www2.ed.gov/programs/triostudsupp/faq.html
U.S. Department of Education (2016). Fast facts report for the Student Support Services program. Washington, DC: Office of Postsecondary Education. Retrieved from https://www2.ed.gov/programs/triostudsupp/resources.html

64 Quinn, Cornelius-White, MacGregor & Uribe-Zarain—The Success of First Generation
VanVoorhis, C. W., & Morgan, B. L. (2007). Understanding power and rules of thumb for deter-mining sample sizes. Tutorials in Quantitative Methods for Psychology, 3(2), 43-50.
Warburton, E. C., Bugarin, R., & Nunez, A. M. (2001). Bridging the gap: Academic preparation and postsecondary success of first-generation students (NCES 2001-153). Washington, DC: U.S. Department of Education, Office of Educational Research and Improvement.
Dory Quinn is an Assistant Professor of social work at Pittsburg State University. Her teaching emphasis is human behavior and professional skills development. She holds a doctorate degree in educational leadership and policy analysis from the University of Missouri, a master’s degree in social work from Missouri State University, and a bachelor’s degree in finance from Missouri State University. Her current research focus includes first-generation college students and after-school programs for low-income youth and families. Jeffrey Cornelius-White is Professor of Counseling at Missouri State University and doctoral faculty in educational leadership and policy analysis at University of Missouri-Columbia. He has published over 100 works related to learner-centered and multicultural issues in K-20 education and psychology. His works include Person-Centered Approaches for Counselors (Sage, 2016) and the Interdisciplinary Handbook of the Person-Centered Approach (Springer, 2013). Jef is currently co-editor of Person-Centered and Experiential Psychotherapies. He enjoys his family, volleyball and cycling. Cynthia J. MacGregor, EdD, professor of educational leadership, is site coordinator for the Mis-souri State University region of the University of Missouri statewide EdD program. Her Bachelor of Science and Master’s degrees in psychology are from Central Missouri State University; her doctorate in educational leadership is from the University of Missouri. She has three decades of experience in a variety of faculty and university leadership roles and extensive research in organ-izational and leadership analysis. Ximena Uribe-Zarain is an assistant professor in the College of Education at Missouri State Uni-versity where she has been a faculty member since 2015. She completed her Ph.D. at the University of Delaware’s School of Education with a specialization in measurement, statistics, and evaluation. She is a generalist. Her work focuses specifically on research methodology and program evalua-tion. Ximena has been teaching college and graduate courses since 2004.