Embed Size (px)
Citation preview

ANRV391-NS59-19 ARI 19 June 2009 15:20
R
E V I E W
S
IN
AD V A
NC
E
The Sudbury NeutrinoObservatoryNick Jelley,1 Arthur B. McDonald,2
and R.G. Hamish Robertson3
1Department of Physics, Oxford University, Oxford OX1 3QR, United Kingdom;email: [email protected] of Physics, Queen’s University, Kingston, Ontario K7L 3N6, Canada;email: [email protected] of Physics and Center for Experimental Nuclear Physics and Astrophysics,University of Washington, Seattle, Washington 98195; email: [email protected]
Annu. Rev. Nucl. Part. Sci. 2009. 59:431–65
The Annual Review of Nuclear and Particle Scienceis online at nucl.annualreviews.org
This article’s doi:10.1146/annurev.nucl.55.090704.151550
Copyright c© 2009 by Annual Reviews.All rights reserved
0163-8998/09/1123-0431$20.00
Key Words
solar neutrino, neutrino oscillation, heavy water, Cherenkov detector
AbstractThe solar neutrino problem arose when the first measurements of the fluxof neutrinos from the Sun, taken by Raymond Davis, Jr. with a Cl-Ar radio-chemical detector, fell substantially below the value predicted theoreticallyby John Bahcall. Bahcall’s prediction came from a detailed model of the nu-clear reactions powering the Sun. Resolution of the problem came threedecades later with the observation of nonelectron flavors of neutrinos in thesolar flux. The use of heavy water in the Sudbury Neutrino Observatory(SNO) experiment provided a means to measure both electron and nonelec-tron components, and the presence of the latter showed that neutrino flavorconversion was taking place—a hallmark of neutrino oscillation and mass.The solar models were vindicated, and the Standard Model of elementaryparticles and fields had to be revised. Here we present an account of theSNO project, its conclusions to date, and its ongoing analysis.
431

ANRV391-NS59-19 ARI 19 June 2009 15:20
Contents
1. INTRODUCTION . . . . . . . . . . . . . . . . . . . . . . . . . . . . . . . . . . . . . . . . . . . . . . . . . . . . . . . . . . . . 4322. THE SOLAR NEUTRINO PROBLEM . . . . . . . . . . . . . . . . . . . . . . . . . . . . . . . . . . . . . . . . 4333. PARTICLE PHYSICS SOLUTIONS . . . . . . . . . . . . . . . . . . . . . . . . . . . . . . . . . . . . . . . . . . . 4364. PHYSICS CAPABILITIES OF THE SUDBURY
NEUTRINO OBSERVATORY. . . . . . . . . . . . . . . . . . . . . . . . . . . . . . . . . . . . . . . . . . . . . . . . . 4385. THE DEVELOPMENT OF THE SUDBURY NEUTRINO OBSERVATORY . . 4406. THE DESIGN AND CONSTRUCTION OF THE SUDBURY
NEUTRINO OBSERVATORY. . . . . . . . . . . . . . . . . . . . . . . . . . . . . . . . . . . . . . . . . . . . . . . . . 4416.1. Photomultiplier Tubes . . . . . . . . . . . . . . . . . . . . . . . . . . . . . . . . . . . . . . . . . . . . . . . . . . . . . . 4416.2. Electronics and Data Acquisition . . . . . . . . . . . . . . . . . . . . . . . . . . . . . . . . . . . . . . . . . . . . 4436.3. Acrylic Vessel . . . . . . . . . . . . . . . . . . . . . . . . . . . . . . . . . . . . . . . . . . . . . . . . . . . . . . . . . . . . . . 4436.4. Water Systems . . . . . . . . . . . . . . . . . . . . . . . . . . . . . . . . . . . . . . . . . . . . . . . . . . . . . . . . . . . . . 4436.5. Radioactivity Control and Measurement . . . . . . . . . . . . . . . . . . . . . . . . . . . . . . . . . . . . . 4446.6. Calibration Sources . . . . . . . . . . . . . . . . . . . . . . . . . . . . . . . . . . . . . . . . . . . . . . . . . . . . . . . . . 445
7. GENERAL DESCRIPTION OF ANALYSIS . . . . . . . . . . . . . . . . . . . . . . . . . . . . . . . . . . . . 4457.1. Analysis and Simulation Code . . . . . . . . . . . . . . . . . . . . . . . . . . . . . . . . . . . . . . . . . . . . . . . 4457.2. Distributions of Events from the Three Neutrino Reactions . . . . . . . . . . . . . . . . . . 4467.3. Removal of Instrumental Background Events . . . . . . . . . . . . . . . . . . . . . . . . . . . . . . . . 448
8. SOLAR NEUTRINOS . . . . . . . . . . . . . . . . . . . . . . . . . . . . . . . . . . . . . . . . . . . . . . . . . . . . . . . . . 4488.1. Phase One: Pure Heavy Water . . . . . . . . . . . . . . . . . . . . . . . . . . . . . . . . . . . . . . . . . . . . . . 4488.2. Phase Two: Salt Added to Heavy Water . . . . . . . . . . . . . . . . . . . . . . . . . . . . . . . . . . . . . . 4518.3. Phase Three: Neutral-Current Detection Array . . . . . . . . . . . . . . . . . . . . . . . . . . . . . . 455
9. OTHER PHYSICS . . . . . . . . . . . . . . . . . . . . . . . . . . . . . . . . . . . . . . . . . . . . . . . . . . . . . . . . . . . . . 4609.1. Supernova and Relic Neutrinos . . . . . . . . . . . . . . . . . . . . . . . . . . . . . . . . . . . . . . . . . . . . . 4609.2. Solar hep Neutrinos . . . . . . . . . . . . . . . . . . . . . . . . . . . . . . . . . . . . . . . . . . . . . . . . . . . . . . . . . 4619.3. Constraints on Nucleon Decay via “Invisible” Modes . . . . . . . . . . . . . . . . . . . . . . . . . 4619.4. A Search for Periodicities in the 8B Solar Neutrino Flux . . . . . . . . . . . . . . . . . . . . . . 4619.5. Antineutrino and Fractionally Charged Particle Searches . . . . . . . . . . . . . . . . . . . . . 4629.6. The Cosmic Ray– and Neutrino-Induced Muon Flux at the
Sudbury Neutrino Observatory. . . . . . . . . . . . . . . . . . . . . . . . . . . . . . . . . . . . . . . . . . . . . . . 46210. CONCLUSIONS . . . . . . . . . . . . . . . . . . . . . . . . . . . . . . . . . . . . . . . . . . . . . . . . . . . . . . . . . . . . . 462
1. INTRODUCTION
The Sudbury Neutrino Observatory (SNO) was designed to make a definitive measurement ofsolar neutrinos, clearly determining whether they change from one type to another, by usingheavy water as a target. This measurement was motivated by the measurements taken by Davisand coworkers (1), which indicated that fluxes of electron neutrinos from the Sun were lower thanhad been calculated by the comprehensive solar models (2) developed by Bahcall and others (3).This discrepancy had come to be known as the solar neutrino problem. The advantages of usingheavy water in this measurement were described in a seminal paper by Herbert Chen (4). Chenand George Ewan acted as cospokesmen for the SNO collaboration after it was founded in 1984.
Deuterium provides the opportunity to observe two reactions for solar neutrinos: the charged-current (CC) reaction, which is specific to electron neutrinos at solar neutrino energies, and the
432 Jelley · McDonald · Robertson

ANRV391-NS59-19 ARI 19 June 2009 15:20
neutral-current (NC) reaction, which is equally sensitive to all active neutrino types. By compar-ing the fluxes observed by these two reactions, it is possible to determine (a) whether electronneutrinos produced by one of the nuclear reactions powering the Sun change to other activetypes in transit to the Earth and (b) the total flux of these neutrinos to compare with solar modelcalculations.
To make these measurements, the SNO collaboration built an ultraclean detector containing1000 tonnes1 of heavy water (valued at ∼$300 million), 2 km underground in an active nickel mine,and spent a number of years making observations. This article is the story of this experiment and ofhow it showed that electron neutrinos from the core of the Sun change to other types of neutrino,requiring extensions to the Standard Model of elementary particles and confirming that solarmodels are accurate.
This article describes the extensive work that went into the experiment, ranging from the initialdesign, to a complex construction period, to the commissioning, operation, and removal of theheavy water, and summarizes the analysis of the data. It is the story of a massive experimentaladventure, involving more than 500 people over 24 years, that followed from an inspired idea ofHerb Chen. whose life was tragically ended by leukemia in 1987 before construction started in1990.
2. THE SOLAR NEUTRINO PROBLEM
Solar neutrinos allow the direct study of the nuclear fusion reactions in the Sun that converthydrogen to helium with the release of energy via a series of reactions, summarized by
4p + 2e− → 4He + 2νe + 26.731 MeV.
The primary process of conversion in the Sun is the pp chain of reactions that produces 98% ofall the energy; the CNO cycle contributes only 2%. The neutrino energy spectrum from the ppchain is shown in Figure 1 (5).
The first experiment to observe solar neutrinos was carried out by Davis’s group fromBrookhaven National Laboratory (7). The group used 615 tons of the dry-cleaning fluid per-chloroethylene (C2Cl4), which was located in a laboratory in the Homestake gold mine, to detectthe inverse beta-decay reaction
νe + 37Cl → 37Ar + e− − 0.814 MeV.
The Q-value of the reaction is such that the experiment was sensitive to 7Be, CNO, and, pre-dominantly, the weak 8B branch in the pp chain. A rate of approximately 2 events per day wasexpected, and the first result published in 1968 (7) reported a limit ∼2.5 times smaller thanpredicted.
Although the total number of solar neutrinos is strongly constrained by the Sun’s luminosity,the relative neutrino fluxes in the pp chain are not; in particular, the competition between 3He +3He → 4He + 2p and 3He + 4He → 7Be + γ and between e− + 7Be → 7 Li + νe and p + 7Be →8B + γ determines the energy spectrum of the neutrinos shown in Figure 1. The calculation ofthese fluxes requires a detailed solar model, and at the time the prediction of the 8B flux was made(1968), Bahcall felt that the theoretical uncertainty was sufficient to contradict the idea that theobserved deficit meant “that something fundamental was really wrong” (8).
1One tonne is equivalent to 1000 kg.
www.annualreviews.org • The Sudbury Neutrino Observatory 433

ANRV391-NS59-19 ARI 19 June 2009 15:20
1012
1011
1010
109
108
107
106
105
104
103
102
101
Neu
trin
o flu
x
Neutrino energy (MeV)
pp±1%
7Be
±12%
7Be
±12%
8B
±23%
pep± 2%
hep± 16%
GalliumChlorine
Super-Kamiokande,SNO
0.1 0.3 1 3 10
Figure 1Energy spectra of neutrinos from the pp chain predicted by the Standard Solar Model (6). The neutrinofluxes from continuum sources ( pp and 8B) are given in cm−2 s−1 MeV−1 at 1 AU. The line fluxes ( pep and7Be) are given in cm−2 s−1. The red arrows at the top represent the thresholds of the indicated experiments.The higher-energy 7Be line is just above threshold in the chlorine experiment. CNO neutrinos are omittedfor simplicity. Reproduced from Reference 5 with permission from IOP Publishing, Ltd. and DeutschePhysikalische Gesellschaft.
Over the next decade, both the experiment and the theoretical calculation were refined. By1978, solar neutrinos had been definitely detected (1), but the flux was still about 2.5 times lowerthan the predicted flux (9). Between 1968 and 1978, many effects that might reduce the centraltemperature of the Sun and hence the 8B solar neutrino flux had been considered. One of themore reasonable effects was that the interior of the Sun was essentially devoid of heavy elements.Also, researchers extensively examined the nuclear cross-section measurements relevant to the ppchain, but no explanation for the discrepancy was apparent. The lack of agreement is what becameknown as the solar neutrino problem.
In 1990, the Kamiokande-II 2140-tonne water Cherenkov detector experiment reported (10)that the flux of 8B solar neutrinos, deduced from the number of νe-electron elastic scattering(ES) events above a threshold energy of 7.5 MeV, was 0.44 ± 0.06 that of the Standard SolarModel (SSM) (11). This result confirmed the deficit of solar neutrinos observed by the Homestakeexperiment and also showed that the neutrinos came from the Sun. However, comparing the rates
434 Jelley · McDonald · Robertson

ANRV391-NS59-19 ARI 19 June 2009 15:20
7Be8Bpp, pepCNO
Experiment
Theory2.55±0.25
ChlorineE > 0.8 MeV
Water CherenkovE > 7.5 MeV
GalliumE > 0.2 MeV
a b c
9.3+1.2–1.4
0.44±0.06
79±12
69±13
1.0+0.14–0.17
137+8–7
Figure 2Comparison of the measured rates with the Standard Solar Model predictions for the (a) chlorine, (b) waterCherenkov, and (c) gallium solar neutrino experiments. Reproduced from Reference 11 with permissionfrom the AAS.
of the water Cherenkov and chlorine experiments implied a negative contribution from the pep,CNO, and 7Be neutrinos to the chlorine experiment. Bahcall termed this apparent incompatibilitythe second solar neutrino problem (11).
In the early 1990s, further experimental confirmation of a deficit in solar neutrinos camewith the results from the gallium experiments, SAGE (12) and GALLEX (13), that detected theneutrinos from the initial pp chain reaction through the reaction
νe + 71Ga → 71Ge + e− − 0.233 MeV.
The results from the two gallium experiments and from the water Cherenkov and chlorine ex-periments are shown in Figure 2. The mean value of the solar neutrino flux from the galliumexperiments is very close to the flux of pp and pep neutrinos. It also leaves no room for the contri-bution from 7Be neutrinos, an effect termed the third solar neutrino problem (11).
By 1996, there was growing evidence that these problems did not originate with solar models:Even when the fluxes were treated as arbitrary parameters, there was no consistent solution (14, 15).Further confirmation emerged with the excellent agreement found between the predictions of solarmodels and data for helioseismological data on p-mode oscillations that sampled deep into theinterior of the Sun (8). The fractional difference averaged less than 0.1% in the interior when newopacity data and, in particular, helium and heavy element diffusion were included in the SSM.These experimental and theoretical investigations strongly suggested that the answer to the solarneutrino problem(s) lay in the physics of neutrinos.
www.annualreviews.org • The Sudbury Neutrino Observatory 435

ANRV391-NS59-19 ARI 19 June 2009 15:20
3. PARTICLE PHYSICS SOLUTIONS
The idea that the solar neutrino problem might be caused by neutrino oscillations dates to asuggestion made by Pontecorvo in 1967 (16, 17). Originally conceived as νe → ν̄e , the termneutrino oscillations now refers to the flavor evolution in space or time of a neutrino state initiallyprepared in a pure flavor, such as the pure electron flavor that solar fusion reactions produce.Because the Cl-Ar experiment was sensitive only to electron flavor neutrinos, oscillation to anotherflavor would render the neutrinos invisible. At that time, only the electron and muon neutrinoswere known; the third flavor of lepton, tau, was not discovered until 1975 (18). There is nothingin the Standard Model that prohibits neutrinos from being states of mixed flavor: The samephenomenon occurs in quarks. However, for any evolution to occur, neutrinos must also havemass, whereas in the Standard Model they are massless. Evolution of flavor follows when neutrinoswith definite mass are not eigenstates of flavor and vice versa. The two representations are relatedthrough a unitary transformation matrix UMNSP, the Maki–Nakagawa–Sakata–Pontecorvo matrix(19): ⎛
⎜⎝νe
νμ
ντ
⎞⎟⎠ =
⎛⎜⎝
Ue1 Ue2 Ue3
Uμ1 Uμ2 Uμ3
Uτ1 Uτ2 Uτ3
⎞⎟⎠
⎛⎜⎝
ν1
ν2
ν3
⎞⎟⎠ .
The nine elements of the matrix are not all independent. A standard way to recast UMNSP is interms of three mixing angles, θ12, θ13, and θ23, and either one or three phases, depending onwhether neutrinos and antineutrinos are different or identical (20). These phases do not affectsolar neutrino oscillations.
The electron neutrino is given in terms of the mass eigenstates by
νe = Ue1ν1 + Ue2ν2 + Ue3ν3.
If the masses of vi are zero, this relationship between mass and flavor eigenstates stays the sameat all times and positions. However, if the masses are nonzero, then
νe (t) = Ue1e−i E1tν1 + Ue2e−i E2tν2 + Ue3e−i E3tν3,
where E2i = p2 + m2
i and where the state evolves with time or distance. The overall phase isunobservable:
νe (t) = e−i E1t(Ue1ν1 + Ue2e−i (E2−E1)tν2 + · · ·).
When m2i � p2, then E j − Ei = (m2
j −m2i )L
2E, and observable effects depend on mass-squared
differences, neutrino energy, distance, and the matrix elements Uei. For negligibly small θ13, theelectron neutrino survival probability in vacuum is
Pee = 1 − sin2 2θ12 sin2(
1.27�m212 L
E
),
where �m212 = m2
2 −m21 is measured in electronvolts squared, E is the energy in megaelectronvolts,
and L is the distance in meters.Wolfenstein noted in 1978 (21) that in the presence of matter with N scatterers per unit volume,
the forward scattering amplitude fl(0) leads to a neutrino refractive index,
nl = 1 + 2π Np2
fl (0),
436 Jelley · McDonald · Robertson

ANRV391-NS59-19 ARI 19 June 2009 15:20
that is different for the electron flavor than for the other two flavors because of W exchange, whichcan occur only for electron neutrinos interacting with electrons. Then,
ne = 1 + 2π Ne
p2
(√2
GF p2π
+ NC)
,
where GF is the Fermi constant and where the flavor-independent part is indicated by NC (22).For 10-MeV neutrinos, even at the center of the Sun (density ∼156 g cm−3), the refractive indexhardly differs from unity:
ne − 1 � 10−18.
Nevertheless, in matter the neutrino acquires an effective mass that may be significantly differentfrom its rest mass. In 1985, Mikheyev & Smirnov (23) made a revolutionary insight: Dependingon the level order for neutrino masses, the effective masses for propagating neutrinos of differentflavors could become identical at a certain matter density, inducing a resonance-like behavior thatmixes the two states and creates an avoided crossing even if the vacuum mixing angle is very small.Under these conditions, a neutrino that begins as an electron neutrino could emerge as anotherflavor or combination of flavors.
Up to this time (1985), physicists had been reluctant to embrace the neutrino oscillation so-lution because the factor-of-three deficit reported by Davis would have required either maximalmixing of three flavors, very unlike quark mixing, or a particular solution in which the oscillationwavelength was 2 AU (24). Both choices seemed improbable. With the discovery of the Mikheyev–Smirnov–Wolfenstein (MSW) matter-enhancement mechanism, a broad range of solutions withsmall vacuum mixing angles between only two neutrinos suddenly became possible. [Ironically,the solution chosen by nature turned out to have both a large mixing angle (LMA) and MSWenhancement.] The familiar triangle (Figure 3) that delineates the sensitivity of a particular solar
10–4
10–6
10–8
Δm
2 (e
V2 )
sin22θ10–4 10–2 100
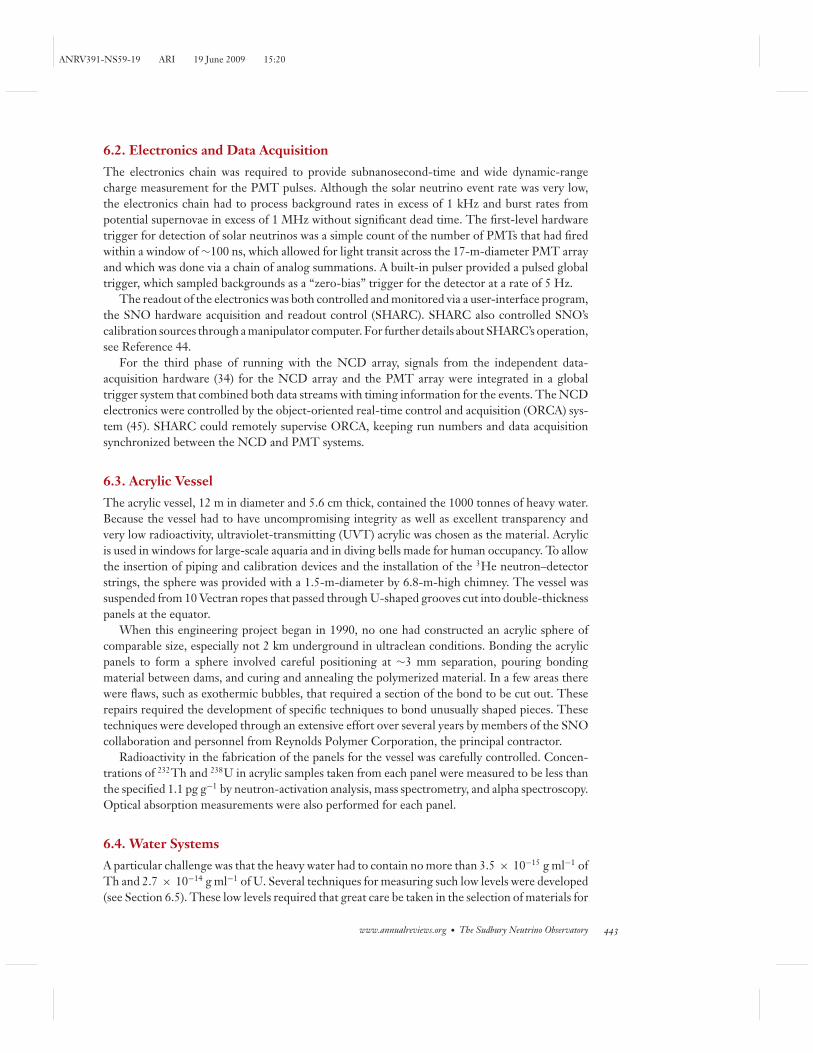
Figure 3MSW-enhanced survival-probability contours in 10% steps in the �m2 − θ plane for the mixing of the ν1and ν2 neutrinos to which the SNO experiment is sensitive (25). The light red shaded area near the bottomis consistent with the Cl-Ar data, the Kamiokande data, and the first data from SAGE (26). Reproduced fromReference 25 with permission from the APS.
www.annualreviews.org • The Sudbury Neutrino Observatory 437

ANRV391-NS59-19 ARI 19 June 2009 15:20
neutrino experiment in the presence of MSW enhancement was calculated for the SNO detectorin 1992 by Balantekin & Loreti (25).
The MSW effect also leads to a marked difference in the flavor content of the solar neutrinoflux between night and day from Earth-regeneration effects for certain regions of the �m2 − θ
plane, as pointed out by Cribier et al. (27) and by Baltz & Weneser (28). For the modern best-fitsolution, the expected day-night asymmetry is only ∼3%, however.
Neutrino oscillation is not the only particle physics solution to the solar neutrino problem tohave been proposed, but given the steadily improving data [particularly those from SNO and theKamLAND reactor experiment (29)], the other theories have fallen into disfavor. Neutrino decay(30) requires an implausibly large coupling constant and does not give solar and reactor neutrinospectra in agreement with observation. Resonant spin-flavor precession (31) is a phenomenonsimilar to the MSW effect, except that the effective mass shift and level crossing are provided bythe Sun’s internal magnetic fields acting on neutrino magnetic moments. Even if this effect werepresent, it is subdominant in view of the good agreement between terrestrial reactor data and solardata. Possible violations of the weak equivalence principle or of Lorentz invariance by neutrinosseem unlikely for the same reason, and quite impressive limits on such violation, of order 10−21,can be set (32).
4. PHYSICS CAPABILITIES OF THE SUDBURYNEUTRINO OBSERVATORY
SNO’s unique physics capabilities arise from the three separate reactions that were used for itsdetection of 8B solar neutrinos,
νe + d → p + p + e− − 1.44 MeV (CC),
νx + d → p + n + νx − 2.22 MeV (NC), and
νx + e− → νx + e− (ES),
where x = e, μ, and τ . The CC reaction on deuterium is sensitive only to electron neutrinos,and it provided an energetic electron that produced Cherenkov light in the heavy water. The NCreaction is equally sensitive to all active neutrino types above threshold. The cross section for theES reaction is smaller than the other reactions and is sensitive to all active neutrino types, with anapproximately sixfold larger sensitivity for electron neutrinos at solar energies. Comparing the fluxof neutrinos observed through the CC reaction to that observed through the ES or NC reactioncould therefore provide evidence for neutrino flavor change, irrespective of the predictions of solarmodels.
The MSW effect (21, 23) can result in neutrinos above a few megaelectronvolts emerging fromthe Sun in essentially pure v2 states, for instance, for oscillation parameters in the LMA region.To the degree to which this statement is true, SNO’s CC/NC ratio, a direct measure of the ve
survival probability, is also a direct measure of |Ue2|2, approximately equal to sin 2θ12.The CC reaction produces an electron with an energy nearly equal to the incoming neutrino,
less the 1.44-MeV Q-value, and therefore provided spectral information. It has a weak directionalsensitivity. The ES reaction produces an electron traveling in nearly the same direction as theincident neutrino but with energies less correlated to those of the incident neutrinos. The NCreaction gives no directional information about the neutrino source, as it produces a free neutronthat is quickly thermalized in the heavy water.
438 Jelley · McDonald · Robertson

ANRV391-NS59-19 ARI 19 June 2009 15:20
150
300
0
Coun
ts p
er b
in NC
Background
CC
Photomultiplier tube hits0 50 100 150
Figure 4The spectrum predicted in 1987 in the Sudbury Neutrino Observatory proposal (33) for the charged-current(CC; red line) and neutral-current (NC; blue line) reactions and for the background with a 8B ve flux of 2 ×106 cm−2 s−2 and a total v flux of 6 × 106 cm−2 s−1. It was assumed that 2.5 tonnes of NaCl would beadded to the 1000 tonnes of heavy water and that the photocathode coverage would be 75%.
In Phase One of SNO’s operation, in which pure heavy water was used, neutron detectionoccurred through capture on the deuterons in the heavy water with the release of a 6.25-MeVgamma ray. The gamma rays Compton-scattered atomic electrons, and the electrons above theCherenkov threshold produced Cherenkov light. In Phase Two, 2 tonnes of NaCl were addedto the heavy water so that the neutrons from the NC reaction were mainly captured on 35Cl,producing a cascade of gammas with a total energy of ∼8.6 MeV. The total capture probabilitywas enhanced, and the pattern of light produced by these gamma cascades was generally moreisotropic than the Cherenkov light cone produced by the single electrons from the CC reaction,enabling the two reactions to be statistically distinguished.
The predicted energy spectrum given in the 1987 SNO proposal (33), which included2.5 tonnes of NaCl added to the 1000 tonnes of heavy water (with 75% photocathode cover-age), is shown in Figure 4. As discussed in Section 8.8 below, the spectrum observed 15 years laterin 2002 was very similar to that originally predicted.
In Phase Three, an array of 3He-filled proportional counters was deployed in pure heavy waterin the central acrylic vessel of the SNO detector (34). This so-called neutral-current detection(NCD) array provided a measure of the number of neutrons from the NC reaction that wasindependent from the light observed by the photomultiplier tubes (PMTs), allowing a separatebut simultaneous measurement of the CC and NC reactions.
In SNO, the energy of an event was calibrated in terms of electron kinetic energy and is termedthe effective kinetic energy, Teff. The threshold for the observation of light from the Cherenkovprocess was limited by radioactive backgrounds to be above Teff ∼ 4 MeV, restricting the solarneutrino measurements to neutrinos from 8B decay and the hep (3He + p → 4He + e+ + νe)reaction. The level of radioactive contamination had to be extremely low, particularly in the heavywater, where levels of less than 3.5 × 10⁻¹⁵ g ml−1 of Th and 2.7 × 10⁻¹⁴ g ml−1 of U wererequired. These levels ensured that the neutron production occurring through photodisintegrationof deuterium was small compared to that from solar neutrino NC interactions.
www.annualreviews.org • The Sudbury Neutrino Observatory 439

ANRV391-NS59-19 ARI 19 June 2009 15:20
The 8B neutrinos were the principal focus: The initial objective was to determine the ratio ofthe flux of electron neutrinos to the flux of all active neutrino types. The data analysis for thesemeasurements is described in detail in Section 8 below. The hep reaction was predicted to have amuch lower flux than the 8B neutrinos, but because hep neutrinos have an end point that extendsseveral megaelectronvolts beyond the end point for 8B neutrinos, it is possible to set a limit ontheir flux with a careful analysis (described in Section 9 below).
SNO’s large target mass, coupled with its very low radioactivity, meant that it was possible to setstringent limits on a number of hypothesized or rare processes, such as neutrinos from a supernova,or limits on the rate for “invisible” nucleon decay. These studies are described in Section 9.
5. THE DEVELOPMENT OF THE SUDBURYNEUTRINO OBSERVATORY
The first collaboration meeting for SNO was held in 1984. It built on efforts begun by Ewanand others (35) to establish an underground laboratory in Canada as well as on ideas from Chen(4, 36) about using heavy water to solve the solar neutrino problem. Previously, T.L. Jenkins ofCase Western University (35) had placed a limit on the solar electron neutrino flux using a smallheavy water detector. Chen’s paper described the possibility of a detector large enough to providea sensitive measurement and the possibility of using the NC reaction on deuterium to observe allneutrino types. Details of the early days of the collaboration can be found in an article by Ewan& Davidson (37), and descriptions of the early designs are contained in References 38 and 39.
The original collaboration included Atomic Energy of Canada Ltd. (Chalk River Labora-tories), Carleton University, Laurentian University, the National Research Council of Canada,Oxford University, Princeton University, Queen’s University, University of California at Irvine,and the University of Guelph. A design for a 1000-tonne heavy water detector was establishedwith research and development funding from government agencies and universities. Following theuntimely death of Chen in 1987, Art McDonald took over as U.S. spokesman, and he was joinedin 1987 by Eugene Beier of the University of Pennsylvania. Los Alamos National Laboratory,Lawrence Berkeley National Laboratory, the University of British Columbia, and Brookhaven Na-tional Laboratory joined the collaboration in 1988–1989. In 1989, McDonald moved to Queen’sUniversity and became director both of the SNO Institute, where he assumed responsibility forthe international project, and of the SNO collaboration. Hamish Robertson became cospokesmanin the United States, and David Sinclair and McDonald served as cospokesmen in Canada. U.K.cospokesmen over the years have included Sinclair, Neil Tanner, David Wark, Nick Jelley, andSteve Biller.
Capital funding from Canada, the United States, and the United Kingdom was obtainedin 1990; thereafter construction began, with the SNO Institute providing oversight and withMonenco, Ltd. providing project management and engineering services. Specific responsibilitieswere assigned to groups of scientists or institutions, with group leaders responsible for parts of thedetector such as laboratory systems, PMTs, PMT support structure (PSUP), electronics, water sys-tems, etc. The international responsibilities were spelled out in a memorandum of understanding,which assigned capital costs and later operating costs for this international experiment.
This project would not have been possible without the strong support and cooperation ofAtomic Energy of Canada Ltd. (AECL), which enabled the loan of 1100 tonnes of heavy waterfrom its reserves with the assistance of Ontario Hydro (now Ontario Power Generation), andINCO Limited (now Vale-INCO), which provided the underground location, only charging in-cremental operations costs. After they were approached by SNO scientists, senior officials of boththese companies became intrigued by the potential for the project, and they were instrumental
440 Jelley · McDonald · Robertson

ANRV391-NS59-19 ARI 19 June 2009 15:20
in convincing their management to provide this assistance. A basic science project of this scalewas very unusual in Canada, and its success depended in large part on strong support from localgovernment officials, universities, and provincial and federal agencies.
The project was international from the outset, with substantial support from U.S. and U.K.funding agencies. Peer review was very important throughout, and the project passed repeatedreviews, culminating in a joint international review of the full project design and capital estimateschaired by Ed Temple of the U.S. Department of Energy in 1989. Subsequent to this meeting, aSNO agency review committee consisting of representatives from the Canadian, U.S., and U.K.funding agencies, senior scientists, and technical experts was established. This committee mettwice per year to review the project and provide advice to the project management and to theagencies. This process worked well and kept all partners informed of the status, successes, andchallenges of the project. Many aspects of the work done to build support for this project beyondpeer review assessment are described in Reference 37.
6. THE DESIGN AND CONSTRUCTION OF THE SUDBURYNEUTRINO OBSERVATORY
Figure 5 shows a schematic drawing of the SNO detector. The detector consisted of 1000 tonnesof ultrapure heavy water (99.917% 2H by mass) contained within a 12-m-diameter, 5.6-cm-thicktransparent acrylic vessel. The heavy water was viewed with the aid of 9438 sensitive PMTs on an18-m-diameter support structure. Highly enriched heavy water was required because the neutron-capture cross section on 1H is 640 times that on 2H, establishing a standard of 99.85% enrichment.The entire cavity outside the acrylic vessel was filled with ultrapure light water.
This large cavity was carefully designed to withstand the enormous stresses in the rock at thisdepth and extensively instrumented to observe the geophysical response following excavation. Theinner surface of the cavity was stabilized by the application of wire screening, fastened far intothe stable rock with cables, covered by a layer of porous “geotextile,” and oversprayed with concreteand a 0.8-cm-thick polyurethane plastic layer designed to reduce the radon permeation from therock by a factor of ∼100,000. The cavity was initially designed as a 20-m-diameter cylinder, butmore advanced modeling indicated that a barrel-shaped design was preferable, enabling a sphericaldetector geometry that was particularly suited to the incorporation of light collectors on the PMTs.However, the SNO logo (see Figure 5), a historical oddity, uses the cylindrical shape in its O.
6.1. Photomultiplier Tubes
The detector’s energy threshold was strongly affected by the radioactivity in the PMT components,which were carefully assayed (40). Because glass was the dominant contributor, Schott Glaswerkeproduced for SNO a new borosilicate glass (Schott 8246), with Th and U impurity levels below40 ppb, using a furnace with a special low-radioactivity liner. After extensive testing (41) of variousPMTs, the Hamamatsu R1408 PMT was selected for use in SNO. This relatively small (20-cm)tube was a manageable size for the thick-walled, mouth-blown Schott 8246 glass envelopes de-signed to resist stress corrosion in ultrapure water under pressure. Tests and calculations alsoshowed that the collapse of a tube did not pose a risk to neighboring tubes or to the acrylic vessel.
The detector contained 9438 inward-facing PMTs, which provided a photocathode coverageof 31%. To improve the light-collection efficiency, a 27-cm-entrance-diameter light concentratorwas mounted on each PMT, increasing the effective photocathode coverage to ∼54% (42). Another91 PMTs without concentrators were mounted facing outward to detect light from muons andother sources in the region exterior to the PSUP. The light concentrators increased the effective
www.annualreviews.org • The Sudbury Neutrino Observatory 441

ANRV391-NS59-19 ARI 19 June 2009 15:20
Figure 5A schematic drawing of the SNO detector, which is located in a 34-m-high by 22-m-diameter barrel-shapedcavity 2039 m below the surface in an active nickel mine owned by Vale-INCO near Sudbury, Ontario,Canada.
area of the photocathode to maximize the number of photons detected and limited the angularacceptance of the photomultipliers so that the detector was viewed by each PMT out to a radius ofonly 7 m. This setup both reduced background and increased the neutrino signal from the D2O.The concentrators were made of 18 curved pieces of thin dielectric-coated aluminum sheet, whoseouter layer of mixed titanium and praseodymium oxides gave good protection in water.
The PSUP was a geodesic sphere that functioned as the main support system and held the panelarrays that housed the PMTs and light concentrators. The PMTs were secured in hexagonal ABS(acrylonitrile butadiene styrene) black plastic housings that also supported the light concentrators(42) for each inward-facing PMT. The PSUP also provided a water and optical barrier betweenthe core of the experiment (the D2O-target and light-collection surfaces) and the outer regionsof the experiment. This barrier shielded the PMTs from light generated in the water surroundingthe PSUP and also functioned as a highly impermeable barrier to any contamination in that water.
All the materials used in the construction of the PSUP were carefully selected to be of lowradioactivity. Originally the design of the PSUP included aluminum, but careful measurements(43) taken at the Lawrence Berkeley Laboratory cyclotron determined that gammas produced bynuclear reactions induced by the inherent alpha radioactivity in aluminum would be unacceptable,requiring a complete change from the original aluminum design to a stainless steel structure.
442 Jelley · McDonald · Robertson
ANRV391-NS59-19 ARI 19 June 2009 15:20
6.2. Electronics and Data Acquisition
The electronics chain was required to provide subnanosecond-time and wide dynamic-rangecharge measurement for the PMT pulses. Although the solar neutrino event rate was very low,the electronics chain had to process background rates in excess of 1 kHz and burst rates frompotential supernovae in excess of 1 MHz without significant dead time. The first-level hardwaretrigger for detection of solar neutrinos was a simple count of the number of PMTs that had firedwithin a window of ∼100 ns, which allowed for light transit across the 17-m-diameter PMT arrayand which was done via a chain of analog summations. A built-in pulser provided a pulsed globaltrigger, which sampled backgrounds as a “zero-bias” trigger for the detector at a rate of 5 Hz.
The readout of the electronics was both controlled and monitored via a user-interface program,the SNO hardware acquisition and readout control (SHARC). SHARC also controlled SNO’scalibration sources through a manipulator computer. For further details about SHARC’s operation,see Reference 44.
For the third phase of running with the NCD array, signals from the independent data-acquisition hardware (34) for the NCD array and the PMT array were integrated in a globaltrigger system that combined both data streams with timing information for the events. The NCDelectronics were controlled by the object-oriented real-time control and acquisition (ORCA) sys-tem (45). SHARC could remotely supervise ORCA, keeping run numbers and data acquisitionsynchronized between the NCD and PMT systems.
6.3. Acrylic Vessel
The acrylic vessel, 12 m in diameter and 5.6 cm thick, contained the 1000 tonnes of heavy water.Because the vessel had to have uncompromising integrity as well as excellent transparency andvery low radioactivity, ultraviolet-transmitting (UVT) acrylic was chosen as the material. Acrylicis used in windows for large-scale aquaria and in diving bells made for human occupancy. To allowthe insertion of piping and calibration devices and the installation of the 3He neutron–detectorstrings, the sphere was provided with a 1.5-m-diameter by 6.8-m-high chimney. The vessel wassuspended from 10 Vectran ropes that passed through U-shaped grooves cut into double-thicknesspanels at the equator.
When this engineering project began in 1990, no one had constructed an acrylic sphere ofcomparable size, especially not 2 km underground in ultraclean conditions. Bonding the acrylicpanels to form a sphere involved careful positioning at ∼3 mm separation, pouring bondingmaterial between dams, and curing and annealing the polymerized material. In a few areas therewere flaws, such as exothermic bubbles, that required a section of the bond to be cut out. Theserepairs required the development of specific techniques to bond unusually shaped pieces. Thesetechniques were developed through an extensive effort over several years by members of the SNOcollaboration and personnel from Reynolds Polymer Corporation, the principal contractor.
Radioactivity in the fabrication of the panels for the vessel was carefully controlled. Concen-trations of 232Th and 238U in acrylic samples taken from each panel were measured to be less thanthe specified 1.1 pg g−1 by neutron-activation analysis, mass spectrometry, and alpha spectroscopy.Optical absorption measurements were also performed for each panel.
6.4. Water Systems
A particular challenge was that the heavy water had to contain no more than 3.5 × 10⁻¹⁵ g ml−1 ofTh and 2.7 × 10⁻¹⁴ g ml−1 of U. Several techniques for measuring such low levels were developed(see Section 6.5). These low levels required that great care be taken in the selection of materials for
www.annualreviews.org • The Sudbury Neutrino Observatory 443

ANRV391-NS59-19 ARI 19 June 2009 15:20
the water systems, in particular for the O-rings, circular gaskets used in sealing the pipes. Initiallyurethane was chosen, but the radon permeation was far too high. This serious problem was solvedonly when the O-ring composition was changed to butyl rubber.
There were two water systems at SNO: one for the ultrapure light water (H2O) and one for theheavy water (D2O). These systems were located underground, near the detector. For the H2O,potable water for the mine was pretreated with filters, then purified through use of charcoal filtersand the addition of EDTA to complex various ion species before passing through a large reverse-osmosis unit. The water then entered a UV unit, where any remaining organic compounds weredissociated, before flowing through ion-exchange units.
A degassser reduced the levels of oxygen and radon in the water, so as not to support biologicalactivity as well as to minimize radioactivity. During the filling of the detector, it was discovered thatdegassed water compromised the breakdown voltage of the PMT connectors. This was causedby diffusion of air out of the PMT high-voltage connectors into the degassed water. To avoidthis serious problem, the water was regassed with pure N2 using a gas permeable–membraneunit. Finally, a chiller cooled the water to 10◦ C before it went into the cavity. The H2O wascontinuously circulated to remove ions, organic materials, and suspended solids.
The source of the D2O was the Ontario Power Generation’s Bruce Heavy Water Plant besideLake Huron. The 1100 tonnes of heavy water from AECL were exchanged with D2O from OntarioPower Generation that had been extracted directly from the lake and had very low tritium content.The heavy water was first passed through ion-exchange columns to reduce its ionic content, inparticular its K content, before it went into the acrylic vessel. After the SNO detector was filled, theD2O was recirculated to maintain its purity, and it was regularly assayed to measure its radioactivity.
To purify the NaCl before it was added to the heavy water for Phase Two, a small purificationplant that included both MnOx and HTiO filters was built. To take the NaCl out of the water afterthe second phase of SNO running, the heavy water was passed through reverse-osmosis units toreduce the concentration of NaCl to a few parts per million.
6.5. Radioactivity Control and Measurement
Minimizing background events required a high intrinsic radioactive purity of materials. This wasaddressed at the time of material selection by measuring the activity of samples from all detec-tor materials. Low-background gamma-ray counting and neutron-activation analysis were usedextensively for such measurements. Extensive measurements of leach rates and radon emanationwere carried out for all critical materials. To prevent radon (at a concentration of 3 pCi liter−1 inthe laboratory air) from getting into the D2O and H2O, a cover gas system provided nitrogen gasthat functioned as a physical barrier between the water and the radon-rich laboratory air.
Contamination with radon, Th, and U was of particular concern because gamma rays withenergy greater than 2.2 MeV can photodisintegrate deuterium, and the neutron thus producedwould be indistinguishable from a neutron produced through the NC interaction of solar neutri-nos. The expected NC neutron-production rate based on solar models was ∼14 per day. To makeneutrons from photodisintegration tractable, the radioactivity requirements on the levels of Thand U chain nuclei in the heavy water were set so that each did not give rise to more than oneneutron per day. These settings gave limits of 3.5 × 10⁻¹⁵ g ml−1 of 232Th and 2.7 × 10⁻¹⁴ g 238
ml−1 of U. The requirement for the light water surrounding the heavy water was less stringent,with upper limits of 3.5 × 10⁻¹⁴ g ml−1 of 232Th and of 4.1 × 10⁻¹³ g ml−1 of 238U.
The nuclei in the Th and U chains that emit gamma rays with energies greater than 2.2 MeVare 208Tl and 214Bi, respectively. The isotope 208Tl is supported by the radium isotope 224Ra,whereas 214Bi is supported by 226Ra and 222Rn. Three ex situ techniques were developed to assay
444 Jelley · McDonald · Robertson

ANRV391-NS59-19 ARI 19 June 2009 15:20
the precursor radioisotopes of 208Tl and 214Bi in the D2O and H2O. The decays of the parent Rnand Ra isotopes were counted in systems external to the SNO detector (46–48).
During neutrino data taking, an in situ method based on the Cherenkov light produced bythe radioactivity in the water was developed to assay 208Tl and 214Bi. The Cherenkov light in theanalysis window ∼4.0 ≤ Teff ≤ 4.5 MeV effective electron kinetic energy is dominated by that fromthe beta-gamma decay of 208Tl and the beta decay of 214Bi. The anisotropies of the Cherenkovlight from these decays are different: The Cherenkov light from 208Tl is more isotropic than thatfrom 214Bi. The different hit patterns of 214Bi and 208Tl events allowed the distribution of eventisotropy (characterized in Phase One by the mean angle between PMT pairs, θ ij) to be used tostatistically separate the 208Tl and 214Bi decays. The parameter θ ij was calculated by taking theaverage angle relative to the reconstructed event vertex for all hit PMT pairs. In Phases Two andThree, the event isotropy was characterized by a function of θ ij, β14 (see Section 8.7 below).
6.6. Calibration Sources
A general-purpose manipulator was developed to provide deployment of calibration sources ataccurately known off-axis positions in two orthogonal planes in the D2O. A 16N source (49)provided a 6.13-MeV gamma ray following its beta decay, allowing these gammas to be used as aprimary energy calibration by triggering on the beta. Both electrons from a 8Li source (50) and19.8-MeV gammas, produced with a small accelerator via the 3H( p, γ ) 4He reaction, were usedto verify the energy scale for higher-energy electrons.
To determine the principal optical properties of the detector, a so-called laser ball source (51)was used to diffuse the laser light from an external pulsed nitrogen laser or dye laser at wavelengthsranging from 337 to 620 nm. Electronic pulsers were regularly used to define the characteristicsof the signal-processing electronic circuits and the data-acquisition systems.
To calibrate the neutron response, sources of 252Cf encapsulated in acrylic were employed, aswere 241AmBe sources. For the third phase, a distributed source of 24Na was used to measurethe neutron response and efficiency of the NCD array. The 2.754-MeV gammas from neutron-activated NaCl dissolved in the heavy water photodisintegrated deuterium and created a nearlyuniform and homogeneous source of neutrons.
Measured amounts (spikes) of 222Rn were added to both the heavy water and the light water.The resulting data, together with those from sources of 238U and 232Th, were used to simulate thesignals coming from trace radioactive contamination. For all the point sources, multiple layers ofacrylic encapsulation were used to ensure that no trace amount of radioactivity could be introducedduring the source deployment.
7. GENERAL DESCRIPTION OF ANALYSIS
Data processing began with the calibration of the raw data and the conversion of analog-to-digitalconverter values into PMT charges and times. The calibrated charges and times were used toreconstruct each event’s position and direction and to estimate event energy. At later stages of thedata processing, cuts were applied to the data set to remove as many background events as possiblewithout rejecting a substantial number of neutrino signal events. A similar procedure was used forthe data from the NCD array (34), and the calibrated charges from the NCD array were used toestimate the event energy.
7.1. Analysis and Simulation Code
The off-line software is required to perform two major functions: (a) analysis of SNO data and(b) detailed and complete simulation by Monte Carlo techniques of all significant signals and
www.annualreviews.org • The Sudbury Neutrino Observatory 445

ANRV391-NS59-19 ARI 19 June 2009 15:20
backgrounds that employs as accurate a model of the detector and its response as possible. Bothof these functions were combined in the SNO Monte Carlo and analysis code (SNOMAN).
SNOMAN consists of a set of largely autonomous processors written primarily in FORTRAN.These processors communicate through a central data structure managed by the CERNLIB pack-age ZEBRA (52). ZEBRA is also the basis for the management of banks of data, known as titles.Title-management routines in SNOMAN ensure that as successive events are analyzed the con-stants describing the detector response are appropriate for that time and detector configuration.A more detailed description is given in Reference 44.
In addition to SNOMAN, there is another major off-line analysis tool: the SNO database(SNODB), which is based on the CERNLIB package HEPDB. SNODB is a distributed master-slave database that runs collaboration-wide via PERL installation and management scripts.Other analysis tools include (a) QSNO, which provides interfaces to ROOT analysis platforms;(b) QPhysics, which is a platform for MSW mixing analysis; and (c) various signal-extraction pack-ages that extract the three neutrino-interaction rates using extended maximum-likelihood fits tothe data.
7.2. Distributions of Events from the Three Neutrino Reactions
The light detected by the PMTs was used in the first two phases of the experiment to determinethe rates of events observed from the three reactions (CC, NC, and ES). In the third phase, thisinformation was supplemented by the events detected by the NCD array, which provided theprimary information for the NC reaction. Each observed event was reconstructed to obtain infor-mation about the energy, location, time, and direction (where relevant) of the event. Informationfrom calibration sources was also used to estimate systematic uncertainties in the reconstructedquantities. The full set of available information was used to provide a statistical separation of theevents from the three reactions by performing a generalized maximum-likelihood fit to the arrayof events.
As an example, Figure 6 shows simulated probability density functions (pdfs) for each of thesignals for Phase One, which used pure D2O. The energy distributions for each of the three signalsare shown in Figure 6a. The strong correlation between the electron energy and the incidentneutrino energy for the CC interaction produces a spectrum that resembles the initial 8B neutrinospectrum, whereas the recoil spectrum for the ES reaction is much softer. Within the smearing ofthe Compton-scattering process and the resolution of the detector, the NC reaction produces whatis essentially a line spectrum because the gamma produced by the neutron capture on deuteriumalways has an energy of 6.25 MeV.
The distributions of reconstructed event positions (R/RAV)3, normalized to the radius of theacrylic vessel, RAV, are shown in Figure 6b. The CC reaction, which occurs only on deuterons,produces events distributed uniformly within the heavy water, whereas the ES reaction, whichcan occur on any electron, produces events distributed uniformly well beyond the heavy watervolume. The small leakage of events just outside the heavy water volume (just outside (R/RAV)3 =1) for the CC reaction is due to the resolution tail of the reconstruction algorithm.
The NC signal does not have a uniform distribution inside the heavy water, but instead itdecreases monotonically from the central region to the edge of the acrylic vessel. The reason forthis nonuniform distribution is the long (∼120-cm) diffusion length for thermal neutrons in D2O,which results in a significant fraction of the neutrons being captured on hydrogen in the acrylic orin the surrounding light water. For the second phase of the project, the distribution of NC eventswas much flatter until close to RAV because the capture on 35Cl dominated the events comparedto leakage into the acrylic and H2O.
446 Jelley · McDonald · Robertson

ANRV391-NS59-19 ARI 19 June 2009 15:20
0
0.025
0.050
0.075
0.100
5 10 15 5 10 15 5 10 150
0.05
0.10
0.15
0
0.05
0.10
0.15
0.20
0
0.025
0.050
0.075
0.100
0
0.02
0.04
0.06
0
0.05
0.10
0.15
0
0.02
0.04
–1 0 1 –1 0 1 –1 0 10
0.2
0.4
CC
a
b
c
ES NC
T (MeV)
0 0.5 1.0 1.5 0 0.5 1.0 1.5 0 0.5 1.0 1.5
(R/RAV)3
cosθ☉
Prob
abili
ty p
er b
in
0
0.01
0.02
0.03
0.04
Figure 6The (a) energy, (b) radial, and (c) directional distributions used to build probability density distributions to fitthe SNO signal data. Abbreviations: T, the kinetic energy of the electron from the charged-current (CC) orelastic scattering (ES) reactions or from the gamma interaction following neutron capture; NC, neutral-current reactions; R/RAV, the reconstructed event radius normalized to the 600-cm radius of the acrylicvessel.
Figure 6c shows the reconstructed direction distribution of the events. The peaking of the ESreaction clearly points away from the Sun, and the 1 − 1
3 cos θSun distribution of the CC reactionis also apparent. The NC reaction shows no correlation with the solar direction: The gamma rayfrom the captured neutron carries no directional information about the incident neutrino.
The NC-labeled distributions in Figure 6 represent equally well the detector response to anyneutrons, not just those produced by NC interactions, as long as the neutrons are distributed uni-formly in the detector. An example is neutrons produced through photodisintegration by gammarays emitted by radioactivity in the D2O. Such neutrons are an irreducible background in the dataanalysis and were kept small compared to the NC events through careful selection and purifi-cation of detector materials. Techniques were developed for the accurate determination of thisbackground of neutron events from photodisintegration of deuterium (see Section 6.5).
www.annualreviews.org • The Sudbury Neutrino Observatory 447

ANRV391-NS59-19 ARI 19 June 2009 15:20
7.3. Removal of Instrumental Background Events
In addition to neutrino interactions, cosmic rays, and radioactive decays, the SNO detector alsocollected and recorded many instrumental background events produced by the detector itself.Because of these events’ much higher frequency, a high rejection fraction was needed to ensurethey did not contaminate the final data sample. The removal of these instrumental backgroundevents by various cuts defined to separate the instrumental events on the basis of a variety ofcharacteristics is described in Reference 53.
Because it was not feasible to model every possible non-Cherenkov background source, it wasnecessary to develop a method that could determine the background level irrespective of its source.The method adopted for this analysis combined cuts in what is sometimes referred to as a bifurcatedanalysis. For the final Phase One data set, this technique revealed that the overall contaminationhad a 95%–confidence level upper limit of ≤3 events. For further details, see Reference 53.
In the third phase, instrumental backgrounds in the NCD array such as bursts, oscillatoryevents caused by electromagnetic transients, “fork” events caused by microdischarge in insulators(mainly near the tops of the delay lines), and blank digitizer traces were removed from the datawith cuts that permitted an evaluation of the signal loss and residual background. For furtherdetails, see Reference 34.
8. SOLAR NEUTRINOS
8.1. Phase One: Pure Heavy Water
The first operation of the detector utilized pure heavy water as the central detection medium. Inthis phase, neutron detection occurred through capture on the deuterons in the heavy water withthe release of a 6.25-MeV gamma ray. The gamma ray Compton-scattered atomic electrons, andthe electrons above the Cherenkov threshold produced Cherenkov light.
Operation began with the empty detector and continued as the levels of heavy water and lightwater were raised together to minimize the stress on the acrylic vessel over a period of more thannine months. The rate was defined primarily by the shipment schedule of the heavy water to thedetector site. This enabled electronic systems to be commissioned and allowed some problems tobe corrected, such as the high-voltage-connector problem discussed above.
8.1.2. Data. Full operation with pure heavy water began on November 2, 1999 and ended onMay 31, 2001, for a total of 306.4 live days of neutrino data taking. The many days of calibrationcorresponded to ∼10% of the running time. The energy scale and response were determinedprimarily with the 16N source, together with the other calibration sources described in Section 6.6.The neutron-capture efficiency was measured by deploying a 252Cf source at various positionsthroughout the heavy water volume. These point-source calibrations were employed, togetherwith Monte Carlo simulation and an analytic diffusion model, to extract the neutron-detectionefficiency and its uncertainty. For a threshold of Teff = 5 MeV and a fiducial volume defined byR ≤ 550 cm, the measured neutron-capture efficiency value was 0.1438 ± 0.0053.
8.1.3. Analysis procedure. To prevent the introduction of statistical bias while cuts were opti-mized, the data set was divided into two separate sets: an “open” data set, to which all analysisprocedures and methods were applied, and a “blind” data set, upon which no analysis within thesignal region (between 40 and 200 hit phototubes) was performed until the full analysis program
448 Jelley · McDonald · Robertson

ANRV391-NS59-19 ARI 19 June 2009 15:20
Even
ts p
er 0
.5 M
eV
0
100
200
300
400
500
600
ES
CC
Data
NC and bkgd neutrons
bkgd
Teff (MeV)
5 6 7 8 9 10 11 12 13 � 20
Figure 7Kinetic energy spectrum for Rfit ≤ 550 cm and Teff ≥ 5 MeV (brown data points). Also shown are the MonteCarlo predictions for charged-current (CC; red lines), elastic scattering (ES; purple lines), and neutral current(NC) and background (bkgd) neutron events (blue lines) scaled to the fit results and the calculated spectrumof beta-gamma background events ( gray lines). The dashed line represents the summed components, and thebands show the ± 1σ statistical uncertainties from the signal-extraction fit.
had been finalized. The total size of the blind data set corresponded to roughly 30% of the totallive time.
The data observed with the PMTs exhibited events from all three detection reactions with thecharacteristics shown in Figure 6. The first detailed analysis (54) aimed at detecting events abovean effective kinetic energy of 6.75 MeV, eliminating any significant contributions from the NCreaction or from the low-energy region dominated by radioactive background (see Figure 7). TheCC and ES reactions could be resolved through use of the strong directional dependence of theES reaction. A second analysis (55) with an effective kinetic energy threshold of 5 MeV, as wellas a fiducial volume inside 550 cm, provided the opportunity to include the NC reaction in theanalysis (Figure 7).
8.1.4. Results from phase one. The results from the first detailed analysis (54) of events abovean effective kinetic energy of 6.75 MeV from the CC and ES reactions provided the followingfluxes (assuming an unperturbed shape for the 8B spectrum):
φSNOCC (νe ) = 1.75 ± 0.07 (stat.)+0.12
−0.11 (syst.) ± 0.05 (theor.) × 106 cm−2 s−1 and
φSNOES (νx) = 2.39 ± 0.34 (stat.)+0.16
−0.14 (syst.) × 106 cm−2 s−1.
www.annualreviews.org • The Sudbury Neutrino Observatory 449

ANRV391-NS59-19 ARI 19 June 2009 15:20
SNO’s ES rate measurement was consistent with the precision measurement of the 8B flux takenby the Super-Kamiokande collaboration, which made use of the same ES reaction (56):
φSKES (νx) = 2.32 ± 0.03 (stat.)+0.08
−0.07 (syst.) × 106 cm−2 s−1.
The difference between the flux φSKES (νx) measured by Super-Kamiokande via the ES reaction
and the φCC(νe ) flux measured by SNO via the CC reaction is (0.57 ± 0.17) × 106 cm−2 s−1, or3.3σ from zero, assuming that the systematic errors are normally distributed. This difference wasstrong evidence for the presence of nonelectron flavors in the flux and therefore for neutrino flavorchange. The total flux of active 8B neutrinos was determined via φSNO
CC and φSKES to be
φ(νx) = 5.44 ± 0.99 × 106 cm−2 s−1,
in excellent agreement with predictions of standard solar models (2, 3, 57). The reference (2) 8Bneutrino flux was 5.05 × 106 cm−2 s−1.
In the second analysis (55), the effective kinetic energy threshold was 5 MeV, sufficient toresolve the contributions from CC, ES, and NC events above threshold. Background event pdfswere included in the analysis, with fixed amplitudes determined by the background calibration.The extended maximum-likelihood method used in the signal decomposition yielded 1967+61.9
−60.9
CC events, 263.6+26.4−25.6 ES events, and 576.5+49.5
−48.9 NC events, where only statistical uncertaintiesare given. Systematic uncertainties on fluxes were derived by repeating the signal decomposi-tion with perturbed pdfs, constrained by calibration data. Figure 7 shows the energy spectraobtained.
The total neutron background was 78 ± 12 events, of which 71 were from photodisintegration.The total Cherenkov background (the background to CC and ES events) was 45+18
−12 events. Thefraction of neutron events (NC + background) that were due to photodisintegration was therefore11% (with an uncertainty of less than 2%), evidence that the radioactive cleanliness requirementsfor SNO had been met.
The results of this analysis gave the following fluxes in units of ×106 cm−2 s−1:
φCC = 1.76+0.06−0.05 (stat.)+0.09
−0.09 (syst.),
φES = 2.39+0.24−0.23 (stat.)+0.12
−0.12 (syst.), and
φNC = 5.09+0.44−0.43 (stat.)+0.46
−0.43 (syst.).
A simple change of variables resolves the data directly into electron (ve) and nonelectron (vμτ )components,
φνe = 1.76+0.05−0.05 (stat.)+0.09
−0.09 (syst.) and
φνμτ= 3.41+0.45
−0.45 (stat.)+0.48−0.45 (syst.),
assuming the standard 8B shape. Combining the statistical and systematic uncertainties in quadra-ture, φνμτ
is 3.41+0.66−0.64, which is 5.3σ above zero. This result provides additional stronger evi-
dence for flavor transformation consistent with neutrino oscillations. These results are plotted inFigure 8.
A further analysis (58) provided information on the day-night asymmetry. For CC events,assuming an undistorted 8B spectrum, the night minus day rate was found to be 14.0 ± 6.3+1.5
−1.4%of the average rate. When the total flux of active neutrinos was additionally constrained to have
450 Jelley · McDonald · Robertson

ANRV391-NS59-19 ARI 19 June 2009 15:20
0 1 2 3 4 5 60
1
2
3
4
5
6
7
8
φe (106 cm–2 s–1)
φμτ
(106 c
m–2
s–1
)
φCC
φSSM
φSSM
SNOφESSNO
φNCSNO
Figure 8The flux of 8B solar neutrinos of μ or τ flavor versus the flux of electron neutrinos deduced from the threeneutrino reactions [charged current (CC; red ), elastic scattering (ES; purple), and neutral current (NC; blue)]in SNO. The diagonal bands show the total 8B flux as predicted by the BP2000 Standard Solar Model (SSM)(dashed lines) from Reference 2 and that measured with the NC reaction in SNO (solid blue band ). Theintercepts of these bands with the axes represent the ± 1σ errors. The three bands intersect at the fit valuesfor φνe and φνμτ , indicating that the combined flux results are consistent with neutrino flavor transformationwith no distortion in the 8B neutrino energy spectrum.
no asymmetry, the ve asymmetry was found to be 7.0 ± 4.9+1.3−1.2%. A global neutrino analysis (59)
that included the MSW effect (21, 23) in the Sun favored a LMA solution.
8.2. Phase Two: Salt Added to Heavy Water
The original SNO proposal (33) suggested adding Cl to raise the NC signal above that observedwith pure heavy water. The addition of Cl increases the neutron-capture efficiency, and the associ-ated Cherenkov light also increases because more energy is released in the accompanying neutroncapture on 35Cl. Furthermore, neutron capture on 35Cl typically produces multiple gamma rays,whereas the CC and ES reactions produce single electrons. The generally greater isotropy of theCherenkov light from neutron-capture events relative to CC and ES events allowed good statis-tical separation of the event types and enabled precise measurement of the NC flux, independentof assumptions about the CC and ES energy spectra.
In May 2001, 2 tonnes of purified NaCl were added to the 1 ktonne of heavy water, whichincreased the neutron-capture efficiency for neutrons generated uniformly in the D2O by approx-imately a factor of three from the pure D2O phase (see Figure 9a). The solution was thoroughlymixed, and a conductivity scan along the vertical axis showed the NaCl concentration to be uniform
www.annualreviews.org • The Sudbury Neutrino Observatory 451

ANRV391-NS59-19 ARI 19 June 2009 15:20
Isotropy parameter β14
0 0.2 0.4 0.6 0.8
Even
ts p
er b
in (a
.u.)
0
0.2
0.4
0.6
0.8
1.0
CC Monte Carlo
252Cf source radial position (cm)
252Cf data252Cf Monte Carlo16N data16N Monte Carlo
0 100
ba
200 300 400 500 600
Effici
ency
(%)
0
20
40
60
80
100
Salt phase
D2O phase
Figure 9(a) Neutron-capture efficiency versus radial position of the 252Cf source for the pure D2O and salt phase. The solid blue line representsthe fit of the salt-phase data to an empirical function (60), and the dotted red line represents the fit of the D2O-phase data to a neutron-diffusion model. (b) β14 isotropy distributions for 252Cf data and Monte Carlo (brown), 16N data and Monte Carlo ( green), andsimulated charged-current (CC) events ( gray).
within 0.5%. MgCl2, rather than NaCl, had been considered (44), because of concern about Kcontamination of NaCl and activation of the 23Na. However, measurements of the radiation nearthe water-circulation pipes and of K content showed that NaCl was acceptable, even preferable,as it was chemically easier to process.
8.2.1. Data. Phase Two data were collected between July 26, 2001 and August 28, 2003, for atotal exposure of 391.4 live days. The measurement and calibration of the detector response weredetermined using the same sources as in the first phase. In addition, sources of 24Na and 222Rn wereused in the D2O to measure the response to low-energy beta-gamma decays. The 24Na sourceswere made by deploying a 330-kBq 232Th source in the heavy water: The 2.614-MeV gammasproduced neutrons through photodisintegration of deuterons, which occasionally captured on23Na nuclei. Calibration of the detector’s optical and energy response was updated to include timevariation in the water-transparency measurements made at various wavelengths throughout therunning period. A normalization for photon-detection efficiency based on 16N calibration dataand Monte Carlo calculations was used to set the absolute energy scale, which had an uncertaintyof 1.1%.
The neutron-detection efficiency was measured with a 252Cf source. The source strength hadbeen determined both with a calibrated array of 3He counters and, after deployment in the heavywater, by time-series analyses of the neutron events (61). In determining the efficiency, the promptfission gammas emitted in the spontaneous decay of 252Cf had to be taken into account. The effi-ciency for detecting neutrons that had a reconstructed vertex within Rfit ≤ 550 cm was foundto be 0.407 ± 0.010. Details of the energy, optical, and efficiency calibrations are given inReference 60.
8.2.2. Analysis procedure. Following data-reduction and analysis-selection procedures similarto those carried out in the first phase, the total data set consisted of 4722 events. The effectiveelectron kinetic energy threshold was Teff ≥ 5.5 MeV, which, together with a fiducial volume cut ofradius Rfit ≤ 550 cm, reduced the Cherenkov event backgrounds arising from beta-gamma decays
452 Jelley · McDonald · Robertson

ANRV391-NS59-19 ARI 19 June 2009 15:20
to 3.5 events. A bifurcated analysis established that the residual contamination of instrumentalbackgrounds in the neutrino data set was fewer than 3 events.
The separation of NC from CC and ES events was enhanced by utilizing the difference betweenthe isotropy of the Cherenkov light from neutron-capture events and those from CC and ES events.Event isotropy was characterized by parameters β l , the average value of the Legendre polynomialPl of the cosine of the angle between PMT hits. The combination β1 + 4β4 ≡ β14 was selectedas the measure of event isotropy to optimize the separation of NC and CC events. Systematicuncertainty on β14 distributions generated by Monte Carlo for signal events was evaluated bycomparing 16N calibration data to Monte Carlo calculations for events throughout the fiducialvolume and running period. The uncertainty on the mean value of β14 was 0.87%. Comparisonsof β14 distributions from 16N events and neutron events from 252Cf to Monte Carlo calculationsare shown in Figure 9b.
Initially, a discrepancy of approximately 2.5% between data and Monte Carlo was observed inβ14. Good agreement was obtained after a small correction was made to EGS4 (62) to accountfor approximations used in the description of electron scattering in the Monte Carlo simulation,mainly for the neglect of the Mott terms (60).
The principal backgrounds were from natural radioactivity in the heavy water and in the acrylicvessel. The backgrounds in the heavy water were measured by the in situ and ex situ methodsdescribed in Section 6.5 above. For the in situ technique used in Phase Two, the isotropy of theCherenkov light from decays of 208Tl and 214Bi was characterized by the decays’ β14 distributions,rather than by their θ ij, distributions. A small amount of 24Na was produced by calibration sourcesdeployed in the heavy water and by radiation activating 23Na in the water-circulation pipes, and thecontribution from 24Na decays was taken into account in the in situ analysis. The total number ofneutrons from internal sources was 125.1+37.3
−32.0, of which 91.3+30.4−31.5 came from photodisintegration
by Th and U chain activity, corresponding to only 6% of the NC events. A table listing all thebackground contributions is provided in Reference 60.
During construction of the acrylic vessel, Rn progeny accumulated on the vessel’s surfaces.These daughters initiated (α, n) reactions on 13C, 17O, and 18O. Also, a few external gamma raysoriginating from radioactivity in the construction material of the detector and the rock cavityentered the D2O target and photodisintegrated deuterons. The radial distribution of these neu-trons peaked near the acrylic vesssel, and the enhanced neutron-detection efficiency in the secondphase of SNO made it possible to extract this external-source neutron contribution in the neutrinosignal window by including an additional radial distribution function in the statistical analysis ofthe solar neutrino flux.
The data were analyzed to give day and night neutrino fluxes. The systematics on the asymmetryratio A = 2(φN − φD)/(φN + φD) were evaluated using classes of events that were continuallypresent in the detector. These consisted primarily of secondary neutrons produced in the D2Oby throughgoing muons and Cherenkov events from low-energy beta-gamma decays. A localizedregion of higher than average background radioactivity was discovered on the upper surface ofthe acrylic vessel. This hot spot provided an excellent check of position reconstruction for a pointsource of events. Variations in detector response with the direction of an event were taken intoaccount, as such variations could produce a day-night systematic for neutrino signals, which havedifferent directional distributions for night and day.
A blind analysis procedure was used in the analysis of the first 254.2 live days of data (63): Thedata set used during the development of the analysis procedures and the definition of parameters(a) excluded an unknown fraction (<30%) of the final data set, (b) included an unknown admixtureof neutrons from muon-produced spallation background events in the analyzed data set, and(c) included an unknown NC cross-section scaling factor in signal simulations. After fixing all
www.annualreviews.org • The Sudbury Neutrino Observatory 453

ANRV391-NS59-19 ARI 19 June 2009 15:20
analysis procedures and parameters, the blindness constraints were removed. The analysis was thenperformed on the open data set, statistically separating events into CC, NC, ES, and external-source neutrons using an extended maximum-likelihood analysis based on the distributions ofisotropy (β14), the cosine of the event direction relative to the vector from the Sun, and the radiuswithin the detector.
This analysis differs from that of the pure D2O data because the spectral distributions of theES and CC events were not constrained to the 8B shape, but rather were extracted from the data.To obtain the electron energy spectra of the CC and ES interactions, pdfs were created for Teff
intervals ranging from 5.5 MeV to 13.5 MeV in 0.5-MeV steps. For Teff values between 13.5 and20 MeV, a single bin was used.
The extended maximum-likelihood analysis for the total data set from the second phase of SNOyielded 2176 ± 78 CC, 279 ± 26 ES, 2010 ± 85 NC, and 128 ± 42 external-source neutronevents. There were also 125.4 internal neutron events and 3.5 internal gamma-ray events.
8.2.3. Results from phase two. The neutrino fluxes derived from the fitted CC, ES, and NCevents, where the electron energy spectrum was unconstrained, are (in units of 106 cm−2 s−1)
φCC = 1.68+0.06−0.06 (stat.)+0.08
−0.09 (syst.),
φES = 2.35+0.22−0.22 (stat.)+0.15
−0.15 (syst.), and
φNC = 4.94+0.21−0.21 (stat.)+0.38
−0.34 (syst.),
and the ratio of the 8B neutrino flux measured with the CC and NC reactions isφCC
φNC= 0.340+0.023
−0.023 (stat.)+0.029−0.031 (syst.).
The quoted CC and ES fluxes are the equivalent fluxes of 8B electron neutrinos, assuming anundistorted 8B energy spectral shape (64) that would produce the same CC and ES event ratesabove the analysis threshold of Teff = 5.5 MeV. (Solar hep neutrinos could also be present in themeasured fluxes; the SSM contribution would be 0.5%.)
A day-night analysis of the data was performed, and the measured values for the asymmetry ratioA from a shape-unconstrained signal extraction were ACC = −0.056±0.091, ANC = 0.042±0.112,and AES = 0.146 ± 0.201, where the statistical and systematic errors have been combined inquadrature. No significant asymmetries were observed. A detailed discussion of the day-nightanalysis and results is given in Reference 60.
The observation of a substantially suppressed ve flux with the CC reaction compared to thetotal active flux measured by the NC reaction, provided clear evidence for neutrino flavor changethat can be analyzed in terms of neutrino oscillations. The evidence is in very good agreement withthe CC–ES comparison obtained in Phase One. A two-flavor, active neutrino oscillation modelwas used. This is a good approximation when θ13 is small.
The Teff spectrum with statistical uncertainties for the data from the second phase of SNO isshown in Figure 10a. Included are Monte Carlo spectra for neutron, CC, ES, and external-sourceneutron distributions. This spectrum is very similar to that predicted in 1987 in the SNO proposal(shown in Figure 4).
The best-fit parameters for a global oscillation analysis of the total data from the second phaseof SNO, including solar neutrino and KamLAND reactor neutrino data, are �m2 = 8.0+0.4
−0.3 ×10⁻⁵ eV2 and θ = 33.9+1.6
−1.6◦, where the errors reflect marginalized 1σ ranges. The predicted CC
electron energy spectrum based on these best-fit parameters is compared to the measured CCspectrum in Figure 10b.
454 Jelley · McDonald · Robertson

ANRV391-NS59-19 ARI 19 June 2009 15:20
0
50
100
150
200
250
300
Data
Systematicuncertainties
SSM 8B model shape 8B model shape LMA
Even
ts p
er 0
.5 M
eV
0
100
200
300
400
500
600
700
800
900
Data
Fit resultNeutrons
CC
ES External neutrons
Teff (MeV)76 8 9 10 11 12
Teff (MeV)76 8 9 10 11 12 1313 13.5–20
ba
Figure 10(a) Data Teff spectrum with statistical uncertainties. Included are Monte Carlo (MC) spectra for neutron (dark blue line), charged-current (CC; red line), elastic scattering (ES; purple line), and external-source neutron (light blue line) distributions. Note that anundistorted 8B spectral shape has been assumed and that each MC contribution has been normalized to the number of correspondingfit events measured by the energy-constrained signal. (b) Extracted CC Teff spectrum compared to that predicted with the best-fit largemixing angle (LMA; green line) parameters. Only statistical uncertainties are shown in the data spectrum. The band in the LMA-predicted spectrum represents the 1σ uncertainty determined from detector systematic uncertainties. The predicted spectrum isnormalized to the same number of counts as the data spectrum. Note that the data points, especially the first three points, arestatistically correlated and also have correlated systematics (indicated by the error band). Abbreviation: SSM, Standard Solar Model.
The neutrino energy spectrum derived from the CC reaction is consistent with both theexpected spectrum, assuming an undistorted 8B shape, and the predicted spectrum, which corre-sponds to the best-fit LMA parameters for a global oscillation analysis that includes solar neutrinoand KamLAND reactor neutrino data. Within uncertainties, no significant day-night asymme-tries were observed, as was expected for the best-fit LMA solution. These data provided furtherconfirmation of flavor change for solar neutrinos and for the oscillation of massive neutrinos asthe dominant flavor change mechanism. The total flux of all active neutrino types for 8B solar neu-trinos is in agreement with solar model calculations (65, 66). The observation of the MSW effectin the Sun enables the relative size of m1 and m2 to be determined. With the usual convention,m1, the mass eigenstate with the largest electron neutrino component, is found to be smaller thanm2. The angle θ12 is found to be less than the maximal value of 45◦ by more than five standarddeviations, thereby providing significant restrictions on models for neutrino mixing.
8.3. Phase Three: Neutral-Current Detection Array
The extraction of the three neutrino-interaction signals from SNO with heavy water alone orwith added dissolved salt requires a decomposition of the Cherenkov light signals into the threecomponents on a statistical basis. Each signal has a characteristic isotropy and dependence onradius, angle with respect to the Sun’s position, and energy. However, it is also possible to detect theNC disintegration of deuterium directly through use of neutron-sensitive proportional counters.This different approach breaks correlations that are present in the Cherenkov light signals andalso provides a check on possible systematic effects.
Upon completion of the salt phase, the salt was removed by reverse osmosis and ion exchange,and a month’s worth of data was taken to confirm that the detector and water clarity had returnedto Phase One conditions. For Phase Three, an array of proportional counters filled with an 85:15
www.annualreviews.org • The Sudbury Neutrino Observatory 455

ANRV391-NS59-19 ARI 19 June 2009 15:20
partial pressure mixture of 3He and CF4 was deployed in the heavy water to detect neutrons. Atotal of 40 strings of proportional counters were attached to anchor points on the inner surfaceof the vessel on a 1-m-square grid. The strings, laser-welded assemblies of individual counters 2to 3 m in length, were 9 to 11 m long. Four strings contained 4He instead of 3He for assessmentof backgrounds. A description of the design and deployment of this NCD array can be found inReference 34. The results obtained from SNO’s third phase are given in Reference 67.
8.3.1. Data. Data were acquired between November 27, 2004 and November 28, 2006 with theNCD array, for a total live time of 385.17 days. Diverse calibrations were also carried out tohelp track the performance and stability of both the PMT and the NCD systems as well as toaid in analysis. Calibration sources were deployed on two orthogonal planes bisecting the NCDarray. A variety of sources were used: (a) two 252Cf neutron sources, one of which was of preciselydetermined strength (60), (b) an 241AmBe neutron source, (c) the 16N source [the 6.13-MeV gammasfrom this source are the primary calibration of the PMT energy scale (49)], (d ) the 8Li sourcefor calibration of event reconstruction and tests of instrumental cuts, (e) encapsulated Th anddissolved 222Rn sources for background calibration, and ( f ) two 24Na sources. Neutron-activatedNaCl, precisely standardized by gamma counting, was dissolved in the heavy water in October2005 and October 2006. The 2.754-MeV gammas photodisintegrated deuterium and created asource of neutrons that, like the neutrons produced by neutrino interactions, were nearly uniformand homogeneous. Small corrections were applied for edge effects at the vessel wall, and therewas an uncertainty that arose from possible lack of mixing homogeneity. These sources were theprimary calibration of NCD neutron efficiency. In addition, optical and electronic calibrationswith pulser signals were carried out regularly on both the PMTs and the NCD array.
8.3.2. Analysis procedure. The extraction of the NC signal rate from the NCD array data beganwith the selection of good runs: generally, runs that are at least 30 minutes in duration and thathave no abnormalities. As in the other phases, a blind analysis procedure was used. A total of 1834neutrino runs were selected for the blind data, and another 121 were chosen as an open data set. Sixof the 3He strings were rejected from the final data because of mechanical and electrical problems.One string contained a counter that had leaked into the interspace between counters (but notinto the heavy water), resulting in gain drift. Two strings had intermittent connections to theircables, and two others had an excess of low-amplitude events, possibly caused by an intermittentconnection. Finally, one string exhibited fluctuating gain.
The PMT and NCD data contained instrumental or irrelevant events that were removed bya set of algorithms and cuts. For the PMT data, the cuts are as described in Reference 53, withsome minor revisions. For the NCD data, the cuts are as described in Reference 34.
The remaining events consisted of neutrons, alpha particles, and possibly a low-energy com-ponent similar to that seen in the two strings, which had an excess of low-amplitude events. Thealpha spectrum shape was simulated numerically in a detailed model of the physics and electron-ics responsible for the ionization profiles registered in the digitizers. Neutron spectra were alsosimulated, which confirmed the accuracy of the approach, but spectra taken from 24Na runs wereused to fit the neutron contribution to the spectrum from neutrino runs. Figure 11 shows theresults of the simulation.
Given the improvements to the calibration data analysis and the increased high voltageon the PMT array, the introduction of the NCD array did not significantly increase theposition- or energy-reconstruction uncertainties from previous phases. A normalization for the
456 Jelley · McDonald · Robertson

ANRV391-NS59-19 ARI 19 June 2009 15:20
Relative energy0 10 20 30 40 50 60 70 80 90
Coun
ts p
er b
in
0
500
1000
1500
2000
2500
3000 Simulation
Data
210Po alphaU chainTh chain
Figure 11Comparison between a simulation of the neutral-current detection (NCD) alpha spectrum and the blind data(a fraction of the neutrino data plus some muon-produced neutrons). The peak near channel 10 is theneutron-capture peak at 764 keV, and the peak near channel 60 is dominated by the 5.3-MeV 210Po alphadecay. The simulation is the curve (dark blue), consisting of the sum of the Th chain (orange; lowest curve atchannel 30), the U chain (red ), and the 210Po alpha activities ( purple), fitted to the data. The U and Thactivities have exponential depth profiles in the Ni wall of the NCDs determined from fits to individualstring data. The common scale depth for 210Po is 0.1 μm.
photon-detection efficiency based on 16N calibration data and Monte Carlo simulations was usedto set the absolute energy scale with an uncertainty of 1.1%.
A table summarizing the neutron and Cherenkov light backgrounds in Phase Three can befound in Reference 67. Low levels of 214Bi and 208Tl present in the heavy and light water, NCDcounters, and cables can create both free neutrons from deuteron photodisintegration and low-energy Cherenkov events from beta-gamma decays. The techniques (46–48, 55) described inSection 6.5 were used to determine these backgrounds in the water. For the NCD array, resultsfrom the in situ and ex situ methods gave comprehensive information about the isotopic com-position and physical distribution of the activity and yielded the neutron background with anuncertainty of 1.5% of the NC signal.
The presence of neutrons from the acrylic vessel and light water had been noted in Phases Oneand Two (60, 63). Measurements, with Si counters, of alpha radioactivity on the inner surface of theacrylic vessel neck, below the normal waterline before and after the NCD phase, were consistentwith those from the salt phase. Thus, the neutron contribution caused by 17,18O(α, n) and 13C(α,n) at the vessel wall was taken to be the same as for the salt phase. An additional contribution fromphotodisintegration caused by gammas passing through the vessel wall was determined from themeasured 214Bi and 208Tl concentrations in the light water.
Backgrounds from Cherenkov events inside and outside the fiducial volume were estimated us-ing calibration source data, measured activities, Monte Carlo calculations, and controlled injections
www.annualreviews.org • The Sudbury Neutrino Observatory 457

ANRV391-NS59-19 ARI 19 June 2009 15:20
of Rn into the detector. These backgrounds were found to be small within the fiducial volume andabove the analysis threshold of 6.0 MeV effective electron kinetic energy; they were included as anadditional uncertainty on the flux measurements. In the previous phases, isotropic acrylic vesselbackground events had been identified and could be limited to 0.3 remaining isotropic backgroundevents (at 68% confidence) after data reduction for the NCD phase.
Blindness constraints were removed after all analysis procedures, parameters, and backgroundswere finalized. As described in Reference 67, some minor errors were discovered and correctedafter “box opening”. A simultaneous fit was made for the number of NC events detected by theNCDs; the numbers of NC, CC, and ES events detected by the PMTs; and the numbers ofbackground events of various types. A Markov-chain Monte Carlo method was employed to makethe fit; this method also allowed nuisance parameters (systematics) weighted by external constraintsto vary in the fit. The NCD event energy spectrum was fit in the 0.4–1.4-MeV range with an alphabackground distribution, a neutron calibration spectrum from 24Na data, and two instrumentalbackground event distributions. The PMT events were fit in reconstructed energy, the cosine ofthe event direction relative to the vector from the Sun (cos θSun), and the reconstructed radialposition.
The spectral distributions of the ES and CC events were not constrained to the 8B shape, butrather were extracted from the data. Fits to the data yielded the following numbers of events:983+77
−76 NC (NCD array), 267+24−22 NC (PMT array), 1867+91
−101 CC, and 171+24−22 ES, with 185+25
−22 and77+12
−10 neutron background events in the NCD and PMT arrays, respectively. Additionally, thetotal NCD array background fits including alphas and the two instrumental components yielded6127 ± 101 events.
8.3.3. Results from phase three. Assuming the 8B neutrino spectrum from Reference 68,the equivalent neutrino fluxes derived from the fitted CC, ES, and NC events are (in units of106 cm−2 s−1)
φCC = 1.67+0.05−0.04 (stat.)+0.07
−0.08 (syst.),
φES = 1.77+0.24−0.21 (stat.)+0.09
−0.10 (syst.), and
φNC = 5.54+0.33−0.31 (stat.)+0.36
−0.34 (syst.),
and the ratio of the 8B neutrino flux measured with the CC and NC reactions isφCC
φNC= 0.301 ± 0.033 (total).
Neutrinos from hep capture may also be present in the measured fluxes; the SSM contributionwould be 0.5%.
The ES flux presented here is 2.2σ lower than that found by Super-Kamiokande-I (69) andis apparently a downward statistical fluctuation, as evidenced in the shortfall of signals near cosθSun = 1 in two isolated energy bins. The 8B spectral shape used here (68) differs from thatused in previous SNO results (64). The CC, ES, and NC flux results are in agreement [ p =32.8% (70)] with the NC flux result of the D2O phase (55) and with the fluxes from the saltphase (60).
The fluxes, combined with day and night energy spectra from the pure D2O and salt phases(58, 60), place constraints on neutrino flavor mixing parameters. Two-flavor active neutrino oscilla-tion models are used to predict the CC, NC, and ES rates in SNO. A combined χ2 fit to SNO D2O-,salt-, and NCD-phase data yields the allowed regions in �m2 and tan2 θ shown in Figure 12a. Datafrom a global analysis of all solar neutrino data, including Borexino (71) and Super-Kamiokande-I(69), as well as the 2881-tonne-year KamLAND reactor antineutrino results (29), yielded the
458 Jelley · McDonald · Robertson

ANRV391-NS59-19 ARI 19 June 2009 15:20
68% CL
a SNO only
Solar global Solar global and KamLAND
b c
95% CL
99.73% CL
0.05
0.10
0.15
0.2 0.4 0.6 0.8 0.2 0.4 0.6 0.8
Δm
2 (eV
2 )Δ
m2 (e
V2
× 10
–3)
tan2θ
tan2θtan2θ
10 –3
10 –3 10 –2 10 –1 10 0
10 –4
10 –5
10 –6
10 –7
10 –8
Figure 12Neutrino-oscillation contours. (a) SNO only: D2O- and salt-phase day and night spectra and neutral-currentdetection–phase fluxes. The best-fit point is �m2 = 4.57 × 10⁻⁵ eV2, tan2 θ = 0.447, fB = 0.900, with χ2
per degree of freedom = 73.77/72. (b) Solar global: SNO, SK, Cl, Ga, and Borexino. The best-fit point is�m2 = 4.90 × 10⁻⁵ eV2, tan2 θ = 0.437, fB = 0.916. (c) Solar global and KamLAND. The best-fit point is�m2 = 7.59 × 10⁻⁵ eV2, tan2 θ = 0.468, fB = 0.864.
allowed regions presented in Figure 12b,c. Here, we treat the three phases of SNO as separateexperiments, with correlations taken into account. However, a three-phase unified analysis is inprogress. The best-fit point to the solar global plus KamLAND data yields �m2 = 7.59+0.19
−0.21 ×10⁻⁵ eV2 and θ = 34.4+1.3
−1.2◦, where the errors reflect marginalized 1σ ranges. In our analyses, the
ratio fB of the total 8B flux to the SSM (65) value was a free parameter, whereas the total hep fluxwas fixed at 7.93 × 103 cm−2 s−1 (72).
The third and final phase of SNO enabled a determination of the total flux of active 8B neu-trinos from the Sun that was independent of the methods used in the previous phases. There isgenerally good agreement among the three phases, consistent with the absence of unexpectedsystematic errors. The flux is in agreement with SSM calculations, and the uncertainty in θ isreduced.
www.annualreviews.org • The Sudbury Neutrino Observatory 459

ANRV391-NS59-19 ARI 19 June 2009 15:20
9. OTHER PHYSICS
SNO provided opportunities to investigate several other interesting physical processes. The de-tector’s large target mass, coupled with its very low radioactivity, meant that stringent limits couldbe set on a number of hypothesized or rare processes. In this section, we summarize the findingsand briefly describe the ongoing analysis of the SNO data for such events.
9.1. Supernova and Relic Neutrinos
A supernova at the middle of our galaxy could provide a burst of up to 1000 neutrino interactionslasting for only a few seconds. At SNO, a system was developed to provide a rapid analysis of suchan event that might allow astronomers to receive early warning prior to the onset of the light curvefor a supernova (which takes place as much as several hours after the initial neutrino burst). SNOalso participated in the SuperNova Early Warning System project, wherein a central computerreceiving possible signals from several international neutrino experiments could, in the event ofa coincidence, alert the astrophysical community. During the course of the SNO experiment, nosuch event was seen.
SNO also searched (73) for the diffuse supernova neutrino background (DSNB) using datacollected during its first operational phase, with an exposure of 0.65 ktonne-years. No events wereobserved in the effective electron energy range of 21 MeV < Teff < 35 MeV (see Figure 13a)and, consequently, an upper limit on the ve component of the DSNB flux in the neutrino energyrange of 22.9 MeV < E < 36.9 MeV of 70 cm−2 s−1 was inferred at the 90% confidence level.
Data 6 MeV< Teff <12 MeV8B electrons
Neutrons
hep electrons
Atmospheric ν interactions
DSNB electrons
10 15 20 25 30
Even
ts p
er 1
.425
MeV
0
2
4
6
8
10
12
14
16
18
20
13 14 15 16 17 18 19 20 21
Estimated background
Data
Predicted hep signal
Even
ts p
er 1
MeV
103
102
101
100
10–1
10–2
10–3
10–4
Teff (MeV) Teff (MeV)
hep signal box
a b
Figure 13(a) The simulated effective electron kinetic energy spectra of the signals and backgrounds of interest in the hep (3He + p → 4He + e+ +νe) and diffuse supernova neutrino background (DSNB) analyses. Also shown are the data in the range 6 MeV < Teff < 12 MeV, whichare used to normalize the 8B electron and neutron distributions. (b) The distribution of events in the region of the 8B end point. Thereare two events in the hep signal box 14.3 < Teff < 20 MeV. Also shown are the estimated number of background events, including thesystematic uncertainty, and the Standard Solar Model prediction for the hep signal.
460 Jelley · McDonald · Robertson

ANRV391-NS59-19 ARI 19 June 2009 15:20
This result is an improvement of two orders of magnitude over the previous ve limit (74). Thesame data were used to look for evidence of hep neutrinos in the Sun.
9.2. Solar hep Neutrinos
The simulated effective electron kinetic energy spectra of the signals and backgrounds of interestin the hep and DSNB analyses are shown in Figure 13a, and the distribution of events in theregion of the 8B end point is shown in Figure 13b (73). There are two events in the hep signal box14.3 MeV < Teff < 20 MeV, where 3.1 background events are expected. After accounting forneutrino oscillations, an upper limit of 2.3 × 104 cm−2 s−1 at the 90% confidence level was inferredon the integral total flux of hep neutrinos. This measurement represents a 6.5-fold improvementover the previous best limit on the hep neutrino flux, measured with the Super-Kamiokandedetector. It is consistent with the SSM. A model-independent limit on the integral hep ve flux, withno assumptions about neutrino oscillations, is set at 3.1 × 104 cm−2 s−1.
9.3. Constraints on Nucleon Decay via “Invisible” Modes
Experimental signatures of the grand unification of the electroweak and strong interactions havebeen sought with increasing sensitivity for the past 25 years. Much effort has gone into identifyingspecific decay modes of free protons and bound nucleons as signatures of grand unification, butto date no signal has been observed. Decay modes that are more unusual than those typicallyexplored cannot, however, be ruled out. A recent paper has even suggested a model in which n →3v becomes the dominant mode (75).
Data from Phases One and Two of SNO have been used to constrain the lifetime for nucleondecay to “invisible” modes, such as n → 3v. The analysis (76) was based on a search for gamma raysfrom the de-excitation of the residual nucleus that would result from the disappearance of either aproton or a neutron from 16O. The gamma rays from the nucleon-decay signal were detected withsimilar efficiencies in Phases One and Two, whereas neutrons produced by 8B solar neutrinos weredetected with very different efficiencies. Comparing the number of neutron-like signals found inPhase One and in Phase Two allowed a limit on the number of gamma rays from the de-excitationof the residual nucleus that would result from the disappearance of either a proton or a neutronfrom 16O to be set.
A limit of τinv > 2 × 1029 years was obtained at 90% confidence for either neutron- or proton-decay modes. This limit is approximately an order of magnitude more stringent than previousconstraints on invisible proton-decay modes and 400 times more stringent than similar neutron-decay modes. [In 2006, the KamLAND experiment reported (77) improved limits of τ (n → inv.) >
5.8 × 1029 years and τ (nn → inv.) > 1.4 × 1030 years at 90% confidence.]A search for evidence for neutron-antineutron oscillation is currently under way. The signal
for neutrons in deuterium would be n̄ p annihilation at rest, and a possible channel to look forwould be 2π+ + π− + π0.
9.4. A Search for Periodicities in the 8B Solar Neutrino Flux
A search (78) has been made for sinusoidal periodic variations in the 8B solar neutrino flux using datacollected by SNO over a four-year interval. The variation at a period of one year is consistent withmodulation of the 8B neutrino flux by the Earth’s orbital eccentricity: A fit yielded ε = 0.0143 ±0.0086, in good agreement with the known value of 0.0167. Neither an unbinned maximum-likelihood analysis nor a Lomb-Scargle periodogram analysis has revealed any other significant
www.annualreviews.org • The Sudbury Neutrino Observatory 461

ANRV391-NS59-19 ARI 19 June 2009 15:20
sinusoidal periodicities with periods between one day and ten years. Searches for time dependencein astrophysical neutrino sources, using a Rayleigh Power test, and for “no-trigger” neutrino bursts,such as from an optically occluded supernova, are under way.
9.5. Antineutrino and Fractionally Charged Particle Searches
Upper limits on solar ν̄e fluxes have been set (79) based on the ν̄e CC reaction on deuterium,which produces a positron and two neutrons in coincidence. This distinctive signature allows asearch with very low background for ν̄e s from the Sun and from other potential sources. For anenergy-independent νe → ν̄e conversion mechanism, the integral limit on the flux of solar ν̄e sin the energy range from 4 to 14.8 MeV has been found to be ν̄e < 3.4 × 104 cm−2 s−2 (at 90%confidence), which corresponds to 0.81% of the SSM 8B ve flux of 5.05 × 106 cm−2 s−1 and isconsistent with the more sensitive limit from KamLAND in the 8.3–14.8-MeV range of 3.7 ×102 cm−2 s−1 (at 90% confidence).
The great depth of SNO (5800 m.w.e.) reduces the background neutron rate from muon-induced reactions. Any fractionally charged particles passing through SNO would give lessCherenkov light per unit path length, and searches for this signature will be performed in thefuture.
9.6. The Cosmic Ray– and Neutrino-Induced Muon Fluxat the Sudbury Neutrino Observatory
For muon zenith angles larger than 66◦, the primary muon flux detected at SNO falls belowthe flux of secondary muons produced by the interaction in the rock of neutrinos created by thedecay of muons and pions. The direction of these secondary muons is not very different fromthat of the neutrinos that created them. Neutrinos incident from below the horizon have traveleddistances as great as the diameter of the Earth, whereas those coming from above the horizonhave traveled relatively short distances. SNO muon data above and below the horizon (79a) areconsistent with current phenomenological models for downward fluxes of atmospheric muonsversus depth and provide a measurement of atmospheric neutrino oscillations in agreement with(though less accurate than) previous measurements of such oscillations (81, 82).
10. CONCLUSIONS
The SNO experiment operated from November 1999 through November 2006, recording solarneutrino data via three reactions (ES on electrons, and CC and NC interactions on deuterium)in three configurations or phases (heavy water alone, heavy water with dissolved salt, and heavywater with neutron-detecting proportional counters deployed). The ES data agree with the muchhigher statistics data from Super-Kamiokande (69). The NC rate yields the flux of all activeneutrino flavors above 2.2 MeV, a result in excellent agreement with the predictions of standardsolar models such as that developed by Bahcall et al. (65). The extraordinary accomplishments ofastrophysical theory can be judged by the dependence of the 8B flux on the twenty-fourth powerof the central temperature of the Sun (80), implying that the temperature has been correctlypredicted to ∼1% accuracy despite decades of contraindication.
The three reactions observed at SNO permit an overdetermined fit to the fluxes of electron andnonelectron flavors, and the agreement is good. This evidence for neutrino flavor conversion andappearance is consistent with the theoretical picture of oscillations between two mass eigenstatesand matter enhancement by the MSW effect. The electron neutrino has been found to be a state
462 Jelley · McDonald · Robertson

ANRV391-NS59-19 ARI 19 June 2009 15:20
of mixed mass like the mu and tau neutrinos were shown to be from an analysis of atmosphericneutrino data (81, 82). The linkage of the three mass eigenstates via oscillation leads to upper andlower bounds (83) on the sum of neutrino masses. Neutrino mass requires revision of the StandardModel of particles and fields. The increasingly accurate results obtained from the SNO experimentare helping to provide strong constraints on neutrino properties and to guide theoretical workseeking to define the required revision.
Further analysis of the extant SNO data continues. A concordant set of fluxes, spectra, andday-night asymmetry from the three phases taken together will be extracted, accounting for cor-relations. With many refinements to the analysis methods, the threshold for the first two phaseswill be lowered below the current 5.0-MeV value. At present, the practical approach for combiningthe results of the three phases is to treat them as independent both statistically and systematically,a very good approximation. SNO is undertaking a three-neutrino analysis in parallel with the im-provements mentioned. Solar neutrinos can provide information about the third mixing angle, θ13,because θ12 and θ13 phenomena have different energy dependences owing to matter enhancementin the Sun for θ12 above a certain energy. Comprehensive three-neutrino analyses incorporatingthe results already published have been reported by Fogli et al. (84) and Schwetz et al. (85).
SNO has almost completed its task, with results that have proven to be exciting and significantto both physics and astrophysics. The study of solar neutrinos is not yet complete, but several inge-nious new experiments have been proposed to explore the spectrum below 5 MeV with precisionand detail.
DISCLOSURE STATEMENT
The authors are not aware of any affiliations, memberships, funding, or financial holdings thatmight be perceived as affecting the objectivity of this review.
ACKNOWLEDGMENTS
We cannot hope to do justice to the tremendous amount of work that has gone into the SNOproject by our colleagues over many years. This work is best understood through reading thedetailed SNO papers cited in this article, and our colleagues’ names are contained in the ex-tensive author lists for those papers. The SNO collaboration is indebted to the financial andother support that it has received from many sources [Canada: NSERC, Industry Canada, NRC,Northern Ontario Heritage Fund, Vale Inco, AECL, Ontario Power Generation, HPCVL, CFI,CRC, Westgrid; United States: Department of Energy, NERSC PDSF; United Kingdom: STFC(formerly PPARC); Portugal: FCT]. We are also indebted to the dedicated and talented techni-cal staff on-site at Sudbury and at the many institutions across the project for their importantcontributions.
LITERATURE CITED
1. Davis R, Evans JC, Cleveland BT. AIP Conf. Proc. 52:17–27 (1979)2. Bahcall JN, Pinsonneault MH, Basu S. Astrophys. J. 555:990 (2001)3. Brun S, Turck-Chieze AS, Zahn JP. Astrophys. J. 525:1032 (1999)4. Chen HH. Phys. Rev. Lett. 55:1534 (1985)5. Bahcall JN, Pena-Garay C. N. J. Phys. 6:63 (2004)6. Bahcall JN, Pinsonneault HM. Phys. Rev. Lett. 92:121301 (2004)7. Davis R. Phys. Rev. Lett. 20:1205 (1968)8. Bahcall JN. Nucl. Phys. B 118:77 (2003)
www.annualreviews.org • The Sudbury Neutrino Observatory 463

ANRV391-NS59-19 ARI 19 June 2009 15:20
9. Bahcall JN, et al. Astrophys. J. 184:1 (1973)10. Hirata S, et al. Phys. Rev. Lett. 65:1297 (1990)11. Bahcall JN. Astrophys. J. 467:475 (1996)12. Abdurashitov JN, et al. Phys. Lett. B328:234 (1994)13. Anselmann P, et al. Phys. Lett. B342:440 (1995)14. Hata N, Langacker P. Phys. Rev. D 56:6107 (1997)15. Heeger KM, Robertson RGH. Phys. Rev. Lett. 77:3720 (1996)16. Pontecorvo B. Zh. Eksp. Teor. Fiz. 53:1717 (1967)17. Gribov V, Pontecorvo B. Phys. Lett. B28:493 (1969)18. Perl ML, et al. Phys. Rev. Lett. 35:1489 (1975)19. Maki Z, Nakagawa N, Sakata S. Prog. Theor. Phys. 28:870 (1962)20. Amsler C, et al. (Part. Data Group) Phys. Lett. B667:1 (2008)21. Wolfenstein L. Phys. Rev. D 17:2369 (1978)22. Langacker P, Liu J. Phys. Rev. D 46:4140 (1992)23. Mikheyev SP, Smirnov AY. Sov. J. Nucl. Phys. 42:913 (1985)24. Glashow SL, Krauss LM. Phys. Lett. B190:199 (1987)25. Balantekin AB, Loreti F. Phys. Rev. D 45:1059 (1992)26. Abazov AI, et al. Phys. Rev. Lett. 67:3332 (1991)27. Cribier M, Hampel W, Rich J, Vignaud D. Phys. Lett. B182:89 (1986)28. Baltz AJ, Weneser J. Phys. Rev. D 35:528 (1987)29. Abe S, et al. (KamLAND Collab.) Phys. Rev. Lett. 100:221803 (2008)30. Beacom JF, Bell NF. Phys. Rev. D 65:113009 (2002)31. Lim C-S, Marciano WJ. Phys. Rev. D 37:1368 (1988)32. Valdiviesso GdA, Guzzo MM, de Holanda PC. arXiv:0811.2128 (2008)33. Ewan GT, et al. (SNO Collab.) Propos. SNO-8712 (1987)34. Amsbaugh JF, et al. Nucl. Instrum. Methods A 579:1054 (2007)35. Davidson WF, et al. Proc. Intl. Colloq. Baryon Nonconserv. (ICOBAN) 84:273 (1984)36. Chen HH. AIP Conf. Proc. 126:249 (1985)37. Ewan GT, Davidson WF. Phys. Can. 61:339 (2005)38. Sinclair D, et al. Nuovo Cim. C9:308 (1986)39. Aardsma G, et al. Phys. Lett. B194:321 (1987)40. Jagam P, Simpson JJ. Nucl. Instrum. Methods A 324:389 (1993)41. Jillings CJ, et al. (SNO Collab.) Nucl. Instrum. Methods A 373:421 (1996)42. Doucas G, et al. Nucl. Instrum. Methods A 370:579 (1996)43. Heaton RK, et al. Phys. Rev. C 56:922 (1997)44. Boger J, et al. (SNO Collab.) Nucl. Instrum. Methods A 449:172 (2000)45. Howe MA, et al. IEEE Trans. Nucl. Sci. 51:878 (2004)46. Andersen TC, et al. (SNO Collab.) Nucl. Instrum. Methods A 501:399 (2003)47. Andersen TC, et al. (SNO Collab.) Nucl. Instrum. Methods A 501:386 (2003)48. Blevis I, et al. Nucl. Instrum. Methods A 517:139 (2004)49. Dragowsky MR, et al. Nucl. Instrum. Methods A 481:284 (2002)50. Tagg NJ, et al. Nucl. Instrum. Methods A 489:178 (2002)51. Moffat BA, et al. Nucl. Instrum. Methods A 554:225 (2005)52. Brun R, et al. (ZEBRA Collab.) CERN Program Libr. Q100/101 (1986)53. Aharmim B, et al. (SNO Collab.) Phys. Rev. C 75:045502 (2007)54. Ahmad QR, et al. (SNO Collab.) Phys. Rev. Lett. 87:071301 (2001)55. Ahmad QR, et al. (SNO Collab.) Phys. Rev. Lett. 89:011301 (2002)56. Fukuda S, et al. Phys. Rev. Lett. 86:5651 (2001)57. Turck-Chieze S, et al. Astrophys. J. Lett. 5:555 (2001)58. Ahmad QR, et al. (SNO Collab.) Phys. Rev. Lett. 89:011302 (2002)59. Hata N, Langacker P. Phys. Rev. D 52:420 (1995)60. Aharmim B, et al. (SNO Collab.) Phys. Rev. C 72:055502 (2005)
464 Jelley · McDonald · Robertson

ANRV391-NS59-19 ARI 19 June 2009 15:20
61. LaBranche H. Time series analysis for the Cf source in Sudbury Neutrino Observatory. M.Sc. thesis. Univ.Guelph (2003)
62. Nelson WR, Hirayama H, Rogers DWO. SLAC Rep. 265 (1985)63. Ahmed SN, et al. (SNO Collab.) Phys. Rev. Lett. 92:181301 (2004)64. Ortiz CE, et al. Phys. Rev. Lett. 85:2909 (2000)65. Bahcall JN, Serenelli AM, Basu S. Astrophys. J. 621:L85 (2005)66. Turck-Chieze S, et al. Phys. Rev. Lett. 93:221102 (2004)67. Aharmim B, et al. (SNO Collab.) Phys. Rev. Lett. 101:111301 (2008)68. Winter WT, Freedman SJ, Rehm KE, Schiffer JP. Phys. Rev. C 73:025503 (2006)69. Hosaka J, et al. (Super-Kamiokande Collab.) Phys. Rev. D 73:112001 (2006)70. Valassi A. Nucl. Instrum. Methods A 500:391 (2003)71. Borexino, Arpesella C, et al. Phys. Rev. Lett. 101:091302 (2008)72. Bahcall JN, Serenelli AM, Basu S. Astrophys. J. Suppl. 165:400 (2006)73. Aharmim B, et al. (SNO Collab.) Astrophys. J. 653:1545 (2006)74. Aglietta M, et al. Astropart. Phys. 1:1 (1992)75. Mohapatra RN, Perez-Lorenzana A. Phys. Rev. D 67:075015 (2003)76. Ahmed SN, et al. (SNO Collab.) Phys. Rev. Lett. 92:102004 (2004)77. Araki T, et al. Phys. Rev. Lett. 96:101802 (2006)78. Aharmim B, et al. (SNO Collab.) Phys. Rev. D 72:052010 (2005)79. Aharmim B, et al. (SNO Collab.) Phys. Rev. D 70:093014 (2004)
79a. Aharmim B, et al. (SNO Collab.) arXiv:0902.2776 (2009)80. Bahcall JN, Ulmer A. Phys. Rev. D 53:4202 (1996)81. Itow Y. (Super-Kamiokande Collab.) J. Phys. Conf. Ser. 120:052037 (2008)82. Abe K, et al. (Super-Kamiokande Collab.) Phys. Rev. D 77:052001 (2008)83. Robertson RGH. J. Phys. Conf. Ser. In press. arXiv:0807.4258 (2008)84. Fogli GL, et al. Phys. Rev. Lett. 101:141801 (2008)85. Schwetz T, Tortola M, Valle JWF. N. J. Phys. 10:113011 (2008)
www.annualreviews.org • The Sudbury Neutrino Observatory 465


![The Future in Neutrino Oscillation Physics · 2013. 7. 16. · Kamiokande and Super-Kamiokande (Kamioka, Japan) [10], and most recently Sudbury Neutrino Observatory (SNO) (Sudbury,](https://img.pdfslide.net/doc/110x75/60d18b912d875242c3146cd6/the-future-in-neutrino-oscillation-physics-2013-7-16-kamiokande-and-super-kamiokande.jpg)