Embed Size (px)
Citation preview

THE SUPPLY OF NORTH SEA OIL
by
Paul Leo Eckbo
M.I.T. World Oil ProjectWorking Paper No. 77-015 WP
July 1977

THE SUPPLY OF NORTH SEA OIL
by
Paul Leo Eckbo
M.I.T. World Oil Project
Working Paper No. 77-015 WP
July 1977
This paper represents a collective effort by the Supply Analysis Group ofthe M.I.T. World Oil Project. Included in the group are Professors M.A.Adelman, H.D. Jacoby, and G. Kaufmann (M.I.T.) and E. Barouch (ClarksonCollege); and Research Assistants J. Paddock, J. Smith, and Arlie Sterling.The work was supported by the Norwegian School of Economics and BusinessAdministration, the Norwegian Research Council for Science and the Humanities,and by the U.S. National Science Foundation under Grant No. SIA75-00739.However, any opinions, findings, conclusions, or recommendations expressedherein are those of the author and do not necessarily reflect the viewsof the sponsoring institutions.

THE SUPPLY OF NORTH SEA OIL
The North Sea is one of the most important non-OPEC-dominated regions
both in terms of its supply potential and in providing a laboratory
for testing of analytical tools. In the North Sea region, we include the
British and the Norwegian sectors between 560 and 620 North latitudes,
the boundary between Norway and Denmark, and the zero paleocene depth
contour. This area covers the "oil area" of the North Sea as seen by
most industry writers [4]. The North Sea sectors of Denmark, Germany,
Holland, and France are hence not included.
Exploration in the UK sector of the North Sea started as early as
1964. The first oil discoveries were made in late 1969. Table 1 shows
current assessment (June 1976) of recoverable reserves in the area of
study, along with order of discovery, field names, and spud dates. Gas
reserves have been converted to oil-equivalent values using a conversion
factor of 1 billion cubic feet of gas equal to 178 million barrels
of oil.
-1-

2
Table 1. Northern North Sea Discoveries, Recoverable Reserves - Oil and Gas
Oil Equivalent (Millions of Barrels)
Order Name or Spud Size(j) Location Date (rj)
1 Cod 2/68 1562 Montrose 4/69 1803 Ekofisk 9/69 17134 Josephine 6/70 1005 Tor 8/70 2436 Eldfisk 8/70 9107 Forties 8/70 18008 W. Ekofisk 8/70 4909 Auk 9/70 50
10 Frigg 4/71 132511 Brent 5/71 25nn12 Argyll 6/71 7013 Bream 12/71 7514 Lomond 2/72 50015 S.E. Tor 4/72 3416 Beryl 5/72 52517 Cormorant 6/72 16518 Edda 6/72 9819 Heimdal 7/72 30020 Albuskjell 7/72 35721 Thistle 7/72 37522 Piper 11/72 63823 Maureen 11/72 50024 Dunlin 4/73 43525 3/15-2 4/73 15026 Hutton 7/73 25027 Alwyn 7/73 35028 E. Frigg 8/73 62329 Heather 8/73 15030 Brisling 8/73 75
Order Name or Spud Size(J) Location Date (rj)
31 Ninian 9/73 100032 Statfjord 12/73 496033 Odin 12/73 17834 Bruce 3/74 45035 Magnus 4/74 80036 N.E. Frigg 4/74 7137 Balder 4/74 10038 Andrew 4/74 30039 Claymore 4/74 37540 E. Magnus 6/74 250A1 Q/1 -A &7 A o)n
42 15/6-1 9/74 15043 Brae 9/74 80044 Sleipner 11/74 5045 Hod 11/74 7546 211/27-3 11/74 45047 Gudrun 11/74 45048 2/10-1 11/74 10049 3/4-4 12/74 10050 14/20-1 1/75 7551 Crawford 1/75 15052 9/13-7 1/75 35053 3/8-3 1/75 10054 Tern 2/75 17555 21/2-1 2/75 17556 3/2-1A 3/75 20057 Valhalla 4/75 5058 3/4-6&3/9-1 20059 15/13-2 20060 211/26-4 175
Source: Beall [4], and estimates byas of June 1976.
the M.I.T. World Oil Supply Group

3
Fourteen oil fields in the UK sector and two major oil fields in the
Norwegian sector have been declared commercial. Another fifteen fields are
expected to be declared commercial over the coming three years [11].
Current industry expectations, as indicated by Wood, Mackenzie & Co.,
investment advisers of Edinburgh, Scotland, who have been computing and
updating appraisals of North Sea fields since early 1973, are that oil
production from these existing fields as well as those most likely to be
declared commercial over the next three years, will peak in 1982 at about
4.2 million barrels a day (MMB/D) as indicated in Table 2 below. The
recoverable oil reserves of the commercial fields are estimated at 14.6
billion barrels and, of the "probable" fields, at 5.6 billion barrels.
Table 2
EXPECTED NORTH SEA OIL PRODUCTION
(Production Level '000 B/D)
1977 1978 1979 1980 1981 1982 1983 1984 1985
UK Existing Fields 875 1385 1776 2017 2090 2026 1800 1627 1446
UK Probable Fields 15 105 318 743 1247 1440 1509 1431
TOTAL UK Production 875 1400 1881 2335 2833 3273 3240 3136 2877
TOTAL Norwegian Production 415 577 747 870 939 918 911 931 940
TOTAL NORTH SEA 1290 1977 2628 3205 3772 4191 4151 4067 3817
Source: Martin Lovegrove of Wood, Mackenzie & Co. [11].

4
The major determinants of the supply of oil are the resource base,
development costs, government policies, and current and expected prices.
The activity in the North Sea has generated an unprecedented wealth of infor-
mation on these determinants of supply. The major reason for this is that
the North Sea developments are being financed mostly by external funds and on
a project-by-project basis. Banks and other sources of funds are furnished
the estimates of reserves and the schedules of expenditures and outputs, which
normally are confidential. Wood, Mackenzie & Co. have compiled and published
these estimates in a uniform format.
The controversy over taxes and government participation has also
generated more public debate and hence also more information than normally
has been the case elsewhere. This wealth of information has allowed us to
experiment with various analytical tools that have been designed to represent
the process of oil exploration, development, and production [1, 2, 3, 4, 6, 7, 12].
Here we will discuss the application of - the disaggregated process model
[2,3,7,12] to forecasting the supply of North Sea oil.
Overly simplified, the disaggregated process model consists of a discovery
model which tells us how a sequence of reservoir discoveries is being produced
by some exploratory effort,and a reservoir model that tells which of the re-
servoirs discovered will be produced and at what rate. Structural re-
lationships which relate factor inputs and outputs at each stage of the supply
process, exploration, reservoir development, and production, are specified
and estimated (where possible). Contingent on prices, factor costs, the tax
regime, and miscellaneous public policy constraints, activity levels are
determined which optimize the economic return to petroleum operators. A
forecast of the process output (additions to reserves and petroleum production)
is determined along with associated input levels. The need to carry out the
supply analysis on a disaggregated, reservoir level is accentuated by the
heterogeneous nature of the stock of resource deposits.

5
The economic viability of a reservoir is determined by the cost
of the input factors required to develop and produce the reservoir, the
fiscal costs or the government take, and the price of petroleum. In Section 1
we discuss the cost of the input factors and how development costs may be
related to the characteristics of a reservoir. The combined effect of de-
velopment and fiscal costs is discussed in Section 2 and summarized in a
relationship between the minimum economic reservoir size (MERS) and the
price of oil. How government policy affects the rate and the sequence of
discoveries is also discussed in Section 2. In Section 3, we discuss the
distinction between the geologic and economic resource base and show how
the discovery model and the reservoir model may be used to estimate the
annual additions to the productive resource base resulting from drilling up
the North Sea. Finally, in Section 4, we summarize the analysis in terms of
the implications for future oil production in the North Sea. We also dis-
cuss some of the empirical elements that we have not dealt with in a satis-
factory fashion and that we expect will influence the supply potential of
the Norwegian and British sectors of the North Sea.
1. DEVELOPMENT COSTS
The high cost escalation in the North Sea confirms "Cheops' Law" that
nothing ever gets built within the initial cost and time estimates. This
"law" seems to characterize the introduction of new technologies in severe
operating areas. The trans-Alaskan pipeline (TAPS) is the best known
example of this phenomenon. The TAPS costs doubled every three years
during 1970-1975, or at a rate of about 26% a year [8]. In an official
UK study of the cost escalation in the development of North Sea oil and gas

6
reserves [13], the cost escalation is estimated in sterling terms at
about 140% between autumn 1973 and spring 1975, equivalent to an annual
rate of 80%. Cost escalation is defined as the difference between the
originally estimated cost of a project and the actual cost or the latest
estimate of final cost.
Expressed in U.S. dollars, however, Wood, Mackenzie & Co. estimated
that the development costs of all the fields under development in the
North Sea by May 1976, had escalated by 57% since the time the original cost
estimates were made [15]. The most significant factor contributing to this
escalation seems to have been the inadequate technical knowledge in manu-
facturing and installing complex structures in an extremely hostile envi-
ronment. There are signs, however, of the maturing of the learning curve
as development has progressed.
In late 1973, shortages in raw materials and components developed.
The companies were bidding for a limited and fixed supply of materials and
components, and their prices "went through the ceiling." The suppliers of
these products were able to capture some of the economic rent the companies
expected from their field development projects. This "boom" period
lasted for about 12 to 15 months. Today, the situation has reversed itself.
Excess capacity characterizes many of the input factor markets today.
The inadequate technical experience, the input factor shortages, and,
most significantly, the bad weather of the North Sea also caused costly
delays. The high fixed back-up costs of the North Sea activity make any
delay a costly experience. In addition to these direct costs, delays make
the project further exposed to the general rate of inflation. The general

7
rate of inflation contributed significiantly to the cost escalation in the
North Sea. In 1974/75, the consumer price annual rate of inflation was
about 9% in the U.S., 24% in the UK and 12% in Norway.
Only two North Sea fields so far are fully developed. An analysis of
North Sea development costs will therefore have to be based upon the planned
development schedules of the oil companies or directly on engineering-type
cost analysis. The recent experience of the North Sea indicates that an
analysis of the input factor markets as well as the learning curve pheno-
menon should be included when projecting likely frontier area development
costs. Given the maturing of the offshore supply industry in Western
Europe and the maturing of the learning curve, a detailed factor market
analysis was considered unnecessary. We adopted what seems to be the
industry consensus, namely that the cost level of input factors to the
activity in the North Sea will most likely increase at a general rate of
inflation of about 6% in the years to come.
The development and production schedules published by Wood, Mackenzie
& Co. are limited to the individual fields. Development costs and production
potential are a function of the characteristics of the individual fields
of a supply region. The individual field is therefore a natural unit of
analysis. For convenience, we assume that each field in the North Sea
consists of only one reservoir (i.e., that each field is one hydrodynamic
system). Therefore, we label the micro-unit of analysis a reservoir.
A reservoir is characterized for our purposes by a set of physical attributes
as listed in Table 3.

8
Table 3
RESERVOIR CHARACTERISTICS
- recoverable reserves
- average well productivity
- reservoir depth
- water depth
- distance to shore (terminal)
Our concept of a reservoir should be distinguished from the engineering
concept of a reservoir. Reservoir engineers usually conceive of a reservoir
as a set of geological conditions that could sustain various levels and
rates of petroleum production, depending upon the level of investment, the
chosen production profile, and other factors. The traditional engineering
development model is designed to optimize several of the quantities we have
taken as fixed reservoir attributes.
Although our simplified definition of a reservoir prevents fine-tuning
of the rate of extraction from economic reserves, there are several compelling
arguments for its use. To go beyond our idealized concept of a reservoir
would require detailed information on hydrocarbons in place and on the
geologic variables that determine the recovery factor and the rate of de-
velopment and extraction (e.g., permeability, porosity, formation thickness,
initial pressure, temperature, etc.). Unfortunately, we have no basis for
predicting how each of these variables will behave in the exploration-discovery
process. There is, however, a substantial amount of work on how the hydro-
carbons in place and (with a fixed recovery factor) the recoverable reserves
change as an area is drilled up. As our focus is on the intermediate- to

9
the longer-term future, the analysis includes the discovery and development
of new reservoirs. It does not make sense to try to analyze a reservoir
along more dimensions than can be predicted with reasonable confidence.
Our simplifying reservoir definition greatly reduces the complexity of the
analysis without being very restrictive when evaluating the reservoirs of
particular interest--those on the borderline of economic viability.
The cost categories that can be explained using predictive reservoir
characteristics (Table 3) are also more aggregative than those of an
engineering-type reservoir development model. Total development and ex-
traction costs are divided into the categories of Table 4. From the point
of view of data collection, this level of cost-disaggregation is also
as ambitious as we could be in the North Sea.
Table 4
COST CATEGORIES
- development drilling
- platform structures and theirinstallation
- platform equipment
- pipelines/tankers and offshore loadingfacilities
- terminals
- operating costs, platforms, and equipment
- operating costs, pipelines and terminals/tankers and offshore loading facilities.

10
The North Sea data base consists of Wod, Mackenzie's estimates of
planned investment and operating expenditures for 17 actual and potential crude
oil producing fields. The Ekofisk complex is treated as one field. These
historic and planned expenditures series were converted into mid-1976
dollars at the historic and expected North Sea cost inflation.
The small number of observations and the homogeneity of the North Sea
with respect to non-size characteristics made the coefficients of these
characteristics, when included as explanatory variables in the cost re-
lationships, turn out to be not significant. Although engineering-type
analysis clearly points out the significance of flow rate and water depth
as determinants of total capital expenditures, our North Sea sample did not
allow us to verify this. For lack of a broad enough sample, then, we dif-
ferentiate among individual reservoirs on the basis of size alone. The
potential error in doing so within a play (a group of similar geological
configurations conceived or proven to contain hydrocarbons) is small, due
to the overriding importance of reservoir size in economic calculations.
But, although the Wood, Mackenzie sample reflects considerable variation in
the size of recoverable reserves, the current sample size is deficiently
small. This turns out to be consequential in the estimation attempts, be-
cause of our inability to reliably estimate nonlinearities that are inherent
in the cost functions.
Among the fields of particular interest to this study, i.e., small
fields on the borderline of economic viability, there are three categories:
(1) the average isolated field; (2) the special tanker offtake/high peak-ratio
field, and (3) the field discovered close to available transportation or
other capacity. The first category promises average productivity, but

11
requires complete build-up of infrastructure. The second category consists
of fields which can achieve peak production through the substitution of
variable expenses for the high fixed-capital costs associated with permanent
infrastructure. The third category is comprised of fields that are able to
take advantage of existing infrastructure--thus avoiding both high capital
costs and high variable costs. The cost analysis of this study focuses on
the fields of category 1. By excluding categories 2 and 3, we bias the
minimum field size upwards and the level of ultimate recoverable reserves
downwards, even if only slightly so.
A detailed discussion of the problems encountered when estimating the
North Sea cost equations based upon our preliminary data analysis is
beyond the scope of this paper. These estimation problems are discussed
elsewhere [12]. To indicate the exploratorypower of recoverable reserves, R,
(in millions of barrels of oil) for total development expenditures, CD, (in
millions of mid-1976 dollars), the following equation was estimated in an
unconstrained form:
CE = 320 + 0.785R (R = 0.8163) (1.1)
It is also apparent from equation (1.1) that the cost of the marginal
barrel increases rapidly as the size of the reservoir added declines as a
function of the discovery decline process. The disaggregated process model
thus allows us to identify how the supply curve will move to the left as a
function of resource depletion. Because the distortive effect of the fiscal
regime is also dependent on the characteristics of the marginal reservoir,
a disaggregated approach is required to identify the location of, as well
as the dynamics of, the supply curve. The fiscal regime is discussed as
part of the government's policy in Section 2.

12
2. GOVERNMENT POLICY
The governments of UK and Norway influence the activity through the
licensing of blocks for exploration and development, through the terms of the
concession agreements, and through the tax regime. The governments influence
the rate of exploratory drilling through the number of blocks they make
available to the oil companies and the work program specifications of the
concession agreements, i.e., the minimum number of wells that the companies
will have to drill on each block. The rate at which blocks are allocated is
determined on the basis of what the likely effect on the aggregate economy
would be as a consequence of the resulting exploration, development, and pro-
ductivion activity. The Norwegians have been concerned about "over-heating"
the economy and thus followed a "go-slow" policy, whereas the British have
been more concerned about their balance of payments and unemployment prob-
lems and thus followed a more aggressive licensing policy. Both countries
have retained certain key blocks as part of a bargaining strategy vis-a-vis
the companies. The governments have thereby influenced not only the rate at
which dicoveries have been made, but also the sequence of discoveries.
For example, the Statfjord field in the Norwegian sector was the 32nd dis-
covery in the North Sea as indicated in Table 1. If exploration were permit-
ted to proceed unrestricted, rather that at the rate at which the Norwegian
government chose to license its blocks, this structure would most likely have
been drilled at about the same time as the Brent field which was the 11th
discovery- and adjacent to Statfjord. Such government-induced distortion of
the discovery process itself creates problems when estimating the most likely
ultimate recoverable reserves of an area as well as the rate at which these

13
reserves will be produced. The reserve potential is usually calculated
by some sort of geologic analogy as is also the case in this study as
discussed below. By distorting the process by which geologic data are
generated, the government will also distort the estimates of the ultimate
resource base. The largest structure in the North Sea is sitting on one
of the Norwegian government's key blocks. The information generated from
drilling this structure is essential to more accurate evaluation of the
North Sea resource base as well as to planning the appropriate development
of infrastructure in the North Sea which would also affect the commerciality
of smaller reservoirs that presently could not support the infrastructure
associated with an average, isolated field as defined above.
In addition to directly influencing the rate and sequence of discovery
of recoverable reserves through licensing and concession arrangements, the
government also influences the process of adding to the recoverable re-
serve base through its tax regime. In the North Sea, a tax and participation
system, rather than a bidding system, has been designed to capture the eco-
nomic rent associated with developing and producing oil and gas. An im-
portant economic variable then becomes the government's perception of how
great a rent exits. The characteristics of the oil industry in par-
ticular, and of extractive industries in general, make it more difficult
to design an appropriate tax package for such industries than for non-
extractive industries. The cost characteristics of each production unit in
a non-extractive industry are, except for possible scale effects, relatively
homogeneous across a large number of production units. In the petroleum

14
industry, however, two reservoirs discovered in the same year may have
entirely different cost characteristics due to different locations, per-
meability, porosity, formation thickness, etc. The heterogeneity of the
reservoirs and resulting tax package design problems have left much room
for misunderstanding which has created additional uncertainty and caused delays
in the development and production schedules of the North Sea. The distortive
effect of the present tax regimes and the complexity of the issues make re-
visions and further misunderstanding possible even if the learning curve
also applies to government policy-making.
The ideal tax system removes economic rent only, and hence leaves
investment unaffected at the margin. The actual tax systems of the North Sea
depart so far from the ideal that we must try to capture the effects of that
divergence [6]. For this reason, a reservoir development model has been
designed to analyze the economic viability of individual reservoirs and to
determine the physical characteristics of the marginal reservoir depending
upon the prevailing level of economic incentives. By extension, the model
also demonstrates the sensitivity of reservoir development to changing eco-
nomic conditions. The rules and regulations that determine the share of
total revenues that are being paid to the government are represented in a
detailed fashion in the reservoir model. The fiscal variables include
royalty payments, petroleum revenue tax, special tax, corporate tax, special
deduction and depreciation rules such as ring fence and uplift provisions, oil
allowance and maximum liability provisions, as well as withholding tax on
distributed dividends and capital tax. The tax systems of UK and Norway
differ in terms of their distortive effects. A discussion of the elements
of the two tax systems is beyond the scope of this paper [6, 12]. For
15
the purpose of this forecasting exercise we may assume that the Norwegian tax
system represents the North Sea fiscal regime. A more detailed empirical
analysis would have to distinguish between the geopolitical regions of the
North Sea.
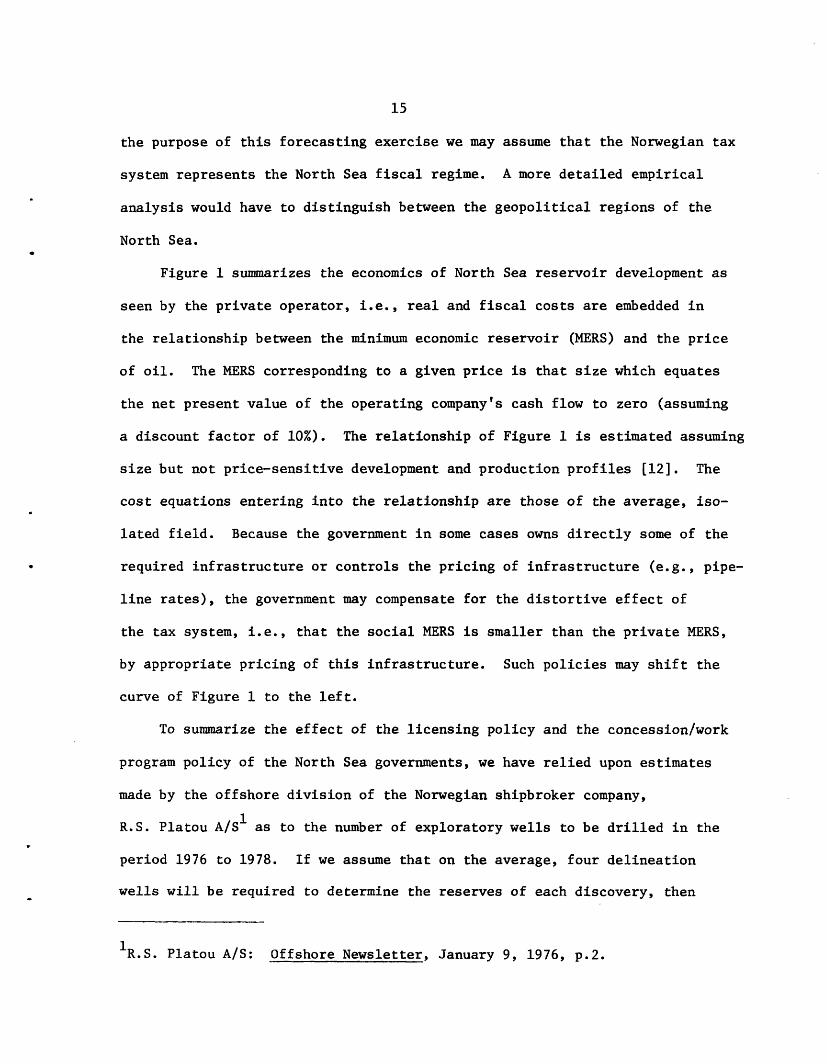
Figure 1 summarizes the economics of North Sea reservoir development as
seen by the private operator, i.e., real and fiscal costs are embedded in
the relationship between the minimum economic reservoir (MERS) and the price
of oil. The MERS corresponding to a given price is that size which equates
the net present value of the operating company's cash flow to zero (assuming
a discount factor of 10%). The relationship of Figure 1 is estimated assuming
size but not price-sensitive development and production profiles [12]. The
cost equations entering into the relationship are those of the average, iso-
lated field. Because the government in some cases owns directly some of the
required infrastructure or controls the pricing of infrastructure (e.g., pipe-
line rates), the government may compensate for the distortive effect of
the tax system, i.e., that the social MERS is smaller than the private MERS,
by appropriate pricing of this infrastructure. Such policies may shift the
curve of Figure 1 to the left.
To summarize the effect of the licensing policy and the concession/work
program policy of the North Sea governments, we have relied upon estimates
made by the offshore division of the Norwegian shipbroker company,
R.S. Platou A/S1 as to the number of exploratory wells to be drilled in the
period 1976 to 1978. If we assume that on the average, four delineation
wells will be required to determine the reserves of each discovery, then
1R.S. Platou A/S: Offshore Newsletter, January 9, 1976, p.2.
__

16
4 6 9S / bbl
FIGURE 1. MINIMUM ECONOMIC
12
RESERVOIR
15
SIZE IN THE
NORTH SEA AS A FUNCTION OF OIL PRICE
(1976 PRICES)
44
zh..a,.0Lm-0
0
E0
Nu,
E
ECc:
300
200
100
_
I I I I
J .t_

17
the Platou estimate implies a rate of 44 exploratory wells per year in the
North Sea. For the purpose of this discussion, we will assume that this
level of exploratory drilling will be maintained until economic constraints
are encountered as a result of the discovery decline behavior of the explora-
tion process.
3. THE RESOURCE BASE
Viewed as an economic process, oil supply is the depletion of a stock,
which is constantly being renewed by adding new reservoirs and expanding the
limits of the old ones. In this section, we focus on the process of
replenishing the stock of reservoirs.
The resource base may be broken down into a number of reserve categories
of economic or geologic significance. We distinguish between reservoirs which
have already been discovered and declared commercial ("existing" reservoirs);
reservoirs which have been discovered but not yet fully evaluated ("probable"
reservoirs); and reservoirs to be discovered ("discoverable" reservoirs).
Existing North Sea oil reservoirs as discussed in Table 2 contain an estimated
14.6 billion barrels of recoverable reserves, i.e., 14.6 billion barrels is
the sum of the annual production profiles presently planned for these reservoirs.
This may be considered a conservative estimate. Through a process of ex-
tension and revision as a result of production experience and additional
development, we could consider this estimate to be increased by 25 - 50%.
This process of extension and revision is disregarded in our forecasting

18
exercise, thereby biasing the future supply potential downwards.
The information available on probable reservoirs is substantially
less extensive than for the commercial reservoirs. The reservoir size
estimates of the probable fields as included in the Wood, Mackenzie estimates
of Table 2 are all substantially larger than the MERS' of Figure 1 in the
$9 - $15 price range (mid-1976 dollars), the price range considered relevant
for this exercise. They are hence all candidates for inclusion in the produc-
tive resource base as judged by the reservoir model of this study. A number
of smaller discoveries has also been made as indicated i Table 1 as well as
in more recent listings of North Sea discoveries [11]. On the basis of
guesstimates of the size of the smaller probable reservoirs of Table 1, each
of these reservoirs were run through the reservoir model to determine the price
at which these reservoirs would enter the productive reserve base. The
reservoir model was hence used to estimate the supply elasticity of the
probable reservoir category [12]. As we are in the process of updating our
data base on the potentially probable reservoirs and a fairly extensive dis-
cussion of the assumptions entering into such probable reservoir analysis is
required to be of empirical interest, we will assume that the probable
fields as listed by Wood, Mackenzie exhaust the list of candidates for the
probable reservoir category. This simplification biases, of course, the
elasticity of supply of North Sea oil downwards. The recoverable reserves
estimate of the probable reservoirs as listed in Table 2 is 5.6 billion bar-
rels.
When proceeding to the next category of reservoirs, the discoverable
reservoirs, the extent of available information is further reduced and the
uncertainty surrounding the estimates is increased. To estimate the supply

19
potential of the discoverable reservoirs, an analysis of the exploratory
process is required, the process by which the geologist's list of prospects
is transformed into an inventory of reservoirs to be developed, as determined
by the reservoir analysis. By separating the discovery/development process in
this fashion, an attempt is made to separate the geological characteristics
of an area from the economic attractiveness of the area. The separation is
not complete as the selection of the prospects to be drilled is influenced
by the expected economics of the reservoirs to be discovered.
There is no basis for predicting how each of the geologic variables
that characterize a reservoir will behave as an area is drilled up. By
properly idealizing an area, however, we may learn how the most significant
geological variable (which is a composite of a number of geological phenomena),
the number of and size distribution of the individual reservoirs to be dis-
covered, behaves as the exploration process matures. Such an idealization is
a "play". A play is defined as a group of similar geological configurations,
generated by a series of common geological events, forming a statistical
population and conceived or proved to contain hydrocarbons. There is a
substantial amount of work on the size-frequency distribution of reservoirs
at the play level [9, 10], and we have some basis for predicting the size of
discoveries to be made.
The size-frequency distribution of the discoverable reservoirs may be
estimated directly from geologic and judgmental data [8, 12], or statistically
as done by Kaufman and Barouch [2, 3]. The approach made here is an adap-
tation of the Kaufman-Barouch work. The analysis is based on two hypo-
theses, one about the nature of resource deposition and the other about the
character of oil exploration. It is assumed that reservoir size, measured in

20
terms of recoverable reserves r, is a random variable, and that its density
function is lognormal [2, 3, 9, 10]. That is, log r is normally distributed
with mean p and variance 2 . To this hypothesis about nature is added an
hypothesis about the process by which oil operators search for and find
reservoirs. Following the work of Kaufman and others [2, 3, 9, 10], the ex-
ploratory process is characterized as one of random sampling, without re-
placement, in proportion to reservoir size r. With these hypotheses, it is
possible to predict the density functions of future discoveries conditional
upon the exploratory history already experienced. The mathematics and numeri-
cal analysis techniques necessary to do these computations are beyond the
scope of this paper. See the work of Barouch and Kaufman [2].
For the purpose of the analysis, the North Sea was treated as one play,
whose discovery history is that of Table 1. The discoveries of Table 1 can,
however, be assigned to three distinct plays. We were restricted to a
"one-play" analysis by the computational resource intensity of the statistical
approach. Due to improved computational algorithms, we will be able to
perform the three-play analysis of the North Sea shortly. A reordering of the
discovery sequence of Table 1 will also be made prior to further analysis to
adjust for the effect of government licensing policy on the discovery process.
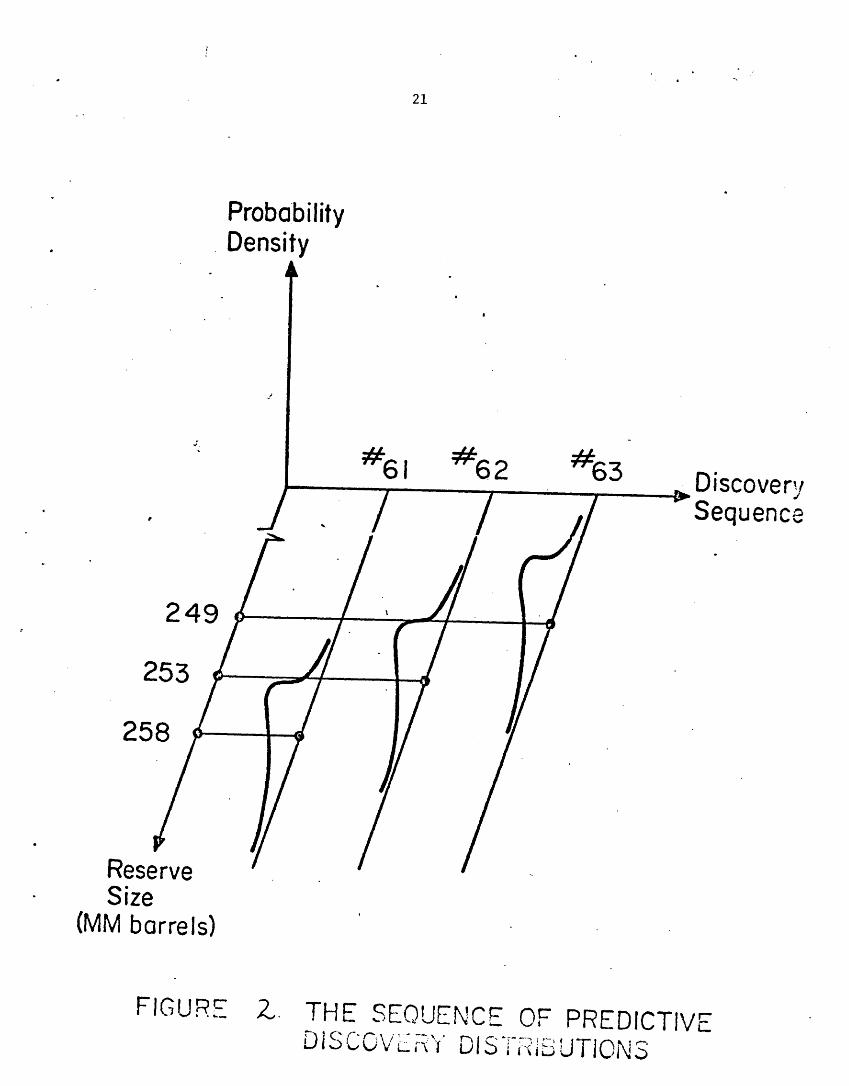
The nature of the results is shown in Figure 2, which shows predictions
of the next three discoveries. For example, the figure shows the rough shape
of the density function for the 61st discovery and the conditional expectation
of the size of the 61st discovery which, in this case, is 258 million barrels.
Figure 2 indicates how we calculate what output from a sequence of suc-
cessful discoveries might be. Given an exploratory effort determined by govern-
ment licensing policy as discussed in Section 2, the number of discoverie is
determined by the geologic risk. The geologic risk results from the lack
21
ProbabilityDensity
#62 63 Discover,Sequence
(MM barrels)
FIGURE' 2. THE SEQUENCE OFDt S'i' -i I L UTIO N
61
249
2525
PaceSize 1 V,
Size
- I(:, , V .'- -` "
PREDICTIVE

22
of technology to determine, prior to drilling, whether a prospect is in fact
a reservoir (i.e., contains hydrocarbons). In the area of analysis,
approximately every fourth wildcat has produced a reservoir. We have assumed
that this ratio will persist over the forecast period. The government-
regulated exploratory effort of Section 2 and a geologic success ratio of
0.25 imply an expected rate of 11 discoveries per year in the North Sea
until the economic incentive to further drilling is removed.
The economic risk results from the fact that some of the reservoirs
to be discovered may not contain hydrocarbons in commercially attractive
quantitites. Therefore, recognizing the variability of actual reservoir size
around the predictive mean, we need some indication of the expected number
of barrels to be found in reservoirs of various sizes. Using the predictive
density funcitons, we can calculate the "partial expectations" i.e., the
expected number of barrels to be found in reservoirs of various sizes. In
Table 4 below, four size categories have been calculated using the North Sea
example. The table shows the partial expectations of the number of barrels to
be discovered in each category in the next five successful exploratory wells.
It is evident that most of the oil is expected to be found in larger reservoirs
and that there is a process of "discovery decline" that governs the explora-
tory process.
The total increment of economic reserves in year t consists of all
current discoveries of oil in reservoirs which satisfy the MERS criterion plus
any oil from earlier discoveries which for the first time satifies this criterion.
The cumulative inventory of submarginal reservoirs is thus monitored continuously
as economic incentives fluctuate.

23
Table 4. Predictive Discovery Distributions, Oil and Gas, Millions of
Barrels Oil Equivalent
Partial Expectation, Pik' for discovery number
Size
Category, k Limits 61 62 63 64 65
1 125 to 250 18 18 18 17 17
2 250 to 375 26 25 25 25 24
3 375 to 500 31 31 30 30 30
4 over 500 176 173 169 166 163
Expected Value, E(ri) 258 253 249 244 240
24
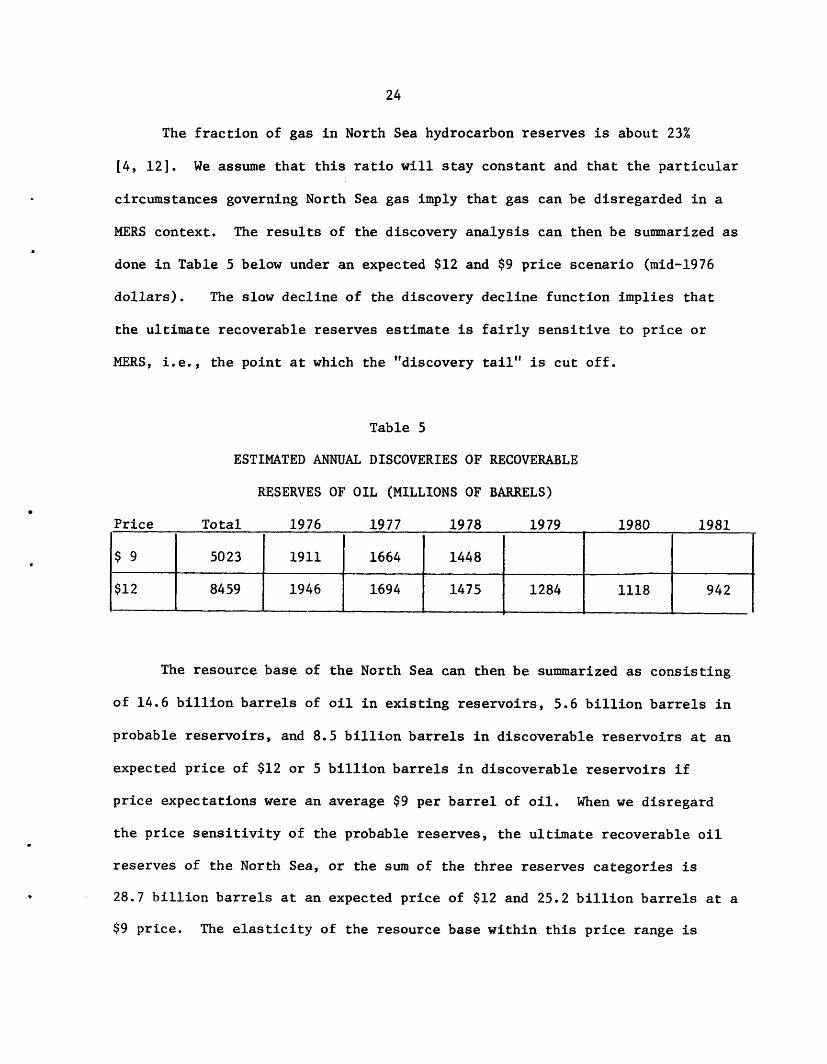
The fraction of gas in North Sea hydrocarbon reserves is about 23%
[4, 12]. We assume that this ratio will stay constant and that the particular
circumstances governing North Sea gas imply that gas can be disregarded in a
MERS context. The results of the discovery analysis can then be summarized as
done in Table 5 below under an expected $12 and $9 price scenario (mid-1976
dollars). The slow decline of the discovery decline function implies that
the ultimate recoverable reserves estimate is fairly sensitive to price or
MERS, i.e., the point at which the "discovery tail" is cut off.
Table 5
ESTIMATED ANNUAL DISCOVERIES OF RECOVERABLE
RESERVES OF OIL (MILLIONS OF BARRELS)
Price Total 1976 1977 1978 1979 1980 1981
$ 9 5023 1911 1664 1448
$12 8459 1946 1694 1475 1284 1118 942
The resource base of the North Sea can then be summarized as consisting
of 14.6 billion barrels of oil in existing reservoirs, 5.6 billion barrels in
probable reservoirs, and 8.5 billion barrels in discoverable reservoirs at an
expected price of $12 or 5 billion barrels in discoverable reservoirs if
price expectations were an average $9 per barrel of oil. When we disregard
the price sensitivity of the probable reserves, the ultimate recoverable oil
reserves of the North Sea, or the sum of the three reserves categories is
28.7 billion barrels at an expected price of $12 and 25.2 billion barrels at a
$9 price. The elasticity of the resource base within this price range is

25
thus about .42.
4. NORTH SEA OIL SUPPLY
The result of applying the disaggregated process model to our North
Sea data base is indicated in Table 6. The result is, of course, influenced by
subjective judgment and interpretation of the data base as well as of the
government policy that will regulate the activity in the North Sea in the
years to come.
The elasticity of supply of North Sea oil in 1985 is estimated at about
.67 in the $9 to $12 price range. It is higher than the elasticity of the
resource base of 0.42 because the discoverable reservoirs are smaller than the
average for the existing reservoirs and are produced at a faster rate (higher
rate of peak production). The elasticity of oil supply is, however, sensitive
to the price range. In the $12 to $15 price range, the supply elasticity is
only half as high as in the $9 to $12 range.
Table 6
NORTH SEA OIL SUPPLY ESTIMATES
(Million Barrels Per Day, 1976 Prices)
1980 1985
$9 $12 $9 $12
Existing Reservoirs 2.89 2.89 2.39 2.39
Probable Reservoirs 0.32 0.32 1.43 1.43
Discoverable Reservoirs 0.47 0.48 1.68 2.87
TOTAL 3.68 3.69 5.50 6.69

26
The estimate of a supply elasticity of 0.67 is conservative as we have
assumed away any price elasticity of existing and probable reservoirs. The
degree to which we will experience extensions and revisions of existing
reservoirs as well as having more recently discovered reservoirs added to
the list of probable reservoirs is also a function of the prevailing price
expectations. We are in the process of gathering data for an analysis of the
elasticity of supply of these reservoir categories.
To increase the empirical validity of the analysis, we are presently
gathering data that will allow us to more fully exploit the disaggregated
model's ability to handle the complexity of the process of oil supply. As
reported above, reservoir size only is determining development and operating
costs. Additional data and engingeering-type analysis will allow us to specify
costs as a function of the five reservoir characteristics of Table 3 [5].
This is significant for the ability to explain costs as drilling is moved into
deeper waters or a different environment. The rate of introduction of new
technologies is also to be built into the cost equations. The emerging
sub-sea completion technology may significantly affect offshore development
costs in the years to come.
The discovery analysis as reported above allows us only to predict
discoveries within the geographic location of a play. Prospect information
is required to determine the likely location of new discoveries relative to
existing discoveries and infrastructure. Prospect data would thus allow us to
operate with a larger set of reservoir categories for MERS purposes.
The governments of the North Sea also have a number of participation
options that affect the MERS as seen by a private operator. The British

27
version is neutral, the Norwegian version, however, "carried interest"
participation, increases the MERS.
There is some administrative freedom in the fiscal regimes as they
affect the North Sea activity. Tax and royalty reimbursement and direct
and indirect subsidies are possible under the present regulatory regimes.
These options may be exploited as the North Sea matures and may decrease
the private MERS towards the social MERS. This effect may also be obtained by
changing the structure of the fiscal system itself.
A reordering of the discoveries of Table 1 to adjust for the impact of
government policy on the discovery process and estimating predictive dis-
covery density functions for three separate North Sea plays are also likely
to affect our forecasts, as will more recentdiscovery data and the likely
discovery of additional plays. As an area matures, the geologic risk or the
success ratio is ikely to be affected. A more sophisticated analysis
of the geologic risk and the rate of exploratory drilling is presently being
undertaken. The last item on the list of immediate research tasks is the
assumption of a constant gas/oil ratio and the economics of North Sea gas
which affects the MERS of associated gas fields and the economic incentive to
drill.
The single, most important event as far as North Sea supply is con-
cerned, would be the dtril yit2 'tbl~Tih I est t 'tu1ir' in ha Nrth : Sea, lying
on acreage held by the Norwegian government. This structure, if not dry, might
contain 5 to 1 SibTliii batfteist`f tveiati ser etd arnd hu icormpietel-y
change the supply ptehtial &6f t'-heegi>ll i.& r WbIrw tta'ing for this
structure to be (drilled, thestiti 6.Ftablei :alr-ous gbst guesses as to
the 1980 and 1985 up'ply of' Nrth Seab "I.. .. '
,.r `··i ~ ~ ~ ~ 2]

28
REFERENCES
1. Adelman, M.A. and .D. Jacoby, "Alternative Methods of Oil SupplyForecasting", prepared for the International Energy Agency Workshopon Energy Supply in Paris, France, November 15-19, 1976.
2. Barouch, E. and G.M. Kaufman, "Oil and Gas Discovery Modeled asSampling Proportional to Random Size", M.I.T. Sloan School ofManagement, Working Paper WP 888-76, December 1976.
3. Barouch, E. and G.M. Kaufman, "Probabilistic Modeling of Oil and GasDiscovery", in Energy: Mathematics and Models, SIAM Institute forMathematics and Society, 1976.
4. Beall, A.O., "Dynamics of Petroleum Industry Investment in the NorthSea", M.I.T. Energy Labroatory Working Paper No. 76-007, June 1976.
5, Beck, F.M. and K. Wiig, The Economics of Offshore Oil and Gas Supply,Lexington Press, Lexington, Mass., August 1977.
6. Eckbo, P.L., "PLanning and Regulation in the North Sea", NorthernOffshore, No. 9, September 1976.
7. Eckbo, P.L., H.D. Jacoby, and J.L. Smith, "Oil Supply Forecasting:A Disaggregated Process Approach", M.I.T. World Oil Project,Working Paper No. MIT-EL 77-007WP, February 1977.
8. Ivanhoe, L.F., "Economic Feasibility Appraised for Petroleum Search inRemote Regions", The Oil and Gas Journal, December 20, 1976.
9. Kaufman, G.M., "Statistical Analysis of the Size Distribution of Oiland Gas Fields", in Symposium on Petroleum Economics and Evaluation,AIME; 1965.
10. Kaufman, G., Y. Balcer and D. Kruyt, "A Probabilistic Model of Oil andGas Discovery" in Studies in Petroleum Exploration, No. 1 AIME; 1975.
11. Lovegrove, M., "The Development of Oil and Gas Reserves on the UKand Norwegian Sectors of the Continental Shelf Off North-WestEurope", Paper presented to an OECD Workshop, November 1976.
12. M.I.T., World Oil Project, Supply AnalysisGroup, "Supply ForecastingUsing Disaggregated Pool Analysis", M.I.T. Energy LabroatoryWorking Paper No. 76-009WP, May 17, 1976.
13. "Petroleum Economist" August 1976, p. 316.
14. Wood, Mackenzie & Co., "Section 2 of the North Sea Service", Edinburgh,June 9, 1976.
15. Wood, Mackenzie & Co., "North Sea Report", Edinburgh, May 14, 1976.
16. Wood, Mackenzie & Co., "North Sea Report", Edinburgh, February 1977.