Embed Size (px)
Citation preview
Page 1
The Sustainability Footprint of Institutional Investors
Rajna Gibson Brandon and Philipp Krüger*
First version: 31 August 2016 This version: 14 January 2018
Abstract
Little is known about the environmental and social (or sustainability) preferences of 13F institutional investors. In this paper, we propose a novel measure to quantify the portfolio-level sustainability of institutional investors. We show that portfolios of institutions with longer investment horizons exhibit higher sustainability and that risk-adjusted performance is positively related to sustainability, primarily through a reduction of portfolio risk. Using exogenous shocks to investor sustainability induced by natural disasters we provide evidence of a causal impact of sustainability on risk-adjusted performance. An instrumental variable strategy using geographic variation in constituency statutes further supports a causal interpretation of our results.
JEL classification: G20, G23, G30, M14, Q01, Q50
Keywords: Investment horizon, institutional investors, sustainability footprint, portfolio turnover, risk-adjusted performance, CSR, ESG impact, socially responsible investing, sustainable investing, impact investing
* University of Geneva, Swiss Finance Institute, Geneva School of Economics and Management (GSEM), and Geneva Finance Research Institute (GFRI); Bd du Pont d'Arve 40, 1211 Geneva 4, Switzerland; Rajna Gibson Brandon, [email protected]; Philipp Krüger, [email protected]. We that the Principles for Responsible Investment (PRI) for awarding this paper the Best quantitative paper award at the PRI Academic Network Conference in 2017. We thank Jean Noel Barrot and Julien Sauvagnat for sharing their natural disaster data with us. We also thank Sudheer Chava, Robert Davidson, Alberta Di Giuli, Guido Giese (MSCI), Michele Doronzo, Guido Fuerer, Valentin Jouvenot, Leonard Kostovestky, Ioannis Oikonomou and Pascal Zbinden as well as seminar audiences at SKEMA Business School, the 6th Luxembourg Asset Management Summit, SwissRe, Bocconi University, University of Maastricht, University of Muenster, the SFI Annual meeting 2016, the SFI Research Days in Gerzensee, The Chinese University of Hong Kong, the 4Nations Cup 2017, the Review of Finance Shanghai Green Finance Conference, Ecole Hôtelière de Lausanne, Shanghai University of Finance and Economics, the PRI Academic Network Conference 2017, 2nd Oklahoma University Energy Finance Conference, and the Ackerman Conference on Corporate Governance for helpful discussions and constructive comments and suggestions. Valentin Jouvenot provided excellent research assistance. We are grateful to MSCI for providing data and to Juan Carlos Calderon for clarifying data issues.
Page 2
I. Introduction
Institutional investors such as mutual funds, hedge funds, pension funds, or insurance
companies play a central role in today’s stock markets. Accordingly, institutional investors have
been extensively studied in a variety of contexts. McConnell and Servaes (1990) provide early
evidence on a positive relation between firm value and institutional ownership. Other studies
have, for instance, addressed issues such as the impact of institutional investors on firms’
research and development (R&D) spending (see Bushee (1998)), on their stock prices (see
Gompers and Metrick (2001)), or institutional investors’ monitoring incentives (see Gaspar,
Massa, and Matos (2005) or Chen, Harford, and Li (2007)).1
Apart from a few recent contributions, however (see, for instance, Hong and Kostovetsky
(2012), Dimson, Karakaş, and Li (2015), Dyck et al. (2016), Hoepner et al. (2016), Nofsinger,
Sulaeman, and Varma (2016), Fernando, Sharfman, and Uysal (2016), Amel-Zadeh and Serafeim
(2017), Barber, Morse, and Yasuda (2017), or Chen, Dong, and Lin (2017)), financial economics
research has left unanswered important questions regarding institutional investors’ preferences,
attitudes, and policies with respect to sustainability (or corporate social responsibility, CSR)
issues.2
The limited scientific knowledge on the role of environmental and social issues at the
institutional investor-level is surprising not only in light of the academic attention such issues
have received at the firm-level (see, for instance, De Bettignies and Robinson (2015), Liang and
Renneboog (2017), or Lins, Servaes, and Tamayo (2017)), but also when considering anecdotal
evidence suggesting that institutional investors increasingly care about these issues: for instance,
as of October 2016, about 1,500 finance institutions representing assets under management of
about $62 trillion worldwide have adopted the Principles for Responsible Investment (PRI)3. In a
similar spirit, according to the U.S Forum for Sustainable and Responsible Investment4 more than
one out of every five dollars under professional management in the United States was invested
according to some form of sustainable investment at the end of 2015 (see USSIF, 2016).
1 See section II.A for a more detailed literature review. 2 More specifically, when referring to sustainability, we have in mind a broad set of environmental (E) and social (S) topics, such as natural resource use, ecosystems services, air and water pollution, carbon emissions, employee relations, gender and diversity issues, labor- and human rights, community relations, or business ethics. 3 See http://www.unpri.org/about 4 See http://www.ussif.org
Page 3
This paper contributes to the emerging literature studying sustainability at the institutional
investor-level by systematically assessing the sustainability characteristics of 13F institutional
investors’ stock portfolios and relating their portfolio-level sustainability to their risk-adjusted
investment performance. We pursue two main objectives: First, we propose novel measures to
quantify the environmental, social, and aggregate sustainability footprint (or “impact”) at the
institutional investor stock portfolio-level. The measures we propose are based on a combination
of (i) institutional investor equity holdings as reported in quarterly 13F filings to the SEC and (ii)
stock-level environmental and social scores collected from different data providers. Secondly, we
want to understand why specific institutions hold sustainability oriented stock portfolio
allocations. For that purpose, we examine whether and how these footprint measures are related
to the institutions’ investment horizons and relate their portfolio-level risk and return
characteristics to their sustainability footprint measures.
To attain our second objective, we draw on Bénabou and Tirole (2010) and derive two
distinct hypotheses as to why institutional investors might choose sustainable stock portfolio
allocations. The first view, which we refer to as the “overcoming short-termism“ hypothesis,
suggests that institutional investors choose sustainability oriented portfolio allocations because it
allows them to take a long-term perspective and maximize (inter-temporal) risk-adjusted
investment performance. The second view, which we refer to as the “managerially driven
philanthropy” hypothesis, suggests that investor-level sustainability policies reflect managers’
own self-serving aspirations to engage in sustainability for reasons rooted in self- and social-
image concerns. We conjecture that if the “overcoming short-termism” hypothesis holds, long-
term oriented institutions should have better (that is higher) sustainability footprints. More
importantly, institutional investors with better sustainability footprints should also exhibit better
risk-adjusted investment performance under this hypothesis. In contrast, under the “managerially
driven philanthropy” hypothesis, risk-adjusted performance should be negatively related to
sustainability footprints.
In a first set of empirical tests, we examine predictions regarding the relationship between
investment horizon and sustainability footprints that are necessary to support the “overcoming
short-termism” hypothesis. We relate sustainability footprints to proxies of investor horizon. To
measure investment horizon, we first use a common investor classification (see Bushee (2001)
and Abarbanell, Bushee, and Raedy (2003)) that categorizes investors according to their fiduciary
Page 4
responsibilities and legal types. Secondly, we employ portfolio turnover (see Carhart, (1997)) as
a time varying measure of investment horizon. We provide evidence that longer term oriented
institutional investors—as defined either by investors’ legal types (e.g., pension funds or
insurance companies) or by low portfolio turnover—are characterized by significantly higher (i.e.
better) environmental, social, and overall sustainability footprints. In contrast, investors with
shorter investment horizons (e.g., independent investment advisors) have significantly worse
sustainability footprints. These results on the positive relation between sustainability and
investment horizon should be interpreted with caution since it is possible that institutions’
sustainability preferences and their investment horizon are endogenously determined. However,
the results on the negative relation between sustainability and turnover remain robust to including
various types of fixed-effects (e.g., at the institutional investor-, institution-type-, and country-
level), allowing us to rule out that unobservable factors are driving the results. Our empirical tests
are also robust to different ways of measuring sustainability footprints (e.g., equally weighted vs.
value weighted) and trading intensity (e.g., portfolio “churn” in the spirit of Gaspar, Massa, and
Matos, (2005)).
In a second step, we then test a sufficient condition for distinguishing between the
“overcoming short-termism” and the “managerially driven philanthropy” hypotheses, that is, we
relate institutions’ risk-adjusted portfolio performance to their sustainability footprints. We find
that institutional investors’ risk-adjusted returns at both shorter (i.e., quarterly) and longer (i.e.,
annual) horizons are higher for investors with better sustainability footprints. This positive
relationship is more pronounced at the annual horizon and appears to be primarily driven by a
negative relation between total portfolio risk and sustainability footprints.
To argue for a causal interpretation of the relationship between sustainability footprints
and risk-adjusted performance, we rely first on an identification strategy that isolates exogenous
variation in institutional investor-level sustainability by using the occurrence of natural disasters.
The idea behind this identification strategy is that the occurrence of natural disasters close to the
institutional investors’ headquarters provides exogenous shocks to the institutional investors’
sustainability preferences. Research in behavioral finance has shown that experiencing
macroeconomic shocks has a profound impact on individual risk-taking behavior (see
Malmendier and Nagel (2011)). We conjecture that experiencing natural disasters (in particular,
those related to extreme weather events) similarly affects individuals’ attitudes and preferences
Page 5
towards sustainability issues. Our identification strategy is motivated by the availability heuristic
(see Tversky and Kahneman (1974)), which postulates that judgments and individual behavior
are disproportionally influenced by information and facts that immediately spring to the mind of
the decision maker. Indeed, Demski et al. (2017) show that when individuals experience extreme
weather events, they tend to act more strongly on sustainability related issues, a behavior that
should thus also apply to decision-makers working for the institutional investors we study in this
paper.
Using twenty major natural disasters in the U.S. between 2002 and 2013 in combination
with data on the geographic location of institutional investors’ headquarters, we show that
institutional investor-level sustainability footprints improve after the investors’ headquarters are
hit by natural disasters (“treatment”).5 In order to address the concern that our results are driven
by the institutions’ holdings of local stocks--which might also be affected by the natural
disasters--we use footprint measures that deliberately exclude local stock holdings and find
similar results.6 In other words investors seem to increase their exposure to high sustainability
stocks in areas that are not directly hit by the natural disasters. In addition, we use equally
weighted footprint measures whose weights are independent of market prices, ruling out the
possibility that our results are primarily driven by stock price effects. We also show that investors
improve their environmental footprints more than their social footprints, consistent with the view
that exposure to weather related natural disasters make fund managers more inclined to invest in
an environmentally responsible way.
In a second step, we show that following the natural disaster treatment, risk-adjusted
performance is positively related to sustainability footprints for treated institutions. This evidence
suggests that the relationship between risk-adjusted performance and sustainability footprints is
likely to be causal.
To further support a causal interpretation of the relation between sustainability and risk-
adjusted performance, we also rely on an instrumental variable (IV) strategy. Our instrument
exploits geographic variation in the existence of state-level constituency statutes that provide a
legal framework for directors to explicitly consider non-shareholder interests in their decision
5 We use the same natural disasters as Barrot and Sauvagnat (2016). 6 This might be due to due to institutions’ preferences for local stocks (see Coval and Moskowitz, 1999) or political considerations in which local pension funds might be inclined to invest in locally headquartered stocks.
Page 6
making (see Geczy et al. (2015) or Flammer and Kacperczyk (2016)). The instrument, which
varies at the institutional investor’s incorporation state-level, is the length of time a state has had
such stakeholder oriented constituency statutes in place. The instrument is highly significant in
the first stage regression and two stage least squares estimates continue to show a significant
positive impact of the sustainability footprint on institutional investors’ risk-adjusted
performance.
Thus, taken together, our empirical evidence is consistent with the “overcoming short-
termism” hypothesis.
We believe that our study makes several important contributions to the literature. First, to
the best of our knowledge, our study is the first to propose measures that systematically quantify
the environmental, social, and aggregate sustainability footprint of 13F institutional investor
stock portfolios and relate these measures to proxies of investor horizon. Second, we know of no
other paper that studies the cross section of 13F institutional investors’ sustainability footprints
and the relationship between their sustainability footprints and risk-adjusted financial
performance. We also contribute to the literature examining the link between risk-adjusted
investment performance and sustainability (see, for instance, Geczy, Stambaugh, and Levin
(2005)) by showing in a quasi-experimental setting that higher sustainability seems to cause
better risk-adjusted investment performance.
The rest of the paper is structured as follows: In section II, we discuss the related
literature and develop our main hypotheses. In section III, we describe the data and discuss how
we construct the main variable of interest, i.e. the sustainability footprint at the institutional
investor portfolio-level. In section IV, we present the main empirical results on the relationship
between sustainability footprints and proxies for institutional investors’ investment horizon and
also examine how footprints relate to risk-adjusted investment performance. In section V, we
discuss the two empirical strategies we employ to causally relate sustainability footprints to
institutional investors’ risk-adjusted investment performance. Section VI concludes.
II. Related literature and hypothesis development
A. Related literature
Page 7
A large body of finance, economics, and management research has, in a variety of
settings, attempted to answer a range of different questions related to sustainability (or CSR) at
the firm-level. For instance, prior research has examined the characteristics of firms engaging in
sustainability activities and their motivations for doing so. Cheng, Hong, and Shue (2016) show
that firm-level sustainability is partly due to agency problems (see also Bénabou and Tirole
(2010) or Masulis and Reza (2014)). In contrast, Ferrell, Liang, and Renneboog (2016) provide
evidence that well-governed firms engage more strongly in sustainability. Using an international
sample of firms, Liang and Renneboog (2017) explore other determinants of firm-level
sustainability and find that a country’s legal origin (see La Porta, Lopez-de-Silanes, Shleifer, and
Vishny (1998)) is a much more fundamental determinant of a firm’s sustainability than firm-level
variables. Other research has focused on financial constraints (see Hong, Kubik, and Scheinkman
(2012)), the political views of corporate decision makers (see Di Giuli and Kostovestsky (2014)),
or other preferences of corporate decision makers (see Cronqvist and Yu (2017)) as important
factors influencing firm-level sustainability.
Another large stream of literature has examined the relationship between sustainability
and financial performance. At the investor-level, some empirical studies find no (see, for
instance, Hamilton, Jo, and Statman (1993)) or negative effects (see Geczy, Stambaugh, and
Levin (2005), Renneboog, Ter Horst, and Zhang (2008), or Hong and Kacperczyk (2009)) of
sustainability on investment performance. Other studies, by contrast, find that sustainability can
enhance investment performance. For instance, Statman and Glushkov (2009) show that
portfolios based on sustainability signals can outperform on a risk-adjusted basis. At the firm-
level, Lins, Servaes, and Tamayo (2017) show that during the 2008-2009 financial crisis, firms
with high sustainability experienced four to seven percentage points higher stock returns than
firms with low sustainability. Servaes and Tamayo (2013) show that sustainability and firm value
are positively related for firms with high customer awareness. Eccles, Ioannu, and Serafeim
(2014) show that portfolios of high sustainability firms outperform portfolios of matched low
sustainability firms. In a similar spirit, Edmans (2011) documents that investing in the “best
companies to work for in America” yields significantly positive risk-adjusted performance. At the
firm-level, Deng, Kang, and Low (2013) show that high sustainability results in better post-
acquisition performance. Ferrell, Liang, and Renneboog (2016) document that high sustainability
firms have higher firm value. Krüger (2015) examines short-term financial valuation effects of
Page 8
positive and negative sustainability news and provides and shows that negative news about a
firm’s environmental and social impact lead to substantial declines in firms’ equity market
valuations.
While there is increasing evidence regarding a positive relationship between sustainability
and financial performance, the exact mechanisms through which sustainability translates into
firm value still remain ambiguous as it is often hard to establish the direction of causation. A
notable exception is Flammer (2015), who relies on a regression discontinuity design to show
that higher sustainability causes higher firm-value. Our paper also uses quasi-experimental
methods, thereby contributing significantly to advancing our understanding of whether
sustainability causes risk-adjusted performance at the institutional investor-level.7
We also contribute to the empirical literature studying the behavior and heterogeneity of
institutional investors. In addition to the papers mentioned in the introduction, other papers have
explored the role of institutional investors in shareholder proposals (see Gillan and Starks
(2000)), their impact on executive compensation (see Hartzell and Starks (2003)), or more
generally focused on institutional investors’ attitudes towards corporate governance (see
McCahery, Sautner, and Starks (2016)). The literature on the heterogeneity of institutional
investors has also examined the implications of investment horizons for issues such as
monitoring of firms’ managers, trading, or price formation. Gaspar, Massa, and Matos (2005)
study how the investment horizon of a firm's institutional shareholders impacts the market for
corporate control. Chen, Harford, and Li (2007) empirically study which kinds of institutional
investors matter for monitoring managers and find that independent long-term institutions with
concentrated holdings tend to monitor more intensively. More recently, Harford, Kecskes, and
Mansi (2017) show that long-term investors strengthen corporate governance and restrain
managerial misconduct and that through their influence on corporate policies, shareholders
benefit through both unexpectedly higher profitability and lower risk. Yan and Zhang (2009)
show that the positive relation between institutional ownership and future stock returns (see
Gompers and Metrick (2001)) is mainly due to short-term oriented institutions. Cella, Ellul, and
Giannetti (2013) show that during periods of market turmoil there is increased price pressure for
7 Other studies have examined issues such as the relation between systematic and idiosyncratic risk on the one hand and sustainability on the other (see, for instance, El Ghoul et al. (2011), and Albuquerque, Durnev, and Koskinen (2016)).
Page 9
stocks held mostly by short term oriented institutional investors (i.e. investors with high portfolio
churn). In contrast, Derrien, Kecskés, and Thesmar (2012) show that longer investor horizons
attenuate the effect of stock mispricing on corporate policies.
Finally, we add significantly to the emerging literature that studies sustainability at the
institutional investor-level. Hong and Kostovetsky (2012) show that democratically inclined
fund-managers hold more sustainable investment portfolios. Relying on proprietary data from
one large UK based institutional investor, Dimson, Karakaş, and Li (2015) study private (or
behind-the-scene) sustainability oriented shareholder engagements and show that successful
engagements generate shareholder value. Using archival data, Dyck et al. (2016) show that firm-
level sustainability is related positively to institutional ownership. They also show this
relationship to be strongest for ownership by institutional investors based in countries with strong
social norms. Hoepner et al. (2016) show that institutional investors’ shareholder engagements on
environmental, social, and governance (ESG) issues reduce firms’ downside risk. Nofsinger,
Sulaeman, and Varma (2016) study institutional ownership in firms with good and bad
environmental and social performance. Amel-Zadeh and Serafeim (2017) survey senior
investment professionals working at institutional investors to examine why and how investors use
ESG information in the investment process. Chen, Dong, and Lin (2017) show that higher
institutional ownership and more concentrated shareholder attention induce corporate managers
to invest more in sustainability activities.
B. Hypothesis development
In order to better understand institutional investors’ motivations for choosing more
sustainable stock portfolio allocations, we draw on Bénabou and Tirole (2010) who set forth
three motivations for why firms would engage in sustainability related activities. The first view,
which they refer to as “doing well by doing good”, states that managers engage in sustainability
activities because this would allow them to take a long-term perspective and maximize inter-
temporal profits. Secondly, Bénabou and Tirole (2010) argue that managers engage in
sustainability because firms are better placed to efficiently “express citizen values” on behalf of
their stakeholders (e.g., because of lower transaction costs or informational advantages). This
second hypothesis—which some refer to as “delegated philanthropy” (see Dimson, Karakas, and
Li (2015))—is also consistent with firm value enhancement and, as Bénabou and Tirole (2010)
Page 10
point out, hard to distinguish empirically from the ”doing well by doing good view”. The third
and more negative view put forth by Bénabou and Tirole (2010) is one of “managerially driven
philanthropy” according to which firms’ CSR oriented policies would reflect managers’ or board
of directors’ own self-serving aspirations to engage in philanthropy for reasons rooted in self- and
social-image concerns. Sustainability activities driven by the latter motivation would ultimately
be detrimental to firm-value. The third view is also observationally equivalent to the commonly
held view that sustainability at the firm-level is a sign of agency problems whereby managers
further their own personal benefits at the expense of shareholders (see Masulis and Reza (2014)
or Cheng, Hong, and Shue (2016)).
We assert that the first and third view, i.e., “doing well by doing good” and “managerially
driven philanthropy” may also apply to institutional investors and explain why institutions choose
to pursue sustainability oriented portfolio allocations. Based on Bénabou and Tirole’s (2010)
characterization of these alternative explanations, we define and test both a necessary and a
sufficient condition that underpin the first view, which we will from now on refer to as the
“overcoming short-termism” hypothesis. The necessary condition to support the “overcoming
short-termism” hypothesis states that long-term oriented institutions care more about
sustainability issues than short term oriented ones. We therefore test whether more long-term
oriented institutions display better (that is higher) sustainability footprints. The sufficient
condition to support the “overcoming short-termism” hypothesis states that institutional investors
with better sustainability footprints should also exhibit better risk-adjusted (long-term)
investment performance. In a second step, we thus test if sustainability footprint positively affects
risk-adjusted investment performance. In contrast, under the “managerially driven philanthropy”
hypothesis, risk-adjusted performance should be negatively related to sustainability footprints.
III. Data and variable definitions
A. Stock-level sustainability scores
We start by building a stock-level dataset. To do so, we obtain stock-level sustainability
scores from Thomson Reuters and MSCI for U.S. stocks, which we merge with CRSP8 and
Compustat. The sample period runs from 2002 to 2015. Both Thomson Reuters and MSCI9
8 We restrict ourselves to stocks with CRSP share codes 10 and 11. 9 See http://goo.gl/M1j7Sd and http://goo.gl/65LDYu
Page 11
provide structured and standardized sustainability research data and scores at the stock-level. The
scores are organized along three pillars, i.e. environmental, social, and governance (ESG). We
use the overall environmental and social pillar scores from Thomson (i.e., the variables
ENVSCORE and SOCSCORE) and MSCI (i.e., the variables
ENVIRONMENTAL_PILLAR_SCORE and SOCIAL_PILLAR_SCORE). These pillar scores
capture the overall social and environmental quality of the company’s policies and products. For
instance, Thomson’s social pillar score captures issues such as the firm’s relationship with its
workforce, respect of human rights, relations with communities, and product responsibility. In a
similar spirit, the environmental score captures issues like firms’ overall resource use, all sorts of
environmental emissions (i.e., including CO2), other environmental aspects of the production
process such as the use of renewable energy as well as environmental innovation (which
quantifies the extent to which the company offers environmentally friendly products and
services). While MSCI and Thomson use proprietary methods to construct their scores, the set of
relevant issues that feed into the construction of their scores are similar.
The stock-level coverage by the two data providers is low at the beginning of the sample
period, but rises gradually. For instance, MSCI covers on average about 500 stocks between 2002
and 2011. The coverage increases to more than 2,000 firms by 2012. Coverage for Thomson
Reuters is lower with, on average, about 400 stocks between 2002 and 2011 and about 700 stocks
between 2011 and 2015.
----Table 1 about here----
We denote by Envir_A4 (Social_A4) the environmental (social) score from Thomson, and
analogously, by Envir_MSCI and Social_MSCI the corresponding scores from MSCI. To make
scores comparable between data providers, we rescale the Thomson scores such that both
measures have the same support (between 0 and 10). High values indicate positive (or good)
stock-level sustainability performance, while low values indicate negative (bad) performance.
Panel A of Table 1 shows summary statistics for the MSCI-Thomson-CRSP-Compustat merged
sample at the annual frequency. While average values are quite similar for both the MSCI and
Thomson Reuters scores (i.e., between 4 and 5), the cross-sectional dispersion is higher for
Thomson’s stock-level sustainability scores. However, Thomson does not use the full support of
the distribution: while the minimum and maximum stock-level scores are 0 and 10 for the MSCI
Page 12
scores, the Thomson Reuters minimum (maximum) social scores are 0.35 and 9.88 (respectively
0.83 and 9.75 for the environmental score).
We now compute, whenever possible, a combined score using the scores from both data
providers. Taking the environmental scores as an example, we calculate
, _ , _
, ,,
where 1 , (1 , ) is a dummy variable indicating if the MSCI (Thomson) environmental
score is available for stock i in period t. This approach consists of using the average score
whenever both MSCI and Thomson scores are available, and using only the available score
whenever a stock is not covered by both data providers. We choose this approach to obtain the
largest possible sample of stock-level sustainability scores.10 We repeat the same procedure to
calculate the combined social score, which we denote by . Next, we calculate our main
stock-level sustainability score by taking the average environmental and social score at the stock-
level, that is 0.5 . The average (median) value of is
4.36 (4.2).
----Figure 1 about here----
In Panel A, Figure 1, we plot the distribution of Susty as well as the distributions of its
component parts Envir and Social. The histograms show that the distributions of all three
variables are non-normal and exhibit considerable cross-sectional variation. Relatively few stocks
have high sustainability scores: only about 2.5 percent stock-years have a sustainability score
exceeding 8.
In order to get a better idea of the characteristics of stocks for which we observe
sustainability scores, we report in Panel B of Table 1 summary statistics for the CRSP-Compustat
universe over the time period. Compared to the average CRSP-Compustat firm (Panel B, Table
1), stocks that are covered by MSCI and Thomson (Panel A, Table 1) tend to be larger (roughly
three times the average market cap, assets, sales, and number of employees), have lower cash
holdings, and higher return on assets. There seem to be no substantial differences in terms of
10 In the Internet appendix we conduct analysis in which we use the scores from both data providers separately, leading to similar conclusions.
Page 13
capital expenditures or capital structures. About 40 percent of the firm-year observations belong
to S&P500 firms suggesting that Thomson and MSCI also cover some small and midcap firms.
In addition to the standard environmental and social scores from MSCI and Thomson, we
also use the recently launched MSCI ESG Sustainable Impact Metrics.11 Since 2015, MSCI
provides data that allow investors to identify firms that provide products or services addressing
the major social and environmental challenges identified by the UN Sustainable Development
Goals (UN SDGs).12 MSCI has broken down the 17 Sustainable Development Goals into four
impact themes: 1. basic needs, 2. empowerment, 3. climate change, and 4. natural capital. These
four impact themes belong to an environmental or social pillar. MSCI estimates companies’
revenue exposure to all four impact themes. These measures capture how much of a firm’s
revenue is derived from products and services related to the themes. Examples include, but are
not limited to, products and services that attempt to resolve water scarcity, water quality, or the
provision of basic products that contribute to the daily intakes of essential nutrients. We focus on
the variable SI_SUST_IMPACT_MAX_REV, which quantifies the fraction of a firm’s total
revenues derived from selling products and services related to any of the social and
environmental impact themes identified by MSCI. We also use the variable
CT_TOTAL_MAX_REV, which captures the fraction of revenues derived from products and
services addressing environmental themes (e.g., alternative energy, energy efficiency, green
building, pollution prevention, or sustainable water), as well as the variable
SI_TOTAL_MAX_REV, which measures all revenues derived from products and services to social
impact themes (e.g., major diseases treatment, SME finance, education or affordable real estate).
The overall, social, and environmental impact measures are denoted by SDG impact, Envir
impact, and Social impact. Given the novelty of the data, the variables are only available for 2015.
Panel A of Table 1 shows that on average the sample stocks derive 6.27 % of their revenues from
products and services addressing at least one of the SDG themes. The corresponding figures for
revenues derived from environmentally and socially related SDG themes are 4.82 and 1.44
percent. Overall, we thus observe that firms derive a low fraction of their revenues from products
and services that address SDGs.
11 See http://www.msci.com/esg-sustainable-impact-metrics 12 The UN SDGs are an intergovernmental set of 17 aspiration goals with 169 specific targets that were adopted in 2014 by the UN General Assembly. (see http://www.un.org/sustainabledevelopment/sustainable-development-goals)
Page 14
B. Institutional investor-level sustainability footprints
The first objective of this paper is to quantify the sustainability footprint at the
institutional investor portfolio-level. To do so, we obtain institutional investor equity holdings
data from 13F filings.13 We focus on institutional-investor holdings of common stocks that can be
linked with CRSP and Compustat. We combine the annual stock-level sustainability scores
described in section III.A with the quarterly 13F stock holdings data to calculate quarterly
footprint measures at the institutional investor-level. Our main variable of interest is the overall
sustainability footprint of the institutional investor, which we define as
_ ∑ ,
where wijt denotes the value-weight of stock i in investor j’s portfolio in quarter t, Sustyit-1 the
sustainability score of stock i in quarter t-1, and Njt the total number of stocks investor j holds in
quarter t for which stock-level sustainability scores are available. This variable quantifies the
sustainability footprint of institutional investor j in quarter t as the weighted average
sustainability score of the stocks that make up the institution’s portfolio. The sustainability
footprint of the investor thus depends on (i) the sustainability scores of the individual stocks in
the investor’s portfolio and (ii) the size of the individual stock holdings. Analogously, we
calculate the social and environmental footprints by individually using the two components of the
stock-level sustainability score, that is _ ∑ and _
∑ . 14 We also calculate footprint measures that are restricted to the investor’s
holdings in S&P 500 stocks, which we denote by Social_VW_SPjt, Envir_VW_SPjt, and
Susty_VW_SPjt.
In Panel B of Figure 1, we plot the distributions of Social_VW, Envir_VW, and Susty_VW.
The histograms reveal that there is considerable dispersion in the footprint measures and that
relatively few institutions possess very good footprints (that is high values). The distribution of
13 The Securities and Exchange Commission (SEC) requires all institutional investment managers who exercise investment discretion over $100 million or more in Section 13(f) securities to report, at the end of each calendar quarter, their holdings on Form 13F. Section 13(f) securities include equity securities that trade on exchanges, certain equity options and warrants, shares of closed-end investment companies, and certain convertible debt securities. The shares of open-end investment companies (i.e., mutual funds) are not Section 13(f) securities. (see http://www.sec.gov/answers/form13f.htm) 14 For robustness checks discussed in the Internet appendix, we also calculate equally weighted footprints by setting wijt =1/Njt. Analysis based on these equally weighted footprints generates similar results.
Page 15
institutional investor-level footprints differs substantially from the stock-level sustainability
scores (Panel A, Figure 1).
----Table 2 about here----
In Table 2, we display summary statistics at the institutional investor-level. The median
value weighted sustainability footprint (i.e., Susty_VW) is 5.39 and the 75h percentile is 6.14 out
of 10. Looking at the tail of the distribution, only about 3 % of institution-quarter observations
exhibit footprints exceeding 8 (out of 10). The latter observation is due to (i) very few stocks
displaying high sustainability scores (above 8) and (ii) most institutional investors holding
diversified stock portfolios.
----Figure 2 about here----
In order to check the plausibility of our sustainability footprint measures, we plot the
evolution of the footprints of the average investor over time. To account for the fact that the
stock-coverage is not constant over time, we use only stocks belonging to the S&P500 to
calculate the footprint. Consistent with the notion that environmental and social issues have
become more important for institutional investors over time, Figure 2 shows that our measures
exhibit positive upward time trends: the average values of all three measures have generally been
increasing between 2002 and 2010. The positive time-trend is most pronounced for the average
environmental footprint. However, the positive time trends have been less pronounced since 2010,
with a dramatic reversal in the social footprint: while the environmental footprint has somewhat
continued to trend upwards, it has decoupled from the social footprint since the second half of
2010 and the social footprint has actually deteriorated.
C. Measures of investor horizon
One of the objectives of the paper, as stated in section II.B, is to test two competing
hypotheses as to why some institutional investors choose more sustainable portfolio allocations
than others. The “overcoming short termism” hypothesis predicts higher sustainability footprints
for investors with longer investment horizons. Given that investor horizon is not directly
observable, we use two proxies. First, we rely on a common classification of 13F institutions (see
Bushee (2001) and Abarbanell, Bushee, and Raedy (2003)). The classification is based on the
Page 16
strictness of the institutions’ fiduciary responsibilities (or legal types).16 Secondly, we rely on
investor holdings data to infer investment horizon from portfolio turnover (see Froot, Perold, and
Stein (1992)).
C.1 Legal type classification (Bushee (2001) and Abarbanell, Bushee, and Raedy (2003))
The eight categories used in the Bushee (2001) and Abarbanell, Bushee, and Raedy (2003)
classification are: banks, insurance companies, corporate pension funds, public pension funds,
investment companies, independent investment advisors, university and foundation endowments,
and a category of miscellaneous institutions. The bank category mainly identifies bank trust
departments. Investment companies are mutual fund management companies and the independent
investment advisors category regroups institutions such as asset management companies,
investment banks, brokers, private wealth management companies, hedge funds, or mutual funds.
Prior research suggests that the behavior of institutional investors is likely to vary depending on
their legal type as institutions may be subject to differences in preferences, investment horizons,
incentives, trading, and investment strategies driven in part by the regulatory constraints that
these investors are facing (see, for instance, Gompers and Metrick (2001), Bennet, Sias, and
Starks (2003), or Cella, Ellul and Giannetti (2013)).
To gain insights on the relative importance of the different categories, we calculate
aggregate stock holdings for each category. The largest category is that of independent
investment advisors, representing aggregate stock holdings of about $25 trillion (tn) at the end of
2013. The second largest investor category is that of investment companies (about $8tn),
followed by banks (about $6tn), and insurance companies (about $2tn). At the end of 2013,
aggregate common stock holdings of miscellaneous institutions, public pension funds, corporate
pension funds, and university endowments were respectively about $2.8tn, $1.5tn, $0.3tn, and
$0.084tn.17 Note that all these holdings are direct stock holdings and exclude mandates or shares
of open-end investment companies such as mutual funds. Some institutional investors (e.g.,
public pension funds) are likely to have much higher investment discretion through such
16 The classification is based on the old CDA/Spectrum classification and maintained by Professor Brian Bushee from the Wharton School. The data may be downloaded on his website: http://goo.gl/rCZNhh. The classification is only available until the end of 2013, which is why empirical analysis that uses the classification runs only until the end of 2013. 17 We report a graph showing the temporal evolution of aggregate stock holdings for the different categories in the Internet appendix to this paper.
Page 17
mandates or other instruments for which there are no reporting requirements. Unfortunately, data
on mandates or other instruments are not available to us.
C.2 Portfolio turnover
Froot, Perold, and Stein (1992) suggest that portfolio turnover can be used as a proxy of
investor horizon. We follow this proposition and calculate portfolio turnover at the institutional
investor-level as the minimum of the absolute values of aggregated sales and aggregated
purchases during a quarter divided by the average total net asset value of the investor’s portfolio
during the quarter, that is
Turnover min , 0.5 ,
where is the total dollar value of buys, the total dollar value of sales since the last
filing, and is the total net asset value of all equity holdings of investor j at date t. We
assume that all trading happens at date t and at prices at the end of period t-1 (see Wermers
(2000), Brunnermeier and Nagel (2004), or Ben-David, Franzoni, and Moussawi (2012)).
Because Turnover is calculated using quarterly holding snapshots, it does not capture trading at
frequencies higher than one quarter and thus understates trading activity. As Chen, Jegadeesh,
and Wermers (2000) note, the above definition of turnover captures institutional investor trading
that is unrelated to investor inflows or redemptions. This is because the definition uses the
minimum of buys and sells and the dollar value of buys minus sells is equal to the net inflow (or
outflow) of money from investors (controlling for changes in fund cash holdings). Loosely
speaking, turnover measures the percentage of the portfolio’s holdings which changed since the
previous reporting period. Note that this measure is not a perfect measure of investment horizon
since more long-term oriented investors may also trade actively in the short term, for instance,
because of hedging or regulation driven mechanic portfolio rebalancing motives.
D. Portfolio returns
In the second part of the empirical analysis, we test whether risk-adjusted portfolio
performance is associated with investors’ sustainability footprints. Indeed, a positive relationship
between risk-adjusted performance and sustainability footprint is a sufficient condition to validate
the “overcoming short-termism” hypothesis. To this end, we calculate a return measure at the
institutional investor portfolio-level, which we denote by Return (Quarterly). This variable
Page 18
measures the value-weighted quarterly portfolio return of the institutional investor, which we
calculate as the hypothetical holdings returns of the long equity portion of the institutional
investor’s portfolio. The portfolio return is computed assuming that positions are held until the
new quarterly holdings are observed and that trades occur only at the end of the quarter. This is a
constraint imposed by the 13F holdings data, which is only available at the quarterly frequency.
We thus miss all positions that were traded in and out during the quarter. Our return measure
based on 13F institutional ownership data should thus not be seen as an exact return measure for
institutions that engage in high frequency trading, that rely heavily on short positions or
derivatives, and that are invested predominantly in other asset classes (e.g., fixed income). The
holdings return also does not account for transaction fees, management fees, or investor taxes.
Yet, we believe the holdings returns reflect the returns on the long leg of institutions’ equity
holdings reasonably well.18 By cumulating quarterly returns in a given year at the institutional
investor-level, we also calculate an annual portfolio return, which we denote as Return
(Annual).19 The average quarterly (annual) portfolio return is 0.67 (3.15) percent (see Table 2).
E. Control variables
We calculate several other characteristics at the institutional investor portfolio-level, such
as the size of the common stock holdings (Assets), number of stocks (# stocks), or number of
SIC2 industries in which the investor holds positions. The variable Coverage (Value) is the
percentage of the investor's portfolio value for which stock-level sustainability scores are
available. The variables % stocks S&P500 and % value S&P500 capture the fraction of stocks
(value) of the investor’s portfolio invested in firms belonging to the S&P500 index.
As Table 2 shows, the average (median) size of the investor’s holdings is $12.42bn
($0.99bn). There is considerable skewness and dispersion in terms of the size of the investors’
equity holdings: some institutions are negligibly small, while others are gigantic with common
stock holdings in excess of $4tn. The average (median) institution holds 194 (69) stocks and less
than 5 percent of investor-quarter observations belong to institutions that are invested in two or
fewer SIC2 industries. Thus, overall institutional investors’ stock holdings appear to be well
18 For a sample of mutual funds at the monthly frequency, Kacperczyk, Sialm, and Zheng (2008) compare returns calculated from holdings data with reported returns. They find dispersion in the difference between reported and holdings returns, but document that the difference is on average close to zero. 19 We retain only annual return observations for which all four quarterly observations are available.
Page 19
diversified. The variable Coverage (Value) shows that on average, about 78 % of the institutional
investor’s portfolio value is covered by stock-level sustainability scores, suggesting that stock-
level sustainability scores generally cover the majority of stocks in which the 13F investors invest.
When looking at the median investor, Coverage (Value) is 90 percent. Using the quarterly time-
series of portfolio returns (i.e., Return (Quarterly)), we also estimate the institutional investor’s
exposure to the four Carhart (1997) factors using rolling windows of 12 quarters. Beta_mkt,
Beta_smb, Beta_hml, and Beta_umd measure these factor exposures.
IV. Empirical analysis
A. Investment horizon and sustainability footprints
In this section we conduct our empirical tests with the objective of better understanding
which institutions choose sustainability oriented portfolio strategies. The “overcoming short-
termism” hypothesis suggests, according to Bénabou and Tirole (2010), that sustainability
oriented investors make decisions while adopting a long term perspective. Given anecdotal
evidence that institutions like pension funds and insurance companies are subject to longer
investment horizons, and the evidence that portfolio turnover is lower for these institutions (see
supplementary analysis in our Internet appendix or evidence in Cella, Ellul, and Giannetti
(2013)), we start by plotting average sustainability footprints by investor categories.
----Figure 3 about here----
In Panel A, Figure 3, we show the average social, environmental, and overall
sustainability footprint for each of the eight investor categories. The upper subfigures in Panel A
show average values of the environmental and social footprint (i.e., Envir_VW and Social_VW)
by investor category, while the lower subfigure displays the average values of the combined
sustainability score Susty_VW. All three figures suggest that longer term oriented institutions
(i.e., banks, insurance companies as well as corporate and public pension funds) have, on
average, better sustainability footprints (i.e., higher values) than shorter-term oriented institutions
such as independent investment advisors and investment companies. In terms of economic
magnitudes, the differences are sizeable.20 Focusing on the combined sustainability footprint for
20 Because of their long-term liabilities and legal asset-liability-management constraints, pension funds and insurance companies are likely to be more long-term oriented and thus less active in terms of short-term trading. In a similar spirit, bank trusts are known for providing conservative investment management services, not the least because of the
Page 20
instance (lower subfigure of Panel A), the data suggest that banks have an about 15 percent
(6.2/5.4-1) better sustainability footprint than investment companies. The differences with respect
to investment companies are less pronounced for public and corporate pension funds (9 and 6
percent) as well as insurance companies (7 percent).
To corroborate the graphical evidence, we estimate pooled cross-sectional regressions in
which we relate the three footprint measures to categorical dummy variables and a set of control
variables. We also include year-quarter and country fixed effects. The base category is that of
independent investment advisors.
----Table 3 about here----
In column 1 and 2, we report the results for regressions in which the environmental and
social footprints serve as dependent variables. Column 3 shows the results for the combined
sustainability footprint. The regression analysis confirms that banks, insurance companies, and
pension funds have significantly better social, environmental, and combined sustainability
footprints than investment companies and independent investment advisors, even after
controlling for observable investor-level and unobservable country characteristics. In terms of
economic magnitude, the effect sizes are similar to those documented in Panel A, Figure 3.
Focusing on the overall sustainability footprint (column 3), the coefficient for banks is 0.54,
which amounts to a 10 percent (0.54/5.4) better footprint compared to the average investment
company. There does not appear to be a big difference in terms of effect sizes when looking at
social and environmental footprint separately. If anything, the effect sizes are slightly larger for
the environmental footprint.
The coefficients on the control variables are informative too. In the cross section,
institutional investors with more stocks tend to have better footprints. In contrast, institutional
investors who pursue industry oriented investment strategies tend to perform more poorly in
terms of sustainability: the coefficient on the dummy variable # Industries<=2, which indicates
whether the investor’s holdings are concentrated in two or fewer industries, is negative. The
factor exposures turn out to be significant too. For instance, institutional investors with higher
requirement that trustees respect prudent man laws. For instance, Del Guercio (1996) shows that bank based investment managers, who invest primarily on behalf of private trust and pension plan clients and are captured by the Banks category of the Bushee classification, tilt portfolios to stocks that courts consider to be prudent.
Page 21
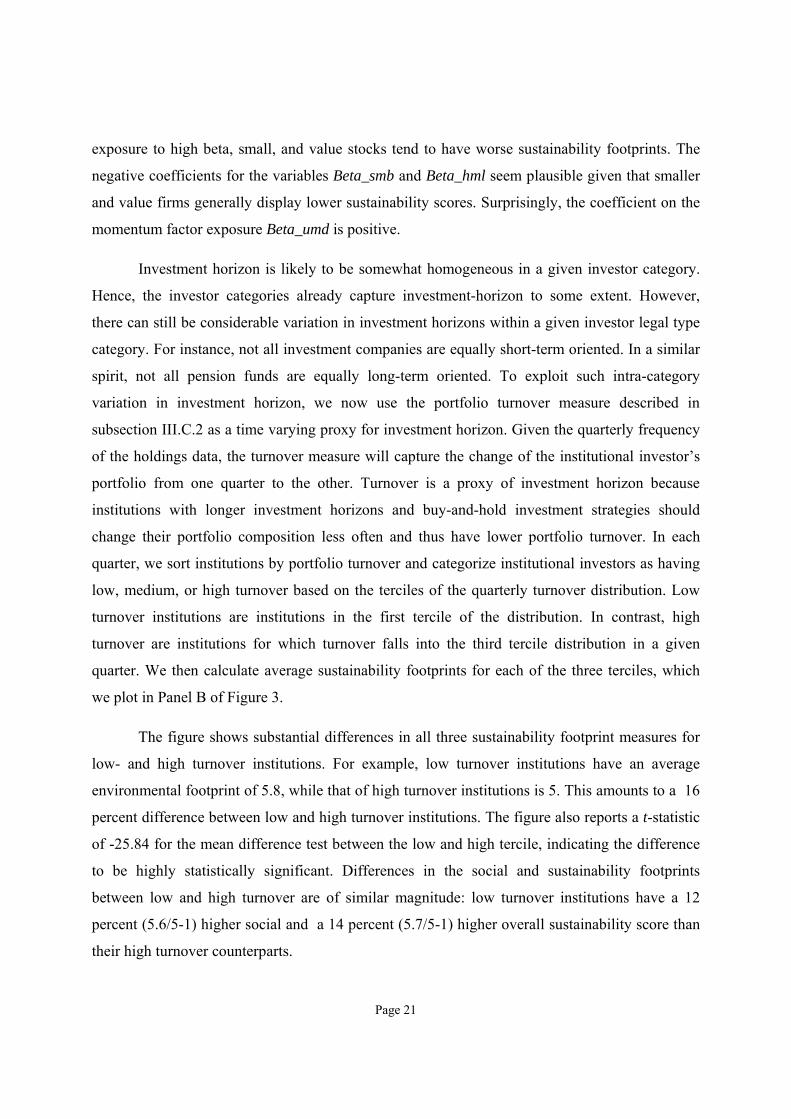
exposure to high beta, small, and value stocks tend to have worse sustainability footprints. The
negative coefficients for the variables Beta_smb and Beta_hml seem plausible given that smaller
and value firms generally display lower sustainability scores. Surprisingly, the coefficient on the
momentum factor exposure Beta_umd is positive.
Investment horizon is likely to be somewhat homogeneous in a given investor category.
Hence, the investor categories already capture investment-horizon to some extent. However,
there can still be considerable variation in investment horizons within a given investor legal type
category. For instance, not all investment companies are equally short-term oriented. In a similar
spirit, not all pension funds are equally long-term oriented. To exploit such intra-category
variation in investment horizon, we now use the portfolio turnover measure described in
subsection III.C.2 as a time varying proxy for investment horizon. Given the quarterly frequency
of the holdings data, the turnover measure will capture the change of the institutional investor’s
portfolio from one quarter to the other. Turnover is a proxy of investment horizon because
institutions with longer investment horizons and buy-and-hold investment strategies should
change their portfolio composition less often and thus have lower portfolio turnover. In each
quarter, we sort institutions by portfolio turnover and categorize institutional investors as having
low, medium, or high turnover based on the terciles of the quarterly turnover distribution. Low
turnover institutions are institutions in the first tercile of the distribution. In contrast, high
turnover are institutions for which turnover falls into the third tercile distribution in a given
quarter. We then calculate average sustainability footprints for each of the three terciles, which
we plot in Panel B of Figure 3.
The figure shows substantial differences in all three sustainability footprint measures for
low- and high turnover institutions. For example, low turnover institutions have an average
environmental footprint of 5.8, while that of high turnover institutions is 5. This amounts to a 16
percent difference between low and high turnover institutions. The figure also reports a t-statistic
of -25.84 for the mean difference test between the low and high tercile, indicating the difference
to be highly statistically significant. Differences in the social and sustainability footprints
between low and high turnover are of similar magnitude: low turnover institutions have a 12
percent (5.6/5-1) higher social and a 14 percent (5.7/5-1) higher overall sustainability score than
their high turnover counterparts.
Page 22
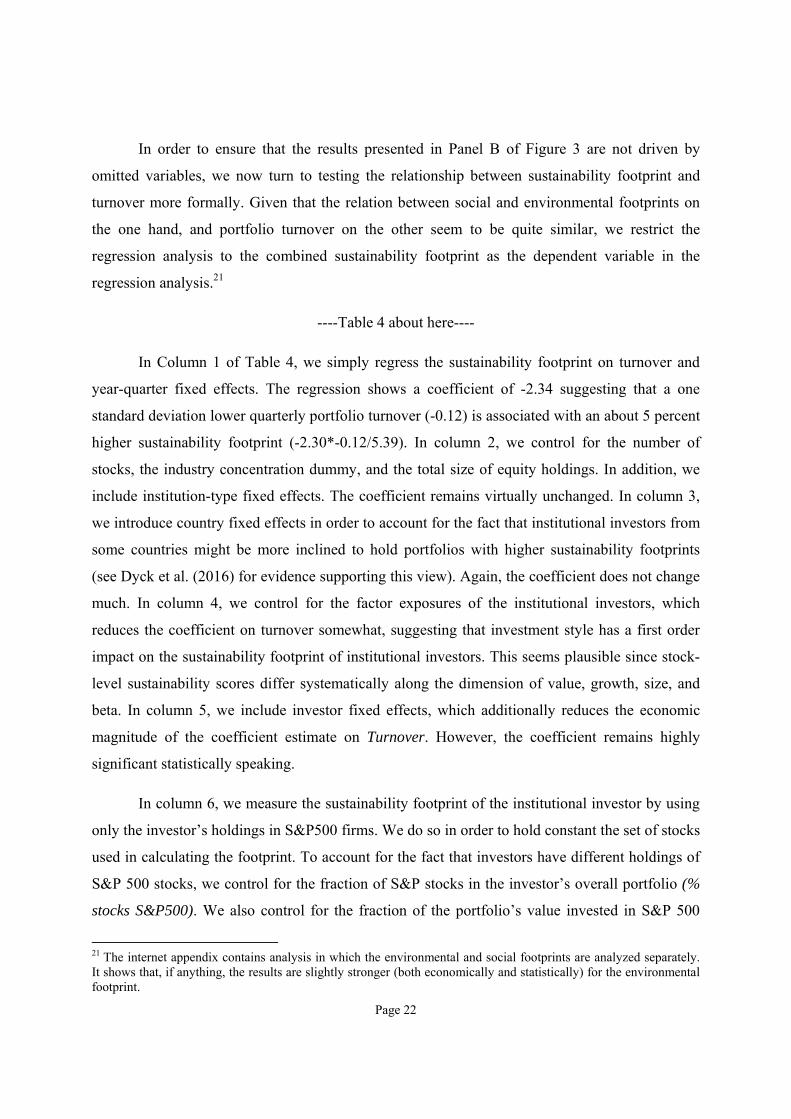
In order to ensure that the results presented in Panel B of Figure 3 are not driven by
omitted variables, we now turn to testing the relationship between sustainability footprint and
turnover more formally. Given that the relation between social and environmental footprints on
the one hand, and portfolio turnover on the other seem to be quite similar, we restrict the
regression analysis to the combined sustainability footprint as the dependent variable in the
regression analysis.21
----Table 4 about here----
In Column 1 of Table 4, we simply regress the sustainability footprint on turnover and
year-quarter fixed effects. The regression shows a coefficient of -2.34 suggesting that a one
standard deviation lower quarterly portfolio turnover (-0.12) is associated with an about 5 percent
higher sustainability footprint (-2.30*-0.12/5.39). In column 2, we control for the number of
stocks, the industry concentration dummy, and the total size of equity holdings. In addition, we
include institution-type fixed effects. The coefficient remains virtually unchanged. In column 3,
we introduce country fixed effects in order to account for the fact that institutional investors from
some countries might be more inclined to hold portfolios with higher sustainability footprints
(see Dyck et al. (2016) for evidence supporting this view). Again, the coefficient does not change
much. In column 4, we control for the factor exposures of the institutional investors, which
reduces the coefficient on turnover somewhat, suggesting that investment style has a first order
impact on the sustainability footprint of institutional investors. This seems plausible since stock-
level sustainability scores differ systematically along the dimension of value, growth, size, and
beta. In column 5, we include investor fixed effects, which additionally reduces the economic
magnitude of the coefficient estimate on Turnover. However, the coefficient remains highly
significant statistically speaking.
In column 6, we measure the sustainability footprint of the institutional investor by using
only the investor’s holdings in S&P500 firms. We do so in order to hold constant the set of stocks
used in calculating the footprint. To account for the fact that investors have different holdings of
S&P 500 stocks, we control for the fraction of S&P stocks in the investor’s overall portfolio (%
stocks S&P500). We also control for the fraction of the portfolio’s value invested in S&P 500
21 The internet appendix contains analysis in which the environmental and social footprints are analyzed separately. It shows that, if anything, the results are slightly stronger (both economically and statistically) for the environmental footprint.
Page 23
stocks (% value S&P500). We further include the full set of control variables as well as time,
investor category, and country fixed effects which we used in column 4. The regression
coefficient on Turnover is again negative and highly significant. When including investor fixed
effects in column 7, the coefficient estimate changes in magnitude, but remains highly
significant.22
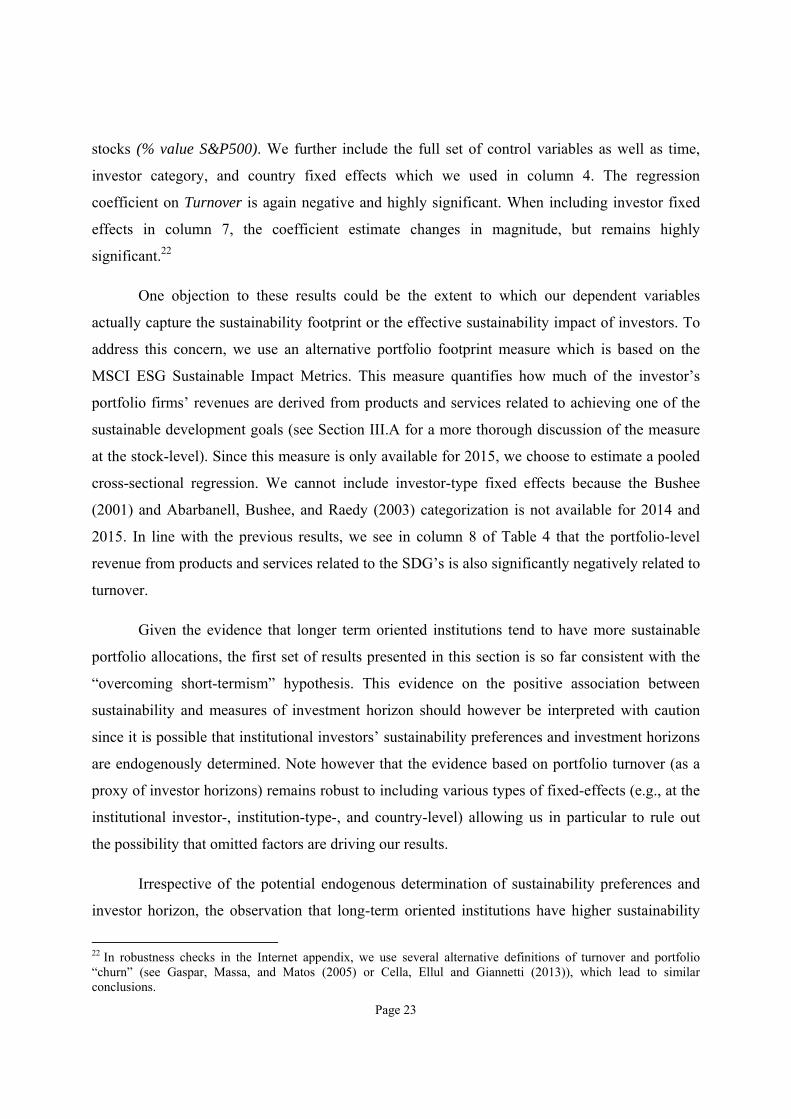
One objection to these results could be the extent to which our dependent variables
actually capture the sustainability footprint or the effective sustainability impact of investors. To
address this concern, we use an alternative portfolio footprint measure which is based on the
MSCI ESG Sustainable Impact Metrics. This measure quantifies how much of the investor’s
portfolio firms’ revenues are derived from products and services related to achieving one of the
sustainable development goals (see Section III.A for a more thorough discussion of the measure
at the stock-level). Since this measure is only available for 2015, we choose to estimate a pooled
cross-sectional regression. We cannot include investor-type fixed effects because the Bushee
(2001) and Abarbanell, Bushee, and Raedy (2003) categorization is not available for 2014 and
2015. In line with the previous results, we see in column 8 of Table 4 that the portfolio-level
revenue from products and services related to the SDG’s is also significantly negatively related to
turnover.
Given the evidence that longer term oriented institutions tend to have more sustainable
portfolio allocations, the first set of results presented in this section is so far consistent with the
“overcoming short-termism” hypothesis. This evidence on the positive association between
sustainability and measures of investment horizon should however be interpreted with caution
since it is possible that institutional investors’ sustainability preferences and investment horizons
are endogenously determined. Note however that the evidence based on portfolio turnover (as a
proxy of investor horizons) remains robust to including various types of fixed-effects (e.g., at the
institutional investor-, institution-type-, and country-level) allowing us in particular to rule out
the possibility that omitted factors are driving our results.
Irrespective of the potential endogenous determination of sustainability preferences and
investor horizon, the observation that long-term oriented institutions have higher sustainability
22 In robustness checks in the Internet appendix, we use several alternative definitions of turnover and portfolio “churn” (see Gaspar, Massa, and Matos (2005) or Cella, Ellul and Giannetti (2013)), which lead to similar conclusions.
Page 24
footprints is a necessary but not a sufficient condition to support the “overcoming short-termism”
hypothesis. The “overcoming short-termism” hypothesis makes explicit predictions about the
relation between investors’ financial performance and their sustainability footprints, a
relationship that we examine in the next subsection.
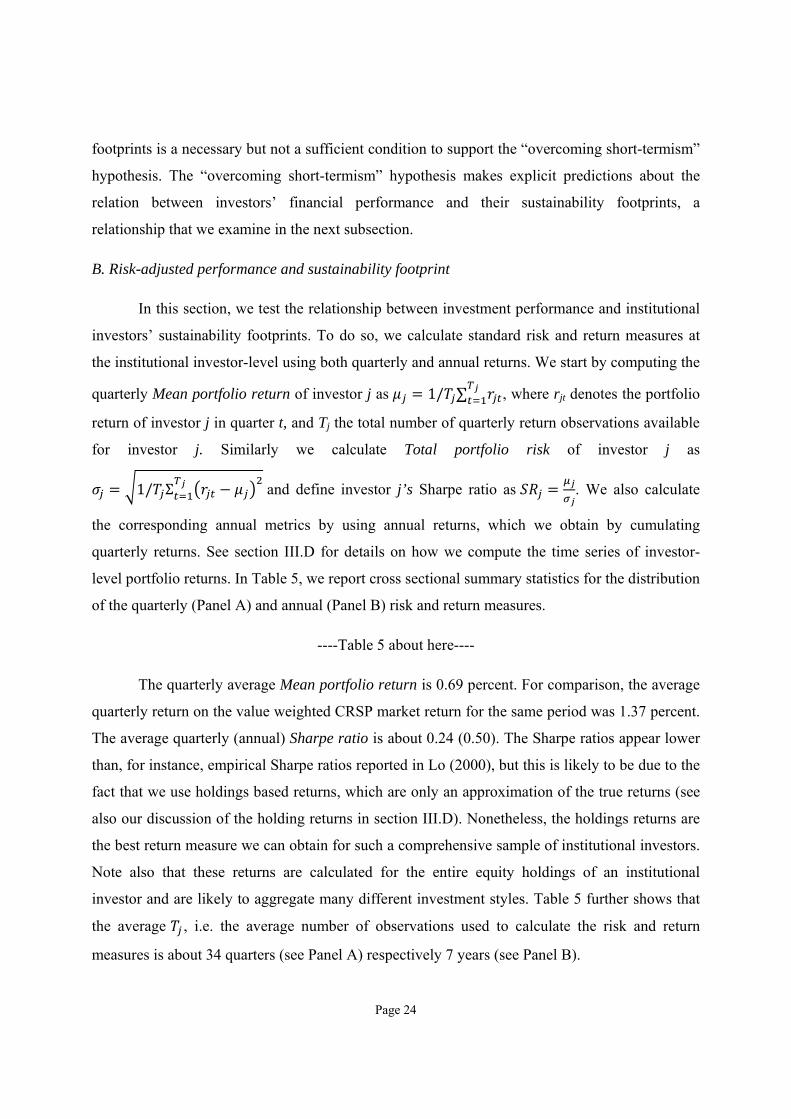
B. Risk-adjusted performance and sustainability footprint
In this section, we test the relationship between investment performance and institutional
investors’ sustainability footprints. To do so, we calculate standard risk and return measures at
the institutional investor-level using both quarterly and annual returns. We start by computing the
quarterly Mean portfolio return of investor j as 1/ ∑ , where rjt denotes the portfolio
return of investor j in quarter t, and Tj the total number of quarterly return observations available
for investor j. Similarly we calculate Total portfolio risk of investor j as
1/ Σ and define investor j’s Sharpe ratio as . We also calculate
the corresponding annual metrics by using annual returns, which we obtain by cumulating
quarterly returns. See section III.D for details on how we compute the time series of investor-
level portfolio returns. In Table 5, we report cross sectional summary statistics for the distribution
of the quarterly (Panel A) and annual (Panel B) risk and return measures.
----Table 5 about here----
The quarterly average Mean portfolio return is 0.69 percent. For comparison, the average
quarterly return on the value weighted CRSP market return for the same period was 1.37 percent.
The average quarterly (annual) Sharpe ratio is about 0.24 (0.50). The Sharpe ratios appear lower
than, for instance, empirical Sharpe ratios reported in Lo (2000), but this is likely to be due to the
fact that we use holdings based returns, which are only an approximation of the true returns (see
also our discussion of the holding returns in section III.D). Nonetheless, the holdings returns are
the best return measure we can obtain for such a comprehensive sample of institutional investors.
Note also that these returns are calculated for the entire equity holdings of an institutional
investor and are likely to aggregate many different investment styles. Table 5 further shows that
the average , i.e. the average number of observations used to calculate the risk and return
measures is about 34 quarters (see Panel A) respectively 7 years (see Panel B).
Page 25
The “overcoming short-termism” hypothesis states that institutional investors adopt
sustainable investment policies to take a long-term view, curb short-termism, and maximize (long
term) investment performance. We thus expect a positive (negative) link between risk-adjusted
performance and institutional investors’ sustainability footprints if the “overcomig short-termism
(“managerially driven philanthropy”) hypothesis prevails.
----Figure 4 about here----
The upper subfigures of Figure 4 display the average Mean portfolio return, Total
portfolio risk, and Sharpe Ratio at the quarterly horizon conditional on low, medium, and high
terciles of the average sustainability footprint. To calculate these conditional averages, we sort
the whole cross section of institutional investors into terciles of the sustainability footprint and
calculate the average performance metrics for each of the three terciles. Since we are considering
a cross section of risk and return measures (i.e., we have, per institution, one estimate for each
metric), we use the average sustainability footprint during the sample period as the sorting
variable, which we calculate as _ 1/ ∑ _ .
The upper left subfigure shows that there is a decreasing relationship between the
quarterly Mean portfolio return and the sustainability footprint: investors with the best
sustainability footprint have an about 20 percent (0.6178/0.7677-1) lower portfolio return.When
looking at Total portfolio risk, we also find a monotonically decreasing relationship with the
sustainability footprint and institutions with the best (i.e., high) sustainability footprint exhibit a
30 percent (2.775/3.988-1) lower Total portfolio risk compared to low sustainability investors.
The difference between the Total portfolio risk of high and low sustainability footprint investors
is highly statistically significant (t-statistic of -27.81). When analyzing the Sharpe ratio
conditional on footprints (upper right subfigure), we find a positive relation between quarterly
Sharpe ratio and sustainability footprint. In fact, institutions with high sustainability footprints
have an about 16 % higher (0.250/0.215-1) quarterly Sharpe ratio than low sustainability
footprint institutions. Again, the difference is statistically significant (t-statistic of 4.71). In the
lower part of Figure 4, we repeat the same analysis at the annual horizon, which yields very
similar results. The evidence of a positive relationship both at the quarterly and annual
investment horizon jointly support the “overcoming short-termism” hypothesis. We now check in
Page 26
an OLS regression framework that the univariate analysis is robust to the inclusion of control
variables.
----Insert Table 6 here----
In columns 1-3 of Table 6, we regress the investor’s Mean portfolio return, Total
portfolio risk, and Sharpe ratio at the quarterly horizon on the average sustainability footprint. In
columns 4-6, we repeat the same analysis at the annual horizon. We also control for several other
investor-level characteristics, i.e. Industries<=2 (which is a dummy equal to one if the investor,
at any time during the sample period, had holdings concentrated in two or fewer industries),
average size (i.e., ln(Assets)), average number of stocks in the portfolio (i.e., Stocks), the number
of observations used to estimate the risk and return characteristics, as well as institution type23
and country fixed effects.
In line with the univariate analysis of Figure 4, quarterly Mean portfolio return is
significantly negatively related to the sustainability footprint (t-statistic=-3.9) in the cross section.
The regression analysis of Total portfolio risk and Sharpe ratio also mirrors the univariate
evidence provided in Figure 4: Total portfolio risk and Sharpe ratio are negatively respectively
positively related to the sustainability footprint. The economic magnitudes of the cross-sectional
coefficient estimates are economically meaningful. At the quarterly horizon for instance, a one
standard deviation increase in the sustainability footprint is associated with a 16 percent (-
0.585*0.9/3.32) lower Total portfolio risk. In a similar spirit, a standard deviation increase in the
sustainability footprint is associated with an 11 percent (0.028*0.9/0.24) higher Sharpe ratio.
Again, the effect sizes at the annual horizon (see columns 5 and 6) are of very similar magnitude
when compared to those at the quarterly horizon: a standard deviation higher sustainability
footprint at the annual horizon is associated with 10 percent lower Total portfolio risk (-
1.342*0.93/8.01) and a 26 percent higher Sharpe ratio (0.056*0.93/0.5). The regression analysis
in Table 6 thus corroborates our univariate findings from Figure 4.
The evidence from Figure 4 and Table 6 suggest that risk-adjusted performance is higher
for high sustainability footprint institutions. Importantly, the positive cross-sectional relationship
between Sharpe ratio and the sustainability footprint measure appears to be, both at the quarterly
23 The institution type fixed effects account for the fact that different types of institutional investors are subject to different investment styles and other restrictions (e.g., regulation).
Page 27
and at the annual horizons, driven primarily by a reduction in the investor’s Total portfolio risk,
suggesting that concerns with and portfolio tilts towards sustainability operate as a risk
management device. Our findings on the positive risk-adjusted performance-sustainability link
materializing through lower total portfolio risk of high footprint institutional investors are in line
with recent findings by Kecskes, Mansi, and Nguyen (2016) who focus on the firm-level and
show that, at the firm-level, the presence of long-term investors increases the financial value of
CSR activities to shareholders, mainly as a result of lower cash flow risk.
In analysis reported in the Internet appendix, we decompose total risk into its market and
idiosyncratic components and also calculate extreme loss probabilities. We show that above all,
idiosyncratic risk and extreme loss probability are lower for high sustainability footprint
investors. These findings further suggest that the positive relationship between sustainability
footprint and risk-adjusted performance seems to operate primarily through a risk reduction
channel, since the relation between raw portfolio returns and the investor’s sustainability
footprint is in general negative or insignificant.
Overall, this set of results is supportive of the “overcoming short-termism” hypothesis
inspired by Bénabou and Tirole (2010) in that we find evidence that institutional investors with
higher sustainability footprints act as long term value maximizers. Indeed, the “managerially
driven philanthropy” hypothesis should have led to the opposite result, i.e. lower risk-adjusted
performance, since this view suggests that activities that ultimately result in higher sustainability
footprints are mainly driven by managerial self- and social-image concerns and are thus value
destroying. In the analysis above, we find evidence of a strong, positive correlation between
sustainability and risk-adjusted investment performance. However, such evidence does not
establish a causal impact of sustainability on risk-adjusted investment performance, because OLS
coefficient estimates could potentially be biased due to the endogenous determination of risk-
adjusted performance and sustainability footprints (for instance, because of an omitted variable).
In order to address this issue, the next section presents results from two identification strategies
that allow us to address the endogeneity issue and ultimately argue for a causal impact of
sustainability on institutional investors’ risk-adjusted performance.
V. Identification
A. Natural disasters as a natural experiment
Page 28
To provide evidence of a causal relationship between sustainability footprints and risk-
adjusted performance, our first empirical strategy exploits the occurrence of natural disasters as a
source of exogenous variation in investor-level sustainability. The idea is that the occurrence of a
natural disaster in the close vicinity of an institutional investor’s headquarters provides an
exogenous shock to the institutional investor’s sustainability preferences. Research in behavioral
finance has shown that experiencing macroeconomic shocks can have a profound impact on
individual risk-taking behavior (see Malmendier and Nagel (2011)). We conjecture that, in a
similar spirit, experiencing natural disasters (in particular, those related to extreme weather
events) affects individual attitudes and preferences towards sustainability issues. The
identification strategy is motivated by the availability heuristic (see Tversky and Kahneman
(1974)), which stipulates that judgements and individual behavior are disproportionally
influenced by information and examples that are salient to the decision-maker.
Indeed, Demski et al. (2017) show that direct experience of extreme weather events leads
to an increased salience of sustainability issues such as climate change. The experience of
extreme weather events also induces more pronounced emotional responses to sustainability
issues. Using survey methods in the context of a single natural disaster in the UK (i.e., the winter
flooding of 2013), Demski et al. (2017) compare individuals personally affected by the extreme
weather event (“treatment”) with a representative “control” sample: the authors show that “direct
flooding experience can give rise to behavioral intentions beyond individual sustainability actions,
including support for mitigation policies, and personal climate adaptation in matters unrelated to
the direct experience.” We build on this evidence by hypothesizing that the sustainability
preferences of portfolio managers working for institutional investors should also be affected by
the experience of natural disasters. The mechanism is as follows: when natural disasters occur
close to an institutional investor’s headquarter, the institution’s employees become more
receptive to environmental and social issues and, as a result, the institution’s portfolio-level
sustainability increases subsequently (“treatment”). In contrast, institutional investors
headquartered in areas unaffected by the natural disasters serve as the “control group”. Given the
exogeneity of natural disasters, it is plausible to think that investors are randomly assigned to the
“treatment” and “control” groups.
Prior studies in economics and finance have exploited the occurrence of natural disasters
for identification purposes. For instance, Barrot and Sauvagnat (2016) use natural disasters to
Page 29
study how idiosyncratic firm-level shocks propagate in production networks. Dessaint and
Matray (2017) examine whether corporate managers’ risk perceptions respond to hurricane
strikes. Similar to these studies, we use natural disaster data from SHELDUS (Spatial Hazard and
Loss Database for the United States). For each natural disaster in the U.S., the database provides
information on the start date, the end date, and the Federal Information Processing Standards
(FIPS) code of all affected counties. Following Barrot and Sauvagnat (2016), we use only major
disasters, which are defined as disasters lasting less than 30 days with total estimated damages
above $1 billion (in constant 2013 dollars).
----Table 7 about here----
Table 7 displays the list of disasters used in this study. The table shows that the majority
of the disasters are hurricane strikes. However, the list also includes other natural disasters such
as floodings or blizzards. We obtain the ZIP codes of the institutional investors’ headquarters
from SEC filings and link them to FIPS codes using a commonly available link table. Obviously,
we restrict the analysis to U.S. based institutions.24
----Figure 5 about here----
We provide a graphical representation of the geographic data in Figure 5. Panel A shows
the geographic distribution of institutional investor headquarters. The map shows concentrations
of headquarters around New York, Boston, Stamford, Chicago, Seattle, San Diego, and San
Francisco. Panel B, Figure 5 displays a map highlighting the counties affected by the natural
disasters. Note that some counties are hit several times by natural disasters.
Our identification strategy rests on two steps: First, we show that institutional investor-
level sustainability footprints improve when natural disasters occur close to institutional investors’
headquarters (“treatment”). Secondly, we show that their risk-adjusted performance is positively
related to sustainability footprints following this treatment. To show that institutions improve
their sustainability footprints following a disaster treatment, we code treatment dummy variables
indicating whether the county in which the institutional investor is headquartered is hit by a
24 While we used a sample of about 4,000 unique 13F institutions (including foreign institutions) in the analysis of section IV.B, we now restrict the analysis to U.S. based institutions. The restriction to U.S. based 13F institutions and the availability of information on the location of the 13F institution’s headquarter from SEC filings reduces the analysis to about 2,800 institutions in this section.
Page 30
natural disaster in quarter t-n. We use dummy variables with a horizon of up to 3 quarters (i.e., t,
t-1, t-2, and t-3. For instance, the variable Disaster hits investorjt indicates that institution j is
subject to a disaster in quarter t. In Column 1, Table 8 we estimate the following specification
_ ∑ , (1)
where _ denotes the sustainability footprint of investor j, of institution type l,
headquartered in state g in year-quarter t. Institution types are based on the Bushee (2001)
classification and headquarters locations are obtained from SEC filings. In specification (1),
are investor fixed effects, Disaster hits investorjt-n are treatment dummies indicating if the county
of the institution’s headquarters is subject to a natural disaster in quarter t-n, are
Headquarters state × Year-quarter fixed effects, and are Institution type × Year-quarter fixed
effects. The fixed effects absorb unobservable factors that systematically affect the
sustainability footprint of institutional investors headquartered in the same state in year-quarter t.
In a similar spirit, the Institution type × Year-quarter fixed effects absorb institution-type
specific time-varying shocks to the sustainability footprint.
----Table 8 about here----
In column (1), we use the sustainability footprint Susty_VW as the dependent variable.
The regression produces positive coefficients for Disaster hits investorjt, Disaster hits investorjt-1,
and Disaster hits investorjt-2 suggesting that footprints improve after the headquarters of
institutional investors are subject to natural disasters. One concern might be that such
improvements are driven by the institution’s holdings of local stocks: Coval and Moskowitz
(1999) show that institutions invest predominantly in stocks that are located close to institutional
investors’ headquarters and since the sustainability footprint is also a function of the portfolio
weights—and thus of the market prices of the stocks—it might be that natural disaster induced
price effects of local stocks are behind the improving footprints. To tackle this issue head on, we
deliberately exclude local stock holdings from the calculation of the institution’s sustainability
footprint. To do so, we exclude stocks that are headquartered in the same state as the institutional
investor. In other words, we use only non-local stocks in the footprint calculation and any
improvement in the sustainability footprint would thus be driven by investors increasing their
exposure to high sustainability stocks in areas that are not directly hit by the natural disasters. We
Page 31
denote this footprint measure as Susty_VW_HQ and report the regression results in column (2) of
Table 8. Again the coefficient estimates on Disaster hits investorjt-n are significant for n
in{0,1,2}, and if anything of similar magnitude as the coefficient estimates from using the
footprints based on all stocks.25 Taken together, the results from columns (1) and (2) suggest that
fund managers’ experiencing of natural disasters does positively affect their sustainability
preferences. It seems plausible that these effects should be more pronounced for environmental
matters since extreme weather is likely to make concerns about the environment more salient to
institutional investors. To examine the validity of this conjecture, we use, in columns (3) and (4),
the environmental and social footprint (excluding local stocks) separately as the dependent
variable. The regression results show that the results are primarily driven by the effect of the
natural disasters on the environmental footprint: the coefficient estimates on the treatment
dummies are less significant (both economically and statistically speaking) when the social
footprint serves as the dependent variable. Note that a positive treatment effect of natural
disasters is also plausible for the social preferences of fund managers to the extent that they
become are likely to become more empathic towards the disaster victims and as such more
concerned about the well-being of communities and employees. Consistent with this idea, the
effects are stronger for the environmental footprint but still significant for the social footprint.
Finally, in columns (5)-(7) we use the equally weighted footprints which are-by definition-
independent of the stock prices of the portfolio firms. Again we find positive treatment effects for
all three footprints. Relative to institutions not affected by disasters (“control”) and relative to
quarters during which the treated institution is not subject to natural disasters, the sustainability
footprint increases in the quarters following natural disasters.
In addition, the use of equally weighted footprint measures whose weights are
independent of market prices, ruling out the possibility that the results are primarily driven by
stock price effects. We also show that the effects are stronger for the environmental footprint
consistent with the view that exposure to weather related natural catastrophes makes fund
managers more inclined to invest in an environmentally responsible way
Having shown that institutions increase portfolio-level sustainability footprints following
exogenous shocks induced by natural disasters, we now interact the sustainability footprint in
25 We obtain similar results when we calculate footprints based on stocks that are headquartered in areas with different ZIP codes as those of the headquarters of the institutional investor.
Page 32
quarter t-n with the corresponding treatment dummies Disaster hits investorjt-n to show that the
positive impact of sustainability on risk-adjusted investment performance identified in the
previous section is likely to be causal. The dependent variables are Mean portfolio returnj(t,t+12),
Total portfolio riskj(t,t+12), and Sharpe ratioj(t,t+12). We calculate these performance metrics on a
forward-rolling basis using windows of 12 quarters and estimate specifications of the following
type:
,
_ _ _ _ ,
where yjgl(t,t+12) is one of the forward investment performance metrics for investor j, of type l,
located in state g and in quarter t. Susty_VW_HQjt denotes the institution-level sustainability
footprint in quarter t excluding any holding of local stocks, where local stocks are defined as
those with headquarters in the same state as the institutional investor j. Disaster hits investorjt-n
denote the disaster treatment dummies as previously defined. The equation again includes
investor fixed effects as well as Headquarters state × Year-quarter ( ) and Institution type ×
Year-quarter fixed effects ( . We regress forward rolling investment performance measures
(i.e., measures between period t and t+12) on lagged and current treatment and sustainability
variables (i.e., between t and t-n) so that post and pre-treatment periods are clearly separated.
Given that disaster treatment leads to better portfolio footprints in quarters t, t+1, and t+2, we let
n go from 0 to 2.
We are mainly interested in the coefficient estimates for the interaction effects
_ _ that is . These coefficients measure whether and
how portfolio sustainability is related to risk-adjusted performance for “treated” firms. The two
hypotheses we entertain in this paper make different predictions regarding the sign of these
interaction coefficients. While the “overcoming short termism” hypothesis suggests positive
coefficient estimates, the “managerially driven philanthropy hypothesis” implies negative
coefficient estimates for these interaction terms. In other words, the former hypothesis suggests
that higher portfolio sustainability due to exogenous shocks to the sustainability preferences of
institutional investors translates into better risk-adjusted performance following a natural disaster,
Page 33
while the latter view predicts the opposite. We report the regression results for the three
performance metrics in Table 9.
----Table 9 about here----
In column 2 of Table 9 we use Mean Portfolio Return(t,t+12) as the dependent variable.
The coefficient estimates on the interaction terms Disaster hits investorjt × Susty_VW_HQjt and
Disaster hits investorjt-1 × Susty_VW_HQjt-1 are significantly positive, suggesting that following
natural disasters the portfolios of higher sustainability investors earn higher returns. In contrast,
column 1 shows that the interaction terms are not significant when Total portfolio risk(t,t+12)
serves as the dependent variable, except for n=2. When we use the Sharpe ratio(t,t+12) as the
dependent variable, we observe a strongly positive and significant relation between the
interaction terms for periods t,t-1, and t-2, suggesting a causal and positive relationship between
risk-adjusted performance and portfolio-level sustainability. Thus, to summarize: after natural
disasters institutional investors headquartered in affected areas experience a positive shock to
their sustainability preferences and tilt their portfolios towards stocks with higher sustainability
scores. The higher portfolio-level sustainability leads to higher post-treatment risk–adjusted
performance, which is likely to be due to positive price pressure on high sustainability stocks
following natural disasters.26
B. Instrumental variable strategy
To provide further evidence of a causal impact of sustainability footprints on risk-adjusted
returns, we also implement an instrumental variables (IV) strategy. We use geographic variation
to instrument for the sustainability footprint. Inspired by Flammer and Kacperczyk (2016) and
Geczy et al. (2015), we construct an instrument based on the existence of state-level constituency
statutes that provide a legal framework for directors to explicitly consider non-shareholder
interests in their decision-making. Since this variable exploits differences in U.S. state laws, we
26 Note that the direct effect of a natural disaster on risk-adjusted performance tends to be significantly negative. The interpretation of this coefficient estimate is difficult, however, because natural disasters can affect risk-adjusted performance for many reasons unrelated to sustainability (e.g., heightened risk-aversion post disaster). The direct effect (i.e. treatment dummy) absorbs all these confounding factors which we do not study in this paper and allows us to better identify the causal impact of higher sustainability on risk adjusted performance, which is entirely captured by the interaction term between the treatment dummy and the institutional-level sustainability footprint.
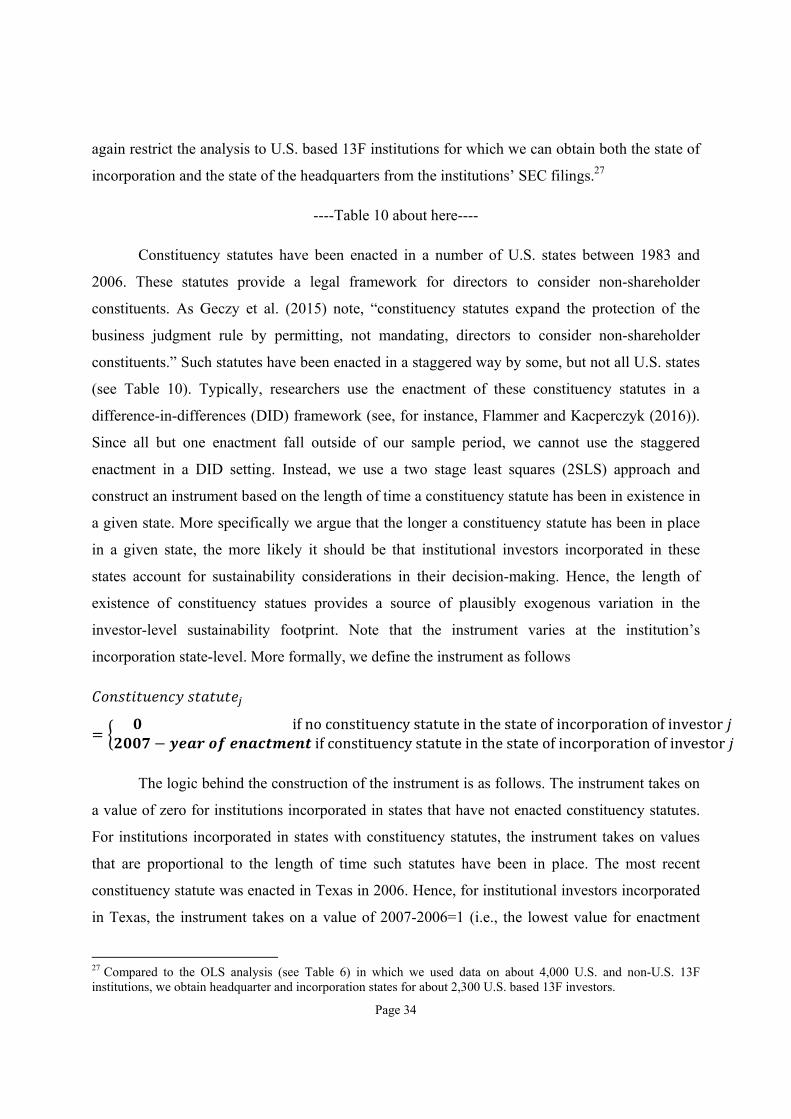
Page 34
again restrict the analysis to U.S. based 13F institutions for which we can obtain both the state of
incorporation and the state of the headquarters from the institutions’ SEC filings.27
----Table 10 about here----
Constituency statutes have been enacted in a number of U.S. states between 1983 and
2006. These statutes provide a legal framework for directors to consider non-shareholder
constituents. As Geczy et al. (2015) note, “constituency statutes expand the protection of the
business judgment rule by permitting, not mandating, directors to consider non-shareholder
constituents.” Such statutes have been enacted in a staggered way by some, but not all U.S. states
(see Table 10). Typically, researchers use the enactment of these constituency statutes in a
difference-in-differences (DID) framework (see, for instance, Flammer and Kacperczyk (2016)).
Since all but one enactment fall outside of our sample period, we cannot use the staggered
enactment in a DID setting. Instead, we use a two stage least squares (2SLS) approach and
construct an instrument based on the length of time a constituency statute has been in existence in
a given state. More specifically we argue that the longer a constituency statute has been in place
in a given state, the more likely it should be that institutional investors incorporated in these
states account for sustainability considerations in their decision-making. Hence, the length of
existence of constituency statues provides a source of plausibly exogenous variation in the
investor-level sustainability footprint. Note that the instrument varies at the institution’s
incorporation state-level. More formally, we define the instrument as follows
ifnoconstituencystatuteinthestateofincorporationofinvestor ifconstituencystatuteinthestateofincorporationofinvestor
The logic behind the construction of the instrument is as follows. The instrument takes on
a value of zero for institutions incorporated in states that have not enacted constituency statutes.
For institutions incorporated in states with constituency statutes, the instrument takes on values
that are proportional to the length of time such statutes have been in place. The most recent
constituency statute was enacted in Texas in 2006. Hence, for institutional investors incorporated
in Texas, the instrument takes on a value of 2007-2006=1 (i.e., the lowest value for enactment
27 Compared to the OLS analysis (see Table 6) in which we used data on about 4,000 U.S. and non-U.S. 13F institutions, we obtain headquarter and incorporation states for about 2,300 U.S. based 13F investors.
Page 35
states). Note that the only enactment that falls into our sample period is that in Texas in 2006.
Institutions incorporated in states that have enacted constituency statutes before 2006 have
proportionally higher values for the instrument Constituency statute. For example, for institutions
incorporated in Ohio, which enacted in 1984, Constituency statute has a value of 2007-1984=23.
Table 10 displays the number of investors by state of incorporation, the year in which the
constituency statute was enacted, and the values of the instrument Constituency statute. There is
considerable variation in the instrument across states.
The Constituency statute variable is a valid instrument if it is correlated with the
sustainability footprint (relevancy condition) but impacts the dependent variables (e.g., Sharpe
ratio) only through its effect on the sustainability footprint (exclusion restriction). The relevancy
condition can be tested in a straightforward manner by regressing the endogenous variable (i.e.,
the sustainability footprint) on the instrument. It seems plausible that there should be a positive
relation between the length of time a constituency statute has been enacted in the incorporation
state of an institutional investor and the institution’s sustainability footprint.
Testing the validity of the exclusion restriction is more difficult and there is no formal test
to do so. Hence, we have to argue for the validity of the exclusion restriction. We believe there is
no reason to think why constituency statutes would impact the risk-adjusted performance of
institutional investor portfolios directly. First of all, institutions typically hold geographically
diversified investment portfolios, reducing the possibility of a direct impact from the portfolio
firms’ incorporation state on the risk-adjusted performance of the institution. Note that even if
there was a correlation between the state of incorporation of an institution and its portfolio firms,
it is not clear a priori how constituency statutes would affect the performance of the institution’s
portfolio. Secondly, we use gross portfolio returns to calculate the dependent variables Mean
portfolio return, Total portfolio risk, and Sharpe ratio. While net returns, which account for taxes
and fees, could potentially vary across the institution’s incorporation states—because of, for
instance, state-level differences in wages or taxes—it seems implausible that institutions’ gross
portfolio returns would depend directly on the state of incorporation of the institution or on the
number of years a constituency statute has been enacted in the incorporation state.
One particularity of the U.S. is that many firms (and institutional investors) choose to
incorporate in Delaware. In our sample, about 900 13F institutions are incorporated in Delaware.
Page 36
It might be a concern that risk-adjusted performance is systematically different for Delaware
incorporated 13F institutions. Again, it is not clear how such potential state-level performance
differences would be directly related to our instrument. Nevertheless, we compare risk-adjusted
performance between institutions incorporated in Delaware and those incorporated in other U.S.
states and find no significant difference between the two. 28 Overall, we believe that our
instrument is valid.
----Table 11 about here----
In Table 11, we display the results from several specifications of the first stage regression
in which the sustainability footprint (at the quarterly horizon) is related to the instrument.29 In
column 1 of Table 8, we regress the sustainability footprint on the instrument and an intercept.
We double cluster standard errors by incorporation and headquarter state to account for the fact
that the instrumental variable varies at the incorporation state level and that there might be
additional clustering at the headquarter-incorporation-state pair level. The instrument is highly
statistically significant (t-statistic=4.38) and positively related to the sustainability footprint:
institutions’ sustainability footprints are increasing in the time constituency statutes have been in
place in the incorporation state. The F-statistic of the first stage regression that includes only the
instrument (column 1) is around 19 and thus easily exceeds the value of 10, which is sometimes
used as a threshold to rule out a weak instruments problem. In column 2, we add firm-level
variables to the regression model, which leaves the coefficient on the instrument largely
unchanged. In column 3, we add institution type fixed effects, which also leaves the magnitude of
the estimate unaffected. Overall, the results show that the sustainability footprint is significantly
positively related to the variable Constituency statute (i.e., the duration of time a constituency
statute has been in place in the incorporation state). We use the full model from column 3 of
Table 8 as our first stage regression.
----Table 12 about here----
In Table 12, we show the results from the second stage regressions. Columns 1-3 display
the second stage regressions for Mean portfolio return, Total portfolio risk, and the Sharpe ratio
28 The average quarterly Sharpe ratio of Delaware incorporated institutions is 0.24, while that of institutions incorporated in other U.S. states is 0.25. 29 The first stage regressions at the annual horizon are virtually identical and are therefore relegated to the Internet appendix.
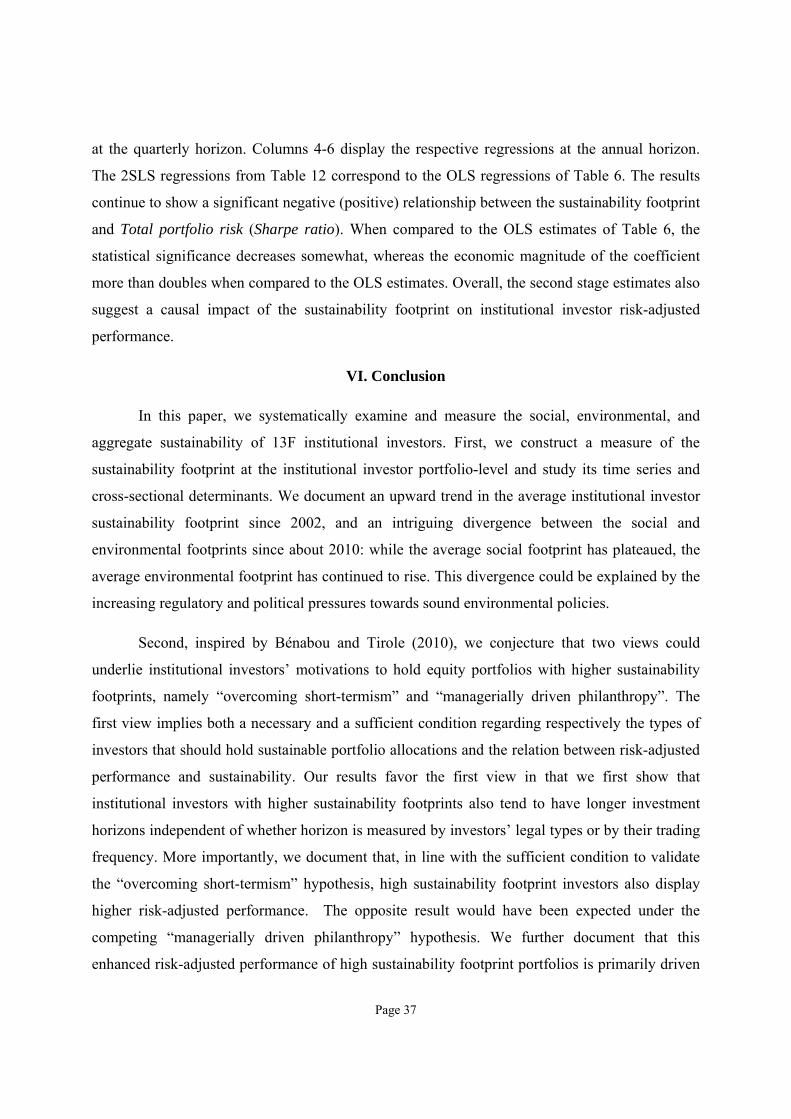
Page 37
at the quarterly horizon. Columns 4-6 display the respective regressions at the annual horizon.
The 2SLS regressions from Table 12 correspond to the OLS regressions of Table 6. The results
continue to show a significant negative (positive) relationship between the sustainability footprint
and Total portfolio risk (Sharpe ratio). When compared to the OLS estimates of Table 6, the
statistical significance decreases somewhat, whereas the economic magnitude of the coefficient
more than doubles when compared to the OLS estimates. Overall, the second stage estimates also
suggest a causal impact of the sustainability footprint on institutional investor risk-adjusted
performance.
VI. Conclusion
In this paper, we systematically examine and measure the social, environmental, and
aggregate sustainability of 13F institutional investors. First, we construct a measure of the
sustainability footprint at the institutional investor portfolio-level and study its time series and
cross-sectional determinants. We document an upward trend in the average institutional investor
sustainability footprint since 2002, and an intriguing divergence between the social and
environmental footprints since about 2010: while the average social footprint has plateaued, the
average environmental footprint has continued to rise. This divergence could be explained by the
increasing regulatory and political pressures towards sound environmental policies.
Second, inspired by Bénabou and Tirole (2010), we conjecture that two views could
underlie institutional investors’ motivations to hold equity portfolios with higher sustainability
footprints, namely “overcoming short-termism” and “managerially driven philanthropy”. The
first view implies both a necessary and a sufficient condition regarding respectively the types of
investors that should hold sustainable portfolio allocations and the relation between risk-adjusted
performance and sustainability. Our results favor the first view in that we first show that
institutional investors with higher sustainability footprints also tend to have longer investment
horizons independent of whether horizon is measured by investors’ legal types or by their trading
frequency. More importantly, we document that, in line with the sufficient condition to validate
the “overcoming short-termism” hypothesis, high sustainability footprint investors also display
higher risk-adjusted performance. The opposite result would have been expected under the
competing “managerially driven philanthropy” hypothesis. We further document that this
enhanced risk-adjusted performance of high sustainability footprint portfolios is primarily driven
Page 38
by a strong reduction in total portfolio risk, suggesting risk mitigation as being one of the main
channels through which portfolio-level sustainability generates long-term value. To argue for a
causal interpretation, we implement both an identification strategies based on the occurrence of
natural disasters and state-level constituency statutes that provide a legal framework for directors
to explicitly consider non-shareholder interests in their decision making. Both strategies suggest
a positive and causal impact of sustainability footprints on institutional investors’ risk-adjusted
performance.
Our results contribute importantly to the literature on the relation between institutional
investors’ financial performance and their environmental and social portfolio policies,
highlighting that the main driver of enhanced risk-adjusted performance is not return
enhancement—but quite to the contrary—a less explored channel that is reduction of total
portfolio risk. Thus, implementing responsible (or sustainable) investment practices is primarily a
risk management device that strengthens the resilience of institutional investors’ portfolios.
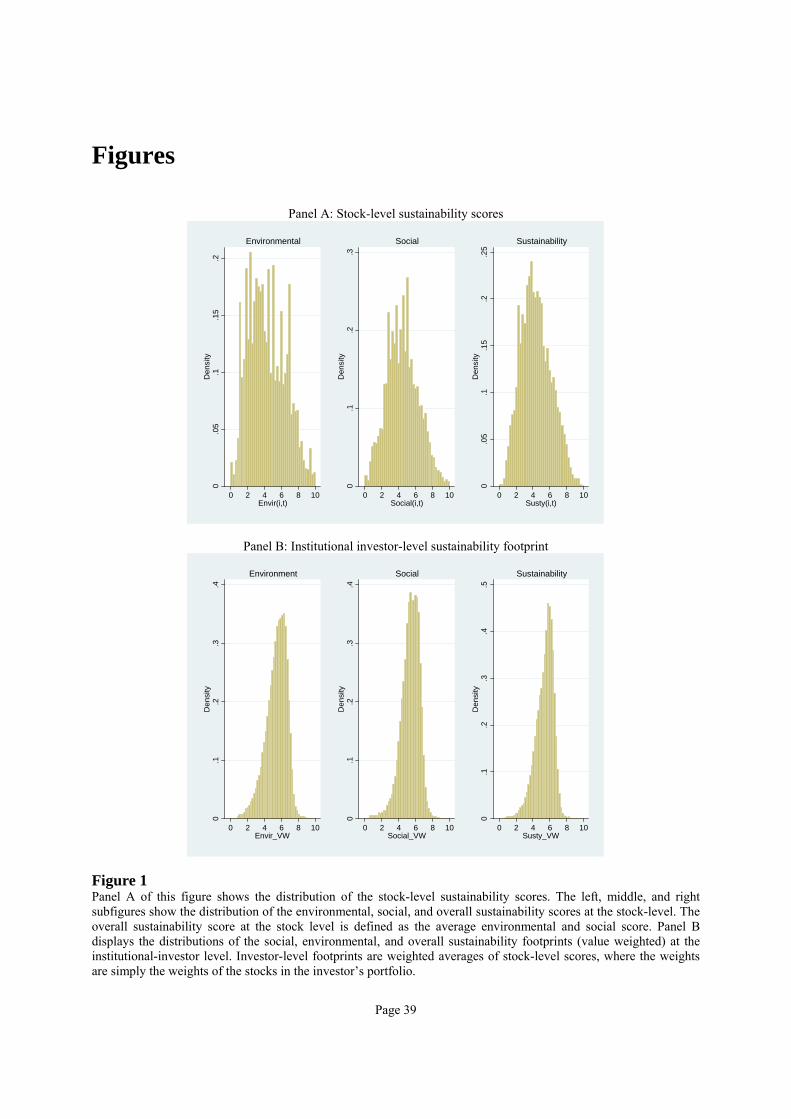
Page 39
Figures
Panel A: Stock-level sustainability scores
Panel B: Institutional investor-level sustainability footprint
Figure 1 Panel A of this figure shows the distribution of the stock-level sustainability scores. The left, middle, and right subfigures show the distribution of the environmental, social, and overall sustainability scores at the stock-level. The overall sustainability score at the stock level is defined as the average environmental and social score. Panel B displays the distributions of the social, environmental, and overall sustainability footprints (value weighted) at the institutional-investor level. Investor-level footprints are weighted averages of stock-level scores, where the weights are simply the weights of the stocks in the investor’s portfolio.
0.0
5.1
.15
.2D
en
sity
0 2 4 6 8 10Envir(i,t)
Environmental
0.1
.2.3
De
nsi
ty
0 2 4 6 8 10Social(i,t)
Social
0.0
5.1
.15
.2.2
5D
en
sity
0 2 4 6 8 10Susty(i,t)
Sustainability
0.1
.2.3
.4D
en
sity
0 2 4 6 8 10Envir_VW
Environment
0.1
.2.3
.4D
en
sity
0 2 4 6 8 10Social_VW
Social
0.1
.2.3
.4.5
De
nsi
ty
0 2 4 6 8 10Susty_VW
Sustainability
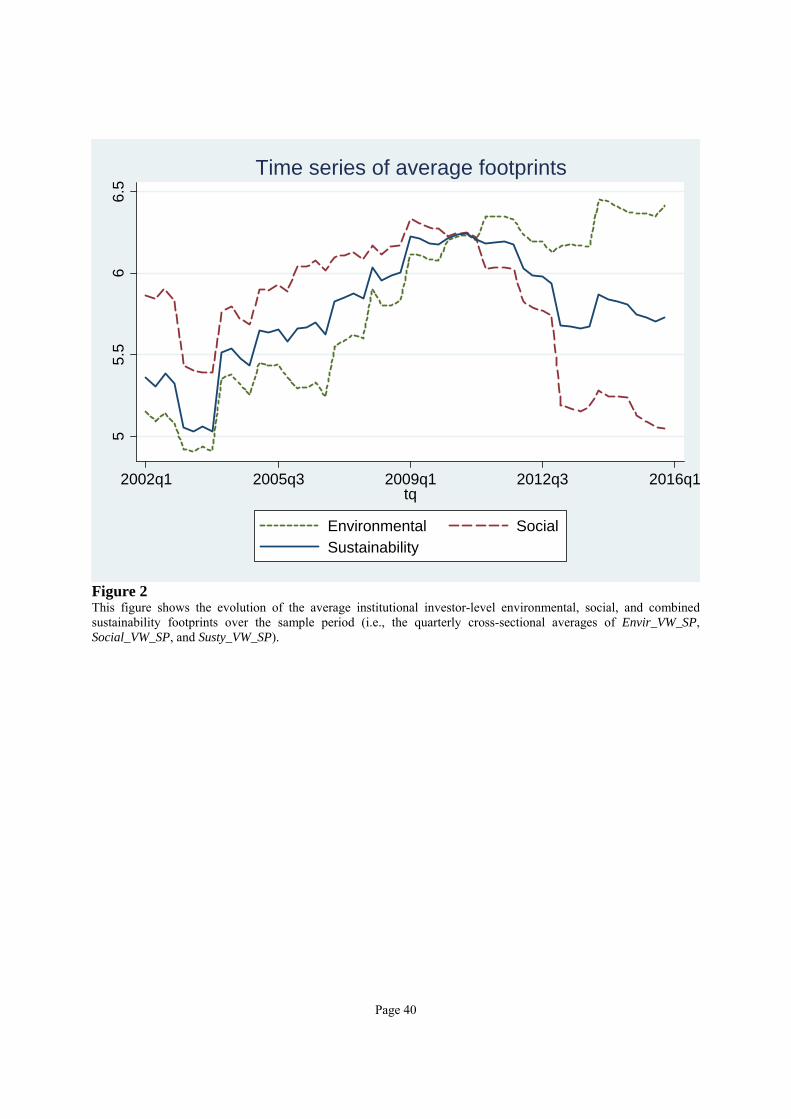
Page 40
Figure 2 This figure shows the evolution of the average institutional investor-level environmental, social, and combined sustainability footprints over the sample period (i.e., the quarterly cross-sectional averages of Envir_VW_SP, Social_VW_SP, and Susty_VW_SP).
55.
56
6.5
2002q1 2005q3 2009q1 2012q3 2016q1tq
Environmental SocialSustainability
Time series of average footprints
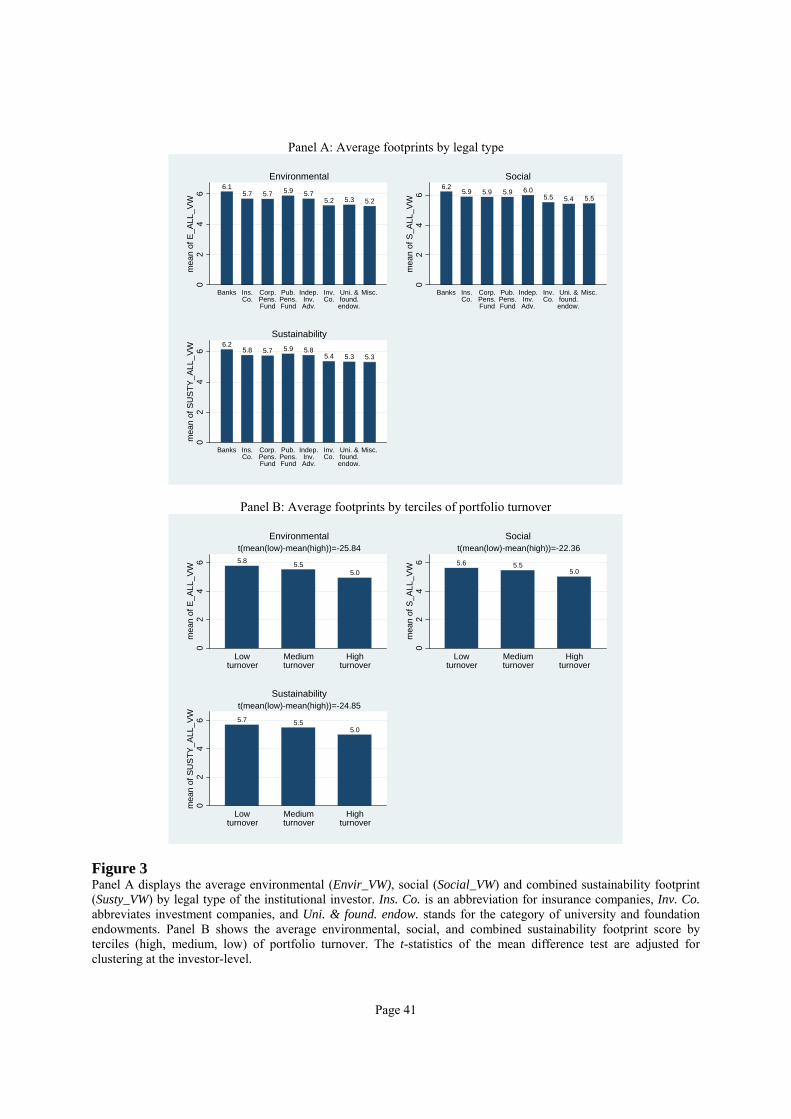
Page 41
Panel A: Average footprints by legal type
Panel B: Average footprints by terciles of portfolio turnover
Figure 3 Panel A displays the average environmental (Envir_VW), social (Social_VW) and combined sustainability footprint (Susty_VW) by legal type of the institutional investor. Ins. Co. is an abbreviation for insurance companies, Inv. Co. abbreviates investment companies, and Uni. & found. endow. stands for the category of university and foundation endowments. Panel B shows the average environmental, social, and combined sustainability footprint score by terciles (high, medium, low) of portfolio turnover. The t-statistics of the mean difference test are adjusted for clustering at the investor-level.
6.15.7 5.7 5.9 5.7
5.2 5.3 5.20
24
6m
ean
of E
_ALL
_VW
Banks Ins.Co.
Corp.Pens.Fund
Pub.Pens.Fund
Indep.Inv.Adv.
Inv.Co.
Uni. &found.endow.
Misc.
Environmental6.2
5.9 5.9 5.9 6.05.5 5.4 5.5
02
46
mea
n of
S_A
LL_V
W
Banks Ins.Co.
Corp.Pens.Fund
Pub.Pens.Fund
Indep.Inv.Adv.
Inv.Co.
Uni. &found.endow.
Misc.
Social
6.25.8 5.7 5.9 5.8
5.4 5.3 5.3
02
46
mea
n of
SU
ST
Y_A
LL_V
W
Banks Ins.Co.
Corp.Pens.Fund
Pub.Pens.Fund
Indep.Inv.Adv.
Inv.Co.
Uni. &found.endow.
Misc.
Sustainability
5.85.5
5.0
02
46
mea
n of
E_A
LL_V
W
Lowturnover
Mediumturnover
Highturnover
t(mean(low)-mean(high))=-25.84Environmental
5.6 5.55.0
02
46
mea
n of
S_A
LL_V
W
Lowturnover
Mediumturnover
Highturnover
t(mean(low)-mean(high))=-22.36Social
5.7 5.55.0
02
46
mea
n of
SU
ST
Y_A
LL_V
W
Lowturnover
Mediumturnover
Highturnover
t(mean(low)-mean(high))=-24.85Sustainability
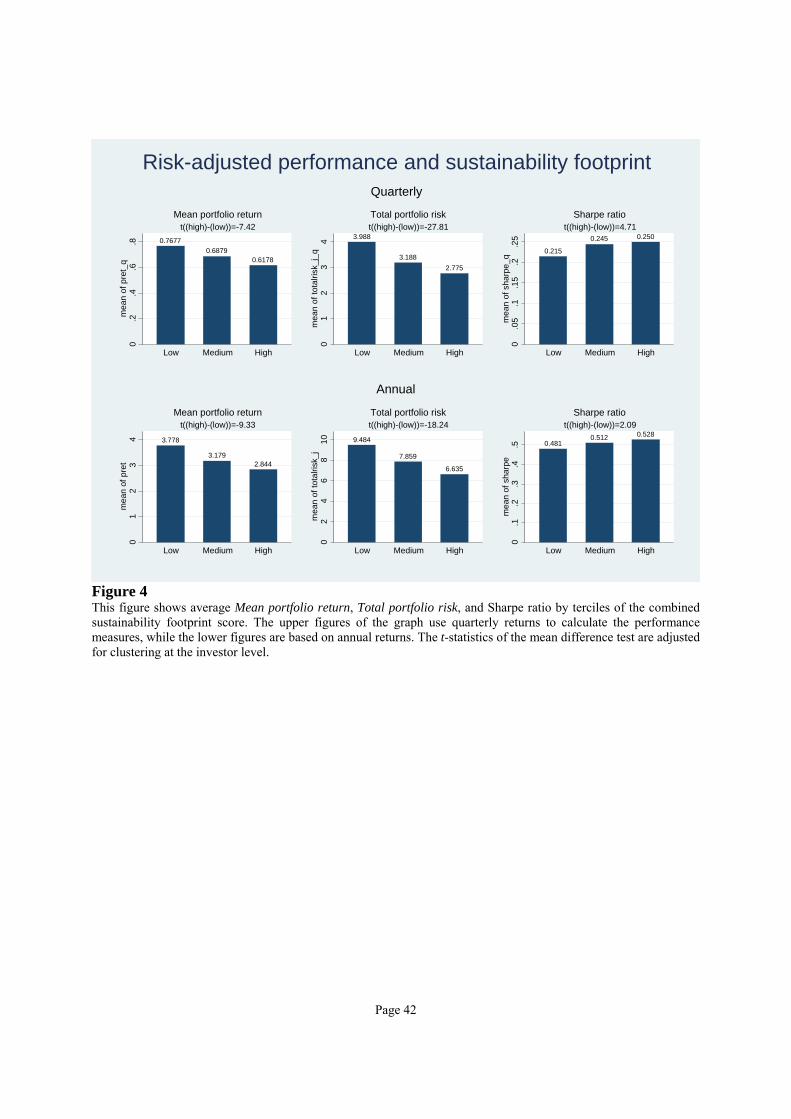
Page 42
Figure 4 This figure shows average Mean portfolio return, Total portfolio risk, and Sharpe ratio by terciles of the combined sustainability footprint score. The upper figures of the graph use quarterly returns to calculate the performance measures, while the lower figures are based on annual returns. The t-statistics of the mean difference test are adjusted for clustering at the investor level.
0.7677
0.68790.6178
0.2
.4.6
.8m
ean
of p
ret_
q
Low Medium High
t((high)-(low))=-7.42
Mean portfolio return
3.988
3.188
2.775
01
23
4m
ean
of t
otal
risk_
j_q
Low Medium High
t((high)-(low))=-27.81
Total portfolio risk
0.215
0.245 0.250
0.0
5.1
.15
.2.2
5m
ean
of s
harp
e_q
Low Medium High
t((high)-(low))=4.71
Sharpe ratio
Quarterly
3.778
3.1792.844
01
23
4m
ean
of p
ret
Low Medium High
t((high)-(low))=-9.33
Mean portfolio return
9.484
7.859
6.635
02
46
810
mea
n of
tot
alris
k_j
Low Medium High
t((high)-(low))=-18.24
Total portfolio risk
0.4810.512 0.528
0.1
.2.3
.4.5
mea
n of
sha
rpe
Low Medium High
t((high)-(low))=2.09
Sharpe ratio
Annual
Risk-adjusted performance and sustainability footprint
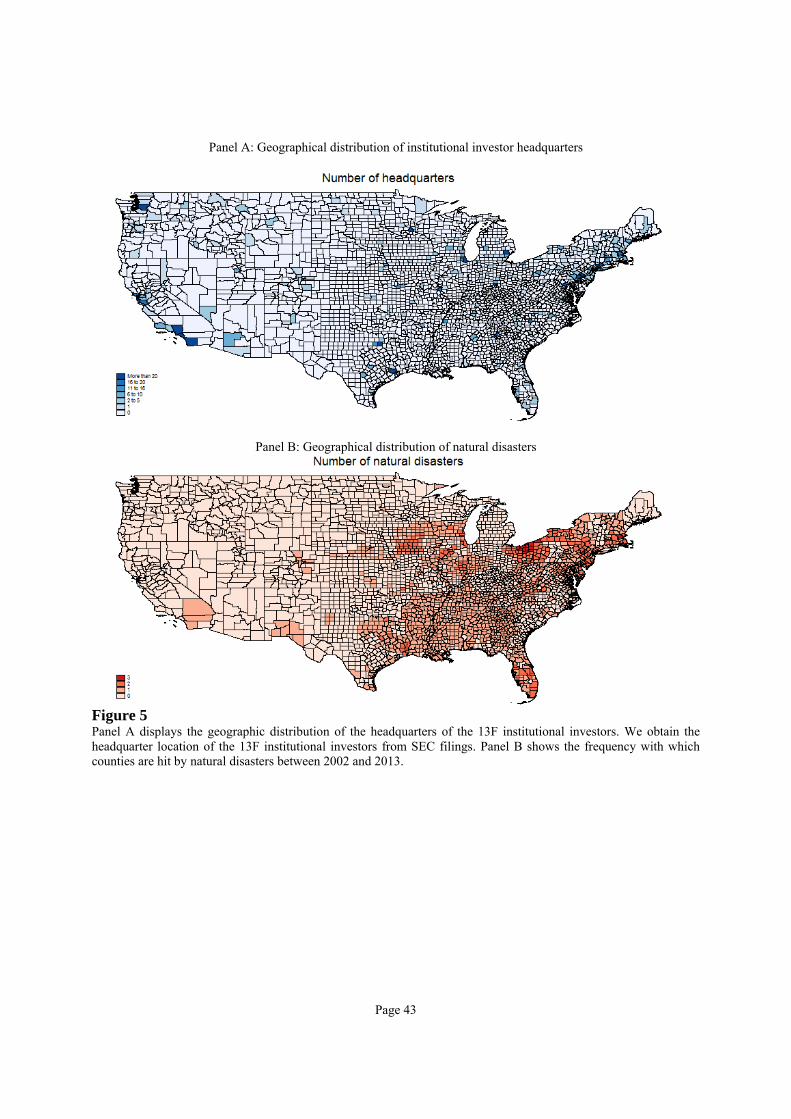
Page 43
Panel A: Geographical distribution of institutional investor headquarters
Panel B: Geographical distribution of natural disasters
Figure 5 Panel A displays the geographic distribution of the headquarters of the 13F institutional investors. We obtain the headquarter location of the 13F institutional investors from SEC filings. Panel B shows the frequency with which counties are hit by natural disasters between 2002 and 2013.
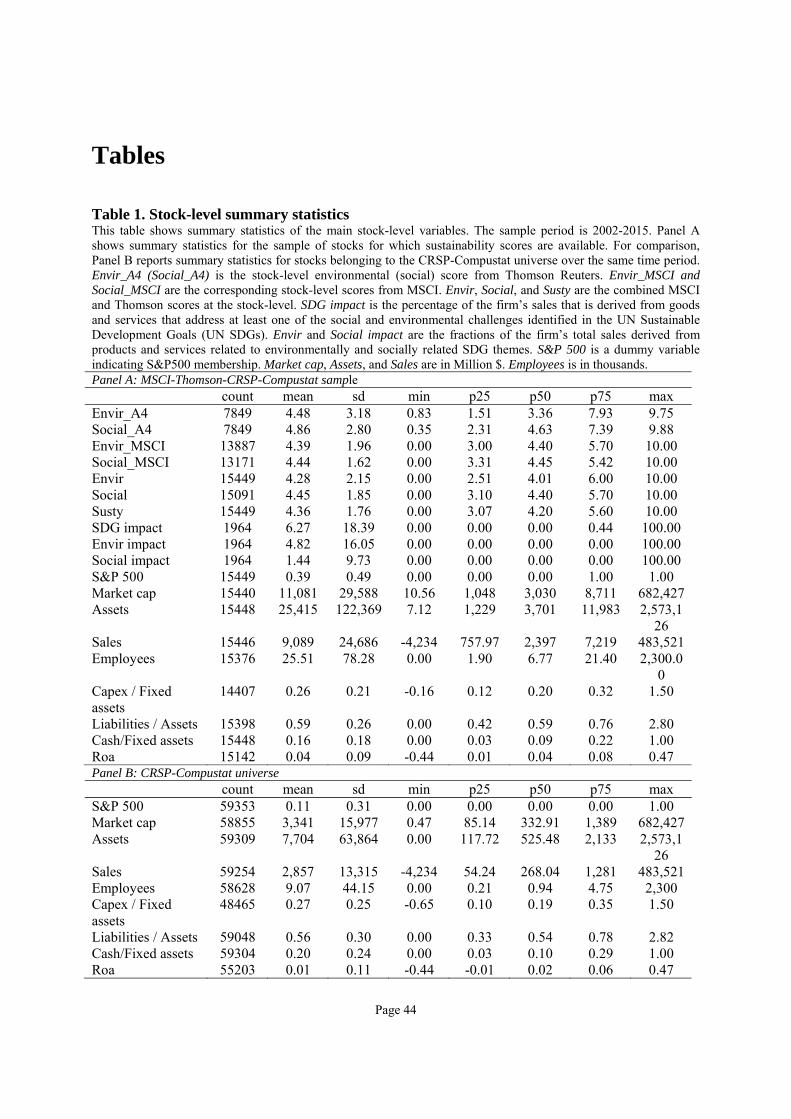
Page 44
Tables
Table 1. Stock-level summary statistics This table shows summary statistics of the main stock-level variables. The sample period is 2002-2015. Panel A shows summary statistics for the sample of stocks for which sustainability scores are available. For comparison, Panel B reports summary statistics for stocks belonging to the CRSP-Compustat universe over the same time period. Envir_A4 (Social_A4) is the stock-level environmental (social) score from Thomson Reuters. Envir_MSCI and Social_MSCI are the corresponding stock-level scores from MSCI. Envir, Social, and Susty are the combined MSCI and Thomson scores at the stock-level. SDG impact is the percentage of the firm’s sales that is derived from goods and services that address at least one of the social and environmental challenges identified in the UN Sustainable Development Goals (UN SDGs). Envir and Social impact are the fractions of the firm’s total sales derived from products and services related to environmentally and socially related SDG themes. S&P 500 is a dummy variable indicating S&P500 membership. Market cap, Assets, and Sales are in Million $. Employees is in thousands. Panel A: MSCI-Thomson-CRSP-Compustat sample count mean sd min p25 p50 p75 max Envir_A4 7849 4.48 3.18 0.83 1.51 3.36 7.93 9.75 Social_A4 7849 4.86 2.80 0.35 2.31 4.63 7.39 9.88 Envir_MSCI 13887 4.39 1.96 0.00 3.00 4.40 5.70 10.00 Social_MSCI 13171 4.44 1.62 0.00 3.31 4.45 5.42 10.00 Envir 15449 4.28 2.15 0.00 2.51 4.01 6.00 10.00 Social 15091 4.45 1.85 0.00 3.10 4.40 5.70 10.00 Susty 15449 4.36 1.76 0.00 3.07 4.20 5.60 10.00 SDG impact 1964 6.27 18.39 0.00 0.00 0.00 0.44 100.00 Envir impact 1964 4.82 16.05 0.00 0.00 0.00 0.00 100.00 Social impact 1964 1.44 9.73 0.00 0.00 0.00 0.00 100.00 S&P 500 15449 0.39 0.49 0.00 0.00 0.00 1.00 1.00 Market cap 15440 11,081 29,588 10.56 1,048 3,030 8,711 682,427 Assets 15448 25,415 122,369 7.12 1,229 3,701 11,983 2,573,1
26 Sales 15446 9,089 24,686 -4,234 757.97 2,397 7,219 483,521 Employees 15376 25.51 78.28 0.00 1.90 6.77 21.40 2,300.0
0 Capex / Fixed assets
14407 0.26 0.21 -0.16 0.12 0.20 0.32 1.50
Liabilities / Assets 15398 0.59 0.26 0.00 0.42 0.59 0.76 2.80 Cash/Fixed assets 15448 0.16 0.18 0.00 0.03 0.09 0.22 1.00 Roa 15142 0.04 0.09 -0.44 0.01 0.04 0.08 0.47 Panel B: CRSP-Compustat universe count mean sd min p25 p50 p75 max S&P 500 59353 0.11 0.31 0.00 0.00 0.00 0.00 1.00 Market cap 58855 3,341 15,977 0.47 85.14 332.91 1,389 682,427 Assets 59309 7,704 63,864 0.00 117.72 525.48 2,133 2,573,1
26 Sales 59254 2,857 13,315 -4,234 54.24 268.04 1,281 483,521 Employees 58628 9.07 44.15 0.00 0.21 0.94 4.75 2,300 Capex / Fixed assets
48465 0.27 0.25 -0.65 0.10 0.19 0.35 1.50
Liabilities / Assets 59048 0.56 0.30 0.00 0.33 0.54 0.78 2.82 Cash/Fixed assets 59304 0.20 0.24 0.00 0.03 0.10 0.29 1.00 Roa 55203 0.01 0.11 -0.44 -0.01 0.02 0.06 0.47
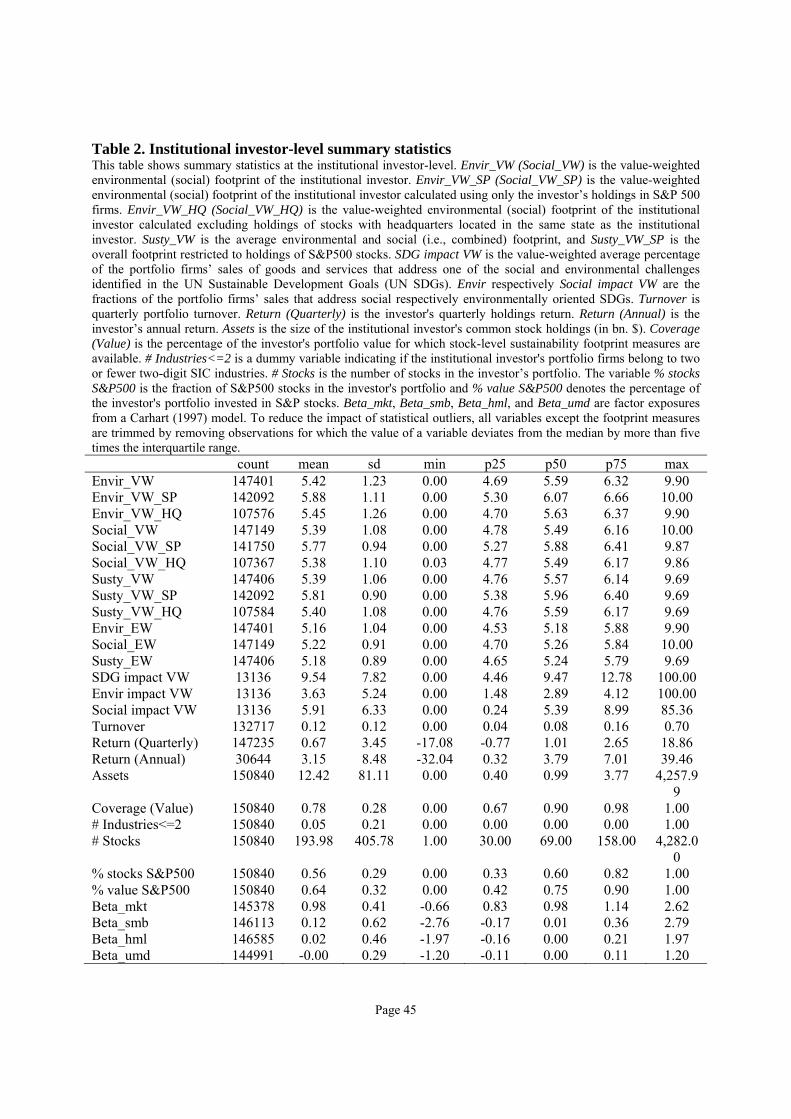
Page 45
Table 2. Institutional investor-level summary statistics This table shows summary statistics at the institutional investor-level. Envir_VW (Social_VW) is the value-weighted environmental (social) footprint of the institutional investor. Envir_VW_SP (Social_VW_SP) is the value-weighted environmental (social) footprint of the institutional investor calculated using only the investor’s holdings in S&P 500 firms. Envir_VW_HQ (Social_VW_HQ) is the value-weighted environmental (social) footprint of the institutional investor calculated excluding holdings of stocks with headquarters located in the same state as the institutional investor. Susty_VW is the average environmental and social (i.e., combined) footprint, and Susty_VW_SP is the overall footprint restricted to holdings of S&P500 stocks. SDG impact VW is the value-weighted average percentage of the portfolio firms’ sales of goods and services that address one of the social and environmental challenges identified in the UN Sustainable Development Goals (UN SDGs). Envir respectively Social impact VW are the fractions of the portfolio firms’ sales that address social respectively environmentally oriented SDGs. Turnover is quarterly portfolio turnover. Return (Quarterly) is the investor's quarterly holdings return. Return (Annual) is the investor’s annual return. Assets is the size of the institutional investor's common stock holdings (in bn. $). Coverage (Value) is the percentage of the investor's portfolio value for which stock-level sustainability footprint measures are available. # Industries<=2 is a dummy variable indicating if the institutional investor's portfolio firms belong to two or fewer two-digit SIC industries. # Stocks is the number of stocks in the investor’s portfolio. The variable % stocks S&P500 is the fraction of S&P500 stocks in the investor's portfolio and % value S&P500 denotes the percentage of the investor's portfolio invested in S&P stocks. Beta_mkt, Beta_smb, Beta_hml, and Beta_umd are factor exposures from a Carhart (1997) model. To reduce the impact of statistical outliers, all variables except the footprint measures are trimmed by removing observations for which the value of a variable deviates from the median by more than five times the interquartile range. count mean sd min p25 p50 p75 max Envir_VW 147401 5.42 1.23 0.00 4.69 5.59 6.32 9.90 Envir_VW_SP 142092 5.88 1.11 0.00 5.30 6.07 6.66 10.00 Envir_VW_HQ 107576 5.45 1.26 0.00 4.70 5.63 6.37 9.90 Social_VW 147149 5.39 1.08 0.00 4.78 5.49 6.16 10.00 Social_VW_SP 141750 5.77 0.94 0.00 5.27 5.88 6.41 9.87 Social_VW_HQ 107367 5.38 1.10 0.03 4.77 5.49 6.17 9.86 Susty_VW 147406 5.39 1.06 0.00 4.76 5.57 6.14 9.69 Susty_VW_SP 142092 5.81 0.90 0.00 5.38 5.96 6.40 9.69 Susty_VW_HQ 107584 5.40 1.08 0.00 4.76 5.59 6.17 9.69 Envir_EW 147401 5.16 1.04 0.00 4.53 5.18 5.88 9.90 Social_EW 147149 5.22 0.91 0.00 4.70 5.26 5.84 10.00 Susty_EW 147406 5.18 0.89 0.00 4.65 5.24 5.79 9.69 SDG impact VW 13136 9.54 7.82 0.00 4.46 9.47 12.78 100.00 Envir impact VW 13136 3.63 5.24 0.00 1.48 2.89 4.12 100.00 Social impact VW 13136 5.91 6.33 0.00 0.24 5.39 8.99 85.36 Turnover 132717 0.12 0.12 0.00 0.04 0.08 0.16 0.70 Return (Quarterly) 147235 0.67 3.45 -17.08 -0.77 1.01 2.65 18.86 Return (Annual) 30644 3.15 8.48 -32.04 0.32 3.79 7.01 39.46 Assets 150840 12.42 81.11 0.00 0.40 0.99 3.77 4,257.9
9 Coverage (Value) 150840 0.78 0.28 0.00 0.67 0.90 0.98 1.00 # Industries<=2 150840 0.05 0.21 0.00 0.00 0.00 0.00 1.00 # Stocks 150840 193.98 405.78 1.00 30.00 69.00 158.00 4,282.0
0 % stocks S&P500 150840 0.56 0.29 0.00 0.33 0.60 0.82 1.00 % value S&P500 150840 0.64 0.32 0.00 0.42 0.75 0.90 1.00 Beta_mkt 145378 0.98 0.41 -0.66 0.83 0.98 1.14 2.62 Beta_smb 146113 0.12 0.62 -2.76 -0.17 0.01 0.36 2.79 Beta_hml 146585 0.02 0.46 -1.97 -0.16 0.00 0.21 1.97 Beta_umd 144991 -0.00 0.29 -1.20 -0.11 0.00 0.11 1.20
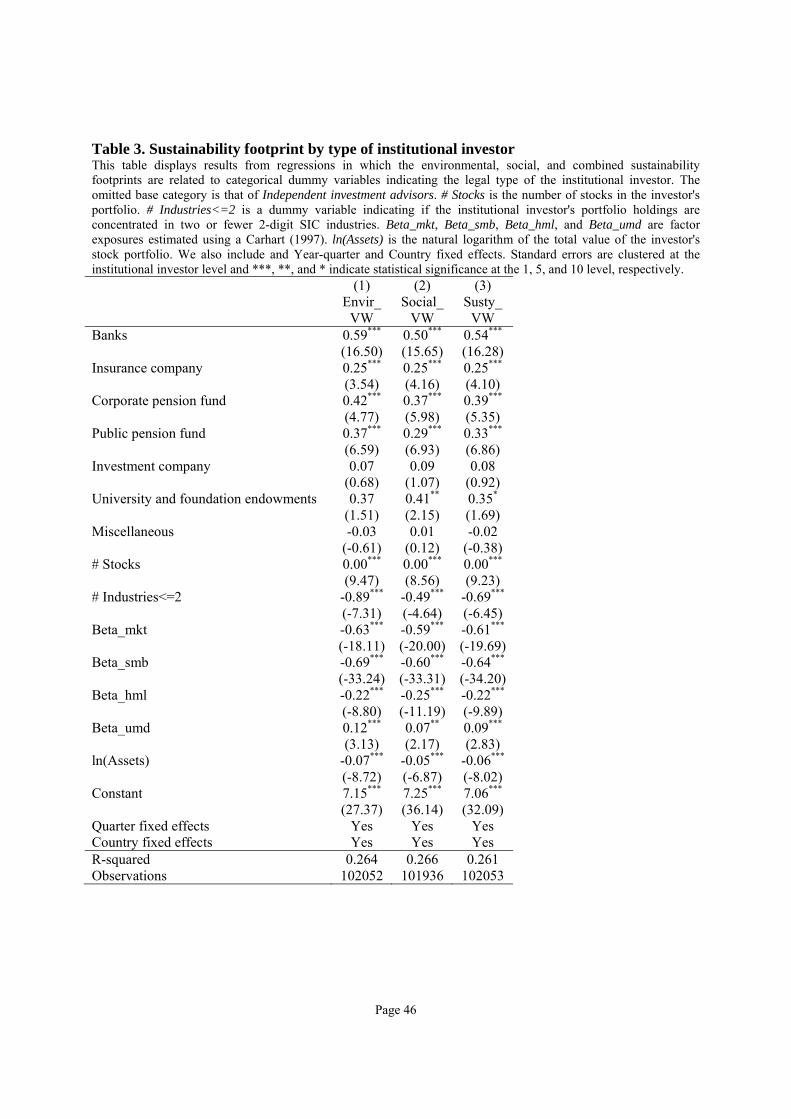
Page 46
Table 3. Sustainability footprint by type of institutional investor This table displays results from regressions in which the environmental, social, and combined sustainability footprints are related to categorical dummy variables indicating the legal type of the institutional investor. The omitted base category is that of Independent investment advisors. # Stocks is the number of stocks in the investor's portfolio. # Industries<=2 is a dummy variable indicating if the institutional investor's portfolio holdings are concentrated in two or fewer 2-digit SIC industries. Beta_mkt, Beta_smb, Beta_hml, and Beta_umd are factor exposures estimated using a Carhart (1997). ln(Assets) is the natural logarithm of the total value of the investor's stock portfolio. We also include and Year-quarter and Country fixed effects. Standard errors are clustered at the institutional investor level and ***, **, and * indicate statistical significance at the 1, 5, and 10 level, respectively. (1) (2) (3) Envir_
VW Social_
VW Susty_
VW Banks 0.59***
(16.50) 0.50***
(15.65) 0.54***
(16.28) Insurance company 0.25***
(3.54) 0.25***
(4.16) 0.25***
(4.10) Corporate pension fund 0.42***
(4.77) 0.37***
(5.98) 0.39***
(5.35) Public pension fund 0.37***
(6.59) 0.29***
(6.93) 0.33***
(6.86) Investment company 0.07
(0.68) 0.09
(1.07) 0.08
(0.92) University and foundation endowments 0.37
(1.51) 0.41** (2.15)
0.35* (1.69)
Miscellaneous -0.03 (-0.61)
0.01 (0.12)
-0.02 (-0.38)
# Stocks 0.00***
(9.47) 0.00***
(8.56) 0.00***
(9.23) # Industries<=2 -0.89***
(-7.31) -0.49***
(-4.64) -0.69***
(-6.45) Beta_mkt -0.63***
(-18.11)-0.59***
(-20.00) -0.61***
(-19.69)Beta_smb -0.69***
(-33.24)-0.60***
(-33.31) -0.64***
(-34.20)Beta_hml -0.22***
(-8.80) -0.25***
(-11.19) -0.22***
(-9.89) Beta_umd 0.12***
(3.13) 0.07** (2.17)
0.09***
(2.83) ln(Assets) -0.07***
(-8.72) -0.05***
(-6.87) -0.06***
(-8.02) Constant 7.15***
(27.37) 7.25***
(36.14) 7.06***
(32.09) Quarter fixed effects Yes Yes Yes Country fixed effects Yes Yes Yes R-squared 0.264 0.266 0.261 Observations 102052 101936 102053
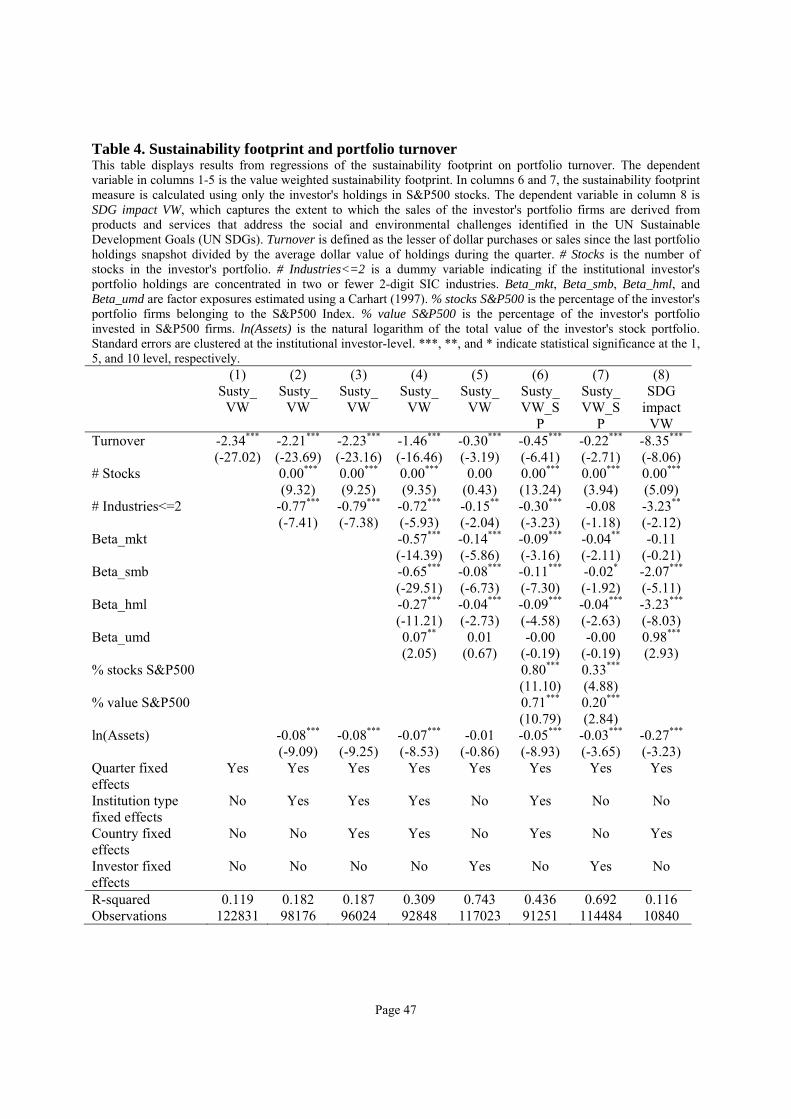
Page 47
Table 4. Sustainability footprint and portfolio turnover This table displays results from regressions of the sustainability footprint on portfolio turnover. The dependent variable in columns 1-5 is the value weighted sustainability footprint. In columns 6 and 7, the sustainability footprint measure is calculated using only the investor's holdings in S&P500 stocks. The dependent variable in column 8 is SDG impact VW, which captures the extent to which the sales of the investor's portfolio firms are derived from products and services that address the social and environmental challenges identified in the UN Sustainable Development Goals (UN SDGs). Turnover is defined as the lesser of dollar purchases or sales since the last portfolio holdings snapshot divided by the average dollar value of holdings during the quarter. # Stocks is the number of stocks in the investor's portfolio. # Industries<=2 is a dummy variable indicating if the institutional investor's portfolio holdings are concentrated in two or fewer 2-digit SIC industries. Beta_mkt, Beta_smb, Beta_hml, and Beta_umd are factor exposures estimated using a Carhart (1997). % stocks S&P500 is the percentage of the investor's portfolio firms belonging to the S&P500 Index. % value S&P500 is the percentage of the investor's portfolio invested in S&P500 firms. ln(Assets) is the natural logarithm of the total value of the investor's stock portfolio. Standard errors are clustered at the institutional investor-level. ***, **, and * indicate statistical significance at the 1, 5, and 10 level, respectively. (1) (2) (3) (4) (5) (6) (7) (8) Susty_
VW Susty_
VW Susty_
VW Susty_
VW Susty_
VW Susty_VW_S
P
Susty_VW_S
P
SDG impact
VW Turnover -2.34***
(-27.02) -2.21*** (-23.69)
-2.23***
(-23.16)-1.46***
(-16.46) -0.30***
(-3.19) -0.45*** (-6.41)
-0.22*** (-2.71)
-8.35***
(-8.06) # Stocks
0.00*** (9.32)
0.00***
(9.25) 0.00***
(9.35) 0.00
(0.43) 0.00*** (13.24)
0.00*** (3.94)
0.00***
(5.09) # Industries<=2
-0.77*** (-7.41)
-0.79***
(-7.38) -0.72***
(-5.93) -0.15**
(-2.04) -0.30*** (-3.23)
-0.08 (-1.18)
-3.23**
(-2.12) Beta_mkt
-0.57***
(-14.39) -0.14***
(-5.86) -0.09*** (-3.16)
-0.04** (-2.11)
-0.11 (-0.21)
Beta_smb
-0.65***
(-29.51) -0.08***
(-6.73) -0.11*** (-7.30)
-0.02* (-1.92)
-2.07***
(-5.11) Beta_hml
-0.27***
(-11.21) -0.04***
(-2.73) -0.09*** (-4.58)
-0.04*** (-2.63)
-3.23***
(-8.03) Beta_umd
0.07** (2.05)
0.01 (0.67)
-0.00 (-0.19)
-0.00 (-0.19)
0.98***
(2.93) % stocks S&P500
0.80*** (11.10)
0.33*** (4.88)
% value S&P500
0.71*** (10.79)
0.20*** (2.84)
ln(Assets)
-0.08*** (-9.09)
-0.08***
(-9.25) -0.07***
(-8.53) -0.01
(-0.86) -0.05*** (-8.93)
-0.03*** (-3.65)
-0.27***
(-3.23) Quarter fixed effects
Yes Yes Yes Yes Yes Yes Yes Yes
Institution type fixed effects
No Yes Yes Yes No Yes No No
Country fixed effects
No No Yes Yes No Yes No Yes
Investor fixed effects
No No No No Yes No Yes No
R-squared 0.119 0.182 0.187 0.309 0.743 0.436 0.692 0.116 Observations 122831 98176 96024 92848 117023 91251 114484 10840
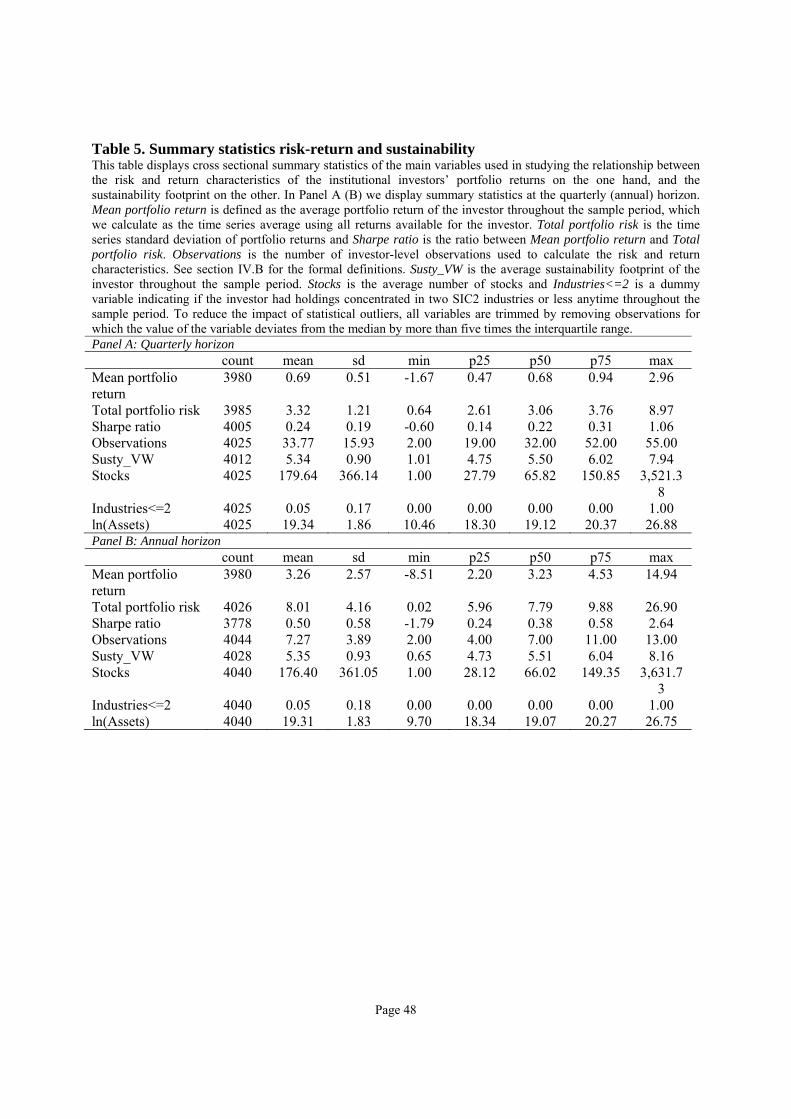
Page 48
Table 5. Summary statistics risk-return and sustainability This table displays cross sectional summary statistics of the main variables used in studying the relationship between the risk and return characteristics of the institutional investors’ portfolio returns on the one hand, and the sustainability footprint on the other. In Panel A (B) we display summary statistics at the quarterly (annual) horizon. Mean portfolio return is defined as the average portfolio return of the investor throughout the sample period, which we calculate as the time series average using all returns available for the investor. Total portfolio risk is the time series standard deviation of portfolio returns and Sharpe ratio is the ratio between Mean portfolio return and Total portfolio risk. Observations is the number of investor-level observations used to calculate the risk and return characteristics. See section IV.B for the formal definitions. Susty_VW is the average sustainability footprint of the investor throughout the sample period. Stocks is the average number of stocks and Industries<=2 is a dummy variable indicating if the investor had holdings concentrated in two SIC2 industries or less anytime throughout the sample period. To reduce the impact of statistical outliers, all variables are trimmed by removing observations for which the value of the variable deviates from the median by more than five times the interquartile range. Panel A: Quarterly horizon count mean sd min p25 p50 p75 max Mean portfolio return
3980 0.69 0.51 -1.67 0.47 0.68 0.94 2.96
Total portfolio risk 3985 3.32 1.21 0.64 2.61 3.06 3.76 8.97 Sharpe ratio 4005 0.24 0.19 -0.60 0.14 0.22 0.31 1.06 Observations 4025 33.77 15.93 2.00 19.00 32.00 52.00 55.00 Susty_VW 4012 5.34 0.90 1.01 4.75 5.50 6.02 7.94 Stocks 4025 179.64 366.14 1.00 27.79 65.82 150.85 3,521.3
8 Industries<=2 4025 0.05 0.17 0.00 0.00 0.00 0.00 1.00 ln(Assets) 4025 19.34 1.86 10.46 18.30 19.12 20.37 26.88 Panel B: Annual horizon count mean sd min p25 p50 p75 max Mean portfolio return
3980 3.26 2.57 -8.51 2.20 3.23 4.53 14.94
Total portfolio risk 4026 8.01 4.16 0.02 5.96 7.79 9.88 26.90 Sharpe ratio 3778 0.50 0.58 -1.79 0.24 0.38 0.58 2.64 Observations 4044 7.27 3.89 2.00 4.00 7.00 11.00 13.00 Susty_VW 4028 5.35 0.93 0.65 4.73 5.51 6.04 8.16 Stocks 4040 176.40 361.05 1.00 28.12 66.02 149.35 3,631.7
3 Industries<=2 4040 0.05 0.18 0.00 0.00 0.00 0.00 1.00 ln(Assets) 4040 19.31 1.83 9.70 18.34 19.07 20.27 26.75
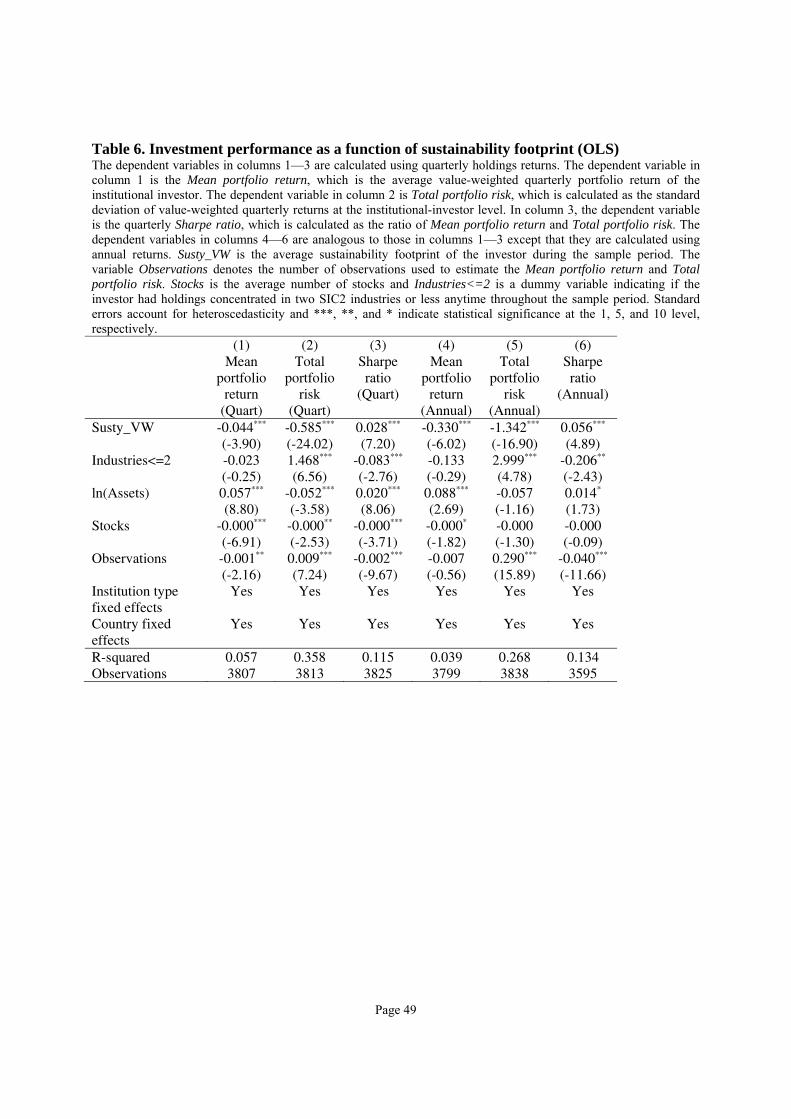
Page 49
Table 6. Investment performance as a function of sustainability footprint (OLS) The dependent variables in columns 1—3 are calculated using quarterly holdings returns. The dependent variable in column 1 is the Mean portfolio return, which is the average value-weighted quarterly portfolio return of the institutional investor. The dependent variable in column 2 is Total portfolio risk, which is calculated as the standard deviation of value-weighted quarterly returns at the institutional-investor level. In column 3, the dependent variable is the quarterly Sharpe ratio, which is calculated as the ratio of Mean portfolio return and Total portfolio risk. The dependent variables in columns 4—6 are analogous to those in columns 1—3 except that they are calculated using annual returns. Susty_VW is the average sustainability footprint of the investor during the sample period. The variable Observations denotes the number of observations used to estimate the Mean portfolio return and Total portfolio risk. Stocks is the average number of stocks and Industries<=2 is a dummy variable indicating if the investor had holdings concentrated in two SIC2 industries or less anytime throughout the sample period. Standard errors account for heteroscedasticity and ***, **, and * indicate statistical significance at the 1, 5, and 10 level, respectively. (1) (2) (3) (4) (5) (6) Mean
portfolio return
(Quart)
Total portfolio
risk (Quart)
Sharpe ratio
(Quart)
Mean portfolio
return (Annual)
Total portfolio
risk (Annual)
Sharpe ratio
(Annual)
Susty_VW -0.044*** (-3.90)
-0.585*** (-24.02)
0.028*** (7.20)
-0.330*** (-6.02)
-1.342*** (-16.90)
0.056*** (4.89)
Industries<=2 -0.023 (-0.25)
1.468*** (6.56)
-0.083*** (-2.76)
-0.133 (-0.29)
2.999*** (4.78)
-0.206** (-2.43)
ln(Assets) 0.057*** (8.80)
-0.052*** (-3.58)
0.020*** (8.06)
0.088*** (2.69)
-0.057 (-1.16)
0.014* (1.73)
Stocks -0.000*** (-6.91)
-0.000** (-2.53)
-0.000*** (-3.71)
-0.000* (-1.82)
-0.000 (-1.30)
-0.000 (-0.09)
Observations -0.001** (-2.16)
0.009*** (7.24)
-0.002*** (-9.67)
-0.007 (-0.56)
0.290*** (15.89)
-0.040*** (-11.66)
Institution type fixed effects
Yes Yes Yes Yes Yes Yes
Country fixed effects
Yes Yes Yes Yes Yes Yes
R-squared 0.057 0.358 0.115 0.039 0.268 0.134 Observations 3807 3813 3825 3799 3838 3595
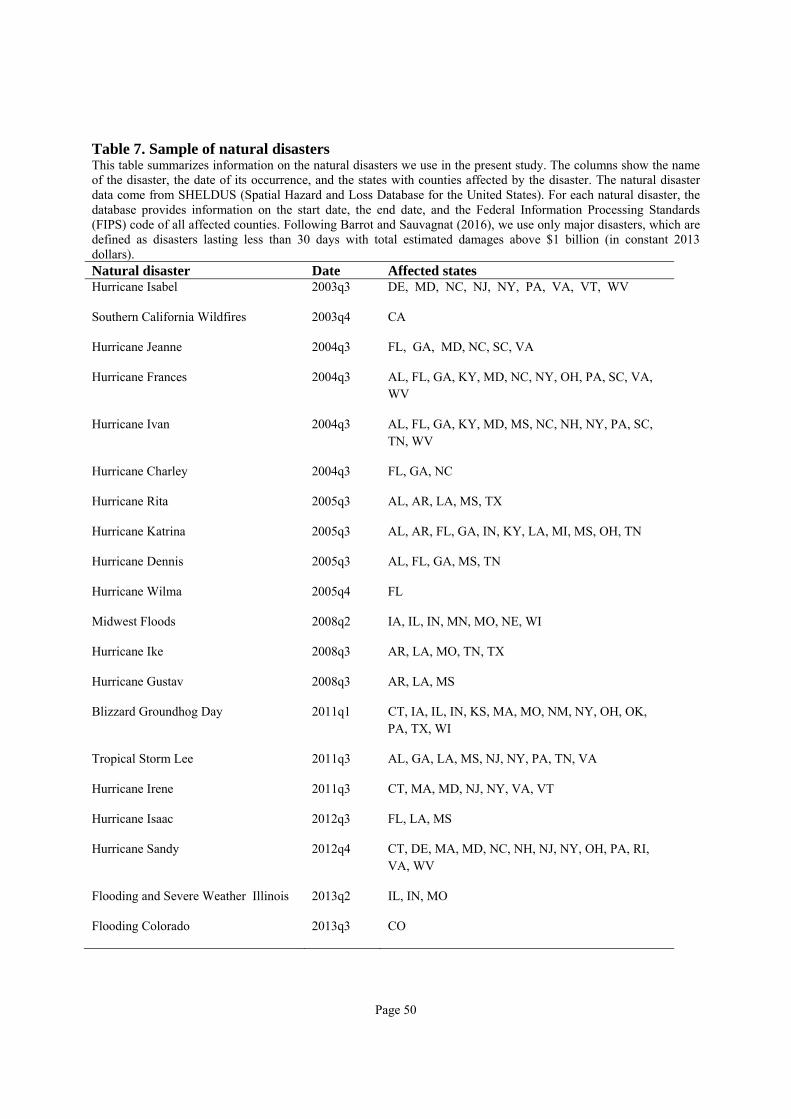
Page 50
Table 7. Sample of natural disasters This table summarizes information on the natural disasters we use in the present study. The columns show the name of the disaster, the date of its occurrence, and the states with counties affected by the disaster. The natural disaster data come from SHELDUS (Spatial Hazard and Loss Database for the United States). For each natural disaster, the database provides information on the start date, the end date, and the Federal Information Processing Standards (FIPS) code of all affected counties. Following Barrot and Sauvagnat (2016), we use only major disasters, which are defined as disasters lasting less than 30 days with total estimated damages above $1 billion (in constant 2013 dollars). Natural disaster Date Affected states Hurricane Isabel 2003q3 DE, MD, NC, NJ, NY, PA, VA, VT, WV
Southern California Wildfires 2003q4 CA
Hurricane Jeanne 2004q3 FL, GA, MD, NC, SC, VA
Hurricane Frances 2004q3 AL, FL, GA, KY, MD, NC, NY, OH, PA, SC, VA, WV
Hurricane Ivan 2004q3 AL, FL, GA, KY, MD, MS, NC, NH, NY, PA, SC, TN, WV
Hurricane Charley 2004q3 FL, GA, NC
Hurricane Rita 2005q3 AL, AR, LA, MS, TX
Hurricane Katrina 2005q3 AL, AR, FL, GA, IN, KY, LA, MI, MS, OH, TN
Hurricane Dennis 2005q3 AL, FL, GA, MS, TN
Hurricane Wilma 2005q4 FL
Midwest Floods 2008q2 IA, IL, IN, MN, MO, NE, WI
Hurricane Ike 2008q3 AR, LA, MO, TN, TX
Hurricane Gustav 2008q3 AR, LA, MS
Blizzard Groundhog Day 2011q1 CT, IA, IL, IN, KS, MA, MO, NM, NY, OH, OK, PA, TX, WI
Tropical Storm Lee 2011q3 AL, GA, LA, MS, NJ, NY, PA, TN, VA
Hurricane Irene 2011q3 CT, MA, MD, NJ, NY, VA, VT
Hurricane Isaac 2012q3 FL, LA, MS
Hurricane Sandy 2012q4 CT, DE, MA, MD, NC, NH, NJ, NY, OH, PA, RI, VA, WV
Flooding and Severe Weather Illinois 2013q2 IL, IN, MO
Flooding Colorado 2013q3 CO
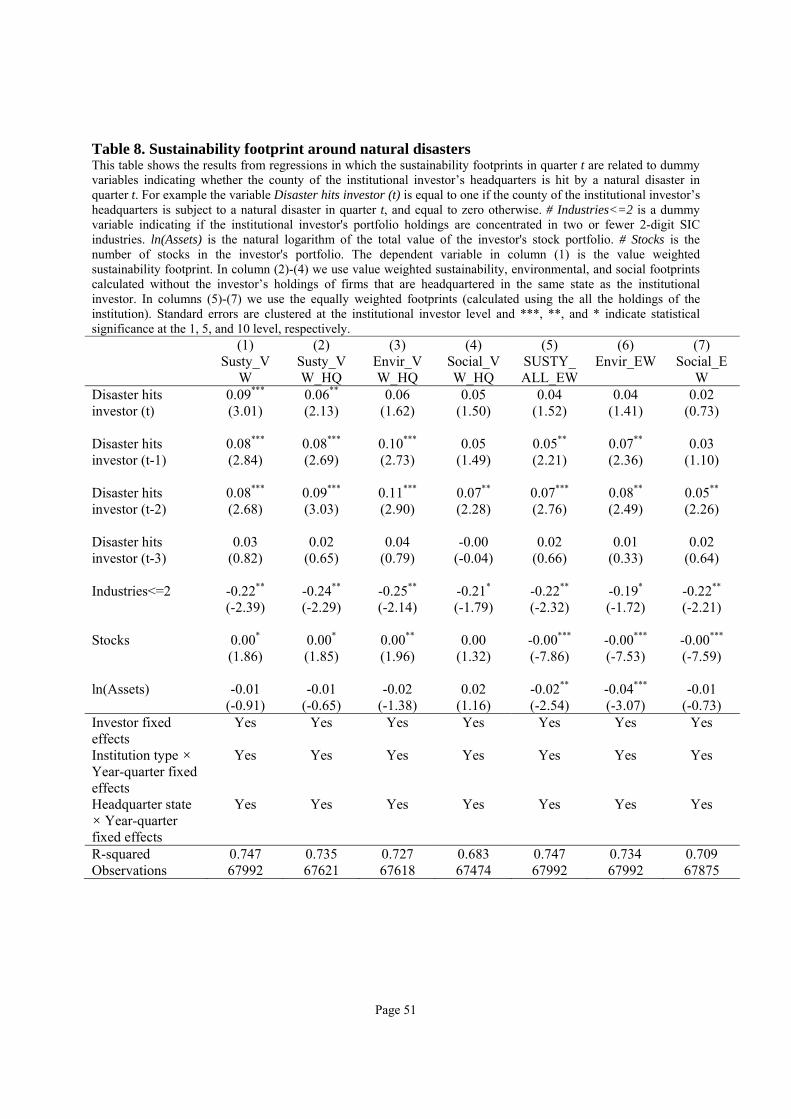
Page 51
Table 8. Sustainability footprint around natural disasters This table shows the results from regressions in which the sustainability footprints in quarter t are related to dummy variables indicating whether the county of the institutional investor’s headquarters is hit by a natural disaster in quarter t. For example the variable Disaster hits investor (t) is equal to one if the county of the institutional investor’s headquarters is subject to a natural disaster in quarter t, and equal to zero otherwise. # Industries<=2 is a dummy variable indicating if the institutional investor's portfolio holdings are concentrated in two or fewer 2-digit SIC industries. ln(Assets) is the natural logarithm of the total value of the investor's stock portfolio. # Stocks is the number of stocks in the investor's portfolio. The dependent variable in column (1) is the value weighted sustainability footprint. In column (2)-(4) we use value weighted sustainability, environmental, and social footprints calculated without the investor’s holdings of firms that are headquartered in the same state as the institutional investor. In columns (5)-(7) we use the equally weighted footprints (calculated using the all the holdings of the institution). Standard errors are clustered at the institutional investor level and ***, **, and * indicate statistical significance at the 1, 5, and 10 level, respectively. (1) (2) (3) (4) (5) (6) (7) Susty_V
W Susty_VW_HQ
Envir_VW_HQ
Social_VW_HQ
SUSTY_ALL_EW
Envir_EW Social_EW
Disaster hits investor (t)
0.09*** (3.01)
0.06** (2.13)
0.06 (1.62)
0.05 (1.50)
0.04 (1.52)
0.04 (1.41)
0.02 (0.73)
Disaster hits investor (t-1)
0.08*** (2.84)
0.08*** (2.69)
0.10*** (2.73)
0.05 (1.49)
0.05** (2.21)
0.07** (2.36)
0.03 (1.10)
Disaster hits investor (t-2)
0.08*** (2.68)
0.09*** (3.03)
0.11*** (2.90)
0.07** (2.28)
0.07*** (2.76)
0.08** (2.49)
0.05** (2.26)
Disaster hits investor (t-3)
0.03 (0.82)
0.02 (0.65)
0.04 (0.79)
-0.00 (-0.04)
0.02 (0.66)
0.01 (0.33)
0.02 (0.64)
Industries<=2 -0.22**
(-2.39) -0.24** (-2.29)
-0.25** (-2.14)
-0.21* (-1.79)
-0.22** (-2.32)
-0.19* (-1.72)
-0.22** (-2.21)
Stocks 0.00*
(1.86) 0.00* (1.85)
0.00** (1.96)
0.00 (1.32)
-0.00*** (-7.86)
-0.00*** (-7.53)
-0.00*** (-7.59)
ln(Assets) -0.01
(-0.91) -0.01
(-0.65) -0.02
(-1.38) 0.02
(1.16) -0.02** (-2.54)
-0.04*** (-3.07)
-0.01 (-0.73)
Investor fixed effects
Yes Yes Yes Yes Yes Yes Yes
Institution type × Year-quarter fixed effects
Yes Yes Yes Yes Yes Yes Yes
Headquarter state × Year-quarter fixed effects
Yes Yes Yes Yes Yes Yes Yes
R-squared 0.747 0.735 0.727 0.683 0.747 0.734 0.709 Observations 67992 67621 67618 67474 67992 67992 67875
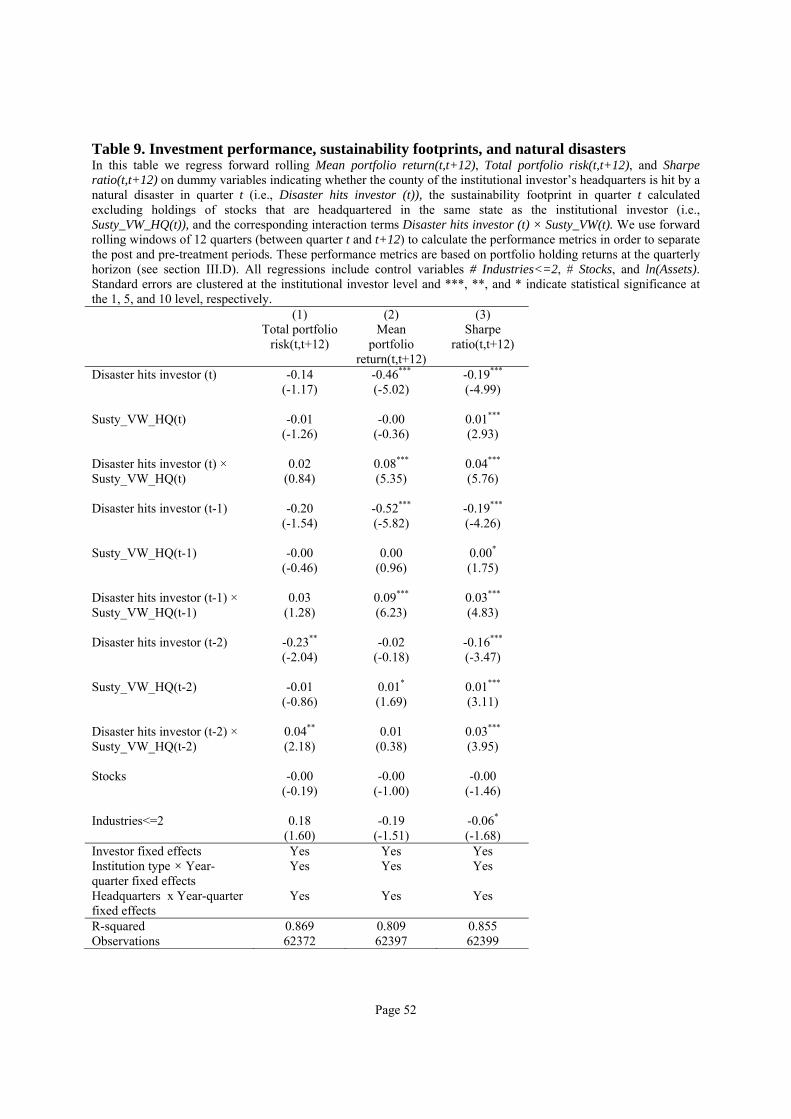
Page 52
Table 9. Investment performance, sustainability footprints, and natural disasters In this table we regress forward rolling Mean portfolio return(t,t+12), Total portfolio risk(t,t+12), and Sharpe ratio(t,t+12) on dummy variables indicating whether the county of the institutional investor’s headquarters is hit by a natural disaster in quarter t (i.e., Disaster hits investor (t)), the sustainability footprint in quarter t calculated excluding holdings of stocks that are headquartered in the same state as the institutional investor (i.e., Susty_VW_HQ(t)), and the corresponding interaction terms Disaster hits investor (t) × Susty_VW(t). We use forward rolling windows of 12 quarters (between quarter t and t+12) to calculate the performance metrics in order to separate the post and pre-treatment periods. These performance metrics are based on portfolio holding returns at the quarterly horizon (see section III.D). All regressions include control variables # Industries<=2, # Stocks, and ln(Assets). Standard errors are clustered at the institutional investor level and ***, **, and * indicate statistical significance at the 1, 5, and 10 level, respectively. (1) (2) (3) Total portfolio
risk(t,t+12) Mean
portfolio return(t,t+12)
Sharpe ratio(t,t+12)
Disaster hits investor (t) -0.14 (-1.17)
-0.46*** (-5.02)
-0.19*** (-4.99)
Susty_VW_HQ(t) -0.01
(-1.26) -0.00
(-0.36) 0.01*** (2.93)
Disaster hits investor (t) × Susty_VW_HQ(t)
0.02 (0.84)
0.08*** (5.35)
0.04*** (5.76)
Disaster hits investor (t-1) -0.20
(-1.54) -0.52*** (-5.82)
-0.19*** (-4.26)
Susty_VW_HQ(t-1) -0.00
(-0.46) 0.00
(0.96) 0.00* (1.75)
Disaster hits investor (t-1) × Susty_VW_HQ(t-1)
0.03 (1.28)
0.09*** (6.23)
0.03*** (4.83)
Disaster hits investor (t-2) -0.23**
(-2.04) -0.02
(-0.18) -0.16*** (-3.47)
Susty_VW_HQ(t-2) -0.01
(-0.86) 0.01* (1.69)
0.01*** (3.11)
Disaster hits investor (t-2) × Susty_VW_HQ(t-2)
0.04** (2.18)
0.01 (0.38)
0.03*** (3.95)
Stocks -0.00
(-0.19) -0.00
(-1.00) -0.00
(-1.46) Industries<=2 0.18
(1.60) -0.19
(-1.51) -0.06* (-1.68)
Investor fixed effects Yes Yes Yes Institution type × Year-quarter fixed effects
Yes Yes Yes
Headquarters x Year-quarter fixed effects
Yes Yes Yes
R-squared 0.869 0.809 0.855 Observations 62372 62397 62399
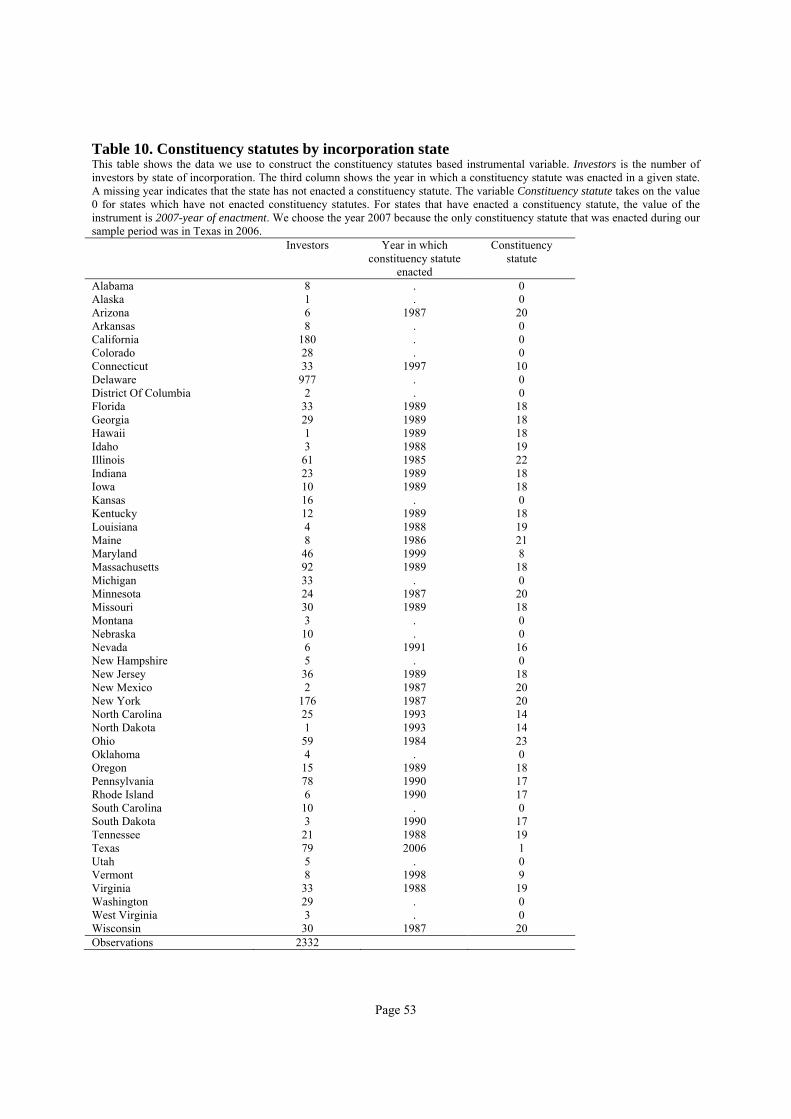
Page 53
Table 10. Constituency statutes by incorporation state This table shows the data we use to construct the constituency statutes based instrumental variable. Investors is the number of investors by state of incorporation. The third column shows the year in which a constituency statute was enacted in a given state. A missing year indicates that the state has not enacted a constituency statute. The variable Constituency statute takes on the value 0 for states which have not enacted constituency statutes. For states that have enacted a constituency statute, the value of the instrument is 2007-year of enactment. We choose the year 2007 because the only constituency statute that was enacted during our sample period was in Texas in 2006. Investors Year in which
constituency statute enacted
Constituency statute
Alabama 8 . 0 Alaska 1 . 0 Arizona 6 1987 20 Arkansas 8 . 0 California 180 . 0 Colorado 28 . 0 Connecticut 33 1997 10 Delaware 977 . 0 District Of Columbia 2 . 0 Florida 33 1989 18 Georgia 29 1989 18 Hawaii 1 1989 18 Idaho 3 1988 19 Illinois 61 1985 22 Indiana 23 1989 18 Iowa 10 1989 18 Kansas 16 . 0 Kentucky 12 1989 18 Louisiana 4 1988 19 Maine 8 1986 21 Maryland 46 1999 8 Massachusetts 92 1989 18 Michigan 33 . 0 Minnesota 24 1987 20 Missouri 30 1989 18 Montana 3 . 0 Nebraska 10 . 0 Nevada 6 1991 16 New Hampshire 5 . 0 New Jersey 36 1989 18 New Mexico 2 1987 20 New York 176 1987 20 North Carolina 25 1993 14 North Dakota 1 1993 14 Ohio 59 1984 23 Oklahoma 4 . 0 Oregon 15 1989 18 Pennsylvania 78 1990 17 Rhode Island 6 1990 17 South Carolina 10 . 0 South Dakota 3 1990 17 Tennessee 21 1988 19 Texas 79 2006 1 Utah 5 . 0 Vermont 8 1998 9 Virginia 33 1988 19 Washington 29 . 0 West Virginia 3 . 0 Wisconsin 30 1987 20 Observations 2332
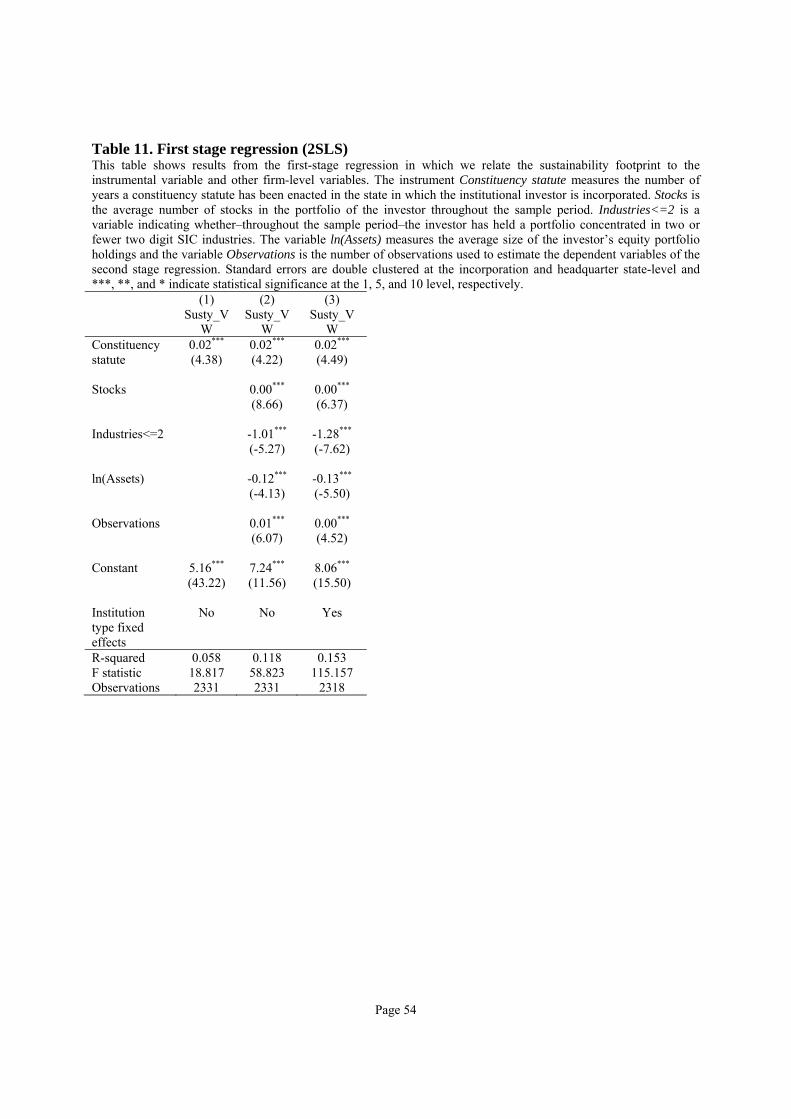
Page 54
Table 11. First stage regression (2SLS) This table shows results from the first-stage regression in which we relate the sustainability footprint to the instrumental variable and other firm-level variables. The instrument Constituency statute measures the number of years a constituency statute has been enacted in the state in which the institutional investor is incorporated. Stocks is the average number of stocks in the portfolio of the investor throughout the sample period. Industries<=2 is a variable indicating whether–throughout the sample period–the investor has held a portfolio concentrated in two or fewer two digit SIC industries. The variable ln(Assets) measures the average size of the investor’s equity portfolio holdings and the variable Observations is the number of observations used to estimate the dependent variables of the second stage regression. Standard errors are double clustered at the incorporation and headquarter state-level and ***, **, and * indicate statistical significance at the 1, 5, and 10 level, respectively. (1) (2) (3) Susty_V
W Susty_V
W Susty_V
W Constituency statute
0.02*** (4.38)
0.02*** (4.22)
0.02*** (4.49)
Stocks
0.00*** (8.66)
0.00*** (6.37)
Industries<=2
-1.01*** (-5.27)
-1.28*** (-7.62)
ln(Assets)
-0.12*** (-4.13)
-0.13*** (-5.50)
Observations
0.01*** (6.07)
0.00*** (4.52)
Constant 5.16***
(43.22) 7.24*** (11.56)
8.06*** (15.50)
Institution type fixed effects
No No Yes
R-squared 0.058 0.118 0.153 F statistic 18.817 58.823 115.157 Observations 2331 2331 2318
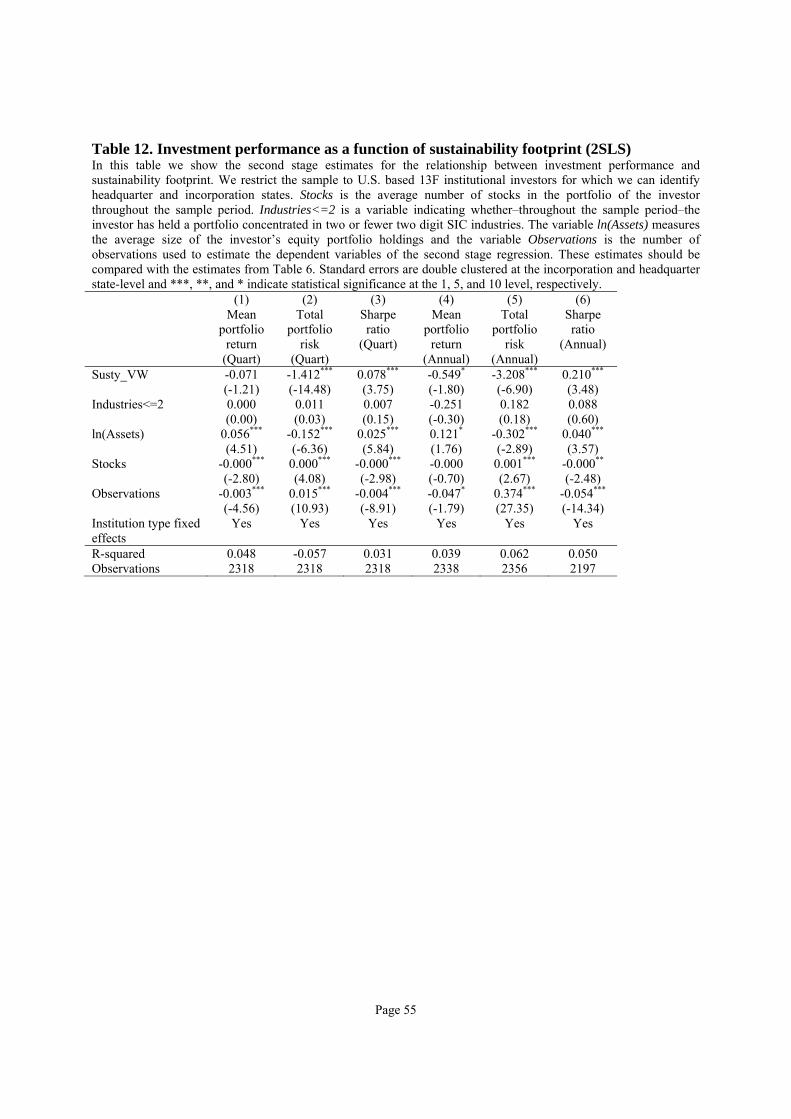
Page 55
Table 12. Investment performance as a function of sustainability footprint (2SLS) In this table we show the second stage estimates for the relationship between investment performance and sustainability footprint. We restrict the sample to U.S. based 13F institutional investors for which we can identify headquarter and incorporation states. Stocks is the average number of stocks in the portfolio of the investor throughout the sample period. Industries<=2 is a variable indicating whether–throughout the sample period–the investor has held a portfolio concentrated in two or fewer two digit SIC industries. The variable ln(Assets) measures the average size of the investor’s equity portfolio holdings and the variable Observations is the number of observations used to estimate the dependent variables of the second stage regression. These estimates should be compared with the estimates from Table 6. Standard errors are double clustered at the incorporation and headquarter state-level and ***, **, and * indicate statistical significance at the 1, 5, and 10 level, respectively. (1) (2) (3) (4) (5) (6) Mean
portfolio return
(Quart)
Total portfolio
risk (Quart)
Sharpe ratio
(Quart)
Mean portfolio
return (Annual)
Total portfolio
risk (Annual)
Sharpe ratio
(Annual)
Susty_VW -0.071 (-1.21)
-1.412***
(-14.48) 0.078*** (3.75)
-0.549* (-1.80)
-3.208***
(-6.90) 0.210*** (3.48)
Industries<=2 0.000 (0.00)
0.011 (0.03)
0.007 (0.15)
-0.251 (-0.30)
0.182 (0.18)
0.088 (0.60)
ln(Assets) 0.056*** (4.51)
-0.152***
(-6.36) 0.025*** (5.84)
0.121* (1.76)
-0.302***
(-2.89) 0.040*** (3.57)
Stocks -0.000*** (-2.80)
0.000*** (4.08)
-0.000***
(-2.98) -0.000 (-0.70)
0.001*** (2.67)
-0.000** (-2.48)
Observations -0.003*** (-4.56)
0.015*** (10.93)
-0.004***
(-8.91) -0.047* (-1.79)
0.374*** (27.35)
-0.054*** (-14.34)
Institution type fixed effects
Yes Yes Yes Yes Yes Yes
R-squared 0.048 -0.057 0.031 0.039 0.062 0.050 Observations 2318 2318 2318 2338 2356 2197
Page 56
References Abarbanell, Jeffery S., Brian J. Bushee, and Jana Smith Raedy, 2003, Institutional investor preferences and price pressure: The case of corporate spin‐offs, The Journal of Business 76, no. 2: 233-261.
Albuquerque, R. A., Durnev, A., and Koskinen, Yrjo, 2016, Corporate social responsibility and firm risk: Theory and empirical evidence, Working paper.
Amel-Zadeh, A., and Serafeim, George, 2017, Why and How Investors Use ESG Information: Evidence from a Global Survey, Working paper Harvard Business School.
Barber, B. M., Morse, A., and Yasuda, A., 2017, Impact investing, Working Paper
Barrot, J. N., and Sauvagnat, J., 2016, Input specificity and the propagation of idiosyncratic shocks in production networks, The Quarterly Journal of Economics, 131(3), 1543-1592.
Bénabou, Roland, and Jean Tirole, 2010, Individual and corporate social responsibility, Economica 77, no. 305: 1-19.
Ben-David, Itzhak, Francesco Franzoni, and Rabih Moussawi, 2012, Hedge fund stock trading in the financial crisis of 2007–2009, Review of Financial Studies 25, no. 1: 1-54
Bennett, J. A., Sias, R. W., and Starks, L. T., 2003, Greener pastures and the impact of dynamic institutional preferences, Review of Financial Studies, 16(4), 1203-1238.
Brunnermeier, Markus, and Stefan Nagel, 2004, Hedge funds and the technology bubble, The Journal of Finance 59, no. 5, 2013-2040.
Bushee, Brian J, 1998, The influence of institutional investors on myopic R&D investment behavior, Accounting Review: 305-333.
Bushee, Brian J., 2001, Do institutional investors prefer near‐term earnings over long‐run value?, Contemporary Accounting Research 18, no. 2, 207-246.
Carhart, M. M., 1997, On persistence in mutual fund performance, The Journal of finance, 52(1), 57-82.
Cella, Cristina, Andrew Ellul, and Mariassunta Giannetti, 2013, Investors' horizons and the amplification of market shocks, Review of Financial Studies 26, no. 7, 1607-1648.
Chen, T., Dong, H., and Lin, C, 2017, Institutional Shareholders and Corporate Social Responsibility: Evidence from Two Quasi-Natural Experiments, Working paper.
Chen, Xia, Jarrad Harford, and Kai Li, 2007, Monitoring: Which institutions matter? Journal of Financial Economics 86, no. 2, 279-305.
Chen, Hsiu-Lang, Narasimhan Jegadeesh, and Russ Wermers, 2000, The value of active mutual fund management: An examination of the stockholdings and trades of fund managers, Journal of Financial and Quantitative Analysis 35.03, 343-368.
Cheng, Ing-Haw, Harrison Hong, and Kelly Shue, 2016, Do Managers Do Good with Other People's Money?, Working paper.
Cronqvist, Henrik, and Frank Yu, 2017, Shaped by their daughters: Executives, female socialization, and corporate social responsibility, Journal of Financial Economics, forthcoming.
Page 57
De Bettignies, J. E., and Robinson, D. T., 2015, When Is Social Responsibility Socially Desirable?, Working paper No. w21364, National Bureau of Economic Research.
Del Guercio, D., 1996, The distorting effect of the prudent-man laws on institutional equity investments, Journal of Financial Economics, 40(1), 31-62.
Demski, C., Capstick, S., Pidgeon, N., Sposato, R. G., and Spence, A., 2017, Experience of extreme weather affects climate change mitigation and adaptation responses, Climatic Change, 140(2), 149-164.
Deng, X., Kang, J.-k., Sin Low, B., 2013, Corporate social responsibility and stakeholder value maximization: Evidence from mergers, Journal of Financial Economics 110 (1), 87–109.
Derrien, François, Ambrus Kecskés, and David Thesmar, 2013, Investor horizons and corporate policies, Journal of Financial and Quantitative Analysis 48, no. 06, 1755-1780.
Dessaint, O., and Matray, A., 2017, Do managers overreact to salient risks? Evidence from hurricane strikes, forthcoming Journal of Financial Economics.
Di Giuli, A., Kostovetsky, L., 2014, Are red or blue companies more likely to go green? Politics and corporate social responsibility, Journal of Financial Economics 111 (1), 158–180.
Dimson, Elroy, Oğuzhan Karakaş, and Xi Li, 2015, Active ownership, Review of Financial Studies 28, no. 12, 3225-3268.
Dyck, I. J., Karl V. Lins, Lukas Roth, and Hannes F. Wagner, 2016, Do Institutional Investors Drive Corporate Social Responsibility? International Evidence, Rotman School of Management Working Paper.
Eccles, Robert G., Ioannis Ioannou, and George Serafeim, 2014, The impact of corporate sustainability on organizational processes and performance, Management Science 60.11 (2014): 2835-2857.
Edmans, A., 2011, Does the stock market fully value intangibles? Employee satisfaction and equity prices, Journal of Financial Economics, 101(3), 621-640.
El Ghoul, S., Guedhami, O., Kwok, C. C., and Mishra, D. R., 2011, Does corporate social responsibility affect the cost of capital?, Journal of Banking and Finance, 35(9), 2388-2406.
Fernando, Chitru S., Mark Sharfman, and Vahap Bülent Uysal, 2016, Corporate Environmental Policy and Shareholder Value: Following the Smart Money. Working paper
Ferrell, A., Liang, H., and Renneboog, L., 2016, Socially responsible firms, Journal of Financial Economics, 122(3), 585-606.
Flammer, Caroline, 2015, Does corporate social responsibility lead to superior financial performance? A regression discontinuity approach, Management Science 61, no. 11, 2549-2568.
Flammer, C., and Kacperczyk, A., 2016, The impact of stakeholder orientation on innovation: Evidence from a natural experiment, Management Science, 62(7), 1982-2001.
Froot, K. A., Perold, A. F., and Stein, J. C., 1992, Shareholder Trading Practices And Corporate Investment Horizons, Journal of Applied Corporate Finance, 5(2), 42-58.
Gaspar, José-Miguel, Massimo Massa, and Pedro Matos, 2005, Shareholder investment horizons and the market for corporate control, Journal of Financial Economics 76, no. 1, 135-165.
Page 58
Geczy, C., Stambaugh, R. F., and Levin, D., 2005, Investing in socially responsible mutual funds, Working Paper Wharton School.
Geczy C., Jeffers, S. Jessica, Musto, David K. and Anne M. Tucker, 2015, Institutional Investing When Shareholders Are Not Supreme, 5 Harvard Business Law Review. 73, 130–31
Gillan, Stuart L., and Laura T. Starks, 2000, Corporate governance proposals and shareholder activism: The role of institutional investors, Journal of Financial Economics 57, no. 2, 275-305.
Gompers, Paul, and Andrew Metrick, 2001, Institutional investors and equity prices, Quarterly Journal of Economics 116, 229-259.
Hamilton, S., Jo, H., Statman, M., 1993, Doing well while doing good? The investment performance of socially responsible mutual funds, Financial Analysts Journal 49, 62–66.
Harford, J., Kecskes, A., and Mansi, S., 2017, Do long-term investors improve corporate decision making?. Working paper.
Hartzell, Jay C., and Laura T. Starks, 2003, Institutional investors and executive compensation. The journal of finance 58, no. 6, 2351-2374.
Hoepner, A. G., Oikonomou, I., Sautner, Z., Starks, L. T., and Zhou, X, 2016, ESG Shareholder Engagement and Downside Risk, Working paper.
Hong, H., Kacperczyk, M., 2009, The price of sin: The effects of social norms on markets, Journal of Financial Economics 93 (1), 15–36.
Hong, H., and Kostovetsky, L., 2012, Red and blue investing: Values and finance, Journal of Financial Economics, 103(1), 1-19.
Hong, H. G., Kubik, J. K., Scheinkman, J. A., 2012, Financial constraints on corporate goodness, Unpublished working paper, Princeton University and Syracuse University.
Kacperczyk, M., Sialm, C., and Zheng, L, 2008, Unobserved actions of mutual funds, Review of Financial Studies, 21(6), 2379-2416.
Kecskes, A., Mansi, S., and Nguyen, P. A. (2016), Does Corporate Social Responsibility Create Shareholder Value? The Importance of Long-Term Investors, Working paper.
Krüger, Philipp, 2015, Corporate goodness and shareholder wealth, Journal of Financial Economics 115, no. 2, 304-329.
La Porta Rafael, Florencio Lopez da Silanes, Andrei Shleifer, and Robert Vishny, 1998, Law and finance, Journal of Political Economy 106, no 6, 1113-1155.
Liang, H. and L. Renneboog, 2017, On the foundations of corporate social responsibility, Forthcoming Journal of Finance.
Lins, Karl V., Henri Servaes, and Ane Tamayo, 2017, Social Capital, Trust, and Firm Performance: The Value of Corporate Social Responsibility during the Financial Crisis, Forthcoming Journal of Finance.
Lo, Andrew W., 2002, The statistics of Sharpe ratios, Financial analysts journal: 36-52. Masulis, Ronald W., and Syed Walid Reza, 2014, Agency problems of corporate philanthropy. Review of Financial Studies
Malmendier, U., and Nagel, S., 2011, Depression babies: do macroeconomic experiences affect risk taking?, The Quarterly Journal of Economics, 126(1), 373-416.
Page 59
McCahery, Joseph A., Zacharias Sautner, and Laura T. Starks, 2016, Behind the scenes: The corporate governance preferences of institutional investors, forthcoming The Journal of Finance.
McConnell, John J., and Henri Servaes, 1990, Additional evidence on equity ownership and corporate value, Journal of Financial Economics 27, no. 2 : 595-612.
Nofsinger, John R., Johan Sulaeman, and Abhishek Varma, 2016, Institutional Investors and Controversial Investments, Working paper
Renneboog, L., Ter Horst, J., Zhang, C., 2008, Socially responsible investments: institutional aspects, performance, and investor behavior, Journal of Banking and Finance 32 (9), 1723–1742.
Servaes, H., and Tamayo, A., 2013, The impact of corporate social responsibility on firm value: The role of customer awareness, Management Science, 59(5), 1045-1061.
Statman, M., Glushkov, D., 2009, The wages of social responsibility, Financial Analysts Journal 65 (4), 774–800.
Tversky, Amos and Kahneman, Daniel, 1974, Judgment under uncertainty: Heuristics and biases, Science 185(4157):1124–1131
USSIF, 2016, Report on U.S. Sustainable, Responsible and Impact Investing Trends 2016.
Wermers, Russ, 2000, Mutual fund performance: An empirical decomposition into stock‐picking talent, style, transactions costs, and expenses, The Journal of Finance 55, no. 4: 1655-1703.
Yan, Xuemin Sterling, and Zhe Zhang, 2009, Institutional investors and equity returns: Are short-term institutions better informed?, Review of Financial Studies 22, no. 2: 893-924.


![WEBINAR: Your Meeting's Footprint [ New Sustainability Perspective]](https://img.pdfslide.net/doc/110x75/55a696d71a28ab7c2d8b465f/webinar-your-meetings-footprint-new-sustainability-perspective.jpg)