Embed Size (px)
Citation preview

The Swiss Glaciers
2009/10 and 2010/11
Glaciological Report (Glacier) No. 131/132
2015

The Swiss Glaciers
2009/2010 and 2010/2011
Glaciological Report No. 131/132
Edited by
Andreas Bauder1
With contributions from
Andreas Bauder1, Mauro Fischer2, Martin Funk1,
Matthias Huss1,2, Giovanni Kappenberger3
1 Laboratory of Hydraulics, Hydrology and Glaciology (VAW), ETH Zurich
2 Department of Geosciences, University of Fribourg
3 6654 Cavigliano
2015

Publication of the Cryospheric Commission (EKK) of the Swiss Academy of Sciences (SCNAT)
c/o Laboratory of Hydraulics, Hydrology and Glaciology (VAW)
at the Swiss Federal Institute of Technology Zurich (ETH Zurich)
Wolfgang-Pauli-Strasse 27, CH-8093 Zurich, Switzerland
http://glaciology.ethz.ch/swiss-glaciers/
c© Cryospheric Commission (EKK) 2015
ISSN 1424-2222
Imprint of author contributions:
Andreas Bauder : Chapt. 1, 2, 3, 4, 5, App. A, B, C
Mauro Fischer : Chapt. 6
Martin Funk : Chapt. 1, 4
Matthias Huss : Chapt. 2, 4, 6
Giovanni Kappenberger : Chapt. 4
Ebnoether Joos AG
print and publishing
Sihltalstrasse 82
Postfach 134
CH-8135 Langnau am Albis
Switzerland
Cover Page: Riedgletscher (Peter Rovina, 31.8.2010)

Summary
During the 131th and 132th year under review by the Cryospheric Commission, Swiss glaciers
continued to lose both length and mass. Both periods were characterized by small amounts of
snow accumulation during winter and moderate melt rates in summer. The results presented in
this report reflect the weather conditions in the measurement periods as well as the impacts of
ongoing atmospheric warming over the past decades.
In autumn 2010, a length variation was determined for 95 of the 114 glaciers currently under active
observation, while one year later such a result was obtained for 98 glaciers. In the two observation
periods, 2009/10 and 2010/11, Swiss glaciers experienced further losses in length. Most of the
measurement values vary between 0 and -30 m in both of these periods. Several glaciers displayed
extraordinarily high retreat values in a single year in one of these two measurement periods. These
can be attributed either to the separation of a protruding mass of dead ice, or to the melting of
sections of the glacier that had constantly been growing thinner over a number of years.
Detailed mass balance figures were obtained for these eight glaciers: Basodino, Findelen, Gries,
Pizol, Plaine Morte, Rhone, Silvretta and Tsanfleuron, and point measurements were taken at
several additional glaciers. The glaciers experienced significant mass losses especially in the second
period, which ranks as about the fifth most negative in the long-term statistics.
Flow measurements were taken at selected glaciers in the Mauvoisin and Mattmark regions. The
trend continued toward diminishing velocities, a clear reflection of the reduction in ice thickness
due to lasting negative mass balances of the glaciers.
As a consequence of rapid changes over the last decade, an update of the inventory with surface
area and additional parameters has been analyzed based on aerial orthophotographs acquired by
swisstopo between 2008 and 2011. Selected results with a focus on the glaciers observed as part
of the Swiss monitoring programme are presented.
iii

Published Reports
Annual reports of the Swiss glaciers started in the year of 1880 by F.A. Forel (1841-1912).
Authors of the annual reports: No. Year
F.A. Forel et L. Du Pasquier 1 - 17 1880 - 1896
F.A. Forel, M. Lugeon et E. Muret 18 - 27 1897 - 1906
F.A. Forel, E. Muret, P.L. Mercanton et E. Ar-
gand
28 1907
F.A. Forel, E. Muret et P.L. Mercanton 29 - 32 1908 - 1911
E. Muret et P.L. Mercanton 33 - 34 1912 - 1913
P.L. Mercanton 35 - 70 1914 - 1949
P.L. Mercanton et A. Renaud 71 - 75 1950 - 1954
A. Renaud 76 - 83 1955 - 1961/62
P. Kasser 84 - 91 1962/63 - 1969/70
P. Kasser und M. Aellen 92 - 104 1970/71 - 1982/83
M. Aellen 105 - 115 1983/84 - 1993/94
M. Aellen, M. Hoelzle und D. Vonder Muhll 116 1994/95
M. Hoelzle und D. Vonder Muhll 117 1995/96
M. Hoelzle, D. Vonder Muhll, A. Bauder und
G.H. Gudmundsson
118 1996/97
M. Hoelzle, D. Vonder Muhll und M. Maisch 119 1997/98
M. Hoelzle, D. Vonder Muhll, M. Schwikowski
und H.W. Gaggeler
120 1998/99
A. Bauder, A. Vieli und M. Hoelzle 121 1999/00
A. Bauder und M. Hoelzle 122 2000/01
A. Bauder, C. Schar und H. Blatter 123 - 124 2001/02 - 2002/03
A. Bauder, J. Faillettaz, M. Funk und A. Pralong 125 - 126 2003/04 - 2004/05
A. Bauder 127 - 132 2005/06 - 2010/11
Authors and editors of the glaciological two year reports:
P. Kasser, M. Aellen und H. Siegenthaler 95/96 - 99/100 1973/74 - 1978/79
M. Aellen 101/102 1979/80 - 1980/81
M. Aellen und E. Herren 103/104 - 111/112 1981/82 - 1990/91
E. Herren und M. Hoelzle 113/114 1991/92 - 1992/93
E. Herren, M. Hoelzle and M. Maisch 115/116 - 119/120 1993/94 - 1998/99
E. Herren, A. Bauder, M. Hoelzle and M. Maisch 121/122 1999/00 - 2000/01
E. Herren and A. Bauder 123/124 2001/02 - 2002/03
A. Bauder and R. Ruegg 125/126 2003/04 - 2004/05
A. Bauder and C. Ryser 127/128 2005/06 - 2006/07
A. Bauder, S. Steffen and S. Usselmann 129/130 2007/08 - 2010/11
iv
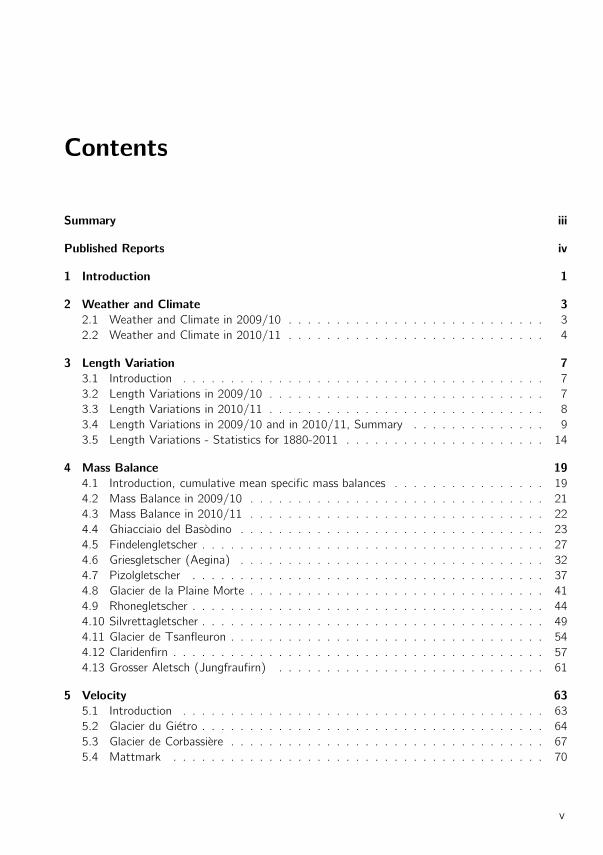
Contents
Summary iii
Published Reports iv
1 Introduction 1
2 Weather and Climate 3
2.1 Weather and Climate in 2009/10 . . . . . . . . . . . . . . . . . . . . . . . . . . . 3
2.2 Weather and Climate in 2010/11 . . . . . . . . . . . . . . . . . . . . . . . . . . . 4
3 Length Variation 7
3.1 Introduction . . . . . . . . . . . . . . . . . . . . . . . . . . . . . . . . . . . . . . 7
3.2 Length Variations in 2009/10 . . . . . . . . . . . . . . . . . . . . . . . . . . . . . 7
3.3 Length Variations in 2010/11 . . . . . . . . . . . . . . . . . . . . . . . . . . . . . 8
3.4 Length Variations in 2009/10 and in 2010/11, Summary . . . . . . . . . . . . . . 9
3.5 Length Variations - Statistics for 1880-2011 . . . . . . . . . . . . . . . . . . . . . 14
4 Mass Balance 19
4.1 Introduction, cumulative mean specific mass balances . . . . . . . . . . . . . . . . 19
4.2 Mass Balance in 2009/10 . . . . . . . . . . . . . . . . . . . . . . . . . . . . . . . 21
4.3 Mass Balance in 2010/11 . . . . . . . . . . . . . . . . . . . . . . . . . . . . . . . 22
4.4 Ghiacciaio del Basodino . . . . . . . . . . . . . . . . . . . . . . . . . . . . . . . . 23
4.5 Findelengletscher . . . . . . . . . . . . . . . . . . . . . . . . . . . . . . . . . . . . 27
4.6 Griesgletscher (Aegina) . . . . . . . . . . . . . . . . . . . . . . . . . . . . . . . . 32
4.7 Pizolgletscher . . . . . . . . . . . . . . . . . . . . . . . . . . . . . . . . . . . . . 37
4.8 Glacier de la Plaine Morte . . . . . . . . . . . . . . . . . . . . . . . . . . . . . . . 41
4.9 Rhonegletscher . . . . . . . . . . . . . . . . . . . . . . . . . . . . . . . . . . . . . 44
4.10 Silvrettagletscher . . . . . . . . . . . . . . . . . . . . . . . . . . . . . . . . . . . . 49
4.11 Glacier de Tsanfleuron . . . . . . . . . . . . . . . . . . . . . . . . . . . . . . . . . 54
4.12 Claridenfirn . . . . . . . . . . . . . . . . . . . . . . . . . . . . . . . . . . . . . . . 57
4.13 Grosser Aletsch (Jungfraufirn) . . . . . . . . . . . . . . . . . . . . . . . . . . . . 61
5 Velocity 63
5.1 Introduction . . . . . . . . . . . . . . . . . . . . . . . . . . . . . . . . . . . . . . 63
5.2 Glacier du Gietro . . . . . . . . . . . . . . . . . . . . . . . . . . . . . . . . . . . . 64
5.3 Glacier de Corbassiere . . . . . . . . . . . . . . . . . . . . . . . . . . . . . . . . . 67
5.4 Mattmark . . . . . . . . . . . . . . . . . . . . . . . . . . . . . . . . . . . . . . . 70
v

6 The Swiss Glacier Inventory SGI2010 73
6.1 Background . . . . . . . . . . . . . . . . . . . . . . . . . . . . . . . . . . . . . . 73
6.2 Previous glacier inventories . . . . . . . . . . . . . . . . . . . . . . . . . . . . . . 73
6.3 Mapping glacier outlines for the SGI2010 . . . . . . . . . . . . . . . . . . . . . . . 74
6.4 The new SGI2010 data set . . . . . . . . . . . . . . . . . . . . . . . . . . . . . . 74
6.5 Observed changes in area and number 1973-2010 . . . . . . . . . . . . . . . . . . 74
References 81
Acknowledgements 84
A Remote Sensing 85
A.1 Aerial photographs . . . . . . . . . . . . . . . . . . . . . . . . . . . . . . . . . . . 85
B Remarks on Individual Glaciers 88
C Investigators 110
C.1 Length Variation (2011) . . . . . . . . . . . . . . . . . . . . . . . . . . . . . . . . 110
C.2 Mass Balance and Velocity . . . . . . . . . . . . . . . . . . . . . . . . . . . . . . 113
vi
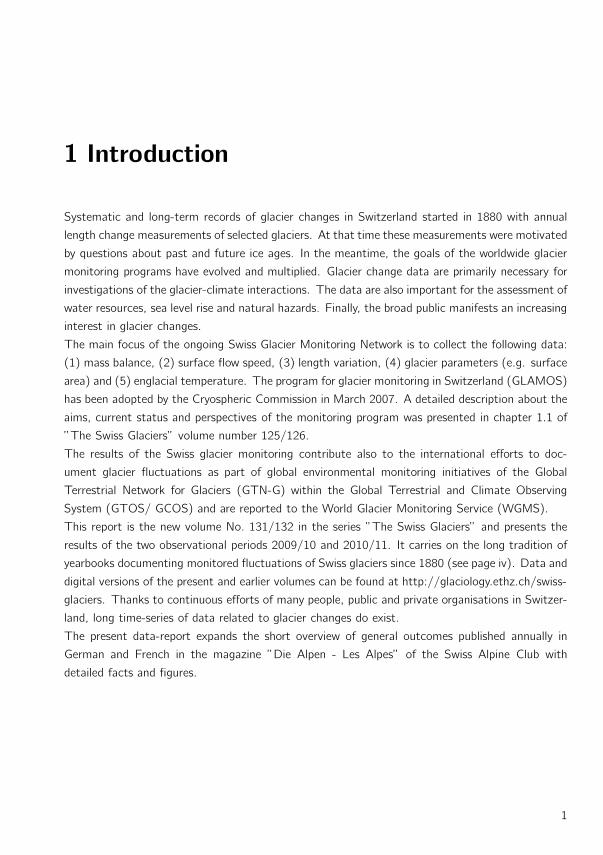
1 Introduction
Systematic and long-term records of glacier changes in Switzerland started in 1880 with annual
length change measurements of selected glaciers. At that time these measurements were motivated
by questions about past and future ice ages. In the meantime, the goals of the worldwide glacier
monitoring programs have evolved and multiplied. Glacier change data are primarily necessary for
investigations of the glacier-climate interactions. The data are also important for the assessment of
water resources, sea level rise and natural hazards. Finally, the broad public manifests an increasing
interest in glacier changes.
The main focus of the ongoing Swiss Glacier Monitoring Network is to collect the following data:
(1) mass balance, (2) surface flow speed, (3) length variation, (4) glacier parameters (e.g. surface
area) and (5) englacial temperature. The program for glacier monitoring in Switzerland (GLAMOS)
has been adopted by the Cryospheric Commission in March 2007. A detailed description about the
aims, current status and perspectives of the monitoring program was presented in chapter 1.1 of
”The Swiss Glaciers” volume number 125/126.
The results of the Swiss glacier monitoring contribute also to the international efforts to doc-
ument glacier fluctuations as part of global environmental monitoring initiatives of the Global
Terrestrial Network for Glaciers (GTN-G) within the Global Terrestrial and Climate Observing
System (GTOS/ GCOS) and are reported to the World Glacier Monitoring Service (WGMS).
This report is the new volume No. 131/132 in the series ”The Swiss Glaciers” and presents the
results of the two observational periods 2009/10 and 2010/11. It carries on the long tradition of
yearbooks documenting monitored fluctuations of Swiss glaciers since 1880 (see page iv). Data and
digital versions of the present and earlier volumes can be found at http://glaciology.ethz.ch/swiss-
glaciers. Thanks to continuous efforts of many people, public and private organisations in Switzer-
land, long time-series of data related to glacier changes do exist.
The present data-report expands the short overview of general outcomes published annually in
German and French in the magazine ”Die Alpen - Les Alpes” of the Swiss Alpine Club with
detailed facts and figures.
1


2 Weather and Climate
In this section the weather and climate conditions for the two periods under review 2009/10 and
2010/11 are described. The focus is on the variables that are most relevant for glacier mass bal-
ance, namely temperature and precipitation. In general, glacier mass balance is largely determined
by the amount of snow fall in winter and the temperature during summer. Additionally, particular
climate conditions can have an important influence. High temperatures in April, May or June
can reduce the winter snow pack rapidly and expose the much darker ice surface already in July.
During July and August solar radiation receipts are very high and melting of the unprotected ice
can reach extreme values. When these two factors are combined very negative mass balances like
in the period 2002/03 are expected. On the other hand, snow fall down to low elevations (2000
m) during summer protects the glacier surface from melting and will lead to less negative mass
balances. Precipitation that falls as rain influences the mass balance negatively.
We have selected the four high-elevation climate stations at Grand St-Bernard (2472 m), Jungfrau-
joch (3580 m), Santis (2502 m) and Weissfluhjoch (2690 m) to illustrate the monthly anomalies
in air temperature (Figure 2.1) and 15 stations (Airolo, Chateau-d’Oex, Disentis, Engelberg, Elm,
Grand St-Bernard, Grimsel Hospiz, Montana, Lauterbrunnen, Santis, Scuol, Sils-Maria, Weiss-
fluhjoch, Zermatt) throughout all regions of the Swiss Alps for monthly anomalies in precipitation
(Figure 2.2) in the two reporting periods. For the two parameters of annual precipitation and
mean summer temperature, the long-term record since 1880 is shown in Figures 2.3 and 2.4 as a
mean of 12 homogenized climate stations (Begert et al., 2005). The description of the weather
conditions in the two reporting periods refer to the figures and the annual and monthly reports
of the meteorological conditions by MeteoSwiss. Data are taken from different stations of the
observational networks maintained by MeteoSwiss.
2.1 Weather and Climate in 2009/10
The first burst of winter weather occurred in mid-October with snow falling at elevations up to 1000
m. Due to further snowfalls, as early as mid-November a snow cover of at least 50 cm thickness lay
at elevations over 2000 m, a critical location for glaciers. This generally does not occur before the
end of November. Cold temperatures and on the whole low precipitation amounts characterized
the further course of the winter. Only Engadine and the southern valleys of the Grisons profited
in the form of above-average snow amounts from the repeated advection situations. There were
no abundant snowfalls at distinctive northwest-oriented slopes. For this reason, at the end of
3

The Swiss Glaciers 2009/10 and 2010/11
Oct Nov Dec Jan Feb Mar Apr May Jun Jul Aug Sep-6
-4
-2
0
2
4
6
Tem
per
atur
e an
omal
y (d
eg C
)
2009/102010/11
Figure 2.1: Mean monthly anomaly of temperature from the long-term climatic mean
(period 1961-1990) for four selected stations of the MeteoSwiss network.
Anomalies in the two reporting periods 2009/10 and 2010/11 are shown.
April snow depths proved to be slightly above average in Upper Engadine and the southern Grison
valleys only, slightly below average on the remaining southern slopes of the Alps, and clearly below
average on the north side of the Alps, as compared to the long-term average. In May a minor
improvement in the situation was brought about by further advection from the south bringing large
amounts of snow to the southern side of the Alps and the main alpine ridge. In addition, the
cool and dull meteorological conditions contributed somewhat to a delay in the melt-out of the
glaciers. During a heat wave in the first half of July, the zero degree line rose over a span of several
days well above 4000 m, resulting in the sixth-hottest July on record since measurements began
in 1864. Conditions were variable for the rest of the summer and autumn. In spite of many bursts
of cold weather, the summer of 2010 clearly remained one with above-average warm temperatures
(Figures 2.1 and 2.2).
Summertime temperatures were 0.9◦C higher than the long-term mean (Figure 2.4). Positive devi-
ations of approx. one degree have been common since the 1990s. On the other hand, precipitation
amounts generally corresponded to the long term mean (Figure 2.3). On the whole it was the lack
of precipitation in winter rather than the heat surplus in summer that had an unfavorable effect on
the glacier mass balance. Since this surplus usually came in the form of liquid precipitation even
at higher elevations, it did not lead to any significant accumulation and succeeded only in slowing
down the melt rate to a minor extent.
2.2 Weather and Climate in 2010/11
As a result of an episode of winter conditions at the end of September, a closed snow cover formed
relatively early in the season above 2000 m. Following further snowfalls at the end of November
and in December, snow depths just slightly above average were recorded in almost the entire Swiss
4

2. Weather and Climate
Oct Nov Dec Jan Feb Mar Apr May Jun Jul Aug Sep-100
-50
0
50
100
Per
cip
itatio
n an
omal
y (%
)
2009/102010/11
Figure 2.2: Mean monthly anomaly of precipitation from the long-term climatic mean
(period 1961-1990) for 15 selected stations of the MeteoSwiss network.
Anomalies in the two reporting periods 2009/10 and 2010/11 are shown.
alpine region. All months from January to the end of April had low precipitation amounts and warm
to very warm temperatures (Figures 2.1 and 2.2). Overall, below-average amounts of snow lay on
the ground and there were no late episodes of a sudden burst of winter weather. The warm and
dry weather continued into May, while snowfalls at high elevations in early June were able to some
extent to slow down the rapid melting. The warmest spring since measurements began in 1864
was followed by a summer marked by variability and repeated cold air intrusions. The extensive
period of high pressure at the end of August brought with it a heat wave and abundant sunshine.
These warm and sunny conditions continued into September, resulting in a temperature surplus
between May and September. With a clear precipitation deficit in the second half of winter, and
predominantly variable conditions during the mid-summer months, the second measurement period
very much resembled the first one.
Annual precipitation for 2010/11 was 17% below the long-term mean (Figure 2.3), whereas the
summer temperatures (May to September 2011) were +1.9◦C above average (Figure 2.4).
5

The Swiss Glaciers 2009/10 and 2010/11
1880 1900 1920 1940 1960 1980 2000
−40
−20
0
20
Pre
cip
itatio
n an
omal
ies
(%)
Figure 2.3: Anomalies of annual precipitation (hydrological year) from the mean value
1961-1990 in percentage for the period 1864-2011. The gray shaded area
highlights the years of the current report.
1880 1900 1920 1940 1960 1980 2000 −2
−1
0
1
2
3
Tem
per
atur
e an
omal
ies
(o C
)
Figure 2.4: Anomalies of mean summer air temperature (May-September) from the
mean value 1961-1990 in degrees Celcius for the period 1864-2011. The
gray shaded area highlights the years of the current report.
6
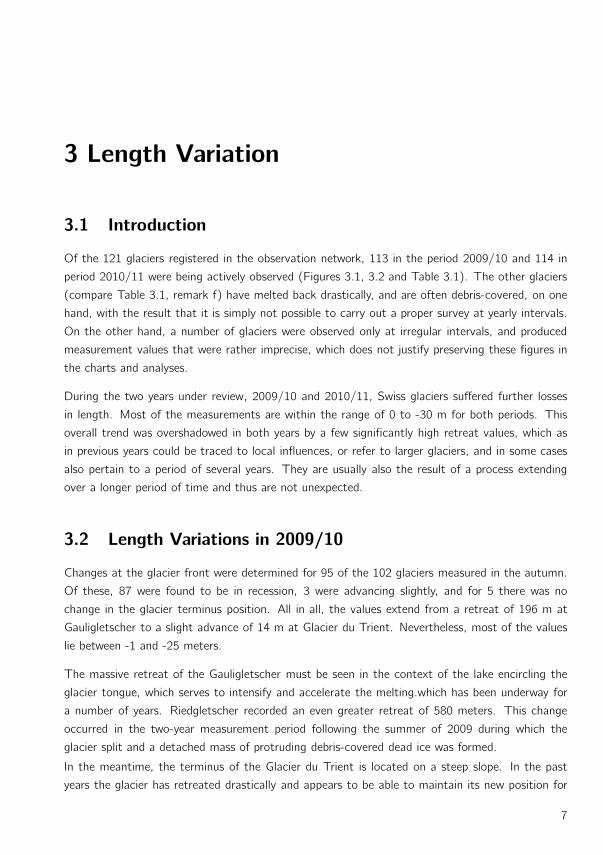
3 Length Variation
3.1 Introduction
Of the 121 glaciers registered in the observation network, 113 in the period 2009/10 and 114 in
period 2010/11 were being actively observed (Figures 3.1, 3.2 and Table 3.1). The other glaciers
(compare Table 3.1, remark f) have melted back drastically, and are often debris-covered, on one
hand, with the result that it is simply not possible to carry out a proper survey at yearly intervals.
On the other hand, a number of glaciers were observed only at irregular intervals, and produced
measurement values that were rather imprecise, which does not justify preserving these figures in
the charts and analyses.
During the two years under review, 2009/10 and 2010/11, Swiss glaciers suffered further losses
in length. Most of the measurements are within the range of 0 to -30 m for both periods. This
overall trend was overshadowed in both years by a few significantly high retreat values, which as
in previous years could be traced to local influences, or refer to larger glaciers, and in some cases
also pertain to a period of several years. They are usually also the result of a process extending
over a longer period of time and thus are not unexpected.
3.2 Length Variations in 2009/10
Changes at the glacier front were determined for 95 of the 102 glaciers measured in the autumn.
Of these, 87 were found to be in recession, 3 were advancing slightly, and for 5 there was no
change in the glacier terminus position. All in all, the values extend from a retreat of 196 m at
Gauligletscher to a slight advance of 14 m at Glacier du Trient. Nevertheless, most of the values
lie between -1 and -25 meters.
The massive retreat of the Gauligletscher must be seen in the context of the lake encircling the
glacier tongue, which serves to intensify and accelerate the melting.which has been underway for
a number of years. Riedgletscher recorded an even greater retreat of 580 meters. This change
occurred in the two-year measurement period following the summer of 2009 during which the
glacier split and a detached mass of protruding debris-covered dead ice was formed.
In the meantime, the terminus of the Glacier du Trient is located on a steep slope. In the past
years the glacier has retreated drastically and appears to be able to maintain its new position for
7

The Swiss Glaciers 2009/10 and 2010/11
the time being. Under these conditions there is a possibility that the glacier tongue will advance
slightly in certain years.
3.3 Length Variations in 2010/11
In the autumn of 2011, length changes were determined for 98 glaciers. Of these, 95 shortened,
two did not change position, and only one glacer had a positive value. The values range from a
retreat of 1300 m at Vadret da Roseg, to an advance at the terminus margin of 23 m at Glacier
du Mont Durand. Approximately three-quarters of the measurement values lie between -1 and -30
meters.
The massive retreat of the Vadret da Roseg stems from a process that has been underway for
decades. The glacier tongue, located in a valley basin, was fed previously by two inflows originating
in the extensive firn area. The transition from firn area to glacier tongue occurs however at a steep
section of terrain. The glacier has been thinning gradually in this area over the past ten years and
as early as the summer of 2007 was no longer connected with the inflow from Piz Sella. In the
summer of 2009 the main inflow also no longer reached as far as the tongue, which favored the
formation of a debris-covered mass of dead ice in the valley basin. This ice mass was nourished then
only by the occasional ice break-off or snow avalanches in winter. For this reason, the terminus of
the active glacier shifted abruptly and substantially.
At the Glacier du Mont Durand, local changes at the glacier terminus, and not an advance due to
abundant ice flow from the firn area, are responsible for the positive measurement values. Because
the glacier is heavily covered with debris, the tongue melts at an very irregular rate. As a result,
a large hollow formed over recent years and a mound of rock can now be seen. Diffusive ice flow
of marginal ice masses most likely led to the advance of the margin in the previous summer.
8
3. Length Variation
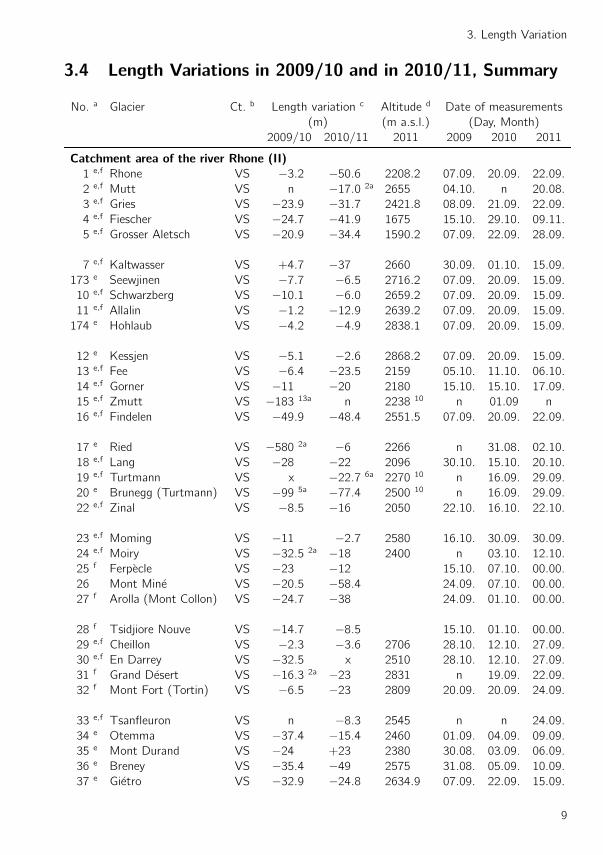
3.4 Length Variations in 2009/10 and in 2010/11, Summary
No. a Glacier Ct. b Length variation c Altitude d Date of measurements
(m) (m a.s.l.) (Day, Month)
2009/10 2010/11 2011 2009 2010 2011
Catchment area of the river Rhone (II)
1 e,f Rhone VS −3.2 −50.6 2208.2 07.09. 20.09. 22.09.
2 e,f Mutt VS n −17.0 2a 2655 04.10. n 20.08.
3 e,f Gries VS −23.9 −31.7 2421.8 08.09. 21.09. 22.09.
4 e,f Fiescher VS −24.7 −41.9 1675 15.10. 29.10. 09.11.
5 e,f Grosser Aletsch VS −20.9 −34.4 1590.2 07.09. 22.09. 28.09.
7 e,f Kaltwasser VS +4.7 −37 2660 30.09. 01.10. 15.09.
173 e Seewjinen VS −7.7 −6.5 2716.2 07.09. 20.09. 15.09.
10 e,f Schwarzberg VS −10.1 −6.0 2659.2 07.09. 20.09. 15.09.
11 e,f Allalin VS −1.2 −12.9 2639.2 07.09. 20.09. 15.09.
174 e Hohlaub VS −4.2 −4.9 2838.1 07.09. 20.09. 15.09.
12 e Kessjen VS −5.1 −2.6 2868.2 07.09. 20.09. 15.09.
13 e,f Fee VS −6.4 −23.5 2159 05.10. 11.10. 06.10.
14 e,f Gorner VS −11 −20 2180 15.10. 15.10. 17.09.
15 e,f Zmutt VS −183 13a n 2238 10 n 01.09 n
16 e,f Findelen VS −49.9 −48.4 2551.5 07.09. 20.09. 22.09.
17 e Ried VS −580 2a −6 2266 n 31.08. 02.10.
18 e,f Lang VS −28 −22 2096 30.10. 15.10. 20.10.
19 e,f Turtmann VS x −22.7 6a 2270 10 n 16.09. 29.09.
20 e Brunegg (Turtmann) VS −99 5a −77.4 2500 10 n 16.09. 29.09.
22 e,f Zinal VS −8.5 −16 2050 22.10. 16.10. 22.10.
23 e,f Moming VS −11 −2.7 2580 16.10. 30.09. 30.09.
24 e,f Moiry VS −32.5 2a −18 2400 n 03.10. 12.10.
25 f Ferpecle VS −23 −12 15.10. 07.10. 00.00.
26 Mont Mine VS −20.5 −58.4 24.09. 07.10. 00.00.
27 f Arolla (Mont Collon) VS −24.7 −38 24.09. 01.10. 00.00.
28 f Tsidjiore Nouve VS −14.7 −8.5 15.10. 01.10. 00.00.
29 e,f Cheillon VS −2.3 −3.6 2706 28.10. 12.10. 27.09.
30 e,f En Darrey VS −32.5 x 2510 28.10. 12.10. 27.09.
31 f Grand Desert VS −16.3 2a −23 2831 n 19.09. 22.09.
32 f Mont Fort (Tortin) VS −6.5 −23 2809 20.09. 20.09. 24.09.
33 e,f Tsanfleuron VS n −8.3 2545 n n 24.09.
34 e Otemma VS −37.4 −15.4 2460 01.09. 04.09. 09.09.
35 e Mont Durand VS −24 +23 2380 30.08. 03.09. 06.09.
36 e Breney VS −35.4 −49 2575 31.08. 05.09. 10.09.
37 e Gietro VS −32.9 −24.8 2634.9 07.09. 22.09. 15.09.
9

The Swiss Glaciers 2009/10 and 2010/11
No. a Glacier Ct. b Length variation c Altitude d Date of measurements
(m) (m a.s.l.) (Day, Month)
2009/10 2010/11 2011 2009 2010 2011
38 e Corbassiere VS −40.2 −64.2 2263.8 07.09. 22.09. 15.09.
39 e,f Valsorey VS −21.4 −17.8 2429.5 04.10. 15.10. 11.08.
40 e Tseudet VS −7.9 −7.2 2483.5 04.10. 15.10. 11.08.
41 e Boveyre VS −18.8 −38.2 2680 09.10. 31.07. 08.09.
42 e,f Saleina VS −25.5 −39.8 1825.3 29.09. 14.10. 18.10.
43 e,f Trient VS +14 0 2075 11.09. 02.10. 01.10.
44 e,f Paneyrosse VD −9.3 −7.7 15.09. 23.09. 14.09.
45 e,f Grand Plan Neve VD −7.9 −8.4 10.09. 23.09. 15.09.
47 e,f Sex Rouge VD n −0.2 2a 10.09. n 05.10.
48 e Prapio VD −9.0 −12.5 2547 09.09. 20.09. 01.10.
Catchment area of the river Aare (Ia)
50 f Oberaar BE n n 2306.9 09 19.08. n n
51 f Unteraar BE n n 1930.3 09 19.08. n n
52 e Gauli BE −196 −135 2130 18.09. 15.09. 06.09.
53 e,f Stein BE −122 −155 1970 22.09. 21.09. 01.10.
54 e Steinlimi BE −51 −28 2100 22.09. 21.09. 01.10.
55 e,f Trift (Gadmen) BE −23.5 −25.2 1655.4 07.09. 20.09. 22.09.
57 e,f Oberer Grindelwald BE x x 1394.0 09 08.09. 23.10. 17.09.
58 e,f Unterer Grindelwald BE x x 1243.4 07.09. 21.09. 28.09.
59 e Eiger BE −8.0 2a −19 2330 10 n 06.10. 15.09.
60 e Tschingel BE −16.2 −21.1 2270 15.09. 14.09. 16.09.
61 f Gamchi BE −15.5 −18.8 2050 03.10. 09.10. 30.09.
109 e Alpetli (Kanderfirn) BE −24.8 −33.1 2280 12.09. 11.09. 10.09.
62 e,f Schwarz VS −2.8 −5.6 2266 23.09. 04.09. 03.09.
63 Lammern VS −12 −20 2550 11.09. 22.09. 10.09.
64 e,f Bluemlisalp BE −15.3 −24.5 2280 16.09. 21.09. 16.09.
111 e Ammerten BE −1.3 −3.5 2350 11.10. 03.10. 03.09.
112 e Dungel BE −2.4 n 2607 10 08.08. 11.09. n
113 e Gelten BE x n 2499 10 09.09. 12.09. n
Catchment area of the river Reuss (Ib)
66 e,f Tiefen UR −16.4 −26.9 2520 10.09. 19.09. 10.09.
67 e,f Sankt Anna UR −13.3 −9.1 2585 26.09. 11.09. 01.10.
68 e,f Kehlen UR −30.7 −28.3 2240 23.09. 20.09. 22.09.
69 e Rotfirn (Nord) UR −24.1 −19.2 2050 23.09. 20.09. 22.09.
70 e,f Damma UR x −41 5a 2370 n 22.09. 23.09.
71 e,f Wallenbur UR −11.8 −18 2261 07.10. 07.10. 04.10.
73 e,f Hufi UR 0 x 1800 30.10. 06.10. 31.10.
10

3. Length Variation
No. a Glacier Ct. b Length variation c Altitude d Date of measurements
(m) (m a.s.l.) (Day, Month)
2009/10 2010/11 2011 2009 2010 2011
74 e,f Griess UR −2.0 −9.4 2224 09.10. 22.09. 15.09.
75 e,f Firnalpeli (Ost) OW −22.9 −11.8 2235 24.08. 23.09. 02.10.
76 e,f Griessen OW −4.3 −11.4 2540 25.08. 14.10. 03.10.
Catchment area of the river Linth / Limmat (Ic)
77 e,f Biferten GL −10.6 −10.9 1969.8 01.11. 11.09. 03.09.
78 e Limmern GL −2.0 −3.3 2290 24.09. 09.10. 13.08.
114 e Plattalva GL −18.9 −19.3 2590 25.09. 10.10. 12.08.
79 e,f Sulz GL −1.6 −2.6 1791 06.10. 31.08. 29.09.
80 e,f Glarnisch GL −8.6 −7.7 2344.6 26.09. 12.09. 24.09.
81 e,f Pizol SG −2.9 −29.1 2595 24.09. 22.09. 26.09.
Catchment area of the river Rhine / Lake Constance (Id)
82 e,f Lavaz GR −14.4 2a −25 2395 n 23.08. 13.09.
83 e,f Punteglias GR −12.5 2a −27.8 2370 n 12.10. 24.08.
84 e,f Lenta GR −14.7 −33.4 2380 07.09. 03.09. 06.09.
85 e,f Vorab GR −8.6 −23.0 2650 22.09. 17.09. 29.09.
86 e,f Paradies GR +0.4 −18.6 2698 17.09. 16.09. 16.09.
87 e Suretta GR +0.7 −2.0 2589 17.09. 23.09. 16.09.
88 e,f Porchabella GR −15.6 −18.7 2715 07.10. 07.10. 03.10.
115 e Scaletta GR −4.4 −5.9 2598 01.09. 26.08. 23.08.
89 e,f Verstankla GR −10 −19.9 2450 01.09. 16.09. 06.09.
90 e Silvretta GR −7.7 −11.8 2466.8 09.09. 22.09. 16.09.
91 e,f Sardona SG +1.7 −14.6 2450 28.08. 24.09. 27.09.
Catchment area of the river Inn (V)
92 e,f Roseg GR 0 −1305 2160 09 14.09. 13.10. 25.11.
93 e Tschierva GR −20.7 −29.3 2262 09 14.09. 13.10. 13.09.
94 e,f Morteratsch GR −50.6 −44.9 2110 14.09. 13.10. 13.09.
95 e Calderas GR −12.6 −18.0 2801 27.08. 17.08. 28.07.
96 e,f Tiatscha GR −7.0 −1.6 2650 05 20.08. 27.08. 19.08.
97 e Sesvenna GR −8.4 −8.4 2760 07 19.08. 26.08. 23.08.
98 e,f Lischana GR x −7.9 2a 2774 06 28.08. 14.09. 12.08.
Catchment area of the river Adda (IV)
99 e Cambrena GR n −42 3a 2530 08 n n 21.10.
100 f Palu GR 0 2a −13.4 2620 n 07.10. 29.09.
101 Paradisino (Campo) GR −40 2a x 2770 n 08.10. 30.10.
102 f Forno GR −27.6 −26.2 2260 09 21.09. 23.08. 19.08.
116 Albigna GR −28.4 −17.3 28.07. 20.08. 30.08.
11

The Swiss Glaciers 2009/10 and 2010/11
No. a Glacier Ct. b Length variation c Altitude d Date of measurements
(m) (m a.s.l.) (Day, Month)
2009/10 2010/11 2011 2009 2010 2011
Catchment area of the river Ticino (III)
120 e Corno TI −6.5 −3.0 2608.3 08.09. 26.08. 29.08.
117 e Valleggia TI −7.9 −4.3 2422.5 02.09. 15.09. 07.09.
118 e Val Torta TI n −44.1 2a 2525.8 23.09. n 06.09.
352 e Croslina TI −1.1 −4.1 2718.0 10.09. 02.09. 14.09.
103 e,f Bresciana TI −6.0 −13.0 2941.7 31.08. 22.09. 12.09.
353 e Camadra TI −2.4 4a −5.6 2924 21.09. 12.09.
119 e Cavagnoli TI −9.3 −24.4 2539.0 28.09. 14.09. 21.09.
104 e,f Basodino TI −6.8 −19.2 2589.3 29.09. 13.09. 22.09.
105 e,f Rossboden VS x x 1930 04 n 13.10. 12.10.
Legend
+ advancing x value not determined
st stationary, ±1m n not observed
− retreating sn snow covered
a Identification number of the glacier in the observation network.
b If a specific glacier is situated in more than one canton, the canton indicated in the table is
the one where the observed glacier tongue lies.
c If the value given relates to more than one year, the number of years is indicated as follows:
−23 4a = Decrease of 23 meters within 4 years.
d If the altitude of the glacier tongue is not measured in 2011, the year of the last measurement
is indicated: 2522 99 = 2522 m above sea level, measured in the year 1999.
e Compare Appendix B: Remarks on individual glaciers.
f Glacier with nearly complete data series since the beginning of the measurements at the end
of the 19th century and one of the 73 glaciers selected in Figures 3.3 and 3.4.
12

3. Length Variation
12
3
45
6
7
10
173
11174 1213
1416
17
18
19 20
21
22
2324
2526
27282930
3132
33
3435
3637
38
39404142
43
4445
4748
505152
535455
575859
6061
109
6263
64
111
65112
113
6667
6869 70
7172
7374
75
76
77 78114
79
8081
82
83
84
85
86
87
88
115
89
9091
92
93 94
95
96
9798
99
100
101
102116
120 117 118 103119
104
352
105
2010advancing
stationary (+/− 1 m)
retreating
not classified
Figure 3.1: Observed glaciers in fall 2010.
12
3
45
6
7
10
173
11174 1213
1416
17
18
19 20
21
22
2324
2526
27282930
3132
33
3435
3637
38
39404142
43
4445
4748
505152
535455
575859
6061
109
6263
64
111
65112
113
6667
6869 70
7172
7374
75
76
77 78114
79
8081
82
83
84
85
86
87
88
115
89
9091
92
93 94
95
96
9798
99
100
101
102116
120 117 118 103119
104
352
353
105
2011advancing
stationary (+/− 1 m)
retreating
not classified
Figure 3.2: Observed glaciers in fall 2011.
13

The Swiss Glaciers 2009/10 and 2010/11
3.5 Length Variations - Statistics for 1880-2011
The long-term development of glaciers in Switzerland is illustrated by taking a selected sample
from the Swiss glacier network (Figures 3.3 and 3.4), and the cumulative glacier length variations
which have been classified according to length (Figures 3.5 - 3.8).
The dynamic response to climatic forcing of glaciers with variable geometry involves striking dif-
ferences in the recorded curves (Figures 3.4 and 3.5 - 3.8) (Hoelzle et al., 2003). Such differences
reflect the considerable effects of size-dependent reaction of the delayed tongue response with
respect to the undelayed input (mass balance) signal. As a consequence, the overview figure of
annual length-change data presented here as annual numbers or percentages of advancing and
retreating glaciers should be interpreted carefully.
We also present absolute numbers, in order to avoid having a glacier sample whose scope changes
annually, not all glaciers were included in Figures 3.3 and 3.4. From the entire dataset, 73 glaciers
were selected as a sample with nearly complete series since the beginning of the measurements at
the end of the 19th century. In Chapter 3.4, these 73 glaciers are indicated by a footnote f. The
measured annual values are assigned to three classes: advancing, stationary and retreating. Figure
3.3 presents absolute numbers and percentages. The sample is dominated by medium-sized glaciers
(length between 1 to 5 km) with a typical response time in the order of decades. The periods of
advance, such as those in the 1910s and the 1970s to 1980s, can be seen clearly. For the purpose of
intercomparison, values of cumulative length change are presented with respect to size categories
chosen in a way to optimally reflect common characteristics of the tongue-reaction signal. Figure
1900 1950 2000
0
20
40
60
Mea
sure
men
ts
no data
retreating
stationary
advancing0
20
40
60
80
100
Frac
tion
(%)
Figure 3.3: Yearly classification of glacier length behaviour (advancing, stationary and
retreating) of 73 selected glaciers.
14

3. Length Variation
3.4 shows the annual and individual length change of all 73 selected glaciers sorted for size. It is
well recognized that large glaciers, such as Grosser Aletschgletscher, show continuous retreat since
1880, in contrast to the smaller glaciers such as Pizolgletscher, which has highly variable behavior.
1900 1950 2000
Grand Plan Névé 0.29 kmSulz 0.30 kmPizol 0.46 km
Sardona 0.53 kmSankt Anna 0.59 km
Bresciana 0.68 kmLischana 0.73 km
Firnalpeli (Ost) 0.77 kmSex Rouge 0.87 km
Mutt 0.89 kmPaneyrosse 0.91 km
Punteglias 1.03 kmGriessen 1.06 km
Lavaz 1.19 kmBasòdino 1.34 km
Griess 1.37 kmKaltwasser 1.46 km
Mont Fort (Tortin) 1.58 kmVorab 1.60 km
Grand Désert 1.66 kmTiatscha 1.76 km
Wallenbur 1.87 kmEn Darrey 1.89 kmVerstankla 1.93 km
Lenta 1.94 kmPorchabella 1.95 km
Paradies 2.26 kmKehlen 2.27 km
Glärnisch 2.29 kmBlüemlisalp 2.31 km
Damma 2.40 kmRoseg 2.56 kmTiefen 2.62 km
Gamchi 2.63 kmBrunni 2.90 km
Tsanfleuron 3.07 kmMoming 3.10 kmCheillon 3.24 kmValsorey 3.40 km
Palü 3.58 kmSchwarzberg 3.64 km
Schwarz 3.66 kmStein 3.81 km
Rossboden 3.96 kmTrient 4.06 km
Biferten 4.26 kmArolla (Mont Collon) 4.40 km
Oberaar 4.58 kmTrift (Gadmen) 4.66 km
Tsidjiore Nouve 4.67 kmFee (Nord) 4.67 km
Rätzli 4.87 kmGries 5.08 kmMoiry 5.17 km
Turtmann 5.22 kmForno 5.34 kmAllalin 5.95 km
Saleina 6.08 kmMorteratsch 6.27 km
Ferpècle 6.41 kmOberer Grindelwald 6.45 km
Zmutt 6.49 kmLang 6.49 kmHüfi 6.74 km
Zinal 6.96 kmFindelen 7.26 km
Rhone 7.78 kmUnterer Grindelwald 8.38 km
Oberaletsch 8.82 kmUnteraar 11.92 km
Gorner 12.54 kmFiescher 14.82 km
Grosser Aletsch 22.66 km
Figure 3.4: Individual yearly pattern of the same 73 selected glaciers (displayed in the
descending order of actual glacier length).
15

The Swiss Glaciers 2009/10 and 2010/11
1900 1950 2000
−2500
−2000
−1500
−1000
−500
0
Cum
ulat
ive
leng
th c
hang
e (m
)
1900 1950 2000
−2000
0
Grosser AletschFiescherGornerUnteraar
Figure 3.5: Large valley glaciers with a length of more than 10 km. The gray shaded
area highlights the years of the current report.
1900 1950 2000
−2500
−2000
−1500
−1000
−500
0
Cum
ulat
ive
leng
th c
hang
e (m
)
1900 1950 2000
−2000
0
RhoneLangFerpècleAllalin
Figure 3.6: Mountain glaciers with a length of 5 to 10 km. The gray shaded area high-
lights the years of the current report.
16

3. Length Variation
1900 1950 2000
−2500
−2000
−1500
−1000
−500
0C
umul
ativ
e le
ngth
cha
nge
(m)
1900 1950 2000
−2000
0
KaltwasserKehlenBlüemlisalpWallenbur
Figure 3.7: Small mountain glaciers with a length of 1 to 5 km. The gray shaded area
highlights the years of the current report.
1900 1950 2000
−2500
−2000
−1500
−1000
−500
0
Cum
ulat
ive
leng
th c
hang
e (m
)
1900 1950 2000
−2000
0
PaneyrosseSardonaPizolSulz
Figure 3.8: Very small cirque glaciers with a length of less than 1 km. The gray shaded
area highlights the years of the current report.
17

The Swiss Glaciers 2009/10 and 2010/11
Gauligletscher (September 2010, top) and Vadret da Roseg (September 2011, bottom)
– both glaciers experienced a massive retreat in the observation periods of this report
(Photos: R. Straub and G. Bott)
18

4 Mass Balance
4.1 Introduction, cumulative mean specific mass balances
Detailed mass balance data were collected using the glaciological method for Ghiacciaio del
Basodino, Findelengletscher, Griesgletscher, Pizolgletscher, Glacier de la Plaine Morte, Rhone-
gletscher, Silvrettagletscher and Glacier de Tsanfleuron in Switzerland. In addition to these inves-
tigations aiming at the determination of the glacier-wide mass balance distribution, individual point
measurements of mass balance were taken at Claridenfirn, Jungfraufirn (Grosser Aletschgletscher),
Glacier du Gietro and Glacier de Corbassiere (cf. Chapter 5), as well as in the Mattmark region
(Allalin, Schwarzberg, Chapter 5). In Figure 4.1 the location within Switzerland of all these glaciers
is shown.
Basòdino
Findelen
Gries
Pizol
Silvretta
Rhone
Tsanfleuron
Plaine Morte
Clariden
Grosser Aletsch
Allalin
SchwarzbergCorbassière
Giétro
Figure 4.1: Investigated glaciers for mass balance with the focus on spatial distribution
and analysis of mean specific seasonal components of mass balance (dark
blue) or point measurements (light blue).
19

The Swiss Glaciers 2009/10 and 2010/11
1960 1980 2000
−30
−20
−10
0
Cum
ulat
ive
mas
s b
alan
ce (
m w
.e.)
1960 1980 2000
−30
−20
−10
0
Basòdino
Findelen
Gries
Pizol
Rhone
Silvretta
Figure 4.2: Cumulative mean specific annual balance over the whole observation period
for the glaciers Silvretta, Rhone, Pizol, Gries, Findelen and Basodino. The
gray shaded area highlights the years of the current report.
The mass balance measurements at stakes, in snow pits and extensive snow probing in spring were
used to calculate the mean specific components of mass balance following the methods described
in Huss et al. (2009). Extrapolation from individual measurements to the entire glacier surface was
performed using a mass balance model including the most important processes governing glacier
mass balance distribution. The procedure is divided into two steps:
(1) The model is tuned such that both the measurements of winter accumulation and summer
ablation are matched optimally over the periods defined by the exact dates of the in-situ
measurements which are reported for the years of the current report. This allows extrapola-
tion of mass balance based on a physical representation of the spatial variability, as well as
the calculation of mass balance over fixed time periods (e.g. the hydrological year).
(2) A periodical final reanalysis and homogenisation with independently derived ice volume changes
is reported separately in five to ten year intervals after evaluation.
The cumulative mean specific winter and annual balances of the glaciers with extensive obser-
vation series are presented in Table 4.1. Numbers for Adlergletscher as a former tributary of
Findelengletscher has been evaluated separately but detailed figures are presented together with
Findelengletscher. The long-term trends are very well recognizable for the Griesgletscher and Sil-
vrettagletscher with long time-series (Figure 4.2). Notably, the accelerated mass loss since the
mid-1980s is remarkable, as are the balanced mass budgets recorded in the 1960s and 70s. The
20

4. Mass Balance
Table 4.1: Summary table with area, mean specific winter and annual balance, ELA and
AAR for the exact measurement periods 2009/10 and 2010/11.
Glacier No. period area Bw Ba ELA AAR
(km2) (mm w.e.) (mm w.e.) (m a.s.l.) (%)
Basodino 104 2009/10 1.961 1687 −491 2985 24
2010/11 1.842 1080 −988 3135 0
Findelen 16 2009/10 13.042 728 −651 3325 50
2010/11 13.042 866 −913 3385 40
Adler 16 2009/10 2.229 529 −397 3535 41
2010/11 2.229 615 −479 3535 42
Gries 3 2009/10 4.973 1649 −1143 3055 18
2010/11 4.834 958 −1802 3175 2
Pizol 81 2009/10 0.081 1180 −859 2772 2
2010/11 0.081 1063 −2023 2792 0
Plaine Morte 65 2009/10 7.878 1347 −822 2795 5
2010/11 7.878 975 −2271 2915 0
Rhone 1 2009/10 15.808 1287 −391 2915 56
2010/11 15.808 1135 −1545 3095 32
Silvretta 90 2009/10 2.789 1363 −417 2865 33
2010/11 2.741 1030 −1392 3025 1
Tsanfleuron 33 2009/10 2.752 1075 −917 2924 0
2010/11 2.752 1175 −2336 2957 0
point measurements of the mass balance are of particular significance with regard to answering
questions related to climate change (Ohmura et al., 2007; Huss and Bauder, 2009). The four
existing long-term time series (Claridenfirn, Grosser Aletschgletscher, Silvrettagletscher) start in
the 1910s and cover almost the entire 20th century. Mass balance data of the present report have
also been communicated to the World Glacier Monitoring Service (WGMS) as a contribution to
the efforts of international glacier monitoring (WGMS, 2013).
4.2 Mass Balance in 2009/10
The glacier-wide mass balance in seasonal resolution was determined by measuring snow accumu-
lation during winter and melting in summer for these 8 glaciers: Basodino, Findelen, Gries, Pizol,
Plaine Morte, Rhone, Silvretta and Tsanfleuron. In comparison with measurements from the past
several years, both the snow accumulation and the melting figures were quite average. All of the
glaciers had a negative mass balance. The values fluctuated between a loss of approx. 0.4 m water
equivalent at Silvretta and Rhone glaciers, to well over a meter at the Gries glacier. The tendency
toward retreat recorded in the last few years is clearly persisting.
Melting was below average in summer at both the Pizol and the Silvretta glaciers at the northeast
side of the Alps. These two glaciers most likely profited the most from a continuous period of
variable weather conditions with repeated snowfalls. In contrast to the other glaciers investigated,
21
The Swiss Glaciers 2009/10 and 2010/11
at these two the new snow remained in place longer, thus diminishing the melt rate. These results
are confirmed by point measurements at the Claridenfirn and the Jungfraufirn of the Grosser
Aletschgletscher.
4.3 Mass Balance in 2010/11
These 8 glaciers were investigated during this period as well with regard to their mass balance.
The very slight amounts of snow in the winter of 2010/11 also led to clearly below-average snow
accumulation on the glaciers. In spite of periods of unstable weather conditions, melting was
intensive during summer, and all of these glaciers registered an extremely negative mass balance.
The values varied from a loss of approx. 1 m at Findelengletscher and Ghiacciaio del Basodino
to about 2 m at the other glaciers, thus continuing the trend of recent years to massive loss of
volume.
For the 2010/11 period, the negative mass balance can be traced to the combination of minimal
snow accumulation during the winter and the early onset of the melting season in the very warm
spring. This is in contrast to previous years in which intensive melting during the summer was
above all responsible for negative mass balance. In the 2010/11 period it was predominantly the
glaciers with catchment areas at high elevations which profited from greater snowfall amounts in
May and June, such as the Findelen and Rhone glaciers. At lower-lying areas, precipation fell in
the form of rain. Point measurements at the Claridenfirn and at the Jungfraufirn of the Grosser
Aletschgletscher are consistent with these results.
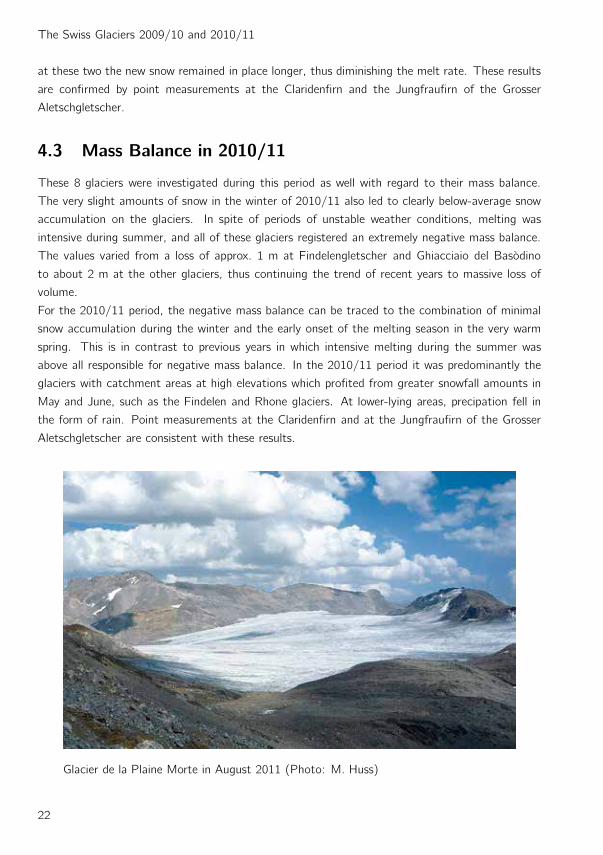
Glacier de la Plaine Morte in August 2011 (Photo: M. Huss)
22

4. Mass Balance
4.4 Ghiacciaio del Basodino
Introduction
Ghiacciaio del Basodino is a small north-east facing temperate mountain glacier in the southern
Swiss Alps. The small individual branch descending to the north with a separate tongue is not con-
sidered part of the glacier and not included in the mass balance determination. The main branch
covers an area of 2.2 km2 and extends from 2530 to 3192 m a.s.l. Detailed mass balance investiga-
tions are being carried out since 1990. Determination of volumetric changes in decadal resolution
reach further back to 1929 (Bauder et al., 2007). Topographic maps or photogrammetrical surveys
exist for 1929, 1949, 1971, 1985, 1991, 2002 and 2008.
3100
3000
3000
2900
2900
2800
2800
2700
2700
2600
2600
2600
23
46
8
910
11
12
1415
16
6790
00
140250
6815
00
141750
0 1km
Figure 4.3: Surface topography and observational network of the Ghiacciaio del
Basodino.
Investigations in 2009/10
The measurement period extended from 10th September 2009 to 11th September 2010 with a
field visit in spring on 20th May 2010. Field visits on July 25th and August 21st 2010 provided
additional measurements with observations of the gradual seasonal evolution. In September 2010,
winter snow accumulation remained only at higher elevations. Snow depth samples were collected
at about 70 locations during the spring measurement period and supplemented by a density profile
from the central sector of the glacier.
23

The Swiss Glaciers 2009/10 and 2010/11
Investigations in 2010/11
The measurement period was from 11th September 2010 to 6th September 2011 with a field visit
in spring on 5th May 2011. Again snow depth was sampled at about 70 locations distributed
over the entire glacier with a density profile at the center. Snow drift was greater than usual
and re-deposited to some extent at the eastern part. Moderate melt rates occurred until the end
of July. During the warm month of August high melt rates were recorded, resulting in the main
contribution the total annual ablation.
1990 1995 2000 2005 2010−2.5
−2.0
−1.5
−1.0
−0.5
0.0
0.5
Mas
s b
alan
ce (
m w
.e.)
−10
−5
0
Cum
ulat
ive
mas
s b
alan
ce (
m w
.e.)
Figure 4.4: Ghiacciaio del Basodino - Mean specific annual balance (bars) and cumulative
annual balance for the period 1991-2011.
24

4. Mass Balance
Table 4.2: Ghiacciaio del Basodino - Specific winter and annual balance versus altitude in
the two periods 2009/10 and 2010/11 evaluated for the exact measurement
period defined by the dates of field survey.
Altitude 2009/10 2010/11
area bw ba area bw ba(m a.s.l.) (km2) (mm w.e.) (mm w.e.) (km2) (mm w.e.) (mm w.e.)
2500 - 2600 0.028 1860 −1567 0.010 1100 −2156
2600 - 2700 0.194 1838 −1189 0.141 1135 −1797
2700 - 2800 0.384 1723 −973 0.360 1134 −1601
2800 - 2900 0.441 1668 −722 0.429 1099 −1007
2900 - 3000 0.534 1704 20 0.528 1109 −576
3000 - 3100 0.315 1607 −44 0.314 974 −644
3100 - 3200 0.064 1322 108 0.059 798 −503
2500 - 3200 1.961 1687 −491 1.842 1080 −988
Table 4.3: Ghiacciaio del Basodino - Individual stake measurements of winter and annual
balance.
stake period coordinates mass balance
start spring end bw ba(m / m / m a.s.l.) (mm w.e.)
2 10.09.2009 20.05.2010 11.09.2010 680210 / 141446 / 2721 1346 −1700
3 10.09.2009 20.05.2010 11.09.2010 680100 / 141450 / 2803 1600 −1280
4 10.09.2009 20.05.2010 11.09.2010 680061 / 141294 / 2819 1365 −1360
6 10.09.2009 20.05.2010 11.09.2010 679650 / 141500 / 2840 1540 −1336
8 10.09.2009 20.05.2010 11.09.2010 679500 / 140800 / 3050 1716 240
9 10.09.2009 20.05.2010 11.09.2010 680557 / 141167 / 2758 1501 −1275
10 10.09.2009 20.05.2010 11.09.2010 681000 / 141130 / 2689 1813 −800
11 10.09.2009 20.05.2010 11.09.2010 681336 / 141054 / 2610 2300 −1020
12 10.09.2009 20.05.2010 11.09.2010 679590 / 140791 / 3052 1560 210
14 10.09.2009 20.05.2010 11.09.2010 679983 / 141017 / 2904 1521 −336
15 10.09.2009 20.05.2010 11.09.2010 679391 / 140978 / 3040 1716 −420
16 10.09.2009 11.09.2010 679656 / 141500 / 2850 −1336
2 11.09.2010 05.05.2011 06.09.2011 680210 / 141446 / 2721 1036 −2550
6 11.09.2010 05.05.2011 06.09.2011 679650 / 141500 / 2840 944 −1600
8 11.09.2010 05.05.2011 06.09.2011 679610 / 140796 / 3050 1007 −490
9 11.09.2010 05.05.2011 06.09.2011 680557 / 141167 / 2758 1073 −1615
10 11.09.2010 05.05.2011 06.09.2011 681000 / 141130 / 2689 1332 −1640
11 11.09.2010 05.05.2011 06.09.2011 681336 / 141054 / 2610 1110 −2253
12 11.09.2010 05.05.2011 06.09.2011 679781 / 140828 / 2990 875 −910
14 11.09.2010 05.05.2011 06.09.2011 679983 / 141017 / 2904 925 −798
15 11.09.2010 05.05.2011 06.09.2011 679391 / 140978 / 3040 858 −644
25

The Swiss Glaciers 2009/10 and 2010/11
−2 0 2specific balance (m w.e.)
2600
2800
3000
3200
Alti
tud
e (m
a.s
.l.)
2009/10
−1.5 −1.0 −0.5 0.0 0.5 1.0volumetric balance (106 m3 w.e.)
−2 0 2specific balance (m w.e.)
2600
2800
3000
3200
Alti
tud
e (m
a.s
.l.)
2010/11
−1.5 −1.0 −0.5 0.0 0.5 1.0volumetric balance (106 m3 w.e.)
Figure 4.5: Specific (left) and volumetric (right) winter (dotted, ⋄), summer
(dashed, △) and annual (continuous line, +) balance versus al-
titude for 2009/10 (top) and 2010/11 (bottom). Small symbols
mark the individual measurements.
−2.5 −2.0 −1.5 −1.0 −0.5 0.0 0.5mean specific mass balance (m w.e.)
2700
2800
2900
3000
3100
ELA
(m
a.s
.l.)
2009/102010/11
−2.5 −2.0 −1.5 −1.0 −0.5 0.0 0.5mean specific mass balance (m w.e.)
0
20
40
60
80
AA
R (
%)
2009/102010/11
Figure 4.6: Equilibrium line altitude (ELA) and accumulation area ratio (AAR)
versus mean specific balance including all previous observations.
26

4. Mass Balance
4.5 Findelengletscher
Introduction
Findelengletscher (13.0 km2) and its former tributary Adlergletscher (2.0 km2) are located in the
southern Valais in the Zermatt area. The two glaciers cover an elevation range from 2560m
a.s.l. to 4110m a.s.l.. Findelengletscher is west-facing and is characterized by gently-sloping high-
elevation accumulation basins and a comparably narrow glacier tongue. The Findelengletscher
region is relatively dry with equilibrium line altitudes being among the highest in the Alps. Mass
balance measurements on Findelengletscher were initiated in fall 2004 and the observational net-
work was extended to Adlergletscher one year later (Machguth, 2008).
3400
3400
3600
3200
3200
3800
380036
0034003200
2800
2600
3000
F1
F12F2
F31
F32F4
F5F6
F7
F8
F81
F82F10
F11
A1
A2
A3
6300
00
96000
6360
00
92000
01km
Adlergletscher
Findelengletscher
Figure 4.7: Surface topography and observational network on Findelengletscher and the
former tributary Adlergletscher.
Investigations in 2009/10
Winter mass balance of Findelengletscher and Adlergletscher was determined in a two-day campaign
on 10./11.4.2010. Snow probings were obtained for 462 locations and snow density was measured
in totally 10 snow pits distributed over the entire elevation range of the glacier. In addition, a
27

The Swiss Glaciers 2009/10 and 2010/11
survey with a helicopter-borne ground penetrating radar system to record snow depth distribution
was performed covering profiles with a length of about 12 km (Sold et al., 2013). Simultaneously,
a high-resolution DEM of the snow surface was acquired with an air-borne LiDAR (Joerg et al.,
2012). In April 2010, an automatic camera overlooking the entire glacier was installed which
can henceforth be used for the remote determination of sub-seasonal mass balance (Huss et al.,
2013). All stakes were visited and re-installed on 29.9.2010. The annual mass balance for the
measurement period since 6.10.2009 was determined for 12 locations on Findelengletscher, and
three on Adlergletscher. Snow density was measured in two snow pits. At the same date flights for
another LiDAR DEM were conducted allowing the calculation of glacier volume change at seasonal
resolution since fall 2009 (Joerg et al., 2012).
Table 4.4: Findelengletscher - Specific winter and annual balance versus altitude in the
two periods 2009/10 and 2010/11 evaluated for the exact measurement pe-
riod defined by the dates of field survey.
Altitude 2009/10 2010/11
area bw ba area bw ba(m a.s.l.) (km2) (mm w.e.) (mm w.e.) (km2) (mm w.e.) (mm w.e.)
2500 - 2600 0.081 303 −6793 0.081 246 −8198
2600 - 2700 0.309 416 −5611 0.309 404 −7304
2700 - 2800 0.239 400 −5029 0.239 415 −5702
2800 - 2900 0.354 508 −3416 0.354 567 −3862
2900 - 3000 0.593 542 −2800 0.593 622 −2976
3000 - 3100 0.982 598 −2276 0.982 702 −2281
3100 - 3200 1.737 749 −1152 1.737 893 −1455
3200 - 3300 1.835 751 −355 1.835 901 −798
3300 - 3400 1.945 830 185 1.945 1000 −88
3400 - 3500 2.357 872 475 2.357 1050 311
3500 - 3600 1.609 773 518 1.609 930 463
3600 - 3700 0.439 704 583 0.439 848 582
3700 - 3800 0.300 462 301 0.300 556 298
3800 - 3900 0.252 433 343 0.252 522 346
3900 - 4000 0.011 349 319 0.011 420 278
2500 - 4000 13.042 728 −651 13.042 866 −913
Investigations in 2010/11
The winter survey was performed on 11.4.2010. In total, 377 snow probings distributed over the
entire surface of Findelen- and Adlergletscher were obtained, and snow density was measured in
four snow pits. Snow depths were below average and in the lower parts of the glacier, snow melt
was already significant. An additional snow depth survey was conducted on 15.6.2011 above the
equilibrium line of Findelengletscher. 22 km of traces with a helicopter-borne ground penetrating
radar were complemented with 145 snow probings and snow density measurements in three snow
28

4. Mass Balance
pits. Due to early melt-out of the lower parts of Findelengletscher, ablation during the summer
months was high – almost 10 meters of ice melt were recorded close to the terminus. On 29.9.2011
all measurement sites were visited. Mass balance was determined at 13 stakes on Findelengletscher
and at three stakes on Adlergletscher. Accumulation only occurred in the uppermost regions of the
glacier and firn density was measured in one snow pit. The second accumulation stake experienced
slightly negative mass balance.
Table 4.5: Adlergletscher - Specific winter and annual balance versus altitude in the two
periods 2009/10 and 2010/11 evaluated for the exact measurement period
defined by the dates of field survey.
Altitude 2009/10 2010/11
area bw ba area bw ba(m a.s.l.) (km2) (mm w.e.) (mm w.e.) (km2) (mm w.e.) (mm w.e.)
2900 - 3000 0.007 463 −3134 0.007 529 −4582
3000 - 3100 0.090 523 −2377 0.090 601 −3143
3100 - 3200 0.121 573 −1889 0.121 664 −2156
3200 - 3300 0.253 572 −1382 0.253 665 −1713
3300 - 3400 0.420 566 −749 0.420 659 −988
3400 - 3500 0.319 527 −304 0.319 614 −368
3500 - 3600 0.278 537 136 0.278 625 194
3600 - 3700 0.297 443 141 0.297 516 245
3700 - 3800 0.239 568 617 0.239 662 815
3800 - 3900 0.111 486 611 0.111 566 813
3900 - 4000 0.069 415 543 0.069 483 723
4000 - 4100 0.019 343 469 0.019 400 604
4100 - 4200 0.004 315 455 0.004 367 580
2900 - 4200 2.227 529 −397 2.227 615 −479
29

The Swiss Glaciers 2009/10 and 2010/11
Table 4.6: Findelengletscher and Adlergletscher - Individual stake measurements of win-
ter and annual balance.
stake period coordinates mass balance
start spring end bw ba(m / m / m a.s.l.) (mm w.e.)
F1 06.10.2009 10.04.2010 29.09.2010 629947 / 95564 / 2585 290 −6920
F12 06.10.2009 10.04.2010 29.09.2010 629988 / 95430 / 2580 290 −7010
F2 06.10.2009 10.04.2010 29.09.2010 630318 / 95450 / 2624 270 −5970
F31 06.10.2009 10.04.2010 29.09.2010 630905 / 95434 / 2695 310 −5710
F32 06.10.2009 10.04.2010 29.09.2010 630994 / 95228 / 2708 280 −5910
F4 06.10.2009 10.04.2010 29.09.2010 631531 / 95372 / 2806 470 −4160
F5 06.10.2009 10.04.2010 29.09.2010 632186 / 95034 / 2928 630 −2670
F7 06.10.2009 10.04.2010 29.09.2010 632531 / 94316 / 3040 700 −2120
F8 06.10.2009 10.04.2010 29.09.2010 633320 / 93841 / 3123 830 −1220
F81 06.10.2009 10.04.2010 29.09.2010 633435 / 94529 / 3159 550 −1700
F82 06.10.2009 10.04.2010 29.09.2010 632557 / 93740 / 3088 580 −1700
F10 06.10.2009 10.04.2010 29.09.2010 635094 / 93920 / 3345 940 350
A1 06.10.2009 10.04.2010 29.09.2010 632356 / 95512 / 3038 380 −3070
A2 06.10.2009 10.04.2010 29.09.2010 632533 / 95501 / 3082 520 −2240
A3 06.10.2009 10.04.2010 29.09.2010 632715 / 95542 / 3140 480 −2460
F1 29.09.2010 11.04.2011 29.09.2011 629998 / 95563 / 2592 220 −8640
F2 29.09.2010 11.04.2011 29.09.2011 630323 / 95447 / 2624 270 −7690
F31 29.09.2010 11.04.2011 29.09.2011 630911 / 95431 / 2695 410 −5820
F32 29.09.2010 11.04.2011 29.09.2011 631009 / 95274 / 2708 260 −6770
F4 29.09.2010 11.04.2011 29.09.2011 631530 / 95375 / 2806 400 −4900
F5 29.09.2010 11.04.2011 29.09.2011 632190 / 95033 / 2932 630 −2820
F6 29.09.2010 11.04.2011 29.09.2011 632418 / 94974 / 2967 600 −3360
F7 29.09.2010 11.04.2011 29.09.2011 632474 / 94375 / 3037 710 −2400
F8 29.09.2010 11.04.2011 29.09.2011 633282 / 93867 / 3119 830 −1610
F81 29.09.2010 11.04.2011 29.09.2011 633396 / 94526 / 3156 530 −2130
F82 29.09.2010 11.04.2011 29.09.2011 632550 / 93728 / 3090 860 −2090
F10 29.09.2010 11.04.2011 29.09.2011 635015 / 93958 / 3338 1010 −100
F11 29.09.2010 11.04.2011 29.09.2011 634134 / 92343 / 3449 990 940
A1 29.09.2010 11.04.2011 29.09.2011 632343 / 95511 / 3038 800 −4140
A2 29.09.2010 11.04.2011 29.09.2011 632515 / 95499 / 3082 580 −2850
A3 29.09.2010 11.04.2011 29.09.2011 632687 / 95540 / 3124 710 −2640
30

4. Mass Balance
−8 −6 −4 −2 0specific balance (m w.e.)
2500
3000
3500
4000
Alti
tud
e (m
a.s
.l.)
2009/10
−6 −4 −2 0 2 4volumetric balance (106 m3 w.e.)
−8 −6 −4 −2 0specific balance (m w.e.)
2500
3000
3500
4000
Alti
tud
e (m
a.s
.l.)
2010/11
−6 −4 −2 0 2 4volumetric balance (106 m3 w.e.)
Figure 4.8: Specific (left) and volumetric (right) winter (dotted, ⋄), summer
(dashed, △) and annual (continuous line, +) balance versus al-
titude for 2009/10 (top) and 2010/11 (bottom). Small symbols
mark the individual measurements.
31

The Swiss Glaciers 2009/10 and 2010/11
4.6 Griesgletscher (Aegina)
Introduction
Griesgletscher is a temperate valley glacier located in the central Swiss Alps. The glacier covers
an area of 4.97 km2 flowing in north-east direction from 3374 m a.s.l. down to 2415 m a.s.l. Mass
balance measurements started in 1961 in connection with the construction of a reservoir for hydro-
power production. Determination of volumetric changes in decadal resolution reach further back
to 1884 (Bauder et al., 2007). Topographic maps or photogrammetrical surveys exist for 1884,
1923, 1961, 1967, 1979, 1986, 1991, 1998, 2003 and 2007. Huss et al. (2009) reanalyzed and
homogenized the seasonal stake data and ice volume changes for the period 1961-2007. Results
of the mean specific winter and annual balance with associated area, ELA and AAR values for
comparable fixed time periods have been reported in Section 4.9 of volume 125/126.
3200
3000 2800
2800
2600
2600
3000123
45
67
89
10
11
1213
1415
1617
18
1920
6670
00
145000
6710
00
143000
01km
Figure 4.9: Surface topography and observational network of the Gries-
gletscher.
32

4. Mass Balance
1960 1970 1980 1990 2000 2010
−2
−1
0
1
Mas
s b
alan
ce (
m w
.e.)
−20
0
Cum
ulat
ive
mas
s b
alan
ce (
m w
.e.)
Figure 4.10: Griesgletscher - Mean specific annual balance (bars) and cumula-
tive annual balance for the period 1961-2011.
Investigations in 2009/10
The measurement period extended from 6th September 2009 to 4th September 2010 with a field
visit in spring on 18th May 2010. Snow depth samples were collected at 58 locations and supple-
mented by two density profiles obtained by firn drilling on the tongue and in the upper area. The
melt extent at the end of the summer covered almost the entire surface area, leaving only a few
marginal firn patches.
Investigations in 2010/11
The measurement period extended from 4th September 2010 to 8th September 2011 with a field
visit in spring on 19th April 2011. Snow depth was sampled at 26 locations and the density was
determined at two locations using a firn drill. The melt-out at the end of the summer extended
over almost the entire surface area with some marginal firn patches left in the higher region.
33

The Swiss Glaciers 2009/10 and 2010/11
Table 4.7: Griesgletscher - Specific winter and annual balance versus altitude
in the two periods 2009/10 and 2010/11 evaluated for the exact
measurement period defined by the dates of field survey.
Altitude 2009/10 2010/11
area bw ba area bw ba(m a.s.l.) (km2) (mm w.e.) (mm w.e.) (km2) (mm w.e.) (mm w.e.)
2400 - 2500 0.154 1210 −3707 0.164 808 −4522
2500 - 2600 0.765 1247 −3140 0.731 747 −3813
2600 - 2700 0.318 1343 −2382 0.237 975 −2706
2700 - 2800 0.342 1678 −1553 0.363 982 −1837
2800 - 2900 0.609 1728 −1252 0.636 916 −1733
2900 - 3000 0.953 1726 −733 1.005 954 −1456
3000 - 3100 1.484 1859 −60 1.421 1081 −904
3100 - 3200 0.263 1879 450 0.206 1121 −67
3200 - 3300 0.082 1336 120 0.071 789 −208
3300 - 3400 0.004 816 −115 0.001 508 −206
2400 - 3400 4.973 1649 −1143 4.834 958 −1802
Griesgletscher on the day of the field survey in September 2010 (Photo:
F. Funk-Salami)
34

4. Mass Balance
Table 4.8: Griesgletscher - Individual stake measurements of winter and annual
balance.
stake period coordinates mass balance
start spring end bw ba(m / m / m a.s.l.) (mm w.e.)
1 06.09.2009 18.05.2010 04.09.2010 667479 / 142824 / 3040 1750 −243
2 06.09.2009 18.05.2010 04.09.2010 667538 / 142662 / 3035 1850 −162
3 06.09.2009 18.05.2010 04.09.2010 667601 / 142554 / 3038 1820 −9
4 06.09.2009 18.05.2010 04.09.2010 667907 / 143037 / 2998 1700 −450
5 06.09.2009 18.05.2010 04.09.2010 668064 / 142909 / 3000 1700 −288
6 06.09.2009 18.05.2010 04.09.2010 668347 / 143283 / 2945 1450 −1431
7 06.09.2009 18.05.2010 04.09.2010 668430 / 143120 / 2945 1650 −837
8 06.09.2009 18.05.2010 04.09.2010 668792 / 143398 / 2893 1700 −1692
9 06.09.2009 18.05.2010 04.09.2010 668956 / 143294 / 2882 1750 −1107
10 06.09.2009 18.05.2010 04.09.2010 669377 / 143567 / 2777 1800 −1206
11 05.09.2009 18.05.2010 03.09.2010 669349 / 143893 / 2686 1450 −2340
12 05.09.2009 18.05.2010 03.09.2010 669258 / 144204 / 2624 1350 −2754
13 05.09.2009 18.05.2010 03.09.2010 669370 / 144182 / 2619 1120 −2790
14 05.09.2009 18.05.2010 03.09.2010 669654 / 144510 / 2578 1270 −3105
15 05.09.2009 18.05.2010 03.09.2010 669670 / 144386 / 2574 1250 −3492
16 05.09.2009 18.05.2010 03.09.2010 670075 / 144849 / 2549 1170 −3231
17 05.09.2009 18.05.2010 03.09.2010 670160 / 144714 / 2544 1320 −3276
18 05.09.2009 18.05.2010 03.09.2010 670349 / 145008 / 2513 1370 −3987
19 05.09.2009 18.05.2010 03.09.2010 670486 / 144828 / 2495 1200 −3636
1 04.09.2010 19.04.2011 08.09.2011 667479 / 142824 / 3040 1070 −1170
2 04.09.2010 19.04.2011 08.09.2011 667538 / 142662 / 3035 1070 −1242
3 04.09.2010 19.04.2011 08.09.2011 667605 / 142554 / 3038 1070 −972
4 04.09.2010 19.04.2011 08.09.2011 667907 / 143037 / 2998 960 −1287
5 04.09.2010 19.04.2011 09.09.2011 668064 / 142909 / 3000 980 −1188
6 04.09.2010 19.04.2011 09.09.2011 668347 / 143283 / 2945 860 −1980
8 04.09.2010 19.04.2011 09.09.2011 668792 / 143398 / 2893 840 −2286
9 04.09.2010 19.04.2011 09.09.2011 668956 / 143294 / 2882 1000 −1737
10 04.09.2010 19.04.2011 09.09.2011 669377 / 143567 / 2777 920 −1755
11 04.09.2010 19.04.2011 09.09.2011 669349 / 143893 / 2686 1030 −2691
12 04.09.2010 19.04.2011 09.09.2011 669258 / 144204 / 2624 800 −4158
13 04.09.2010 19.04.2011 09.09.2011 669370 / 144182 / 2619 840 −3159
14 04.09.2010 19.04.2011 09.09.2011 669654 / 144510 / 2578 780 −3537
15 04.09.2010 19.04.2011 09.09.2011 669670 / 144386 / 2574 680 −4077
16 04.09.2010 19.04.2011 09.09.2011 670075 / 144849 / 2549 760 −3888
18 04.09.2010 19.04.2011 09.09.2011 670349 / 145008 / 2513 900 −4806
19 04.09.2010 19.04.2011 09.09.2011 670486 / 144828 / 2495 820 −4752
35

The Swiss Glaciers 2009/10 and 2010/11
−4 −2 0 2specific balance (m w.e.)
2400
2600
2800
3000
3200
3400
Alti
tud
e (m
a.s
.l.)
2009/10
−4 −2 0 2 4volumetric balance (106 m3 w.e.)
−4 −2 0 2specific balance (m w.e.)
2400
2600
2800
3000
3200
3400
Alti
tud
e (m
a.s
.l.)
2010/11
−4 −2 0 2 4volumetric balance (106 m3 w.e.)
Figure 4.11: Specific (left) and volumetric (right) winter (dotted, ⋄), summer
(dashed, △) and annual (continuous line, +) balance versus al-
titude for 2009/10 (top) and 2010/11 (bottom). Small symbols
mark the individual measurements.
−2 −1 0 1mean specific mass balance (m w.e.)
2400
2600
2800
3000
3200
3400
ELA
(m
a.s
.l.)
2009/102010/11
−2 −1 0 1mean specific mass balance (m w.e.)
0
20
40
60
80
AA
R (
%)
2009/102010/11
Figure 4.12: Equilibrium line altitude (ELA) and accumulation area ratio (AAR)
versus mean specific balance including all previous observations.
36

4. Mass Balance
4.7 Pizolgletscher
Introduction
Pizolgletscher is a steep cirque glacier in the north-eastern Swiss Alps. With a surface area of
about 0.07 km2 Pizolgletscher is the dwarf in the Swiss glacier monitoring network and represents
the size class of glacierets that include almost 80% of the total number of glaciers in Switzer-
land. Pizolgletscher is north-exposed and located at relatively low elevation (2630-2780m a.s.l.)
which indicates that it depends on high quantities of winter accumulation. Seasonal mass balance
measurements were started in 2006 (Huss, 2010). The observation network was extended from
initially two to six stakes. Photogrammetrical surveys exist for 1968, 1973, 1979, 1985, 1990,
1997, 2006 providing area and ice volume changes over the last four decades (Huss, 2010).
2750
2700
2650
P1
P2
P2
P3
P4P5
P6P7
P8
7482
00
202600
7487
00
203000
0200m
Figure 4.13: Surface topography and observational network of the Pizolgletscher.
Investigations in 2009/10
Winter balance was determined on April 2nd, 2010. Snow probings at 106 locations were performed
and snow density was measured in a snow pit. The glacier was covered by about four meters of
37
The Swiss Glaciers 2009/10 and 2010/11
snow on average. During the late summer field survey on 22nd September 2010 a negative mass
balance for the measurement period since 13th September 2009 was observed at eight stakes.
Although no winter snow remained on the glacier, ice ablation was below the long-term average,
also due to several summer snow fall events.
Table 4.9: Pizolgletscher - Specific winter and annual balance versus altitude in the two
periods 2009/10 and 2010/11 evaluated for the exact measurement period
defined by the dates of field survey.
Altitude 2009/10 2010/11
area bw ba area bw ba(m a.s.l.) (km2) (mm w.e.) (mm w.e.) (km2) (mm w.e.) (mm w.e.)
2600 - 2650 0.020 1068 −1222 0.020 936 −2330
2650 - 2700 0.034 1110 −1020 0.034 1006 −2238
2700 - 2750 0.021 1351 −407 0.021 1224 −1565
2750 - 2800 0.005 1375 −254 0.005 1273 −1294
2600 - 2800 0.081 1180 −859 0.081 1063 −2023
Investigations in 2010/11
During a winter field survey on 26th March 2011, probings of the snow depth at 102 locations
were realized and snow density was determined in a snow pit. Snow accumulation was found to
be below average. Due to high air temperatures and little precipitation during spring and summer
the melt-out started early and ablation was extreme. It is estimated that roughly 15% of the total
remaining ice volume of Pizolgletscher was removed only in 2011. On 24th September 2011, the
annual mass balance was measured at eight locations and all stakes were re-installed. The negative
mass balances of the last years have contributed to an increasing quantity of supraglacial debris.
The firn coverage originating from the beginning of the 2000s has almost completely disappeared.
Several large crevasses were observed for the first time.
38

4. Mass Balance
Table 4.10: Pizolgletscher - Individual stake measurements of winter and annual balance.
stake period coordinates mass balance
start spring end bw ba(m / m / m a.s.l.) (mm w.e.)
P1 13.09.2009 02.04.2010 22.09.2010 748531 / 202901 / 2632 890 −1490
P1 13.09.2009 02.04.2010 22.09.2010 748528 / 202908 / 2632 890 −1530
P2 13.09.2009 02.04.2010 22.09.2010 748438 / 202778 / 2699 1440 −350
P2 13.09.2009 02.04.2010 22.09.2010 748472 / 202755 / 2701 1120 −870
P3 13.09.2009 02.04.2010 22.09.2010 748359 / 202656 / 2770 1130 −560
P3 13.09.2009 02.04.2010 22.09.2010 748347 / 202645 / 2778 1130 −430
P4 13.09.2009 02.04.2010 22.09.2010 748432 / 202904 / 2662 660 −2370
P5 13.09.2009 02.04.2010 22.09.2010 748387 / 202892 / 2676 980 −1450
P6 13.09.2009 02.04.2010 22.09.2010 748544 / 202682 / 2712 1540 −420
P1 22.09.2010 26.03.2011 24.09.2011 748519 / 202909 / 2634 1030 −2480
P2 22.09.2010 26.03.2011 24.09.2011 748438 / 202778 / 2699 1230 −1130
P3 22.09.2010 26.03.2011 24.09.2011 748342 / 202650 / 2776 1470 −1420
P4 22.09.2010 26.03.2011 24.09.2011 748436 / 202912 / 2657 1170 −3110
P5 22.09.2010 26.03.2011 24.09.2011 748388 / 202886 / 2676 1190 −2170
P6 22.09.2010 26.03.2011 24.09.2011 748549 / 202687 / 2710 1310 −1230
P7 22.09.2010 26.03.2011 24.09.2011 748367 / 202681 / 2756 1170 −1890
P8 22.09.2010 26.03.2011 24.09.2011 748535 / 202796 / 2673 970 −2030
39
The Swiss Glaciers 2009/10 and 2010/11
−3 −2 −1 0 1specific balance (m w.e.)
2600
2650
2700
2750
2800
Alti
tud
e (m
a.s
.l.)
2009/10
−0.15 −0.10 −0.05 0.00 0.05volumetric balance (106 m3 w.e.)
−3 −2 −1 0 1specific balance (m w.e.)
2600
2650
2700
2750
2800
Alti
tud
e (m
a.s
.l.)
2010/11
−0.15 −0.10 −0.05 0.00 0.05volumetric balance (106 m3 w.e.)
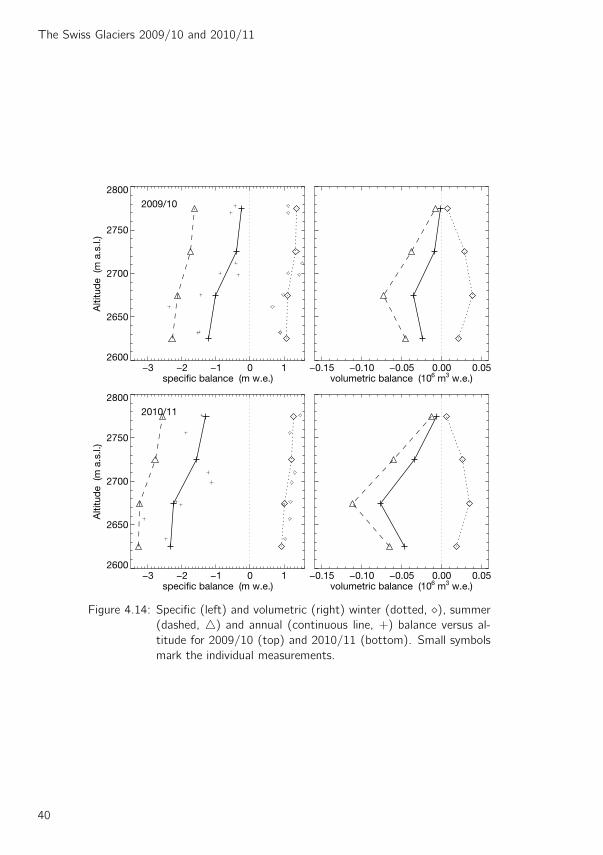
Figure 4.14: Specific (left) and volumetric (right) winter (dotted, ⋄), summer
(dashed, △) and annual (continuous line, +) balance versus al-
titude for 2009/10 (top) and 2010/11 (bottom). Small symbols
mark the individual measurements.
40

4. Mass Balance
4.8 Glacier de la Plaine Morte
Introduction
Glacier de la Plaine Morte (7.88 km2) is the largest plateau glacier in the European Alps and
thus represents a particularly interesting site for studying accelerating effects of climate change
on Alpine glaciers. Glacier de la Plaine Morte is situated at the main Alpine divide between the
cantons Berne and Valais. About 90% of the glacier surface lie in a narrow altitudinal band
between 2650 and 2800m a.s.l.. From the 5 km wide plateau with an average slope of less than
four degrees, a small outlet glacier (Rezligletscher) flows northwards. There is no clear separation
between the accumulation and the ablation area. In most years, the entire glacier is either snow-
covered or completely snow-free at the end of summer, i.e. the equilibrium line either lies above
or below the glacier. Ice flow speed is very limited and some crevasses are only observed on
Retzligletscher. Large circular depressions of the glacier surface, probably related to cryo-karst,
are common features and are stable over several decades. Three ice marginal lakes, notably Lac
des Faverges with a water volume of more than 1 million m3, are subject to annual drainage events.
The seasonal mass balance of Glacier de la Plaine Morte is determined since 2009 using the direct
glaciological method (Huss et al., 2013). Due to the homogenous glacier surface characteristics
the spatial variability in melt is mainly driven by differences in ice surface albedo.
2700
2700
2700
26002600
2800
29002800
1
23
4
6030
00
138000
6085
00
136000
01km
Figure 4.15: Surface topography and observational network of the Glacier de la Plaine
Morte.
Investigations in 2009/10
Measurements of the winter mass balance were conducted on April 6th, 2010. Snow probings at 66
locations distributed over the entire glacier surface were realized and snow density was determined
in a snow pit. The average snow depth on the glacier was about three meters. In a mid-summer
41

The Swiss Glaciers 2009/10 and 2010/11
field survey on July 31st, 2010, two stakes were re-drilled and stake readings on 12nd September
2010 indicated a negative mass balance for the measurement period since 15th September 2009
at four stakes. At the end of the hydrological year, the entire glacier surface was snow-free.
Table 4.11: Glacier de la Plaine Morte - Specific winter and annual balance versus al-
titude in the two periods 2009/10 and 2010/11 evaluated for the exact
measurement period defined by the dates of field survey.
Altitude 2009/10 2010/11
area bw ba area bw ba(m a.s.l.) (km2) (mm w.e.) (mm w.e.) (km2) (mm w.e.) (mm w.e.)
2400 - 2500 0.009 1460 −862 0.009 1245 −2059
2500 - 2600 0.152 1329 −1278 0.152 1082 −2561
2600 - 2700 1.831 1343 −1028 1.831 1023 −2435
2700 - 2800 5.634 1345 −783 5.634 959 −2256
2800 - 2900 0.223 1467 63 0.223 933 −1314
2900 - 3000 0.029 1117 166 0.029 731 −639
2400 - 3000 7.878 1347 −822 7.878 975 −2271
Investigations in 2010/11
The winter 2010/11 was characterized by below average snow accumulation on Glacier de la
Plaine Morte. A winter field survey on April 18th, 2011 provided probings of the snow depth at 193
locations and snow density was measured in two snow pits. The mean snow depth was only slightly
above two meters. This contributed to an extraordinarily early melt-out of the glacier. During
a survey on 5th July 2011 most of the glacier surface was already snow-free. Additional stake
readings in connection with extensive dye tracer experiments (Finger et al., 2013) on September
22nd, 2011 indicated a major mass loss throughout the summer. Stakes were re-drilled on 1st
September 2011, and annual mass balance was determined at three stakes for the measurement
period 12th September 2010 to 2nd October 2011. In July 2011, the first subglacial drainage of
Lac des Faverges was reported causing a significant short-term runoff increase in the Simme valley.
42
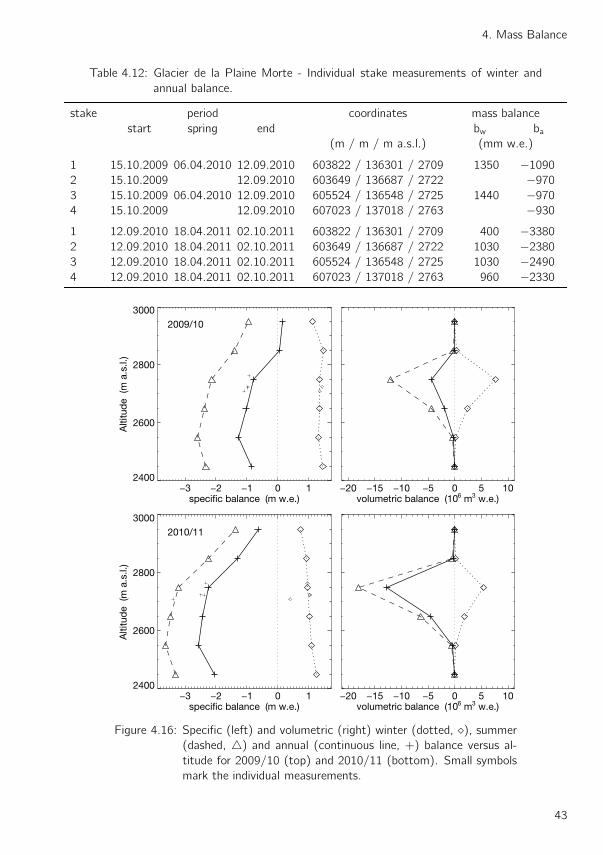
4. Mass Balance
Table 4.12: Glacier de la Plaine Morte - Individual stake measurements of winter and
annual balance.
stake period coordinates mass balance
start spring end bw ba(m / m / m a.s.l.) (mm w.e.)
1 15.10.2009 06.04.2010 12.09.2010 603822 / 136301 / 2709 1350 −1090
2 15.10.2009 12.09.2010 603649 / 136687 / 2722 −970
3 15.10.2009 06.04.2010 12.09.2010 605524 / 136548 / 2725 1440 −970
4 15.10.2009 12.09.2010 607023 / 137018 / 2763 −930
1 12.09.2010 18.04.2011 02.10.2011 603822 / 136301 / 2709 400 −3380
2 12.09.2010 18.04.2011 02.10.2011 603649 / 136687 / 2722 1030 −2380
3 12.09.2010 18.04.2011 02.10.2011 605524 / 136548 / 2725 1030 −2490
4 12.09.2010 18.04.2011 02.10.2011 607023 / 137018 / 2763 960 −2330
−3 −2 −1 0 1specific balance (m w.e.)
2400
2600
2800
3000
Alti
tud
e (m
a.s
.l.)
2009/10
−20 −15 −10 −5 0 5 10volumetric balance (106 m3 w.e.)
−3 −2 −1 0 1specific balance (m w.e.)
2400
2600
2800
3000
Alti
tud
e (m
a.s
.l.)
2010/11
−20 −15 −10 −5 0 5 10volumetric balance (106 m3 w.e.)
Figure 4.16: Specific (left) and volumetric (right) winter (dotted, ⋄), summer
(dashed, △) and annual (continuous line, +) balance versus al-
titude for 2009/10 (top) and 2010/11 (bottom). Small symbols
mark the individual measurements.
43

The Swiss Glaciers 2009/10 and 2010/11
4.9 Rhonegletscher
Introduction
The Rhonegletscher is a temperate valley glacier located in the central Swiss Alps, and is the
primary source of water for the Rhone river. The glacier is easily accessible and therefore has been
observed since the 19th century. The total surface area of the glacier is 15.93 km2 flowing in a
south direction from 3600 m a.s.l. down to 2200 m a.s.l. The first mass balance measurements
were carried out in 1874 and are considered to be one of the first ever recorded worldwide. After
two periods of measurements between 1884-1910, and 1980-’82, the measurement series was
resumed in 2006. Determination of volumetric changes in decadal resolution reach further back
2400
2600
30003000
3000
2800
3200
3400
32001
2
3
4
5
6
7
8910
11
1213
14
6720
00
16700067
4000
161000
01km
Figure 4.17: Surface topography and observational network of the Rhonegletscher.
44

4. Mass Balance
to 1874 (Bauder et al., 2007). Topographic maps or photogrammetrical surveys exist for 1874,
1929, 1959, 1980, 1991, 2000, and 2007. Provided are stake measurements and the resulting
mass balance data extrapolated to the entire glacier for the two periods of this report. However,
there is no figure summarizing the entire data set because the collection processes only started in
2006.
Investigations in 2009/10
The measurement period extended from 10th September 2009 to 5th September 2010 with a
field visit in spring on 21st to 23rd April 2010. There was a total of 433 individual snow depth
soundings collected. The density was measured at Stake 13 using a firn drill. At the time of
the field measurements in September, the glacier was covered with snow above the icefall and
melt-out proceeded during summer up to about 2850m asl with many of the exposed areas higher
up completely melted out.
Rhonegletscher at the end of ablation season in 2010 (Photo: A. Bauder)
Investigations in 2010/11
The measurement period began on the 5th of September 2010 and ended on the 15th of September
2011 with a field visit in the spring on 4th and 5th of May 2011. During the spring field visit, snow
samples from roughly 600 individual points were collected to measure the winter accumulation. No
detailed measurements of a density profile were performed.In September, complete melt of winter
accumulation extended to the highest regions.
45

The Swiss Glaciers 2009/10 and 2010/11
Table 4.13: Rhonegletscher - Specific winter and annual balance versus altitude in the
two periods 2009/10 and 2010/11 evaluated for the exact measurement
period defined by the dates of field survey.
Altitude 2009/10 2010/11
area bw ba area bw ba(m a.s.l.) (km2) (mm w.e.) (mm w.e.) (km2) (mm w.e.) (mm w.e.)
2200 - 2300 0.268 507 −5449 0.268 -110 −7186
2300 - 2400 0.484 609 −4872 0.484 15 −6535
2400 - 2500 0.639 705 −4430 0.639 181 −5994
2500 - 2600 1.139 793 −3495 1.139 338 −5116
2600 - 2700 0.936 935 −2385 0.936 476 −4210
2700 - 2800 1.069 1134 −1380 1.069 914 −2725
2800 - 2900 2.154 1330 −414 2.154 1171 −1684
2900 - 3000 2.171 1467 289 2.171 1429 −742
3000 - 3100 1.877 1450 744 1.877 1434 −263
3100 - 3200 1.534 1487 1143 1.534 1475 129
3200 - 3300 1.456 1580 1395 1.456 1557 510
3300 - 3400 0.951 1615 1596 0.951 1585 820
3400 - 3500 0.795 1493 1614 0.795 1550 1066
3500 - 3600 0.334 1194 1277 0.334 1365 1019
2200 - 3600 15.808 1287 −391 15.808 1135 −1545
Proglacial lake reached a considerable size over summer 2011 and the snout lost contact
to the rock barrier (Photo: A. Bauder)
46

4. Mass Balance
Table 4.14: Rhonegletscher - Individual stake measurements of winter and annual bal-
ance.
stake period coordinates mass balance
start spring end bw ba(m / m / m a.s.l.) (mm w.e.)
01 10.09.2009 22.04.2010 05.09.2010 673815 / 166614 / 3236 1436 1513
02 10.09.2009 05.09.2010 673551 / 165949 / 3128 1238
03 10.09.2009 22.04.2010 05.09.2010 673095 / 164926 / 2937 1235 738
04 10.09.2009 03.09.2010 673350 / 162759 / 2754 −1332
05 10.09.2009 22.04.2010 02.09.2010 672521 / 161915 / 2615 447 −3114
06 10.09.2009 22.04.2010 02.09.2010 672420 / 160844 / 2482 −540 −4689
07 10.09.2009 22.04.2010 02.09.2010 672657 / 160172 / 2379 −330 −5067
08 09.09.2009 22.04.2010 02.09.2010 672688 / 159722 / 2322 −420 −5265
09 09.09.2009 22.04.2010 02.09.2010 672597 / 159478 / 2276 −500 −5481
10 09.09.2009 22.04.2010 02.09.2010 672512 / 159375 / 2259 −640 −5283
11 09.09.2009 23.04.2010 02.09.2010 672450 / 159247 / 2238 −470 −6678
12 09.09.2009 22.04.2010 02.09.2010 672814 / 159949 / 2342 −440 −4878
13 09.09.2009 21.04.2010 02.09.2010 672711 / 159905 / 2340 −460 −4986
14 09.09.2009 21.04.2010 02.09.2010 672573 / 159901 / 2339 −850 −5301
01 05.09.2010 04.05.2011 15.09.2011 673815 / 166615 / 3236 1412 556
02 05.09.2010 04.05.2011 15.09.2011 673552 / 165950 / 3128 1224 99
03 05.09.2010 04.05.2011 15.09.2011 673099 / 164930 / 2936 1392 162
04 03.09.2010 04.05.2011 13.09.2011 673356 / 162754 / 2754 540 −2592
05 03.09.2010 04.05.2011 13.09.2011 672520 / 161919 / 2614 −60 −4725
06 03.09.2010 04.05.2011 13.09.2011 672420 / 160844 / 2480 −660 −6237
07 03.09.2010 04.05.2011 12.09.2011 672660 / 160164 / 2375 −810 −6984
08 03.09.2010 04.05.2011 12.09.2011 672686 / 159725 / 2319 −1020 −7047
09 03.09.2010 05.05.2011 13.09.2011 672586 / 159460 / 2269 −720 −7092
10 03.09.2010 04.05.2011 12.09.2011 672511 / 159379 / 2255 −960 −7056
11 03.09.2010 04.05.2011 12.09.2011 672438 / 159265 / 2232 −1422 −8334
12 03.09.2010 04.05.2011 12.09.2011 672832 / 159940 / 2337 −910 −6228
13 03.09.2010 04.05.2011 13.09.2011 672738 / 159880 / 2335 −730 −6066
14 03.09.2010 04.05.2011 12.09.2011 672590 / 159897 / 2336 −1080 −6525
47

The Swiss Glaciers 2009/10 and 2010/11
−6 −4 −2 0 2specific balance (m w.e.)
2500
3000
3500
Alti
tud
e (m
a.s
.l.)
2009/10
−8 −6 −4 −2 0 2 4volumetric balance (106 m3 w.e.)
−6 −4 −2 0 2specific balance (m w.e.)
2500
3000
3500
Alti
tud
e (m
a.s
.l.)
2010/11
−8 −6 −4 −2 0 2 4volumetric balance (106 m3 w.e.)
Figure 4.18: Specific (left) and volumetric (right) winter (dotted, ⋄), summer
(dashed, △) and annual (continuous line, +) balance versus al-
titude for 2009/10 (top) and 2010/11 (bottom). Small symbols
mark the individual measurements.
48

4. Mass Balance
4.10 Silvrettagletscher
Introduction
Silvrettagletscher is a small temperate mountain glacier located in the north-eastern part of
Switzerland in the Silvretta massif at the border to Austria. The present surface area is 2.8 km2,
stretching from 3079 m a.s.l. down to 2467 m a.s.l.
First mass balance measurements date back to 1910s (Firnberichte, 1978). Seasonal observations
of 2 stakes were conducted until 1959, when the stake network was extended to about 40 stakes.
Huss and Bauder (2009) compiled and homogenized all existing measurements of stake 5 to a
continuous time series 1914-2007 of seasonal resolution (see Section 4.10 in volume 127/128).
Determination of volumetric changes in decadal resolution reach further back to 1892 (Bauder
et al., 2007). Topographic maps and photogrammetrical surveys exist for 1892, 1938, 1959,
1973, 1986, 1994, 2003 and 2007. Huss et al. (2009) reanalyzed and homogenized the seasonal
stake data and ice volume changes for the period 1959-2007. Results of the mean specific winter
and annual balance with associated area, ELA and AAR values for comparable fixed time periods
have been reported in Section 4.9 of volume 125/126.
2600
2800
2800
3000
3000
1
2
3
45
6789
10
11
1213
15
16
17
18
8000
00
192000
8025
00
193000
01km
Figure 4.19: Surface topography and observational network of the Silvrettagletscher.
Investigations in 2009/10
The measurement period extended from 26th September 2009 to 11th September 2010. The winter
mass balance was determined during a field visit in spring on 22nd May 2010. Snow depth samples
49

The Swiss Glaciers 2009/10 and 2010/11
were collected at 343 locations and supplemented by two density profiles from snow pits. At the
time of the measurements in autumn 2010, large sections of the glacier were covered with fresh
snow. The snowline at the end of summer reached an elevation of 2850m asl. Measurements
from 15 stakes and a density profile were available for determining the annual mass balance.
Silvrettagletscher covered with fresh snow at the time of the field survey in September
2010 (Photo: A. Bauder)
Investigations in 2010/11
The measuring period was from 11th September 2010 to 11th September 2011. During a spring
field visit on 22nd April 2011, snow samples from about 170 individual points were collected.
Density profiles were acquired at two locations in snow pits. In September the glacier was almost
completely free of snow accumulated during winter. Only a few patches in hollows and on steep
shaded slopes survived the summer and no density measurements were possible. Measurements
were available from 16 stakes for determining the annual mass balance.
50

4. Mass Balance
1960 1980 2000
−2
−1
0
1
Mas
s b
alan
ce (
m w
.e.)
−15
−10
−5
0
Cum
ulat
ive
mas
s b
alan
ce (
m w
.e.)
Figure 4.20: Silvrettagletscher - Mean specific annual balance (bars) and cumulative
annual balance (line) for the period 1959-2011.
Table 4.15: Silvrettagletscher - Specific winter and annual balance versus altitude in the
two periods 2009/10 and 2010/11 evaluated for the exact measurement
period defined by the dates of field survey.
Altitude 2009/10 2010/11
area bw ba area bw ba(m a.s.l.) (km2) (mm w.e.) (mm w.e.) (km2) (mm w.e.) (mm w.e.)
2400 - 2500 0.023 1417 −2027 0.023 967 −2854
2500 - 2600 0.362 1366 −1512 0.362 949 −2754
2600 - 2700 0.407 1443 −900 0.404 1001 −1740
2700 - 2800 0.698 1372 −527 0.676 1053 −1397
2800 - 2900 0.583 1382 −46 0.576 1063 −1065
2900 - 3000 0.580 1310 245 0.583 1067 −722
3000 - 3100 0.136 1205 355 0.117 923 −609
2400 - 3100 2.789 1363 −417 2.741 1030 −1392
51

The Swiss Glaciers 2009/10 and 2010/11
Table 4.16: Silvrettagletscher - Individual stake measurements of winter and annual bal-
ance.
stake period coordinates mass balance
start spring end bw ba(m / m / m a.s.l.) (mm w.e.)
01 27.09.2009 22.05.2010 11.09.2010 801851 / 191728 / 2983 1282 865
02 26.09.2009 22.05.2010 11.09.2010 801916 / 192030 / 2954 1348 397
03 26.09.2009 22.05.2010 11.09.2010 801787 / 192297 / 2891 1383 1272
04 26.09.2009 23.05.2010 11.09.2010 801745 / 192633 / 2821 1273 366
05 27.09.2009 23.05.2010 12.09.2010 801069 / 192691 / 2718 1417 −558
06 25.09.2009 23.05.2010 12.09.2010 800524 / 192887 / 2622 1225 −1440
07 25.09.2009 23.05.2010 12.09.2010 800171 / 192871 / 2573 1469 −1557
08 25.09.2009 23.05.2010 12.09.2010 799823 / 192733 / 2529 1510 −1458
09 25.09.2009 23.05.2010 12.09.2010 799666 / 192731 / 2497 1387 −2115
10 27.09.2009 22.05.2010 11.09.2010 801526 / 191808 / 2937 1197 10
11 25.09.2009 23.05.2010 11.09.2010 800727 / 192201 / 2724 1360 −675
12 27.09.2009 23.05.2010 12.09.2010 800405 / 192582 / 2597 1357 −1386
13 25.09.2009 23.05.2010 12.09.2010 799947 / 192611 / 2543 1220 −2151
15 26.09.2009 22.05.2010 11.09.2010 801164 / 191987 / 2856 1115 −711
16 25.09.2009 23.05.2010 11.09.2010 801333 / 192373 / 2767 1153 −927
17 26.09.2009 23.05.2010 12.09.2010 801454 / 192817 / 2776 1113 −621
18 25.09.2009 23.05.2010 11.09.2010 800760 / 192544 / 2690 1508 −639
01 11.09.2010 21.04.2011 11.09.2011 801840 / 191729 / 2981 1159 −414
02 11.09.2010 22.04.2011 11.09.2011 801927 / 192023 / 2956 1176 −318
03 11.09.2010 22.04.2011 11.09.2011 801786 / 192292 / 2893 1242 −276
04 11.09.2010 22.04.2011 11.09.2011 801743 / 192633 / 2820 900 −1314
05 12.09.2010 22.04.2011 11.09.2011 801076 / 192689 / 2719 1006 −1458
06 12.09.2010 22.04.2011 11.09.2011 800515 / 192890 / 2620 905 −2232
07 12.09.2010 22.04.2011 11.09.2011 800169 / 192871 / 2571 1037 −2511
08 12.09.2010 21.04.2011 11.09.2011 799821 / 192733 / 2527 914 −2268
09 12.09.2010 11.09.2011 799665 / 192731 / 2494 −3060
10 11.09.2010 21.04.2011 11.09.2011 801513 / 191815 / 2935 1086 −1362
11 11.09.2010 21.04.2011 11.09.2011 800726 / 192202 / 2723 926 −1620
12 12.09.2010 21.04.2011 11.09.2011 800406 / 192587 / 2596 934 −2448
13 12.09.2010 21.04.2011 11.09.2011 799949 / 192612 / 2541 754 −3492
15 11.09.2010 21.04.2011 11.09.2011 801160 / 191989 / 2854 905 −1638
17 12.09.2010 22.04.2011 11.09.2011 801451 / 192818 / 2775 947 −1665
18 11.09.2010 21.04.2011 11.09.2011 800754 / 192546 / 2688 894 −1620
52
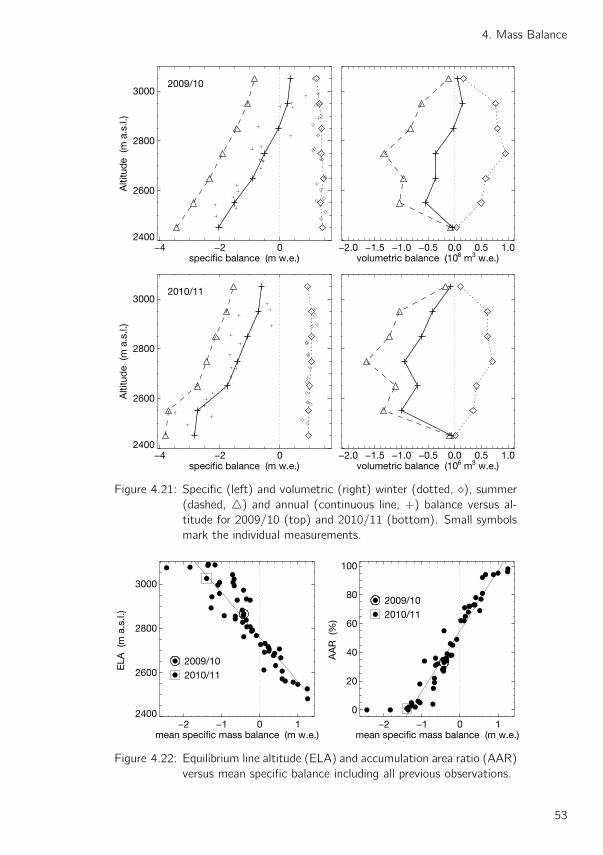
4. Mass Balance
−4 −2 0specific balance (m w.e.)
2400
2600
2800
3000
Alti
tud
e (m
a.s
.l.)
2009/10
−2.0 −1.5 −1.0 −0.5 0.0 0.5 1.0volumetric balance (106 m3 w.e.)
−4 −2 0specific balance (m w.e.)
2400
2600
2800
3000
Alti
tud
e (m
a.s
.l.)
2010/11
−2.0 −1.5 −1.0 −0.5 0.0 0.5 1.0volumetric balance (106 m3 w.e.)
Figure 4.21: Specific (left) and volumetric (right) winter (dotted, ⋄), summer
(dashed, △) and annual (continuous line, +) balance versus al-
titude for 2009/10 (top) and 2010/11 (bottom). Small symbols
mark the individual measurements.
−2 −1 0 1mean specific mass balance (m w.e.)
2400
2600
2800
3000
ELA
(m
a.s
.l.)
2009/102010/11
−2 −1 0 1mean specific mass balance (m w.e.)
0
20
40
60
80
100
AA
R (
%)
2009/102010/11
Figure 4.22: Equilibrium line altitude (ELA) and accumulation area ratio (AAR)
versus mean specific balance including all previous observations.
53

The Swiss Glaciers 2009/10 and 2010/11
4.11 Glacier de Tsanfleuron
Introduction
Glacier de Tsanfleuron is a well-accessible medium-sized glacier at the border between the cantons
of Valais and Vaud. The glacier currently has an area of 3.28 km2 and exhibits relatively small
surface slopes. Glaciological investigations were started in 2009 with the aim of establishing a
mass balance monitoring program in the Western Swiss Alps. In addition, measurements are also
performed on the very small Glacier du Sex Rouge connected to Tsanfleuron in the accumulation
area. This permits comparing the mass balance response of neighbouring glaciers of different size
and characteristics.
2900
2800
2800
2800
2700
2700
2600
1
2
4
5
6
5820
00
130500
5850
00
129000
01km
Figure 4.23: Surface topography and observational network of the Glacier de Tsanfleu-
ron.
Investigations in 2009/10
The winter mass balance observations on Glacier de Tsanfleuron were conducted on April 7th,
2010. Snow probings at 34 locations were performed and snow density was determined in a snow
pit. On average, roughly 3 meters of snow were recorded. Simultaneously, the ice thickness
was measured using a ground penetrating radar system. In a mid-summer field survey on 28th
July 2010 two stakes were re-drilled. On September 21st, 2010 a negative mass balance for the
measurement period since October 31st, 2009 was found at all four measurement sites. All stakes
were re-installed. At the end of the ablation season the glacier was completely snow-free and mass
loss was considerable.
54

4. Mass Balance
Table 4.17: Glacier de Tsanfleuron - Specific winter and annual balance versus altitude in
the two periods 2009/10 and 2010/11 evaluated for the exact measurement
period defined by the dates of field survey.
Altitude 2009/10 2010/11
area bw ba area bw ba(m a.s.l.) (km2) (mm w.e.) (mm w.e.) (km2) (mm w.e.) (mm w.e.)
2500 - 2600 0.098 1090 −1753 0.098 975 −4356
2600 - 2700 0.497 1062 −1435 0.497 1106 −3357
2700 - 2800 1.143 1084 −955 1.143 1219 −2323
2800 - 2900 0.964 1075 −546 0.964 1183 −1674
2900 - 3000 0.050 954 −380 0.050 1068 −1228
2500 - 3000 2.752 1075 −917 2.752 1175 −2336
Investigations in 2010/11
During the winter field survey on April 10th, 2011 probings of the snow depth at 154 locations
distributed over the entire glacier were realized and snow density was determined in a snow pit.
The below average winter snow cover and the warm and dry weather conditions contributed to an
early depletion of the winter snow cover and resulted in extreme ice ablation. On 26th September
2011 ablation readings were obtained for three stakes. Unfortunately, two stakes were lost due to
the unexpectedly high melt. Even for the highest regions of Glacier du Tsanfleuron, a mass loss
of more than 1 m water equivalent was found.
Table 4.18: Glacier de Tsanfleuron - Individual stake measurements of winter and annual
balance.
stake period coordinates mass balance
start spring end bw ba(m / m / m a.s.l.) (mm w.e.)
1 31.10.2009 07.04.2010 21.09.2010 582846 / 130336 / 2818 1190 −350
2 31.10.2009 07.04.2010 21.09.2010 582917 / 129534 / 2857 1070 −420
4 31.10.2009 21.09.2010 583979 / 130332 / 2727 −960
5 31.10.2009 21.09.2010 584276 / 130051 / 2685 −1500
4 21.09.2010 10.04.2011 26.09.2011 583979 / 130332 / 2727 1200 −2590
5 21.09.2010 10.04.2011 26.09.2011 584276 / 130051 / 2685 1200 −3040
6 21.09.2010 10.04.2011 26.09.2011 584741 / 130343 / 2603 1120 −3720
55

The Swiss Glaciers 2009/10 and 2010/11
−4 −2 0specific balance (m w.e.)
2500
2600
2700
2800
2900
3000
Alti
tud
e (m
a.s
.l.)
2009/10
−5 −4 −3 −2 −1 0 1 2volumetric balance (106 m3 w.e.)
−4 −2 0specific balance (m w.e.)
2500
2600
2700
2800
2900
3000
Alti
tud
e (m
a.s
.l.)
2010/11
−5 −4 −3 −2 −1 0 1 2volumetric balance (106 m3 w.e.)
Figure 4.24: Specific (left) and volumetric (right) winter (dotted, ⋄), summer
(dashed, △) and annual (continuous line, +) balance versus al-
titude for 2009/10 (top) and 2010/11 (bottom). Small symbols
mark the individual measurements.
56

4. Mass Balance
4.12 Claridenfirn
Introduction
Measurements of the snow and firn accumulation and melt, as well as of precipitation values
in the accumulation area of the Claridenfirn, have been undertaken by various researchers since
1914. The traditional glaciological method was applied by digging a snowpit down to the layer of
ochre applied the previous autumn and measuring the water equivalents. Specific annual balances
were determined every autumn since 1957 and also regularly in spring at two plateau locations at
altitudes of 2700 and 2900 m a.s.l. The reports dealing with the years 1914 to 1978 are published
in Kasser et al. (1986). The method of measurement and the results from the period 1914-1984
are published in Muller and Kappenberger (1991). A further update of the measurements until
2007 allowed Huss and Bauder (2009) to separate accumulation and melt and to interpret the
entire time series in terms of climatic influences (see Section 4.10 in volume 127/128).
2900
2900
2800
2700
2600
2800
2800
2700
2700
2700
26002600
3000
lower
upper
190000
7110
00
189000
7130
00
01km
Figure 4.25: Surface topography and observational network of the Claridenfirn.
57

The Swiss Glaciers 2009/10 and 2010/11
Investigations in 2009/10
The spring measurements were taken on 23rd May. Detailed observations in a snow pit at the upper
stake were supplemented by 10-20 snow depth samples in the vicinity of the stake. During the warm
month of April considerable melt occurred at the surface and several ice lenses provided evidence
of percolation into the accumulated layer. Temperatures were still slightly below freezing only at
the greatest depths and indicated that mass losses had not yet occurred. Autumn measurements
were carried out on 6th September. At the lower site, snow accumulation during winter had melted
completely, while at the upper site, approx. 35 cm of snow had accumulated since maximum melt-
out in August. In addition to the snow pits and depth probing, two precipitation storage gauges
were monitered and readings taken during spring and fall visits at Claridenhutte and Geissbutzistock.
Investigations in 2010/11
The investigations included snow depth measurements at both stakes, snow pit measurements in
spring and fall at the upper site, stake readings, and determination of the position using a small
theodolite in fall. The spring field survey was carried out on 1st May, and the late summer survey
on 3rd September. In May, percolation of meltwater extended only as far as the upper third, while
ice lenses were less clearly visible than in the previous year. The accumulated snow from the winter
season was completely melted at both sites by early September. This has very rarely been observed
at the upper site since observations began nearly 100 years ago.
Table 4.19: Claridenfirn - Individual stake measurements of winter and annual balance.
stake period coordinates mass balance
start spring end bw ba(m / m / m a.s.l.) (mm w.e.)
lower 13.09.2009 23.05.2010 06.09.2010 712245 / 190388 / 2700 1135 −338
upper 13.09.2009 23.05.2010 06.09.2010 710598 / 189141 / 2900 1648 886
lower 06.09.2010 01.05.2011 03.09.2011 712245 / 190388 / 2700 939 −1498
upper 06.09.2010 01.05.2011 03.09.2011 710598 / 189141 / 2900 1307 −189
58

4. Mass Balance
Mas
s b
alan
ce (
m w
.e.)
1920 1940 1960 1980 2000
−4
−2
0
2
Annual balance
Winter balance
Summer balance
lower C
umul
ated
dev
iatio
ns (
m w
.e.)
1920 1940 1960 1980 2000
0
5
10
Figure 4.26: Mass balance (top) and cumulated deviation changes (bottom) of the lower
stake on Claridenfirn over the whole observation period. The gray shaded
area highlights the years of the current report.
59
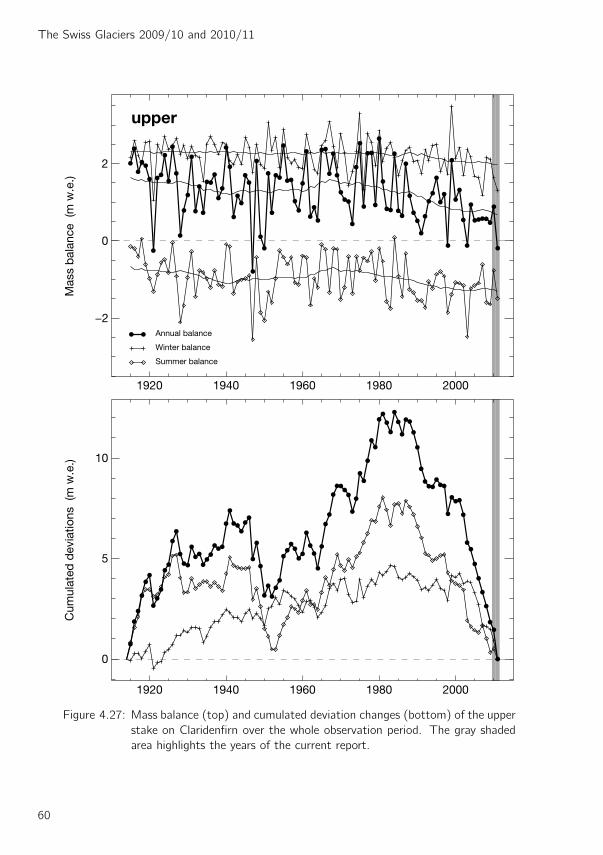
The Swiss Glaciers 2009/10 and 2010/11
Mas
s b
alan
ce (
m w
.e.)
1920 1940 1960 1980 2000
−2
0
2
Annual balance
Winter balance
Summer balance
upper
Cum
ulat
ed d
evia
tions
(m
w.e
.)
1920 1940 1960 1980 2000
0
5
10
Figure 4.27: Mass balance (top) and cumulated deviation changes (bottom) of the upper
stake on Claridenfirn over the whole observation period. The gray shaded
area highlights the years of the current report.
60

4. Mass Balance
4.13 Grosser Aletsch (Jungfraufirn)
Introduction
Grosser Aletschgletscher is the largest ice mass in the Alps and borders to the main northern
Alpine crest. The three main tributaries merge at the Konkordiaplatz and form the common
tongue which extends southwards for about 15 km. Starting in 1918, the first stake was installed
at 3350 m a.s.l. on Jungfraufirn and snow accumulation and annual mass balance was measured
almost continuously at P3 (Figure 4.28). Huss and Bauder (2009) compiled and homogenized
all existing measurements to a continuous time series of seasonal resolution (see Section 4.10 in
volume 127/128).
3000
3500
3500
3500
3500
3500
35003000
3500P3
6390
00
156000
6390
00
138000
6490
00
138000
05km
Figure 4.28: Surface topography and observational network of the Grosser
Aletschgletscher.
61

The Swiss Glaciers 2009/10 and 2010/11
Investigations in 2009/10
The investigations consisted of snow depth measurements and density profiling using a firn drill
in spring and fall. This program was supplemented by stake readings approx. twice a month.
The measurements were taken in spring on 29th May and in fall on 10th September. The layer of
winter accumulation included 1-2 not very distinct ice lenses detectable by snow depth probing. The
distinct surface crust present during the previous fall could be identified clearly at both measurement
events in May and October. In addition, the position of the stake was surveyed using a high-
precision differential GPS.
Investigations in 2010/11
The same set of measurements was conducted as in the previous period. The spring field survey
was carried out on 18th May and the fall survey on 17th October. Snow depth measurement and
firn coring in May showed a homogeneous layer of winter accumulation with no distinct ice lenses.
Corresponding measurements from stake readings, firn drilling, and snow depth measurements all
delivered similar results. A surface crust and a distinct horizon at 1m depth representing the
summer melt surface were present in October.
Table 4.20: Aletsch - Individual stake measurements of winter and annual balance.
stake period coordinates mass balance
start spring end bw ba(m / m / m a.s.l.) (mm w.e.)
P3 06.10.2009 29.05.2010 21.09.2010 641821 / 154818 / 3342 2054 2029
P3 21.09.2010 18.05.2011 17.10.2011 641821 / 154818 / 3343 1846 1624
62

5 Velocity
5.1 Introduction
On some specific glaciers (Figure 5.1) long-term investigations are carried out with measurements
of the ice flow velocity. The VAW/ETHZ has been contracted by two hydro-electric power com-
panies Kraftwerke Mattmark, and Force Motrice de Mauvoisin SA to survey the glaciers in the
operated catchments. The main objective of this research assignment is to observe the flow condi-
tions of the glaciers, particularly with regard to their potential threat to the buildings and operation
of the power station in the valley. The observations are mainly focused on the two glaciers Gietro
and Corbassiere in the Mauvoisin area (Val de Bagnes) and the two glaciers Allalin and Schwarzberg
in the Mattmark area (Saastal).
Allalin
SchwarzbergCorbassière
Giétro
Figure 5.1: Investigated glaciers for velocity measurements.
63

The Swiss Glaciers 2009/10 and 2010/11
5.2 Glacier du Gietro
Introduction
One of the longest measurement series in existence, for Glacier du Gietro (Figure 5.2) in Val
de Bagnes (Valais), is being continued by VAW/ETHZ under contract of the Force Motrice de
Mauvoisin SA. The aim of these annual observations is the early recognition of glacier break-off,
which can endanger the dammed lake located below it. The measurements, which have been
carried out for more than 40 years, include periods of glacier growth and recession (VAW, 1997,
1998; Bauder et al., 2002; Raymond et al., 2003).
3400
3400
3400 3600
3200
3000
2800
1
2
4
5
6
8
10
5980
00
95000
5940
00
93000
01km
Figure 5.2: Surface topography and observational network of the Glacier du Gietro.
Figure 5.3 shows the velocity mesurements at 7 stakes along the central flow line of the glacier,
taken since 1966. There are 3 distinct periods: in the first (1966-1976), the velocities in the
accumulation area (stakes 1, 2 and 4) are approximately 5-20 m per year, in the central region of
the glacier (stake 5) about 35 m per year and in the steep tongue area (stakes 6, 8 and 10) they
are in the range of 50-90 m annually. The second period (1977 to 1982) is marked by a distinct
acceleration phase, in which the speeds (for example at stake 6) increase from 90-120 m per year.
64

5. Velocity
From the middle of the 1980s onward, the velocities decrease sharply again and in the last years
have reached the lowest values measured since 1966.
Investigations in 2009/10 and in 2010/11
Seven stakes provided measurements of velocity and local mass balance. The field survey in late
summer 2010 was carried out on 1st September. At the end of August melt had occurred over
almost the entire extent of the firn plateau, and of the snow accumulated during winter only a few
thin patches were left. On 30th August 2011, the field measurements were taken for the second
period. Again the melt extent reached the entire firn plateau and at all stakes mass losses were
recorded.
Table 5.1: Glacier du Gietro - Individual measurements of annual flow velocity and thick-
ness change
stake period coordinates thickness change velocity
start end (m / m / m a.s.l.) (m) (m a−1)
P1 07.09.2009 01.09.2010 596143 / 92346 / 3310 −0.76 3.32
P1 01.09.2010 30.08.2011 596143 / 92346 / 3310 3.37
P2 07.09.2009 01.09.2010 596605 / 92835 / 3255 −0.70 9.40
P2 01.09.2010 30.08.2011 596605 / 92835 / 3255 9.29
P4 07.09.2009 01.09.2010 596211 / 93400 / 3195 −0.54 13.77
P4 01.09.2010 30.08.2011 596211 / 93400 / 3195 13.25
P5 07.09.2009 01.09.2010 595615 / 94303 / 3060 −0.97 20.86
P5 01.09.2010 30.08.2011 595615 / 94303 / 3060 −2.05 17.45
P6 07.09.2009 01.09.2010 594568 / 94497 / 2830 30.45
P6 01.09.2010 30.08.2011 594568 / 94497 / 2830 27.31
P8 07.09.2009 01.09.2010 594327 / 94268 / 2670 −7.99 4.92
P8 01.09.2010 30.08.2011 594327 / 94268 / 2670
P10 07.09.2009 01.09.2010 594270 / 94250 / 2660 0.85
P10 01.09.2010 30.08.2011 594270 / 94250 / 2660
Velocity in 2009/10 and in 2010/11
Due to the glacier retreat with complete icemelt at the glacier snout, the two lowest sites had
to be abandoned. The ongoing decrease in speed was more pronounced at the lower sites (P4 -
P6) with higher values than on the flat area of the firn plateau (P1 - P2). This stems from the
significant reduction in the ice thickness over the past several years.
65

The Swiss Glaciers 2009/10 and 2010/11
0
20
40
60
80
100
120
flow
vel
ocity
(m
a−
1 )
0
20
40
60
80
100
120
P1 P2 P4 P5 P6 P8 P10
1970 1980 1990 2000 2010−50
0
50
100
150
200
thic
knes
s ch
ange
(m
)
1970 1980 1990 2000 2010−50
0
50
100
150
200
Figure 5.3: Annual flow velocities (top) and thickness change (bottom) of the Glacier
du Gietro at all 7 stakes. Note the gaps that hamper the interpretation of
the total thickness change. The gray shaded area highlights the years of the
current report.
66
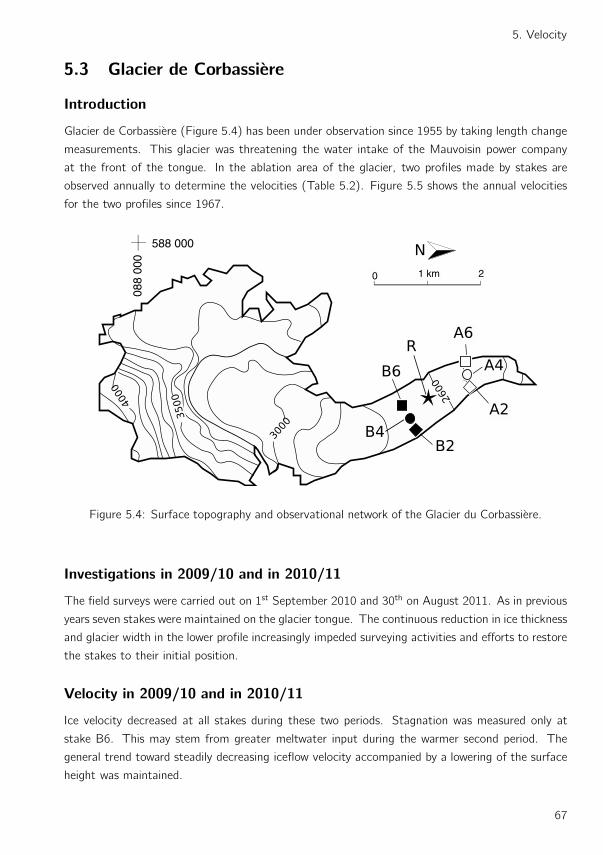
5. Velocity
5.3 Glacier de Corbassiere
Introduction
Glacier de Corbassiere (Figure 5.4) has been under observation since 1955 by taking length change
measurements. This glacier was threatening the water intake of the Mauvoisin power company
at the front of the tongue. In the ablation area of the glacier, two profiles made by stakes are
observed annually to determine the velocities (Table 5.2). Figure 5.5 shows the annual velocities
for the two profiles since 1967.
Figure 5.4: Surface topography and observational network of the Glacier du Corbassiere.
Investigations in 2009/10 and in 2010/11
The field surveys were carried out on 1st September 2010 and 30th on August 2011. As in previous
years seven stakes were maintained on the glacier tongue. The continuous reduction in ice thickness
and glacier width in the lower profile increasingly impeded surveying activities and efforts to restore
the stakes to their initial position.
Velocity in 2009/10 and in 2010/11
Ice velocity decreased at all stakes during these two periods. Stagnation was measured only at
stake B6. This may stem from greater meltwater input during the warmer second period. The
general trend toward steadily decreasing iceflow velocity accompanied by a lowering of the surface
height was maintained.
67

The Swiss Glaciers 2009/10 and 2010/11
0
20
40
60
80
flow
vel
ocity
(m
a−
1 )
0
20
40
60
80
B2 B4 B6 R A2 A4 A6
1970 1980 1990 2000 2010−60
−40
−20
0
20
thic
knes
s ch
ange
(m
)
1970 1980 1990 2000 2010−60
−40
−20
0
20
Figure 5.5: Annual flow velocities (top) and thickness change (bottom) of the Glacier
de Corbassiere at two profiles with 3 stakes each and the additional stake in
between. The gray shaded area highlights the years of the current report.
68

5. Velocity
Table 5.2: Glacier de Corbassiere - Individual measurements of annual flow velocity and
thickness change
stake period coordinates thickness change velocity
start end (m / m / m a.s.l.) (m) (m a−1)
B2 07.09.2009 01.09.2010 589577 / 93202 / 2650 −2.07 11.23
B2 01.09.2010 30.08.2011 589577 / 93202 / 2650 −3.26 10.78
B4 07.09.2009 01.09.2010 589392 / 93101 / 2650 −0.10 18.70
B4 01.09.2010 30.08.2011 589392 / 93101 / 2650 −4.35 18.17
B6 07.09.2009 01.09.2010 589230 / 93012 / 2655 −1.62 18.83
B6 01.09.2010 30.08.2011 589230 / 93012 / 2655 −3.34 18.98
R 07.09.2009 01.09.2010 589150 / 93650 / 2620 14.01
R 01.09.2010 30.08.2011 589150 / 93650 / 2620 −3.95 13.41
A2 07.09.2009 01.09.2010 588650 / 94315 / 2475 −4.06 9.52
A2 01.09.2010 30.08.2011 588650 / 94315 / 2475 8.48
A4 07.09.2009 01.09.2010 588450 / 94257 / 2460 7.56
A4 01.09.2010 30.08.2011 588450 / 94257 / 2460 −5.42 6.64
A6 07.09.2009 01.09.2010 588273 / 94207 / 2470 −4.10 2.02
A6 01.09.2010 30.08.2011 588273 / 94207 / 2470 −5.14 1.64
Glacier de Corbassiere in September 2010 (Photo: A. Bauder)
69

The Swiss Glaciers 2009/10 and 2010/11
5.4 Mattmark
Introduction
The first ice flow velocity and mass balance measurements in the Mattmark area date back to 1955
(VAW, 1999; Antoni, 2005). Investigations were carried out with a network of up to 22 stakes on
the glaciers Allalin, Hohlaub, Kessjen, Schwarzberg and Talliboden. Currently, measurements are
continued on 10 selected stakes as part of the investigations by VAW/ETHZ for the Mattmark
hydro-power company (Figure 5.6).
40003800
3600
3600
3400 3400
38003600
3400
3200
3000
3200
3200
3000
32003400
2800
100
101103
105
106
110
120
123
101000
6350
00
98000
6390
00
95000
6350
00
01km
Figure 5.6: Surface topography and observational network of the Mattmark glaciers.
Investigations in 2009/10
The measurement period at the stakes on Schwarzberggletscher, Hohlaub as well as those on
Allalingletscher began on 22nd September 2009 and ended on 13th September 2010. Results for
70

5. Velocity
horizontal flow velocity and thickness change for each glacier are given in Tables 5.3, 5.4 and 5.5.
The measurement period at the stakes on Schwarzberggletscher, Hohlaub as well as the on Allal-
ingletscher began on September 22nd, 2009 and ended on September 13th, 2010. The individual
results of the horizontal flow velocity and thickness change for each glacier are given in the Tables
5.3, 5.4 and 5.5.
0
20
40
60
80
100
flow
vel
ocity
(m
a−
1 )
0
20
40
60
80
100
100 101 103 105 106
1960 1980 2000−40
−20
0
20
thic
knes
s ch
ange
(m
)
1960 1980 2000−40
−20
0
20
Figure 5.7: Annual flow velocities (top) and thickness change (below) of the Allalin-
gletscher at 5 stakes. The gray shaded area highlights the years of the
current report.
71
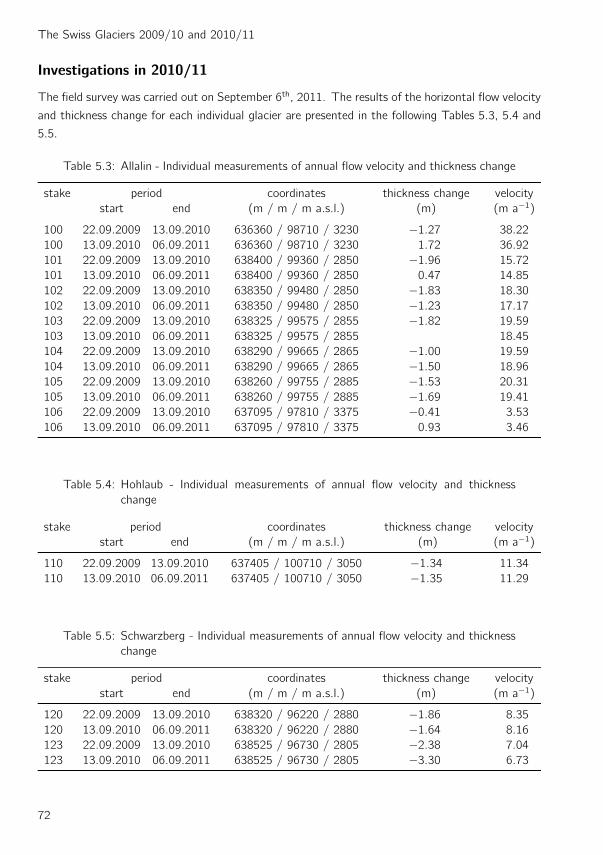
The Swiss Glaciers 2009/10 and 2010/11
Investigations in 2010/11
The field survey was carried out on September 6th, 2011. The results of the horizontal flow velocity
and thickness change for each individual glacier are presented in the following Tables 5.3, 5.4 and
5.5.
Table 5.3: Allalin - Individual measurements of annual flow velocity and thickness change
stake period coordinates thickness change velocity
start end (m / m / m a.s.l.) (m) (m a−1)
100 22.09.2009 13.09.2010 636360 / 98710 / 3230 −1.27 38.22
100 13.09.2010 06.09.2011 636360 / 98710 / 3230 1.72 36.92
101 22.09.2009 13.09.2010 638400 / 99360 / 2850 −1.96 15.72
101 13.09.2010 06.09.2011 638400 / 99360 / 2850 0.47 14.85
102 22.09.2009 13.09.2010 638350 / 99480 / 2850 −1.83 18.30
102 13.09.2010 06.09.2011 638350 / 99480 / 2850 −1.23 17.17
103 22.09.2009 13.09.2010 638325 / 99575 / 2855 −1.82 19.59
103 13.09.2010 06.09.2011 638325 / 99575 / 2855 18.45
104 22.09.2009 13.09.2010 638290 / 99665 / 2865 −1.00 19.59
104 13.09.2010 06.09.2011 638290 / 99665 / 2865 −1.50 18.96
105 22.09.2009 13.09.2010 638260 / 99755 / 2885 −1.53 20.31
105 13.09.2010 06.09.2011 638260 / 99755 / 2885 −1.69 19.41
106 22.09.2009 13.09.2010 637095 / 97810 / 3375 −0.41 3.53
106 13.09.2010 06.09.2011 637095 / 97810 / 3375 0.93 3.46
Table 5.4: Hohlaub - Individual measurements of annual flow velocity and thickness
change
stake period coordinates thickness change velocity
start end (m / m / m a.s.l.) (m) (m a−1)
110 22.09.2009 13.09.2010 637405 / 100710 / 3050 −1.34 11.34
110 13.09.2010 06.09.2011 637405 / 100710 / 3050 −1.35 11.29
Table 5.5: Schwarzberg - Individual measurements of annual flow velocity and thickness
change
stake period coordinates thickness change velocity
start end (m / m / m a.s.l.) (m) (m a−1)
120 22.09.2009 13.09.2010 638320 / 96220 / 2880 −1.86 8.35
120 13.09.2010 06.09.2011 638320 / 96220 / 2880 −1.64 8.16
123 22.09.2009 13.09.2010 638525 / 96730 / 2805 −2.38 7.04
123 13.09.2010 06.09.2011 638525 / 96730 / 2805 −3.30 6.73
72

6 The Swiss Glacier Inventory SGI2010
6.1 Background
The rapid mass loss and shrinkage of Swiss glaciers observed since the mid-1980s requires more
frequent updates of glacier inventories (every 5-10 years; Paul et al., 2007). The so far latest
glacier outlines for the Swiss Alps derived by Paul et al. (2011) based on 30m Landsat imagery
from 2003 and a semi-automatic mapping approach are thus already outdated. Moreover, use of
medium-resolution source data for glacier mapping yields qualitatively too poor results for change
assessments of small (<1.0 km2) glaciers. This is problematic for the Swiss Alps, where almost
90% of the individual glaciers belong to these size classes (Fischer et al., 2014). Therefore, the
fifth Swiss Glacier Inventory was recently compiled by manual digitization from high-resolution
(25 cm) aerial orthophotographs acquired between 2008 and 2011. A more detailed description of
the source data used and the methodologies applied for compilation of the new inventory, selected
aspects of glacier change assessment from 1973 to 2010, as well as an accuracy assessment is
given in Fischer et al. (2014). In the following, only some key aspects of the new inventory are
presented.
6.2 Previous glacier inventories
Digital glacier outlines for the first inventory of the entire Swiss Alps for the Little Ice Age (LIA)
maximum extent around 1850 were reconstructed from geomorphological or glacial historical evi-
dence and topographic maps of the ’Dufour’ and ’Siegfried’ atlas (Maisch et al., 2000). The second
Swiss Glacier Inventory 1973 (Muller et al., 1976) was derived from stereo-photogrammetric in-
terpretation of aerial imagery collected in September 1973, completed by Maisch et al. (2000) and
provided in finalized digital format by Paul (2003). A third inventory was created by applying a
threshold to a ratio of spectral bands (TM 4/TM 5) to extract glacier outlines from 30m Landsat
TM scenes acquired on 31 August 1998 and 13 September 1999 (Paul et al., 2007), and a forth
inventory applying a threshold to a ratio of bands TM 3/TM 5 of Landsat TM scenes acquired on
the 6 and 13 August 2003 (Paul et al., 2011).
73

The Swiss Glaciers 2009/10 and 2010/11
6.3 Mapping glacier outlines for the SGI2010
Based on the SWISSIMAGE Level 2 mosaic composed of high-resolution (25 cm) digital aerial
orthophotographs covering entire Switzerland (swisstopo, 2010), outlines of all Swiss glaciers were
manually digitized using a commercial Geographic Information System (GIS) software tool. For the
individual SWISSIMAGE tiles used, aerial photographs were taken on cloudless days and at the end
of the ablation season (September/October) between 2008 and 2011. Because 98% of the imagery
was acquired over only two hydrological years (autumn 2009 to autumn 2011) and most glacier
entities were mapped from source data of 2010, the inventory was not temporally homogenized
and named the Swiss Glacier Inventory 2010 (SGI2010). To avoid missing any glacierized surfaces
or erroneously mapping seasonal and/or perennial snow as glaciers, digital extents of the 1973
inventory were used as a reference or starting point. The hydrologically-based coding scheme of
the 1973 inventory (Muller et al., 1976; Maisch et al., 2000) was adopted for the SGI2010. This
allowed glacier-individual change assessments over the 37-year period of 1973-2010 (Figure 6.1).
Mapping by only one single expert ensured data consistency. The high level of visible detail and
structure, good contrast, the absence of clouds and particularly favorable snow conditions on the
25 cm orthoimagery used were in advantage of accurate glacier mapping even for the smallest
glacier size classes. However, mapping of highly debris-covered glacier ice was shown to remain
challenging even if based on high-resolution source data.
6.4 The new SGI2010 data set
According to the guidelines for the compilation of glacier inventory data from digital sources version
1.0 (Paul et al., 2010), the following parameters were derived for every glacier entity inventoried in
the new SGI2010 database: (1) identification (ID); (2) x- and y-point coordinates; (3) acquisition
date of the SWISSIMAGE tiles used; (4) surface area (km2); (5) length (km); (6) minimum, (7)
maximum, (8) mean, and (9) median elevation (m a.s.l.); (10) mean slope (degree); and (11) mean
aspect. Parameters (6) – (10) were calculated with the new 2m swissALTI3D digital elevation
model (swisstopo, 2013) of the same acquisition dates as for the source data of the SGI2010
glacier outlines. Glacier length was measured along an automatically derived center line following
Machguth and Huss (2014). The entire data set is available from the University of Fribourg, or
over the Global Land Ice Measurements from Space (GLIMS) database.
6.5 Observed changes in area and number 1973-2010
For the entire Swiss Alps, the total glacierized area mapped for 2010 is 944.3±24.1 km2, which
corresponds to a total area loss of 27.7% since 1973, when 1306.9 km2 were covered by glaciers.
In number, 733 glaciers (34%) have completely vanished since 1973, and 1420 glacier entities
remain by 2010 (Table 6.1, Figure 6.2a,b). Relative area changes between 1973 and 2010 vary
significantly for individual glaciers, but were generally highest for smallest glaciers and decreased
74

6. The Swiss Glacier Inventory SGI2010
Ü
0 1 2 3 4 5km
SGI2010
SGI1973
H
C
Br
Bi
L
Figure 6.1: Glacier changes in the Clariden / Todi area from 1973 to 2010. Underlain
are the 2010 SWISSIMAGE Level 2 tiles used for creation of 2010 glacier
outlines. Br is Brunni-, H Hufi-, C Clariden-, Bi Biferten- and L Limmernfirn.
towards largest glacier size classes (Figure 6.2c). The percentaged size-class distribution has hardly
changed since 1973 (Table 6.1). As in 1973, most of the glacierized area in the Swiss Alps belongs
to north-facing glaciers in 2010 (mean aspects NW-N-NE) (Figure 6.2d). The mean aspect class
SE has to be considered with care because it is strongly influenced by Grosser Aletschgletscher
(78.4 km2 in 2010). Relative changes in area and number are smallest for SE-exposed and highest
for W-exposed glaciers.
Area values for 1973 and 2010, relative area changes between 1973 and 2010, and 2010 length of
the 100 largest glaciers according to the SGI2010 and of all glaciers of the Swiss glacier monitoring
network are listed in Table 6.2. Three glaciers of the latter (Lischana, Talliboden and Val Torta) are
omitted as they were not inventoried in the SGI2010 anymore. All glaciers except for Hintersulzfirn,
a highly debris-covered small glacier situated in a very shadowy cirque, show negative area changes.
75
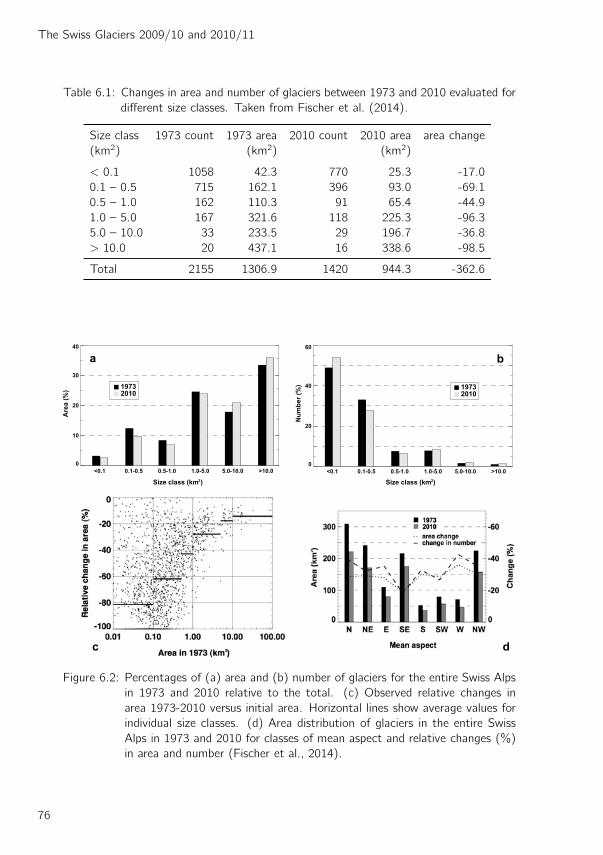
The Swiss Glaciers 2009/10 and 2010/11
Table 6.1: Changes in area and number of glaciers between 1973 and 2010 evaluated for
different size classes. Taken from Fischer et al. (2014).
Size class 1973 count 1973 area 2010 count 2010 area area change
(km2) (km2) (km2)
< 0.1 1058 42.3 770 25.3 -17.0
0.1 – 0.5 715 162.1 396 93.0 -69.1
0.5 – 1.0 162 110.3 91 65.4 -44.9
1.0 – 5.0 167 321.6 118 225.3 -96.3
5.0 – 10.0 33 233.5 29 196.7 -36.8
> 10.0 20 437.1 16 338.6 -98.5
Total 2155 1306.9 1420 944.3 -362.6
0
10
20
30
40
Are
a (%
)
<0.1 0.1-0.5 0.5-1.0 1.0-5.0 5.0-10.0 >10.0
19732010
a
Size class (km2)
0
20
40
60
Num
ber (
%)
<0.1 0.1-0.5 0.5-1.0 1.0-5.0 5.0-10.0 >10.0
Size class (km2)
19732010
b
c d
Figure 6.2: Percentages of (a) area and (b) number of glaciers for the entire Swiss Alps
in 1973 and 2010 relative to the total. (c) Observed relative changes in
area 1973-2010 versus initial area. Horizontal lines show average values for
individual size classes. (d) Area distribution of glaciers in the entire Swiss
Alps in 1973 and 2010 for classes of mean aspect and relative changes (%)
in area and number (Fischer et al., 2014).
76

6. The Swiss Glacier Inventory SGI2010
Table 6.2: Compilation of the 1973 and 2010 areas (A1973, A2010), relative area
changes (dA), current length (L2010) and year of image acquisition (Year)
of the 100 largest glaciers of the SGI2010 and of all glaciers included in the
Swiss glacier monitoring network.
Rank Name Canton A1973 A2010 dA L2010 Year
(km2) (km2) (%) (km)
1 Grosser Aletschgletscher VS 86.63 78.38 -9.52 23.58 2011
2 Gornergletscher VS 57.77 51.55 -10.77 13.43 2009
3 Fieschergletscher VS 32.65 29.48 -9.72 15.38 2011
4 Unteraargletscher VS 27.15 22.51 -17.09 12.62 2009
5 Oberaletschgletscher VS 21.62 17.47 -19.17 9.16 2011
6 Unterer Grindelwald BE 19.96 16.70 -16.33 8.05 2011
7 Findelengletscher VS 18.62 16.24 -12.81 7.47 2009
8 Rhonegletscher VS 17.44 15.31 -12.19 10.06 2010
9 Glacier de Corbassiere VS 16.18 15.22 -5.97 9.75 2010
10 Triftgletscher BE 17.18 14.91 -13.23 6.42 2010
11 Vadret da Morteratsch GR 16.79 14.87 -11.48 7.43 2009
12 Feegletscher VS 16.62 14.57 -12.29 4.59 2009
13 Zmuttgletscher VS 16.85 13.74 -18.48 7.87 2010
14 Glacier de Zinal VS 15.70 13.36 -14.90 7.29 2010
15 Hufifirn UR 13.77 12.72 -7.60 7.15 2010
16 Glacier d’Otemma VS 16.64 12.59 -24.33 7.07 2010
17 Kanderfirn BE 13.76 12.23 -11.11 6.28 2011
18 Gauligletscher BE 13.76 11.40 -17.13 6.38 2010
19 Glacier du Mont Mine VS 11.09 9.91 -10.72 5.44 2010
20 Allalingletscher VS 9.98 9.17 -8.11 6.77 2009
21 Glacier de Ferpecle VS 9.90 9.01 -9.04 6.07 2010
22 Oberer Grindelwaldgletscher BE 9.42 8.42 -10.65 6.22 2009
23 Langgletscher VS 9.52 8.27 -13.18 6.39 2011
24 Riedgletscher VS 8.31 7.32 -11.92 5.33 2011
25 Glacier de la Plaine Morte BE 9.09 7.29 -19.74 3.73 2010
26 Steingletscher BE 8.81 7.28 -17.34 4.23 2010
27 Glacier du Breney VS 9.96 7.11 -28.63 6.25 2010
28 Mittelaletschgletscher VS 8.31 6.86 -17.49 5.33 2011
29 Vadret da Roseg GR 8.78 6.82 -22.41 3.72 2009
30 Glacier de Saleina VS 7.77 6.54 -15.79 6.40 2010
31 Vadrec del Forno GR 8.82 6.26 -29.08 5.80 2009
32 Glacier du Mont Durand VS 7.63 6.05 -20.65 5.50 2010
33 Glacier du Trient VS 6.40 5.82 -8.98 4.40 2010
34 Brungegggletscher VS 6.75 5.53 -18.17 4.72 2011
35 Glacier du Mont Collon VS 6.18 5.44 -12.1 5.11 2010
36 Rosenlauigletscher BE 6.14 5.40 -12.06 4.70 2009
37 Vadret da Palu GR 6.64 5.27 -20.64 2.54 2009
38 Glacier de Moming VS 6.36 5.26 -17.23 3.26 2010
39 Tschingelfirn BE 6.19 5.23 -15.53 4.13 2011
77

The Swiss Glaciers 2009/10 and 2010/11
Rank Name Canton A1973 A2010 dA L2010 Year
(km2) (km2) (%) (km)
40 Schwarzberggletscher VS 5.48 5.17 -5.58 4.11 2009
41 Glacier du Gietro VS 5.85 5.17 -11.68 4.45 2010
42 Turtmanngletscher VS 5.99 5.17 -13.73 5.87 2010
43 Vadret da Tschierva GR 7.03 5.09 -27.56 3.96 2009
44 Glacier de Moiry VS 5.77 4.90 -15.14 5.07 2010
45 Griesgletscher VS 6.43 4.79 -25.47 5.48 2009
46 Mellichgletscher VS 5.32 4.69 -11.79 3.11 2009
47 Hohlichtgletscher VS 5.51 4.36 -20.89 4.30 2010
48 Dammagletscher UR 5.16 4.25 -17.62 2.15 2010
49 Oberaargletscher BE 5.18 4.1 -20.85 4.83 2009
50 Ussre Baltschiedergletscher VS 4.84 3.85 -20.48 2.90 2011
51 Bisgletscher VS 4.81 3.83 -20.33 3.69 2010
52 Furgggletscher VS 5.37 3.79 -29.36 3.72 2010
53 Glacier de Cheillon VS 4.56 3.60 -20.91 3.83 2010
54 Haut Glacier d’Arolla VS 5.81 3.46 -40.46 3.69 2010
55 Stufesteigletscher BE 4.21 3.37 -20.00 3.24 2011
56 Hohberggletscher VS 3.45 3.20 -7.06 4.28 2009
57 Glacier de Tsidjiore Nouve VS 3.20 2.73 -14.64 5.00 2010
58 Breithorngletscher BE 3.42 2.71 -20.69 3.64 2011
59 Glatt Firn UR 3.05 2.71 -11.32 2.76 2010
60 Silvrettagletscher GR 3.25 2.68 -17.65 3.29 2008
61 Glacier de Tsanfleuron VS 3.81 2.65 -30.63 2.90 2010
62 Oberer Theodulgletscher VS 3.38 2.60 -23.16 2.75 2010
63 Bifertenfirn GL 2.89 2.52 -12.56 4.40 2010
64 Vadrec d’Albigna GR 3.76 2.50 -33.48 3.42 2009
65 Flachensteinfirn UR 3.09 2.46 -20.21 1.62 2010
66 Wildstrubelgletscher VS 3.34 2.34 -29.75 2.50 2010
67 Brunnifirn UR 3.02 2.31 -23.62 3.52 2010
68 Minstigergletscher VS 2.83 2.25 -20.41 3.11 2009
69 Blumlisalpgletscher BE 3.00 2.23 -25.60 2.47 2011
70 Claridenfirn GL 2.39 2.20 -7.67 2.93 2010
71 Alpjergletscher VS 3.04 2.17 -28.88 1.87 2011
72 Hohwanggletscher VS 2.54 2.15 -15.47 2.53 2010
73 Hohlaubgletscher VS 2.39 2.11 -12.06 3.65 2009
74 Bluemlisalpfirn UR 2.52 2.10 -16.55 2.33 2010
75 Triftgletscher (Zermatt) VS 2.46 2.04 -17.17 2.79 2010
76 Driestgletscher VS 2.39 2.03 -15.14 2.08 2011
77 Paradiesgletscher GR 4.57 2.02 -55.71 1.82 2009
78 Triftgletscher (Fiescher) VS 2.42 2.01 -17.04 2.96 2011
79 Tiefengletscher UR 3.20 2.00 -37.62 2.71 2010
80 Vadrec da Fedoz GR 2.57 1.97 -23.29 2.42 2009
81 Vadret da Grialetsch GR 3.24 1.92 -40.67 1.67 2009
82 Glacier de L’A Neuve VS 2.38 1.92 -19.45 1.83 2010
83 Glacier de Valsorey VS 2.36 1.91 -19.28 3.8 2010
78
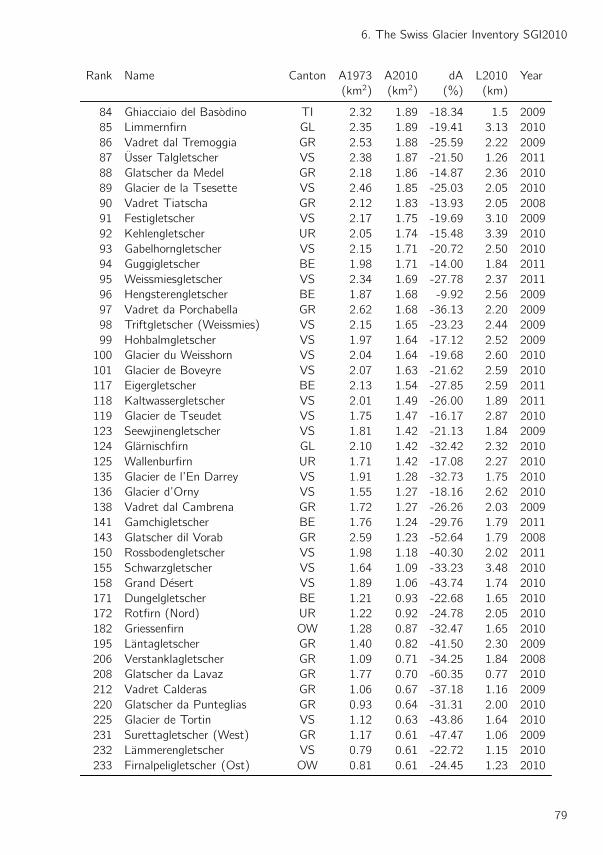
6. The Swiss Glacier Inventory SGI2010
Rank Name Canton A1973 A2010 dA L2010 Year
(km2) (km2) (%) (km)
84 Ghiacciaio del Basodino TI 2.32 1.89 -18.34 1.5 2009
85 Limmernfirn GL 2.35 1.89 -19.41 3.13 2010
86 Vadret dal Tremoggia GR 2.53 1.88 -25.59 2.22 2009
87 Usser Talgletscher VS 2.38 1.87 -21.50 1.26 2011
88 Glatscher da Medel GR 2.18 1.86 -14.87 2.36 2010
89 Glacier de la Tsesette VS 2.46 1.85 -25.03 2.05 2010
90 Vadret Tiatscha GR 2.12 1.83 -13.93 2.05 2008
91 Festigletscher VS 2.17 1.75 -19.69 3.10 2009
92 Kehlengletscher UR 2.05 1.74 -15.48 3.39 2010
93 Gabelhorngletscher VS 2.15 1.71 -20.72 2.50 2010
94 Guggigletscher BE 1.98 1.71 -14.00 1.84 2011
95 Weissmiesgletscher VS 2.34 1.69 -27.78 2.37 2011
96 Hengsterengletscher BE 1.87 1.68 -9.92 2.56 2009
97 Vadret da Porchabella GR 2.62 1.68 -36.13 2.20 2009
98 Triftgletscher (Weissmies) VS 2.15 1.65 -23.23 2.44 2009
99 Hohbalmgletscher VS 1.97 1.64 -17.12 2.52 2009
100 Glacier du Weisshorn VS 2.04 1.64 -19.68 2.60 2010
101 Glacier de Boveyre VS 2.07 1.63 -21.62 2.59 2010
117 Eigergletscher BE 2.13 1.54 -27.85 2.59 2011
118 Kaltwassergletscher VS 2.01 1.49 -26.00 1.89 2011
119 Glacier de Tseudet VS 1.75 1.47 -16.17 2.87 2010
123 Seewjinengletscher VS 1.81 1.42 -21.13 1.84 2009
124 Glarnischfirn GL 2.10 1.42 -32.42 2.32 2010
125 Wallenburfirn UR 1.71 1.42 -17.08 2.27 2010
135 Glacier de l’En Darrey VS 1.91 1.28 -32.73 1.75 2010
136 Glacier d’Orny VS 1.55 1.27 -18.16 2.62 2010
138 Vadret dal Cambrena GR 1.72 1.27 -26.26 2.03 2009
141 Gamchigletscher BE 1.76 1.24 -29.76 1.79 2011
143 Glatscher dil Vorab GR 2.59 1.23 -52.64 1.79 2008
150 Rossbodengletscher VS 1.98 1.18 -40.30 2.02 2011
155 Schwarzgletscher VS 1.64 1.09 -33.23 3.48 2010
158 Grand Desert VS 1.89 1.06 -43.74 1.74 2010
171 Dungelgletscher BE 1.21 0.93 -22.68 1.65 2010
172 Rotfirn (Nord) UR 1.22 0.92 -24.78 2.05 2010
182 Griessenfirn OW 1.28 0.87 -32.47 1.65 2010
195 Lantagletscher GR 1.40 0.82 -41.50 2.30 2009
206 Verstanklagletscher GR 1.09 0.71 -34.25 1.84 2008
208 Glatscher da Lavaz GR 1.77 0.70 -60.35 0.77 2010
212 Vadret Calderas GR 1.06 0.67 -37.18 1.16 2009
220 Glatscher da Punteglias GR 0.93 0.64 -31.31 2.00 2010
225 Glacier de Tortin VS 1.12 0.63 -43.86 1.64 2010
231 Surettagletscher (West) GR 1.17 0.61 -47.47 1.06 2009
232 Lammerengletscher VS 0.79 0.61 -22.72 1.15 2010
233 Firnalpeligletscher (Ost) OW 0.81 0.61 -24.45 1.23 2010
79

The Swiss Glaciers 2009/10 and 2010/11
Rank Name Canton A1973 A2010 dA L2010 Year
(km2) (km2) (%) (km)
245 Ammertengletscher BE 1.17 0.56 -52.58 1.78 2010
263 Vadrecc di Bresciana TI 0.86 0.48 -44.31 0.75 2009
272 Sardonagletscher SG 0.84 0.45 -45.68 0.64 2008
276 Geltengletscher BE 0.83 0.45 -45.57 0.84 2010
284 Ghiacciaio del Cavagnoli TI 1.33 0.43 -67.72 1.17 2009
296 Griessfirn UR 0.89 0.41 -53.77 0.55 2010
306 Vadret da Sesvenna GR 0.69 0.38 -44.35 0.97 2009
319 Muttgletscher VS 0.57 0.37 -35.76 1.01 2009
320 Glacier des Martinets VD 0.59 0.36 -37.68 1.06 2010
336 Plattalva GL 0.74 0.34 -54.04 0.93 2010
349 Ghiacciaio di Valleggia TI 0.59 0.31 -47.50 1.25 2009
355 Glacier de Pierredar VD 0.50 0.30 -39.96 0.42 2010
357 Glacier de Paneyrosse VD 0.46 0.30 -34.58 0.59 2010
386 Glacier du Sex Rouge VD 0.69 0.27 -60.8 0.64 2010
399 Hintersulzfirn GL 0.20 0.26 33.74 0.96 2010
406 Vedreit da Camp GR 0.56 0.26 -54.52 0.71 2009
451 St. Annafirn UR 0.44 0.22 -50.63 0.68 2010
458 Glacier du Prapio VD 0.28 0.21 -24.58 0.70 2010
459 Scalettagletscher GR 0.67 0.21 -68.55 0.78 2009
476 Kessjengletscher VS 0.60 0.19 -68.47 0.33 2009
590 Plan Neve VD 0.20 0.12 -40.41 0.34 2010
598 Ghiacciaio Grande di Croslina TI 0.35 0.12 -65.74 0.45 2009
627 Ghiacciaio del Corno TI 0.27 0.11 -59.95 0.57 2009
669 Pizolgletscher SG 0.29 0.09 -69.70 0.42 2008
737 Bella Tola Gletscher VS 0.25 0.07 -71.47 0.28 2010
846 Ofentalgletscher VS 0.41 0.05 -88.08 0.17 2009
80

References
Antoni, C. (2005). Langjahrige Messreihen in den Schweizer Alpen. Praktikumsararbeit ausgefuhrt
an der VAW, ETH Zurich, unter Anleitung von A. Bauder (unveroffentlicht).
Bauder, A., Funk, M., and Bosch, H. (2002). Glaziologische Untersuchungen am Glacier de
Gietro im Zusammenhang mit der Sicherheit der Stauanlage Mauvoisin. In Moderne Methoden
und Konzepte im Wasserbau, volume 175, (Band 2), pages 419–431. Mitteilung der Versuch-
sanstalt fur Wasserbau, Hydrologie und Glaziologie, ETH Zurich. Internationales Symposium
7.-9. Oktober 2002 in Zurich.
Bauder, A., Funk, M., and Huss, M. (2007). Ice volume changes of selected glaciers in the Swiss
Alps since the end of the 19th century. Annals of Glaciology, 46:145–149.
Begert, M., Schlegel, T., and Kirchhofer, W. (2005). Homogeneous temperature and precipitation
series of switzerland from 1864 to 2000. International Journal of Climatology, 25(1):65–80.
Evans, I. S. (2006). Glacier distribution in the Alps: Statistical modelling of altitude and aspect.
Geografiska Annaler, 88(2):115–133.
Finger, D., Hugentobler, A., Huss, M., Voinesco, A., Wernli, H., Fischer, D., Weber, E., Jeannin,
P.-Y., Kauzlaric, M., Wirz, A., Vennemann, T., Husler, F., Schadler, B., and Weingartner, R.
(2013). Identification of glacial melt water runoff in a karstic environment and its implication for
present and future water availability. Hydrology and Earth System Sciences, 17(8):3261–3277.
Firnberichte (1914–1978). Der Firnzuwachs 1913/14–1976/77 in einigen schweizerischen Firnge-
bieten, number 1-64 in Vierteljahrsschrift der Naturforschenden Gesellschaft in Zurich. Jahres-
berichte herausgegeben von der Gletscher-Kommission der Physikalischen Gesellschaft Zurich,
spater Schweizerische Meteorologische Zentralanstalt und ab 1973 durch A. Lemans.
Fischer, M., Huss, M., Barboux, C., and Hoelzle, M. (2014). The new swiss glacier inventory
SGI2010: Relevance of using high-resolution source data in areas dominated by very small
glaciers. Arctic, Antarctic, and Alpine Research, 46(4):933–945.
Hoelzle, M., Haeberli, W., Dischl, M., and Peschke, W. (2003). Secular glacier mass balances
derived from cumulative glacier length changes. Global and Planetary Change, 36(4):295–306.
Huss, M. (2010). Mass balance of pizolgletscher. Geographica Helvetica, 65(2):80–91.
81

The Swiss Glaciers 2009/10 and 2010/11
Huss, M. and Bauder, A. (2009). 20th-century climate change inferred from four long-term point
observations of seasonal mass balance. Annals of Glaciology, 50(50):207–214.
Huss, M., Bauder, A., and Funk, M. (2009). Homogenization of long-term mass-balance time
series. Annals of Glaciology, 50(50):198–206.
Huss, M., Sold, L., Hoelzle, M., Stokvis, M., Salzmann, N., Farinotti, D., and Zemp, M.
(2013). Towards remote monitoring of sub-seasonal glacier mass balance. Annals of Glaciology,
54(63):75–83.
Joerg, P. C., Morsdorf, F., and Zemp, M. (2012). Uncertainty assessment of multi-temporal
airborne laser scanning data: A case study on an Alpine glacier. Remote Sensing of Environment,
127:118–129.
Kasser, P., Aellen, M., and Siegenthaler, H. (1986). Clariden. In Die Gletscher der Schweizer
Alpen, 1977/78 und 1978/79, volume 99/100 of Glaziologisches Jahrbuch der Gletscherkom-
mission SNG, pages 142–148. Versuchsanstalt fur Wasserbau, Hydrologie und Glaziologie der
ETH Zurich.
Machguth, H. (2008). On the use of RCM data and gridded climatologies for regional scale glacier
mass balance modeling in high mountain topography : the example of the Swiss Alps. PhD
thesis, University of Zurich. 176 pp.
Machguth, H. and Huss, M. (2014). The length of the world’s glaciers – a new approach for the
global calculation of center lines. The Cryosphere, 8(5):1741–1755.
Maisch, M., Wipf, A., Denneler, B., Battaglia, J., and Benz, C. (2000). Die Gletscher der
Schweizer Alpen. vdf, Hochschulverlag AG an der ETH Zurich, Zurich, 2. edition. Schlussbericht
NFP31, 373 pp., ISBN 3 7281 2733 7.
Muller, F., Caflisch, T., and Muller, G. (1976). Firn und Eis der Schweizer Alpen: Gletscherinven-
tar. Publ. Nr. 57, Geographisches Institut der ETH Zurich, Zurich.
Muller, H. and Kappenberger, G. (1991). Claridenfirn-Messungen 1914-1984. Technical Report 40,
Zurcher Geographische Schriften, Geographisches Institut der ETH Zurich. pp. 79.
Ohmura, A., Bauder, A., Muller, H., and Kappenberger, G. (2007). Long-term change of mass
balance and the role of radiation. Annals of Glaciology, 46:367–374.
Paul, F. (2003). The New Swiss Glacier Inventory 2000. Application of Remote Sensing and GIS.
PhD thesis, University of Zurich. 192 pp.
Paul, F., Barry, R., Cogley, G., Frey, H., Haeberli, W., Ohmura, A., Ommanney, S., Raup, B.,
Rivera, A., and Zemp, M. (2010). Recommendations for the compilation of glacier inventory
data from digital sources. Annals of Glaciology, 50(53):119–126.
82

6. REFERENCES
Paul, F., Frey, H., and Bris, R. L. (2011). A new glacier inventory for the European Alps from
Landsat TM scenes of 2003: challenges and results. Annals of Glaciology, 52(59):144–152.
Paul, F., Maisch, M., Rothenbuhler, C., Hoelzle, M., and Haeberli, W. (2007). Calculation and
visualisation of future glacier extent in the swiss alps by means of hypsographic modelling. Global
and Planetary Change, 55(4):343–357.
Raymond, M., Wegmann, M., and Funk, M. (2003). Inventar gefahrlicher Gletscher in der Schweiz.
Mitteilungen 182, Versuchsanstalt fur Wasserbau, Hydrologie und Glaziologie der ETH Zurich,
Gloriastrasse 37-39, CH-8092 Zurich. pp. 368.
Sold, L., Huss, M., Hoelzle, M., Andereggen, H., Joerg, P. C., and Zemp, M. (2013). Methodolog-
ical approaches to infer end-of-winter snow distribution on alpine glaciers. Journal of Glaciology,
59(218):1047–1059.
swisstopo (2010). SWISSIMAGE The Digital Color Orthophotomosaic of Switzerland. Swiss
Federal Office of Topography. Product documentation.
swisstopo (2013). swissALTI3D. Swiss Federal Office of Topography. Ausgabebericht 2013.
VAW (1997). Gletscherveranderungen im Val de Bagnes 1966 – 1996. Untersuchungen im
Zusammenhang mit den Anlagen der Kraftwerke Mauvoisin AG. Zusammenfassend dargestellte
Hauptergebnisse der jahrlichen Messungen. Bericht Nr. 7903.55.04 (M. Aellen, unveroffentlicht).
Im Auftrag der Kraftwerke Mauvoisin AG.
VAW (1998). Mauvoisin – Gietrogletscher – Corbassieregletscher. Glaziologische Studien im
Zusammenhang mit den Stauanlagen Mauvoisin. Bericht Nr. 55.05.7903 (M. Funk, un-
veroffentlicht). Im Auftrag der Elektrizitatsgesellschaft Lauffenburg AG.
VAW (1999). Mattmark – Zusammenfassender Bericht uber die hydrologischen und glaziologis-
chen Messungen im Mattmarkgebiet. Bericht Nr. 7902.52.45 (H. Bosch und M. Funk, un-
veroffentlicht), Versuchsanstalt fur Wasserbau, Hydrologie und Glaziologie der ETH Zurich. Im
Auftrag der Kraftwerke Mattmark AG.
WGMS (2013). Glacier Mass Balance Bulletin No. 12, (2010–2011). ICSU(FAGS)–IUGG(IACS)–
UNEP–UNESCO–WMO, World Glacier Monitoring Service, Zurich.
83

Acknowledgements
The Cryospheric Commission again received solid support in this 131th/132th measuring period
from its reliable team of observers. Sincere thanks for their cooperation are extended to: the
forestry services from the cantons of Berne, Glarus, Grisons, Obwalden, St. Gallen, Uri, Ticino,
Vaud and Wallis, the staff of the hydro-power stations Aegina, Mattmark and, Mauvoisin, all the
individual helpers, the Aerial Photography Flying and Coordination Service (CCAP) of the Swiss
Federal Office of Topography swisstopo and Photogrammetrie Perrinjaquet AG (Gumligen). The
Laboratory of Hydraulics, Hydrology and Glaciology (VAW) of the ETH Zurich, colleagues from
the national weather service MeteoSwiss, the Geographical Institutes of the University of Fribourg
and Zurich provided valuable contributions to the publication of this glaciological report. Stephanie
Usselmann and Simon Steffen helped with preparing data and general information. A special vote
of thanks goes to Susan Braun-Clarke for translating and proof-reading the report.
84

A Remote Sensing
A.1 Aerial photographs
Aerial photographs were taken at periodic intervals in order to provide a baseline documentation for
various applications (mapping, glacier change, natural hazards, etc). In addition to the periodical
surveys conducted by the Swiss Federal Office of Topography (swisstopo), high resolution aerial
photographs have been acquired which are designed in particular for glaciological applications. In
addition to the aerial photographs listed in the following tables (A.1 and A.2), other aerial photos
for updating the National Maps are available from swisstopo. In the year 2010, pictures were taken
for the sheets 1:50’000 nos. 245, 246, 255, 256, 257, 258, 259, 262, 263, 268, 269, 272, 273,
282 and 283 and in 2011 for nos. 227, 247, 248, 249, 264, 265, 266, 267, 274, 275, 278 and
279. More detailed information is available on swisstopo’s webviewer http://www.luftbildindex.ch.
Figure A.1: Aerial photographs from the years 2010 and 2011.
85
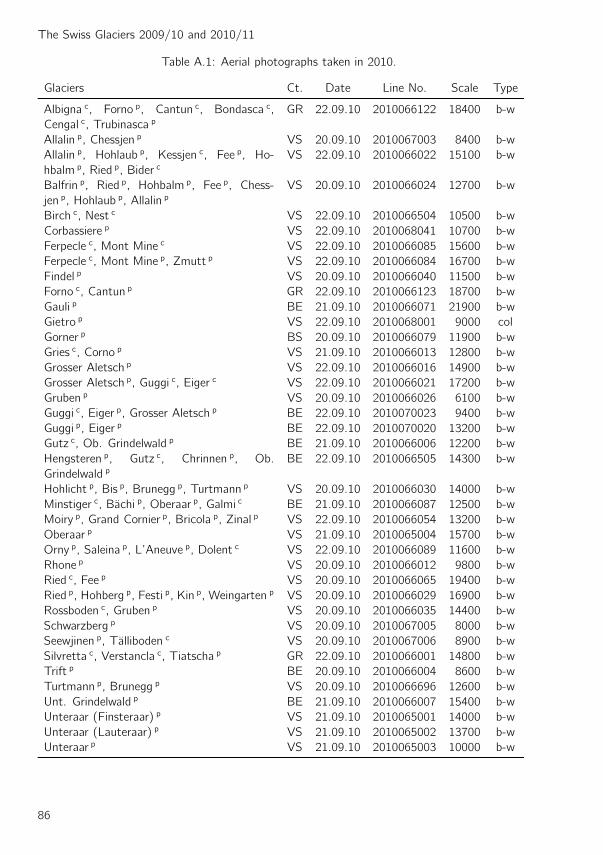
The Swiss Glaciers 2009/10 and 2010/11
Table A.1: Aerial photographs taken in 2010.
Glaciers Ct. Date Line No. Scale Type
Albigna c, Forno p, Cantun c, Bondasca c,
Cengal c, Trubinasca pGR 22.09.10 2010066122 18400 b-w
Allalin p, Chessjen p VS 20.09.10 2010067003 8400 b-w
Allalin p, Hohlaub p, Kessjen c, Fee p, Ho-
hbalm p, Ried p, Bider cVS 22.09.10 2010066022 15100 b-w
Balfrin p, Ried p, Hohbalm p, Fee p, Chess-
jen p, Hohlaub p, Allalin pVS 20.09.10 2010066024 12700 b-w
Birch c, Nest c VS 22.09.10 2010066504 10500 b-w
Corbassiere p VS 22.09.10 2010068041 10700 b-w
Ferpecle c, Mont Mine c VS 22.09.10 2010066085 15600 b-w
Ferpecle c, Mont Mine p, Zmutt p VS 22.09.10 2010066084 16700 b-w
Findel p VS 20.09.10 2010066040 11500 b-w
Forno c, Cantun p GR 22.09.10 2010066123 18700 b-w
Gauli p BE 21.09.10 2010066071 21900 b-w
Gietro p VS 22.09.10 2010068001 9000 col
Gorner p BS 20.09.10 2010066079 11900 b-w
Gries c, Corno p VS 21.09.10 2010066013 12800 b-w
Grosser Aletsch p VS 22.09.10 2010066016 14900 b-w
Grosser Aletsch p, Guggi c, Eiger c VS 22.09.10 2010066021 17200 b-w
Gruben p VS 20.09.10 2010066026 6100 b-w
Guggi c, Eiger p, Grosser Aletsch p BE 22.09.10 2010070023 9400 b-w
Guggi p, Eiger p BE 22.09.10 2010070020 13200 b-w
Gutz c, Ob. Grindelwald p BE 21.09.10 2010066006 12200 b-w
Hengsteren p, Gutz c, Chrinnen p, Ob.
Grindelwald pBE 22.09.10 2010066505 14300 b-w
Hohlicht p, Bis p, Brunegg p, Turtmann p VS 20.09.10 2010066030 14000 b-w
Minstiger c, Bachi p, Oberaar p, Galmi c BE 21.09.10 2010066087 12500 b-w
Moiry p, Grand Cornier p, Bricola p, Zinal p VS 22.09.10 2010066054 13200 b-w
Oberaar p VS 21.09.10 2010065004 15700 b-w
Orny p, Saleina p, L’Aneuve p, Dolent c VS 22.09.10 2010066089 11600 b-w
Rhone p VS 20.09.10 2010066012 9800 b-w
Ried c, Fee p VS 20.09.10 2010066065 19400 b-w
Ried p, Hohberg p, Festi p, Kin p, Weingarten p VS 20.09.10 2010066029 16900 b-w
Rossboden c, Gruben p VS 20.09.10 2010066035 14400 b-w
Schwarzberg p VS 20.09.10 2010067005 8000 b-w
Seewjinen p, Talliboden c VS 20.09.10 2010067006 8900 b-w
Silvretta c, Verstancla c, Tiatscha p GR 22.09.10 2010066001 14800 b-w
Trift p BE 20.09.10 2010066004 8600 b-w
Turtmann p, Brunegg p VS 20.09.10 2010066696 12600 b-w
Unt. Grindelwald p BE 21.09.10 2010066007 15400 b-w
Unteraar (Finsteraar) p VS 21.09.10 2010065001 14000 b-w
Unteraar (Lauteraar) p VS 21.09.10 2010065002 13700 b-w
Unteraar p VS 21.09.10 2010065003 10000 b-w
86
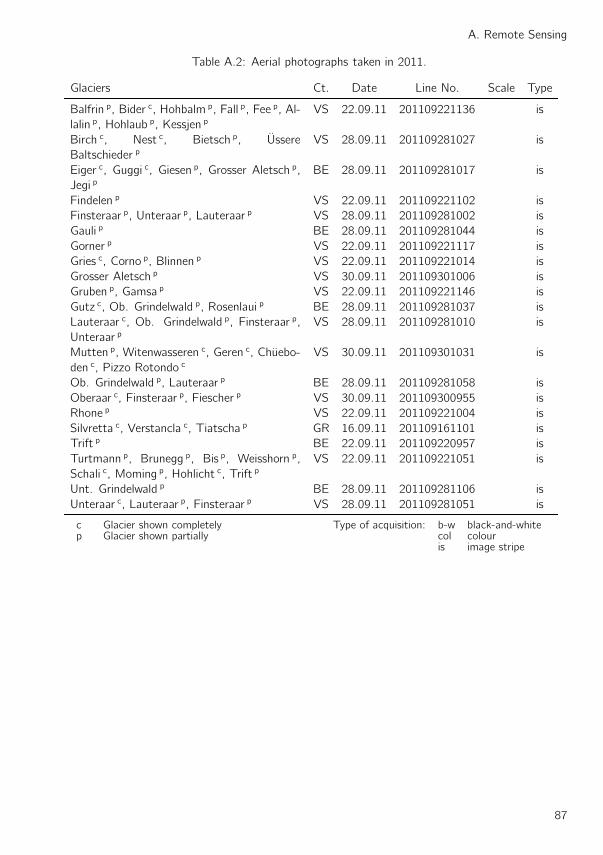
A. Remote Sensing
Table A.2: Aerial photographs taken in 2011.
Glaciers Ct. Date Line No. Scale Type
Balfrin p, Bider c, Hohbalm p, Fall p, Fee p, Al-
lalin p, Hohlaub p, Kessjen pVS 22.09.11 201109221136 is
Birch c, Nest c, Bietsch p, Ussere
Baltschieder pVS 28.09.11 201109281027 is
Eiger c, Guggi c, Giesen p, Grosser Aletsch p,
Jegi pBE 28.09.11 201109281017 is
Findelen p VS 22.09.11 201109221102 is
Finsteraar p, Unteraar p, Lauteraar p VS 28.09.11 201109281002 is
Gauli p BE 28.09.11 201109281044 is
Gorner p VS 22.09.11 201109221117 is
Gries c, Corno p, Blinnen p VS 22.09.11 201109221014 is
Grosser Aletsch p VS 30.09.11 201109301006 is
Gruben p, Gamsa p VS 22.09.11 201109221146 is
Gutz c, Ob. Grindelwald p, Rosenlaui p BE 28.09.11 201109281037 is
Lauteraar c, Ob. Grindelwald p, Finsteraar p,
Unteraar pVS 28.09.11 201109281010 is
Mutten p, Witenwasseren c, Geren c, Chuebo-
den c, Pizzo Rotondo cVS 30.09.11 201109301031 is
Ob. Grindelwald p, Lauteraar p BE 28.09.11 201109281058 is
Oberaar c, Finsteraar p, Fiescher p VS 30.09.11 201109300955 is
Rhone p VS 22.09.11 201109221004 is
Silvretta c, Verstancla c, Tiatscha p GR 16.09.11 201109161101 is
Trift p BE 22.09.11 201109220957 is
Turtmann p, Brunegg p, Bis p, Weisshorn p,
Schali c, Moming p, Hohlicht c, Trift pVS 22.09.11 201109221051 is
Unt. Grindelwald p BE 28.09.11 201109281106 is
Unteraar c, Lauteraar p, Finsteraar p VS 28.09.11 201109281051 is
c Glacier shown completely Type of acquisition: b-w black-and-whitep Glacier shown partially col colour
is image stripe
87
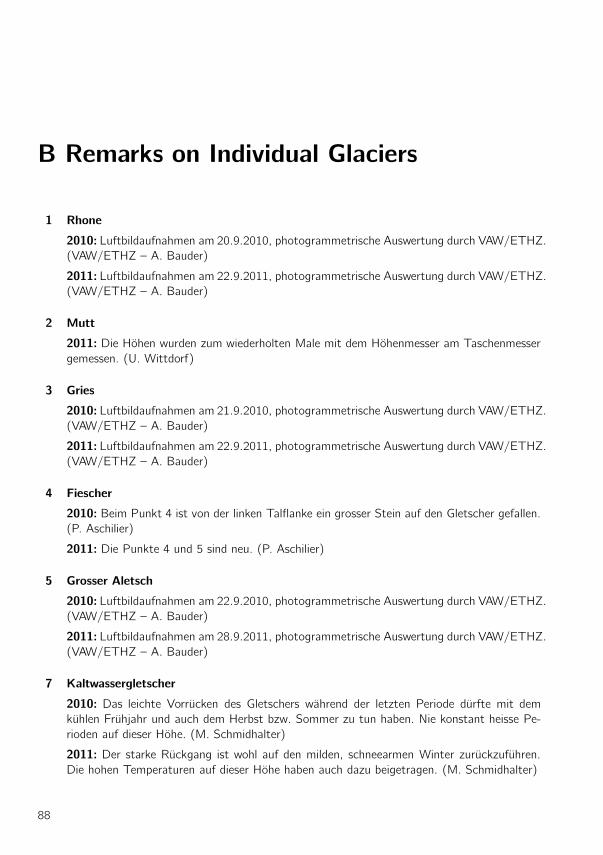
B Remarks on Individual Glaciers
1 Rhone
2010: Luftbildaufnahmen am 20.9.2010, photogrammetrische Auswertung durch VAW/ETHZ.
(VAW/ETHZ – A. Bauder)
2011: Luftbildaufnahmen am 22.9.2011, photogrammetrische Auswertung durch VAW/ETHZ.
(VAW/ETHZ – A. Bauder)
2 Mutt
2011: Die Hohen wurden zum wiederholten Male mit dem Hohenmesser am Taschenmesser
gemessen. (U. Wittdorf)
3 Gries
2010: Luftbildaufnahmen am 21.9.2010, photogrammetrische Auswertung durch VAW/ETHZ.
(VAW/ETHZ – A. Bauder)
2011: Luftbildaufnahmen am 22.9.2011, photogrammetrische Auswertung durch VAW/ETHZ.
(VAW/ETHZ – A. Bauder)
4 Fiescher
2010: Beim Punkt 4 ist von der linken Talflanke ein grosser Stein auf den Gletscher gefallen.
(P. Aschilier)
2011: Die Punkte 4 und 5 sind neu. (P. Aschilier)
5 Grosser Aletsch
2010: Luftbildaufnahmen am 22.9.2010, photogrammetrische Auswertung durch VAW/ETHZ.
(VAW/ETHZ – A. Bauder)
2011: Luftbildaufnahmen am 28.9.2011, photogrammetrische Auswertung durch VAW/ETHZ.
(VAW/ETHZ – A. Bauder)
7 Kaltwassergletscher
2010: Das leichte Vorrucken des Gletschers wahrend der letzten Periode durfte mit dem
kuhlen Fruhjahr und auch dem Herbst bzw. Sommer zu tun haben. Nie konstant heisse Pe-
rioden auf dieser Hohe. (M. Schmidhalter)
2011: Der starke Ruckgang ist wohl auf den milden, schneearmen Winter zuruckzufuhren.
Die hohen Temperaturen auf dieser Hohe haben auch dazu beigetragen. (M. Schmidhalter)
88

B. Remarks on Individual Glaciers
10 Schwarzberg
2010: Luftbildaufnahmen am 20.9.2010, photogrammetrische Auswertung durch VAW/ETHZ
im Auftrag der Kraftwerke Mattmark AG. (VAW/ETHZ – A. Bauder)
2011: Luftbildaufnahmen am 15.9.2011, photogrammetrische Auswertung durch VAW/ETHZ
im Auftrag der Kraftwerke Mattmark AG. (VAW/ETHZ – A. Bauder)
11 Allalin
2010: Luftbildaufnahmen am 20.9.2010, photogrammetrische Auswertung durch VAW/ETHZ
im Auftrag der Kraftwerke Mattmark AG. (VAW/ETHZ – A. Bauder)
2011: Luftbildaufnahmen am 15.9.2011, photogrammetrische Auswertung durch VAW/ETHZ
im Auftrag der Kraftwerke Mattmark AG. (VAW/ETHZ – A. Bauder)
12 Chessjen
2010: Luftbildaufnahmen am 20.9.2010, photogrammetrische Auswertung durch VAW/ETHZ
im Auftrag der Kraftwerke Mattmark AG. (VAW/ETHZ – A. Bauder)
2011: Luftbildaufnahmen am 15.9.2011, photogrammetrische Auswertung durch VAW/ETHZ
im Auftrag der Kraftwerke Mattmark AG. (VAW/ETHZ – A. Bauder)
13 Fee
2010:Messung am 11.10.2010: Die Messpunkte C und D sind vom Aufnahmepunkt aus nicht
mehr einsehbar. Der Gletscher zog sich hinter die Felskuppe zuruck. (U. Andenmatten)
14 Gorner
2011: Die Bestimmung, ob Vorstoss oder Ruckzug, erfolgt nicht vom Basispunkt aus. Oro-
graphisch links reicht das Eis unter Blockschutt weiter talsauswarts. (S. Walther)
15 Zmutt
2010: Luftbildaufnahmen am 1.9.2010, photogrammetrische Auswertung durch VAW/ETHZ.
(VAW/ETHZ – A. Bauder)
16 Findelen
2010: Luftbildaufnahmen am 20.9.2010, photogrammetrische Auswertung durch VAW/ETHZ.
(VAW/ETHZ – A. Bauder)
2011: Luftbildaufnahmen am 22.9.2011, photogrammetrische Auswertung durch VAW/ETHZ.
(VAW/ETHZ – A. Bauder)
17 Ried
2010: Neuer Fixpunkt Nr. 74 wurde eingerichtet. Gletscherzunge hat sich 2009 losgetrennt!
Einmessung des alten Toteisrandes und des neuen Zungenendes. (P. Rovina)
89

The Swiss Glaciers 2009/10 and 2010/11
2011: Wegen der Steilheit des Gelandes wird die Gletscherzunge, bei weiterem Ruckgang,
vom FP74 aus nicht mehr sichtbar sein; vermutlich bereits 2012(?). Im Vorfeld des Gletschers
sind etliche Felsbrocken von jemanden nummeriert worden! Es wurden auch ”Messpunkt”-
Marken gesetzt! (P. Rovina)
18 Lang
2010: In den nachsten Jahren wird der Gletscher massiv an Lange und Dicke verlieren.
(H. Henzen)
19 Turtmann
2010: Im Gletschervorfeld wurden auf 3 grosseren Steinblocken Nummerbezeichnungen ge-
funden. Diese Punkte wurden mit den Distanzmessungen aus den Jahren 2004 und 2005
verglichen. Leider korrelieren diese Punkte nicht mit den Messungen aus diesen Jahren. Fur
Punkt 1 stimmen die Resultate in etwa, fur die beiden anderen Punkte mussen hingegen naher
zum Gletscher neue Messpunkte eingerichtet worden sein. Diese konnten im Spatherbst 2010
allerdings nicht mehr aufgefunden werden. Das Gletschervorfeld wird 2011 nochmals auf das
Vorhandensein dieser Punkte abgesucht werden. Falls die Punkte nicht rekonstruiert werden
konnen, mussen 2011 neue Messpunkte eingerichtet werden. Da sich der Gletscher inzwischen
weit gegen die steile Felspartie zuruckgezogen hat und ein weiterer Ruckzug zu erwarten ist,
ist auf einem markanten Felskopf ein neuer Messpunkt 5 errichtet worden. (A. Brigger)
2011: P5, MP1 und MP2 wurden neu mit Distanzmessung gemessen. Die Verschiebung MP2
erfolgte aufgrund des Vergleichs der GPS Aufnahmen 2010 und 2011. Fur MP1 neu ist die
Unsicherheit zu gross. P1 - P5 wurden ebenfalls auf Basis der GPS Aufnahme 2010/2011
ermittelt. (A. Brigger)
20 Brunegg
2010: Der Ausgangspunkt der Gletschermessung 2005 konnte mit grosster Wahrscheinlich-
keit ermittelt werden. Es handelt sich um einen grossen Stein im Bachbett des Brunneggba-
ches. Fur die Messung 2010 wurde auf einem grossen Felskopf ein neuer Messpunkt einge-
richtet. Der Ruckzug des Gletschers fur den Zeitraum 2005 - 2010 betragt auf Basis dieser
Messpunkte 2010: -99 m. (A. Brigger)
2011: Starker Ruckgang. An der Gletscherfront 2010 befindet sich noch Eis. Dieses ist aber
vollstandig vom Gletscher getrennt. (A. Brigger)
22 Zinal
2010: La largeur du glacier se retrecit. Le point C ne sera dorenavant plus mesure car l’azimut
de 225 g donne contre la moraine. (M. Barmaz)
2011: Comme le point C n’est plus mesurable, et que le point B” n’a plus ete retrouve, j’ai
institue un point B”’ qui sera releve en 2012. (M. Barmaz)
23 Moming
2011: Mesures avec distance metre laser (P. Stoebener)
90

B. Remarks on Individual Glaciers
24 Moiry
2010: Le recul de 32 m correspond au recul de deux ans, car je n’ai pas mesure le recul de
2009 suite a la fermeture prematuree de la route. (M. Barmaz)
29 Cheillon
2011: Nouveaute: creation d’un petit lac au pied du glacier cote est. Le glacier recule prin-
cipalement sur les cotes, mais perd de sa masse. (O. Bourdin)
30 En Darrey
2011: Le processus entame dans les annees 2000 (annee exacte inconue) de recession entre
le glacier bas et haut est accentue. Le glacier bas est notamment ”creve” a 2 endroits et
forme un tunnel de glace spectaculaire. Le recul est egalement important sur la partie haute.
(O. Bourdin)
33 Tsanfleuron
2010: Reprise des mesures par le soussigne a partir de cette annee. (P. Stoebener)
34 Otemma
2010: Comme toujours ici, les crues dues a la fonte ont completement change l’avant pla-
teau. Le front du glacier s’est effondre rive gauche decouvrant le socle rocheux sur lequel
j’ai determine un nouveau Pt 17/10. Voir croquis ci-joint. Cela m’evitera le gymkhana des
723 metres jusqu’au Pt 15/95, pour autant que lors de la prochaine crue, des gravats ne le
couvre pas! Selon les chiffres, le retrait n’est pas tres marque, cependant sur le terrain la
diminution de l’epaisseur de toute la langue est flagrante. (J.-J. Chabloz)
2011: Bonne surprise le nouveau Pt 17/10 est toujours apparent et la rive gauche de la langue
est en forte diminution. Le recul est bien visible rive gauche sur la photographie de l’Aouille.
L’annee passee, il passait encore sous le glacier d’Otemma. Rive droite meme situtation en
plus accentue. Les cones de glace couverts de gravats sur le plateau a l’avant du glacier ont
pratiquement disparu. Nouvelle photographie du glacier d’Epicoune. (J.-J. Chabloz)
35 Mont Durand
2010: Affaissement de tout le front. Plus du tout de voute au portail et de torrent rive gau-
che. Le socle rocheux est au point de visee sous les gravats, voir fleche sur la photo, j’ai donc
modifie l’altitude du front, cependant rive droite le glacier est encore au niveau du torrent
glaciere. La fonte est egalement bien visible au plateau sous la Tete Blanche. (J.-J. Chabloz)
2011: Affaissement de tout le front rive droite avec pour effet de pousser la langue en avant,
d’ou avance du front. Cependant une grande modification du front se prepare au vu des gros
pots qui s’ouvrent en amont ou le socle se fait voir a plusieurs endroits cela jusque sous Tete
Blanche. (J.-J. Chabloz)
36 Brenay
2010: Diminution de la masse bien marquee surtout rive droite, egalement au niveau des
Seracs du Brenay. La langue glaciere se couvre de plus en plus de torrents de surface et
de nombreuses fissures et crevasses se forment tant rive gauche que droite. Sur la photo
91

The Swiss Glaciers 2009/10 and 2010/11
vue aval, bonne vision du Glacier du Mont Durand entre le Mont Avril et la Tete Blanche.
(J.-J. Chabloz)
2011: Rive droite la moraine laissee a l’avant du front, glace morte couverte de crevasses
et de blocs en equilibre instables avec en plus le torrent glaciere du portail droit me fait
abandonner l’acces par ce cote ainsi que deux points de mesure. La langue frontale est par
contre completement abaissee du fait de sa diminution de masse d’ou un recul assez marque.
J’ai pu ajouter un point sur ligne 22/08 et une belle roche moutonnee a fait jour sur cet axe
de visee. Cela me permettra de recentrer mes mesures sans probleme. Les reperes 1 et 2 ne
sont plus mesurables a cause des chutes de glace. J’ai etabli un Pt 5 a l’oppose de la meme
ligne. (J.-J. Chabloz)
37 Gietro
2010: Luftbildaufnahmen am 22.9.2010, photogrammetrische Auswertung durch Photogram-
metrie Perrinjaquet im Auftrag der Force Motrices de Mauvoisin SA. Bestimmung der
Langenanderung durch die VAW/ETHZ. (VAW/ETHZ – A. Bauder)
2011: Luftbildaufnahmen am 15.9.2011, photogrammetrische Auswertung durch Photogram-
metrie Perrinjaquet im Auftrag der Force Motrices de Mauvoisin SA. Bestimmung der
Langenanderung durch die VAW/ETHZ. (VAW/ETHZ – A. Bauder)
38 Corbassiere
2010: Luftbildaufnahmen am 22.9.2010, photogrammetrische Auswertung durch VAW/ETHZ
im Auftrag der Force Motrices de Mauvoisin SA. (VAW/ETHZ – A. Bauder)
2011: Luftbildaufnahmen am 15.9.2011, photogrammetrische Auswertung durch VAW/ETHZ
im Auftrag der Force Motrices de Mauvoisin SA. (VAW/ETHZ – A. Bauder)
39 Valsorey
2010: En rive gauche, l’espace entre le rocher et le glacier est passe de 5.0 a 10.0 m. La
largeur visible de la langue frontale est de 6.4 m, elle se prolonge sous le eboulis en rive droite
probablement d’une dizaine de metres. (J. Medico)
2011: La largeur de la langue frontale est de 6.0 m, elle se prolonge sous les eboulis en
rive droite probablement d’une dizaine de metres. L’epaisseur de la langue est de 0.7 m.
(J. Medico)
40 Tseudet
2010: Tout le bas du glacier est recouvert d’eboulis ce qui rend tres difficile la determination
de la limite exacte du glacier. (J. Medico)
2011: Tout le bas du glacier est recouvert d’eboulis ce qui rend tres difficile la determination
des limites laterales. (J. Medico)
41 Boveyre
2011:Toute la mince langue de glacier a fondu, ce qui explique cet important recul. (J. Medico)
92
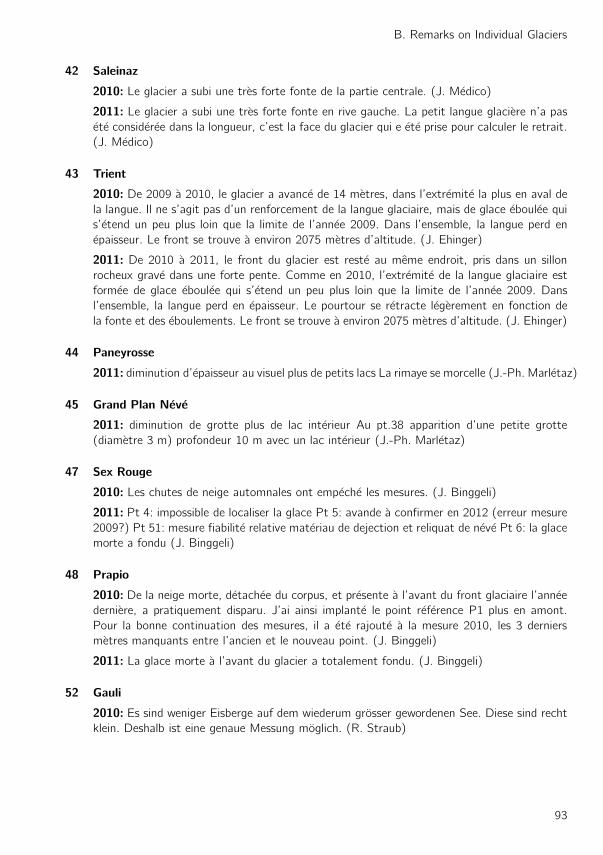
B. Remarks on Individual Glaciers
42 Saleinaz
2010: Le glacier a subi une tres forte fonte de la partie centrale. (J. Medico)
2011: Le glacier a subi une tres forte fonte en rive gauche. La petit langue glaciere n’a pas
ete consideree dans la longueur, c’est la face du glacier qui e ete prise pour calculer le retrait.
(J. Medico)
43 Trient
2010: De 2009 a 2010, le glacier a avance de 14 metres, dans l’extremite la plus en aval de
la langue. Il ne s’agit pas d’un renforcement de la langue glaciaire, mais de glace eboulee qui
s’etend un peu plus loin que la limite de l’annee 2009. Dans l’ensemble, la langue perd en
epaisseur. Le front se trouve a environ 2075 metres d’altitude. (J. Ehinger)
2011: De 2010 a 2011, le front du glacier est reste au meme endroit, pris dans un sillon
rocheux grave dans une forte pente. Comme en 2010, l’extremite de la langue glaciaire est
formee de glace eboulee qui s’etend un peu plus loin que la limite de l’annee 2009. Dans
l’ensemble, la langue perd en epaisseur. Le pourtour se retracte legerement en fonction de
la fonte et des eboulements. Le front se trouve a environ 2075 metres d’altitude. (J. Ehinger)
44 Paneyrosse
2011: diminution d’epaisseur au visuel plus de petits lacs La rimaye se morcelle (J.-Ph. Marletaz)
45 Grand Plan Neve
2011: diminution de grotte plus de lac interieur Au pt.38 apparition d’une petite grotte
(diametre 3 m) profondeur 10 m avec un lac interieur (J.-Ph. Marletaz)
47 Sex Rouge
2010: Les chutes de neige automnales ont empeche les mesures. (J. Binggeli)
2011: Pt 4: impossible de localiser la glace Pt 5: avande a confirmer en 2012 (erreur mesure
2009?) Pt 51: mesure fiabilite relative materiau de dejection et reliquat de neve Pt 6: la glace
morte a fondu (J. Binggeli)
48 Prapio
2010: De la neige morte, detachee du corpus, et presente a l’avant du front glaciaire l’annee
derniere, a pratiquement disparu. J’ai ainsi implante le point reference P1 plus en amont.
Pour la bonne continuation des mesures, il a ete rajoute a la mesure 2010, les 3 derniers
metres manquants entre l’ancien et le nouveau point. (J. Binggeli)
2011: La glace morte a l’avant du glacier a totalement fondu. (J. Binggeli)
52 Gauli
2010: Es sind weniger Eisberge auf dem wiederum grosser gewordenen See. Diese sind recht
klein. Deshalb ist eine genaue Messung moglich. (R. Straub)
93

The Swiss Glaciers 2009/10 and 2010/11
2011: Die maximale Grosse des Sees ist nahezu erreicht. Nur noch ca. ein Dutzend kleine
Eisberge schwimmen im See. In Richtung der bis 2010 erfolgten Messung ist kein Gletscher
mehr, nur noch bis weit hinauf Fels. Der Seespiegel hat sich seit 2002 jahrlich um ganz wenige
cm gesenkt, 2011 etwas mehr, ca. 20 cm, insgesamt ca. 30 cm. (R. Straub)
53 Stein
2010: Da sich die Gletscherzunge in eine Schlucht zuruckzieht, wird die Messung immer
schwieriger. Der Ruckzug beschleunigt sich. (R. Straub)
54 Steinlimi
2011: Das Toteis auf der orographisch rechten Seite ist geschmolzen und hat nackten Fels
und etwas Moranenschutt Platz gemacht. (R. Straub)
55 Trift (Gadmen)
2010: Luftbildaufnahmen am 20.9.2010, photogrammetrische Auswertung durch VAW/ETHZ.
(VAW/ETHZ – A. Bauder)
2011: Luftbildaufnahmen am 22.9.2011, photogrammetrische Auswertung durch VAW/ETHZ.
(VAW/ETHZ – A. Bauder)
57 Oberer Grindelwald
2010: Kein Zugang moglich, nur Fotodokumentation von den gleichen Standorten aus wie
in fruheren Jahren auf dem Felsen der ’Gletscher-Bar’. (VAW/ETHZ – A. Bauder)
2011: Kein Zugang moglich, nur Fotodokumentation von den gleichen Standorten aus wie
in fruheren Jahren auf dem Felsen der ’Gletscher-Bar’. (VAW/ETHZ – A. Bauder)
57 Unterer Grindelwald
2010: Luftbildaufnahmen am 21.9.2010, photogrammetrische Auswertung durch VAW/ETHZ.
Zungenende ist stark schuttbedeckt (Ablagerung Felssturz Schlossplatte) und die Position
der Front bleibt stationar. (VAW/ETHZ – A. Bauder)
2011: Luftbildaufnahmen am 28.9.2011, photogrammetrische Auswertung durch VAW/ETHZ.
Weiterhin keine Veranderung der Position vom schuttbedeckten Zungenende bestimmbar. Da-
hinter dunnt sich der Gletscher zunehmend aus. (VAW/ETHZ – A. Bauder)
59 Eiger
2010: Am 6.10.2010 war wunderschones Wetter mit blauem Himmel, es herrschten kuhle
Temperaturen. Durch Schneefall wenige Tage vor der Messung erschien der Gletscher viel
”sauberer” als 2009. An den Seiten ist der Gletscher im Jahr 2010 vorgestossen. Dies ist
auch durch den Vergleich der Bilder 2009/10 ersichtlich. Der grosste Ruckzug ereignete sich
bei den Punkten 10 - 15. In Zukunft werden noch weitere alte Messpunkte aufgesucht und
digital festgehalten. (R. Zumstein)
94

B. Remarks on Individual Glaciers
2011: Ruckgang im zentralen Bereich stark. Sehr warmer Fruhling und Herbst. Sehr gute
Messbedingungen. Die Suche nach alten Messpunkten war erfolgreich. Gelegentlich konnen
wir den Ruckgang 1938 - 1962 angeben (erste Schatzung nach Orthophoto ca. 230 Meter).
Wir haben die Punkte A und B der alten Messlinie um 1930 gefunden und konnen die Basis-
linie von damals rekonstruieren. (R. Zumstein)
60 Tschingel
2010: Am 14.09.2010 gab es eine leichte Nebeldecke, leichter Wind, ansonsten war es
schon und es herrschten angenehme Temperaturen. Auf der Ruckseite verzeichnet sich ein
gleichmassiger Ruckzug von 3-4 Metern. Abbau der Gletscherzunge seitlich durch Abstrah-
lung von Felsen und Moranen. Ruckgang bis 40 m. Das Messkonzept muss uberpruft werden,
weil die Messungen am linken Rand zunehmend tangential erfolgen und die Aussagekraft der
Werte in Frage gestellt wird. Am Ende der Gletscherzunge bildet sich ein See. (R. Zumstein)
62 Schwarz
2011: Gletschertor eingebrochen. Warmes Wetter mit Fohn: Wegen hoher Wassermenge im
Gletscherbach musste die Messung abgebrochen werden (nur viel weiter unten zu queren).
(C. Coleman Bratschen)
64 Blumlisalp
2010: Zunehmend schwierigere Messverhaltnisse. Seitliche Hangegletscher als Gefahr. Das
Wetter am 21.09.2010 war schon und sehr warm. (U. Fuhrer)
2011: Sehr schwierige Messbedingungen - Einsturzgefahr! Der vermessene Gletscher ist mit
dem seitlich einlaufenden Gletscher nicht mehr verbunden. (U. Fuhrer)
66 Tiefen
2010: Im sudlichen Zungenbereich ist der Gletscher praktisch stationar. Bei den Messpunk-
ten 9 und 10 ist der Ruckgang hingegen ausgepragt. In der Zungenmitte ist eine Felsstufe
zum Vorschein gekommen. Der auf dieser Stufe neu eingerichtete Messpunkt 11 ersetzt den
Messpunkt 04, welche vom Bach teilweise unterkolkt wurde. (J. Marx)
2011: Im nordlichen Zungenbereich ist der Ruckgang sehr ausgepragt. Beim Messpunkt 08
bricht die unter Schutt liegende Eisdecke immer mehr in sich zusammen. Es hat sich ein
grosses Tor gebildet. Der Wasserabfluss konzentriert sich jedoch beim Messpunkt 11. Als
Folge des markanten Schwundes im Einzugsgebiet wird der ostlichste Gletscherbereich nicht
mehr genahrt und fallt zunehmend in sich zusammen. (J. Marx)
67 St. Anna
2010: Auf einem grossen Block wurde ein neuer Messpunkt (2010) eingerichtet. Dieser er-
setzt den Messpunkt 2004. Die Langenanderung entspricht derjenigen der Vorjahre. Der
Massenverlust ist sehr ausgepragt. (J. Marx)
2011: Der Ruckgang liegt in der Grossenordnung der letzten Jahre. Gegen St. Annalucke
und St. Annahorn ist das ostlichste Einzugsgebiet praktisch ausgeapert. (J. Marx)
95

The Swiss Glaciers 2009/10 and 2010/11
68 Chelen
2010: Der Ruckgang ist auf der ganzen Breite ausgepragt. Der von Schutt bedeckte vorder-
ste Zungenbereich fallt zunehmend ein. (J. Marx)
2011: Der Ruckgang ist auf der ganzen Breite markant. Mit der Einrichtung neuer Mes-
spunkte (2010 C, D, E, F) konnten alle Messdistanzen wesentlich verkurzt werden. Die Mes-
slinie 2004 B zielt am Gletscher vorbei. Der Zungenbereich ist stark mit Schutt uberlagert.
(J. Marx)
69 Rotfirn
2010: Viel augenscheinlicher als der Langenverlust ist der Massenverlust. Dieser ist sogar im
Einzugsgebiet von Jahr zu Jahr besser zu beobachten. (J. Marx)
2011: Auch hier schrumpft das Nahrgebiet sehr stark. Dank einer dicken Schuttauflage wird
der Zungenbereich momentan noch konserviert. Die Nahrung von oben bleibt jedoch fast
ganzlich aus. (J. Marx)
70 Damma
2010: Es wurde ein neuer Versuch unternommen, in den Zungenbereich zu gelangen. Der
Zugang uber die Nordflanke via Gemischstockli (Pkt. 2373) ist bezuglich Steinschlag sicherer
als der 2006 gewahlte ”Weg”. Die Zunge selbst konnte nicht erreicht werden. Nordwestlich
des tiefsten Gletscherpunktes wurde ein Messpunkt (2010) eingerichtet. Dieser liegt praktisch
auf der alten Visierlinie. (J. Marx)
2011: Zum im Vorjahr eingerichteten Messpunkt 2010 konnten drei weitere Punkte einge-
richtet werden (2011 A, B, C). Durch die Lage in einer ehemaligen Zugzone (Absturz) ist
die Eisdecke hier verhaltnismassig dunn, was zu einem ausgepragten Ruckgang fuhrt. Der
Zugang uber das Gemschistockli wurde mit Farbe markiert. (J. Marx)
71 Wallenbur
2010: Der Gletscher hat immer noch 2 Tore. Der zwischen den Toren liegende Bereich fallt
seit einigen Jahren stark zusammen. Der Zungenbereich ist von Schutt konserviert. Da er
von oben kaum mehr genahrt wird, hungert er zunehmend aus. Das ostliche Tor ist ca. 11 m
breit. Dieser Gletscherbach fuhrt mehr Wasser als jener beim westlichen Tor, welches ca. 20
m breit und 8 m hoch ist. Ein Bach (kleiner) tritt kurz ausserhalb vom Tor von Ost aus dem
Gletscher aus. Das Tor und der anschliessend grosse Tunnel sind mehr oder weniger trocken.
(J. Marx)
2011: Trotz machtiger Schuttauflage im Zungenbereich liegt der Ruckgang deutlich uber
dem Durchschnitt der letzten Jahre. 2 Gletschertore: Das Ostliche ist nur flach ausgebildet,
das Westliche ist viel hoher (mindestens 10 m). Der Bach tritt hier von Ost eigentlich aus-
serhalb vom Tor aus dem Gletscher. Gletscherzunge ist stark gelappt und vor allem im Osten
sehr stark uberdeckt. (J. Marx)
73 Hufi
2010: Die Zunge ist ab Messpunkt 2002 immer noch knapp sichtbar. Die elektronisch
gemessene Distanz hat sich nicht verandert. Der Gletscher hat sich auf ein Felsplateau
zuruckgezogen und kann nicht aussagekraftig gemessen werden. Die kleine Gletscherzun-
96

B. Remarks on Individual Glaciers
ge hat sich gegenuber 2009 nicht zuruckgezogen, hat jedoch in der Hohe abgenommen.
(J. Marx)
2011: Der Hufifirn wurde besucht, konnte jedoch nicht gemessen werden. Zur Zeit ist die
Gletscherzunge zu Fuss nicht erreichbar. Auch die in den letzten Jahren ausgefuhrte elektroni-
sche Distanzmessung ist nicht mehr moglich. Wir planen das Gebiet anlasslisch der nachsten
Messung des Brunnifirns aus der Luft zu erkunden. Der Gletscher hat sich auf ein Felsplateau
zuruckgezogen. Die bis anhin gemessene kleine Gletscherzunge ist vom Pt 2002 aus nicht
mehr sicht- resp. messbar. (J. Marx)
74 Griess
2010: Die Situation im Zungenbereich zeigt sich weitgehend unverandert. Dies ist auf eine
starke Uberdeckung mit Schutt zuruckzufuhren. (J. Marx)
2011: Der Zungenbereich ist stark mit Schutt bedeckt, entsprechend andert sich hier wenig.
Der Ruckgang im Nahrgebiet ist jedoch augenfallig. Punkt 2007/3 wegen Schuttuberdeckung
nicht messbar. (J. Marx)
75 Firnalpeli
2010:Gletscher am 23.9.2010 vermessen. An der Gletscherzunge waren teilweise grossflachige
Teilabbruche zu verzeichnen. Bei der Messung wurden die vom Gletscher losgelosten Eisab-
bruche nicht berucksichtigt. Deshalb weisen die Messungen im Jahr 2010 teilweise einen
erheblich grosseren Ruckgang des Gletschers im Vergleich zu den letzten Jahren aus. Die
Gletscherhohle (bei Punkt 3) hat sich ebenfalls massiv vergrossert. Die GPS-Aufnahmen
funktionierten auch dieses Jahr nicht. (U. Walser)
2011: Vermessung am 2.10.2011: Auf der Westseite, wo sich der Gletscherbach gebildet
hat, ist der Gletscher stark zuruck gegangen. Die Gletscherhohle ist eingefallen und auf der
Westseite haben sich grosse Hohlraume ausgebildet. Das Eis ist in diesem Bereich teilweise
sehr dunn. (U. Walser)
76 Griessen
2010: Gletscher am 14.10.2010 vermessen. Der Gletscher war schneebedeckt. (U. Walser)
2011: Gletscher am 3.10.2011 vermessen. Im Jahr 2010 wurde die Messung durchgefuhrt,
als der Gletscher bereits schneebedeckt war. Wie ruckwirkend festgestellt werden konnte,
fuhrte dies beim Punkt 1 wahrscheinlich zu einer Uberschatzung der Lange des Gletschers im
Jahr 2010. Die Abgrenzung war auch im Jahr 2011 nicht immer ganz einfach, da die Glet-
scherzunge im Endbereich teilweise mit Schutt uberdeckt war. In den letzten Jahren hat sich
beim Gletscher ein Gletschersee ausgebildet. Im nord-ostlichen Bereich reicht die Ausaperung
praktisch bis ins Akkumulationsgebiet. Diese Ausaperung wurde mit den GPS-Messungen er-
fasst. (U. Walser)
77 Biferten
2010: Das Jahr 2010 ist fur die Messung am Biferten eine spezielle Sache, denn dieses Mal
kann ich mit 2 Gehilfen die ganze Vermessung vornehmen. Dies aus dem Grunde, weil Manu-
el Grossmann aus Luchsingen, als Maturand der Kantonsschule Glarus, seine Matura-Arbeit,
eben dem Bifertengletscher widmet und einmal eine Messung vor Ort mitverfolgen mochte.
97

The Swiss Glaciers 2009/10 and 2010/11
Mit Roman Muller begleitet mich diesmal ein ehemaliger Forstwart und begeisterter Bergler
zur Messung, dies eben auch aus ”Gwunder”, wie dies denn so ablauft, aber auch aus Interes-
se an der Materie Eis. Beinahe 2 Monate fruher als im Vorjahr starten wir am 11. September
unser Unternehmen, mit den ublichen Vorarbeiten im Tal: Schlussel abholen, Fahrt nach Hin-
tersand, dabei mit Fotohalt bei der Sandrisi um unseren hochsten Glarner den Todi einmal
mehr bildlich zu begrussen. Ab Hintersand steigen wir schliesslich zu Fuss in gut einer Stunde
mit unserem Vermessungsmaterial hinauf zur Unterkunftshutte der KLL. Dabei wird ebenfalls
fleissig ”geknipst” um auch das ”Vorgelande” und die Umgebung des Bifertengletschers zu
dokumentieren. Ein wirklicher Prachtstag mit milden Temperaturen ist beste Reklame fur die
Gletschermessung. Lediglich im Schatten ist es fur kurze Zeit kalt und so wie es eben auch
sein kann. Nach Fassung des Stativs und Verschiebung uber die Felsbander hinauf zu Punkt
2003 beginnt die eigentliche Kartierung der Gletscherzunge 2010. Schnell ist das Gletscher-
tor am Gletscherbach 1 erfasst und dokumentiert, danach beginnt einmal mehr die Suche
nach dem Eis, das durch Geroll und Felsbrocken immer noch stark zugedeckt ist. Gemein-
sam finden die zwei Gehilfen aber schliesslich die Zunge und steigen so mit Reflektor und
Rucksack hinauf Richtung Punkt 20031. Auf der Hohe des Gletschersees ist ein Wechsel der
Station notig, da ich ab dort keine Einsicht mehr habe wie die Zunge verlauft. Somit haben
die zwei Helfer eine erste Rast verdient, wahrend ich den schaumenden Gletscherbach 1 uber
seinen Rucken umgehe und uber den Gletschersee hinauf zu Punkt 20031 steige. Ein kurz-
es Fachgesprach beim Gletschersee. Erklaren des weiteren Vorgehens etc. gehoren naturlich
dazu. Der Punkt 20031 ist nun definitiv ungunstig fur die Fortsetzung der Messung, daher
bestimme ich, wie bereits im 2009 angetont, eine neue Station die wiederum fur einige Jahre
den gunstigeren Blick zum Gletscher gewahrt. So entsteht die Station 20101 die ca. 90 m in
sudlicher Richtung von der Station 20031 entfernt liegt. Von dort habe ich beste Einsicht zum
zweiten Teil des Bifertengletscher und insbesondere zum Gletscherbach 2 der in diesem Jahr
eine ganz besondere Form prasentiert: als ob ein riesiger Stein vom Himmel gefallen ware ist
das Gletschertor als Kreis im Gletscher hinausgebrochen. Manuel der Maturant ist begeistert
vom Anblick seiner Maturamaterie. Interessiert dokumentiert er Samtliches, was er vielleicht
irgendwo in seine Arbeit einbauen kann. Der Gehilfe Roman Muller erledigt die Arbeit, wie
wenn er wohl nie etwas anderes getan hatte mit rund 30 Punkten lasst sich die Gletscherzun-
ge wunderbar dokumentieren und so kann ich eine weitere Messung mit Erfolg abschliessen.
Die Auswertung bringt einmal mehr einen betrachtlichen Schwund ans Tageslicht: -10.6 m
hat sich der Gletscher zuruckgezogen. Der tiefste Punkt ist ebenfalls wiederum einen halben
Meter hoher anzutreffen, namlich auf 1969.2 m.u.M. Das Gletschertor am Gletscherbach 1
liegt etwas hoher auf 1970.7 m.u.M. Ab eben diesem Tor bis zur Fassung 2 der KLL betragt
der Abstand nun bereits 173.7 m also nahe an der 200m Grenze. Die ganze Breite die wir
bei der Begehung 2010 vermessen haben betragt 553.2 m. Ab dem Gletschertor 2 hat sich
der Gletscher etwas ausgeweitet und hat daher in diesem Gebiet den Eindruck eines kleinen
Vorstosses hinterlassen, doch der Schein trugt, ist das Eis in diesem Bereich doch in der
Machtigkeit um vieles in sich zusammengefallen. Das Gletschertor mit dem Gletscherbach 2
hat sich zum Vorjahr um ca. 4 m verandert und liegt neu auf 2010.8 m.u.M. Der Ausstieg wie
gewohnt uber die Morane hinauf zur Fridolinshutte ist ebenfalls ohne Zwischenfall gelungen,
so dass wir bald in der Fridolinshutte bei Wahe und Flussigem die Messung nochmals Revue
passieren lassen. Das Fachsimpeln mit der Huttenwartin Gabi Aschwanden gehort ebenfalls
dazu und lasst einem dies und das erfahren. Manuel der Maturand hat wohl einiges an Ma-
terial sammeln konnen, das er in seine Arbeit einfliessen lasst. Gespannt warte ich auf seine
Arbeit, die ich schliesslich gerne auch der VAW zustellen werde. Er bleibt die Nacht in der
Fridolinshutte, so steigen Roman Muller und meine Wenigkeit uber den Ochsenstock und die
98

B. Remarks on Individual Glaciers
Roti nach Obersand und schliesslich nach Hintersand zum Bus ab. Naturlich nicht ohne auch
noch ab dem Ochsenstock ein Bild zur Ubersicht des Gletschers zu schiessen. Eine immer
wieder interessante Perspektive zur Dokumentation. Ein rundum zufriedener Gletschermes-
ser kann eine weitere Messung unfallfrei und mit tollen Eindrucken abschliessen. Der Winter
kann kommen und den geschwachten Gletscherriesen zudecken, damit er sich endlich wieder
einmal etwas erholen kann. (H. Klauser)
78 Limmern
2011: Punkt 1 - 4: stark schuttbedeckt; Gletscherzunge aper, etwas Neuschnee in hoheren
Lagen, kaum Firnschnee (U. Steinegger)
79 Sulz
2010: Mittlerer Ruckgang von -1.50 m. (M. Schaller)
2011: Es haben sich gravierende Differenzen zur GPS-Messung 2010 ergeben. In der Hohe
5 - 16 m und in der Lage 5 - 7 m. Habe in der Situation 1:500 die gemessenen Punkte 2011
um 5.5 m in Sudrichtung verschoben um einen relativen Vergleich zu den Punkten von 2010
zu erhalten. Schatze die Messung 2011 genauer ein. Jeder Punkt wurde langer gemessen
(zwischen 4 - 7 Epochen). Im 2010 wurde mit max. 2 Epochen gemessen. Fazit: 2013 sollte
man mind. 10 Epochen lang messen... (M. Schaller)
80 Glarnisch
2010: Gut 14 Tage fruher als die Messung im 2009 namlich am 12. September 2010 nimmt
mein Gehilfe, diesmal ist es wieder einmal Maurus Pfister (ein Bergsteigerkamerad meines
Sohnes) und ich den Weg zum Glarnischgletscher in Angriff. Dabei bewundern wir, wie bereits
seit mehreren Jahren, die herrliche Flora. Herrlich milde Temperaturen bringen uns bereits
machtig ins Schwitzen, doch wie gewohnt erreichen wir in ca. 1.5 Stunden Marschzeit unse-
ren Arbeitsort. Maurus lasse ich bei der Station 12 bereits stehen, wahrend ich noch weiter
ansteige um schliesslich bei der Station 13 das Instrument zu installieren. Nach der Orientie-
rung des Instrumentes zur Station 12 kann auch Maurus nachziehen und schliesslich mit der
eigentlichen Kartierung des Gletschers beginnen. Dabei zieht er vom nordlichen Ende zum
Sudende und erfasst alle grosseren Knicke und Ecken der Gletscherzunge entlang, die ich wie-
derum mit dem Instrument in Lage und Hohe registriere. Probleme tauchen dabei keine auf.
Alles lauft wie am Schnurchen. Lediglich die Aufnahme der Gletscherzunge im Bereich des
markanten Felsenriffes in Richtung Suden, veranlasst mich zum Entschluss, eine neue Station
zu bestimmen, die mir einen besseren Uberblick uber die Gletscherzunge gewahrt. Maurus
mit Spitz und Faustel ausgerustet, schlagt ein Loch und markiert dieses mit Farbe. Somit
ist die neue Station 14 fur die kommenden Messungen bereit, nachdem ich auch diese in
Lage und Hohe bestimmt habe. Das Verdikt der Messung ist weiterhin ein Schwund; diesmal
betragt dieser im Schnitt doch wiederum beachtliche -8.6 m. Der tiefste Punkt bewegt sich
dabei nicht allzu stark, der ist nur gerade 0.2 m hoher als das letzte Mal. Der Gletscherbach
tritt auf einer Hohe von 2345.4 m.u.M. aus dem Gletscher. Dieser ist wiederum im Plan
markiert. Er schlangelt sich dem Fels entlang unter der Station 13 zu Tale und bringt doch
beachtliche Mengen an Wasser. Der Glarnischgletscher flacht immer mehr ab, dies ist wohl
auch ein Zeichen seiner schwindenden Eisflachen. Eine erfolgreiche Messung ist immer erst
dann zu Ende, wenn alle wieder heil im Tale ankommen, dies war auch diesmal wiederum so.
Nach einer ausgiebigen Rast in der Glarnischhutte bei Kuchen und Kaffee kommen wir ohne
99

The Swiss Glaciers 2009/10 and 2010/11
Zwischenfalle bei unserem Bus in Warben an, mit dem wir schliesslich wieder zuruck in die
Zivilisation fahren und eine weitere erfolgreiche Messung beenden. (H. Klauser)
2011: Noch im selben Monat wie im Jahr davor, aber 2 Wochen spater am 24.09.2011
(Schwander Chilbi Samstag) treten Josef Wildhaber und meine Wenigkeit, zur Messung am
Glarnischfirn an. Josef oder eben Sepp ist auch an meinem Arbeitsort als Gehilfe tatig und
so konnte ich ihn fur diese Arbeit ebenfalls begeistern. So steigen wir, gespannt, was denn
der Gletscher wieder fur uns bereit halt, die gut 1000 Hohenmeter hinauf zum Firn. Der Zwi-
schenhalt bei der Glarnischhutte gehort selbstverstandlich zum alljahrlichen Ritual, einerseits
zur Starkung andererseits zum Gedankenaustausch mit dem Huttenwartsteam und bereits
ersten Infos zum Gletscher. Bereits vorher leuchteten uns wiederum die herrlichen Edelweisse
entgegen, wirkliche eine Pracht der Natur. Nachdem ich ja im letzten Jahr mit der Station
14 einen neuen Ausgangspunkt geschaffen habe ist fur mich auch der Anstieg etwas an-
ders. Ich ziehe bereits tief unter dem Gletscher uber die herrlichen Gletscherschliffe hinweg
Richtung Sudende des Firns. Bis zum Fusse der markanten Felsrippe, dann am einfachsten
Ort hinauf auf diese Felsrippe und der entlang bis zur Station 14. Dort installiere ich mich
mit dem Instrument, erstmalig mit dem Theodoliten TC605L von Leica, denn fur das ”alte
Instrument” waren leider keine Batterien mehr aufzutreiben und so wird dieses Instrument
bald zum ”Antiquarium”. Sepp steigt wahrend dieser Zeit zum Nordende des Gletschers und
halt bei den beiden Stationen 12 und 13 noch kurz inne um mir die ”Orientierungen” zu
ubermitteln. Danach beginnt die Messung am Nordende, nicht ganz ohne eine Schrecksekun-
de: Sepp gleitet beim Ubergang vom Fels und Geroll auf den Gletscher aus (da alles mit einer
feinen Schneeschicht uberdeckt ist) und schlagt unsanft auf dem Po auf. Die Auswirkungen
dieses Sturzes sind schliesslich noch Tage, ja Wochen nach der Messung sichtbar (kraftiger
blauer Fleck, als Bluterguss). Zum Gluck kann er aber weiter der Erfassung des Gletschers
nachgehen und so erfassen wir wiederum Punkt um Punkt. Mit ca. 40 Punkten in Lage und
Hohe konnen wir so die Gletscherzunge dokumentieren und den Stand 2011 festhalten. Der
tiefste Punkt am Gletscher schwankt in den letzten Jahren beinahe auf demselben Niveau hin
und her. So erreicht er im 2011 wieder den Stand von 2009; namlich die Hohe von 2344.6
m.u.M. Dies ist sicherlich auch auf das flache Vorgelande des Gletschers zuruckzufuhren. Im
Moment konnen da keine all zu grossen Schwankungen in der Hohe des tiefsten Punktes
entstehen. Beim tiefsten Punkt tritt auch der Gletscherbach hervor und schlangelt sich ins
Tal. Die Messung konnen wir bei spiegelblankem und stahlblauem Himmel durchfuhren. Die
Temperaturen sind wie immer fur den Gletscher zu mild, jedoch fur die Messung wunderbar.
Die Station 14 bewahrt sich und so kann ich nun auch das sudliche Ende des Gletschers ge-
nauestens erfassen. Die Flachendifferenzen bei der Auswertung im Buro von 3257.4 m2 durch
die gemessene Breite ergibt aber immer noch einen Schwund von -7.7 m im Durchschnitt,
was fur diesen Gletscher sicherlich immer noch betrachtlich ist und ihn dementsprechend
schwacht. Nach getaner Arbeit am Gletscher gehort auch eine Rast, bei der immer auch
noch diverse Bilder des Gletschers entstehen, so dass auch da eine tolle Publikation fur die
Nachwelt geschaffen werden kann. Der Abstieg zur Glarnischhutte und der Z’Vesperhalt mit
Wahe und einem Durstloscher verlaufen ebenfalls ohne Zwischenfalle, wie auch der Abstieg
zum Bus in Warben birgt fur uns keine weiteren Schwierigkeiten mehr. So kann ich eine wei-
tere Messkampagne erfolgreich abschliessen. Mit Gedanken, wie sich denn die Gletscher in
Zukunft entwickeln, ob sie immer noch so rasant zuruck schmelzen oder ob da einmal etwas
Einhalt geboten wird, sehe ich gespannt der Messung im 2012 entgegen. (H. Klauser)
100

B. Remarks on Individual Glaciers
81 Pizol
2010: Die Gletscherkontrolle erfolgte am 22. September. Die Witterungsbedingungen waren
sehr gut. Die Langenmessungen erfolgten ab der C-Linie, in den Punkten C2 bis C5, alle im
Beobachtungsazimut 244 Neugrad. In den Linien 2, 3 und 4 ist der Gletscherrand einfach
bestimmbar. Die starke Uberfuhrung in der Linie 5 macht es schwierig, den ”richtigen” Rand
zu finden. Aus dem Durchschnitt der Messungen ergibt sich eine Langenanderung von -2.9
m. Bezuglich der Schwierigkeiten mit der Bestimmung des Gletscherrandes in der Linie 5 ist
wohl eher von einer, zwischen 2009 und 2010 konstanten Lange auszugehen. 2011 soll ver-
sucht werden, eine neue Messlinie einzurichten. Da das Gletschervorfeld vor allem mit Geroll
belegt ist und kaum anstehender Fels sichtbar ist, wird dies nicht ganz einfach sein, echte
”Fixpunkte” zu finden. (Th. Brandes)
2011: Die Gletscherkontrolle erfolgte am 26. September. Die Witterungsbedingungen waren
sehr gut. Das Gletschervorfeld wies noch einige Schneefelder auf. Dies behinderte die Mes-
sungen aber nicht wesentlich, allenfalls in Linie 5, wo es immer schwieriger ist, den Eisrand
richtig zu erkennen. Die ausgewerteten Messungen fur 2011 erfolgten ab der C-Linie, in den
Punkten C2 bis C5, alle im Beobachtungsazimut 244 Neugrad. In den Linien 2, 3 und 4 ist
der Gletscherrand einfach bestimmbar. Die starke Uberfuhrung in der Linie 5 erschwert die
Festlegung des ”richtigen” Randes. Aus dem Durchschnitt der Messungen ergibt sich eine
deutliche Verkurzung in der Lange von -29.1 m. Immer deutlicher tritt die schon von Noldi
Hartmann vermerkte ”Teilung” des Gletscherfeldes hervor. Zwischen dem steileren oberen
Teil und dem etwas flacheren unteren Teil sind eindeutig Felsen sichtbar. Ob es sich um
anstehenden Fels handelt haben wir nicht gepruft, ich gehe aber davon aus. Kontrolle im
nachsten Jahr. Fur die kommenden Jahre wurde eine neue Messlinie eingerichtet (D-Linie).
(Th. Brandes)
82 Lavaz
2010: Gletschermessung am 23.8.2010 bei frischer, aber schoner Witterung. (R. Lutz)
2011: Die Messung fand am 13.9.2011 bei frischer, aber schoner Witterung statt. Vom im
2008 eingerichteten Fixpunkt aus, wurde nun die dritte Gletschermessung durchgefuhrt. Hier-
durch ist ein erster aussagekraftiger Vergleich moglich: aus dem Plan herausgelesen sind die
Grenzlinien 2010 - 2011 am Nordrand der Gletscherzunge zwischen 2 - 46 m und am Ostrand
der Gletscherzunge zwischen 2 - 36 m voneinander entfernt. (R. Lutz)
83 Punteglias
2010: Das Wetter bei der Messung am 12.10.2010 war schon und wolkenlos bei 5◦C. Im
Messbereich war kein Schnee vorhanden, der Gletschersee zeigte nur vereinzelt eine ganz
dunne Eisschicht. Aus dem Gletscher tritt an verschiedenen Stellen Wasser aus. Der Schmelz-
prozess hat sich wahrend der Messung deutlich verstarkt. Wo der von Schutt beladene Glet-
scherkorper zu Tage tritt, herrschte leichter Steinschlag durch abrutschende Steine und Fein-
material. Die Ferrera fuhrte am Morgen massig Wasser - der Abfluss steigt bei schonem und
warmen Wetter im Verlauf des Tages an. Der See verlandet immer starker. Die Deltas wer-
den grosser. Der Gletscher besteht immer noch aus 3 Gletscherkorpern, die alle in Richtung
SO fliessen. Der Machtigste ist ganz im Osten und ist von braunem Schutt bedeckt. Am
Gletscher Ostrand, im Grenzbereich Gletscher-Gerollhalde hat sich ein Gletschertor geoffnet.
Der Eingang zum Gletschertor wurde durch einen recht frischen Gletscherabbruch versperrt.
Die Eisgrotte ist rund 80 m lang und 15 m breit. Auch der westliche Teil schmilzt zusehends.
101

The Swiss Glaciers 2009/10 and 2010/11
Die einst klare Gletschergrenze beginnt sich zu verasteln, uberall finden sich Abbruche und
neue Einschnitte - die Zunge wird unregelmassig. Zum Teil ist es sehr schwierig, die Glet-
schergrenze abzuschatzen, da uberall sehr viel Schutt den Gletscher bedeckt. Der mittlere
Gletscherkorper ist recht machtig, ist aber starker am Schmelzen als die ostliche Zunge.
Die Abtrennung zwischen dieser mittleren Gletscherzunge und der Ostlichen tritt durch ein
grosser werdendes ”Talchen” immer starker zu Tage. Einige Gletschereinbruche bilden kleine
Krater. Die Gletschergrenze im westlichen Teil dieser mittleren Zunge ist eindrucklich. Es ist
eine rund 10 - 15 m hohe Eiswand. Im Tagesverlauf und bei Sonneneinstrahlung fangt diese
Wand zu leben an - es kracht und achzt und Wasser und Steine fallen herunter. Der westliche
Teil verzahnt sich immer starker. Es entstehen mehr Einschnitte mit zum Teil eindrucklichen
Gletschereinbruchen - wahrscheinlich dort, wo fruher das Gletschertor ”West” stand. Dieses
ist eingesturzt und grosstenteils geschmolzen. Der Gletscher hat sich seit 2008 um 12.5 m
zuruckgezogen. Der Gletscherschwund fand vorwiegend am mittleren und westlichen Glet-
scherkorper statt. (Chr. Buchli)
2011: Die Messung fand am 24.8.2011 bei schoner und warmer, teilweise bewolkter und
boiger Witterung statt. Im Messbereich befand sich kein Schnee und der Gletschersee war
offen. Aus dem Gletscher tritt an verschiedenen Stellen viel Wasser aus. An den Glet-
scherrandern herrscht reger Steinschlag, zum Teil sehr gefahrlich, Vorsicht ist geboten. Die
Ferrera fuhrt viel und braunes Wasser. Die Seeverlandung schreitet voran. Der Gletscher be-
steht immer noch aus 3 Gletscherkorpern, die alle in Richtung SO fliessen. Der immer noch
Machtigste ist mit dem ”oberen” Gletscher, oberhalb der Felswand noch verbunden. Die
Trennung vom ostlichen Gletscherkorper zum mittleren Teil schreitet voran - es bildet sich
ein Talchen zwischen den beiden Gletscherzungen. In diesem Bereich lebt der Gletscher stark,
es ist eine dynamische Zeit, viel ist in Bewegung. Steine rutschen aus den Gletscherrandern
ins neu entstandene Talchen, zum Teil sind kleine Murgange zu beobachten, welche dann
den entstandenen Abflussbach stauen. Dieser sucht sich dann einen anderen Weg und so
entstehen Locher im Gletscherbereich. Der Bach fliesst unterirdisch wieder weiter und tritt
weiter unten wieder zu Tage. Durch Gletschereinbruche entstehen kleine Krater, Sackungen.
In diesem mittleren Bereich, ist es wie im letzten Jahr sehr schwierig, die Gletschergrenze ab-
zuschatzen. Am Westrand ist der Gletscher ruhiger, er schmilzt eher gemachlich vor sich hin.
In einem Bereich entstand unter dem Geroll eine Art Wasserlinse, betritt man diese Flache
(von aussen nicht sichtbar, sieht aus wie uberall) so sinkt man rasch und relativ tief ein und
kommt nur schwer wieder raus. Das Jalon ist mit Leichtigkeit bis 50 cm in den Boden zu
stossen. Auch hier ist also Vorsicht geboten. Das grosse Gletschertor und die Eisgrotte am
Ostrand sind eingesturzt und verschwinden. Es stellt sich die Frage, wie lange der Gletscher
in diesem flachen Teilstuck noch mit dem oberen Gletscher verbunden ist. In der Steilstufe
(Felswand) weiter hinten scheint das Eis schnell zu schmelzen und abzubrechen. In diesem
Jahr ist der obere mit dem mittleren Gletscher noch verbunden. Falls diese Verbindung weg-
schmelzen sollte, so entsteht in unserem Messbereich Toteis. Wie die Gletschermessung dann
vonstatten geht, ist abzuklaren. Der Gletscher hat sich seit 2010 um 27.75 m zuruckgezogen.
Der Gletscherschwund fand vorwiegend am mittleren Gletscherkorper statt. Was erstaunt,
ist die Tatsache, dass sich der Gletscher im westlichen Teil, im Vergleich zum letzten Jahr
etwas ausgebreitet hat. Ob dies durch Gletschereinsturze oder leichtes Abrutschen aus dem
Osthang zustande kommt, ist nicht klar. Am Ostrand ist eine Offnung entstanden, dies kann
durch eine Abrutschung hervorgerufen worden sein. (Chr. Buchli)
102

B. Remarks on Individual Glaciers
84 Lanta
2011: Der rechte Gletscherteil ist stark mit Schutt bedeckt. Der Ruckzug geht langsamer
vor sich. Am Verbindungsband in der Steilstufe scheint der Gletscher auseinander zu brechen.
Ein massiver Ruckgang zeichnet sich jetzt konkret ab. Die Problematik von 2007 besteht
jedoch weiterhin. (B. Riedi)
85 Vorab
2010: Das Wetter am 17.09.2010: Nebel und Regen. Die Gletscherzunge ist zum Teil schnee-
bedeckt. (J. Brunold)
2011: Das Wetter am 29.09.2011: schon und warm. Gletscherzunge wurde detailliert mit
GPS aufgenommen. (J. Brunold)
86 Paradies
2010: Die Veranderung zwischen 2009 und 2010 wurde graphisch durch 12 Messungen im
Abstand von 10 m ermittelt und betragt +0.4 m. Der Schnee vom letzten und vorletzten
Winter ist sehr wahrscheinlich nicht ganz geschmolzen und ist am Rand des Gletschers noch
teilweise vorhanden. Da die Gletscherzunge sehr dunn und flach ist, ist es kaum moglich, eine
genaue Trennung von Eis und altem Schnee zu bestimmen. Das Wasser tritt an der Glet-
scherzunge verstreut aus. Das Nebentor von 2008 fuhrt am meisten gesammeltes Wasser
und wird somit weiterhin als Haupttor bezeichnet. (C. Fisler)
2011: Die Veranderung zwischen 2010 und 2011 wurde graphisch durch 8 Messungen im
Abstand von 10 m ermittelt und betragt -18.6 m. Der grosse Ruckzug gegenuber 2010 er-
gibt sich durch das Verschwinden des im SO gelegenen Teils der Gletscherzunge. In diesem
Bereich betragt der Ruckgang ca. 53 m. Der starke Ruckgang des Sudostteils relativiert sich,
wenn die Fotos aus den Jahren 2007 bis 2011 verglichen werden. Daraus geht hervor, dass
2008 - 2010 der Schnee nicht komplett geschmolzen ist und somit der tatsachliche Zungen-
verlauf nicht zu erkennen war. Im westlichen Teil des Gletschers ist der Wasserfall, der bis
letztes Jahr noch von Eis uberdeckt war, frei geworden. Der heutige Gletscherrand verlauft
bei der fruheren halbmondformigen Gletscherspalte. Ebenfalls hat sich die Machtigkeit des
Gletschers stark verringert. Ab HP3 ist neu der Gipfel der Logia zu sehen. Das Wasser tritt an
der Gletscherzunge verstreut aus. Die gefuhrte Wassermenge 2011 im Vergleich zu den Vor-
jahren, ist trotz geringer Niederschlage, in den vorausgegangenen Wochen besonders hoch.
Die Temperaturen sind fur dieses Jahreszeit sehr hoch. (C. Fisler)
87 Suretta
2010: Der Gletscher ist zwischen 2009 und 2010 praktisch gleich geblieben. Die gerin-
ge Zunahme von 0.7 m ist auf die genauere Messmethode vom 2010 gegenuber 2009
zuruckzufuhren. Die Zunahme wurde graphisch anhand von 29 Messungen im Abstand von
10 m ermittelt. Im Feld ist ein Punkt mit dem Gletscherzustand von 2006 gefunden worden.
Der Abstand zur heutigen Gletscherzunge betragt 2 - 3 m. Dies entspricht grossenmassig
dem graphisch ermittelten Ruckzug der letzten Jahre. Anhand eines Vergleichs mit Fotos
aus dem Punkt G10 kann man sagen, dass dieses Resultat durchaus plausibel ist. Um die
Gletscherzunge zu erreichen, muss man teilweise uber Fels klettern. Die Erreichbarkeit ist nur
mit guten Bedingungen gewahrleistet. (C. Fisler)
103

The Swiss Glaciers 2009/10 and 2010/11
2011: Der Gletscher ist zwischen 2010 und 2011 im Mittel um 2 m zuruck gegangen. Die
Abnahme wurde graphisch anhand von 30 Messungen im Abstand von 10 m ermittelt. Der
geringe Ruckgang wird auch durch die Markierung vom letzten Jahr bestatigt. Auffallig sind
die, im Vergleich zum Vorjahr, deutlich grosseren Spalten und das vermehrte Abbrechen von
grossen Eisblocken. Eine erhebliche Zunahme an Felsabbruchen und die daraus resultierende
Menge an Geroll auf dem Gletschervorfeld (vorherige Gletscherzunge) ist festgestellt wor-
den. Im Fotovergleich von Punkt G10 ist zu erkennen, dass die Machtigkeit des Gletschers
erheblich abgenommen hat. Durch die erheblich hohere Wassermenge (trotz geringen Nieder-
schlagen im September, aber gleichzeitig erhohten Temperaturen), konnte ein Bachverlauf
auf der Karte festgelegt werden. Der 2010 entdeckte See am Nebengletscher ist nicht grosser
geworden. Um die Gletscherzunge zu erreichen, muss man teilweise uber Fels klettern. Die
Erreichbarkeit ist nur mit guten Bedingungen gewahrleistet. (C. Fisler)
88 Porchabella
2010: Die Messung erfolgte nach dem ersten Schneefall, aber bei guten Verhaltnissen.
Die Ermittlung der Langenanderung erfolgte graphisch an 64 Messpunkten. Die mittlere
Langenanderung betragt -15.6 m. Die Hohe der Schneelinie lag den ganzen Sommer auf
ca. 3100 m.u.M. Die Flachen mit erodierbarem Material haben wieder zugenommen. Diese
Entwicklung kann zu Murgangen fuhren. (Chr. Barandun)
2011: Die Messung erfolgte nach dem ersten Schneefall, aber bei guten Verhaltnissen.
Die Ermittlung der Langenanderung erfolgte graphisch an 81 Messpunkten. Die mittlere
Langenanderung betragt -18.7 m. Die Hohe der Schneelinie lag den ganzen Sommer auf ca.
3100 m.u.M. Zusatzlich zur Langenanderung, musste neu auch auf der Westseite eine mar-
kante Breitenabnahme registriert werden. Um die Breitenabnahme auf der Westseite besser
dokumentieren zu konnen, wurde die Messlinie in diesem Bereich verlangert und der neue
Fotostandort GPS2011 definiert. Die beobachtete Entwicklung kann zu Murgangen fuhren.
(Chr. Barandun)
89 Verstankla
2010: Am Tag der Gletschermessung war das Wetter sehr wechselhaft. Im Winter 2009/10
waren die Temperaturen und die Schneehohen weitgehend unterdurchschnittlich. Zusammen
mit wiederholten, meist wenig ergiebigen Schneefallen und nur sehr kurzen Schonwetterphasen
fuhrte dies zu einem mehrheitlich schwachen Schneedeckenaufbau. Der Verstankla-, wie der
Chammgletscher zeigte blankes Eis. Die Gletscherzunge ist mit viel Blockschutt und Feinma-
terial beladen. Die markierten Basispunkte sind nach wie vor gut auffindbar. Die Gletscher-
randlinie wurde gleich wie in den letzten Jahren mit dem GPS-Gerat aufgenommen. Insgesamt
sind 15 Gletscherrandpunkte eingemessen worden. Seit der letzten Messung hat sich der Glet-
scher um -10 m zuruckgezogen. Der Ruckzug ist etwa gleich gross wie im Vorjahr. (I. Buhler)
2011: Bei sehr schonem Wetter - dank eines Zwischenhochs - konnten die Messungen unter
idealen Bedinungen durchgefuhrt werden. Der Winter 2010/11 war bezuglich Schneemengen
sicher ein unterschurchschnittlicher Winter. Wahrend er eher fruh begonnen hatte, stieg die
Regengrenze im Januar auf 2000 m.u.M. Darauf folgten langere milde Schonwetterperioden.
Die Oberflache des Gletschers ist in den Randgebieten nach wie vor von viel Blockschutt
uberdeckt. In der schuttfreien Flache lag das Eis blank. Die Gletscherrandpunkte, sowie 2
Basispunkte - total 14 Punkte - wurden mit dem GPS-Gerat aufgenommen. Neu wurde in
dieser Messung der mittlere Ruckzug des Gletschers uber einen 10-Meter-Raster berech-
104

B. Remarks on Individual Glaciers
net. Seit der letzten Messung hat sich der Gletscher um 19.9 Meter zuruckgezogen. Dies
entspricht einer Verdoppelung der letztjahrigen Werte. Die Starken der drei Wasserabflusse
verhalten sich (von Nord nach Sud) wie 50%, zu 15%, zu 35%. Auf der ganzen Breite
des Gletschers sind weitere kleinere Wasseraustritte festzustellen. Der nordliche Hauptab-
fluss fuhrt viel Feinmaterial und ist stark beige eingefarbt, wahrend die beiden anderen klares
Wasser fuhren. Im Bereich der Gletscherzunge sind rechte Mengen Schutt und Feinmaterial
(bis Sand) abgelagert, die in einem Murgang weiter verfrachtet werden konnten. (M. Maikoff)
90 Silvretta
2010: Luftbildaufnahmen am 22.9.2010, photogrammetrische Auswertung durch VAW/ETHZ.
(VAW/ETHZ – A. Bauder)
2011: Luftbildaufnahmen am 16.9.2011, photogrammetrische Auswertung durch VAW/ETHZ.
(VAW/ETHZ – A. Bauder)
91 Sardona
2010: Die Kontrolle fand am 24. September statt. Nach Sonne am Anfang zog Bewolkung
auf. In der Regel ist ein Gletscherrand in allen Linien deutlich erkennbar. Die im letzten
Jahr gemachte Feststellung, dass im Gletschervorfeld verschiedene, meist schuttbedeckte
Eisflachen verbleiben, ist 2010 noch starker ausgefallen. Wir gehen aber davon aus, dass kei-
ne Verbindung mehr zum eigentlichen Gletscher besteht. Die Vermutung, dass beim Punkt
2B die Messung 2009 zu weit gegangen ist, hat sich auch 2010 bestatigt. (T. Brandes)
2011: Die Kontrolle fand am 27. September statt. Die Verhaltnisse waren gut (sonnig, gegen
Ende zog Bewolkung auf). Die Messung erfolgte ab den Punkten 1B, 2B, 3B, 4B und 5B mit
dem Fadenmessgerat (Gelandemass) im bisherigen Azimut 289g (korrigierter Winkel). Op-
tisch hat sich gegenuber 2010 am Gletscherrand nichts geandert: verschiedene, meist schutt-
bedeckte Eisflachen verbleiben am Gletscherrand. Was wo noch Verbindung aufweist, ist nicht
immer mit Sicherheit festzustellen. Auf der Linie 1 ist der Gletscher massiv zuruckgegangen.
Dies hangt mit dem schleifenden Winkel zwischen Gletscherzunge und Messlinie zusammen.
Die Linie 2 2008 ist definitiv zu lang gewesen, resp. der Gletscherrand ist naher beim Punkt.
Somit haben wir uns wieder auf den Bereich festgelegt, den wir 2010 zusatzlich eingemessen
haben. Der in der Linie 2 dennoch wieder gemessene Vorstoss ist eher mit der Unsicher-
heit des Randes als mit einem effektiven Vorrucken zu interpretieren. Die durchschnittliche
Langenabnahme aus den Messungen betragt somit -14.6 m. Aufgefallen ist die Veranderung
am obersten Ende des Gletschers. Wo bisher eine durchgehende Eisflache zu sehen war, ist
nun eine deutliche Spalte/Rinne ersichtlich. Die Veranderung in der Eisdicke kann dort auch
am nun deutlich hoheren dunklen Felsenband erkannt werden. (T. Brandes)
92 Roseg
2010: Installation eines neuen Fixpunktes. Die Einzige von ehemals drei Nahrzungen ist auf
der Hohe der Coazhutte auch bald weggeschmolzen. Der Ruckgang des Gletschers konnte
dieses Jahr aufgrund technischer Probleme nicht bestimmt werden. (G. Bott)
2011: Die Gletscherzunge hat sich nun ganzlich von Sella-/Roseggletscher gelost und ist
”Toteis”. Ab 2012: Sella- oder Rosegzunge bei Coazhutte messen. Enormer Abschmelzpro-
zess am ”Toteis”. (G. Bott)
105

The Swiss Glaciers 2009/10 and 2010/11
93 Tschierva
2010: Installation eines neuen Fixpunktes. (G. Bott)
2011: Zunge links stark geschmolzen. Bach fuhrt enorm viel Wasser (Abschmelzprozess!)
Diverse Holzfunde (G. Bott)
94 Morteratsch
2010: Installation eines neuen Fixpunktes. Neues Loch in Zunge entstanden. (G. Bott)
2011: Enorme Schmelzwassermenge. Linke Gletscherzungenhalfte ganzlich von Geroll ein-
gedeckt. Einbruch des Gletschertores. Loch in Zungenmitte auf Felsabsatz hat sich stark
erweitert. (G. Bott)
95 Calderas
2010: Gwachte beim See eingefallen. Toteis rechts und unter Gletscherzunge. (G. Bott)
2011: Gwachte 2010: weggeschmolzen/Vorstoss. Viel Toteis weggeschmolzen. Schlechtes
Wetter. (G. Bott)
96 Tiatscha
2011: Ab 2012 muss Basislinie weiter nach Suden verschoben werden, damit Einsehbarkeit
bei allen 5 Messpunkten gegeben ist! (G. Bott)
97 Sesvenna
2010: Konventionelle Messmethode & Zungenlinie mit GPS. (G.C. Feuerstein)
98 Lischana
2010: Gletscher war eingeschneit (ca. 10 - 15 cm Neuschnee). Konventionelle Messmethode
& Zungenlinie mit GPS. (G.C. Feuerstein)
2011: Messung 2010 ungultig!!! Vergleich nur mit 2009 moglich (G.C. Feuerstein)
99 Cambrena
2010: Infolge Wintereinbruch schon nach Mitte Oktober keine Einmessung moglich. (G. Ber-
chier)
2011: Ruckzug von 42 m in 3 Jahren. (G. Berchier)
103 Bresciana
2010: Il fronte di questo ghiacciaio si trova ora a una quota di 2940 m slm. La parte terminale
del ghiacciaio ha un andamento orizzontale ed e molto ripida. Il confronto con il 2009 mostra
una diminzione di spessore tra i 0.50 e 1.15 metri ed un arretramento medio di 0.60 m. Il
ghiacciaio e arretrato in media 7.0 m rispetto al 2007. (C. Valeggia)
2011: Il fronte di questo ghiacciaio si trova ora a una quota di 2941.70 mslm. La parte
terminale del ghiacciaio ha un andamento orizziontale ed e molto ripida. Il confronto con il
2009 mostro una diminuzione di spessore 3.80 metri ed un arretramento medio rispetto al
2010 e di 13.0 m. (C. Valeggia)
106

B. Remarks on Individual Glaciers
104 Basodino
2010: Il confronto tra il profilo del 2009 e quello del 2010 mostra, nella zona misurata, una
perdita di spessore che varia da 1.00 a 1.80 m. L’arretramento medio rispetto al 2009 e stato
di 6.80 m. (C. Valeggia)
2011: Il confronto tra il profilo del 2010 e quello del 2011 mostra, nella zona misurata, una
perdita di spessore che varia da 2.10 a 2.80 m. Come nel 2001, nel 2011 l’intero fronte del
ghiacciaio e stato rilevato. L’arretramento medio in 10 anni e di circa 150 metri. Nella parte
centrale arriva anche a circa 280 metri. L’arretramento medio rispetto al 2010 e di 19.20 m.
(C. Valeggia)
105 Rossboden
2010: Da sich im Jahr 2009 ein grosserer Eissturz ereignet hat, wurden die Messpunkte vom
Jahr 2008 verschuttet. 2010 wurden zwei neue Messpunkte eingerichtet. Vom Messpunkt
1 konnten 6 Messungen in verschiedene Richtungen durchgefuhrt werden. Beim Messpunkt
2 konnte leider kein geeignetes Resultat gemessen werden. Dieser Punkt ist fur die elek-
tronische Distanzmessung zu weit vom Gletscher entfernt. Der Hauptgletschter ist klar von
der fruheren Zunge getrennt. Der Eissturz vom letzten Jahr ist nun komplett mit Schutt
uberdeckt. (G. Marco)
2011: Fur die Messung konnte nur Messpunkt 1 berucksichtigt werden. Messpunkt 2 konnte
gar nicht mehr gefunden werden. Womoglich wurde diese Stelle stark ausgewaschen. (G. Mar-
co)
109 Alpetli (Kanderfirn)
2010: Das Wetter am Tag der Messung war schon und sehr warm. 2 kleine Gletschertore.
Relativ flaches Gletschervorfeld. (U. Fuhrer)
2010: 3 kleine Gletschertore. (U. Fuhrer)
111 Ammerten
2010: Die Bedingungen waren sehr gut - erster frischer Schnee, der aufgrund des super
schonen Fohntages grosstenteils grad wieder abschmolz. (W. Hodel)
2011: Auffallend ist dieses Jahr besonders die Nordflanke des (Mittel-) Wildstrubels, die so-
zusagen wie leergefegt scheint. In den Graben ist so gut wie kein Altschnee mehr vorhanden.
Dass der Gletscher am Punkt 1 mehr als 10 m zuruckgegangen ist, hat wohl auch damit zu
tun, dass wir dort immer genau derselben Messrichtung, mittlerweile sehr am linken Rand
der Zunge (in dem kleinen Talchen) auf das Eis stossen. Wenn nun am Rande das Eis auch
nur ein bisschen schmilzt, kann das aber in der Langsrichtung relativ viel ausmachen und ist
nicht sehr stetig. (W. Hodel)
112 Dungel
2010: Am Tag der Vermessung herrschten ideale Bedingungen. Das Zungenende konnte so
ohne Probleme eingemessen werden. (A. Wipf)
107

The Swiss Glaciers 2009/10 and 2010/11
113 Gelten
2010: Beim Gletscher prasentierte sich die Zunge schneefrei. Es zeigte sich jedoch, dass diese
- wie schon in den letzten Jahren - nun aber noch markanter asymmetrisch abgeschmolzen
ist, sodass eine Angabe der Langenanderung nicht sehr sinnvoll erscheint. Zudem liegt der
ostliche Teil unter einer Obermorane und ist, wenn uberhaupt, nur noch marginal mit der
”aktiven” Zunge verbunden. (A. Wipf)
114 Plattalva
2010: Punkt 5: Rand spitzwinklig zu Messrichtung. Ganzer Gletscher schneebedeckt (Herbst-
schnee) (U. Steinegger)
2011: Punkt 5: Gletscherrand spitzwinklig zu Messrichtung. Gletscherzunge aper, etwas Neu-
schnee in hoheren Lagen, kaum Firnschnee (U. Steinegger)
115 Scaletta
2010: Gletscherende unter Schutt, sehr schwer zu eruieren. Der Gletscher ist furchtbar am lei-
den. Es hatte Unmengen Wasser im Gletscherbach. Von links her beginnt das braune Schutt-
band den oberen Gletscherteil gegen den Felsen hin vom Unteren zu trennen. Weiter unten
gibt es nur noch Toteis. (B. Teufen)
2011:Mit Werkzeugen nach Eis unter dem Schutt gesucht. Messung sehr schwierig. (B. Teu-
fen)
117 Valleggia
2010: Il suo fronte continua ad appiattirsi e la diminuzione di spessore dal 2009 al 2010
e notevole (da 1.00 a 3.25 m). L’arretramento medio rispetto al 2009 e stato di 7.90 m.
(C. Valeggia)
2011: Il suo fronte continua ad appiattirsi e la diminuzione di spessore dal 2010 al 2011 e
notevole (da 2.70 a 4.90 m). L’arretramento medio rispetto al 2010 e di 4.30 m. (C. Valeggia)
118 Val Torta
2010: Il ghiacciaio e in fase di estinzione (ghiaccio morto) e non ha piu una zona di alimen-
tazione. La parte terminale del ghiacciaio e ricoperta da neve. Dal 2008 non ci sono state
variazioni di lunghezza. Quest’anno non e stato misurato. (C. Valeggia)
2011: Il ghiacciaio e in fase di estinzione (ghiaccio morto) e non ha piu una zona di alimen-
tazione. Lungo il suo fronte troviamo un nevaio con un spessore 5.0 metri. Il confronto tra
il profilo anno 2008 e 2011 mostra una diminuzione nella parte alta del ghiacciaio di 4.80 m.
L’arretramento medio rispetto al 2009 e di 44.10 m. (C. Valeggia)
119 Cavagnoli
2010: La parte terminale del ghiacciaio continua a ritirarsi, ad appiattirsi e a perdere spes-
sore favorita dal fatto che termina in una zona pianeggiante con un laghetto formatosi una
decina di anni fa e rilevato anche nell’ultima edizione della CN 1:25.000. Il ghiacciaio non
dispone piu di una zona di accumulo e la tendenza in atto da parecchi anni, di dividersi
in campi isolati di ghiaccio morto, continua. Lo spessore di ghiaccio scioltosi nel 2010 varia
da 2.30 a 3.14 metri. L’arretramento medio rispetto al 2009 e stato di 9.30 m . (C. Valeggia)
108

B. Remarks on Individual Glaciers
2011: La parte terminale del ghiacciaio continua a ritirarsi, ad appiattirsi e a perdere spessore
favorita dal fatto che termina in una zona pianeggiante con un laghetto formatosi una decina
di anni fa e rilevato anche nell’ultima edizione della CN1:25000. Il ghiacciaio non dispone
piu di una zona di accumulo e la tendenza in atto da parecchi anni, di dividersi in campi
isolati di ghiaccio morto, continua. Lo spessore di ghiaccio scioltosi dal 2010 al 2011 varia
da 0.50 a 5.40 metri. L’arretramento medio rispetto al 2010 e stato di 24.40 m. (C. Valeggia)
120 Corno
2010: La parte di ghiacciaio rimasta attiva (ossia con una zona d’accumulo ed una di abla-
zione) ha perso da 1.00 a 3.30 m di spessore nel periodo 2009-2010. L’arretramento medio
rispetto al 2009 e stato di 6.50 m. (C. Valeggia)
2011: La parte di ghiacciaio rimasta attiva (ossia con una zona d’accumulo ed una di abla-
zione) ha perso da da 1.20 a 3.00 m di spessore nel period 2010-2011. L’arretramento medio
rispetto al 2010 e stato di 3.00 m. (C. Valeggia)
173 Seewjinen
2010: Luftbildaufnahmen am 20.9.2010, photogrammetrische Auswertung durch VAW/ETHZ
im Auftrag der Kraftwerke Mattmark AG. (VAW/ETHZ – A. Bauder)
2011: Luftbildaufnahmen am 15.9.2011, photogrammetrische Auswertung durch VAW/ETHZ
im Auftrag der Kraftwerke Mattmark AG. (VAW/ETHZ – A. Bauder)
174 Hohlaub
2010: Luftbildaufnahmen am 20.9.2010, photogrammetrische Auswertung durch VAW/ETHZ
im Auftrag der Kraftwerke Mattmark AG. (VAW/ETHZ – A. Bauder)
2011: Luftbildaufnahmen am 15.9.2011, photogrammetrische Auswertung durch VAW/ETHZ
im Auftrag der Kraftwerke Mattmark AG. (VAW/ETHZ – A. Bauder)
352 Croslina
2010: Il rilievo del profilo ha mostrato variazioni di spessore da 1.10 a 3.60 m mentre la
lunghezza si e ridotta in media di 1.10 m rispetto al 2009. (C. Valeggia)
2011: Il rilievo del profilo ha mostrato variazioni di spessore da 1.50 a 2.45 m mentre la
lunghezza si e ridotta in media di 4.10m rispetto al 2010. (C. Valeggia)
353 Vadrecc di Camadra
2010: Questo ghiacciaio si trova nel comune di Ghirone ad una quota di 2924 m slm, tra la
Cima di Camadra ed il Piz Medel. Il ghiacciaio e stato misurato l’ultima volta il 28. settembre
2006. Il confronto tra il profilo del 2006 e quello del 2010 mostra una perdita di spessore che
varia da 2.80 a 7.85 m. Il ghiacciaio e arretrato in media 2.40 m rispetto al 2006. (C. Valeggia)
2011: Il confronto con il profilo del 2010 mostra una perdita di spessore di 2.10 m. Il ghiac-
ciaio e arretrato in media 5.60 rispetto al 2010. (C. Valeggia)
109
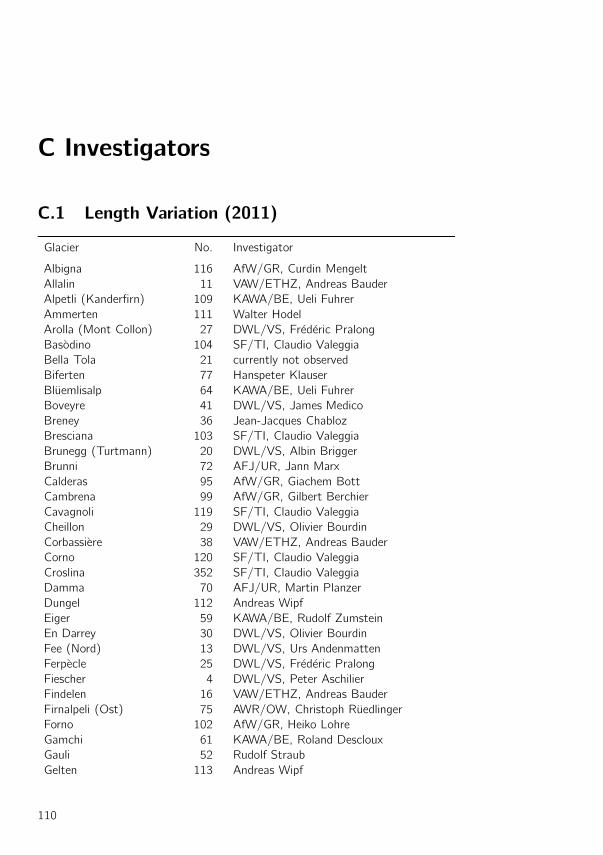
C Investigators
C.1 Length Variation (2011)
Glacier No. Investigator
Albigna 116 AfW/GR, Curdin Mengelt
Allalin 11 VAW/ETHZ, Andreas Bauder
Alpetli (Kanderfirn) 109 KAWA/BE, Ueli Fuhrer
Ammerten 111 Walter Hodel
Arolla (Mont Collon) 27 DWL/VS, Frederic Pralong
Basodino 104 SF/TI, Claudio Valeggia
Bella Tola 21 currently not observed
Biferten 77 Hanspeter Klauser
Bluemlisalp 64 KAWA/BE, Ueli Fuhrer
Boveyre 41 DWL/VS, James Medico
Breney 36 Jean-Jacques Chabloz
Bresciana 103 SF/TI, Claudio Valeggia
Brunegg (Turtmann) 20 DWL/VS, Albin Brigger
Brunni 72 AFJ/UR, Jann Marx
Calderas 95 AfW/GR, Giachem Bott
Cambrena 99 AfW/GR, Gilbert Berchier
Cavagnoli 119 SF/TI, Claudio Valeggia
Cheillon 29 DWL/VS, Olivier Bourdin
Corbassiere 38 VAW/ETHZ, Andreas Bauder
Corno 120 SF/TI, Claudio Valeggia
Croslina 352 SF/TI, Claudio Valeggia
Damma 70 AFJ/UR, Martin Planzer
Dungel 112 Andreas Wipf
Eiger 59 KAWA/BE, Rudolf Zumstein
En Darrey 30 DWL/VS, Olivier Bourdin
Fee (Nord) 13 DWL/VS, Urs Andenmatten
Ferpecle 25 DWL/VS, Frederic Pralong
Fiescher 4 DWL/VS, Peter Aschilier
Findelen 16 VAW/ETHZ, Andreas Bauder
Firnalpeli (Ost) 75 AWR/OW, Christoph Ruedlinger
Forno 102 AfW/GR, Heiko Lohre
Gamchi 61 KAWA/BE, Roland Descloux
Gauli 52 Rudolf Straub
Gelten 113 Andreas Wipf
110

C. Investigators
Glacier No. Investigator
Gietro 37 VAW/ETHZ, Andreas Bauder
Glarnisch 80 Hanspeter Klauser
Gorner 14 Stefan Walther
Grand Desert 31 DWL/VS, Francois Vouillamoz
Grand Plan Neve 45 FFN/VD, J.-Ph. Marletaz
Gries 3 VAW/ETHZ, Andreas Bauder
Griess 74 AFJ/UR, Beat Annen
Griessen 76 AWR/OW, Christoph Ruedlinger
Grosser Aletsch 5 VAW/ETHZ, Andreas Bauder
Hohlaub 174 VAW/ETHZ, Andreas Bauder
Hufi 73 AFJ/UR, T. Arnold
Kaltwasser 7 DWL/VS, Martin Schmidhalter
Kehlen 68 AFJ/UR, Martin Planzer
Kessjen 12 VAW/ETHZ, Andreas Bauder
Lang 18 DWL/VS, Hans Henzen
Lavaz 82 AfW/GR, Renaldo Lutz
Lenta 84 AfW/GR, Bernard Riedi
Limmern 78 Urs Steinegger
Lischana 98 AfW/GR, Gian Cla Feuerstein
Lammern 63 KAWA/BE, Christian von Grunigen
Mittelaletsch 106 currently not observed
Moiry 24 Marcel Barmaz
Moming 23 DWL/VS, Pascal Stoebener
Mont Durand 35 Jean-Jacques Chabloz
Mont Fort (Tortin) 32 DWL/VS, Francois Vouillamoz
Mont Mine 26 DWL/VS, Frederic Pralong
Morteratsch 94 AfW/GR, Giachem Bott
Mutt 2 Ueli Wittorf
Oberaar 50 Flotron AG
Oberaletsch 6 DWL/VS, Christian Theler
Oberer Grindelwald 57 Hans Boss
Otemma 34 Jean-Jacques Chabloz
Palu 100 AfW/GR, Gilbert Berchier
Paneyrosse 44 FFN/VD, J.-Ph. Marletaz
Paradies 86 AfW/GR, Cristina Fisler
Paradisino (Campo) 101 AfW/GR, Gilbert Berchier
Pizol 81 KFA/SG, Thomas Brandes
Plattalva 114 Urs Steinegger
Porchabella 88 AfW/GR, Christian Barandun
Prapio 48 FFN/VD, Jacques Binggeli
Punteglias 83 AfW/GR, Christian Buchli
Rhone 1 VAW/ETHZ, Andreas Bauder
Ried 17 DWL/VS, Peter Rovina
Roseg 92 AfW/GR, Giachem Bott
Rossboden 105 DWL/VS, Gerold Marco
Rotfirn (Nord) 69 AFJ/UR, Martin Planzer
111
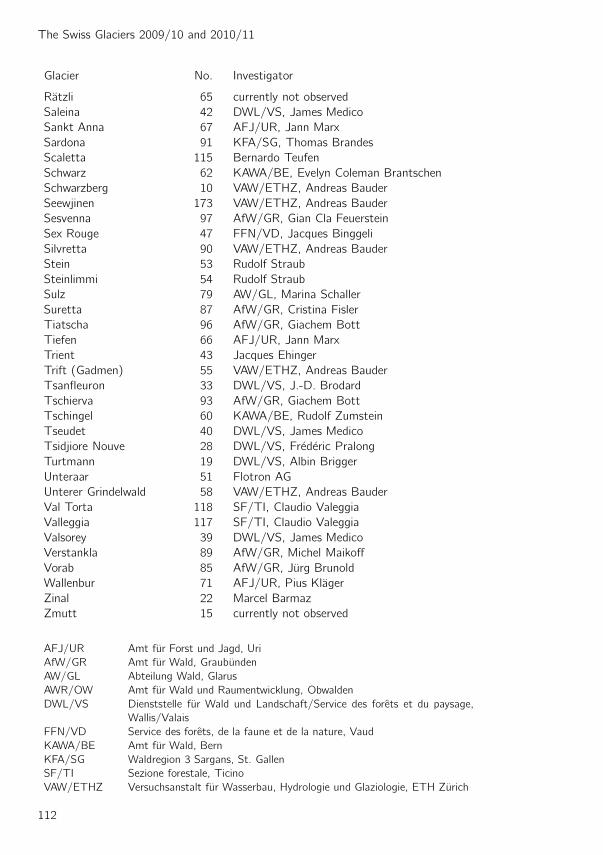
The Swiss Glaciers 2009/10 and 2010/11
Glacier No. Investigator
Ratzli 65 currently not observed
Saleina 42 DWL/VS, James Medico
Sankt Anna 67 AFJ/UR, Jann Marx
Sardona 91 KFA/SG, Thomas Brandes
Scaletta 115 Bernardo Teufen
Schwarz 62 KAWA/BE, Evelyn Coleman Brantschen
Schwarzberg 10 VAW/ETHZ, Andreas Bauder
Seewjinen 173 VAW/ETHZ, Andreas Bauder
Sesvenna 97 AfW/GR, Gian Cla Feuerstein
Sex Rouge 47 FFN/VD, Jacques Binggeli
Silvretta 90 VAW/ETHZ, Andreas Bauder
Stein 53 Rudolf Straub
Steinlimmi 54 Rudolf Straub
Sulz 79 AW/GL, Marina Schaller
Suretta 87 AfW/GR, Cristina Fisler
Tiatscha 96 AfW/GR, Giachem Bott
Tiefen 66 AFJ/UR, Jann Marx
Trient 43 Jacques Ehinger
Trift (Gadmen) 55 VAW/ETHZ, Andreas Bauder
Tsanfleuron 33 DWL/VS, J.-D. Brodard
Tschierva 93 AfW/GR, Giachem Bott
Tschingel 60 KAWA/BE, Rudolf Zumstein
Tseudet 40 DWL/VS, James Medico
Tsidjiore Nouve 28 DWL/VS, Frederic Pralong
Turtmann 19 DWL/VS, Albin Brigger
Unteraar 51 Flotron AG
Unterer Grindelwald 58 VAW/ETHZ, Andreas Bauder
Val Torta 118 SF/TI, Claudio Valeggia
Valleggia 117 SF/TI, Claudio Valeggia
Valsorey 39 DWL/VS, James Medico
Verstankla 89 AfW/GR, Michel Maikoff
Vorab 85 AfW/GR, Jurg Brunold
Wallenbur 71 AFJ/UR, Pius Klager
Zinal 22 Marcel Barmaz
Zmutt 15 currently not observed
AFJ/UR Amt fur Forst und Jagd, Uri
AfW/GR Amt fur Wald, Graubunden
AW/GL Abteilung Wald, Glarus
AWR/OW Amt fur Wald und Raumentwicklung, Obwalden
DWL/VS Dienststelle fur Wald und Landschaft/Service des forets et du paysage,
Wallis/Valais
FFN/VD Service des forets, de la faune et de la nature, Vaud
KAWA/BE Amt fur Wald, Bern
KFA/SG Waldregion 3 Sargans, St. Gallen
SF/TI Sezione forestale, Ticino
VAW/ETHZ Versuchsanstalt fur Wasserbau, Hydrologie und Glaziologie, ETH Zurich
112

C. Investigators
C.2 Mass Balance and Velocity
Glacier No. Investigator
Allalin 11 VAW/ETHZ, Andreas Bauder
Basodino 104 Giovanni Kappenberger
Clariden 141 Giovanni Kappenberger
Corbassiere 38 VAW/ETHZ, Andreas Bauder
Findelen 16 GIUZ, Nadine Salzmann and colleagues /
UFR, Matthias Huss
Gietro 37 VAW/ETHZ, Andreas Bauder
Gries 3 VAW/ETHZ, Martin Funk
Hohlaub 174 VAW/ETHZ, Andreas Bauder
Pizol 81 VAW/ETHZ / UFR, Matthias Huss
Plaine Morte 65 UFR, Matthias Huss
Schwarzberg 10 VAW/ETHZ, Andreas Bauder
Silvretta 90 VAW/ETHZ, Andreas Bauder
Tsanfleuron 33 UFR, Matthias Huss
VAW/ETHZ Versuchsanstalt fur Wasserbau, Hydrologie und Glaziologie,
ETH Zurich
GIUZ Geographisches Institut, Universitat Zurich
UFR Departement de Geosciences, Universite de Fribourg
113