Embed Size (px)
Citation preview

The System of Rice Intensification and Its Puzzling Impacts on Household
Welfare: Evidence from Rural Indonesia
Kazushi Takahashi and Christopher B. Barrett
Presentation at workshop on
The Economics of Global Poverty
Calvin College
July 12, 2012

Motivation
“SRI is pro-poor technology”:– Nontraditional origins (developed by missionary priest in
Madagascar, not in the labs/fields of a research institute)– No additional or new external inputs needed– Intensive use of labor, which the poor commonly have
Controversy within rice community– Repeated observations of large yields gains (50-200%) on
farmers’ fields while some trials show little impact on yield in experimental fields (McDonald et al., 2006, 2008).
– Weak theoretical foundation: Science behind SRI is “mysterious” and is not well accepted by some crop scientists. (“Scientific Unconfirmed Field Observations”)
What are the welfare impacts of SRI?- Widespread adoption but in some places also much disadoption …
are users really better off?- Experimental fields may not reflect realities faced by farmers,
while simple with-without comparisons among farmers or over time ignore selection effects.
- Especially because of its labor use implications, must look beyond just partial productivity of land (yield) impacts
Our core (as-yet-unanswered) question:
What are the consequence of SRI use for household income, including off-farm income generation, and on children’s education?
Knowledge gap
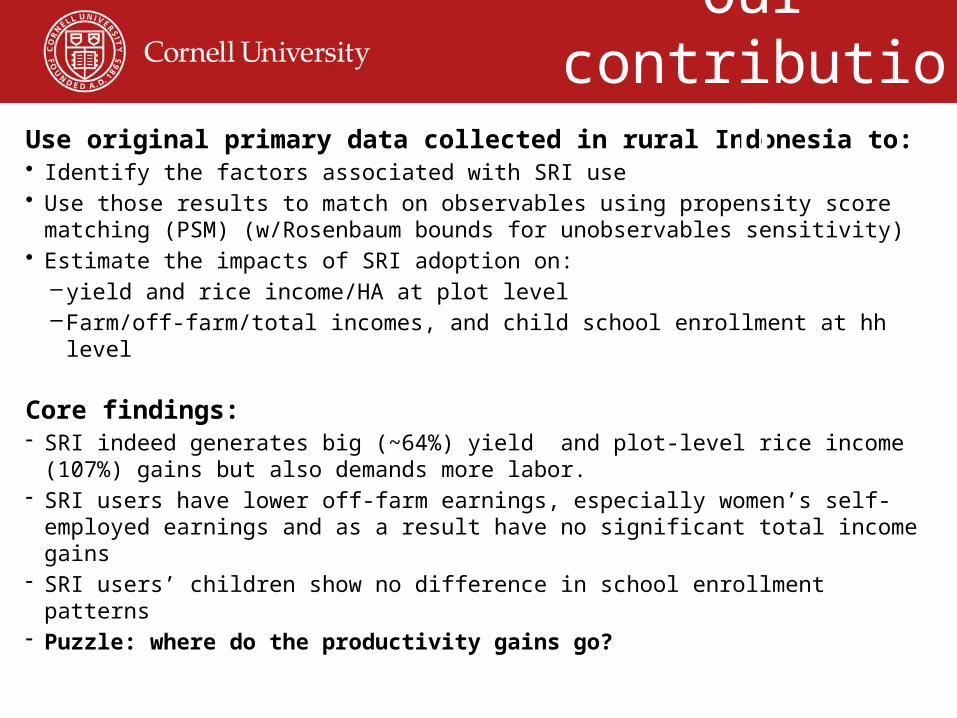
Use original primary data collected in rural Indonesia to:• Identify the factors associated with SRI use • Use those results to match on observables using propensity score matching
(PSM) (w/Rosenbaum bounds for unobservables sensitivity)• Estimate the impacts of SRI adoption on:
– yield and rice income/HA at plot level– Farm/off-farm/total incomes, and child school enrollment at hh level
Core findings:- SRI indeed generates big (~64%) yield and plot-level rice income (107%)
gains but also demands more labor.- SRI users have lower off-farm earnings, especially women’s self-employed
earnings and as a result have no significant total income gains- SRI users’ children show no difference in school enrollment patterns- Puzzle: where do the productivity gains go?
Our contribution

What is SRI?
System of Rice Intensification is a systems-based rice production approach/technology characterized by:
1. young seedlings of 8-12 days old2. shallow planting (1-2 cm) of one or two seedlings3. sparse planting density (more than 20 × 20 cm)4. intermittent irrigation (alternate wetting and drying)
It is commonly held that SRI is complex and careful/ timely water management and weed control are required. Thus both higher yields and higher yield risk.

Non-SRI Seedlings
(30 days after seeding)
SRI Seedling (10 days after Seeding)
Photos by Nippon Koei
What is SRI?
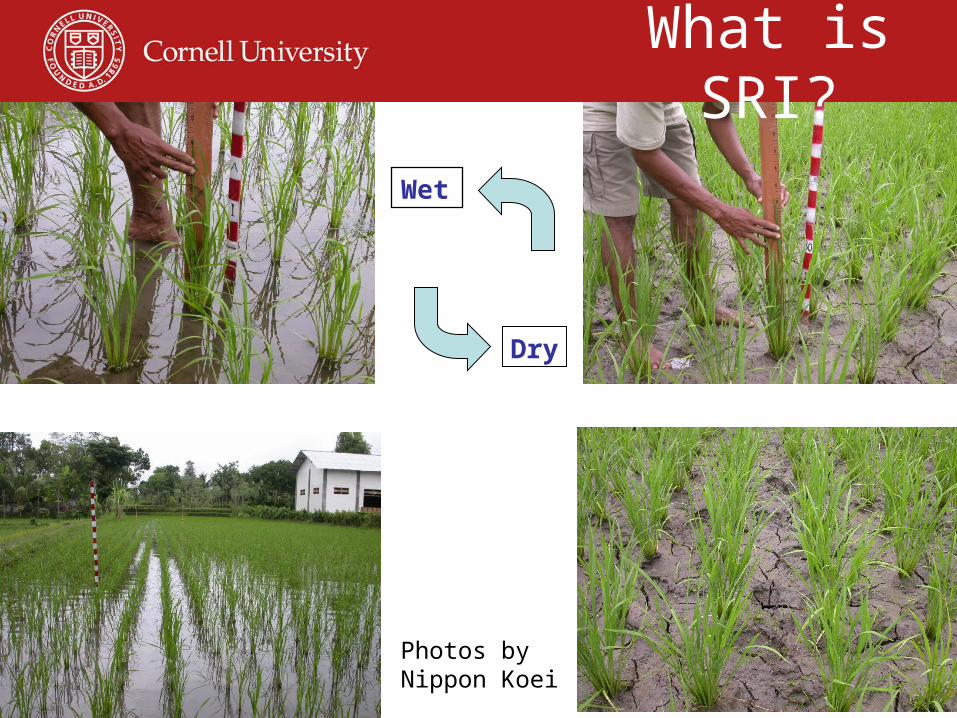
Wet
Dry
Photos by Nippon Koei
What is SRI?
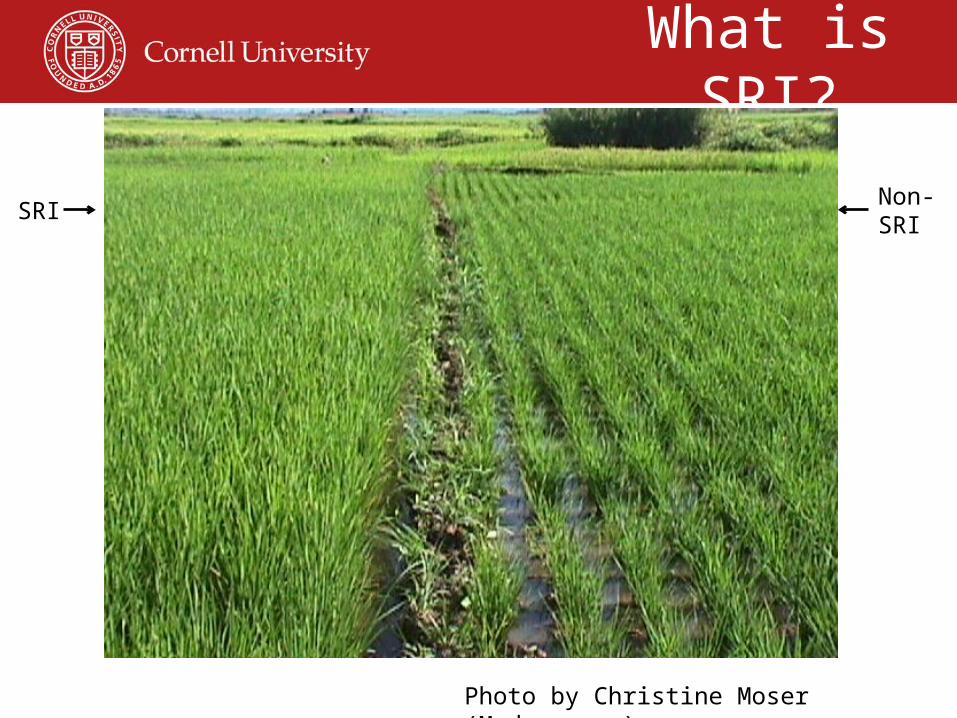
Photo by Christine Moser (Madagascar)
What is SRI?
SRINon-SRI

Photos by Nippon Koei
What is SRI?

Impact Evaluation
Want to know avg treatment effect on the treated (ATT):
1)=|(= 01 iii DyyEATT 1)=|(1)=|(= 01 iiii DyEDyE
But it is never possible to observe the outcome of SRI-adopters had they not adopted SRI, . So use PSM to match conditional on probability of SRI use, as estimable based on plot- and household-level observable characteristics.
Vulnerable to selection-on-unobservables, so (i) try to elicit/control for key unobservables, (ii) do sensitivity testing using Rosenbaum bounds.
1)=|( 0 ii Dy

Data
Indonesia, South Sulawesi, Jeneponto District• Poor, agriculture-dependent region• Annual rainfall is limited (1,000 mm-1,500 mm/year)• Irrigation project funded by JICA• SRI promoted under the scheme since 2002• Sample of 864 rice farmers (122 SRI adopters/742
non-adopters), operating 1202 rice plots• Wet season, cross-sectional data collected in 2009

Descriptive Stats 1
Mean sd
Household Characteristics
# of Cultivated Plots 1.43 0.8Total Land Size (ha) 0.64 0.6Adopt SRI (%) 14.12 34.8SRI Experience (years) 0.71 1.9# Agricultural Advisors 0.77 1.0Advisors Ever Adopt SRI (%) 17.13 37.7
Plot Characteristics
Adopt SRI (%) 13.98 34.69 Young Seedling (%) 13.64 34.34 Shallow Planting (%) 13.14 33.80 Parse Planting (%) 13.56 34.25 Intermittent Irrigation (%) 11.15 31.49Full Adoption of SRI (%) 9.98 29.99

SRINon-SRI
Diff
Plot level outcomes
Yield (ton/ha) 5.50 2.95 2.54***
Rice income per ha (Mill Rp) 6.67 2.46 4.21***N 168 1034
Household level outcomes
Monthly Total Farm income(000 RP)
732.50 238.80 493.7***
Monthly Total off-farm labor income(000 RP)
543.90 503.90 40.06
Monthly Off-farm wage earnings(000 RP)
398.10 272.30 125.80
Monthly Self-employed non-farm income
(000 RP)
145.90 231.60 -85.69
Monthly Total labor income(000 RP)
1276.50 742.70 533.7***
N 122 742
Descriptive Stats 2
Elicited Risk Preferences
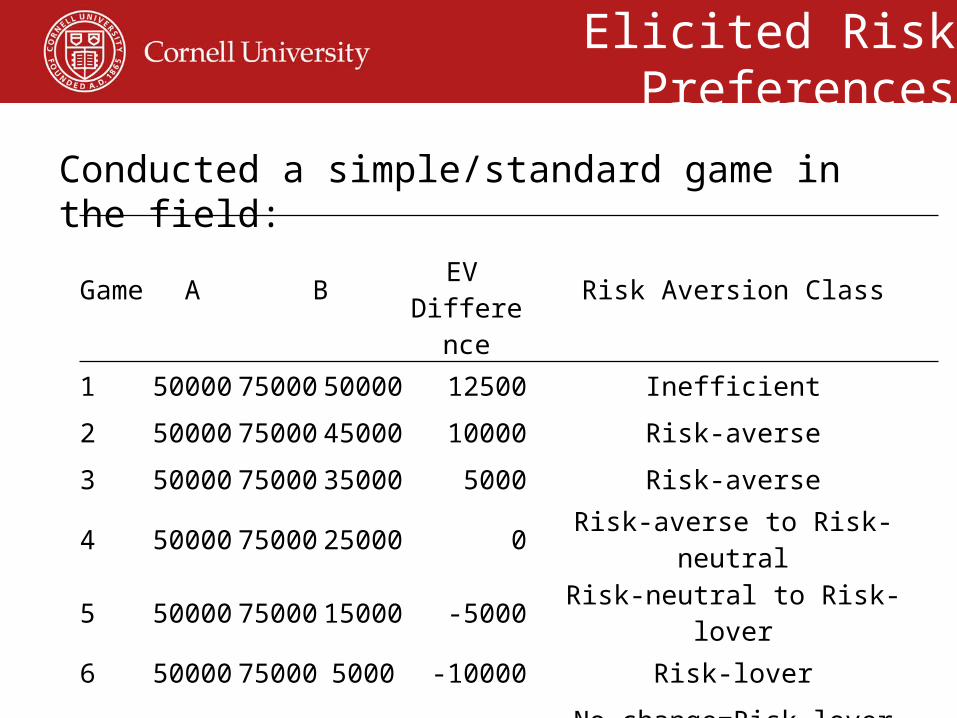
Conducted a simple/standard game in the field:
Game A B
EV Difference
Risk Aversion Class
1 50000 75000 50000 12500 Inefficient
2 50000 75000 45000 10000 Risk-averse
3 50000 75000 35000 5000 Risk-averse
4 50000 75000 25000 0 Risk-averse to Risk-neutral
5 50000 75000 15000 -5000 Risk-neutral to Risk-lover
6 50000 75000 5000 -10000 Risk-lover
No change=Risk-lover

0.2
.4.6
.81
Cum
mu
lative F
requ
en
cy
1 2 3 4 5 6 7# Game
SRI adopter Non-Adopter
Risk Averse
Risk Neutral
Risk Loving
Elicited Risk PreferencesNo real risk preference differences b/n SRI users/non-users:

Probit SRI Use Estimates
Probit Estimates Estimate (SE) Dummy equal to 1 if plot is in upstream 0.802***(0.238) Dummy equal to 1 if plot is in midstream 0.488** (0.199) Dummy equal to 1 if plot is in downstream 0.388 (0.242) Dummy equal to 1 if plot recieve water directly from canal 0.947*** (0.222) Size of plot (ha) 0.243* (0.141) Number of plots a household operates -0.121** (0.052) Dummy equal to 1 if a household head is female -0.823*** (0.294) Number of HH members age 6 and below -0.330*** (0.070) Number of HH members age 15 and above 0.071** (0.032) Number of HH members age between 6-14 0.026 (0.073) Proportion of male household members -0.432 (0.384) Number of agricultural technology advisors 0.010 (0.055) Dummy equal to 1 if at least one technology advisor ever adopt SRI 1.843*** (0.133) Dummy equal to 1 if household is risk averse -0.425* (0.228) Dummy equal to 1 if household is risk loving -0.002 (0.269)
Pseudo R-squared 0.379
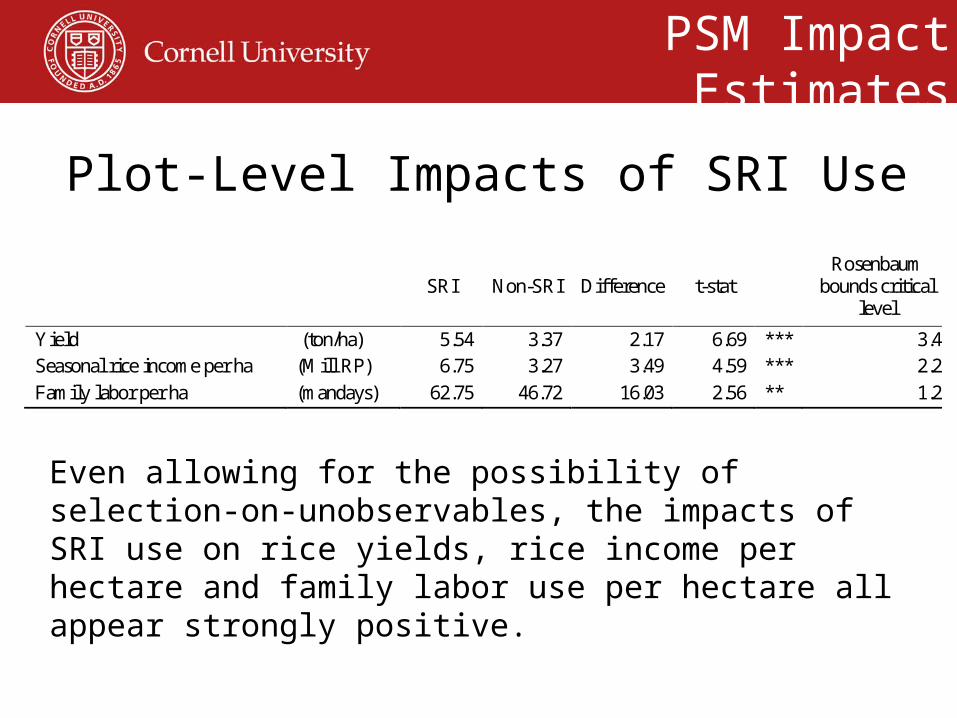
Plot-Level Impacts of SRI Use
PSM Impact Estimates
SRI Non-SRI Difference t-stat Rosenbaum
bounds critical level
Yield (ton/ha) 5.54 3.37 2.17 6.69 *** 3.4 Seasonal rice income per ha (Mill RP) 6.75 3.27 3.49 4.59 *** 2.2
Family labor per ha (mandays) 62.75 46.72 16.03 2.56 ** 1.2
Even allowing for the possibility of selection-on-unobservables, the impacts of SRI use on rice yields, rice income per hectare and family labor use per hectare all appear strongly positive.
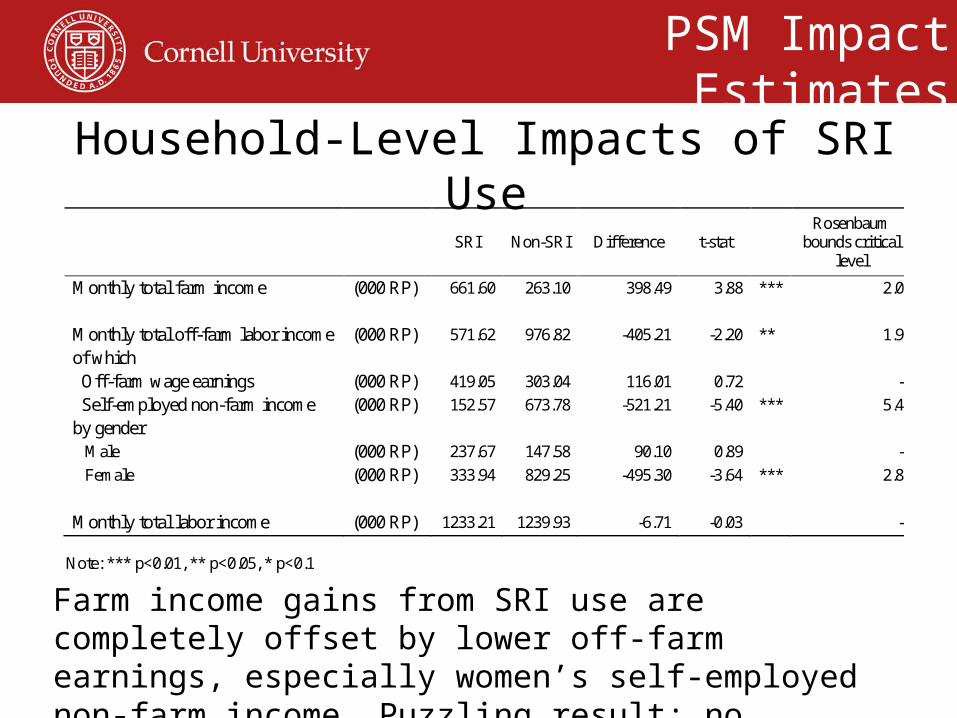
PSM Impact Estimates
Household-Level Impacts of SRI Use SRI Non-SRI Difference t-stat
Rosenbaum bounds critical
level
Monthly total farm income (000 RP) 661.60 263.10 398.49 3.88 *** 2.0
Monthly total off-farm labor income (000 RP) 571.62 976.82 -405.21 -2.20 ** 1.9
of which
Off-farm wage earnings (000 RP) 419.05 303.04 116.01 0.72
-
Self-employed non-farm income (000 RP) 152.57 673.78 -521.21 -5.40 *** 5.4
by gender
Male (000 RP) 237.67 147.58 90.10 0.89
-
Female (000 RP) 333.94 829.25 -495.30 -3.64 *** 2.8
Monthly total labor income (000 RP) 1233.21 1239.93 -6.71 -0.03 -
Note: *** p<0.01, ** p<0.05, * p<0.1
Farm income gains from SRI use are completely offset by lower off-farm earnings, especially women’s self-employed non-farm income. Puzzling result: no household income gains from SRI.

PSM Impact Estimates
Household-Level Impacts of SRI Use
Despite increased labor demands of SRI use, children in SRI using households are no less likely to attend school or no more likely to be delayed in school progress. Reflects offsetting income effects of productivity gains and substitution effects on labor demand?
SRI Non-SRI Difference t-stat
The proportion of school-aged children actually go to school 0.92 0.92 0.01 0.16 of which
Male 0.99 0.95 0.04 0.65 Female 0.88 0.89 -0.02 -0.26 The proportion of school-aged children lagged behind 0.12 0.11 0.01 0.19 of which
Male 0.01 0.07 -0.05 -0.79
Female 0.20 0.15 0.05 0.62
Note: *** p<0.01, ** p<0.05, * p<0.1

We corroborate claims of SRI’s tremendous plot level productivity gains, but also of increased labor demand.
But we find that these productivity gains vanish at household level. SRI seems to induce reallocation of (women’s) time from off-farm (self-)employment, wiping out income gains.
Some of those are perhaps invested in keeping children in school in spite of higher returns to family labor on-farm.
Puzzle: where do the productivity gains go? Why no disadoption?
Conclusions

Thank you for your time, interest and insights
Thank you!