Embed Size (px)
Citation preview
10th Biopathways meeting, 27 June 2009
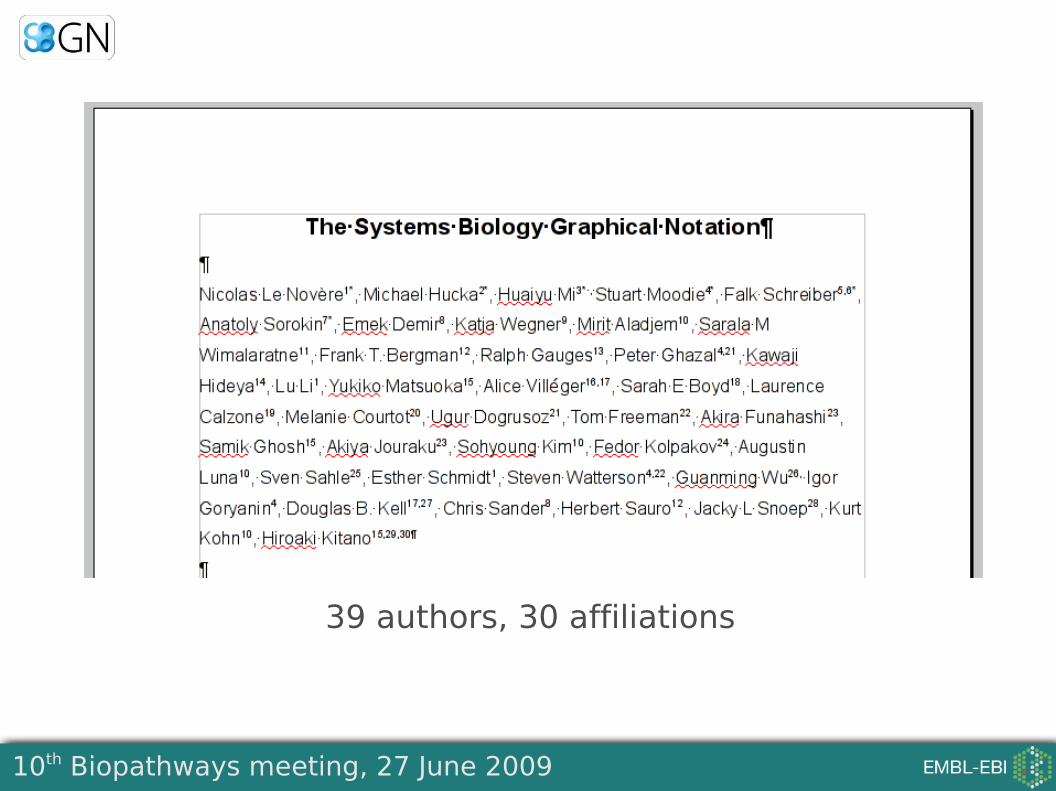
The Systems Biology Graphical Notation
Nicolas Le Novère, EMBL-EBI
(on the behalf of SBGN editors, authors and contributors)
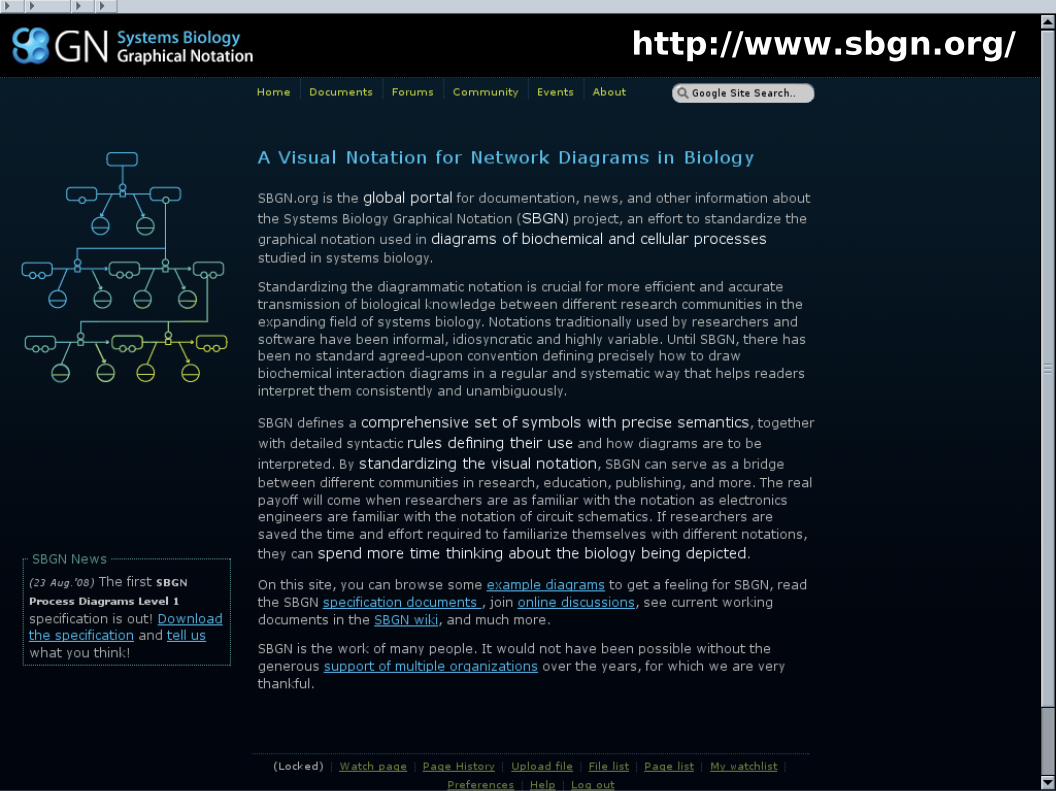
http://www.sbgn.org/
10th Biopathways meeting, 27 June 2009
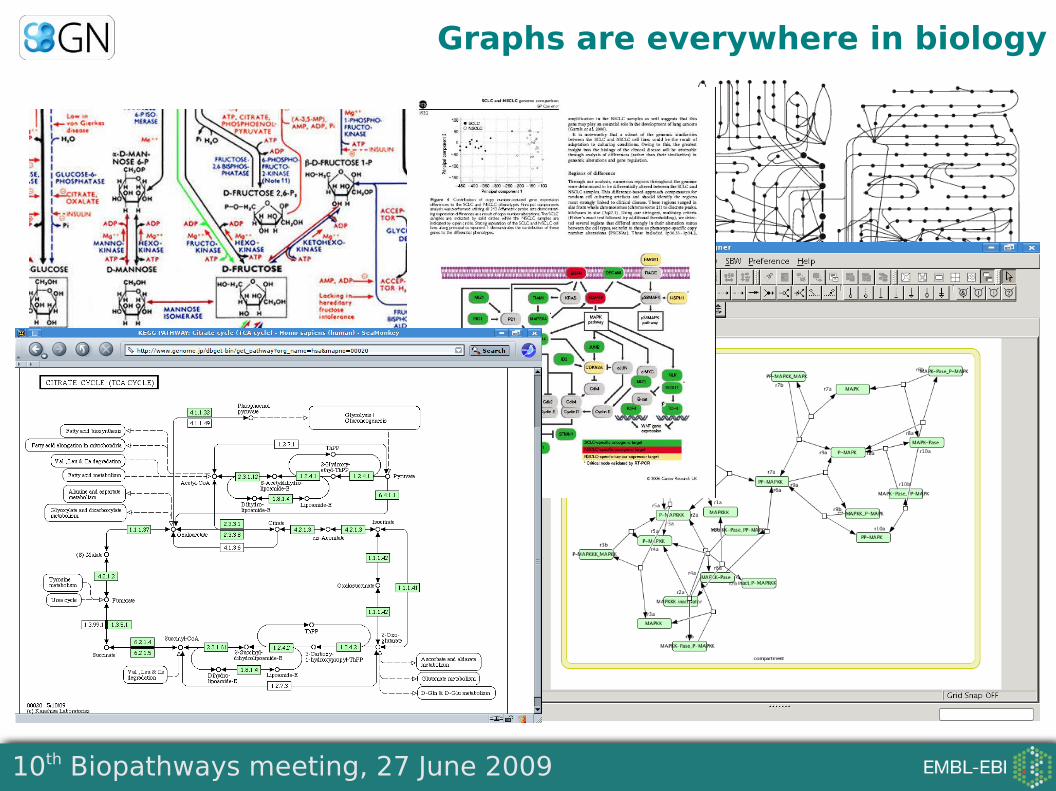
Graphs are everywhere in biology
10th Biopathways meeting, 27 June 2009
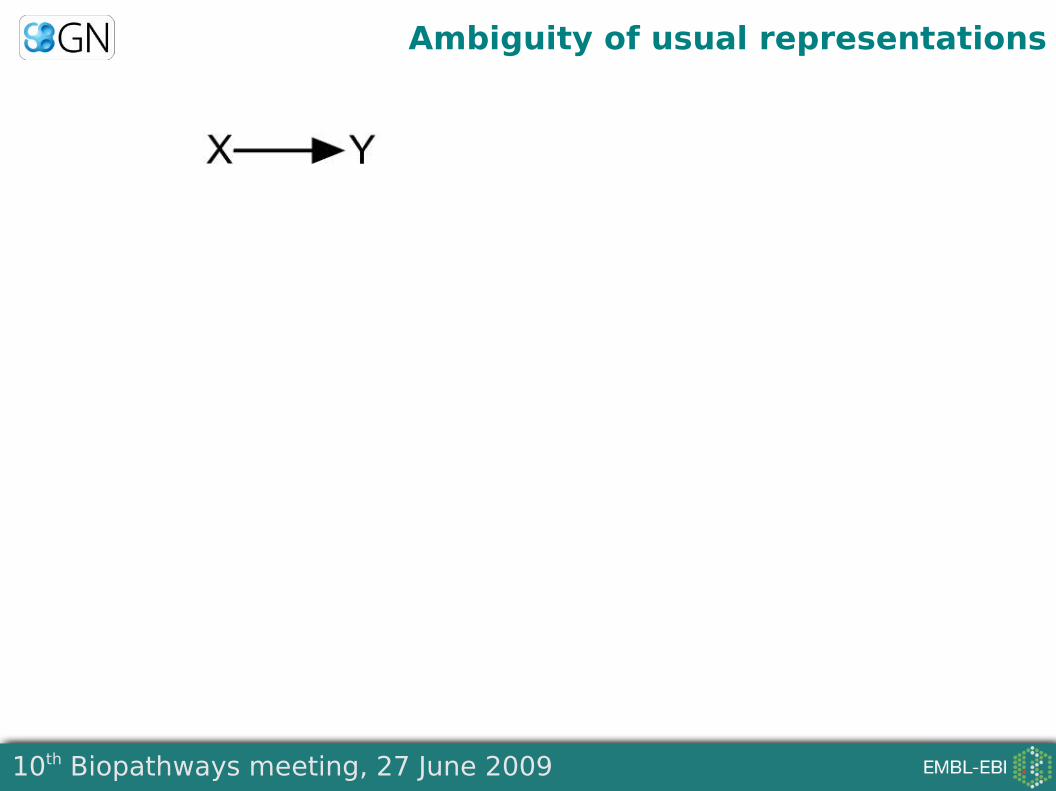
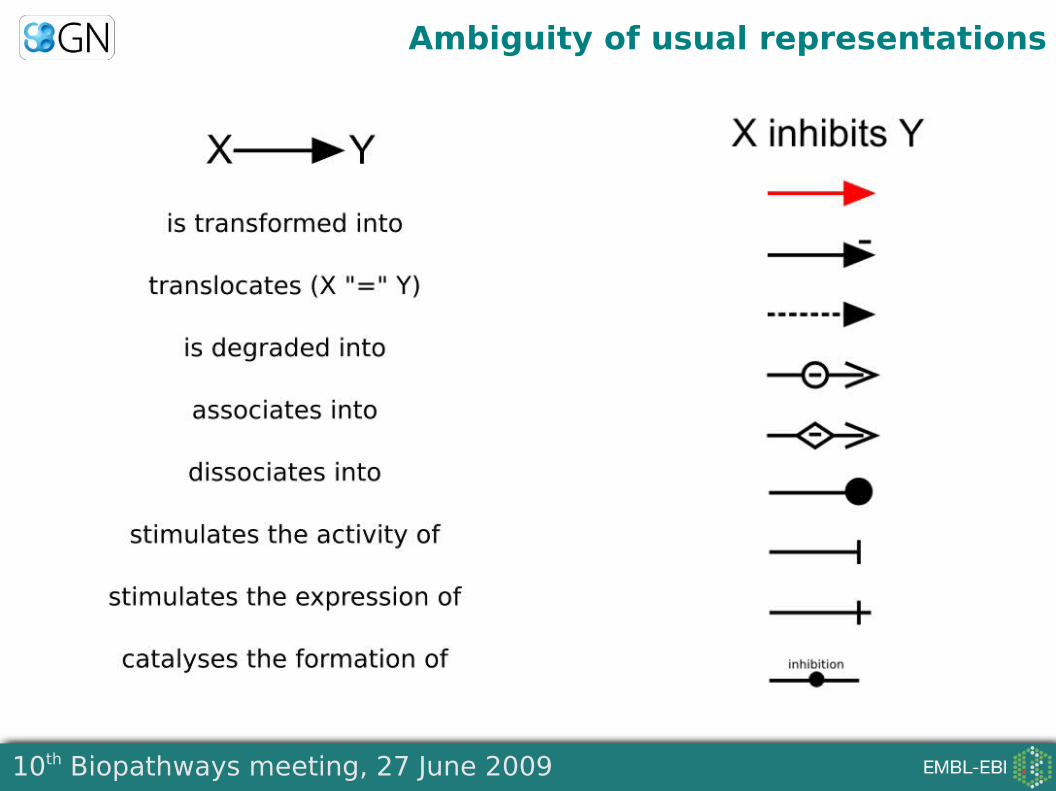
Ambiguity of usual representations
10th Biopathways meeting, 27 June 2009
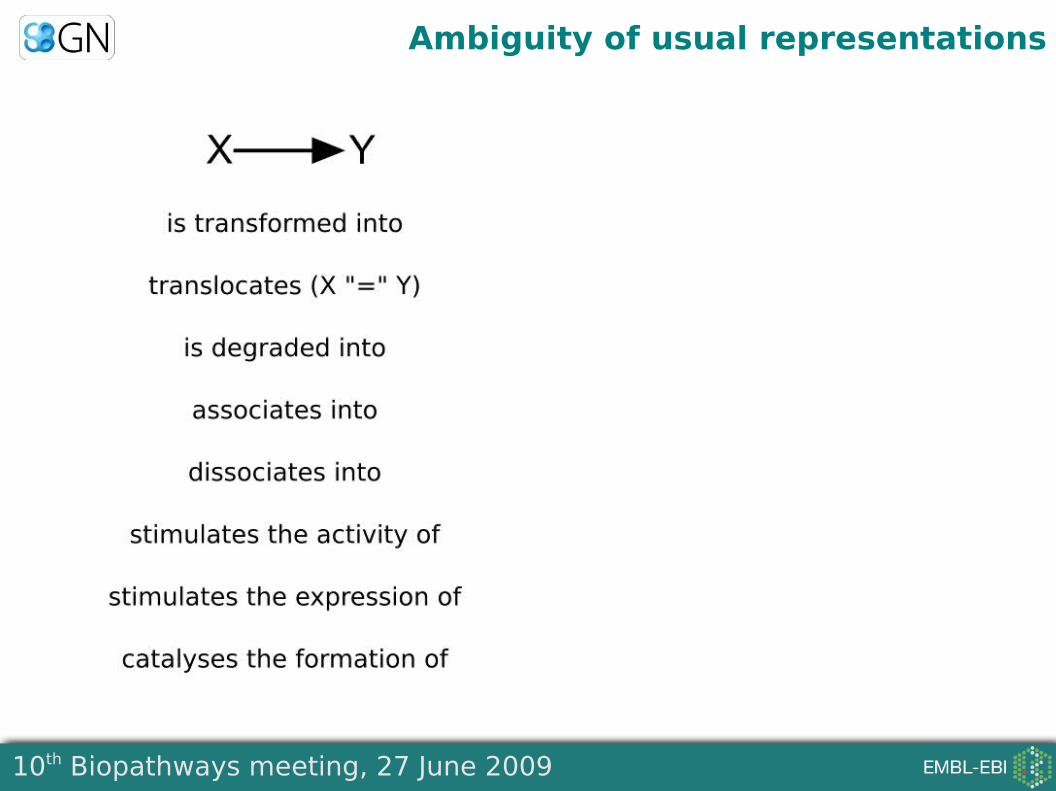
Ambiguity of usual representations
10th Biopathways meeting, 27 June 2009
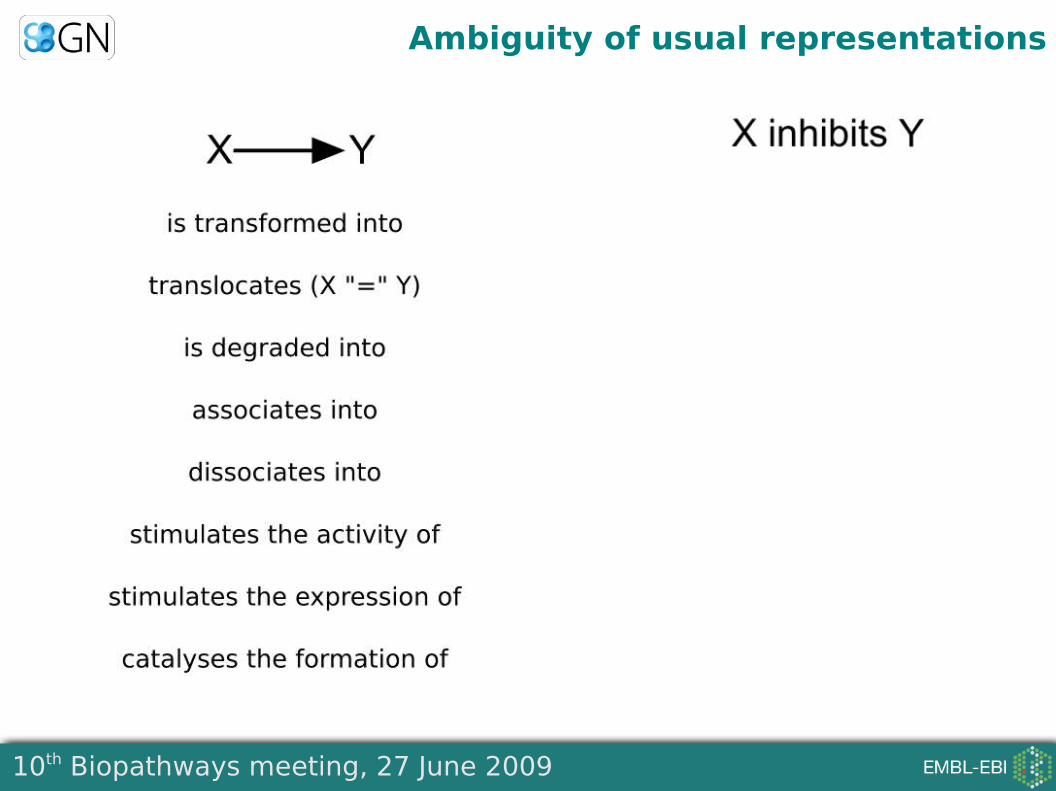
Ambiguity of usual representations
10th Biopathways meeting, 27 June 2009
Ambiguity of usual representations
10th Biopathways meeting, 27 June 2009
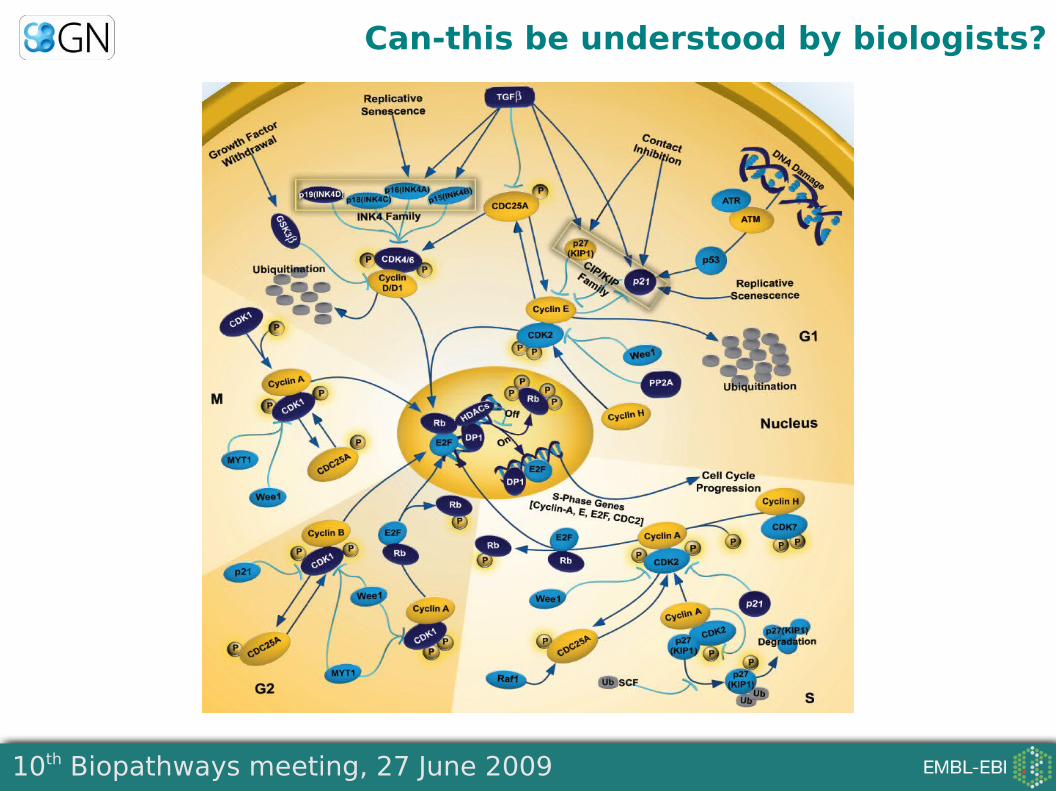
Can-this be understood by biologists?
10th Biopathways meeting, 27 June 2009
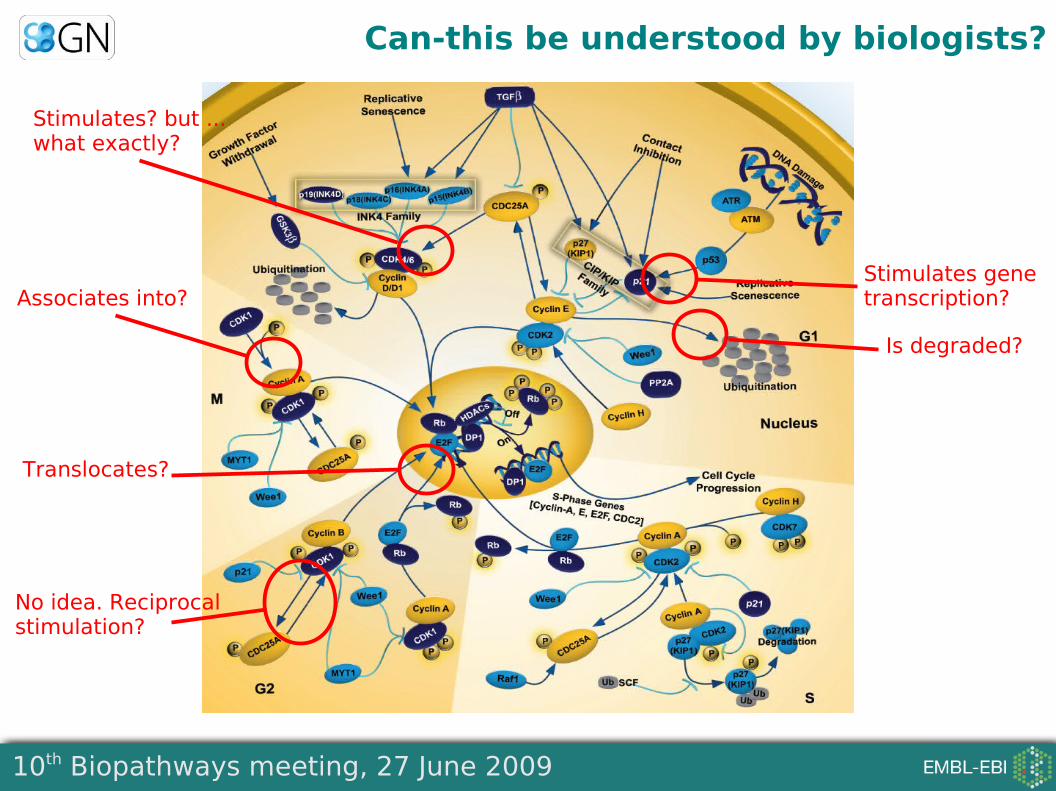
Can-this be understood by biologists?
Stimulates? but ... what exactly?
Associates into?
Translocates?
No idea. Reciprocalstimulation?
Is degraded?
Stimulates genetranscription?
10th Biopathways meeting, 27 June 2009
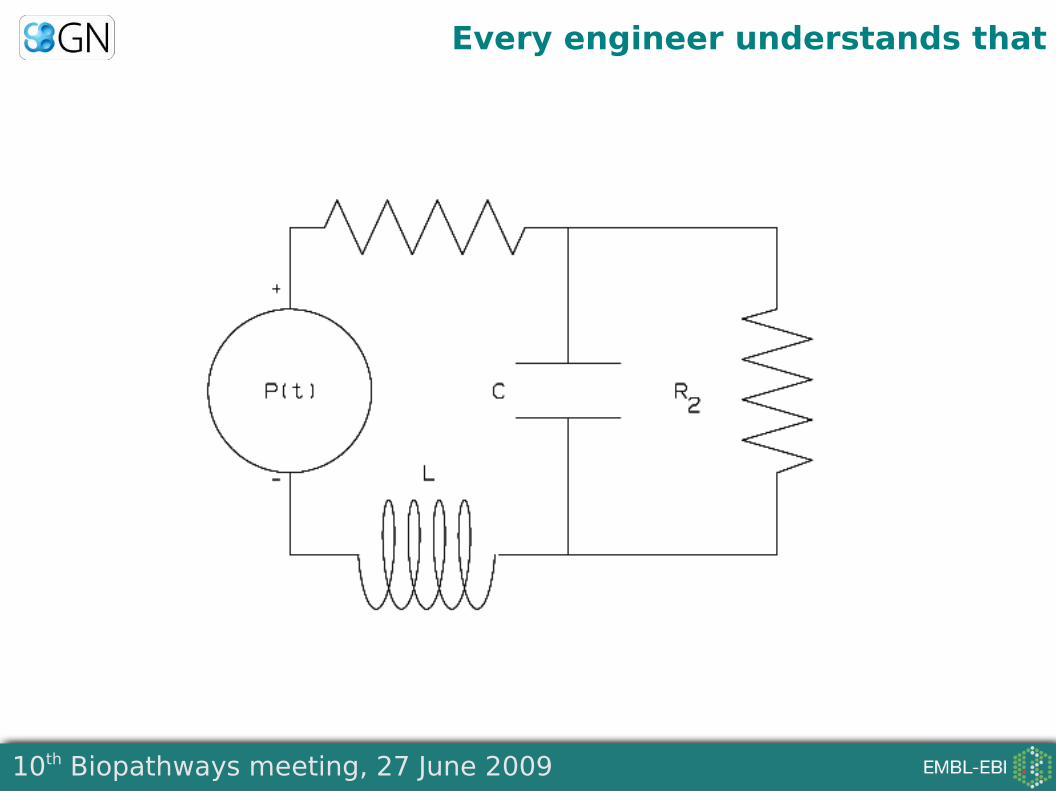
Every engineer understands that
10th Biopathways meeting, 27 June 2009
Or that
10th Biopathways meeting, 27 June 2009
Why can-we understand electric diagrams?
Standard symbols
Simple shapes, easily recognisable
Limited number of basic symbols (<70)
Similarity of shapes reflects similarity of functions
Unambiguous interpretation of the circuits
Endorsed by the community for practical reasons
End-users: manufacturers
Tool developers
Publishing industry
Teaching communities
10th Biopathways meeting, 27 June 2009
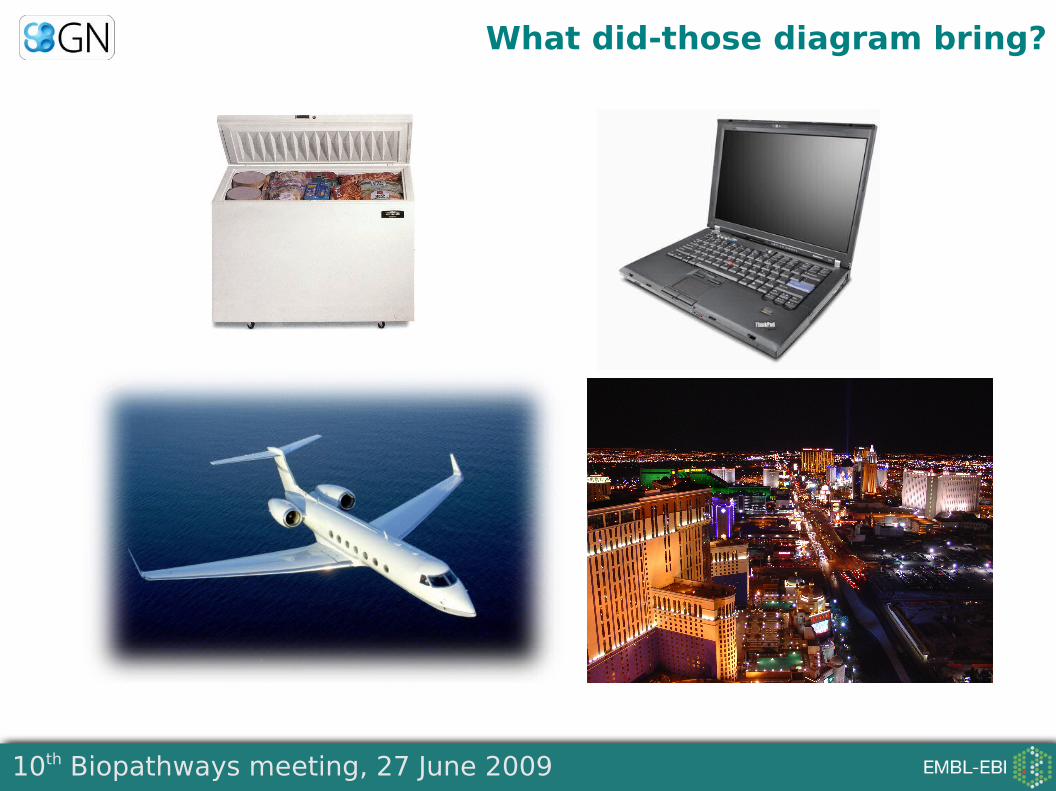
What did-those diagram bring?
10th Biopathways meeting, 27 June 2009
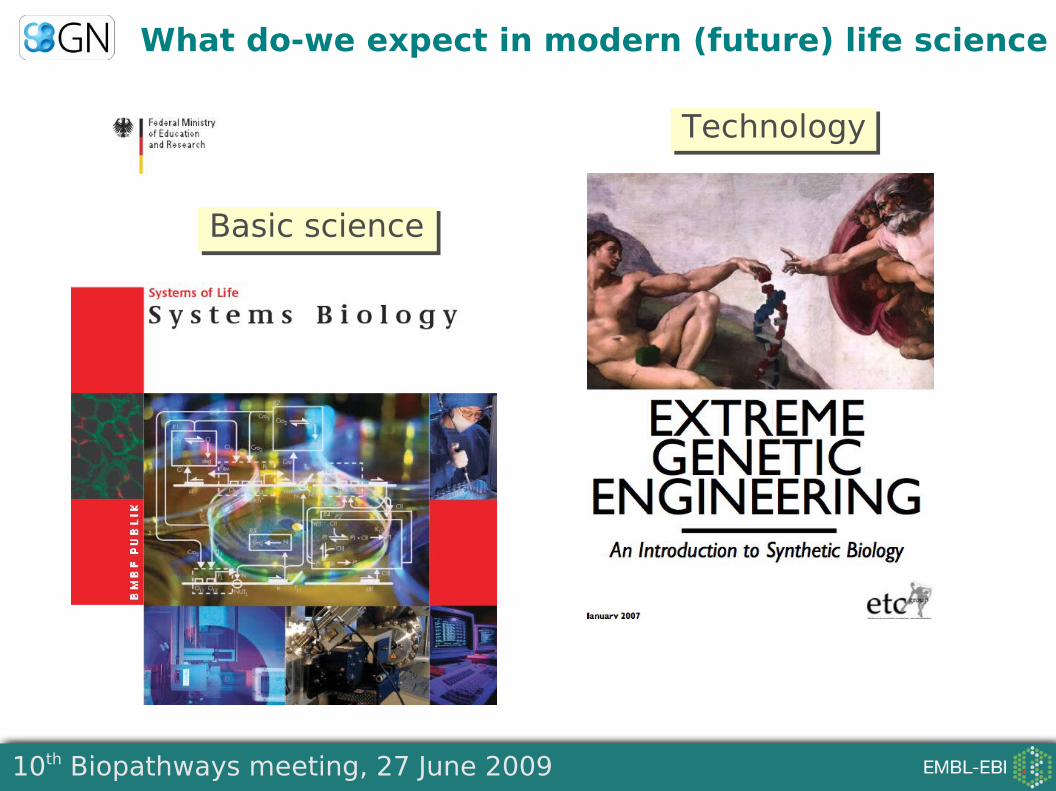
What do-we expect in modern (future) life science
Basic science
Technology
10th Biopathways meeting, 27 June 2009
EntersThe Systems Biology Markup Language
http://www.sbgn.org/
10th Biopathways meeting, 27 June 2009
What is SBGN?
A way to unambiguously describe biochemical and cellular events in graphs
Limited amount of symbols Smooth learning curve
Can graphically represent quantitative models, biochemical pathways, at different levels of granularity
Developed over three years by a growing community
10th Biopathways meeting, 27 June 2009
39 authors, 30 affiliations
10th Biopathways meeting, 27 June 2009
What is SBGN?
A way to unambiguously describe biochemical and cellular events in graphs
Limited amount of symbols Smooth learning curve
Can graphically represent quantitative models, biochemical pathways, at different levels of granularity
Developed over three years by a growing community
Three languages
Process Diagrams one state = one glyph, biochemical level
Entity Relationships one entity = one glyph, biochemical level
Activity Flow conceptual level
10th Biopathways meeting, 27 June 2009
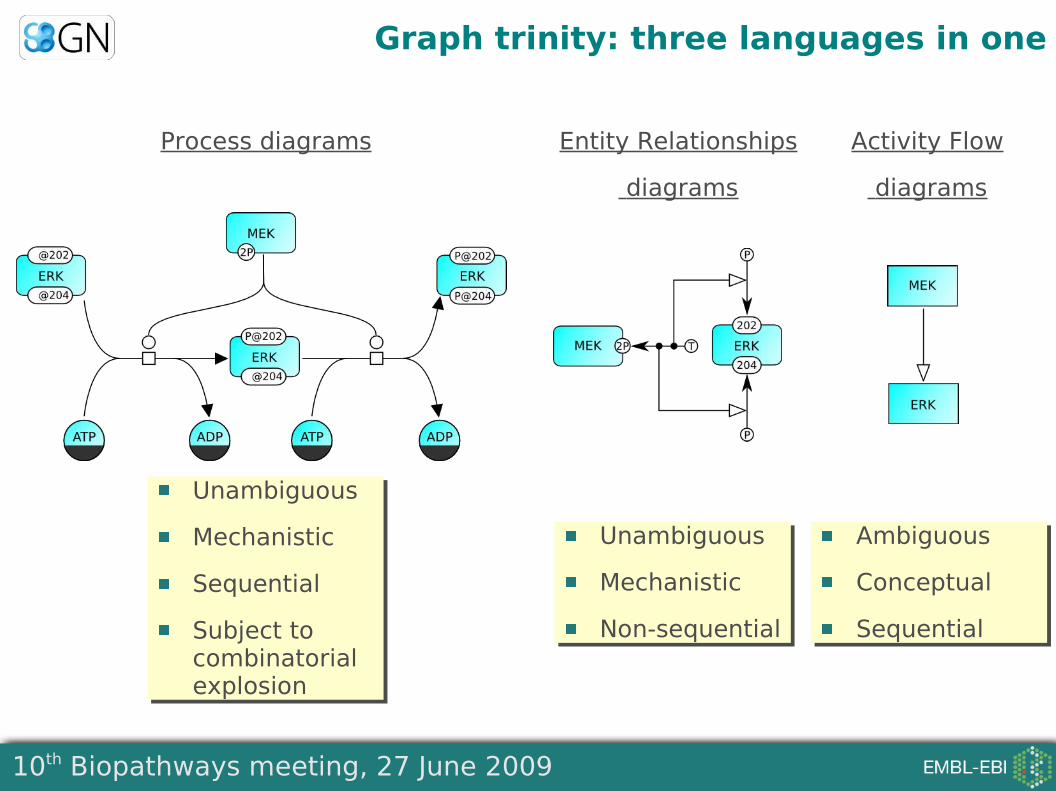
Graph trinity: three languages in one
Unambiguous
Mechanistic
Sequential
Subject to combinatorial explosion
Process diagrams Entity Relationships
diagrams
Activity Flow
diagrams
Unambiguous
Mechanistic
Non-sequential
Ambiguous
Conceptual
Sequential
10th Biopathways meeting, 27 June 2009
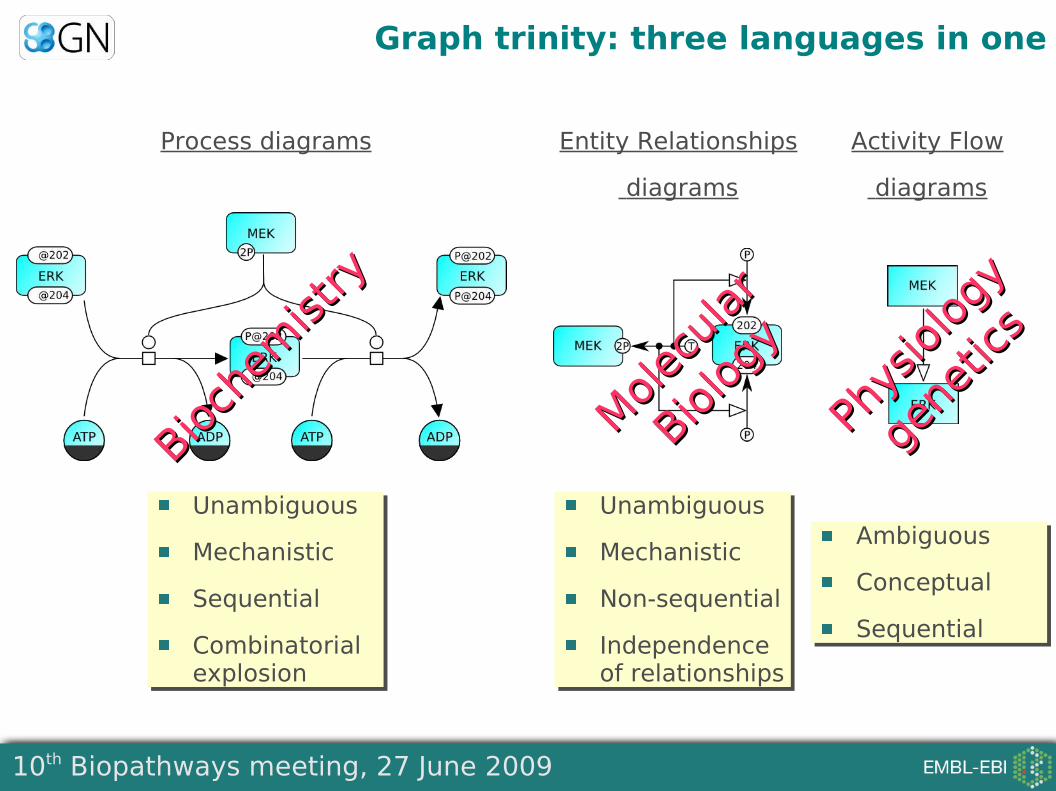
Graph trinity: three languages in one
Unambiguous
Mechanistic
Sequential
Combinatorial explosion
Process diagrams Entity Relationships
diagrams
Activity Flow
diagrams
Unambiguous
Mechanistic
Non-sequential
Independence of relationships
Ambiguous
Conceptual
Sequential
Bioch
emist
ry
Bioch
emist
ry
Molec
ular
Molec
ular
Biology
Biology
Phys
iology
Phys
iology
gene
tics
gene
tics
10th Biopathways meeting, 27 June 2009
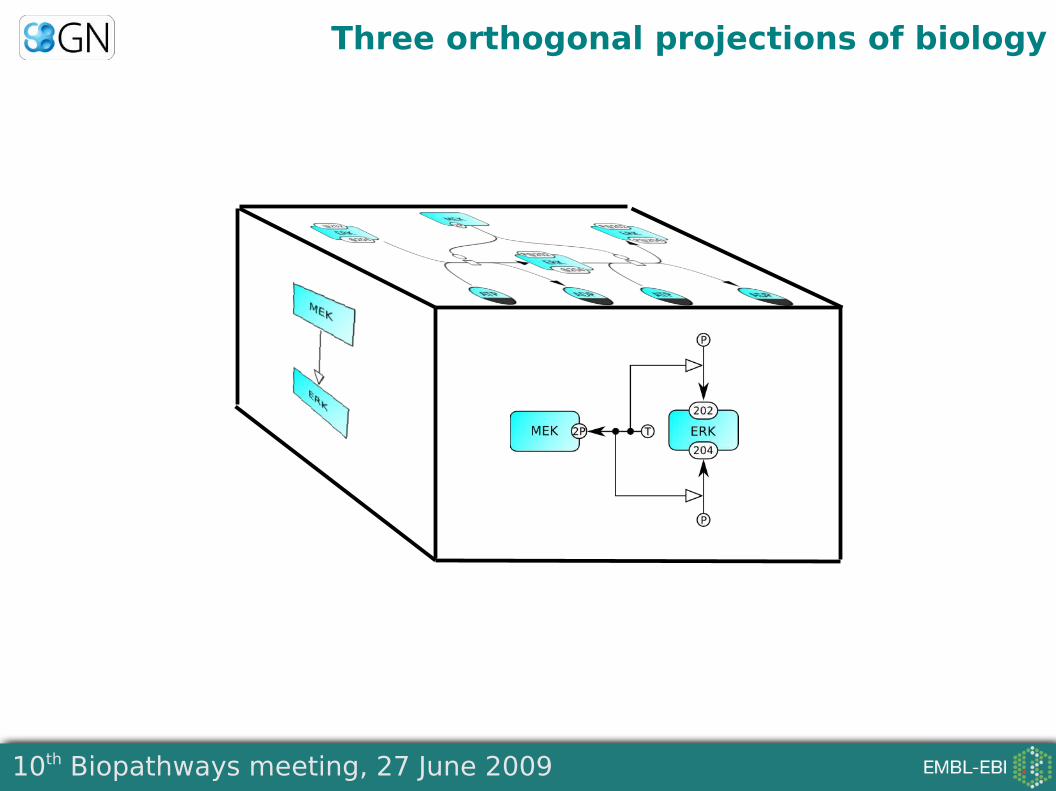
Three orthogonal projections of biology
10th Biopathways meeting, 27 June 2009
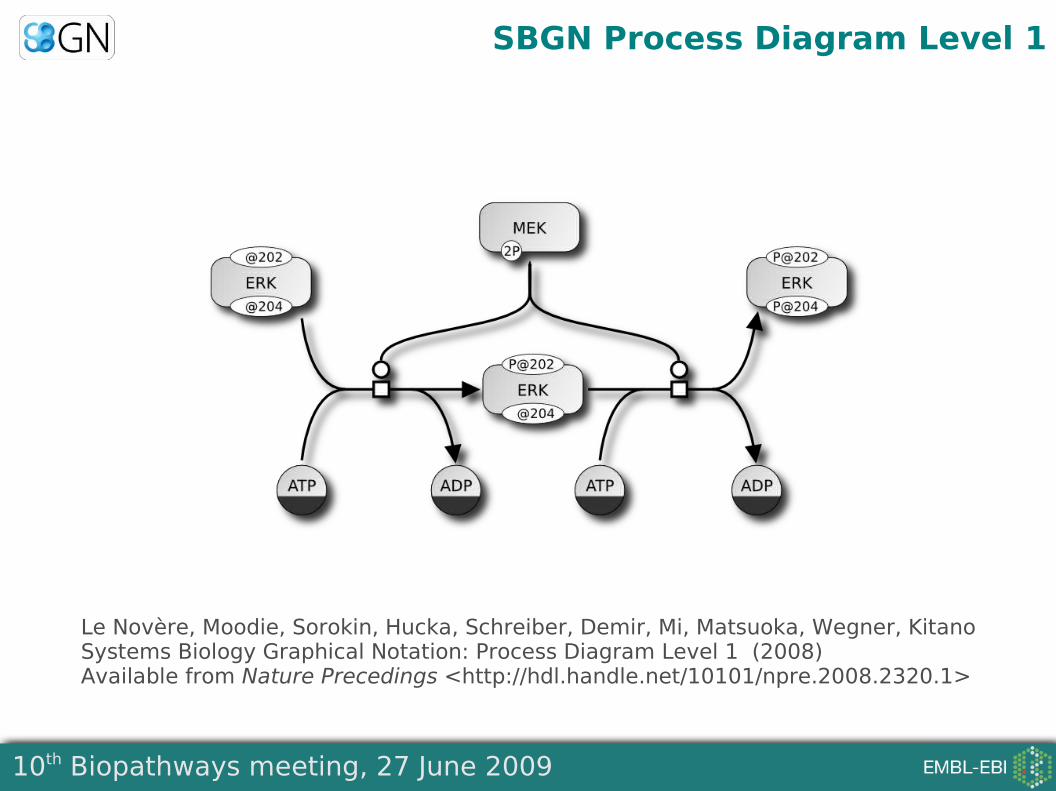
SBGN Process Diagram Level 1
Le Novère, Moodie, Sorokin, Hucka, Schreiber, Demir, Mi, Matsuoka, Wegner, Kitano Systems Biology Graphical Notation: Process Diagram Level 1 (2008)Available from Nature Precedings <http://hdl.handle.net/10101/npre.2008.2320.1>
10th Biopathways meeting, 27 June 2009
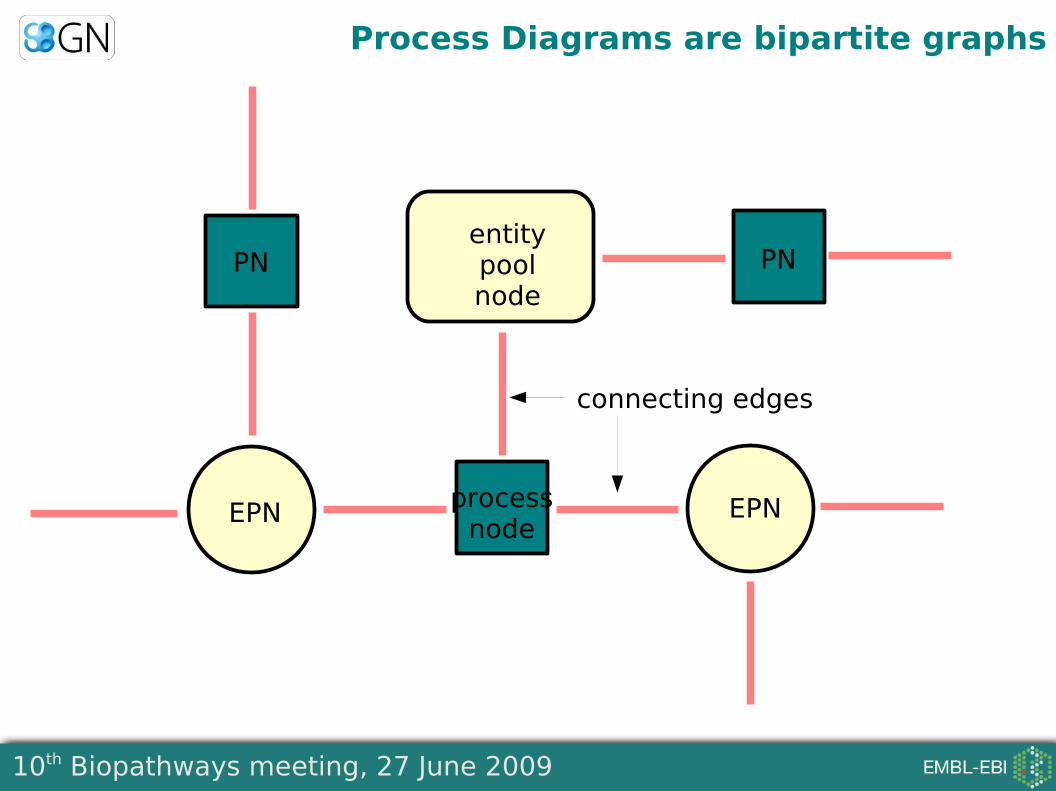
Process Diagrams are bipartite graphs
processnode
entitypoolnode
EPN EPN
PN
connecting edges
PN
10th Biopathways meeting, 27 June 2009
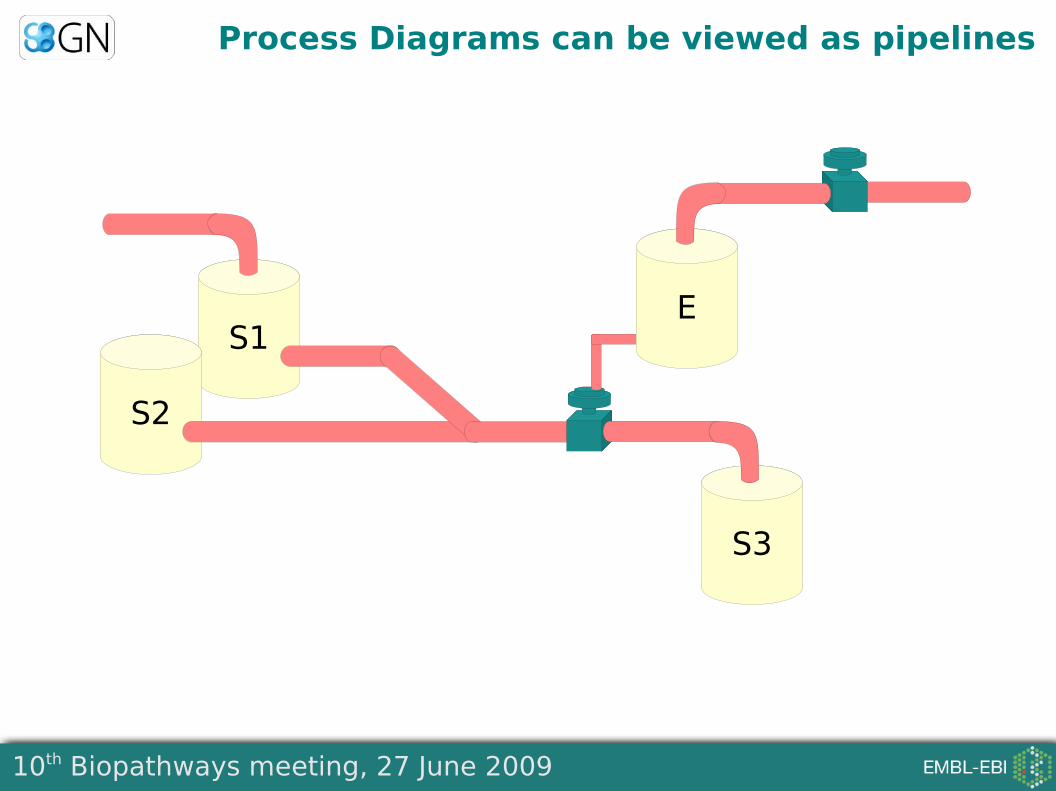
Process Diagrams can be viewed as pipelines
S1
S2
S3
E
10th Biopathways meeting, 27 June 2009
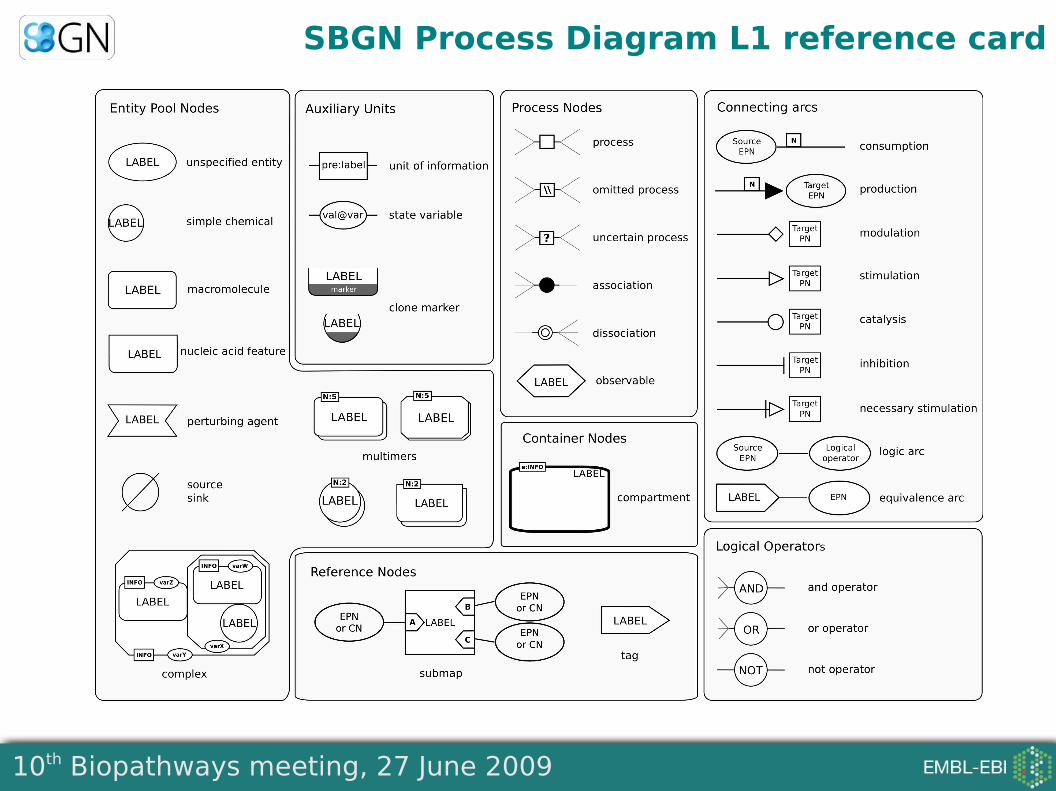
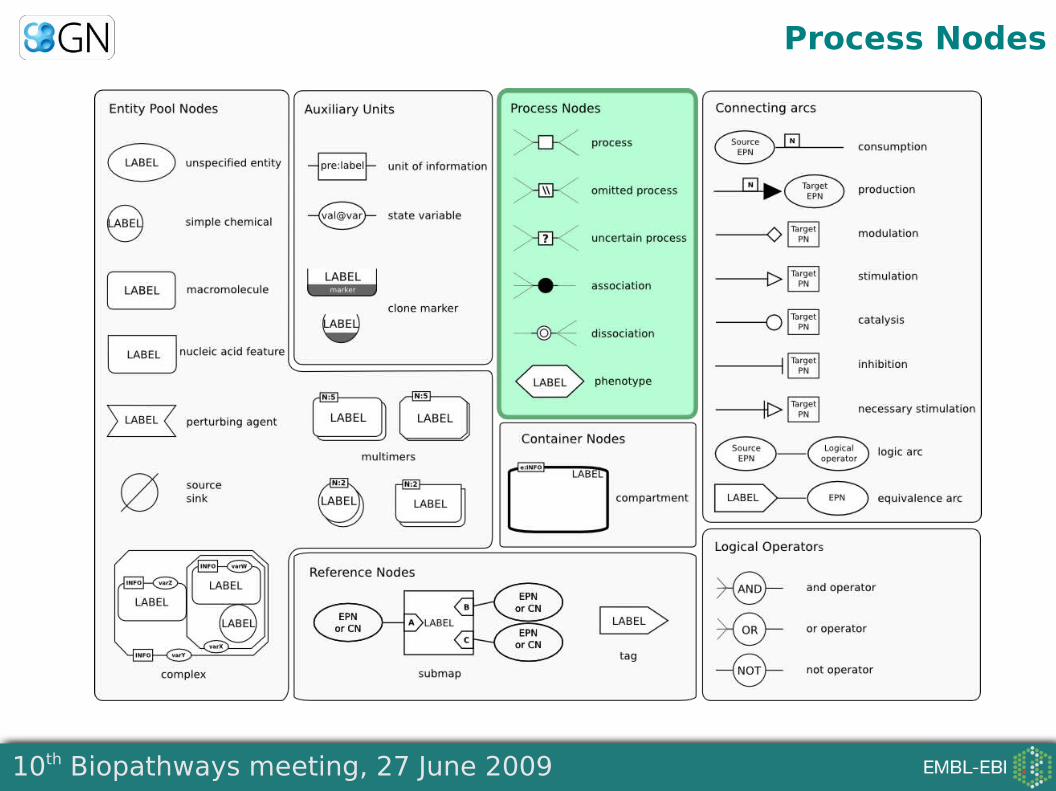
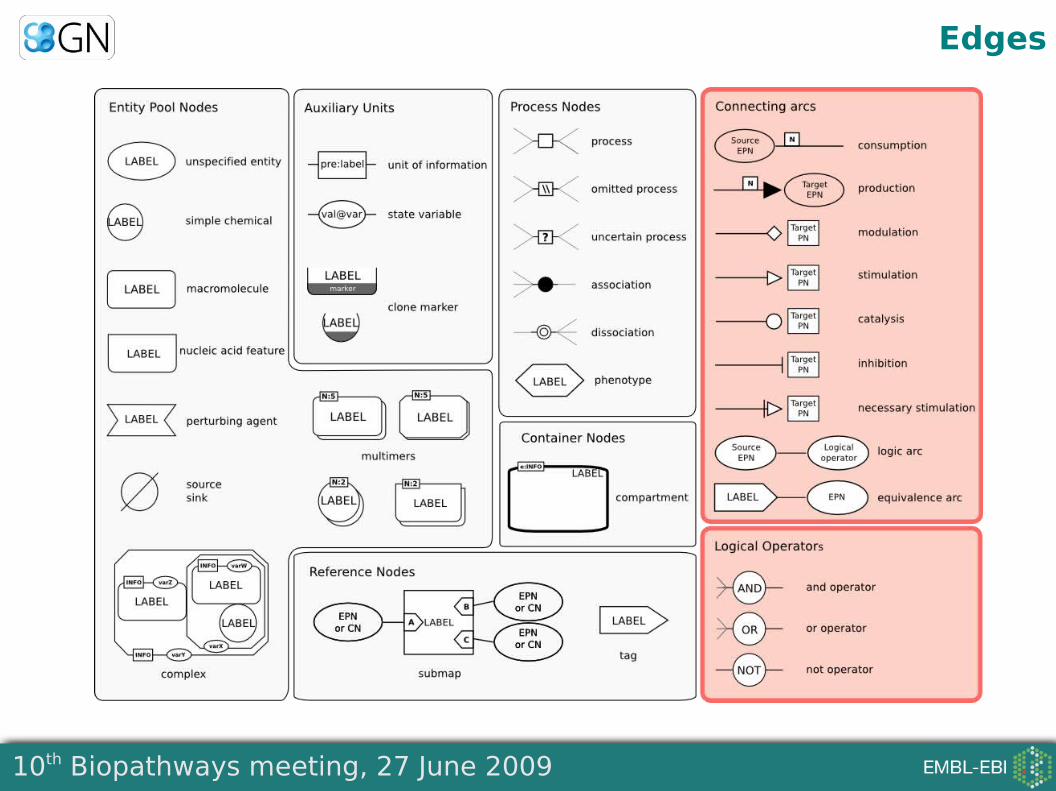
SBGN Process Diagram L1 reference card
10th Biopathways meeting, 27 June 2009
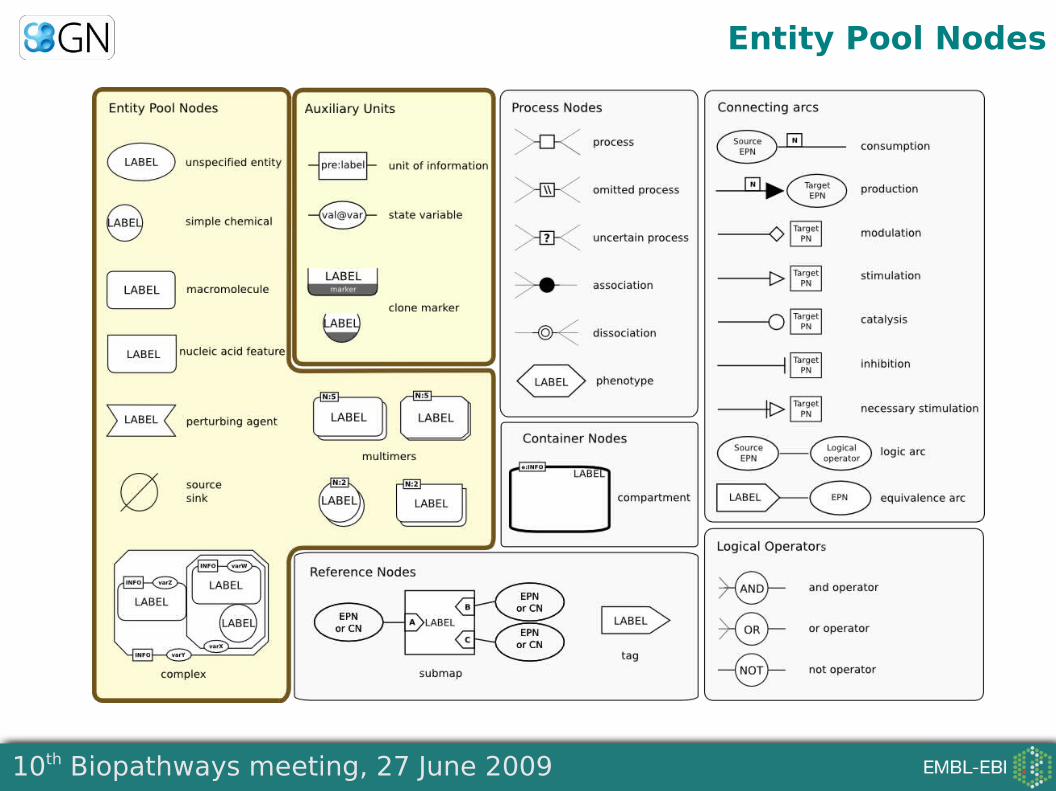
Entity Pool Nodes
10th Biopathways meeting, 27 June 2009
Process Nodes
10th Biopathways meeting, 27 June 2009
Edges
10th Biopathways meeting, 27 June 2009
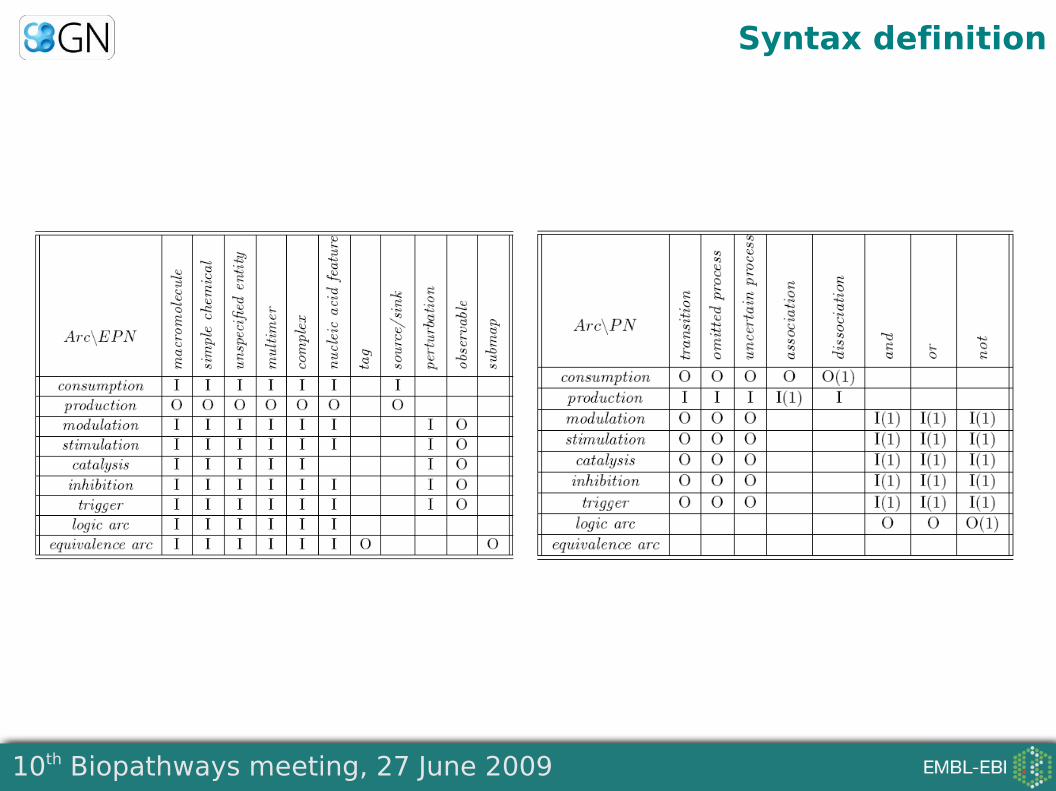
Syntax definition
10th Biopathways meeting, 27 June 2009
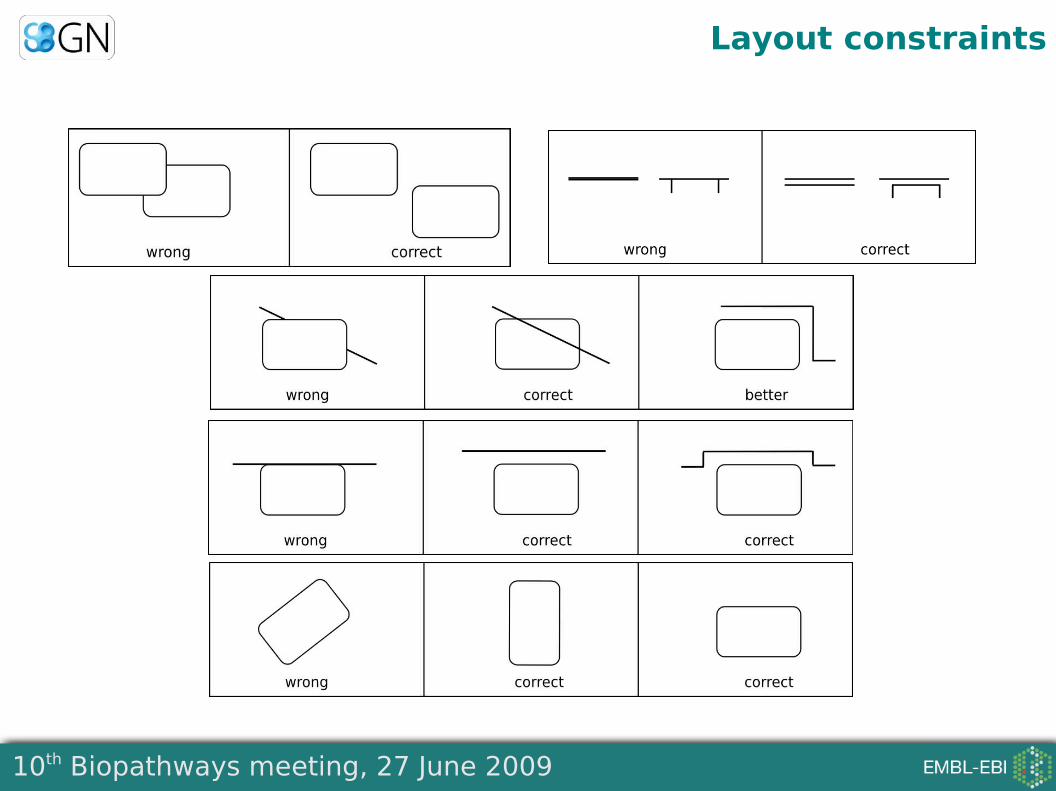
Layout constraints
10th Biopathways meeting, 27 June 2009
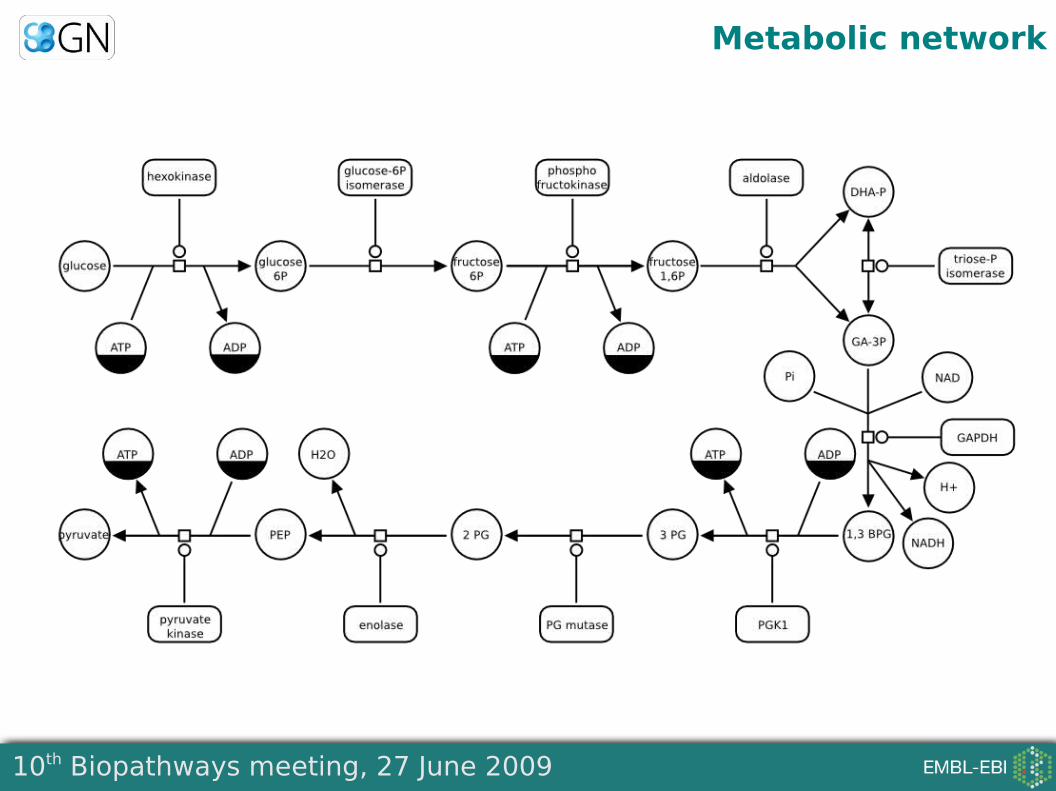
Metabolic network
10th Biopathways meeting, 27 June 2009
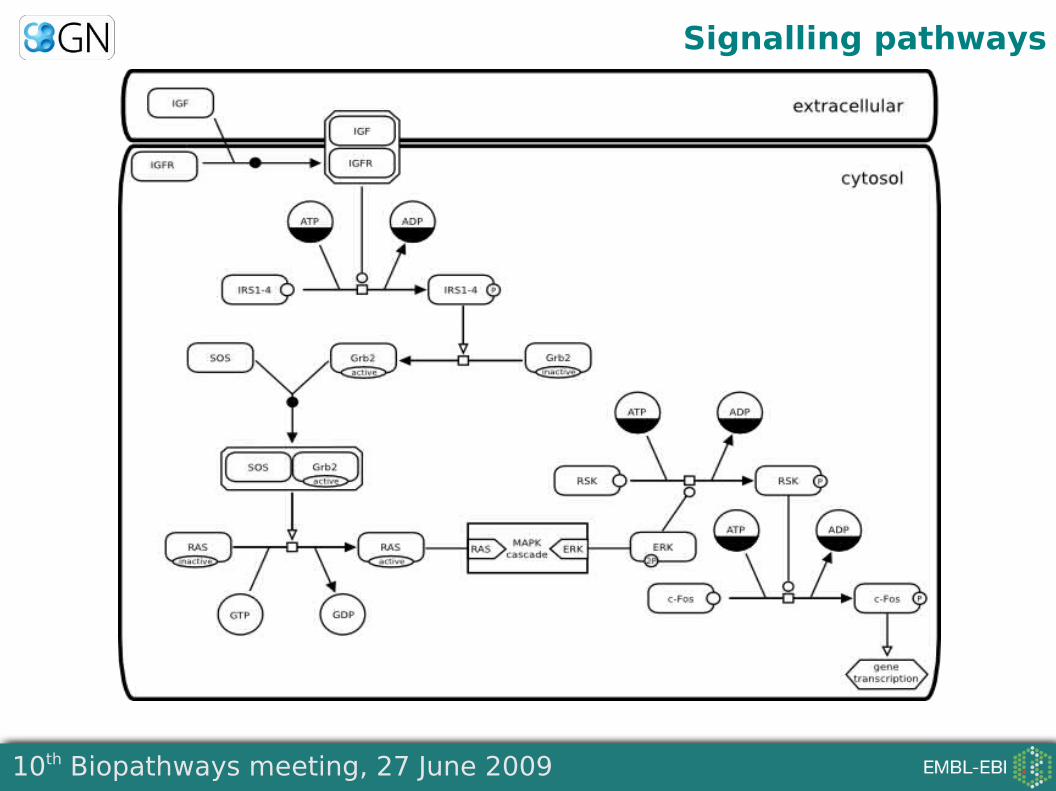
Signalling pathways
10th Biopathways meeting, 27 June 2009
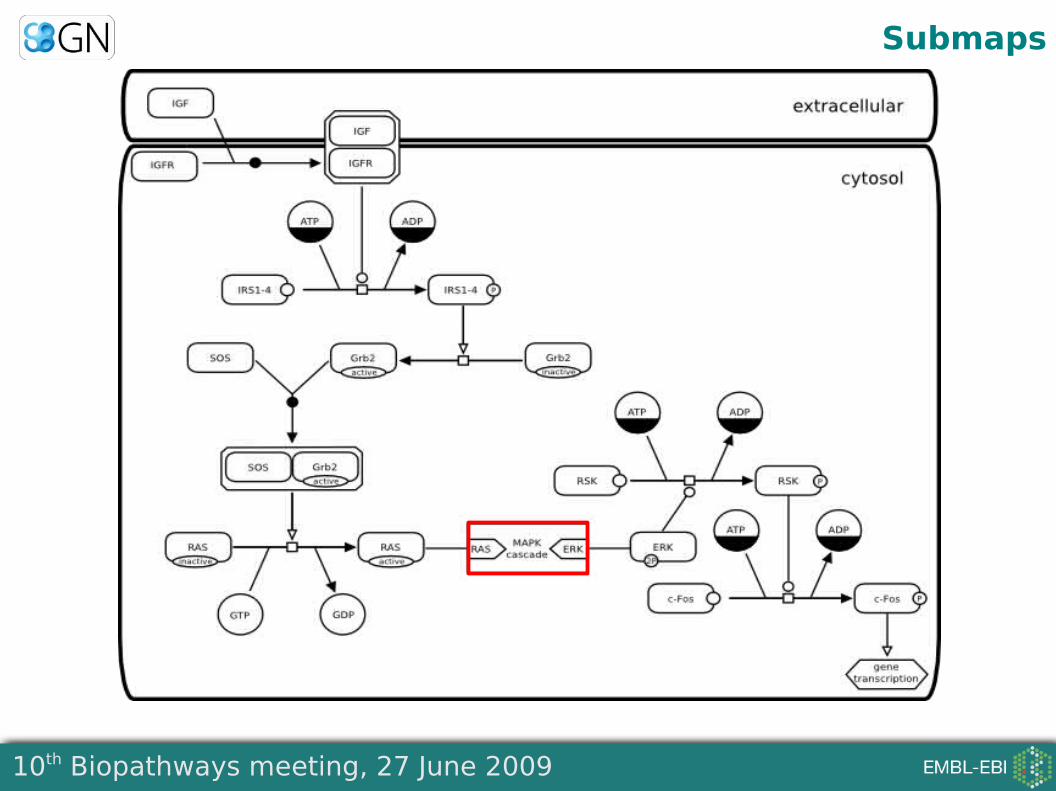
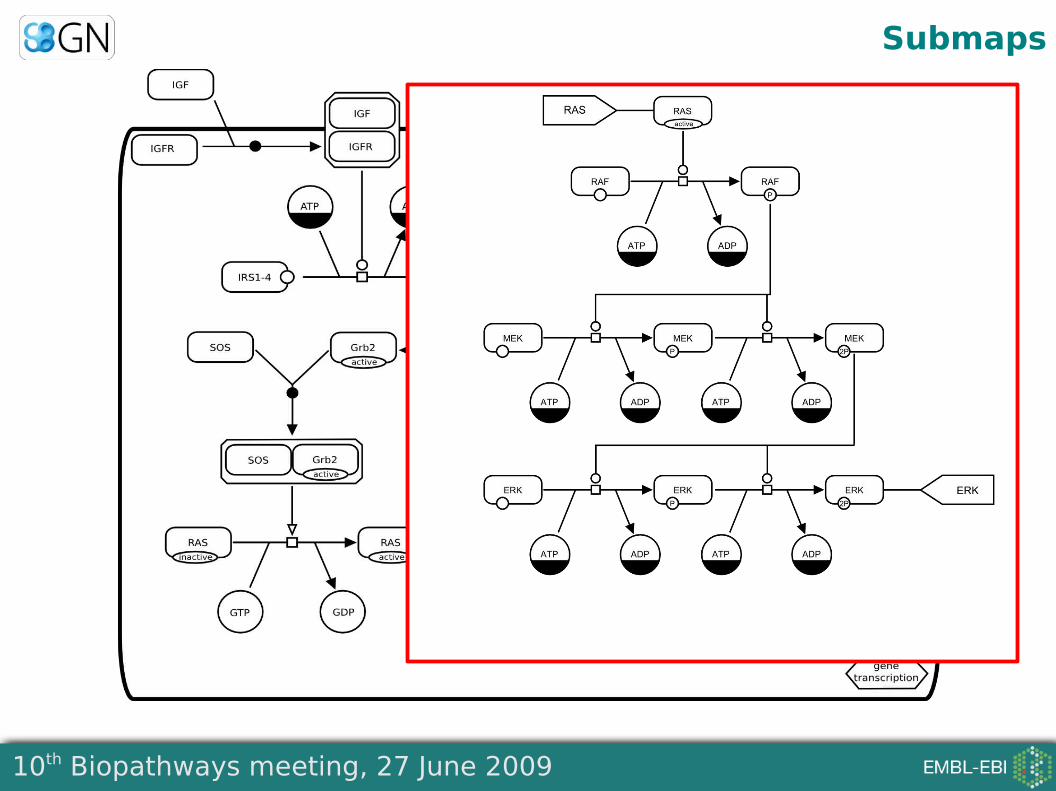
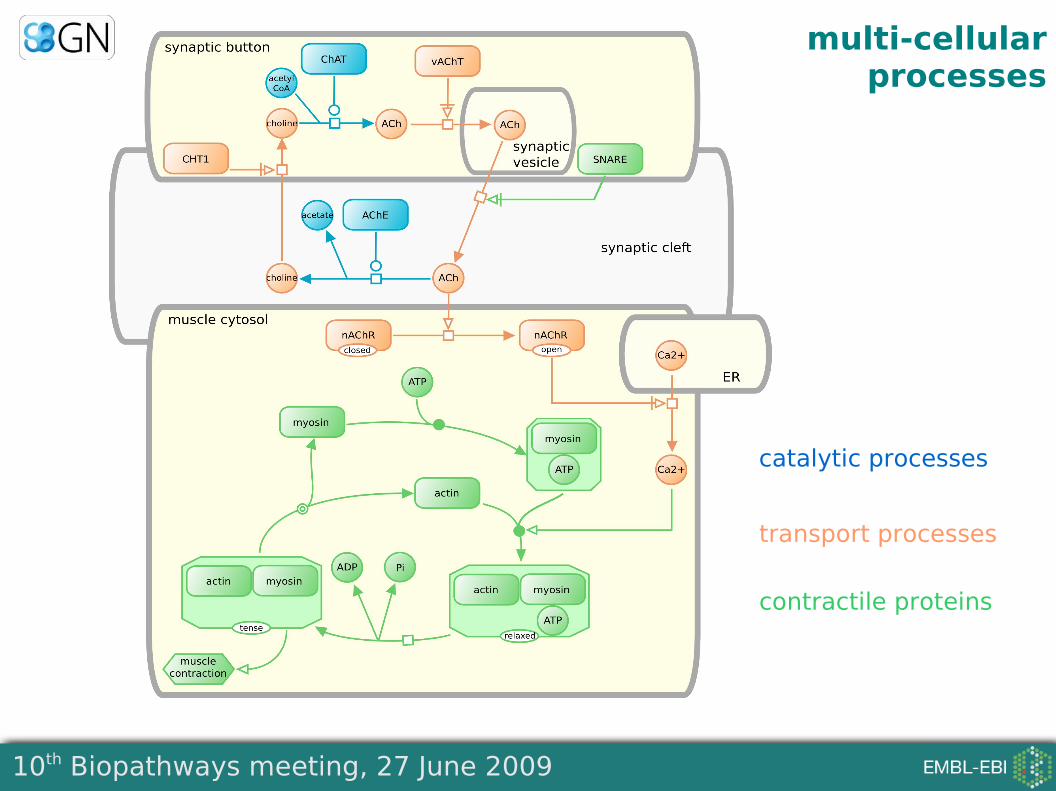
Submaps
10th Biopathways meeting, 27 June 2009
Submaps
10th Biopathways meeting, 27 June 2009
multi-cellularprocesses
catalytic processes
transport processes
contractile proteins
10th Biopathways meeting, 27 June 2009
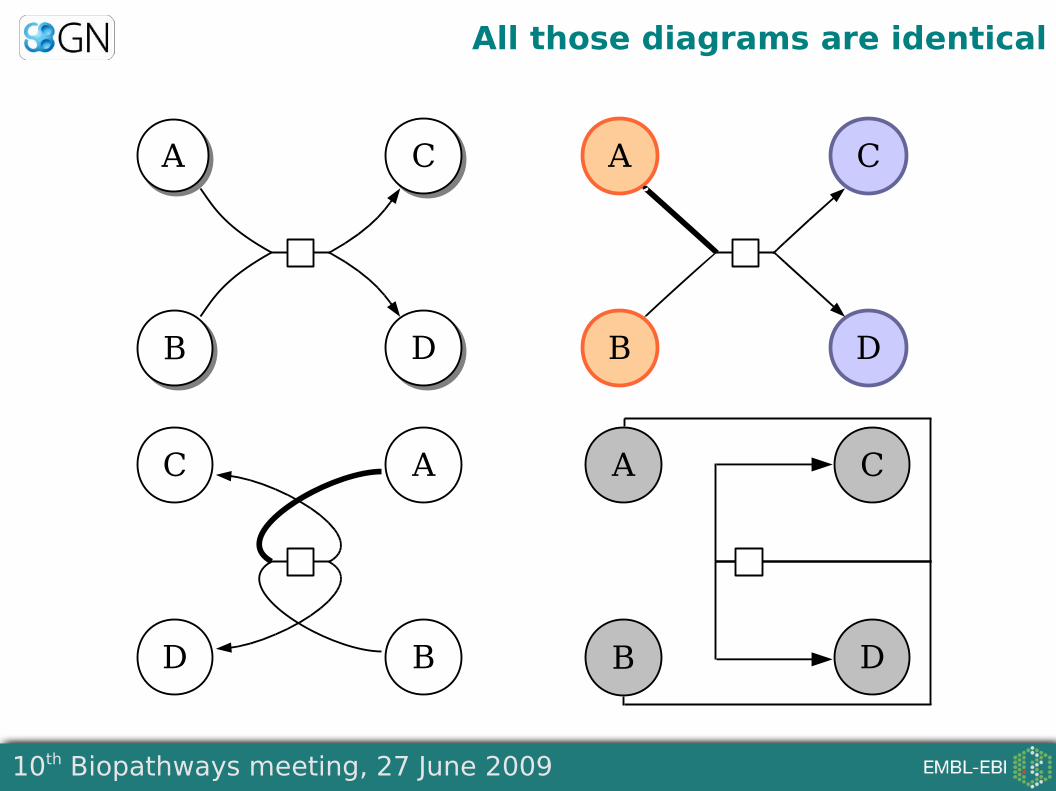
All those diagrams are identical
C
D
A
B
C
D
A
B
A
B
C
D
C
D
A
B
10th Biopathways meeting, 27 June 2009
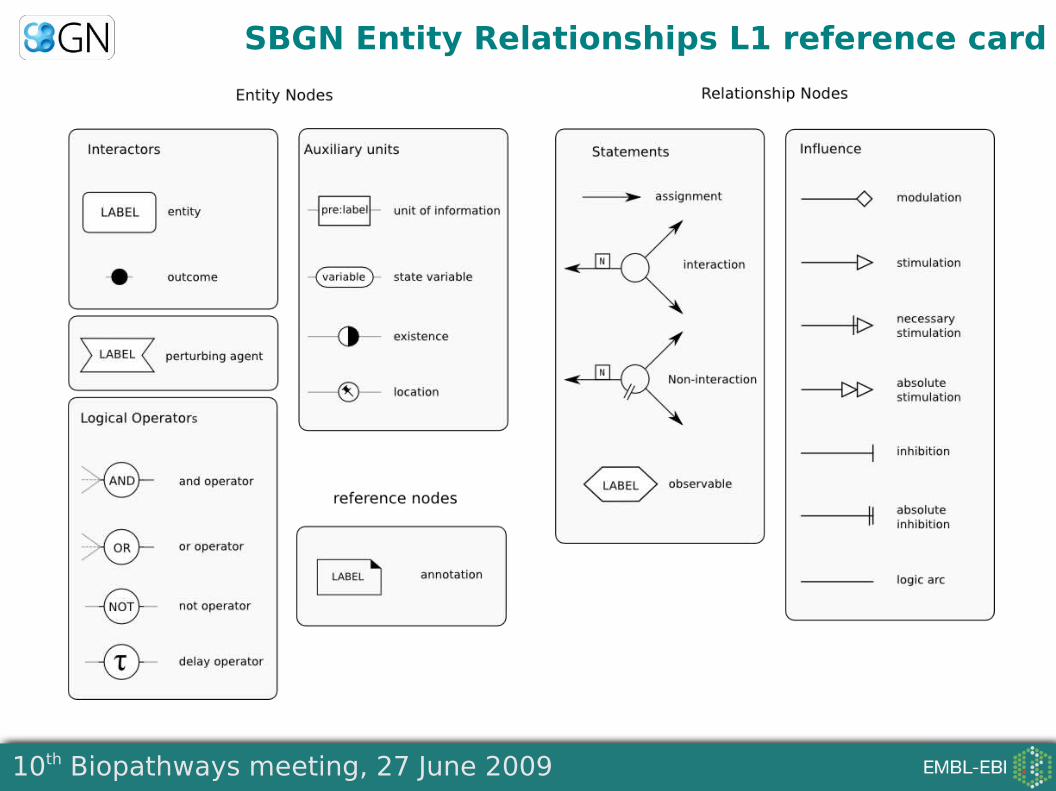
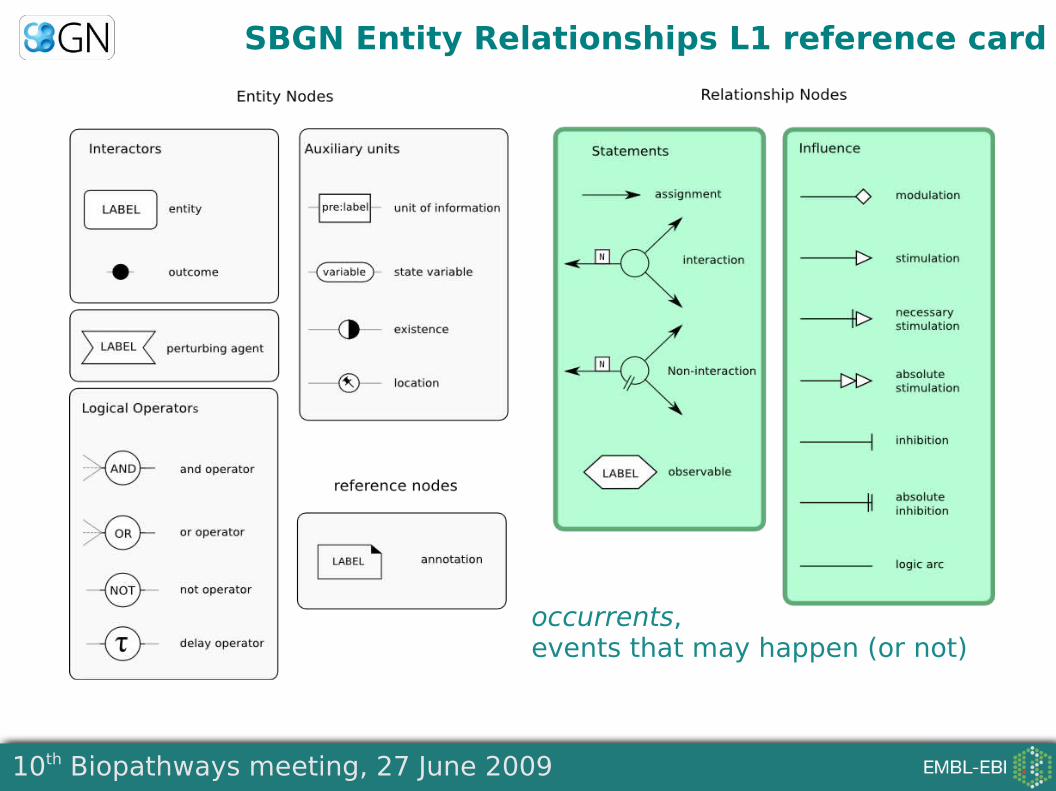
SBGN Entity Relationships L1 reference card
10th Biopathways meeting, 27 June 2009
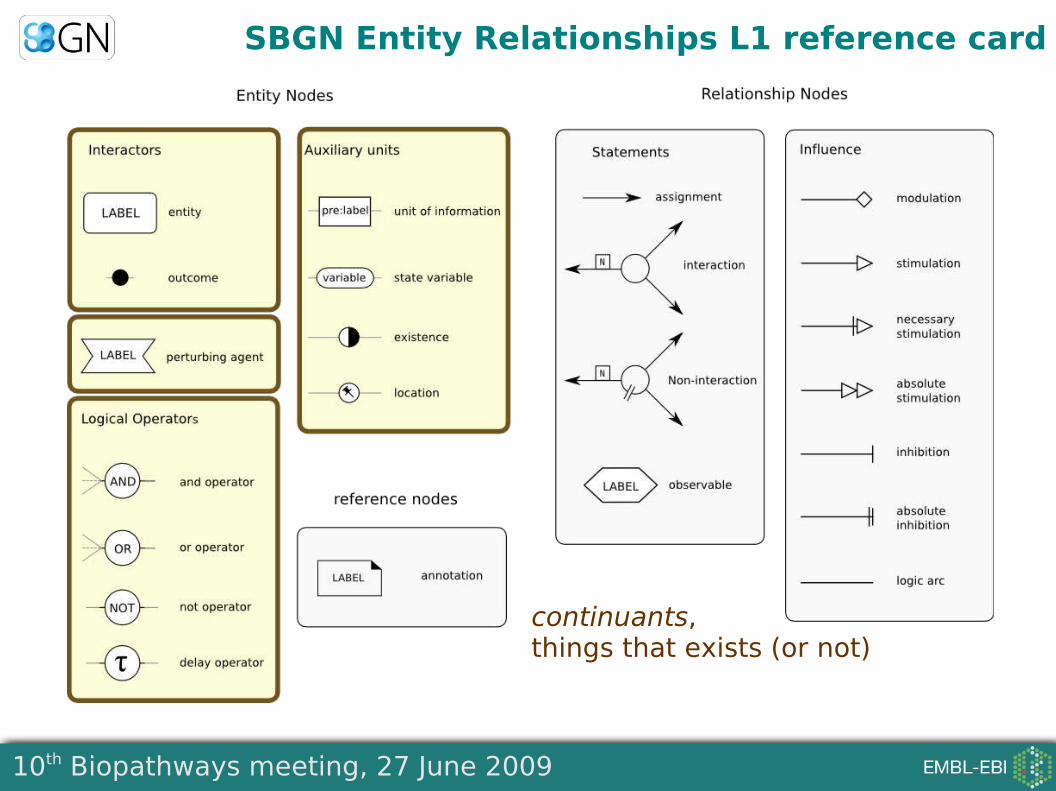
SBGN Entity Relationships L1 reference card
continuants,things that exists (or not)
10th Biopathways meeting, 27 June 2009
SBGN Entity Relationships L1 reference card
occurrents,events that may happen (or not)
10th Biopathways meeting, 27 June 2009
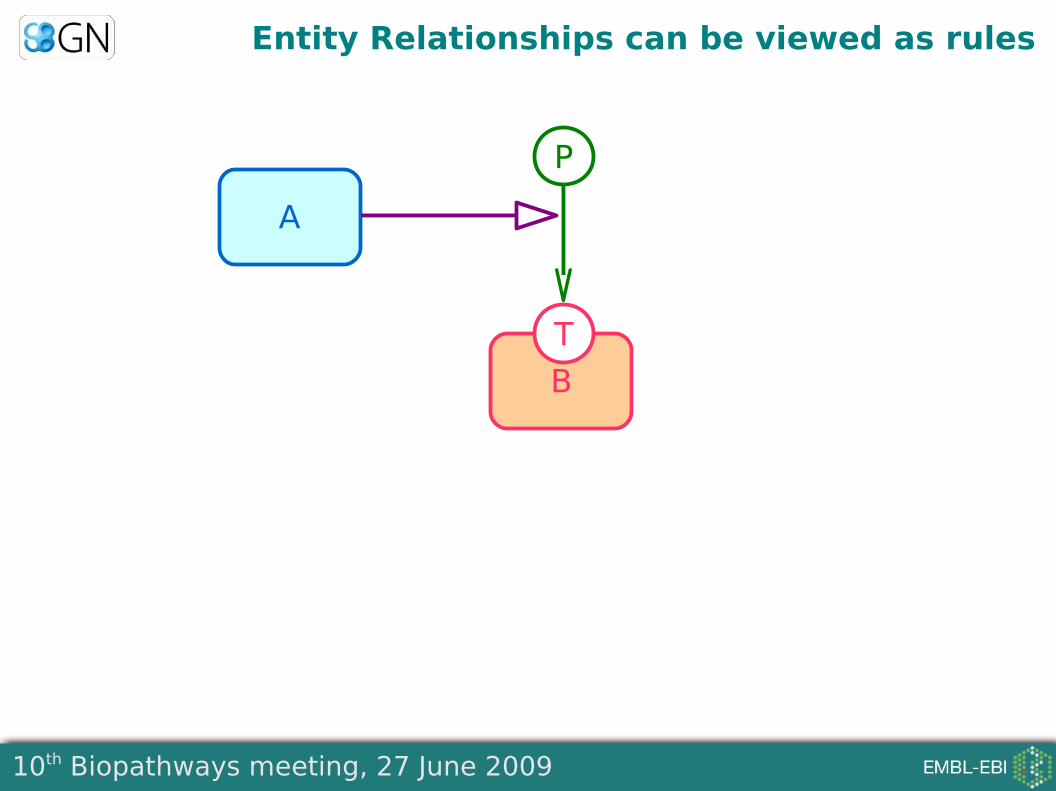
A
B
T
P
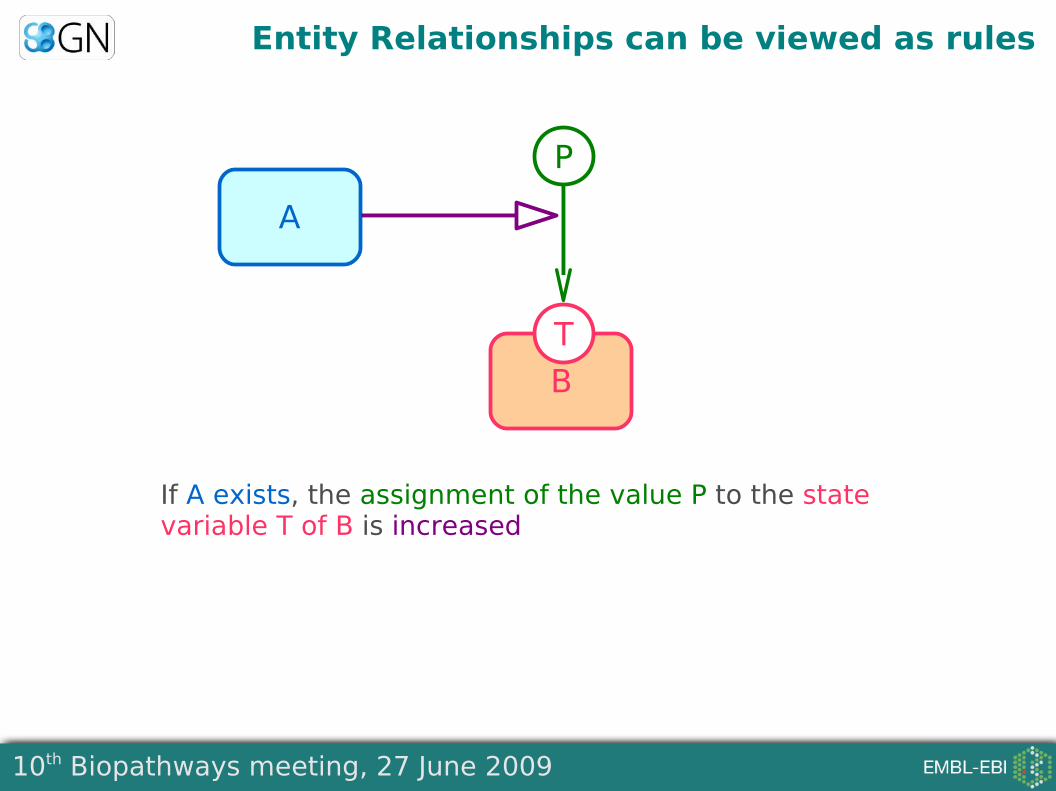
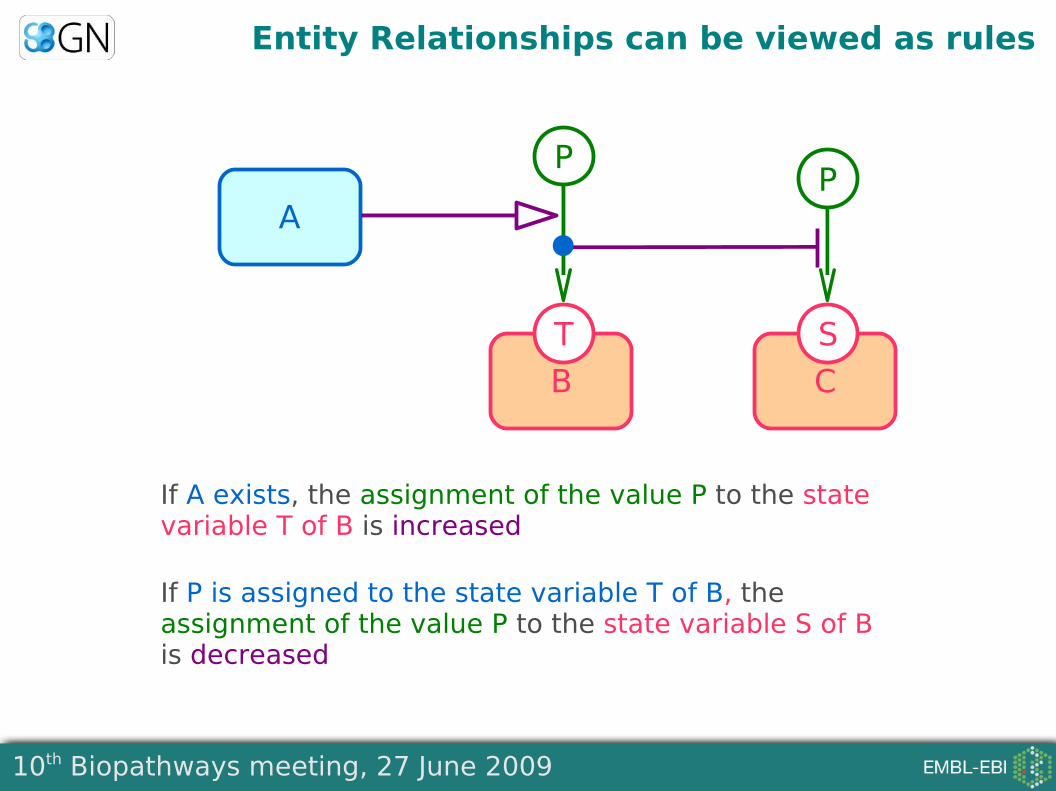
Entity Relationships can be viewed as rules
10th Biopathways meeting, 27 June 2009
A
B
T
P
If A exists, the assignment of the value P to the state variable T of B is increased
Entity Relationships can be viewed as rules
10th Biopathways meeting, 27 June 2009
A
B
T
P
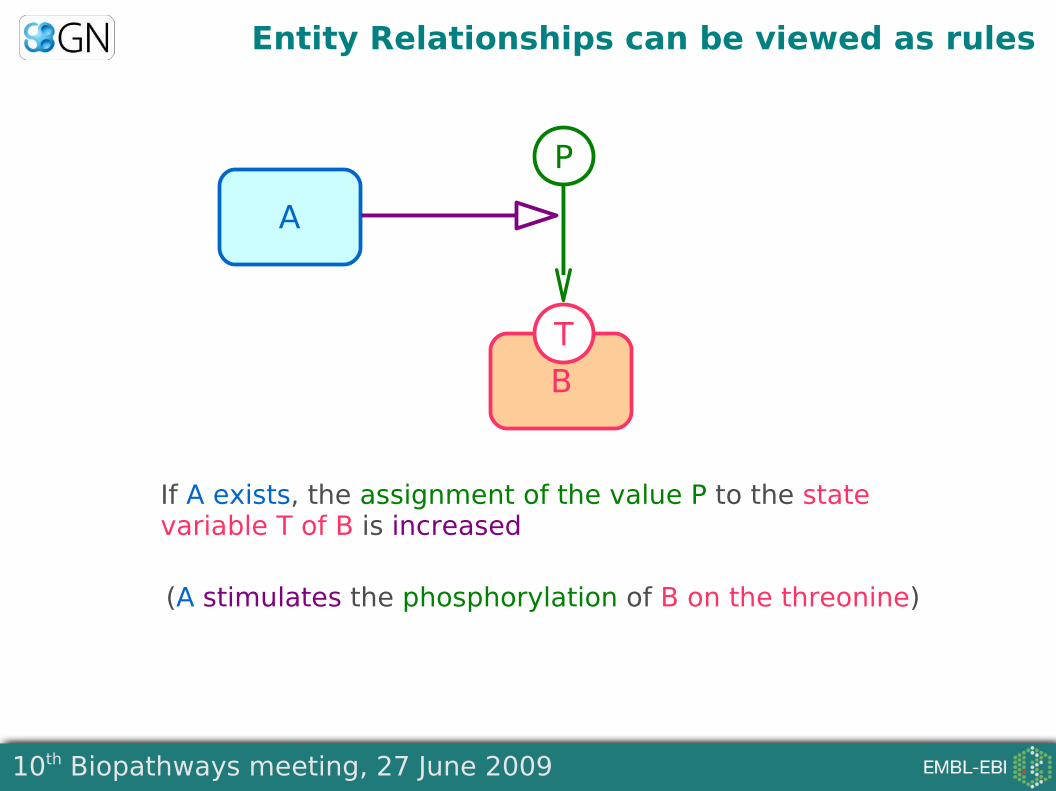
If A exists, the assignment of the value P to the state variable T of B is increased
Entity Relationships can be viewed as rules
(A stimulates the phosphorylation of B on the threonine)
10th Biopathways meeting, 27 June 2009
A
B
T
P
If A exists, the assignment of the value P to the state variable T of B is increased
C
S
P
Entity Relationships can be viewed as rules
If P is assigned to the state variable T of B, the assignment of the value P to the state variable S of B is decreased
10th Biopathways meeting, 27 June 2009
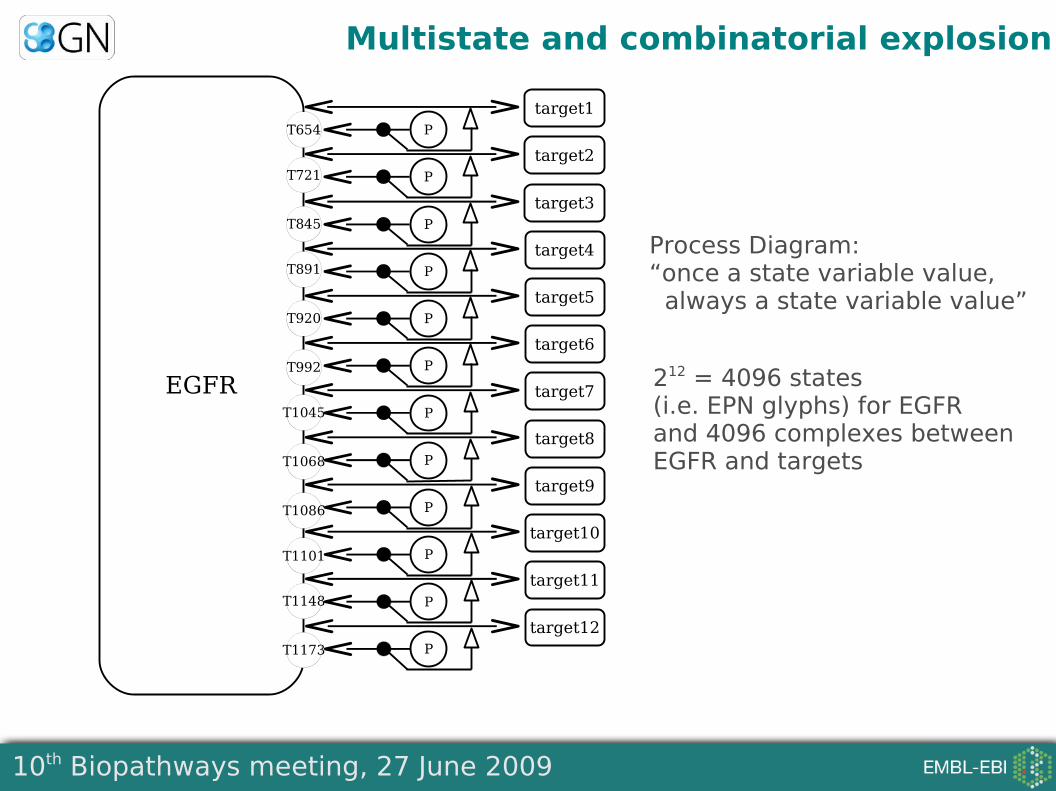
Multistate and combinatorial explosion
EGFR
T654
T721
T845
T891
T920
T992
T1045
T1068
T1086
T1101
T1148
T1173
Process Diagram: “once a state variable value, always a state variable value”
212 = 4096 states (i.e. EPN glyphs) for EGFRand 4096 complexes between EGFR and targets
P
target1
P
target2
P
target3
P
target4
P
target5
P
target6
P
target7
P
target8
P
target9
P
target10
P
target11
P
target12
10th Biopathways meeting, 27 June 2009
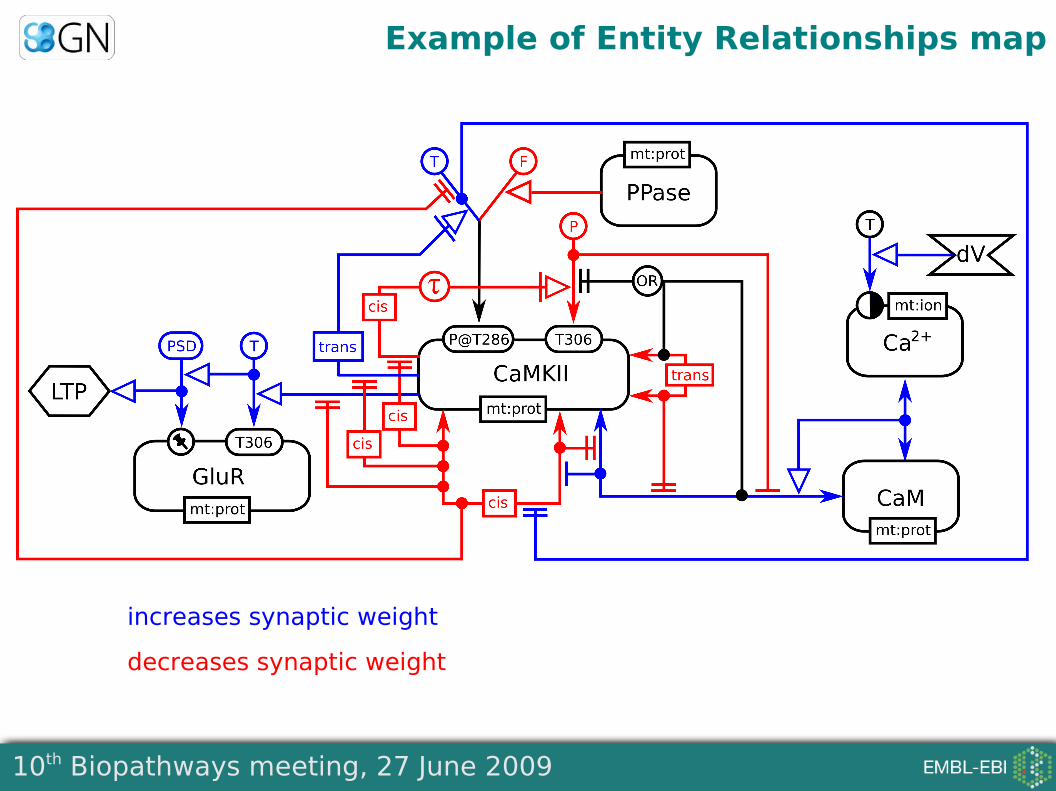
Example of Entity Relationships map
increases synaptic weight
decreases synaptic weight
10th Biopathways meeting, 27 June 2009
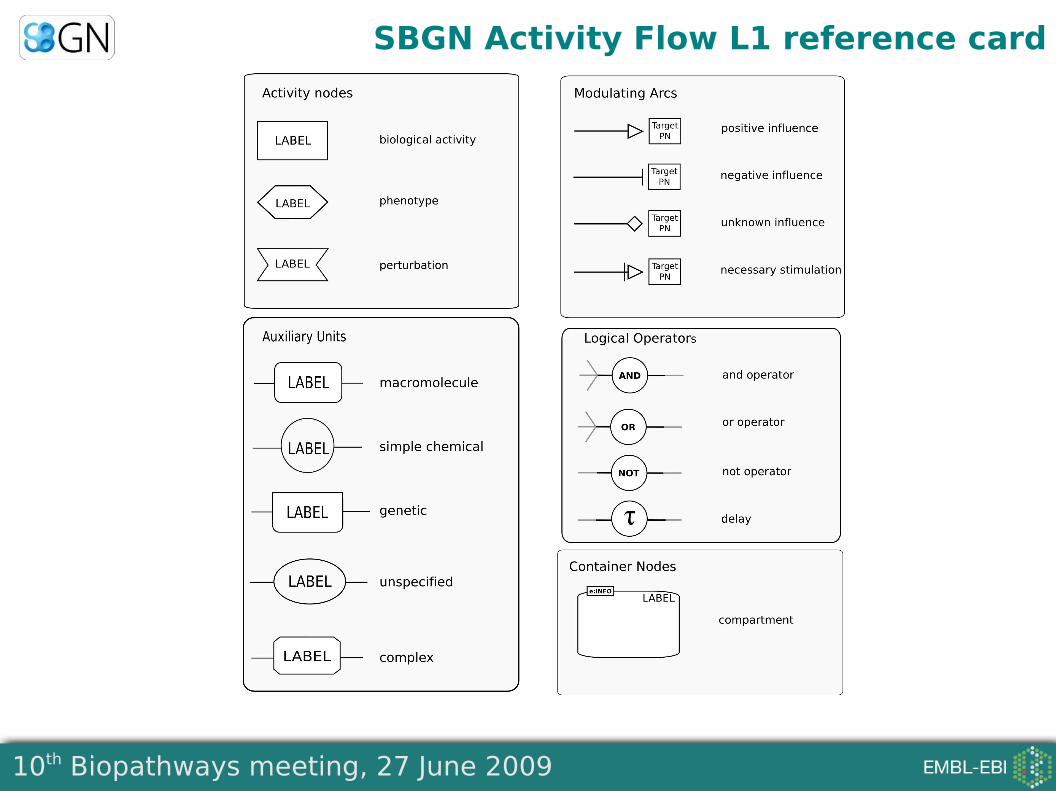
SBGN Activity Flow L1 reference card
10th Biopathways meeting, 27 June 2009
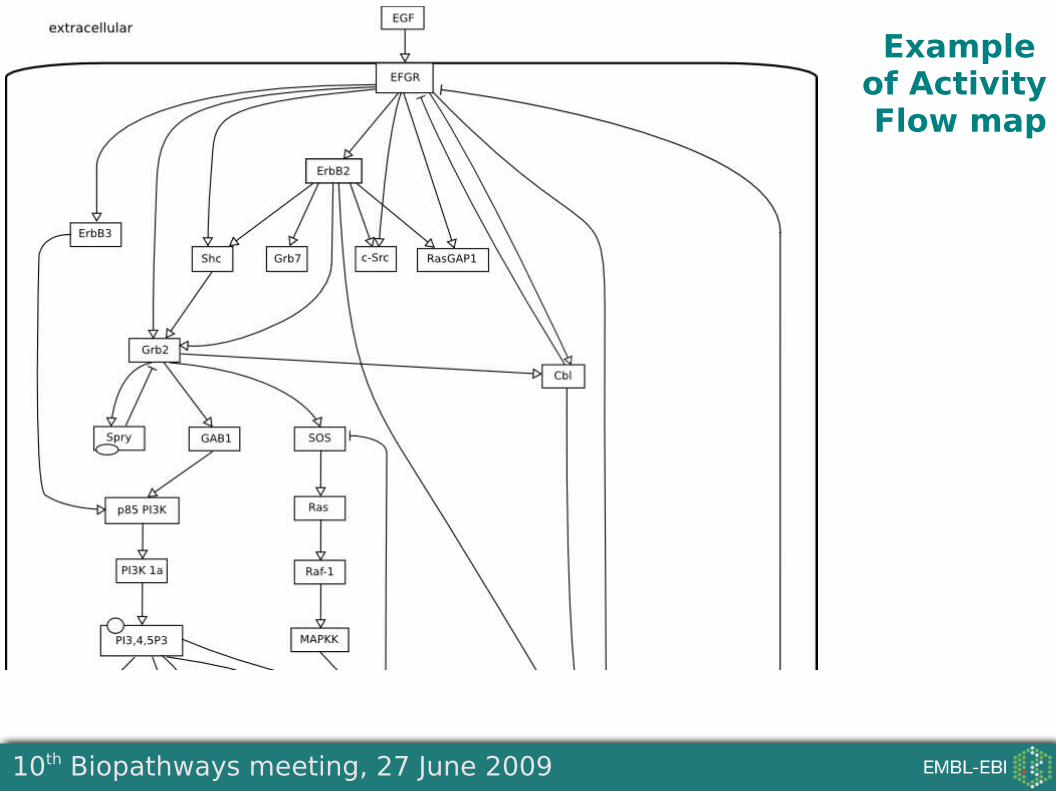
Example of ActivityFlow map
10th Biopathways meeting, 27 June 2009
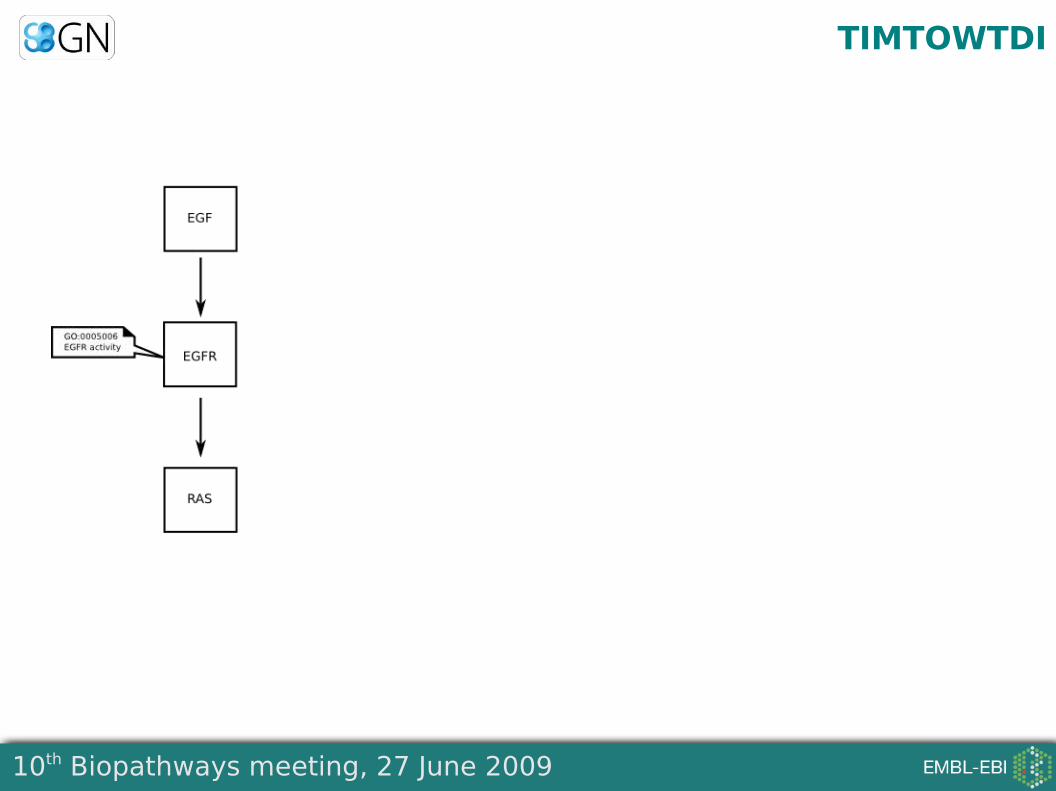
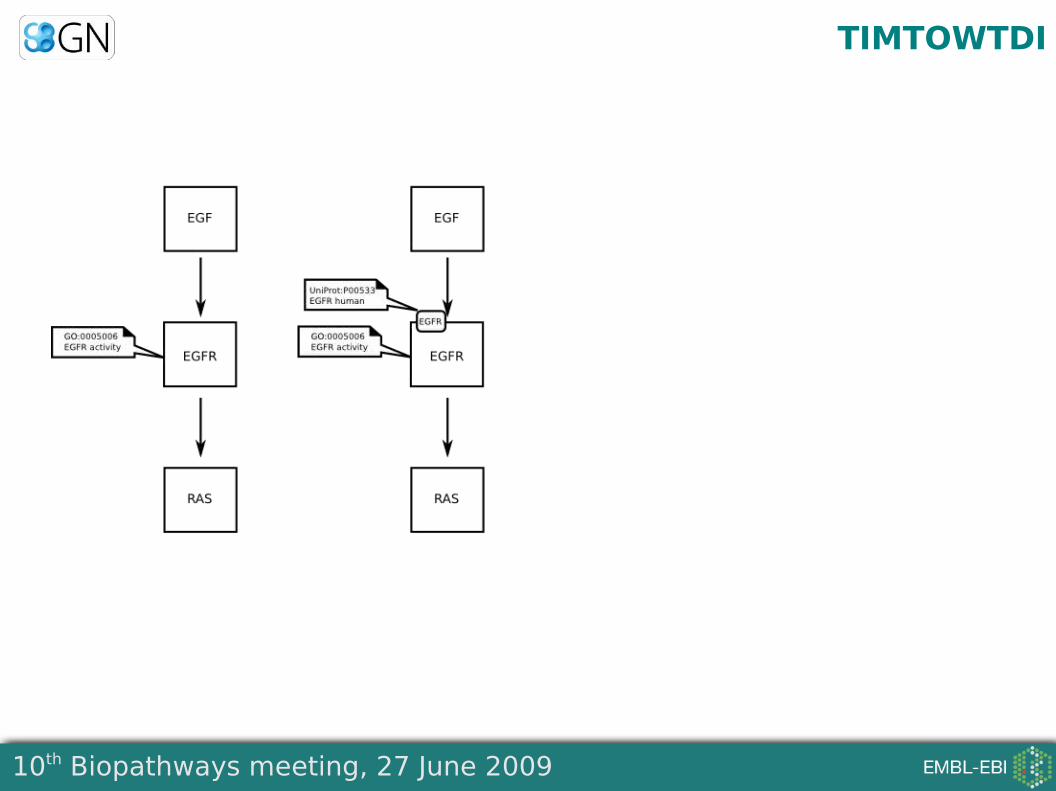
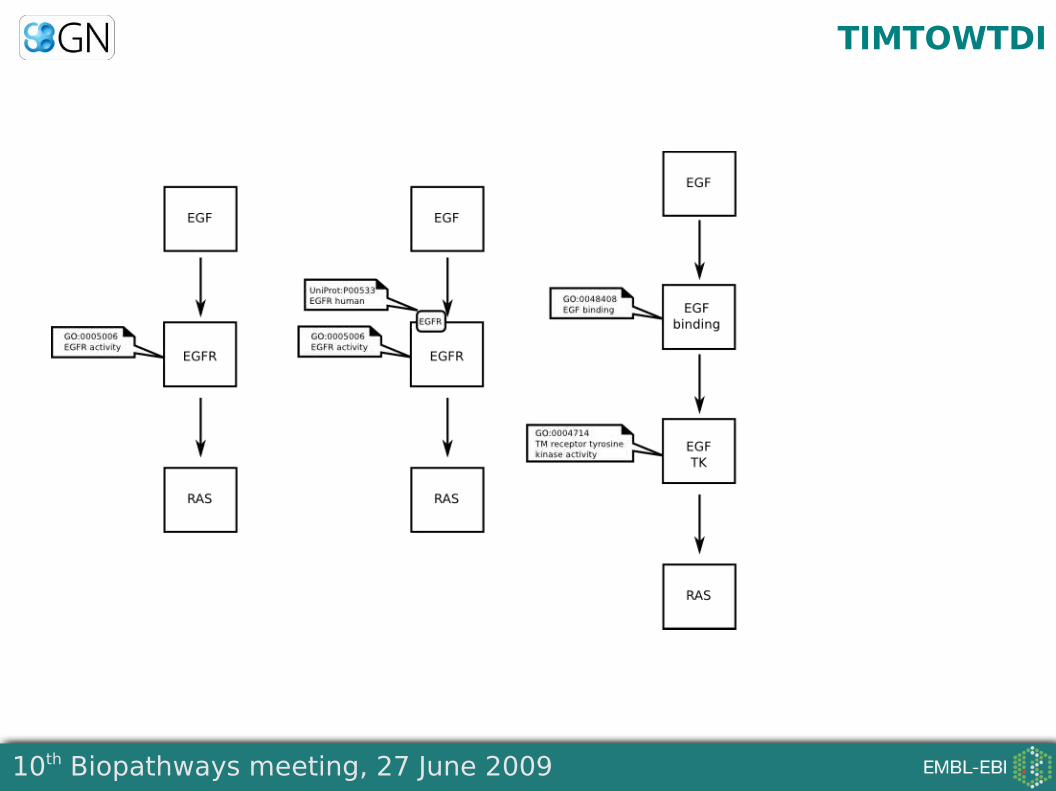
TIMTOWTDI
10th Biopathways meeting, 27 June 2009
TIMTOWTDI
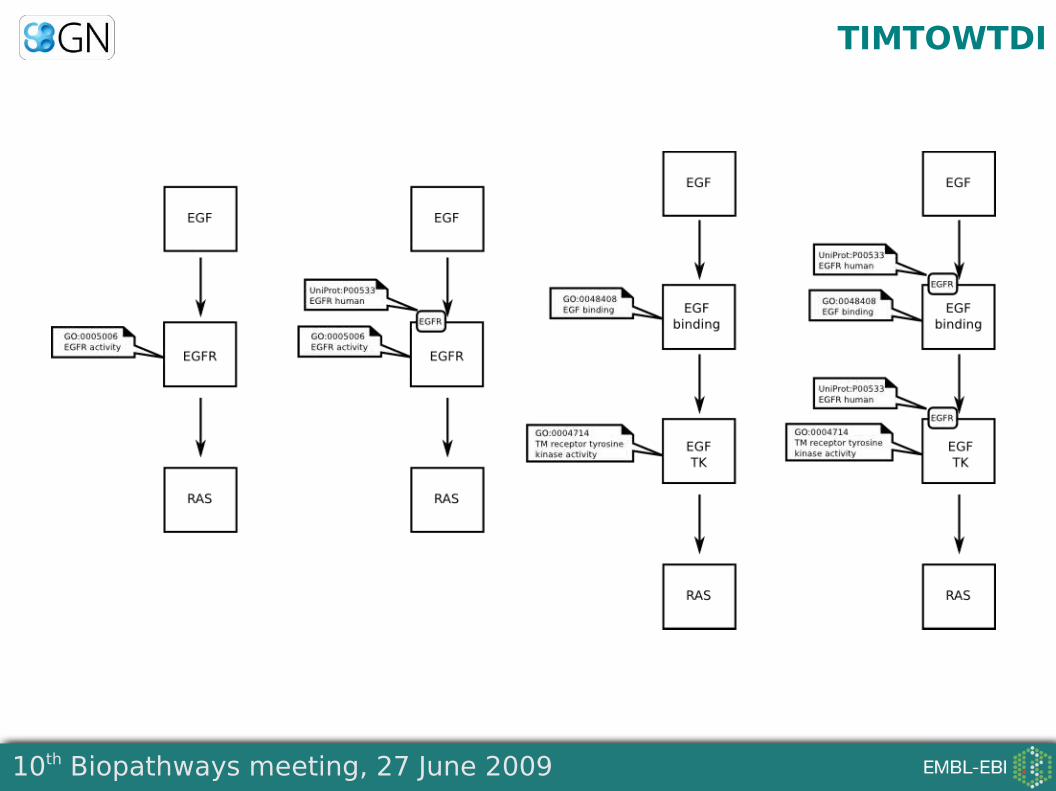
10th Biopathways meeting, 27 June 2009
TIMTOWTDI
10th Biopathways meeting, 27 June 2009
TIMTOWTDI
10th Biopathways meeting, 27 June 2009
TIMTOWTDI
10th Biopathways meeting, 27 June 2009
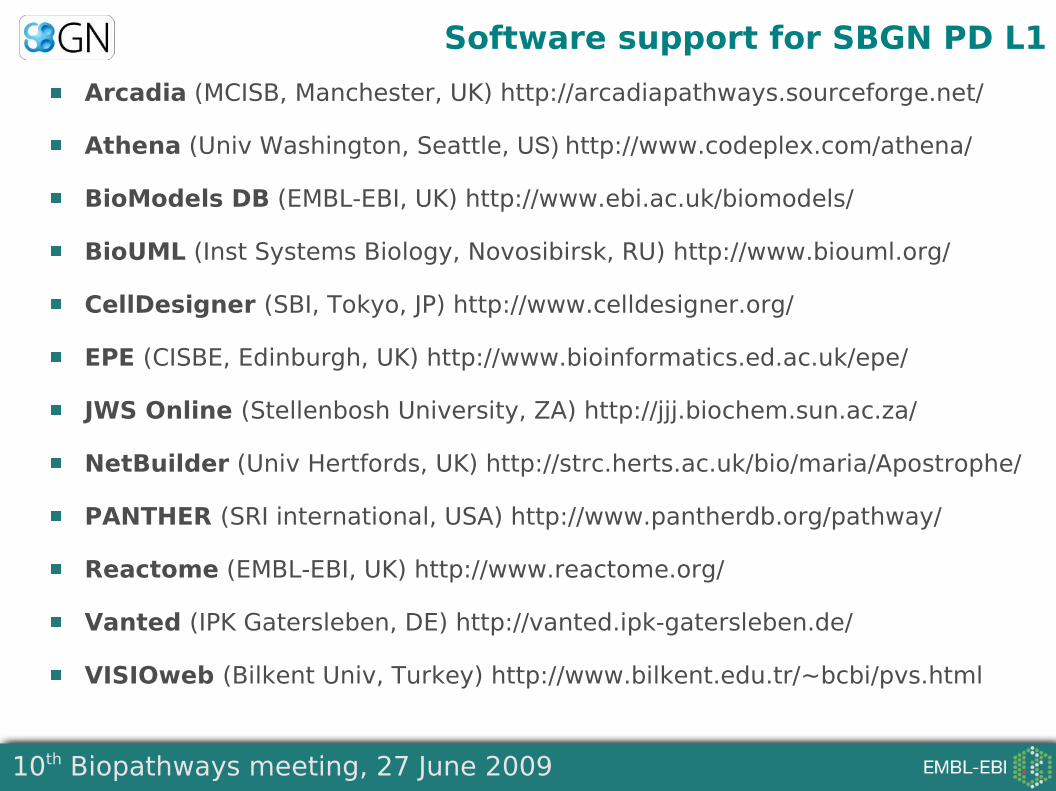
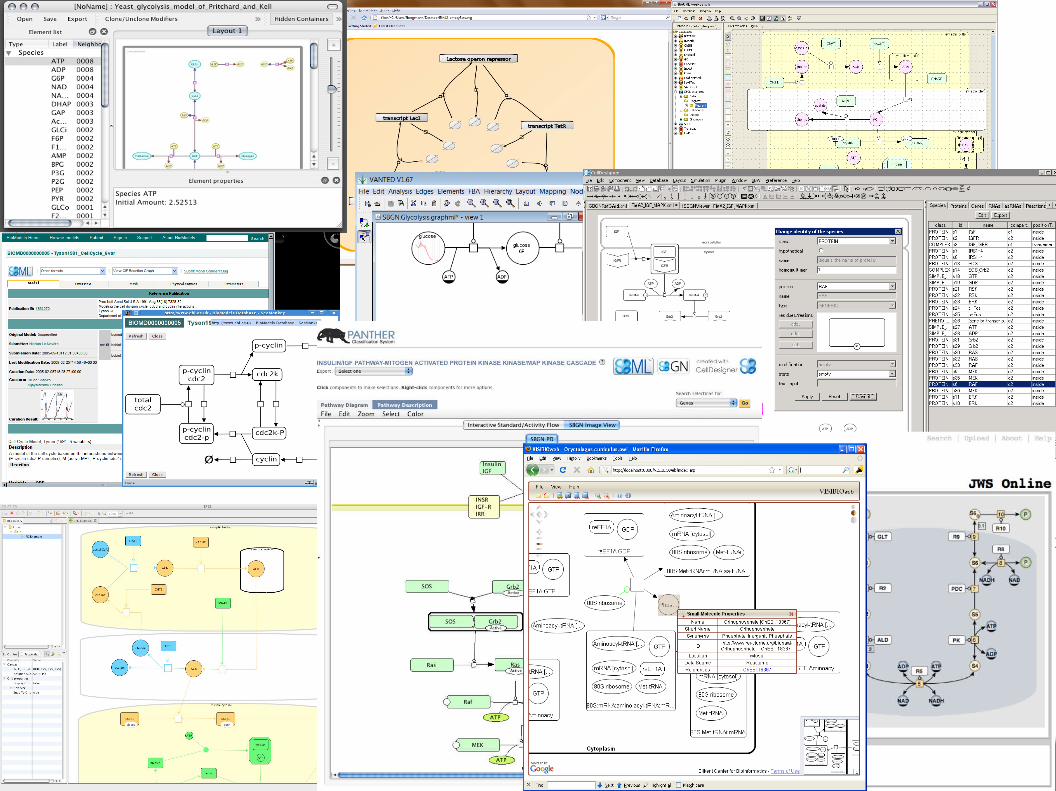
Software support for SBGN PD L1
Arcadia (MCISB, Manchester, UK) http://arcadiapathways.sourceforge.net/
Athena (Univ Washington, Seattle, US) http://www.codeplex.com/athena/
BioModels DB (EMBL-EBI, UK) http://www.ebi.ac.uk/biomodels/
BioUML (Inst Systems Biology, Novosibirsk, RU) http://www.biouml.org/
CellDesigner (SBI, Tokyo, JP) http://www.celldesigner.org/
EPE (CISBE, Edinburgh, UK) http://www.bioinformatics.ed.ac.uk/epe/
JWS Online (Stellenbosh University, ZA) http://jjj.biochem.sun.ac.za/
NetBuilder (Univ Hertfords, UK) http://strc.herts.ac.uk/bio/maria/Apostrophe/
PANTHER (SRI international, USA) http://www.pantherdb.org/pathway/
Reactome (EMBL-EBI, UK) http://www.reactome.org/
Vanted (IPK Gatersleben, DE) http://vanted.ipk-gatersleben.de/
VISIOweb (Bilkent Univ, Turkey) http://www.bilkent.edu.tr/~bcbi/pvs.html
10th Biopathways meeting, 27 June 2009
10th Biopathways meeting, 27 June 2009
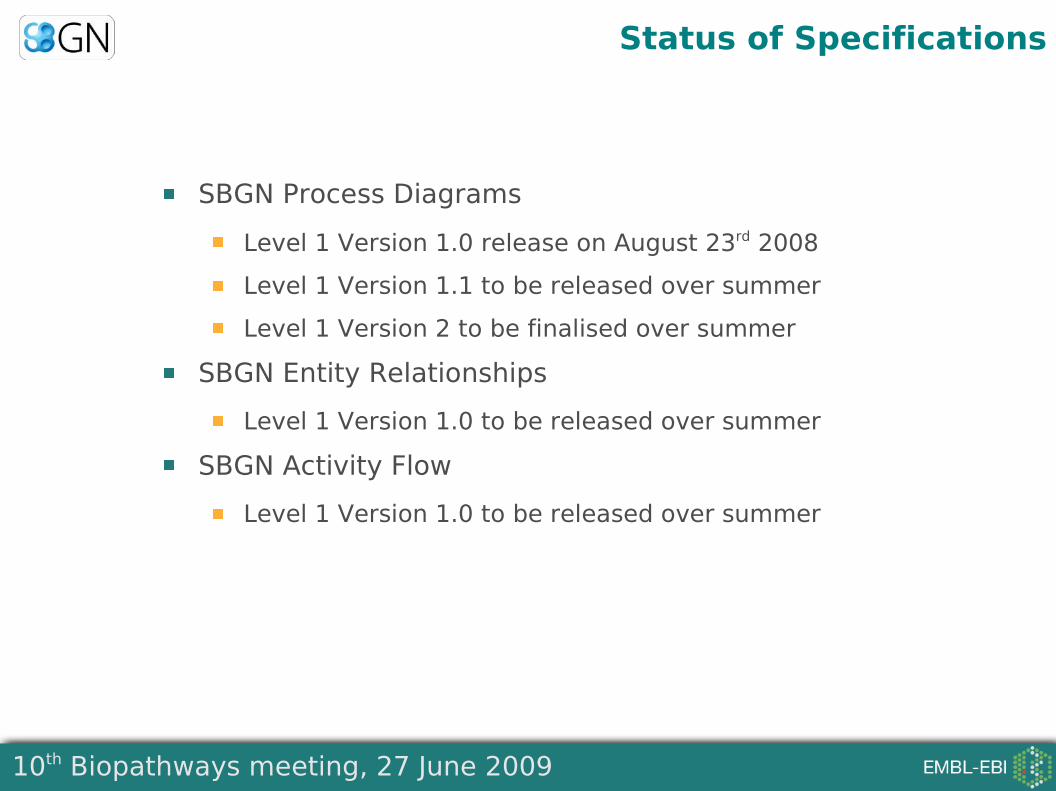
Status of Specifications
SBGN Process Diagrams
Level 1 Version 1.0 release on August 23rd 2008
Level 1 Version 1.1 to be released over summer
Level 1 Version 2 to be finalised over summer
SBGN Entity Relationships
Level 1 Version 1.0 to be released over summer
SBGN Activity Flow
Level 1 Version 1.0 to be released over summer
10th Biopathways meeting, 27 June 2009
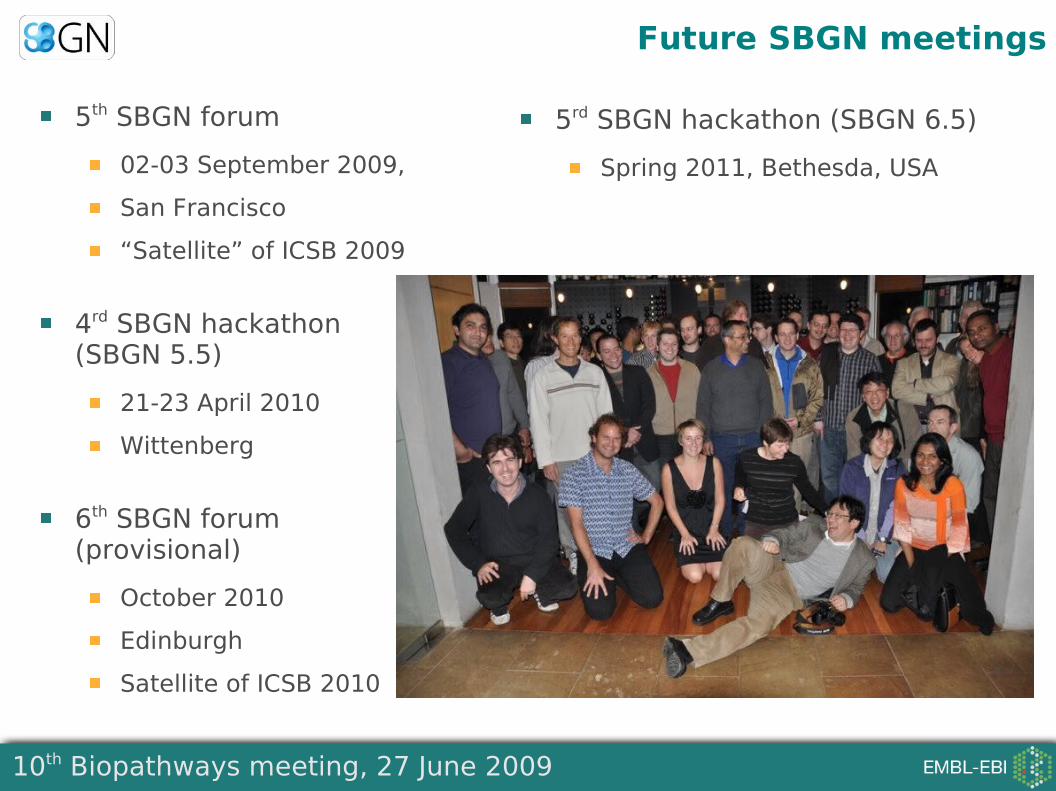
Future SBGN meetings
5th SBGN forum
02-03 September 2009,
San Francisco
“Satellite” of ICSB 2009
4rd SBGN hackathon (SBGN 5.5)
21-23 April 2010
Wittenberg
6th SBGN forum (provisional)
October 2010
Edinburgh
Satellite of ICSB 2010
5rd SBGN hackathon (SBGN 6.5)
Spring 2011, Bethesda, USA
10th Biopathways meeting, 27 June 2009
http://www.sbgn.org/
10th Biopathways meeting, 27 June 2009
Acknowledgements
SBGN editors
Nicolas Le Novère (UK)
Stuart Moodie (UK)
Anatoly Sorokin (UK)
Michael Hucka (US)
Falk Schreiber (DE)
Huaiyu Mi (US)
The whole community participatingto SBGN meetings, and mailing-lists
Special contributors
Emek Demir, Katja Wegner, Mirit Aladjem, Sarala
Wimalaratne, Frank Bergman, Ralph Gauges, Peter
Ghazal, Kawaji Hideya, Lu Li, Yukiko Matsuoka, Alice
Villéger, Sarah Boyd, Laurence Calzone, Melanie
Courtot, Ugur Dogrusoz, Akira Funahashi, Sohyoung
Kim, Fedor Kolpakov, Augustin Luna, Sven Sahle,
Douglas Kell, Kurt Kohn, Hiroaki Kitano