Embed Size (px)
Citation preview

The Task Force chose projections for Kingston to plan for:
Year
Sea Level Rise Scenario
2060 2100
Low 20 inches 33 inches
High – rapid ice melt 36 inches 68 inches

http://www.scenichudson.org/slr/mapper
Scenic Hudson’s Sea Level Rise
Mapper
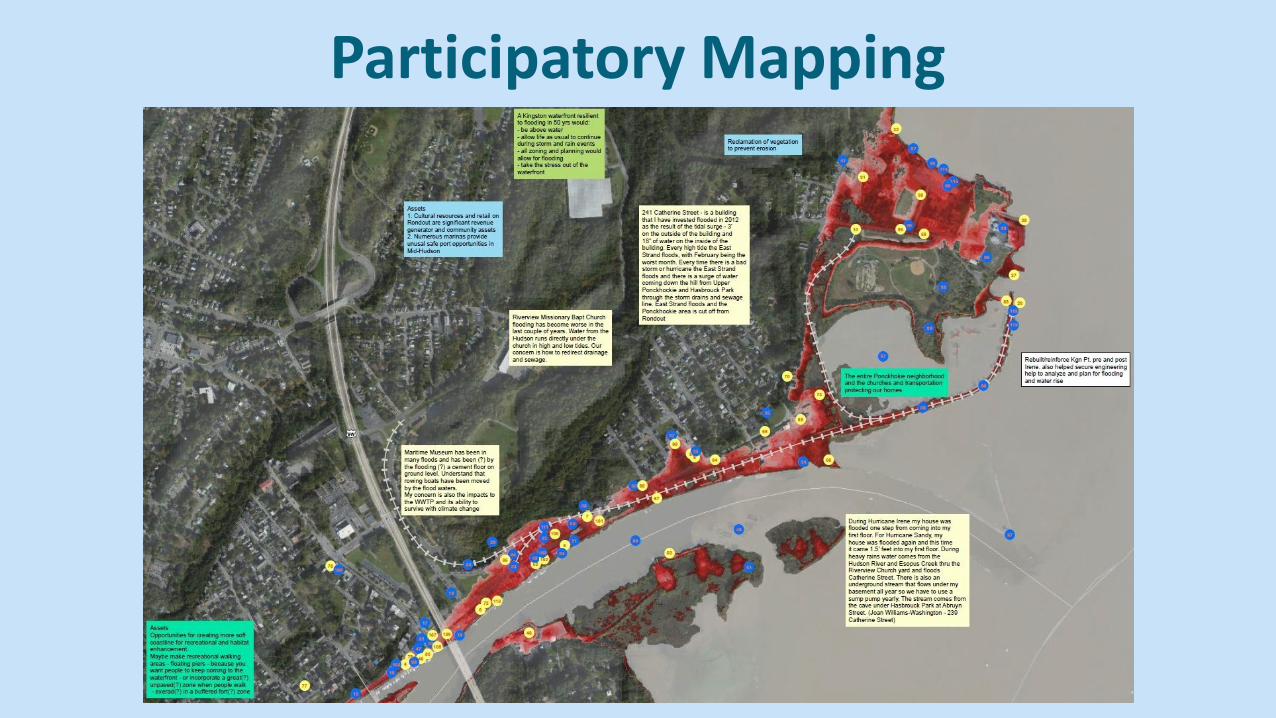
Participatory Mapping

DOS New York Rising – Community Reconstruction Program (NYR-CR Program) Risk Assessment Tool
Risk = Hazard × Exposure × Vulnerability
http://stormrecovery.ny.gov/community-reconstruction-program
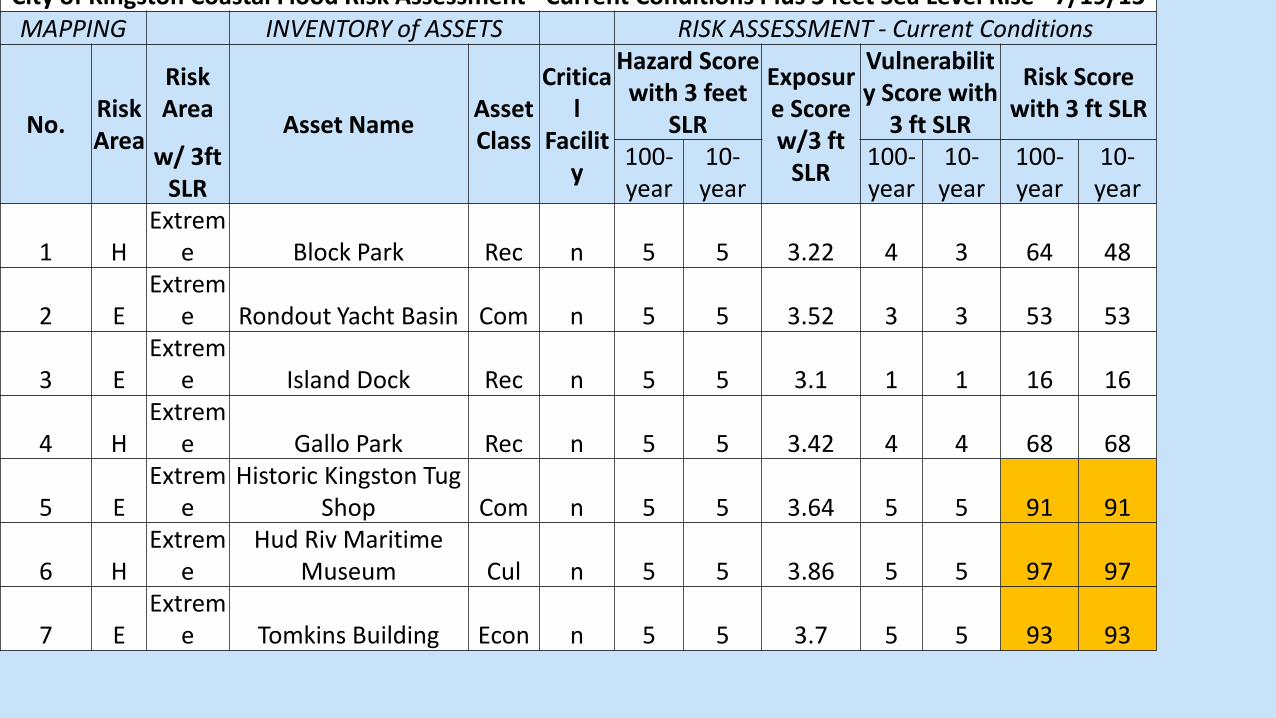
City of Kingston Coastal Flood Risk Assessment Current Conditions Plus 3 feet Sea Level Rise 7/19/13 MAPPING INVENTORY of ASSETS RISK ASSESSMENT - Current Conditions
No. Risk Area
Risk Area Asset Name Asset
Class
Critical
Facility
Hazard Score with 3 feet
SLR
Exposure Score w/3 ft
SLR
Vulnerability Score with
3 ft SLR
Risk Score with 3 ft SLR
w/ 3ft SLR
100-year
10-year
100-year
10-year
100-year
10-year
1 H Extrem
e Block Park Rec n 5 5 3.22 4 3 64 48
2 E Extrem
e Rondout Yacht Basin Com n 5 5 3.52 3 3 53 53
3 E Extrem
e Island Dock Rec n 5 5 3.1 1 1 16 16
4 H Extrem
e Gallo Park Rec n 5 5 3.42 4 4 68 68
5 E Extrem
e Historic Kingston Tug
Shop Com n 5 5 3.64 5 5 91 91
6 H Extrem
e Hud Riv Maritime
Museum Cul n 5 5 3.86 5 5 97 97
7 E Extrem
e Tomkins Building Econ n 5 5 3.7 5 5 93 93

Worst case scenario Year 2100, With High Sea Level Rise and a 100-year Storm 1% Probability of Occurrence in Any Given Year Total Damage for this Event: $39.9 Million Damage to Wastewater Treatment Plant: $27.6 Million • Lost Value Due to Sea Level Rise • Lost Value Due to Sea Level Rise + Storm Surge
Cumulative Expected Damages by 2100 With High Sea Level Rise = $126 Million

Flooding Adaptation Strategies • Do Nothing
• Fortify
• Accommodate
• Strategically Relocate

Strategic Retreat Park Buffer Elevate Land Floodwall
Seawall Living Shoreline Beaches & Dunes
Multi-purpose Levee Levee/Dike
Groin Field
Breakwater Wetland Restoration
Artificial Reef
Barrier Island Creation
Floating Islands Surge Barrier Polder
http://www.nyc.gov/html/dcp/pdf/sustainable_communities/urban_waterfront_print.pdf

Divided shoreline into neighborhoods to assess adaptation strategies

100 Year Storm in 2060
COAST - COastal Adaptations to Sea level rise Tool
Buildings damaged by storm surge from this single event (height of bar indicates relative damage amount) Buildings permanently inundated due to sea level rise by 2060, if no action is taken Extent of flooding from this event

POTENTIAL ADAPTATION SOLUTIONS

BENEFIT COST ANALYSIS OF ADAPTATION STRATEGIES – KINGSTON
Scenario B: WITH ELEVATION OF EAST
STRAND STREET TO 11 FEET (NAVD 88)
Scenario C: WITH ELEVATION OF
BULKHEAD/WITH PATH TO 11 FEET (NAVD 88)
Scenario D: PURCHASES OF ROLLING
EASEMENTS, TRANSFER OF TITLE TO CITY AT 2060 OR WHEN MHHW REACHES
6.0 FEET (NAVD 88) Low SLR High SLR Low SLR High SLR Low SLR High SLR
46,400,000 44,100,000 46,400,000 44,100,000 46,400,000 44,100,000
4,900,000 4,700,000 241,000 466,900 36,900,000 39,576,000
41,500,000 39,400,000 46,159,000 43,633,100 9,500,000 4,524,000
9,800,000 6,200,000 22,540,000
4.2 4.0 7.4 7.0 3.7 1.8
Cumulative Damage to East Strand Study Area With No Action1
Cumulative Damage with Adaptation Strategy in Place1
Avoided Damage (Row 1 – Row 2) or BENEFIT
Estimated COST of Adaptation Strategy
BENEFIT/COST Ratio (The higher the number above 1, the more favorable the ratio.)
1Discount Rate of 3.3% applied.
2Does not include purchase of easements at five city-owned properties, and sewage treatment plant remains unprotected.

http://www.dec.ny.gov/energy/82168.html http://www.dec.ny.gov/docs/administration_pdf/csrptool.pdf
DEC Climate Smart Resiliency Planning tool

Climate Smart Resiliency Planning Assessment Three areas of opportunities for Kingston to incorporate flood-preparedness:
Outreach and collaboration
Zoning, building codes and regulation
Planning

Final Report

Final recommendations fall into 6 categories • City operations, funding and decision-making
• Resilient structures
• Promotion of a waterfront economy and economic revitalization
• Collaboration and public outreach
• Emergency management
• Site-based recommendations

1. Adopt the sea-level rise and flood projections recommended by New York State and the Kingston Waterfront Flooding Task Force for planning purposes.
2. Incorporate these 24 findings and recommendations from the Kingston Waterfront Flooding Task Force into other City and regional plans.
3. Develop a Kingston Waterfront Long-term Resiliency Plan.
4. Reduce Kingston’s greenhouse gas emissions and contribution to sea level rise and other climate impacts through the implementation of Kingston’s Climate Action Plan, green infrastructure and green architecture.
5. Ensure that all relevant City staff and elected and appointed officials are fully trained in and expected to incorporate impacts of flooding and sea-level rise into their daily work.
Recommendations: City Operations, Funding and Decision-Making NEAR TERM

6. Ensure that zoning designations in the Kingston 2025 Comprehensive Plan consider increasing risk and vulnerability from flooding and sea-level rise.
7. Require that proposals for new development of any kind in the Flood Hazard Overlay District take flood risk into account.
8. Reduce stormwater, upland flooding and combined sewer overflows through green infrastructure and best stormwater management practices.
Recommendations: Resilient structures
NEAR TERM

9. Research, evaluate and implement changes to City building and zoning codes that will increase resiliency and are cost-effective and socially equitable.
10. Study the feasibility of using policy, zoning and building codes to achieve creative, water-dependent and water-enhanced uses that are resilient, including elevated, amphibious, or floating structures, wharves, berms and elevated rights of way.
11. Evaluate the use of natural buffers and green shoreline infrastructure to reduce flood risk and erosion and conserve natural resource functions.
12. Ensure that local street networks, utilities and other infrastructure function and remain connected as the City implements adaptation strategies to sea-level rise.
13. Research and evaluate land-use tools and financing mechanisms or incentives to facilitate flood adaptation in the waterfront.
Recommendations:Resilient structures LONG TERM
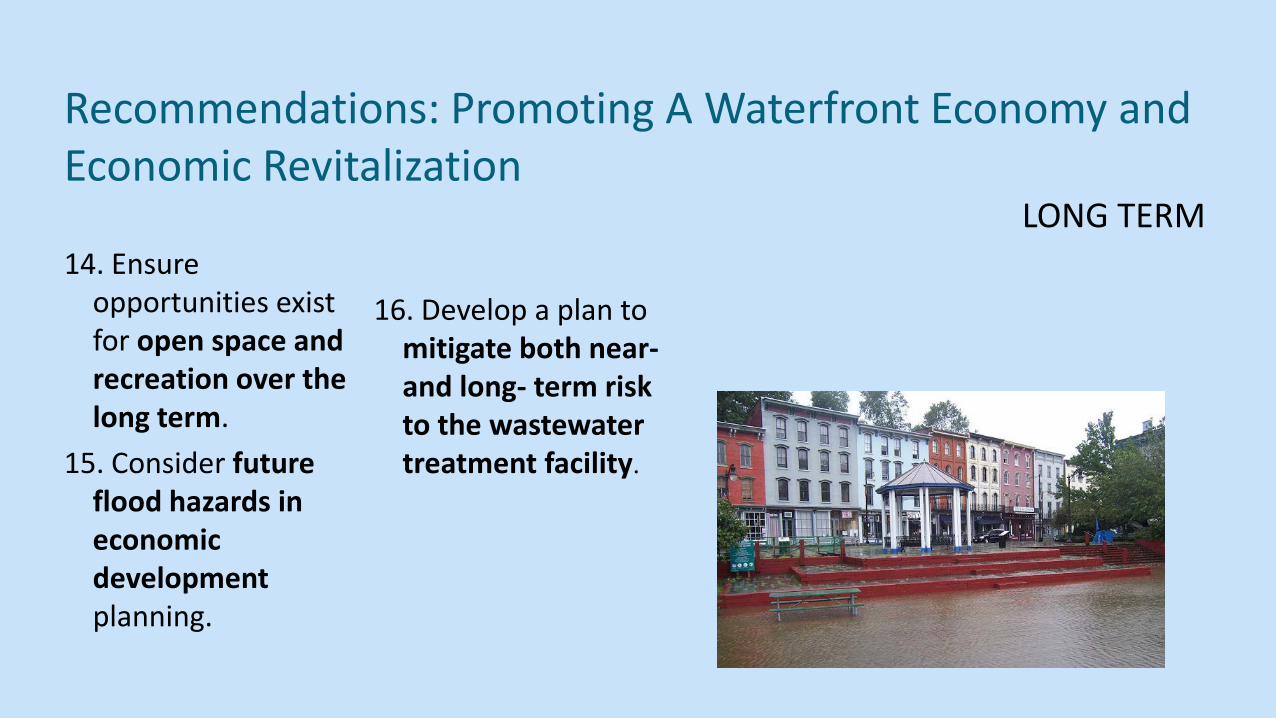
14. Ensure opportunities exist for open space and recreation over the long term.
15. Consider future flood hazards in economic development planning.
16. Develop a plan to
mitigate both near- and long- term risk to the wastewater treatment facility.
Recommendations: Promoting A Waterfront Economy and Economic Revitalization
LONG TERM

17. Host an informational public meeting with FEMA.
18. Conduct public outreach to property owners, tenants and prospective buyers in the Flood Hazard Overlay District.
19. Encourage and assist community-based organizations in their efforts to communicate the risks of flooding and potential adaptation solutions to vulnerable
or non-English speaking populations. 20. Collaborate with other waterfront
communities and county and state government to plan for coastal hazards like sea-level rise and storm surge.
Recommendations: Community Collaboration and Public Outreach
NEAR TERM

21. Revise emergency management planning documents.
22. Employ new tools to improve real time emergency management planning.
23. Ensure safe
access and evacuation along the waterfront during regular flood events.
Recommendations: Emergency Management NEAR TERM

24. Develop a process to map and track repetitive storm damage.
Recommendations: Emergency Management
LONG TERM

Outcomes Official adoption of the recommendations
Integrate in comprehensive plan and emergency management
plan
Changes in design of waterfront development proposals
NFIP and Community Rating System Workshop 12/4/13
Model for other communities (DEC funded task forces in Catskill,
Piermont and Stony Point for 2013-14)

Next steps January 14, 2014 public meeting to share results and next steps
(6:15 PM in the Council Chambers at Kingston City Hall)
Stewardship of process forward by various community organizations
Buy-in from community and municipal staff
Investigate policy changes to reduce risks
Follow up with Community Rating System (to reduce insurance rates)

Funding Mechanisms for Communities Consolidated Funding Application Process
• Various state agencies participate • Funding applications were submitted • Department of Homeland Security and Emergency Services • FEMA “Sandy” monies
• $5 million Waterfront Resiliency Project • $2.7 million: Certification of levee along Esopus Creek (non-tidal) • $500,000: Emergency generators at Wastewater Treatment Plant

Julie Noble [email protected]
Kristin Marcell
Emilie Hauser [email protected]
All Kingston documents available at
www.kingstoncac.org

Climate Smart Communities Webinar
• Mark Lowery [email protected] • Kim Farrow
[email protected] • Climate Change Office
E-Mail Addresses
Climate Smart Communities Webinar
http://www.dec.ny.gov/energy/50845.html
Website Address