Embed Size (px)
Citation preview
A report for the Jesuit Centre for Theological Reflection
THE TAXATION SYSTEM IN ZAMBIA
Technical Report
Final Report
January 2011
This study was prepared by Messrs Alfred Mwila, David Manley, Patrick Chileshe, Ezekiel Phiri and Kelvin Mpembamoto for the Jesuit Centre for Theological Reflection (JCTR). The Debt, Aid and Trade (DAT) Programme provided funding for the study. The views expressed in this study are those of the authors and do not necessarily reflect the views of any allied institutions.
The Taxation System in Zambia Final Report-January 2011
ii
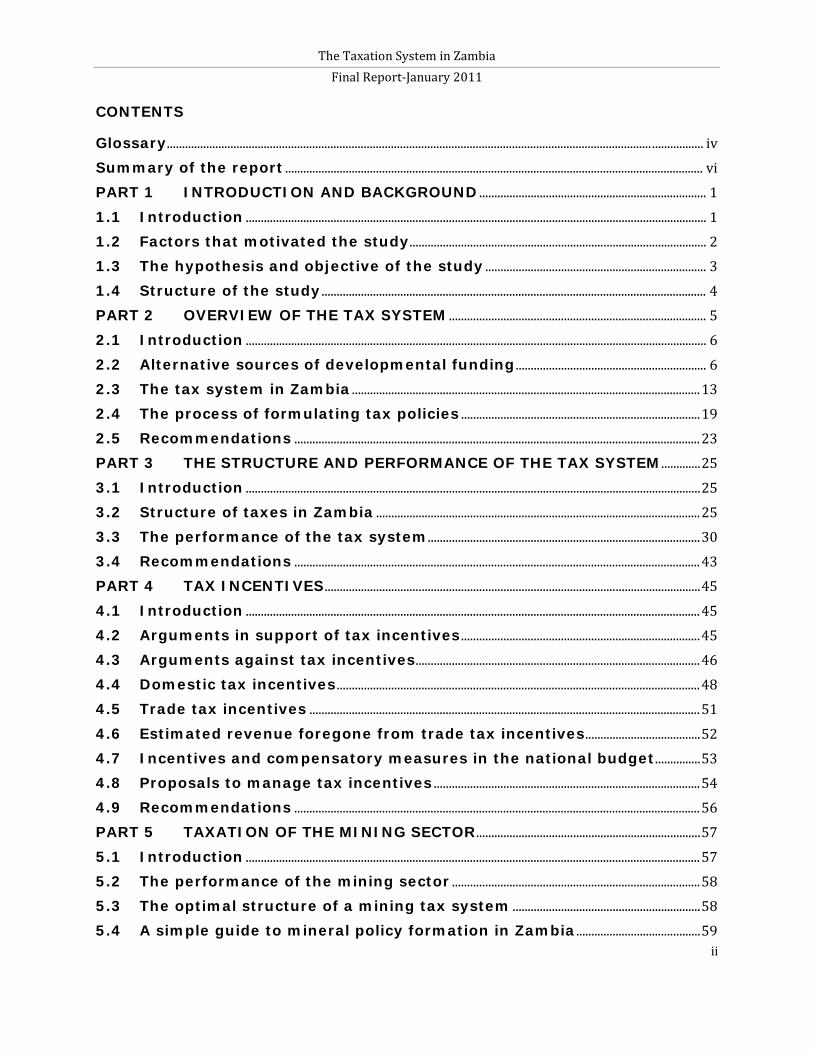
CONTENTS
Glossary ................................................................................................................................................................ ................. iv
Summary of the report .......................................................................................................................................... vi
PART 1 INTRODUCTION AND BACKGROUND ........................................................................... 1
1.1 Introduction ........................................................................................................................................................ 1
1.2 Factors that motivated the study .................................................................................................. 2
1.3 The hypothesis and objective of the study ......................................................................... 3
1.4 Structure of the study ............................................................................................................................... 4
PART 2 OVERVIEW OF THE TAX SYSTEM ..................................................................................... 5
2.1 Introduction ........................................................................................................................................................ 6
2.2 Alternative sources of developmental funding ............................................................... 6
2.3 The tax system in Zambia ................................................................................................................... 13
2.4 The process of formulating tax policies ............................................................................... 19
2.5 Recommendations ...................................................................................................................................... 23
PART 3 THE STRUCTURE AND PERFORMANCE OF THE TAX SYSTEM ............. 25
3.1 Introduction ...................................................................................................................................................... 25
3.2 Structure of taxes in Zambia ........................................................................................................... 25
3.3 The performance of the tax system .......................................................................................... 30
3.4 Recommendations ...................................................................................................................................... 43
PART 4 TAX INCENTIVES ............................................................................................................................ 45
4.1 Introduction ...................................................................................................................................................... 45
4.2 Arguments in support of tax incentives ............................................................................... 45
4.3 Arguments against tax incentives .............................................................................................. 46
4.4 Domestic tax incentives ........................................................................................................................ 48
4.5 Trade tax incentives ................................................................................................................................. 51
4.6 Estimated revenue foregone from trade tax incentives ...................................... 52
4.7 Incentives and compensatory measures in the national budget ............... 53
4.8 Proposals to manage tax incentives ........................................................................................ 54
4.9 Recommendations ...................................................................................................................................... 56
PART 5 TAXATION OF THE MINING SECTOR .......................................................................... 57
5.1 Introduction ...................................................................................................................................................... 57
5.2 The performance of the mining sector .................................................................................. 58
5.3 The optimal structure of a mining tax system .............................................................. 58
5.4 A simple guide to mineral policy formation in Zambia ......................................... 59
The Taxation System in Zambia Final Report-January 2011
iii
5.5 Description of current and past regimes ............................................................................. 60
5.6 The current regime in detail and alternative modifications ............................ 61
5.7 Tax loopholes in mining taxation ................................................................................................ 66
5.8 Reforming tax mining regimes ...................................................................................................... 66
5.9 Recommendations ...................................................................................................................................... 67
PART 6 INFORMAL SECTOR TAXATION ........................................................................................ 68
6.1 Introduction ...................................................................................................................................................... 69
6.2 Definition of the informal sector and rationale for taxation .......................... 69
6.3 The structure and conduct of the informal sector ..................................................... 71
6.4 The size of the informal sector ...................................................................................................... 73
6.5 The informal sector tax regime ..................................................................................................... 76
6.6 The performance of informal sector taxes ........................................................................ 77
6.7 Challenges of informal sector taxation ................................................................................. 81
6.8 Recommendations ...................................................................................................................................... 83
PART 7 FEASIBILITY OF A FINANCIAL TRANSACTION TAX ................................... 86
7.1 Introduction ...................................................................................................................................................... 86
7.2 Concept of FTT and how it reduces volatility .................................................................. 86
7.3 FTT experiences in other countries ........................................................................................... 87
7.4 Impact of a FTT .............................................................................................................................................. 88
7.5 Benefits of a FTT ........................................................................................................................................... 90
7.6 Technical feasibility of a FTT ........................................................................................................... 91
7.7 Feasibility of a transaction tax with direct remittance of revenues ....... 91
7.8 Recommendations ...................................................................................................................................... 92
PART 8 CONCLUSION AND SUMMARY OF RECOMMENDATIONS ........................ 94
8.1 Conclusion ........................................................................................................................................................... 94
8.2 Recommendations ...................................................................................................................................... 95
REFERENCES ................................................................................................................................................................ .... 96
The Taxation System in Zambia Final Report-January 2011
iv
GLOSSARY AfDF African Development Fund AIT Advance Income Taxes ASIP Agricultural Sector Investment Programme CES Carbon Emission Surtax CFDs Contracts for Differences CFTC Commodity Futures Trading Commission CIT corporate income tax COMESA Common Market for Eastern and Southern Africa COMEX COMEX = NYMEX = New York Mercantile Exchange CSO Central Statistics Office CSPR Civil Society for Poverty Reduction CSR Corporate Social Responsibility DFID Department for International Development EITI Extractive Transparency Initiative FDI Foreign Direct Investment FTT Financial Transaction Tax GDP Gross Domestic Product GNI Gross National Income GRZ Government of the Republic of Zambia HDI Human Development Index HIPC Highly Indebted Poor Countries ICT Information Communication Technology IDA International Development Association IMF International Monetary Fund JCTR Jesuit Centre of Theological Reflection KCM Konkola Copper Mine LME London Metal Exchange MDGs Millennium Development Goals MDRI Multilateral Debt Relief Initiative METR Marginal Effective Tax Rate MoFNP Ministry of Finance and National Planning MTEF Medium Term Expenditure Framework NGO Non-Governmental Organizations ODA Official Development Assistance OECD Organization for Economic Cooperation and Development PAYE Pay as You Earn
The Taxation System in Zambia Final Report-January 2011
v
SACU Southern African Customs Union SADC Southern African Development Community SEI Self-employed Individuals TPRC Tax Policy Review Committee UK United Kingdom UNDP United Nations Development Programme VAT Value Added Tax ZESCO Zambia Electricity Supply Corporation ZMK Zambian Kwacha ZRA Zambia Revenue Authority
The Taxation System in Zambia Final Report-January 2011
vi
SUMMARY OF THE REPORT
Taxes world over are mainly levied in order to raise revenue to fund government developmental operations and assist to reduce disparity between the rich and the poor and reduce poverty. This study was undertaken on behalf of the Jesuit Centre of Theological Reflection (JCTR), which is a research, education, and advocacy organization that promotes study and action on issues linking faith and social justice in Zambia. The Debt, Aid and Trade (DAT) programme of JCTR commissioned the study to comprehend the taxation system in Zambia with the aim of forming knowledgeable and evidence based opinions on how it affects social justice1
The study uses qualitative and quantitative analysis based on data compiled from various sources. This study was motivated by the poor performance of the revenue system in the last decade. In particular, there has been an obvious decline in the share of tax revenue to Gross Domestic Product (GDP) while the performance of some tax types, such as domestic VAT and trade taxes, have also progressively declined. The performance of the mining sector taxes has equally not been impressive and there has been concern as to whether the sector is being taxed optimally. Another factor that motivated the study was the need to analyse the role of the informal sector in the tax system and how it can sustainably contribute to domestic revenue mobilization. This is because, up until now, the tax system has relied mostly on revenues from the formal sector while the informal sector remains largely untaxed. The last motivating factor was the need to explore how Zambia can raise extra revenue from its traditional exports, like copper, through a financial transaction tax.
.
The premise of this study is that Zambia has the potential to raise more tax revenue and improve social justice by employing prudent policies and practices that improve tax revenue administration. The major objective of the study is to contribute to the existing body of knowledge on the tax system in Zambia by identifying the key challenges and possible success factors. The information generated by this study would be used by the JCTR as research, education, and advocacy tools to lobby relevant authorities on how the current tax system can be best utilized and reorganised in order to attain social justice.
1 Social justice deals with matters of fair distribution of advantages, assets, and benefits among all members of a society. This can be attained through degree of economic equality through progressive taxation, income redistribution, or even property redistribution.
The Taxation System in Zambia Final Report-January 2011
vii
Study findings
Part 2 Government funding sources and overview of the tax system
Zambian taxes are broadly categorised into three groups as follows: income taxes, consumption taxes and trade taxes. These taxes make up the domestic revenue base for the country. These taxes contribute up to 70 percent to national budget. Other revenues that Government mobilises to supplement tax revenue comes from funding from external donors through budgetary support, Foreign Direct Investment (FDI), and debt provision. Apart from these revenue sources, there are other sources that are not fully exploited yet. These include, local government revenues and alternatives taxes, such as wealth taxes. However, these alternative sources of revenue have challenges that need to be addressed if they are to be reliable and predictable sources of revenue.
Increasing the tax take from wealth transactions can increase the tax base and allow the government to reduce the highly unequal burden on the formally employed, which is unfair and creates economic distortions. The closest tax that reflects wealth transaction in Zambia is the property transfer tax. However, this tax has not performed well because properties are mostly undervalued which negatively affects tax revenue realized from property transactions. The lack of well-trained tax inspectors in property evaluation compounds the problem and as such, tax evasion is common.
The tax administration system faces several challenges, among them the following: a large informal cash economy; low taxpayer compliance; complexities associated with taxation of international transactions; poor traceability of taxpayers; smuggling; and inadequate funding to Zambia Revenue Authority (ZRA), for infrastructural and technological development.
The Zambian tax system has numerous tax types and rates, which can result in high effective taxation. The many taxes and rates have the potential to make the tax system complex, and therefore increase the cost of compliance and encourage non-compliance. Further, the tax system is mature and has undergone several administrative and policy reforms. The tax formulation process is inclusive (both government and private sector participate in the formulation process), although it still has some challenges.
The following recommendations were made with respect to Part 2 of the study:
1. Government must explore and create conducive policies to tap on alternative sources of revenue and relieve some pressure on the tax system.
2. Wealth taxation if considered and implemented in Zambia can further increase the tax base and promote equity.
The Taxation System in Zambia Final Report-January 2011
viii
3. There is need to support the operations of ZRA by providing it with adequate funding for its operations.
4. ZRA must commission a study to determine the optimal level of funding and the impact of increased funding on revenue collection.
5. To avoid the risk of high effective taxation, Government must consider reducing the number of taxes and tax rates.
6. The tax system must develop an effective system of taxpayer services and education that will effectively communicate and educate taxpayers about their tax obligations and associated penalties. This will increase voluntary compliance and minimise cases of negligence, wilful default and fraud in the tax system.
7. Government must further enhance the tax policy formulation by creating a recognised binding legal structure or mechanism that formalises the participation of non- government actors in the national budget process.
Part 3 The structure and performance of the tax system
In Zambia, income taxes are the major sources of revenue followed by consumption taxes (domestic VAT, import VAT and excise duty) and trade taxes (customs duty and export duty). Up until ten years ago, international trade taxes used to account for the bulk of the taxes collected but now there has been a shift to income taxes, particularly Pay As You Earn (PAYE). During this same period, the proportion of consumption taxes (domestic VAT, import VAT and excise duty) has also increased steadily.
Most taxes in the Zambian tax system are borne by the formal sector. Even here, only few firms and individuals in selected economic sectors are bearing the burden of tax. In whole, the tax system is responsive and buoyant as it is capable of capturing more revenue when the economy is doing well and similarly records revenue declines during bad times when the economy is in a recession. The tax system can be considered effective going by the good performance of tax collections against set targets and the good tax-to-GDP ratio. However, there has been concern on the performance of the tax system, particularly in the last three years, when there has been some decline.
In terms of adequacy, the contribution of tax revenue to the national budget has increased overtime, rising from 50 percent in 2001 to 70 percent in 2010. The rising contribution of tax to the national budget will eventually make the tax system sustainable especially that donor support is steadily declining.
The following recommendations were made with respect to Part 3 of the study:
The Taxation System in Zambia Final Report-January 2011
ix
1. The tax system must move towards a tax structure that relies more on consumption taxes and less on income and trade taxes as these have proved to be volatile and may cause inefficiency and inequity.
2. There should be improvement in the VAT refund administration as the high tax refunds that go to the mining sector (over 90%) have dictated the performance of VAT.
3. There should be greater investment in VAT administration processes using Information Communication Technology (ICT) options.
4. There should also be a major review of exemptions to determine their cost effectiveness and impact on the VAT tax base.
5. There is therefore need to broaden the tax base by spreading to other sectors and individuals, including the informal sector. This is because, the middle-class (those who derive the majority of their income from formal salaries) are faced with the highest burden of taxation.
Part 4 Tax incentives
Government favours the use of incentives as a means of fostering economic growth. As such, the Zambian tax system offers several incentives, such as low tax rates and tax breaks. However, care has to be taken in designing these incentives if they have to yield the desired results. In Zambia, there is evidence that tax incentives, concessions and exemptions and legislated trade tax concessions and tariff reductions due to the Southern African Development Community (SADC) and the Common Market for East and Southern Africa (COMESA) trade protocols have collectively eroded the tax base. Further, some incentives currently used in Zambia represent serious problems for revenue leakage and administration.
The following recommendations were made with respect to Part 4 of the study:
1. Government must cost incentives so that they are part of the national budget formulation process. Government must undertake further analysis on the costs and benefits of incentives.
2. Government must improve oversight on the allocation of budget discretionary measures. Discretionary incentives currently issued by the Minister of Finance must be done with the concurrence of Parliament.
3. Government must design incentives with the impact of tax administration in mind and avoid incentives that can be abused or hard to administer.
4. Government must work towards a system of simplified uniform tax rates to control for high effective tax rates that may complicate tax administration and cause tax leakages.
The Taxation System in Zambia Final Report-January 2011
x
Part 5 Taxation of the mining sector
The contribution of the mining sector taxes, over the period 2006 to 2009, averaged 7 percent (excluding PAYE, which is paid by employees). The contribution of the mining sector to total tax revenue has steadily increased mainly as a result of high mineral prices, increased output, and increase in the mineral royalty rate following policy changes in 2008. Meanwhile, much of the mining industry is still recouping investment costs and when these losses are finally recouped, it is expected that a much larger share of revenue collection will come from the mines. Like any other large and specialized operations, mining operations are very complex and provide taxation challenges. ZRA recognises this and now has established a dedicated Mining Tax Unit (MTU) to ensure efficient and effective taxation of the mining sector. Lately, there has been a lot of debate on the choice of tax instrument to use for the mining sector. The debate has mainly been on whether to use a windfall tax based on sales revenue or not.
Zambia’s ‘Windfall tax’ is a tax on sales revenues. However, such a tax regime can put firms under financial strain when costs rise relative to the mineral prices. With a ‘windfall tax’, operators of more costly mines, such as underground and old mines, would be inequitably taxed compared to those with relatively less costly mining operations, such as open-pit and new mines. A ‘Windfall tax may, therefore, pose a threat on the viability of some mines and may lead to closure and related job losses.
Zambia has another option for taxing the mining sector, using the “variable profit tax” regime. Consistent with the principle of taxation, it is a much better instrument as it is more focused towards profits unlike windfall tax which is insensitive to the cost structure of the mines. This notion of “variable profit tax” or taxing super profits is currently applied in the financial sector and will be applied to the telecommunication sector, as announced in the 2011 budget. In both the financial and telecommunications sectors, it is configured on profits and not revenues. As such, with full information disclosure by mining companies, all expected taxes can be captured optimally using variable profit tax.
The following recommendations were made with respect to Part 5 of the study:
1. There is need for continued support, both financial and materially, to enable ZRA keep pace with the complexities associated with mining taxation, such as counteracting transfer pricing by mining firms.
2. The use of variable profit taxation is supported as it is administratively consistent with the current practices within the ZRA. This is in view of the fact that the capacity of the Authority is now being reinforced with the establishment of a specialized mining unit.
The Taxation System in Zambia Final Report-January 2011
xi
3. In view of the complex nature of mining taxation, technical tax loopholes, such as the treatment of hedging income2
and other tax avoidance tendencies, must be addressed. This will reduce the difficulties faced by the tax authority and so increase its capacity to administer the mining tax regime.
Part 6 Informal Sector Taxation
In Zambia, the informal sector is growing but its contribution to tax revenue has remained poor. In order to meet the ever-growing demand for social services and development there is need to extend taxation to the informal sector. This will enhance tax revenue productivity and attain equity in bearing the tax burden.
Zambia has in place a presumptive tax regime for the informal sector that is simplified and aims to deal with factors hindering the participation of the informal sector in taxation. However, the performance of the informal tax regime has not been impressive although it has the potential to grow if several challenges are addressed. ZRA has started to address some of the challenges and the contribution of taxes from informal sector has been increasing, though slowly.
Taxation of the informal sector is labour-intensive and potentially low yielding especially if undertaken solely by the tax authority. As such, any moves to broaden the tax base by reaching out to the informal sector will need a significant budgetary support for tax administration. Administering taxes in the informal sector has several challenges such as; a large cash-based informal economy that reduces ability to audit transactions; improper record keeping and widespread political interference. The following recommendations were made with respect to Part 6 of the study:
1. ZRA must consider contracting the collection of such taxes to formal institutions, such as local councils, that have some degree of legitimacy and can exercise control and sanctions in case of non-compliance.
2. ZRA must consider utilising informal sector business associations, such as cross border traders and similar representative bodies, to promote compliance using peer pressure and coherence.
3. ZRA needs to continue developing innovative approaches that can provide less costly taxpayer services, such as e-payment and e-filling and improve taxpayer education to the informal sector.
2 Hedging relates to the practice of buying and selling derivatives like options and futures to protect a business from volatile prices and costs.
The Taxation System in Zambia Final Report-January 2011
xii
Part 7 Feasibility of an international Financial Transaction Tax
Financial Transaction Taxes (FTTs) exist in various forms, although the implementation of one on an international context and across certain asset types, like commodity futures, has not been done on a large scale. Most FTTs are currently specific to individual countries. FTTs could be an efficient, and administratively cheap, means to raise funds for international development and other global objectives.
However, there are two key arguments against FTTs. Firstly, there are real technical problems with its implementation and secondly there is a risk of damaging market liquidity (which is essential to the smooth running of global markets) because an FTT comes with a cost. In terms of technical feasibility, a common argument is that an FTT would have to be globally implemented to avoid market fragmentation and trading migration to untaxed products and services. It also requires a far larger political commitment.
The study analysed the possibility of implementing an FTT on copper transactions with direct remittance to Zambia. The study found that such a proposal would not be feasible. This is because the majority of copper transactions are not based on a physical trade but are purely financial (no copper actually changes hands). As such, these trades cannot be attributed to the trading of copper originating from Zambia. Therefore, the tax revenue from these trades could also not easily be attributed to Zambia.
The following recommendations were made with respect to Part 7 of the study:
1. An international FTT must be supported although there is no mechanism for direct allocation of revenues according to producer countries. Instead, in line with most common proposals on this topic, revenues would be collected in a common fund that would be allocated along the same lines as all other developmental aid.
2. With regard to the proposal of a FTT levied on commodities in which revenues can be remitted back to Zambia, this study is not supportive. This is because a remittance mechanism would not be at all feasible since the vast majority of trading is not related to any physical commodity.
PART 1 INTRODUCTION AND BACKGROUND
1.1 INTRODUCTION Primarily a country’s tax system must provide sufficient funds for government expenditure programmes. However, the means of attaining this basic requirement to get a sufficient level of taxation matters a lot. This mainly relates to the structure and productivity of the tax system. A productive and well-structured tax system should espouse two basic principles. It should:
• minimise the distortion caused by taxation as economic agents attempt to limit their tax liability (the principle of ‘efficiency’); and
• extract tax without disadvantaging or discriminating against any taxpayer (the principle of ‘equity’).
In addition to the main objective, taxes can also be used to redistribute income in the economy to reduce inequality or as a tool for regulation to encourage or dissuade particular activities in order to enhance social welfare. For example, imposition of excise taxes on cigarettes and alcohol could be aimed at reducing the incidence of diseases associated with the consumption of these products. Taxation can also be used to achieve certain macroeconomic objectives such as low inflation by increasing levels of taxation in general or to stimulate economic activity by offering tax incentives in certain sectors of the economy. However, the achievement of these secondary aims should not compromise the core tenets of efficiency and equity.
Developing countries like Zambia face impediments to achieving key objectives of taxation. These objectives are universal, but countries endeavour to achieve them in very different environments. Developing countries, in particular, face great obstacles in achieving these aims. In fact, the need for high government
Summary of key points
• Factors that motivated the study were the following:
o the poor performance of the Zambian tax system; o the impact of tax incentives on the revenue system; o the performance and taxation options of the mining sector; o the performance and taxation options of the informal sector; and o the possibility of a financial transaction tax on copper trading.
• The premise of this study is that Zambia can raise enough developmental resources through an equitable and efficient tax system.
• The objective of the study is to contribute to the existing knowledge on the tax system in Zambia.
The Taxation System in Zambia Final Report-January 2011
2
expenditure is even greater in developing countries where the capital stock (e.g. schools, hospitals and roads) is low. In Zambia, tax revenues fund a lot, but not all of expenditure.3
This study was undertaken on behalf of the Jesuit Centre of Theological Reflection (JCTR), which is a research, education, and advocacy organization that promotes study and action on issues linking faith and social justice in Zambia. The Debt, Aid and Trade (DAT) programme of JCTR commissioned the study to comprehend the taxation system in Zambia with the aim of forming knowledge and making evidence based opinions on how it affects social justice.
The shortfall is mainly plugged by foreign aid from cooperating partners and by government borrowing, both locally and internationally.
The study uses qualitative and quantitative analysis based on data compiled from various local and international academic research works, policy reports, reports from institutions of government, grant-aided institutions and non-government actors that play pivotal roles in tax administration and policy.
1.2 FACTORS THAT MOTIVATED THE STUDY
Zambia is facing particular tax performance challenges that need to be addressed urgently. The ratio of tax revenue to Gross Domestic Product (GDP), often used as a basic measure of the performance of a tax system, has been on the decline, from 19.2 percent in 2000 to 15 percent in 2009.
The performance of the Zambian tax system
4 Underlying this overall decline in this performance measure is a slow change in the structure of tax revenue (i.e. the different sources of tax revenue). The recent global recession of 2008/2009 highlighted the dangers of relying on trade taxes. However, the best alternative, that is, reliance on consumption taxes, especially domestic VAT, have been declining in performance. The country, therefore, has continued to rely on income taxes as the major sources of tax revenue.
The declining tax performance in the recent past has been caused, in part, by the proliferation of tax incentives in Zambia. While, in principle, these should encourage economic growth, there is mixed evidence on whether this is actually the case. What is much more certain is the large loss of tax revenue and associated costs because of these incentives.
Tax incentives
3 Taxes funding of the national budget has improved, from 45 percent in 2000 to about 70 percent in 2009.
4 The Medium Term Expenditure Framework (MTEF) has projected to increase the tax revenue to GDP ratio to between 18 and 20 percent during the period 2011 to 2013. But this may fail if the issues described in this study are not solved.
The Taxation System in Zambia Final Report-January 2011
3
Zambia’s greatest opportunity for growth, poverty reduction and development is in harnessing the wealth of its mineral resources. It is debatable whether past mining tax systems fully seized this opportunity. For instance, from 1997 to 2005 the mining sector only contributed three percent of total revenues on average. This performance has improved slightly and now contributes seven percent on average since 2009.
Taxing the mining sector
5 Some of this increase is attributed to the recent reforms in the tax system, as well as high copper prices. However, despite this increase in performance, the government should still strive towards achieving an optimal taxation system for the mining sector. This study investigates how much further the Government must go before this is achieved.
The Zambian tax system has relied mainly on revenues from the formal sector while the informal sector (businesses) remains largely untaxed. For example, there are around 500,000 workers in the formal sector while the informal sector is estimated at 4.2 million workers.
The informal sector
6 Such a high level of informality is a recipe for failure to meet the principle objectives of a tax system. With a large revenue base untaxed, the resulting burden on the formal sector may be inequitable.
As this report explains, Zambia’s mineral tax regime may still not be performing satisfactorily. There may be other innovative methods of capturing tax revenue from the mining sector. One possible innovation is the use of a Financial Transaction Tax on copper that is traded on the international market. The study evaluates the possibility of such a transaction tax.
Possibility of a financial transaction tax on copper
1.3 THE HYPOTHESIS AND OBJECTIVE OF THE STUDY The premise of this study is that Zambia can equitably and efficiently raise enough resources through taxation and raise the necessary finances for development, address the needs of the poor and improve social justice. The aim and objective of the study is to contribute to the existing knowledge on the tax system in Zambia, its policy and practice, and make recommendations on the alternative ways of improving Government revenue from domestic and trans-national taxes.
The information generated by this study would be used by the JCTR as research, education, and advocacy tools to lobby relevant authorities on how the current tax system can be best utilized and reorganised in order to attain social justice. For the Debt, Aid and Trade (DAT) programme in particular, the study will provide an insight on how increased domestic revenue can reduce debt and rationalise foreign
5 Source: ZRA website.
6 CSO labour Survey of 2007 estimated that Zambia had 500,000 formal sector workers.
The Taxation System in Zambia Final Report-January 2011
4
aid and trade in order to attain a higher level of equity, justice and accountability in the contribution of taxes.
1.4 STRUCTURE OF THE STUDY This study is structured as follows:
• Part 1 discusses the background and justification for the study. • Part 2 discusses the overview of the tax system. • Part 3 discusses the structure and performance of the tax system. • Part 4 discusses tax incentives. • Part 5 discusses the taxation of the mining sector. • Part 6 discusses informal sector taxation. • Part 7 discusses the feasibility of a financial transaction tax for Zambia. • Part 8 concludes the study and summarises recommendations.
Each Part starts with a summary of key points and ends with recommendations.
The Taxation System in Zambia Final Report-January 2011
5
PART 2 OVERVIEW OF THE TAX SYSTEM
Summary of key points
• Taxation is just one option of funding government developmental programmes. Apart from taxation, there exists various forms of funding, that must be fully exploited. Addressing challenges of these other sources would increase the revenue base and make the tax system more equitable.
• The tax administration continues to face several challenges ht need urgent attention.
• The tax system broadly comprises income taxes, consumption taxes and
trade taxes. Income taxes contribute the most to Government revenue.
• The tax system has numerous tax types and many rates, which has the potential to make the tax system complex, costly and may encourage non-compliance.
• The tax system has undergone several administrative and policy reforms and the tax formulation process is fairly inclusive.
• Government must explore and create conducive policies and institutional provisions to tap alternative sources of funding. Some taxes that reflect wealth should be introduced or enhanced. This includes property income taxes, withholding taxes and other wealth taxes.
• The study recommends continued strong support to ZRA.
• Government may consider reducing the number of taxes and tax rates on
some activities to avoid high effective taxation. Government should reform to a single tax rate for income tax to make it equitable and less complex.
• The tax system must develop or enhance an effective system of taxpayer services and education that will effectively communicate and educate taxpayers about their tax obligations and associated penalties.
• The tax formulation process must create a legal and binding structure that should formalise the participation of non-government actors.
The Taxation System in Zambia Final Report-January 2011
6
2.1 INTRODUCTION Conceptually, developmental needs can be funded from both private and public sources. Resources from private entities can be provided through domestic private borrowing while resources from public entities are provided mainly through taxation as well as from foreign sources, both private and public. External private sources include Foreign Direct Investment (FDI), portfolio investments and remittances from nationals abroad while external public sources include foreign aid and foreign public borrowing. According to studies commissioned by the Civil Society for Poverty Reduction (CSPR, JCTR and CSTNZ) in 20087, Zambia needs a significant increase in income from donor countries in addition to local resources if it is to meet the Millennium Development Goals (MDGs)
Given the immense difficulties of raising sufficient taxes and the costs to economic efficiency and equity, there is a case for supporting alternative sources of funding for developing countries. What this means is that tax is just one form of funding development, and if other sources fall, then tax resources have to increase to maintain the balance.
.
2.2 ALTERNATIVE SOURCES OF DEVELOPMENTAL FUNDING Zambia currently relies on a mix of revenue sources mentioned above. However, some of these sources are less predictable and unreliable. This section discusses some common sources of development funding and the associated opportunities and challenges.
Development aid or development cooperation (also called development assistance, technical assistance, international aid, overseas aid, Official Development Assistance (ODA) or foreign aid) is aid given by governments and other agencies to support the economic, environmental, social and political development of developing countries. It is distinguished from humanitarian aid by focusing on alleviating poverty in the long term, rather than a short term response. The term development cooperation is used to express the idea that a partnership should exist between donor and recipient, rather than the traditional situation in which the relationship was dominated by the wealth and specialised knowledge of one side. Most development aid comes from the Western industrialised countries but some poorer countries also contribute aid. Aid may be bilateral: given from one country directly to another; or it may be multilateral: given by the donor country to an international organisation such as the World Bank or the United Nations Agencies
Overseas Development Assistance
7 Study1: A Future without the Debt Burden: is it feasible for Zambia?: Study 2: An Assessment Study on the Impact of Donor Aid Conditions and Study 3: It is Half-Time- Will we finish the race? A Study of Zambia and trade issues in the context of MDG number 8.
The Taxation System in Zambia Final Report-January 2011
7
which then distributes it among the developing countries. In the world, the proportion is currently about 70 percent bilateral 30 percent multilateral8
About 80-85 percent of developmental aid comes from government sources as Official Development Assistance (ODA). The remaining 15-20 percent comes from private organisations such as "
.
Non-governmental organisations" (NGOs), foundations and other development charities9. In addition, remittances received from migrants working or living in diaspora form a significant amount of international transfer.
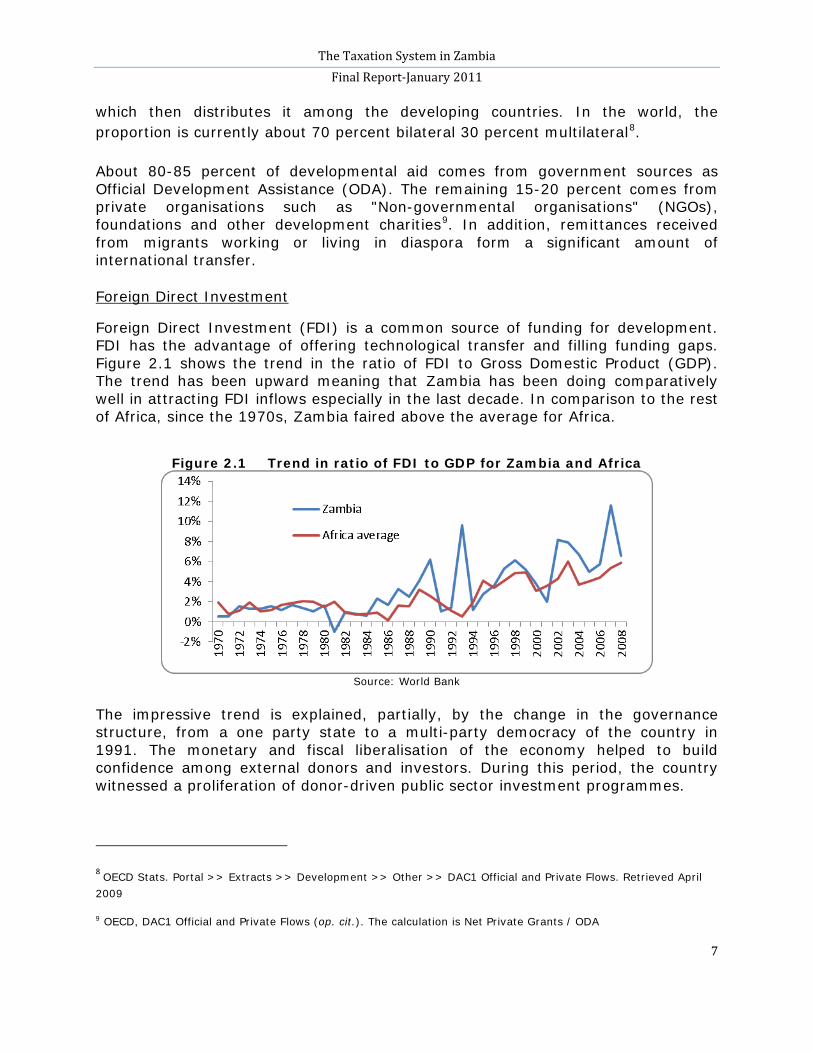
Foreign Direct Investment (FDI) is a common source of funding for development. FDI has the advantage of offering technological transfer and filling funding gaps. Figure 2.1 shows the trend in the ratio of FDI to Gross Domestic Product (GDP). The trend has been upward meaning that Zambia has been doing comparatively well in attracting FDI inflows especially in the last decade. In comparison to the rest of Africa, since the 1970s, Zambia faired above the average for Africa.
Foreign Direct Investment
Figure 2.1 Trend in ratio of FDI to GDP for Zambia and Africa
Source: World Bank
The impressive trend is explained, partially, by the change in the governance structure, from a one party state to a multi-party democracy of the country in 1991. The monetary and fiscal liberalisation of the economy helped to build confidence among external donors and investors. During this period, the country witnessed a proliferation of donor-driven public sector investment programmes.
8 OECD Stats. Portal >> Extracts >> Development >> Other >> DAC1 Official and Private Flows. Retrieved April 2009
9 OECD, DAC1 Official and Private Flows (op. cit.). The calculation is Net Private Grants / ODA
The Taxation System in Zambia Final Report-January 2011
8
FDI as a source of funding is, however, volatile, as it is dependent on investment parameters that include political stability and performance of the global economy. This is evident from a noticeable dip seen in 1991 just before Zambia changed to a multi-partisan system and another dip in 2008, during the global economic crisis. With such volatility, FDI may not be relied upon to provide predictable flow of funding. Like Mutesa, F (2008)10 noted during the global economic crisis of 2008, “the political climate in the capitals of donor nations may dictate that priority be given to dealing with domestic problems before extending a helping hand to people in remote places”.
Public–private partnership (PPP) describes a government service or private business venture that is funded and operated through a partnership of government and one or more private sector companies. These schemes are sometimes referred to as Public–Private Partnership (PPP). PPP involves a contract between a public-sector authority and a private party, in which the private party provides a public service or project and assumes substantial financial, technical and operational risk in the project.
Public–Private Partnership
In some types of PPP, the cost of using the service is borne exclusively by the users of the service and not by the taxpayer. In other types (notably the private finance initiative), capital investment is made by the private sector on the strength of a contract with government to provide agreed services and the cost of providing the service is borne wholly or in part by the government. Government contributions to a PPP may also be in kind (notably the transfer of existing assets). In projects that are aimed at creating public goods like in the infrastructure sector, the government may provide a capital subsidy in the form of a one-time grant, so as to make it more attractive to the private investors. In some other cases, the government may support the project by providing revenue subsidies, including tax breaks or by providing guaranteed annual revenues for a fixed period.
The Government of the Republic of Zambia has recognised that the national treasury has limited resources for economic programmes which include infrastructure development and delivery of social services. For this reason the Government has facilitated the provision of infrastructure development through PPPs. In this regard, most construction, rehabilitation and maintenance of infrastructure is now being contracted out in order to further increase private sector involvement. Overall, PPPs have been identified as a viable means of infrastructure development that can effectively address the constraints of finance and
10 Paper presentation on “Impact on Zambia of the global financial crisis: the social and poverty dimensions” University of Zambia ,Development Studies Dept. 23/10/08; Taj Pamodzi, Lusaka, Zambia
The Taxation System in Zambia Final Report-January 2011
9
management faced by the public sector. The PPP concept allows the public sector to source private sector providers for the delivery of public infrastructure and related services which the private sector can provide more effectively and efficiently.
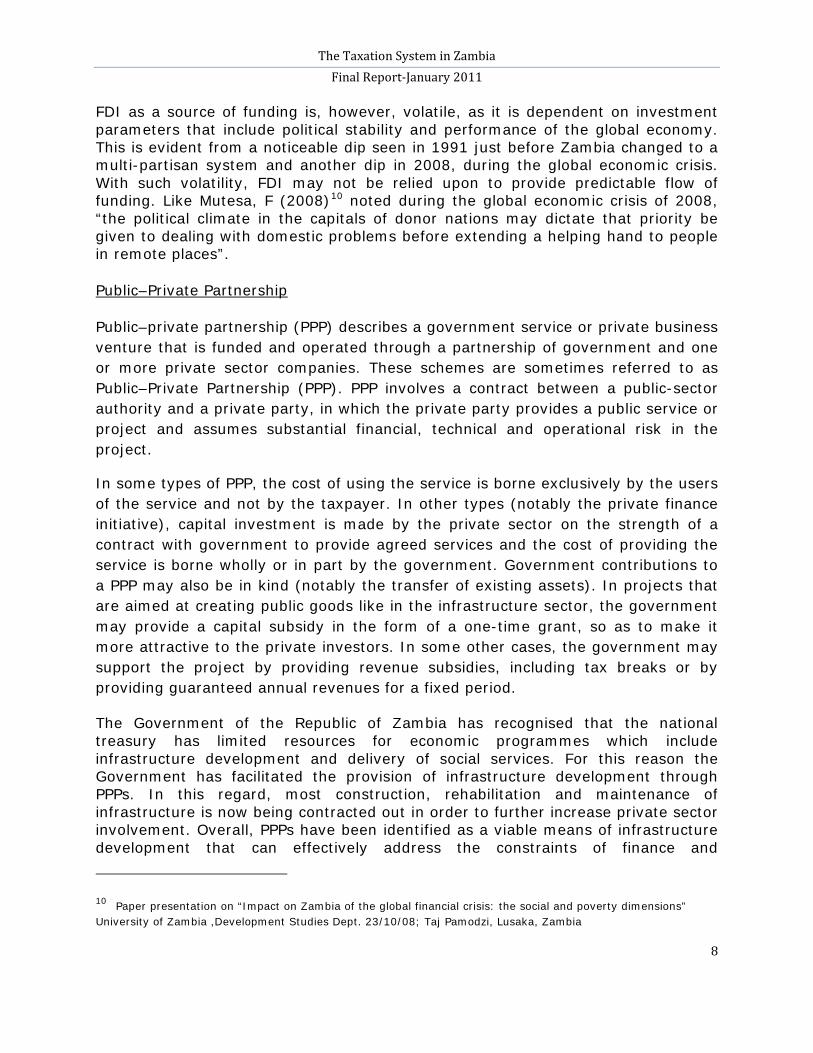
Many countries have to borrow money in one form or another in order to meet their planned investments. Countries like Brazil, Uruguay, and Philippines issue bonds to borrow from foreign investors. Ghana has also issued bonds before in order to borrow externally. Figure 2.2 shows the trend in the ratio of external debt to Gross National Income (GNI) since 1970.
Debt inflow
F
Figure 2.2 Trend in ration of external debt to GNI for Zambia and Africa
or much of its history, Zambia has had external debt levels far higher than the average in Africa.
Source: World Bank and Authors’ calculations
The debt levels, however, started to fall after debt cancellation in 2005 and 2006 following the county’s attainment of the Highly Indebted Poor Countries (HIPC) completion point and after benefiting from the Multilateral Debt Relief Initiative (MDRI). The MDRI provided for 100 percent relief on eligible debt from three multilateral institutions (IMF, the International Development Association (IDA) of the World Bank, and the African Development Fund (AfDF)) to a group of low-income countries that reached the completion point.
Zambia's external debt position currently stands at about US$3.3billion, Government external debt is around half11
11 http://www.zambian-economist.com/2010/03/from-china-with-debt.html
. Debt as a source of funding comes with a cost since the money is pegged to an interest rate. If not properly managed, there is a risk of getting into a debt trap if the country’s capacity to pay back falls. The period before 2005 emphasises the point that there is a possibility of ‘runaway debt’ levels. According to CSPR studies (2008), debt can be more useful if Government takes steps to provide a legislative environment to ensure
The Taxation System in Zambia Final Report-January 2011
10
transparency and accountability in its use. Unless this attained, there is little scope to rely on borrowing to fund economic development.
Remittances
Remittances or contributions sent by citizens living abroad can be potential sources of revenue for economic development and citizens’ welfare. In some countries, like Mexico, the amounts are very substantial and make up an important part of financing economic activity. For example in 2004, remittances became the tenth largest source of foreign income. According to Christopher Lydon,12
In 2009, in the
migrant workers in the world remitted more than US$232 billion to their families in 2006. Noticeably, US$232 billion is twice what the world paid out in international aid in 2005; and in Latin America it was more than aid and foreign direct investment combined.
Philippines, despite the global economic downturn, foreign remittances held up well, providing the economy a desperately needed capital boost. It was reported that overseas Filipino workers' remittances reached nearly US$7 billion in the first quarter of 2009, representing a 2.8 percent increase from the US$6.79 billion recorded over the same period in 2008. It was predicted that remittances will likely reach a record $17 billion in 2009, with the bulk of inflows coming mainly from the United States, Canada, Saudi Arabia, United Kingdom, Japan, Singapore, United Arab Emirates, Italy and Germany. An estimated 10 million Filipinos sent home US$16.4 billion in 2008, making the Philippines the world's fourth largest recipient of remittances, trailing only India (US$45 billion), China (US$34 billion) and Mexico (US$26 billion), according to the World Bank13
Unfortunately, information on remittances by Zambians living abroad is not readily available. Although in 2006,
.
it was roughly estimated that Zambians abroad sent US$201 million in 2006 or 1.8 percent of Zambia's GDP (a little more than the Government got from the entire mining sector)14. The same report estimated that in the same year, Zimbabweans abroad sent US$361m (7.2% of Zimbabwe's GDP). Cliggett L15
12
(2005) noted that "Zambian migrants do not remit large sums of cash or goods, and that the fundamental concern for the migrants in Zambia is investing in people and relationships through remitting, rather than investing in development, improved living conditions or other capital in rural communities."
http://www.radioopensource.org/harnessing-remittances/ - 2006
13 http://www.atimes.com/atimes/Southeast_Asia/KH11Ae01.html
14 http://www.zambian-economist.com/2007/11/zambian-remittances-2nd-edition.html.
15 Cliggett, L. (2003). "Gift Remitting and Alliance Building in Zambian Modernity: Old Answers to Modern Problems." American Anthropologist 105(3): 543-552. Cliggett, L. (2005). "Remitting the gift: Zambian mobility and anthropological insights for migration studies." Population, Space and Place 11(1): 35-48.
The Taxation System in Zambia Final Report-January 2011
11
By and large, remittances in Zambia are unreliable sources of funding. For example, while US$201m was remitted in 2006, this figure fell to US$49m in 200916. Moreover, the true size of remittances remains unknown because there is no formal tracking and accounting mechanisms. Supriya Singh17
From a macroeconomic perspective, it is widely accepted in the existing literature that remittances generate output growth either by increasing consumption or by increasing investment. Beyond the consumption/ investment choice, academicians and policymakers in recent years have been suggesting a third destination of remittances—reverse flows. It has been suggested that remittance flows allow developing countries to maintain adequate foreign reserves, service debt and finance capital flight. Remittances that are used for such reverse flows (i.e., debt amortization, reserve accumulation, or capital flight) are no longer available for consumption or investment, placing a limit on the direct potential growth effect
(2009) argued for the promotion of international mobile remittances and improved financial management as an option, if remittances are to play the desired role in economic development.
18
.
In the case of Zambia, Government should find a better mechanism of tracking and encouraging remittances. The establishment of a Diaspora Desk at State House is a welcome move that should hopefully lead to increased remittances.
This study argues that tax revenue mobilisation must not only be a preserve of the national tax authority because council levies and charges can supplement revenue collections and developmental expenditure. Local governments have a role to play in economic development through provision of local social and economic services. However, in the recent past, local governments have faced a steady fall in the local revenue sources available to them. This situation has been worsened by ad-hoc, discretionary funding from central government that is erratic and unpredictable. Over time, the revenue base of local authorities has eroded due to Government policies like the withdrawal of grants from some councils, and water services and housing, which were a major source of revenue but were privatised
Local government taxation
19
A further important source of revenue is crop levies but considering the low margins faced by many farmers and the need to promote agriculture as a
. The councils still have sources of revenue like markets and bus stations, but they have very little power and influence to fully utilise this revenue base.
16 Paper on “Modernizing Zambia’s payment system”: At the Ecobank Launch of Financial Products, Lusaka, 16th December 2009. Using an exchange rate of 4,500 ZMK to USD.
17 Supriya Singh (2009), “Mobile Remittances: Design for Financial Inclusion”, RMIT University, Melbourne 3001. 18 Anupam Das and John Serieux (2010), “Remittances and reverse flows in Developing countries” The ideas working paper series paper no. 02/2010 Jel classification, f 24; e 21; e 22 19 Local Government Association of Zambia ‘Submission to the Constitutional Review Commission’
The Taxation System in Zambia Final Report-January 2011
12
development tool; these levies were thought to be detriment to economic development.20
The fall in traditional tax bases of the local councils and the general lack of administrative and executive capacity has forced them rely on levies and other business fees. These are far less efficient and equitable than normal tax types and cause significant compliance costs for businesses.
Under pressure from the farmers lobby groups, these have since been abolished. Although the revenue base of councils have eroded, some of them have demonstrated that they can raise enough local revenues and operate effectively. Mulenga (2005) demonstrated that some councils, like Chipata, have fairly efficient and accountable revenue collection systems that can supplement the central government development objectives.
One important reason for the inequality of the income tax system in Zambia is the weak taxation of wealth held by the well off. Currently, Zambia taxes wealth solely through the Property transfer tax on real estate and shares in unlisted companies. Extra tax income can be earned on sustainable basis from selling assets like property or shares. While there is an equity case for exempting tax on gains from selling an individual’s primary residence, tax should be applied to sales of additional properties. Currently Zambia does not tax any of these capital gains. In the 2011 Budget, Government has proposed an increase of the property tax rate from 3 percent to 5 percent which this study supports. The study recommends that such taxes that reflect wealth should be introduced or enhanced. This can be done by taxing capital gains (i.e. income from capital assets) and taxing all dividends income and interest income from bonds, government loans and such assets.
Revenue from wealth taxation
Meanwhile, the property levy, administered by local councils, may or may not be considered a wealth tax in the redistributive sense. Officially, the revenue from the levy should only be spent on local council projects within the area in which the levy is raised. For example, revenue raised in a particular residential area in Lusaka should be spent by the Lusaka City Council in that area only. Hence, these funds cannot officially be spent in other poorer areas of Lusaka. Even so, the property transfer tax has not performed well principally because of a lack of tax inspectors trained in property taxation and the property valuation system itself, which is likely to be undervaluing properties.
Withholding tax on rental income is another way to increase the tax burden of the wealthy. Withholding tax is a government requirement for the payer of an item of income to withhold or deduct tax from the payment, and pay that tax to the government. This includes withholding tax on dividends, interest, rent, commissions, management and consultancy fees. Unfortunately, in Zambia, this tax has not performed very well and has only averaged 5 percent of total revenue collection in the last ten years. The main reason for its poor performance is the lack
20 IMCS/ZAMTIE report (2003)
The Taxation System in Zambia Final Report-January 2011
13
of disclosure of such earned income by the majority of earners. Particularly for withholding taxes on rental property, very few properties particularly houses are registered for tax purposes.
Effective use of withholding taxes can assist Government to combat tax evasion, because typically the withholding tax is treated as a payment on account of the recipient's final tax liability. It may be refunded if it is determined, when a tax return is filed, that the recipient's tax liability to the Government is less than the tax withheld, or additional tax may be due if it is determined that the recipient's tax liability is more than the withholding tax. In some cases the withholding tax is treated as discharging the recipient's tax liability, and no tax return or additional tax is required.
Typically, withholding is required to be done by the employer of someone else, taking the tax payment funds out of the employee or contractor's salary or wages. The withheld taxes are then paid by the employer to the Government, and applied to the account of the employee, if applicable. The employee (consultant) may also be required by the Government to file a tax return self-assessing their tax and reporting their withheld payments. Since the law requires that withholding taxes are paid directly to Government, it is advantageous to the tax system because it ensures that taxes will be paid first, and on time.
2.3 THE TAX SYSTEM IN ZAMBIA
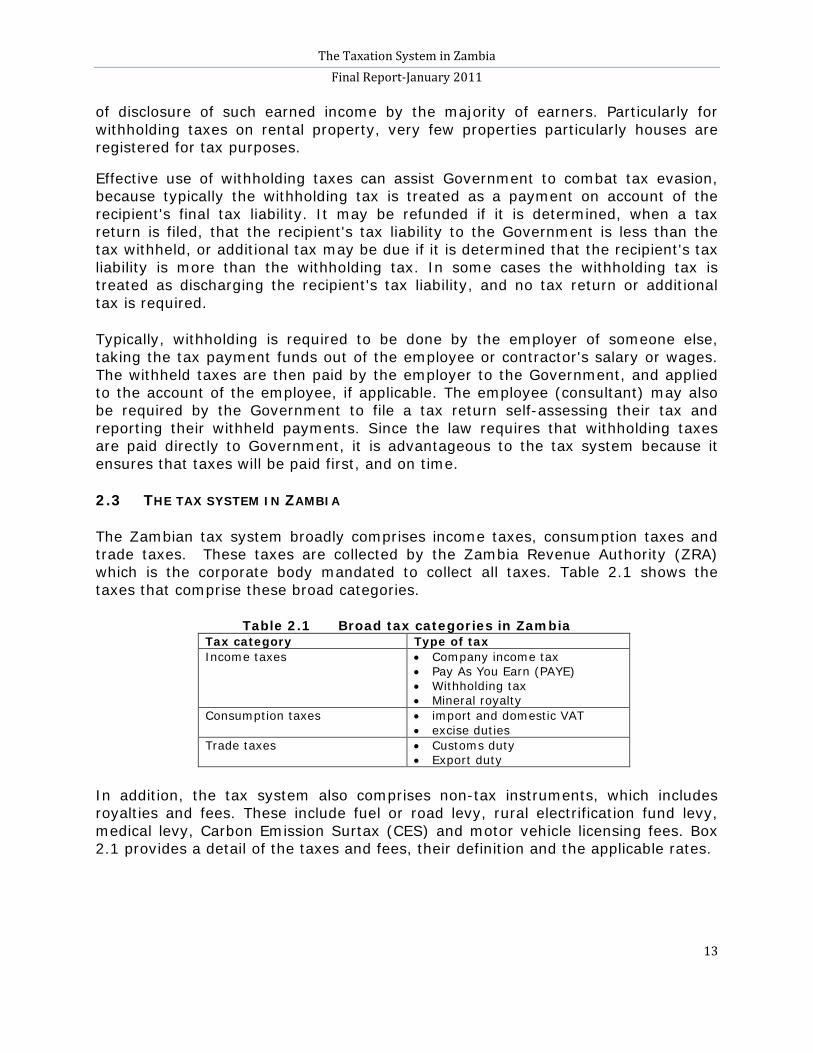
The Zambian tax system broadly comprises income taxes, consumption taxes and trade taxes. These taxes are collected by the Zambia Revenue Authority (ZRA) which is the corporate body mandated to collect all taxes. Table 2.1 shows the taxes that comprise these broad categories.
Table 2.1 Broad tax categories in Zambia Tax category Type of tax Income taxes • Company income tax
• Pay As You Earn (PAYE) • Withholding tax • Mineral royalty
Consumption taxes • import and domestic VAT • excise duties
Trade taxes • Customs duty • Export duty
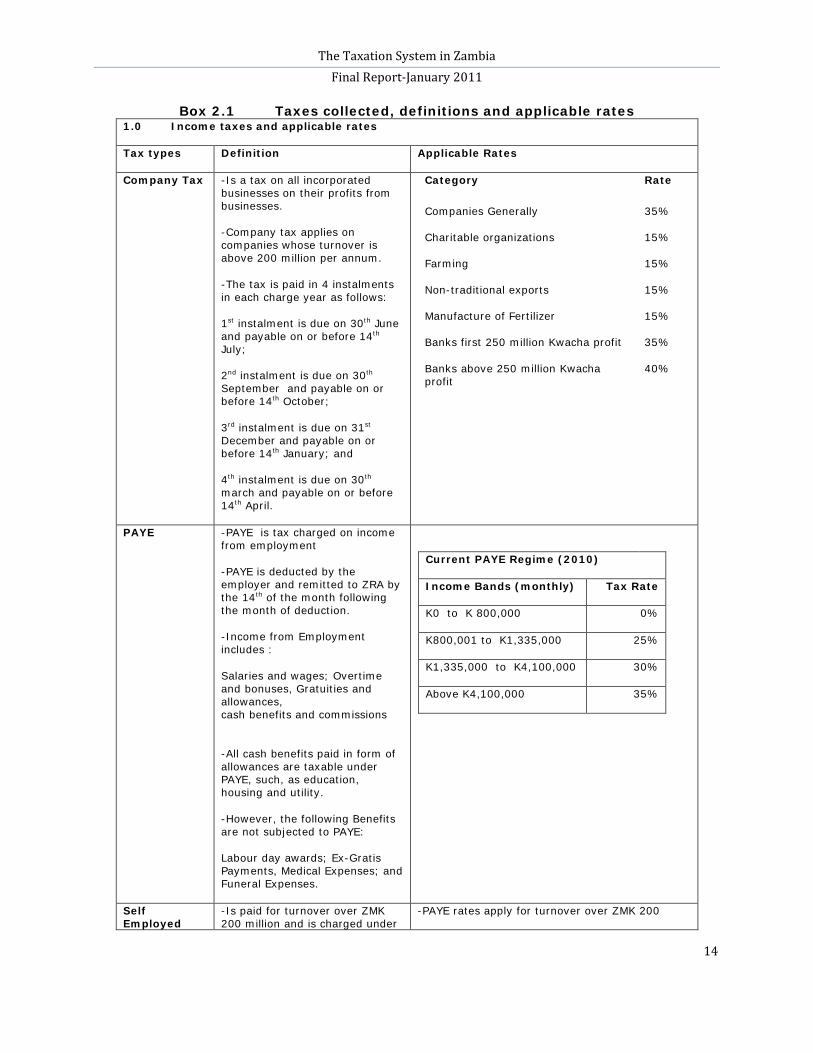
In addition, the tax system also comprises non-tax instruments, which includes royalties and fees. These include fuel or road levy, rural electrification fund levy, medical levy, Carbon Emission Surtax (CES) and motor vehicle licensing fees. Box 2.1 provides a detail of the taxes and fees, their definition and the applicable rates.
The Taxation System in Zambia Final Report-January 2011
14
Box 2.1 Taxes collected, definitions and applicable rates 1.0 Income taxes and applicable rates
Tax types Definition Applicable Rates
Company Tax
-Is a tax on all incorporated businesses on their profits from businesses.
-Company tax applies on companies whose turnover is above 200 million per annum.
-The tax is paid in 4 instalments in each charge year as follows:
1st instalment is due on 30th June and payable on or before 14th
2
July;
nd instalment is due on 30th September and payable on or before 14th
3
October;
rd instalment is due on 31st December and payable on or before 14th
4
January; and
th instalment is due on 30th march and payable on or before 14th
Category
April.
Rate
Companies Generally 35%
Charitable organizations 15%
Farming 15%
Non-traditional exports 15%
Manufacture of Fertilizer 15%
Banks first 250 million Kwacha profit 35%
Banks above 250 million Kwacha profit
40%
PAYE -PAYE is tax charged on income from employment
-PAYE is deducted by the employer and remitted to ZRA by the 14th
-Income from Employment includes :
of the month following the month of deduction.
Salaries and wages; Overtime and bonuses, Gratuities and allowances, cash benefits and commissions
-All cash benefits paid in form of allowances are taxable under PAYE, such, as education, housing and utility.
-However, the following Benefits are not subjected to PAYE:
Labour day awards; Ex-Gratis Payments, Medical Expenses; and Funeral Expenses.
Current PAYE Regime (2010)
Income Bands (monthly) Tax Rate
K0 to K 800,000 0%
K800,001 to K1,335,000 25%
K1,335,000 to K4,100,000 30%
Above K4,100,000 35%
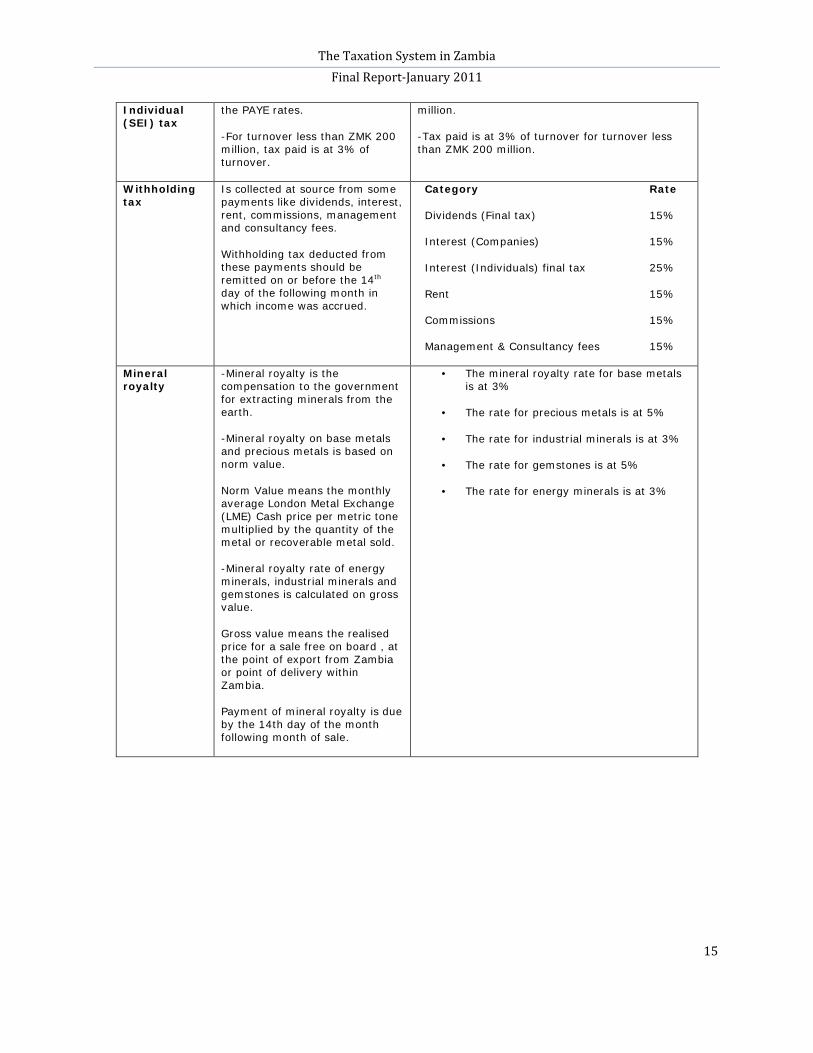
Self Employed
-Is paid for turnover over ZMK 200 million and is charged under
-PAYE rates apply for turnover over ZMK 200
The Taxation System in Zambia Final Report-January 2011
15
Individual (SEI) tax
the PAYE rates.
-For turnover less than ZMK 200 million, tax paid is at 3% of turnover.
million.
-Tax paid is at 3% of turnover for turnover less than ZMK 200 million.
Withholding tax
Is collected at source from some payments like dividends, interest, rent, commissions, management and consultancy fees.
Withholding tax deducted from these payments should be remitted on or before the 14th
day of the following month in which income was accrued.
Category Rate
Dividends (Final tax) 15%
Interest (Companies) 15%
Interest (Individuals) final tax 25%
Rent 15%
Commissions 15%
Management & Consultancy fees 15%
Mineral royalty
-Mineral royalty is the compensation to the government for extracting minerals from the earth.
-Mineral royalty on base metals and precious metals is based on norm value.
Norm Value means the monthly average London Metal Exchange (LME) Cash price per metric tone multiplied by the quantity of the metal or recoverable metal sold.
-Mineral royalty rate of energy minerals, industrial minerals and gemstones is calculated on gross value.
Gross value means the realised price for a sale free on board , at the point of export from Zambia or point of delivery within Zambia.
Payment of mineral royalty is due by the 14th day of the month following month of sale.
• The mineral royalty rate for base metals is at 3%
• The rate for precious metals is at 5%
• The rate for industrial minerals is at 3%
• The rate for gemstones is at 5%
• The rate for energy minerals is at 3%
The Taxation System in Zambia Final Report-January 2011
16
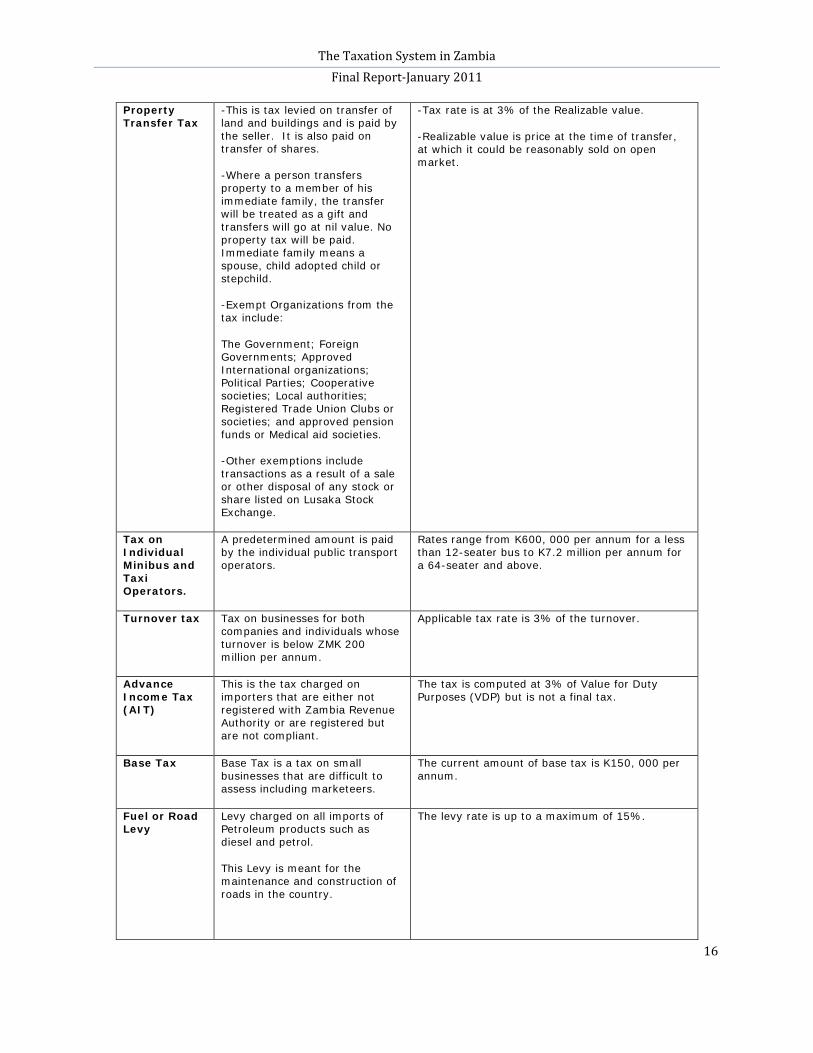
Property Transfer Tax
-This is tax levied on transfer of land and buildings and is paid by the seller. It is also paid on transfer of shares.
-Where a person transfers property to a member of his immediate family, the transfer will be treated as a gift and transfers will go at nil value. No property tax will be paid. Immediate family means a spouse, child adopted child or stepchild.
-Exempt Organizations from the tax include:
The Government; Foreign Governments; Approved International organizations; Political Parties; Cooperative societies; Local authorities; Registered Trade Union Clubs or societies; and approved pension funds or Medical aid societies.
-Other exemptions include transactions as a result of a sale or other disposal of any stock or share listed on Lusaka Stock Exchange.
-Tax rate is at 3% of the Realizable value.
-Realizable value is price at the time of transfer, at which it could be reasonably sold on open market.
Tax on Individual Minibus and Taxi Operators.
A predetermined amount is paid by the individual public transport operators.
Rates range from K600, 000 per annum for a less than 12-seater bus to K7.2 million per annum for a 64-seater and above.
Turnover tax
Tax on businesses for both companies and individuals whose turnover is below ZMK 200 million per annum.
Applicable tax rate is 3% of the turnover.
Advance Income Tax (AIT)
This is the tax charged on importers that are either not registered with Zambia Revenue Authority or are registered but are not compliant.
The tax is computed at 3% of Value for Duty Purposes (VDP) but is not a final tax.
Base Tax
Base Tax is a tax on small businesses that are difficult to assess including marketeers.
The current amount of base tax is K150, 000 per annum.
Fuel or Road Levy
Levy charged on all imports of Petroleum products such as diesel and petrol.
This Levy is meant for the maintenance and construction of roads in the country.
The levy rate is up to a maximum of 15%.
The Taxation System in Zambia Final Report-January 2011
17
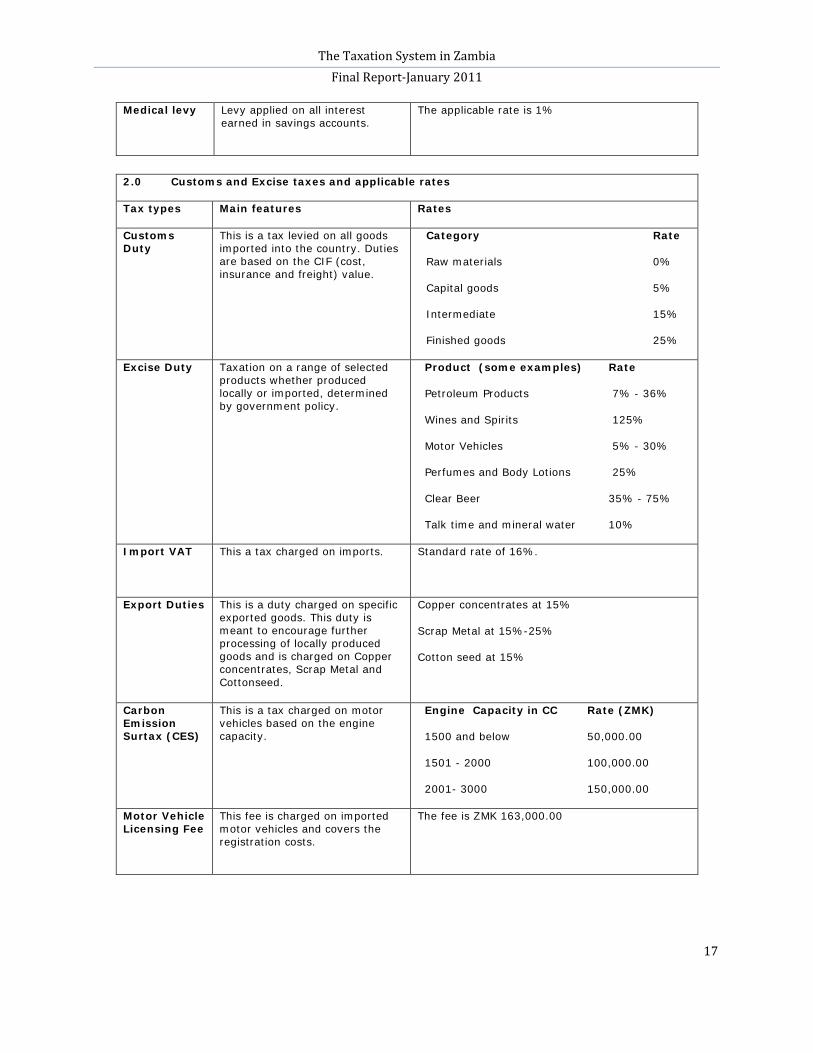
Medical levy
Levy applied on all interest earned in savings accounts.
The applicable rate is 1%
2.0 Customs and Excise taxes and applicable rates
Tax types Main features Rates
Customs Duty
This is a tax levied on all goods imported into the country. Duties are based on the CIF (cost, insurance and freight) value.
Category Rate
Raw materials 0%
Capital goods 5%
Intermediate 15%
Finished goods 25%
Excise Duty Taxation on a range of selected products whether produced locally or imported, determined by government policy.
Product (some examples) Rate
Petroleum Products 7% - 36%
Wines and Spirits 125%
Motor Vehicles 5% - 30%
Perfumes and Body Lotions 25%
Clear Beer 35% - 75%
Talk time and mineral water 10%
Import VAT
This a tax charged on imports.
Standard rate of 16%.
Export Duties This is a duty charged on specific exported goods. This duty is meant to encourage further processing of locally produced goods and is charged on Copper concentrates, Scrap Metal and Cottonseed.
Copper concentrates at 15%
Scrap Metal at 15%-25%
Cotton seed at 15%
Carbon Emission Surtax (CES)
This is a tax charged on motor vehicles based on the engine capacity.
Engine Capacity in CC Rate (ZMK)
1500 and below 50,000.00
1501 - 2000 100,000.00
2001- 3000 150,000.00
Motor Vehicle Licensing Fee
This fee is charged on imported motor vehicles and covers the registration costs.
The fee is ZMK 163,000.00
The Taxation System in Zambia Final Report-January 2011
18
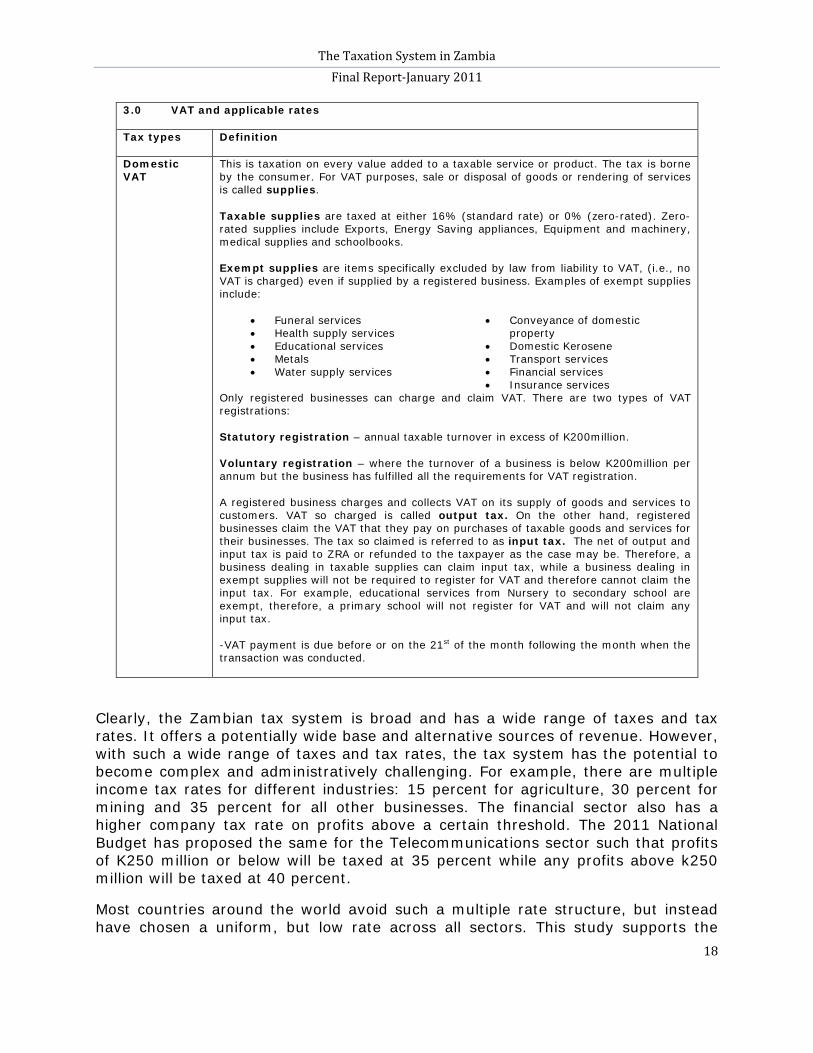
3.0 VAT and applicable rates
Tax types Definition
Domestic VAT
This is taxation on every value added to a taxable service or product. The tax is borne by the consumer. For VAT purposes, sale or disposal of goods or rendering of services is called supplies.
Taxable supplies are taxed at either 16% (standard rate) or 0% (zero-rated). Zero-rated supplies include Exports, Energy Saving appliances, Equipment and machinery, medical supplies and schoolbooks.
Exempt supplies are items specifically excluded by law from liability to VAT, (i.e., no VAT is charged) even if supplied by a registered business. Examples of exempt supplies include:
• Funeral services • Health supply services • Educational services • Metals • Water supply services
• Conveyance of domestic property
• Domestic Kerosene • Transport services • Financial services • Insurance services
Only registered businesses can charge and claim VAT. There are two types of VAT registrations:
Statutory registration – annual taxable turnover in excess of K200million.
Voluntary registration – where the turnover of a business is below K200million per annum but the business has fulfilled all the requirements for VAT registration.
A registered business charges and collects VAT on its supply of goods and services to customers. VAT so charged is called output tax. On the other hand, registered businesses claim the VAT that they pay on purchases of taxable goods and services for their businesses. The tax so claimed is referred to as input tax. The net of output and input tax is paid to ZRA or refunded to the taxpayer as the case may be. Therefore, a business dealing in taxable supplies can claim input tax, while a business dealing in exempt supplies will not be required to register for VAT and therefore cannot claim the input tax. For example, educational services from Nursery to secondary school are exempt, therefore, a primary school will not register for VAT and will not claim any input tax.
-VAT payment is due before or on the 21st
of the month following the month when the transaction was conducted.
Clearly, the Zambian tax system is broad and has a wide range of taxes and tax rates. It offers a potentially wide base and alternative sources of revenue. However, with such a wide range of taxes and tax rates, the tax system has the potential to become complex and administratively challenging. For example, there are multiple income tax rates for different industries: 15 percent for agriculture, 30 percent for mining and 35 percent for all other businesses. The financial sector also has a higher company tax rate on profits above a certain threshold. The 2011 National Budget has proposed the same for the Telecommunications sector such that profits of K250 million or below will be taxed at 35 percent while any profits above k250 million will be taxed at 40 percent.
Most countries around the world avoid such a multiple rate structure, but instead have chosen a uniform, but low rate across all sectors. This study supports the
The Taxation System in Zambia Final Report-January 2011
19
practices in other countries because it supports equity and is administratively efficient21
2.4 THE PROCESS OF FORMULATING TAX POLICIES
. It is also advantageous because firms stop relying on costly rent seeking to win discretionary tax incentives from government. This view point is supported by Alcock. O, (2003) who states that many taxes and rate structures are harmful, as they become determinants for foreign and local businesses and consumers decisions on where to invest or what to consume. This means that investors and consumers have an incentive to tilt investment and consumption respectively, towards sectors that are dimmed tax friendly at the expense of decisions that may have more value addition.
The institution mandated to administer and collect tax revenue in Zambia is ZRA
Key players 22.
The Ministry of Finance and National Planning (MoFNP) is responsible for tax policy formulation. Local councils administer and collect fees or levies. The process of tax reform started in 1992 when Government formed a Tax Policy Task Force to review tax administration and policy following a noticeable deterioration in the tax revenue collection. The main output of this reform was the creation of a quasi-independent ZRA in 1993. Revenue administration prior to the establishment of ZRA was under the Ministry of Finance in two departments: Department of Income Tax and Department of Customs and Excise. The tax policy review process of 1992 also recommended the following: elimination of import licenses; abolishment of such ‘nuisance taxes’ as the education levy and stamp duties; the introduction of VAT to replace Sales tax; a simplified personal income structure (i.e. reduced tax bands); and a simplification of customs procedures.
The tax reform process had a noticeable positive effect on revenue collection almost immediately and by 1995, revenue collection had increased to 18 percent of GDP from 13 percent in 1993. Government reviews tax policy periodically and sometimes it draws mixed feelings in the country. For example, according to Gorter, J (2004), the reforms in 2002, were regressive as they shifted the tax burden from the rich to the poor.
Impact of tax reforms
MoFNP is the lead institution in the process of policy formation. It has created a Tax Policy Review Committee (TPRC), which consists of experts on tax policy and
The policy formulation process
21 It is expected that those who do not support this view point will argue, for example, that a uniform rate would increase tax burden on the agricultural sector and perpetuate poverty for the majority poor resource farmers. A counter argument is the current 15 percent incentive rate on agriculture also benefits the “well off” large commercial farms, who will grow even bigger. This will result in increased inequality between the rich and the poor farmers.
22 Zambia Revenue Authority Act, Chapter 321 of the laws of Zambia
The Taxation System in Zambia Final Report-January 2011
20
administration from Government departments, and ZRA. When formulating national budgets, the TPRC invites non-government actors (individuals, NGOs, business associations and similar organisations) to submit tax proposals and the justification. The TPRC assesses the proposal, mostly in terms of revenue impact and tax administration, and makes recommendations to the Minster of Finance. The Minster of Finance tables the approved budget and tax proposals before cabinet for further debate. After cabinet approval, the budget and proposals are presented to the nation through Parliament. Parliament further debates the national budget and tax proposals and is responsible for final adoption.
Non-government actors are increasingly using the tax policy formulation process to lobby for tax concessions and exemptions, changes in tax administration and the adoption of pro-growth public expenditures in the economy. However, although the process is in place, there is no legal framework that exists to formalise and support the participation of non-state actors in the tax formulation process. As such, Government still uses discretion and favour to consider their inputs. This becomes a potential source of mixed reactions because some measures that are adopted just favour a small section of the community. Further, the process has some intrinsic weaknesses and is still open to political influence, which results in some policy reversals, and introduction of new policy measures long after the budget has been announced and approved by Parliament.
Nevertheless, despite some drawbacks, the current mechanism for soliciting inputs from non-government actors has now become standard practice. As noted by Bwalya et al (2009), the process of tax policy creation in Zambia indicates that non-government actors have utilised state-business relations and the budget formulation processes to lobby both unilaterally and collectively to influence government fiscal policy choices.
2.5 Tax administration and challenges
Overall, there is a lot of internal and external goodwill towards the support for tax policy and administration reforms in Zambia. There are yearly scheduled IMF and World Bank missions to Zambia for the purpose of supporting tax administration. For instance, at the inception of ZRA, the Department for International Development (DFID) provided support in form of infrastructure, information technology and human resource development.
In 2006, with the assistance of the World Bank, Government and ZRA embarked on a tax administration modernisation process where the organisational focus of tax administration was moved from tax-type to taxpayer and resulted in the creation of specialised offices to administer taxes for large taxpayers, medium and small taxpayers. It is expected that the modernisation process will improve business processes, information technology and operational infrastructure as well as harmonise tax legislation.
The Taxation System in Zambia Final Report-January 2011
21
Like any revenue authority in a developing country, ZRA is beset by a large array of challenges. Solving these has implications for the performance of the whole tax system. The common challenges are discussed below
Challenges faced by the Tax Authority
23
:
(a) Taxation of the informal sector
As the economy grows, the informal sector also grows. Although ZRA has in place specific taxes targeted at the informal sector many potential taxpayers still remain outside the tax net. (b) Taxpayer compliance
Compliance among small taxpayers is low because some taxpayers still find keeping books of accounts challenging and this adversely influences the collection of taxes. To some extent, this is an inevitable consequence of the lack of funds for proper accountants in small businesses coupled with possibly low levels of tax literacy.
(c) Taxation of international transactions
Taxation of cross-border business transactions is another challenge that the tax system has to address as the economy grows. This involves difficulties associated with auditing of international transactions of multinational companies (i.e. transfer pricing), taxation of new or non-traditional goods and services and electronic commercial transactions. (d) Tax regimes harmonization Although the tax design will continue to be largely dictated by domestic considerations, there are challenges associated with activities that happen across the borders and in other countries. For example, increased cross-border activity means the domestic tax system can no longer be designed without regard to tax systems of other countries. (e) Smuggling and tax evasion
Zambia’s borders are huge and porous and therefore smuggling of goods across the borders continued to be a big challenge. The domestic revenue base continues to be undermined by tax evasion tendencies such as non-issuance of VAT invoices by most traders. This situation is exacerbated by the existence of a huge cash economy, which makes it difficult to maintain an accurate audit trail.
23 ZRA Annual Reports, 2005 to 2009
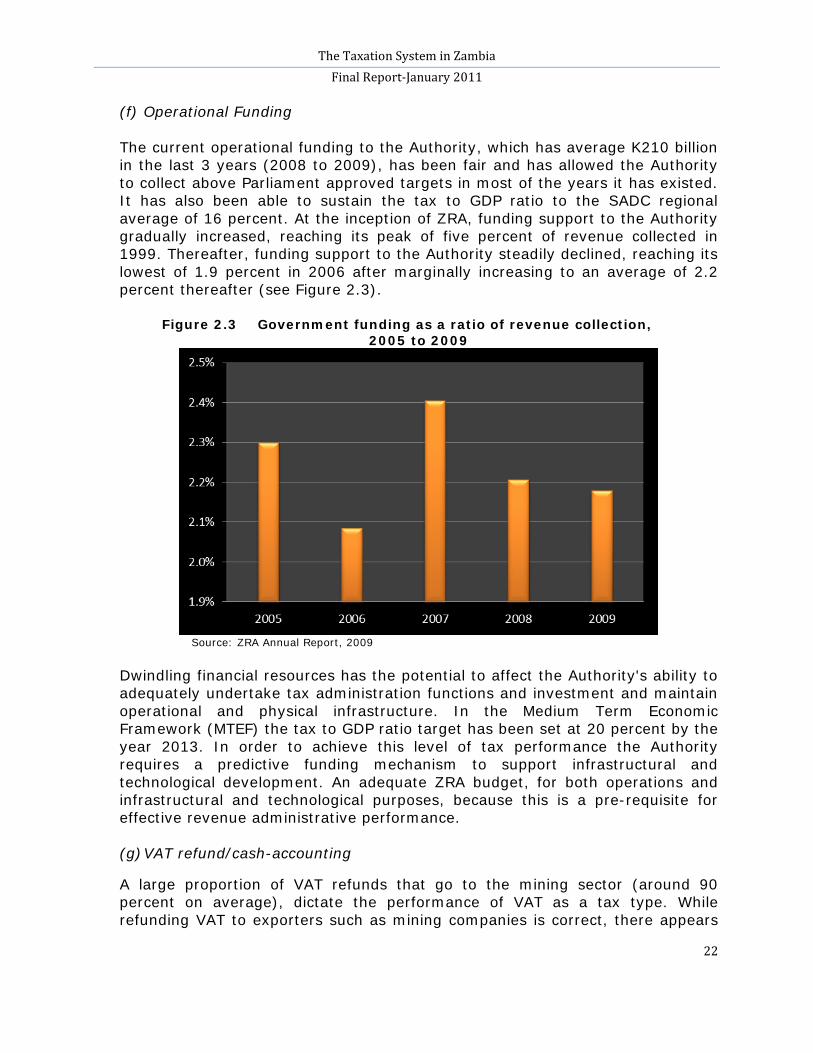
The Taxation System in Zambia Final Report-January 2011
22
(f) Operational Funding
The current operational funding to the Authority, which has average K210 billion in the last 3 years (2008 to 2009), has been fair and has allowed the Authority to collect above Parliament approved targets in most of the years it has existed. It has also been able to sustain the tax to GDP ratio to the SADC regional average of 16 percent. At the inception of ZRA, funding support to the Authority gradually increased, reaching its peak of five percent of revenue collected in 1999. Thereafter, funding support to the Authority steadily declined, reaching its lowest of 1.9 percent in 2006 after marginally increasing to an average of 2.2 percent thereafter (see Figure 2.3).
Figure 2.3 Government funding as a ratio of revenue collection, 2005 to 2009
Source: ZRA Annual Report, 2009
Dwindling financial resources has the potential to affect the Authority's ability to adequately undertake tax administration functions and investment and maintain operational and physical infrastructure. In the Medium Term Economic Framework (MTEF) the tax to GDP ratio target has been set at 20 percent by the year 2013. In order to achieve this level of tax performance the Authority requires a predictive funding mechanism to support infrastructural and technological development. An adequate ZRA budget, for both operations and infrastructural and technological purposes, because this is a pre-requisite for effective revenue administrative performance.
(g) VAT refund/cash-accounting
A large proportion of VAT refunds that go to the mining sector (around 90 percent on average), dictate the performance of VAT as a tax type. While refunding VAT to exporters such as mining companies is correct, there appears
The Taxation System in Zambia Final Report-January 2011
23
to be large channels through which firms supplying the mines may be avoiding their tax obligations. The VAT refund system needs to be studied to ensure that it is not being abused.
2.5 RECOMMENDATIONS
1. In order to relieve some pressure on the tax system, Government must leverage other forms of development funding. Government must explore and create conducive policies on alternative sources of funding so that they supplement the domestic tax revenue base sustainably. This includes policies on FDIs, debt contraction and use, and inflow of remittances. A stable and predictable investment policy climate (fiscal and monetary) can guarantee reasonable and steady flow of FDIs. The role of Government is to ensure that the kind of FDIs that flow into the country are productive and yield positive results in terms of improving the welfare of citizens and reducing poverty, for example, through employment creation and value addition. Debt management must be prudent so that debt traps are avoided and that funds obtained through debt are used on productive expenditures. This requires Government to take steps towards providing a legislative environment to ensure transparency and accountability in the sourcing and use of debt. Remittances as a source of revenue for government must be explored further by developing appropriate data capture, monitoring and financial systems that can quantify its contribution to social and economic development.
2. Explore revenue potentials of the local councils. The study recommends that the revenue potentials of councils be exploited further by adopting appropriate policy and institutional changes that will enable councils to increase their revenue sources and effectively and efficiently collect local revenues. This includes re-empowering councils to enable them have the power and authority to collect from markets and bus stations, which currently have political stakeholders playing a major part. In communities were crop and livestock levies are affordable, such as predominately commercial farmer communities, the councils may be allowed to impose the crop levies. However, the level of the levy must be reached in consultation with the farmers.
3. Enhance wealth taxation to improve the tax base. The study recommends that some taxes that reflect wealth be introduced or enhanced. This can be done by taxing capital gains.
4. Continue strong support of the tax authority. Government must commission a study to assess the optimal support to ZRA.
5. Review funding of ZRA. There is need to support the operations of ZRA by providing it with adequate funding which must be predictable and enable it to have adequate staff and operational infrastructure.
The Taxation System in Zambia Final Report-January 2011
24
6. Create an effective system of taxpayer services and education. The Zambian tax system has many taxes, many rates and is quite complex. It also has a stiff penalty regime and many taxpayer obligations. This increases the cost of complying with the regime, and encourages tax evasion. In this regard, the tax system must develop or enhance an effective system of taxpayer services and education that will effectively communicate and educate taxpayers about their tax obligations and associated penalties. This will increase voluntary compliance and minimise cases of negligence, wilful default and fraud in the tax system. Other factors that make the tax system complex are tax incentives, which are discussed later in this study. If the structure of tax exemptions and reductions is very complicated and difficult to interpret, it may lead to a low level of tax compliance by taxpayers.
7. Make the policy formulation more inclusive, formal and transparent. The tax policy formulation is inclusive but should be enhanced further. To avoid the Government using discretion and favour when considering input from other stakeholders, the tax formulation process must create a legal and binding structure that should formalise the participation of non-government actors in the national budget process. This will allow a greater breadth of ideas to enter into tax policy, while crowding out discretionary policies from government that may not be entirely welfare enhancing.24
24 Bwalya, et al, 2009
The Taxation System in Zambia Final Report-January 2011
25
PART 3 THE STRUCTURE AND PERFORMANCE OF THE TAX SYSTEM
3.1 INTRODUCTION
Part 3 first discusses the structure of the Zambian tax system and later the broad elements that are commonly used to evaluate the performance of the tax system. These are: adequacy of the revenue system in terms of meeting set targets; contribution to the national budget; revenue productivity; efficiency; and fairness.
3.2 STRUCTURE OF TAXES IN ZAMBIA Studying the structure of the tax system helps explain the sources of revenue and how these affect sustainability and equity. It states the relative importance of the different tax types and the role they play in raising revenue. The structure of the tax system influences the decisions on what tax instruments to use. Further, the structure indirectly gives an indication of the capacity of the revenue authority.
Summary of key points
• The prominent taxes in Zambia are income taxes followed by consumption taxes. Within income taxes, PAYE is the most prominent.
• The proportion of consumption taxes in the structure have fallen lately
and there is need to reverse this trend.
• Meanwhile, the Zambian tax system has performed well in terms of meeting set targets, contributing to the national budget and responding to economic growth.
• However, the tax system has become less responsive and productive.
• In particular, there is an evident fall in the performance of VAT and there
is a need to reverse the declining trend.
• There should be greater investment in VAT administration processes and a major review of exemptions to review their cost effectiveness and impact on the VAT tax base.
• The tax system is not fair, and places a high burden on the few middle to high–class in the formal sector and a few economic sectors.
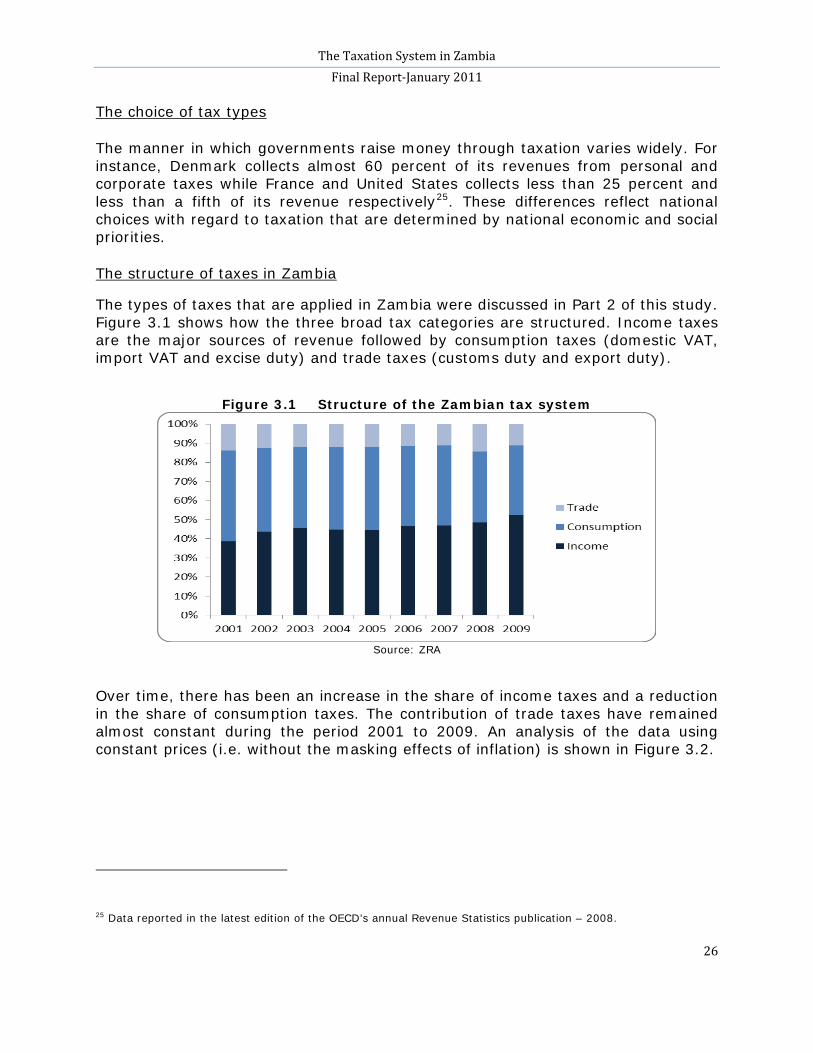
The Taxation System in Zambia Final Report-January 2011
26
The manner in which governments raise money through taxation varies widely. For instance, Denmark collects almost 60 percent of its revenues from personal and corporate taxes while France and United States collects less than 25 percent and less than a fifth of its revenue respectively
The choice of tax types
25. These differences reflect national choices with regard to taxation that are determined by national economic and social priorities.
The types of taxes that are applied in Zambia were discussed in Part 2 of this study. Figure 3.1 shows how the three broad tax categories are structured. Income taxes are the major sources of revenue followed by consumption taxes (domestic VAT, import VAT and excise duty) and trade taxes (customs duty and export duty).
The structure of taxes in Zambia
Figure 3.1 Structure of the Zambian tax system
Source: ZRA
Over time, there has been an increase in the share of income taxes and a reduction in the share of consumption taxes. The contribution of trade taxes have remained almost constant during the period 2001 to 2009. An analysis of the data using constant prices (i.e. without the masking effects of inflation) is shown in Figure 3.2.
25 Data reported in the latest edition of the OECD’s annual Revenue Statistics publication – 2008.
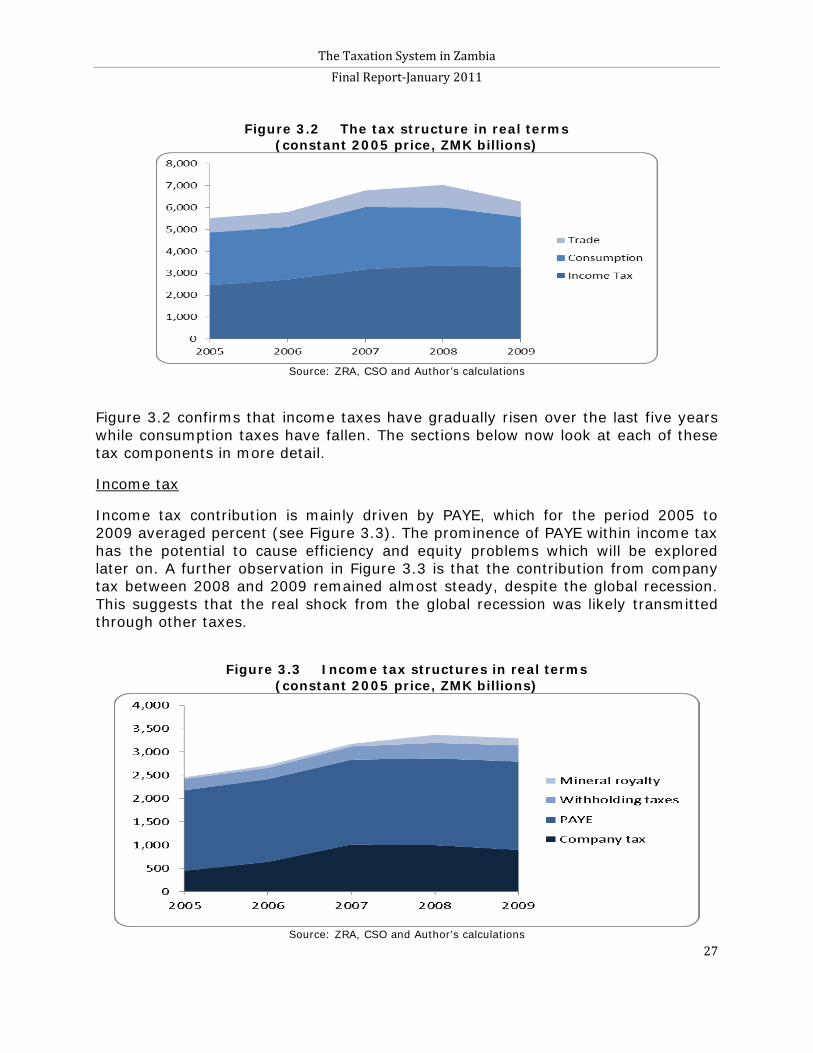
The Taxation System in Zambia Final Report-January 2011
27
Figure 3.2 The tax structure in real terms
(constant 2005 price, ZMK billions)
Source: ZRA, CSO and Author’s calculations
Figure 3.2 confirms that income taxes have gradually risen over the last five years while consumption taxes have fallen. The sections below now look at each of these tax components in more detail.
Income tax contribution is mainly driven by PAYE, which for the period 2005 to 2009 averaged percent (see Figure 3.3). The prominence of PAYE within income tax has the potential to cause efficiency and equity problems which will be explored later on. A further observation in Figure 3.3 is that the contribution from company tax between 2008 and 2009 remained almost steady, despite the global recession. This suggests that the real shock from the global recession was likely transmitted through other taxes.
Income tax
Figure 3.3 Income tax structures in real terms
(constant 2005 price, ZMK billions)
Source: ZRA, CSO and Author’s calculations
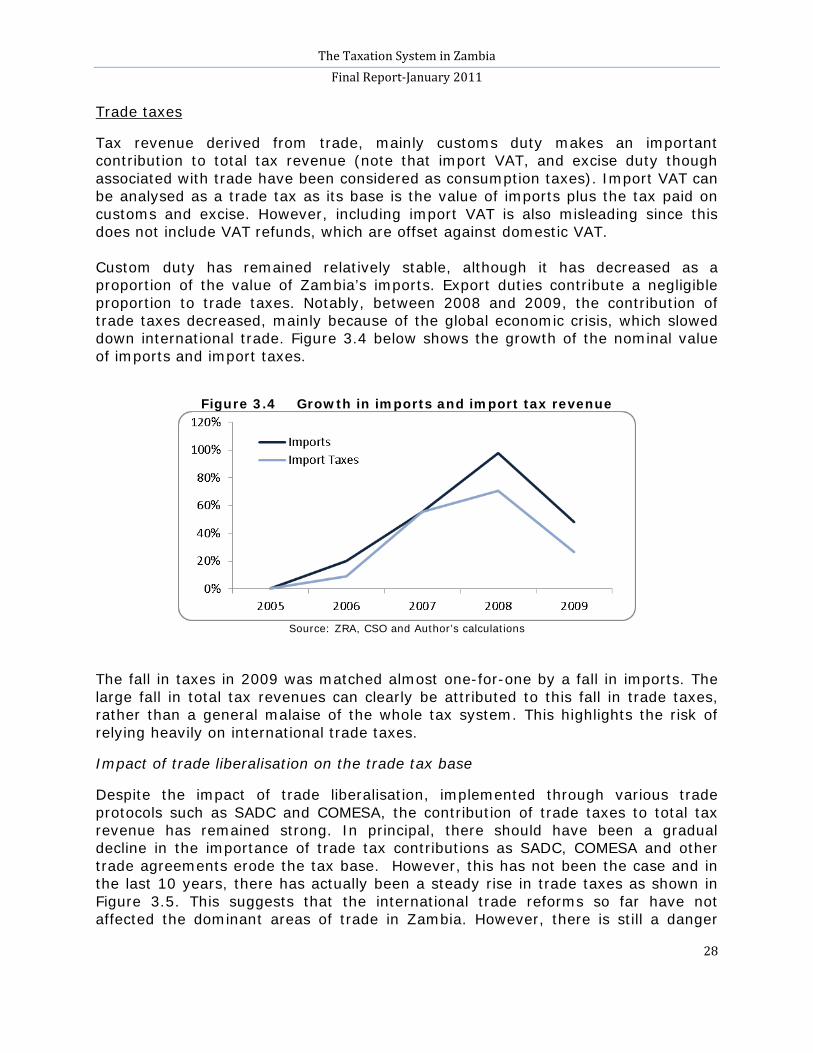
The Taxation System in Zambia Final Report-January 2011
28
Tax revenue derived from trade, mainly customs duty makes an important contribution to total tax revenue (note that import VAT, and excise duty though associated with trade have been considered as consumption taxes). Import VAT can be analysed as a trade tax as its base is the value of imports plus the tax paid on customs and excise. However, including import VAT is also misleading since this does not include VAT refunds, which are offset against domestic VAT.
Trade taxes
Custom duty has remained relatively stable, although it has decreased as a proportion of the value of Zambia’s imports. Export duties contribute a negligible proportion to trade taxes. Notably, between 2008 and 2009, the contribution of trade taxes decreased, mainly because of the global economic crisis, which slowed down international trade. Figure 3.4 below shows the growth of the nominal value of imports and import taxes.
Figure 3.4 Growth in imports and import tax revenue
Source: ZRA, CSO and Author’s calculations
The fall in taxes in 2009 was matched almost one-for-one by a fall in imports. The large fall in total tax revenues can clearly be attributed to this fall in trade taxes, rather than a general malaise of the whole tax system. This highlights the risk of relying heavily on international trade taxes.
Impact of trade liberalisation on the trade tax base
Despite the impact of trade liberalisation, implemented through various trade protocols such as SADC and COMESA, the contribution of trade taxes to total tax revenue has remained strong. In principal, there should have been a gradual decline in the importance of trade tax contributions as SADC, COMESA and other trade agreements erode the tax base. However, this has not been the case and in the last 10 years, there has actually been a steady rise in trade taxes as shown in Figure 3.5. This suggests that the international trade reforms so far have not affected the dominant areas of trade in Zambia. However, there is still a danger
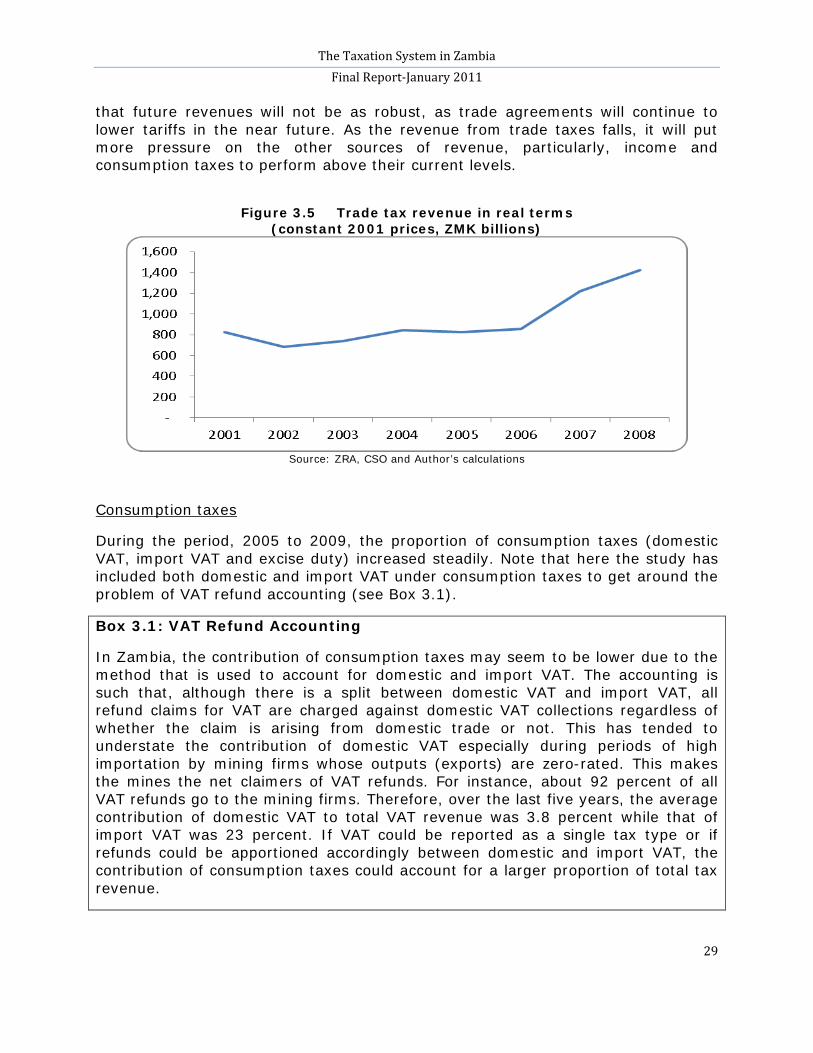
The Taxation System in Zambia Final Report-January 2011
29
that future revenues will not be as robust, as trade agreements will continue to lower tariffs in the near future. As the revenue from trade taxes falls, it will put more pressure on the other sources of revenue, particularly, income and consumption taxes to perform above their current levels.
Figure 3.5 Trade tax revenue in real terms
(constant 2001 prices, ZMK billions)
Source: ZRA, CSO and Author’s calculations
During the period, 2005 to 2009, the proportion of consumption taxes (domestic VAT, import VAT and excise duty) increased steadily. Note that here the study has included both domestic and import VAT under consumption taxes to get around the problem of VAT refund accounting (see Box 3.1).
Consumption taxes
Box 3.1: VAT Refund Accounting
In Zambia, the contribution of consumption taxes may seem to be lower due to the method that is used to account for domestic and import VAT. The accounting is such that, although there is a split between domestic VAT and import VAT, all refund claims for VAT are charged against domestic VAT collections regardless of whether the claim is arising from domestic trade or not. This has tended to understate the contribution of domestic VAT especially during periods of high importation by mining firms whose outputs (exports) are zero-rated. This makes the mines the net claimers of VAT refunds. For instance, about 92 percent of all VAT refunds go to the mining firms. Therefore, over the last five years, the average contribution of domestic VAT to total VAT revenue was 3.8 percent while that of import VAT was 23 percent. If VAT could be reported as a single tax type or if refunds could be apportioned accordingly between domestic and import VAT, the contribution of consumption taxes could account for a larger proportion of total tax revenue.
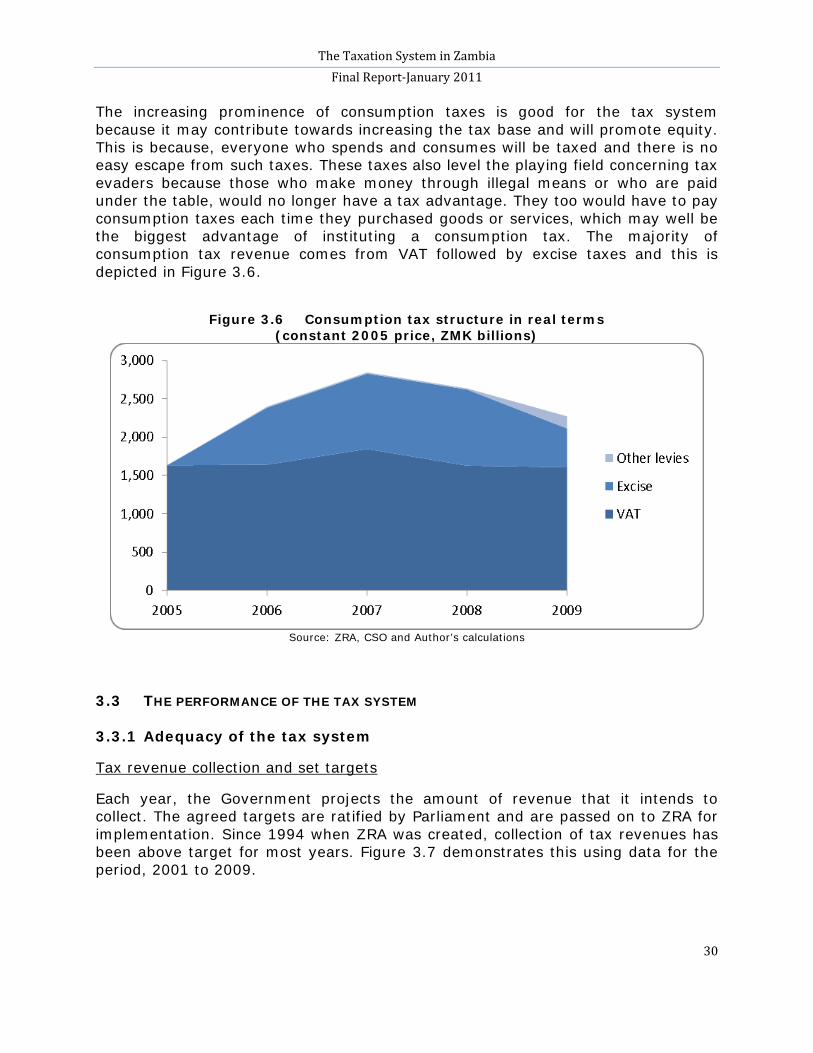
The Taxation System in Zambia Final Report-January 2011
30
The increasing prominence of consumption taxes is good for the tax system because it may contribute towards increasing the tax base and will promote equity. This is because, everyone who spends and consumes will be taxed and there is no easy escape from such taxes. These taxes also level the playing field concerning tax evaders because those who make money through illegal means or who are paid under the table, would no longer have a tax advantage. They too would have to pay consumption taxes each time they purchased goods or services, which may well be the biggest advantage of instituting a consumption tax. The majority of consumption tax revenue comes from VAT followed by excise taxes and this is depicted in Figure 3.6.
Figure 3.6 Consumption tax structure in real terms
(constant 2005 price, ZMK billions)
Source: ZRA, CSO and Author’s calculations
3.3 THE PERFORMANCE OF THE TAX SYSTEM 3.3.1 Adequacy of the tax system
Each year, the Government projects the amount of revenue that it intends to collect. The agreed targets are ratified by Parliament and are passed on to ZRA for implementation. Since 1994 when ZRA was created, collection of tax revenues has been above target for most years. Figure 3.7 demonstrates this using data for the period, 2001 to 2009.
Tax revenue collection and set targets
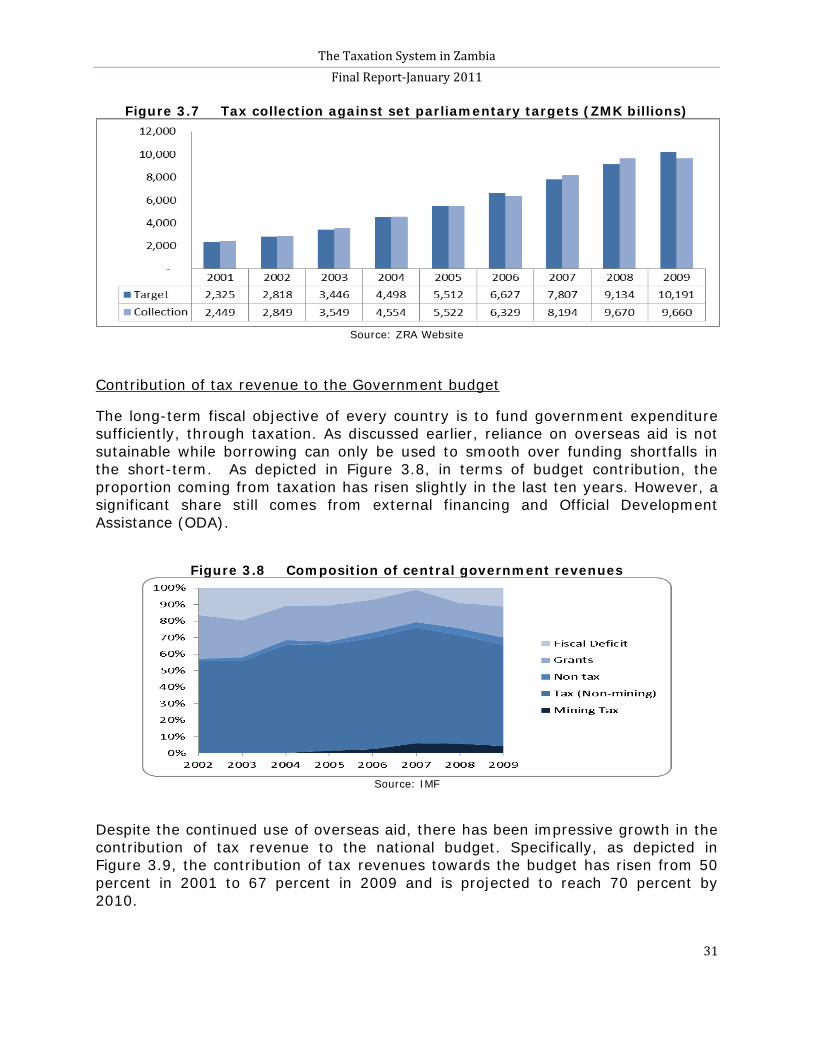
The Taxation System in Zambia Final Report-January 2011
31
Figure 3.7 Tax collection against set parliamentary targets (ZMK billions)
Source: ZRA Website
The long-term fiscal objective of every country is to fund government expenditure sufficiently, through taxation. As discussed earlier, reliance on overseas aid is not sutainable while borrowing can only be used to smooth over funding shortfalls in the short-term. As depicted in Figure 3.8, in terms of budget contribution, the proportion coming from taxation has risen slightly in the last ten years. However, a significant share still comes from external financing and Official Development Assistance (ODA).
Contribution of tax revenue to the Government budget
Figure 3.8 Composition of central government revenues
Source: IMF
Despite the continued use of overseas aid, there has been impressive growth in the contribution of tax revenue to the national budget. Specifically, as depicted in Figure 3.9, the contribution of tax revenues towards the budget has risen from 50 percent in 2001 to 67 percent in 2009 and is projected to reach 70 percent by 2010.
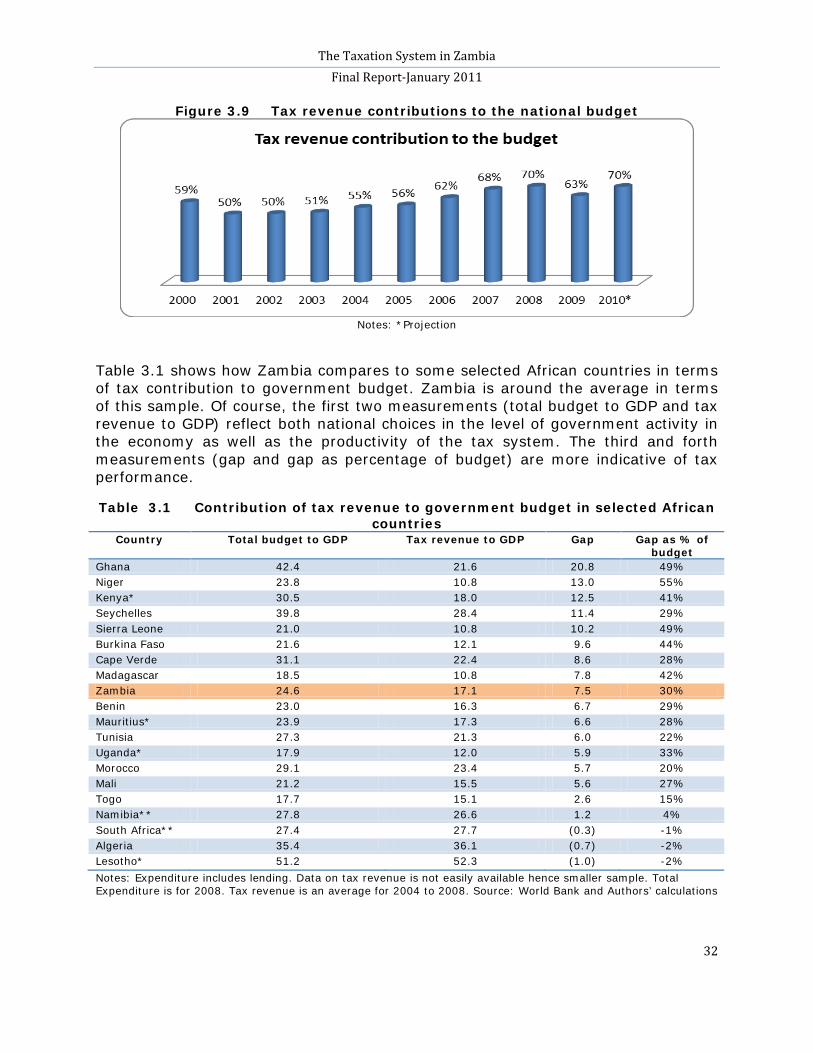
The Taxation System in Zambia Final Report-January 2011
32
Figure 3.9 Tax revenue contributions to the national budget
Notes: *Projection
Table 3.1 shows how Zambia compares to some selected African countries in terms of tax contribution to government budget. Zambia is around the average in terms of this sample. Of course, the first two measurements (total budget to GDP and tax revenue to GDP) reflect both national choices in the level of government activity in the economy as well as the productivity of the tax system. The third and forth measurements (gap and gap as percentage of budget) are more indicative of tax performance.
Table 3.1 Contribution of tax revenue to government budget in selected African countries
Country Total budget to GDP Tax revenue to GDP Gap Gap as % of budget
Ghana 42.4 21.6 20.8 49% Niger 23.8 10.8 13.0 55% Kenya* 30.5 18.0 12.5 41% Seychelles 39.8 28.4 11.4 29% Sierra Leone 21.0 10.8 10.2 49% Burkina Faso 21.6 12.1 9.6 44% Cape Verde 31.1 22.4 8.6 28% Madagascar 18.5 10.8 7.8 42% Zambia 24.6 17.1 7.5 30% Benin 23.0 16.3 6.7 29% Mauritius* 23.9 17.3 6.6 28% Tunisia 27.3 21.3 6.0 22% Uganda* 17.9 12.0 5.9 33% Morocco 29.1 23.4 5.7 20% Mali 21.2 15.5 5.6 27% Togo 17.7 15.1 2.6 15% Namibia** 27.8 26.6 1.2 4% South Africa** 27.4 27.7 (0.3) -1% Algeria 35.4 36.1 (0.7) -2% Lesotho* 51.2 52.3 (1.0) -2% Notes: Expenditure includes lending. Data on tax revenue is not easily available hence smaller sample. Total Expenditure is for 2008. Tax revenue is an average for 2004 to 2008. Source: World Bank and Authors’ calculations
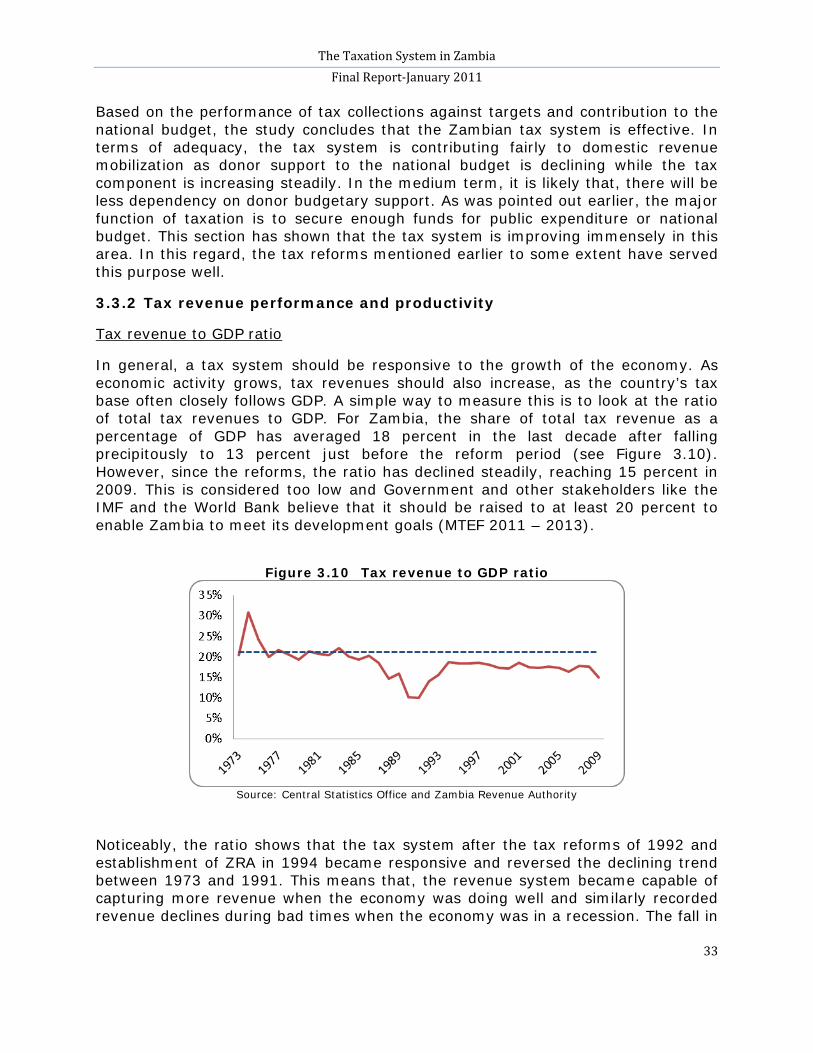
The Taxation System in Zambia Final Report-January 2011
33
Based on the performance of tax collections against targets and contribution to the national budget, the study concludes that the Zambian tax system is effective. In terms of adequacy, the tax system is contributing fairly to domestic revenue mobilization as donor support to the national budget is declining while the tax component is increasing steadily. In the medium term, it is likely that, there will be less dependency on donor budgetary support. As was pointed out earlier, the major function of taxation is to secure enough funds for public expenditure or national budget. This section has shown that the tax system is improving immensely in this area. In this regard, the tax reforms mentioned earlier to some extent have served this purpose well.
3.3.2 Tax revenue performance and productivity
In general, a tax system should be responsive to the growth of the economy. As economic activity grows, tax revenues should also increase, as the country’s tax base often closely follows GDP. A simple way to measure this is to look at the ratio of total tax revenues to GDP. For Zambia, the share of total tax revenue as a percentage of GDP has averaged 18 percent in the last decade after falling precipitously to 13 percent just before the reform period (see Figure 3.10). However, since the reforms, the ratio has declined steadily, reaching 15 percent in 2009. This is considered too low and Government and other stakeholders like the IMF and the World Bank believe that it should be raised to at least 20 percent to enable Zambia to meet its development goals (MTEF 2011 – 2013).
Tax revenue to GDP ratio
Figure 3.10 Tax revenue to GDP ratio
Source: Central Statistics Office and Zambia Revenue Authority
Noticeably, the ratio shows that the tax system after the tax reforms of 1992 and establishment of ZRA in 1994 became responsive and reversed the declining trend between 1973 and 1991. This means that, the revenue system became capable of capturing more revenue when the economy was doing well and similarly recorded revenue declines during bad times when the economy was in a recession. The fall in
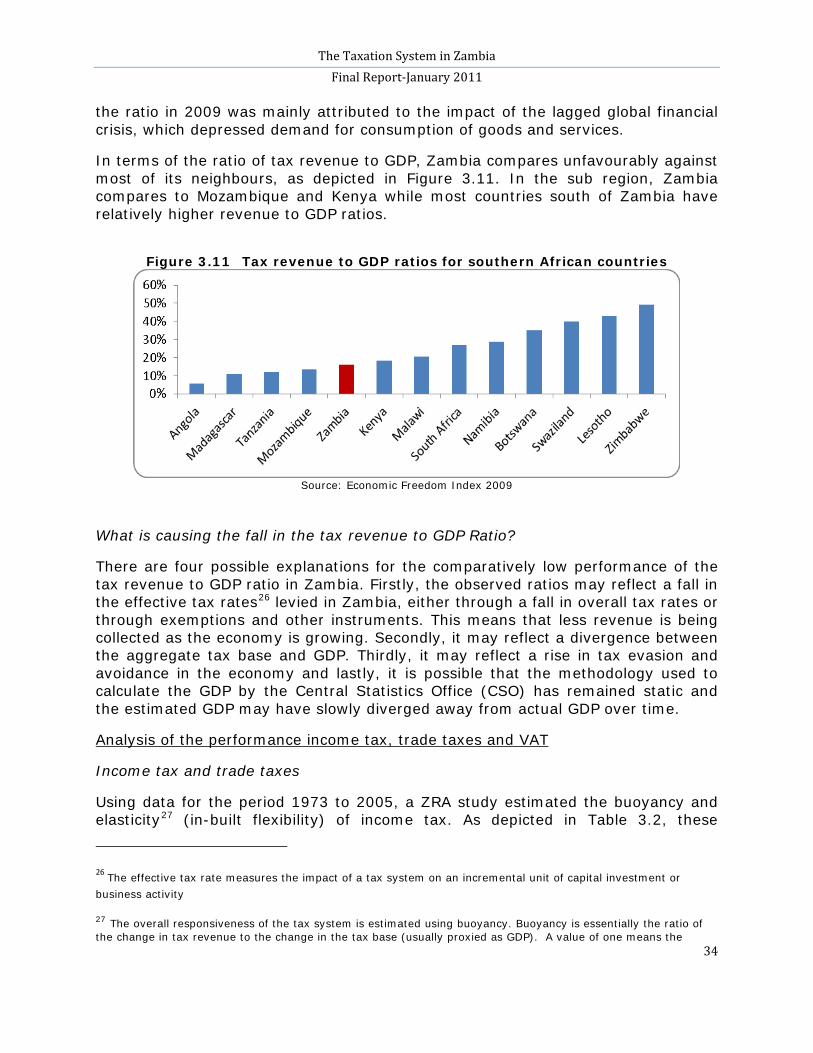
The Taxation System in Zambia Final Report-January 2011
34
the ratio in 2009 was mainly attributed to the impact of the lagged global financial crisis, which depressed demand for consumption of goods and services.
In terms of the ratio of tax revenue to GDP, Zambia compares unfavourably against most of its neighbours, as depicted in Figure 3.11. In the sub region, Zambia compares to Mozambique and Kenya while most countries south of Zambia have relatively higher revenue to GDP ratios.
Figure 3.11 Tax revenue to GDP ratios for southern African countries
Source: Economic Freedom Index 2009
What is causing the fall in the tax revenue to GDP Ratio?
There are four possible explanations for the comparatively low performance of the tax revenue to GDP ratio in Zambia. Firstly, the observed ratios may reflect a fall in the effective tax rates26 levied in Zambia, either through a fall in overall tax rates or through exemptions and other instruments. This means that less revenue is being collected as the economy is growing. Secondly, it may reflect a divergence between the aggregate tax base and GDP. Thirdly, it may reflect a rise in tax evasion and avoidance in the economy and lastly, it is possible that the methodology used to calculate the GDP by the Central Statistics Office (CSO) has remained static and the estimated GDP may have slowly diverged away from actual GDP over time.
Income tax and trade taxes
Analysis of the performance income tax, trade taxes and VAT
Using data for the period 1973 to 2005, a ZRA study estimated the buoyancy and elasticity27
26 The effective tax rate measures the impact of a tax system on an incremental unit of capital investment or business activity
(in-built flexibility) of income tax. As depicted in Table 3.2, these
27 The overall responsiveness of the tax system is estimated using buoyancy. Buoyancy is essentially the ratio of the change in tax revenue to the change in the tax base (usually proxied as GDP). A value of one means the
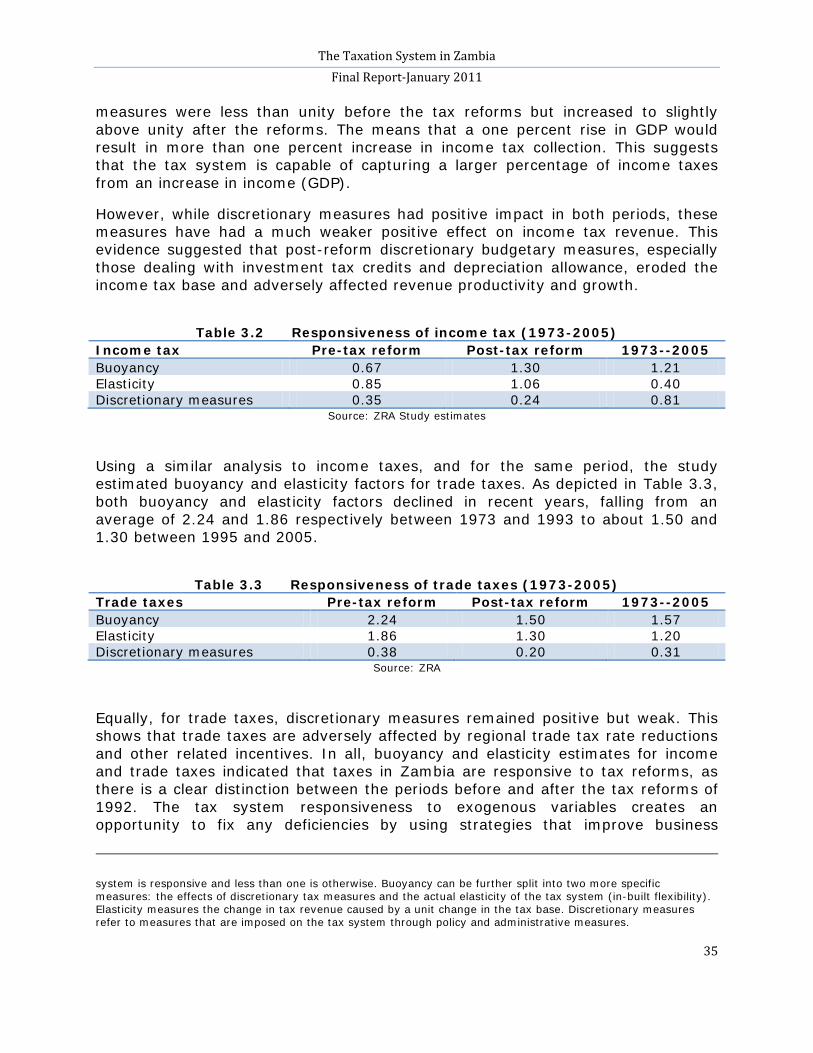
The Taxation System in Zambia Final Report-January 2011
35
measures were less than unity before the tax reforms but increased to slightly above unity after the reforms. The means that a one percent rise in GDP would result in more than one percent increase in income tax collection. This suggests that the tax system is capable of capturing a larger percentage of income taxes from an increase in income (GDP).
However, while discretionary measures had positive impact in both periods, these measures have had a much weaker positive effect on income tax revenue. This evidence suggested that post-reform discretionary budgetary measures, especially those dealing with investment tax credits and depreciation allowance, eroded the income tax base and adversely affected revenue productivity and growth.
Table 3.2 Responsiveness of income tax (1973-2005)
Income tax Pre-tax reform Post-tax reform 1973--2005 Buoyancy 0.67 1.30 1.21 Elasticity 0.85 1.06 0.40 Discretionary measures 0.35 0.24 0.81
Source: ZRA Study estimates Using a similar analysis to income taxes, and for the same period, the study estimated buoyancy and elasticity factors for trade taxes. As depicted in Table 3.3, both buoyancy and elasticity factors declined in recent years, falling from an average of 2.24 and 1.86 respectively between 1973 and 1993 to about 1.50 and 1.30 between 1995 and 2005.
Table 3.3 Responsiveness of trade taxes (1973-2005)
Trade taxes Pre-tax reform Post-tax reform 1973--2005 Buoyancy 2.24 1.50 1.57 Elasticity 1.86 1.30 1.20 Discretionary measures 0.38 0.20 0.31
Source: ZRA Equally, for trade taxes, discretionary measures remained positive but weak. This shows that trade taxes are adversely affected by regional trade tax rate reductions and other related incentives. In all, buoyancy and elasticity estimates for income and trade taxes indicated that taxes in Zambia are responsive to tax reforms, as there is a clear distinction between the periods before and after the tax reforms of 1992. The tax system responsiveness to exogenous variables creates an opportunity to fix any deficiencies by using strategies that improve business
system is responsive and less than one is otherwise. Buoyancy can be further split into two more specific measures: the effects of discretionary tax measures and the actual elasticity of the tax system (in-built flexibility). Elasticity measures the change in tax revenue caused by a unit change in the tax base. Discretionary measures refer to measures that are imposed on the tax system through policy and administrative measures.
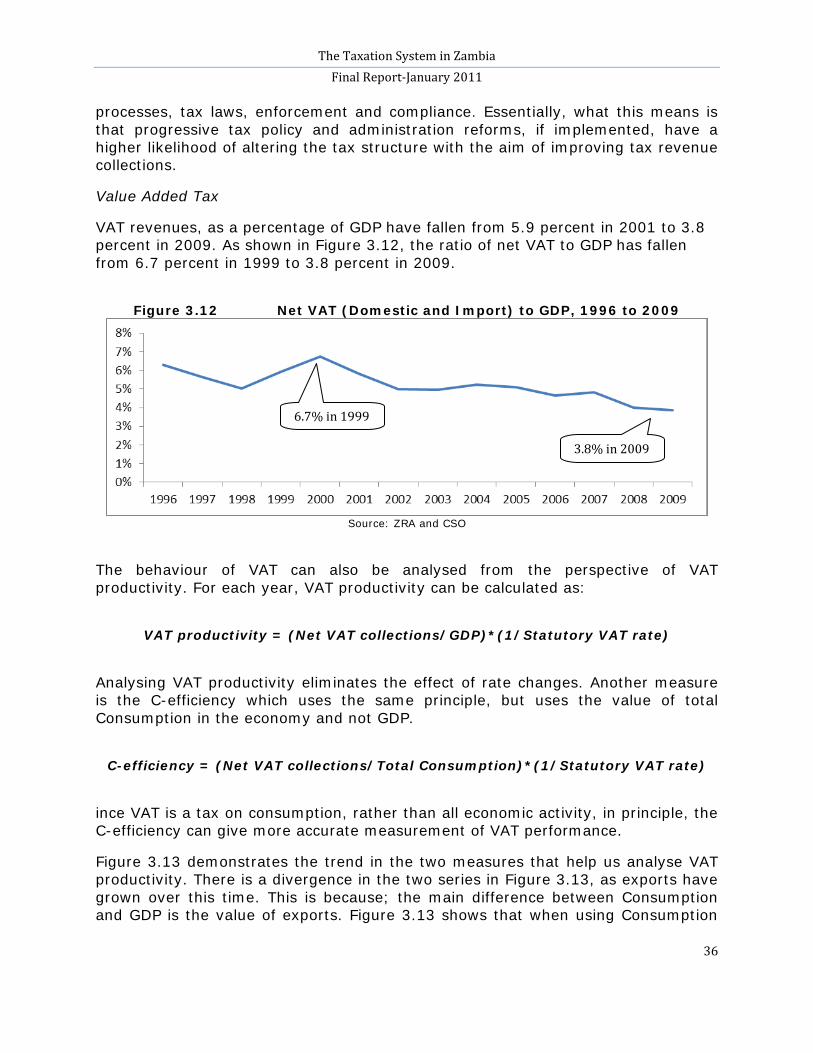
The Taxation System in Zambia Final Report-January 2011
36
processes, tax laws, enforcement and compliance. Essentially, what this means is that progressive tax policy and administration reforms, if implemented, have a higher likelihood of altering the tax structure with the aim of improving tax revenue collections.
Value Added Tax
VAT revenues, as a percentage of GDP have fallen from 5.9 percent in 2001 to 3.8 percent in 2009. As shown in Figure 3.12, the ratio of net VAT to GDP has fallen from 6.7 percent in 1999 to 3.8 percent in 2009.
Figure 3.12 Net VAT (Domestic and Import) to GDP, 1996 to 2009
Source: ZRA and CSO
The behaviour of VAT can also be analysed from the perspective of VAT productivity. For each year, VAT productivity can be calculated as:
VAT productivity = (Net VAT collections/GDP)*(1/Statutory VAT rate)
Analysing VAT productivity eliminates the effect of rate changes. Another measure is the C-efficiency which uses the same principle, but uses the value of total Consumption in the economy and not GDP.
C-efficiency = (Net VAT collections/Total Consumption)*(1/Statutory VAT rate)
ince VAT is a tax on consumption, rather than all economic activity, in principle, the C-efficiency can give more accurate measurement of VAT performance.
Figure 3.13 demonstrates the trend in the two measures that help us analyse VAT productivity. There is a divergence in the two series in Figure 3.13, as exports have grown over this time. This is because; the main difference between Consumption and GDP is the value of exports. Figure 3.13 shows that when using Consumption
6.7% in 1999
3.8% in 2009
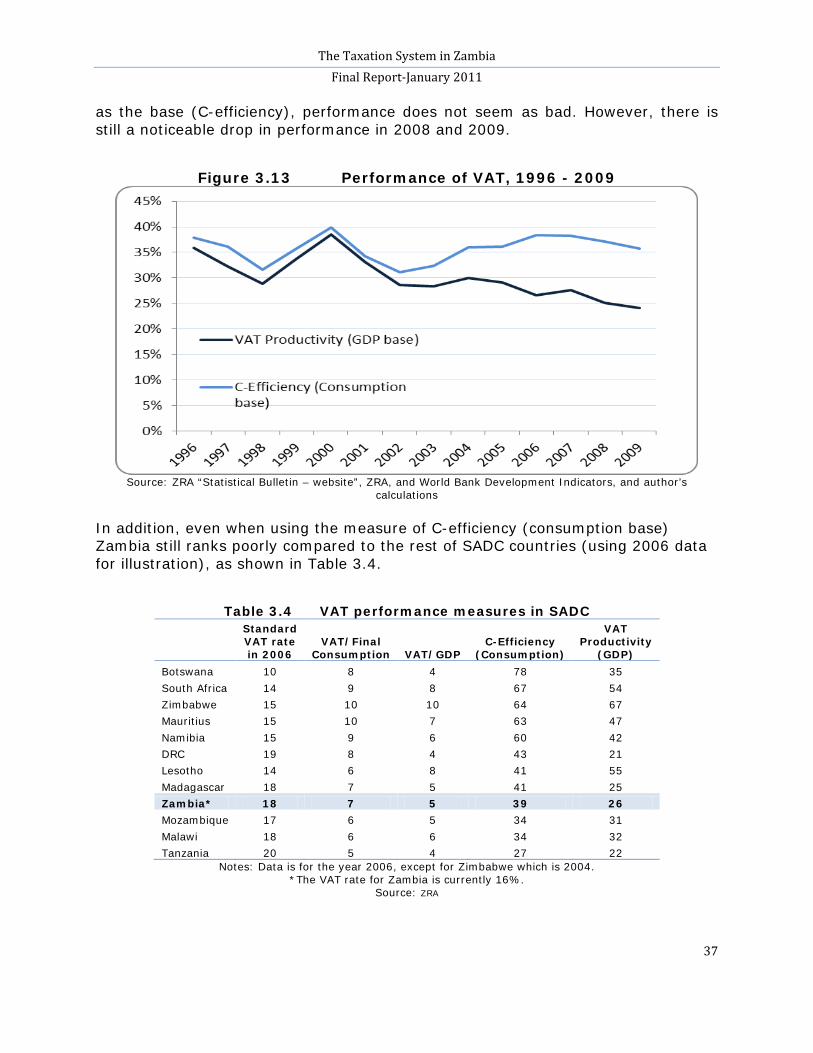
The Taxation System in Zambia Final Report-January 2011
37
as the base (C-efficiency), performance does not seem as bad. However, there is still a noticeable drop in performance in 2008 and 2009.
Figure 3.13 Performance of VAT, 1996 - 2009
Source: ZRA “Statistical Bulletin – website”, ZRA, and World Bank Development Indicators, and author’s
calculations In addition, even when using the measure of C-efficiency (consumption base) Zambia still ranks poorly compared to the rest of SADC countries (using 2006 data for illustration), as shown in Table 3.4.
Table 3.4 VAT performance measures in SADC
Standard VAT rate in 2006
VAT/Final Consumption VAT/GDP
C-Efficiency (Consumption)
VAT Productivity
(GDP) Botswana 10 8 4 78 35 South Africa 14 9 8 67 54 Zimbabwe 15 10 10 64 67 Mauritius 15 10 7 63 47 Namibia 15 9 6 60 42 DRC 19 8 4 43 21 Lesotho 14 6 8 41 55 Madagascar 18 7 5 41 25 Zambia* 18 7 5 39 26 Mozambique 17 6 5 34 31 Malawi 18 6 6 34 32 Tanzania 20 5 4 27 22
Notes: Data is for the year 2006, except for Zimbabwe which is 2004. *The VAT rate for Zambia is currently 16%.
Source:
ZRA
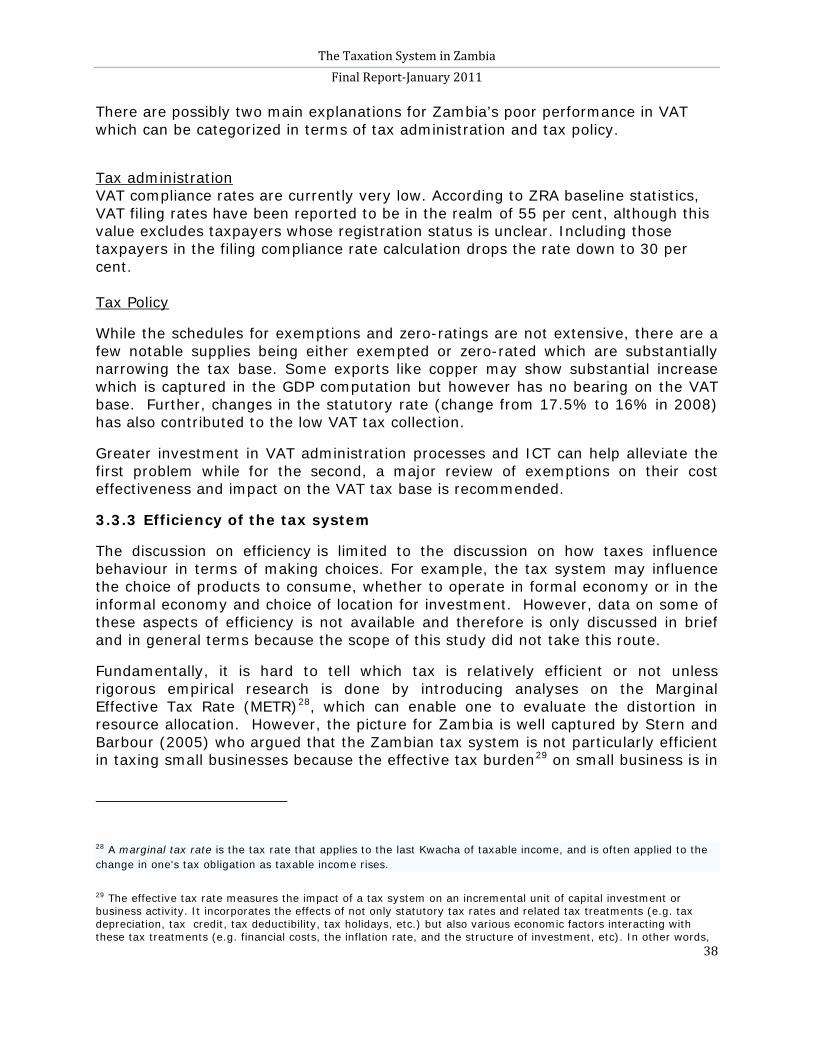
The Taxation System in Zambia Final Report-January 2011
38
There are possibly two main explanations for Zambia’s poor performance in VAT which can be categorized in terms of tax administration and tax policy.
Tax administrationVAT compliance rates are currently very low. According to ZRA baseline statistics, VAT filing rates have been reported to be in the realm of 55 per cent, although this value excludes taxpayers whose registration status is unclear. Including those taxpayers in the filing compliance rate calculation drops the rate down to 30 per cent.
While the schedules for exemptions and zero-ratings are not extensive, there are a few notable supplies being either exempted or zero-rated which are substantially narrowing the tax base. Some exports like copper may show substantial increase which is captured in the GDP computation but however has no bearing on the VAT base. Further, changes in the statutory rate (change from 17.5% to 16% in 2008) has also contributed to the low VAT tax collection.
Tax Policy
Greater investment in VAT administration processes and ICT can help alleviate the first problem while for the second, a major review of exemptions on their cost effectiveness and impact on the VAT tax base is recommended.
3.3.3 Efficiency of the tax system
The discussion on efficiency is limited to the discussion on how taxes influence behaviour in terms of making choices. For example, the tax system may influence the choice of products to consume, whether to operate in formal economy or in the informal economy and choice of location for investment. However, data on some of these aspects of efficiency is not available and therefore is only discussed in brief and in general terms because the scope of this study did not take this route.
Fundamentally, it is hard to tell which tax is relatively efficient or not unless rigorous empirical research is done by introducing analyses on the Marginal Effective Tax Rate (METR)28, which can enable one to evaluate the distortion in resource allocation. However, the picture for Zambia is well captured by Stern and Barbour (2005) who argued that the Zambian tax system is not particularly efficient in taxing small businesses because the effective tax burden29
28 A marginal tax rate is the tax rate that applies to the last Kwacha of taxable income, and is often applied to the change in one's tax obligation as taxable income rises.
on small business is in
29 The effective tax rate measures the impact of a tax system on an incremental unit of capital investment or business activity. It incorporates the effects of not only statutory tax rates and related tax treatments (e.g. tax depreciation, tax credit, tax deductibility, tax holidays, etc.) but also various economic factors interacting with these tax treatments (e.g. financial costs, the inflation rate, and the structure of investment, etc). In other words,
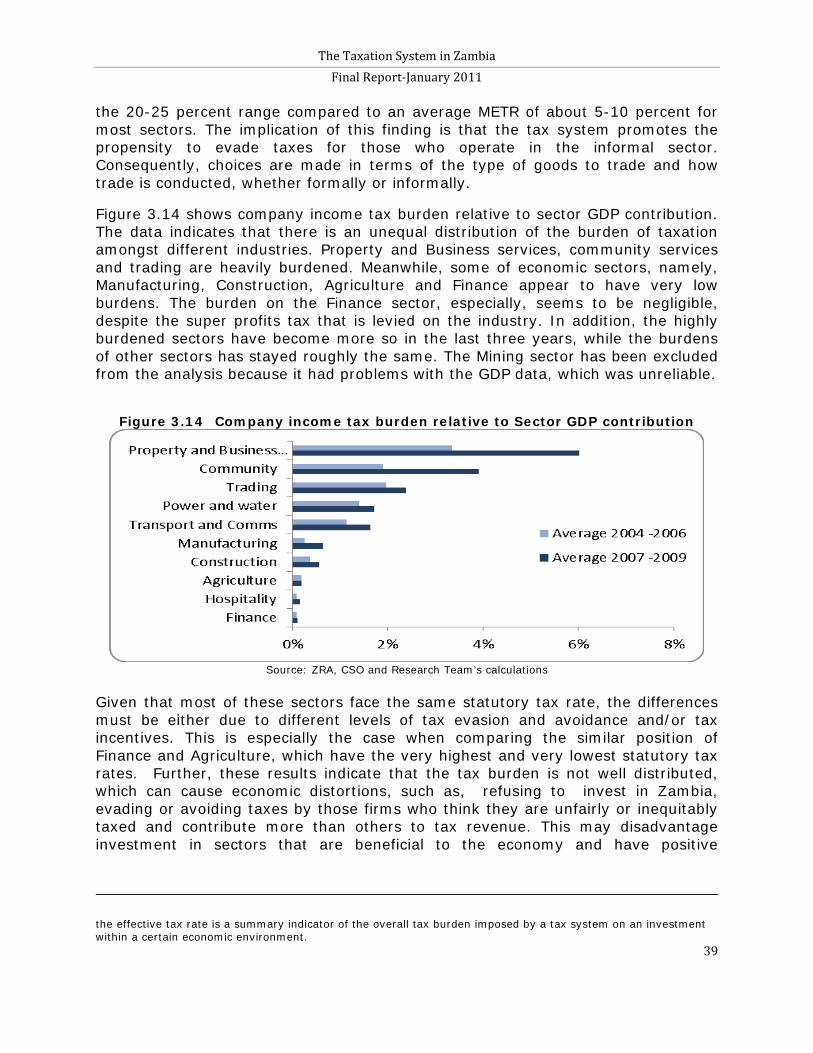
The Taxation System in Zambia Final Report-January 2011
39
the 20-25 percent range compared to an average METR of about 5-10 percent for most sectors. The implication of this finding is that the tax system promotes the propensity to evade taxes for those who operate in the informal sector. Consequently, choices are made in terms of the type of goods to trade and how trade is conducted, whether formally or informally.
Figure 3.14 shows company income tax burden relative to sector GDP contribution. The data indicates that there is an unequal distribution of the burden of taxation amongst different industries. Property and Business services, community services and trading are heavily burdened. Meanwhile, some of economic sectors, namely, Manufacturing, Construction, Agriculture and Finance appear to have very low burdens. The burden on the Finance sector, especially, seems to be negligible, despite the super profits tax that is levied on the industry. In addition, the highly burdened sectors have become more so in the last three years, while the burdens of other sectors has stayed roughly the same. The Mining sector has been excluded from the analysis because it had problems with the GDP data, which was unreliable.
Figure 3.14 Company income tax burden relative to Sector GDP contribution
Source: ZRA, CSO and Research Team’s calculations
Given that most of these sectors face the same statutory tax rate, the differences must be either due to different levels of tax evasion and avoidance and/or tax incentives. This is especially the case when comparing the similar position of Finance and Agriculture, which have the very highest and very lowest statutory tax rates. Further, these results indicate that the tax burden is not well distributed, which can cause economic distortions, such as, refusing to invest in Zambia, evading or avoiding taxes by those firms who think they are unfairly or inequitably taxed and contribute more than others to tax revenue. This may disadvantage investment in sectors that are beneficial to the economy and have positive
the effective tax rate is a summary indicator of the overall tax burden imposed by a tax system on an investment within a certain economic environment.
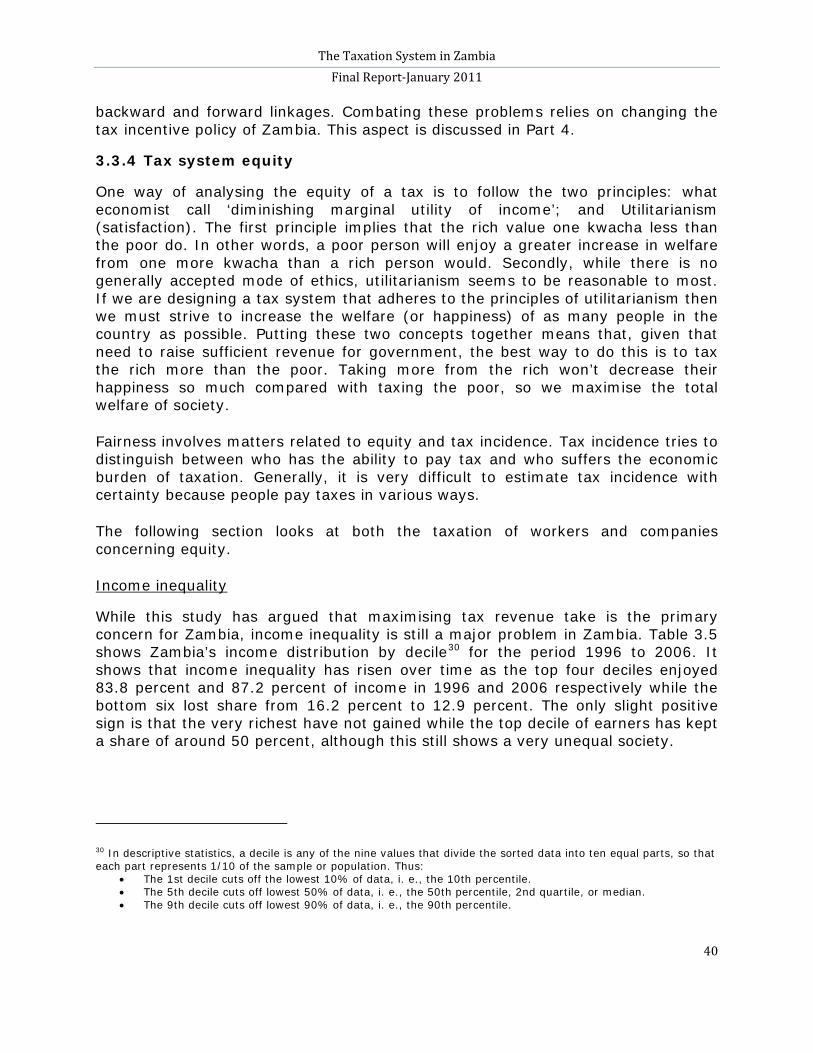
The Taxation System in Zambia Final Report-January 2011
40
backward and forward linkages. Combating these problems relies on changing the tax incentive policy of Zambia. This aspect is discussed in Part 4.
3.3.4 Tax system equity
One way of analysing the equity of a tax is to follow the two principles: what economist call ‘diminishing marginal utility of income’; and Utilitarianism (satisfaction). The first principle implies that the rich value one kwacha less than the poor do. In other words, a poor person will enjoy a greater increase in welfare from one more kwacha than a rich person would. Secondly, while there is no generally accepted mode of ethics, utilitarianism seems to be reasonable to most. If we are designing a tax system that adheres to the principles of utilitarianism then we must strive to increase the welfare (or happiness) of as many people in the country as possible. Putting these two concepts together means that, given that need to raise sufficient revenue for government, the best way to do this is to tax the rich more than the poor. Taking more from the rich won’t decrease their happiness so much compared with taxing the poor, so we maximise the total welfare of society.
Fairness involves matters related to equity and tax incidence. Tax incidence tries to distinguish between who has the ability to pay tax and who suffers the economic burden of taxation. Generally, it is very difficult to estimate tax incidence with certainty because people pay taxes in various ways.
The following section looks at both the taxation of workers and companies concerning equity.
While this study has argued that maximising tax revenue take is the primary concern for Zambia, income inequality is still a major problem in Zambia. Table 3.5 shows Zambia’s income distribution by decile
Income inequality
30
for the period 1996 to 2006. It shows that income inequality has risen over time as the top four deciles enjoyed 83.8 percent and 87.2 percent of income in 1996 and 2006 respectively while the bottom six lost share from 16.2 percent to 12.9 percent. The only slight positive sign is that the very richest have not gained while the top decile of earners has kept a share of around 50 percent, although this still shows a very unequal society.
30 In descriptive statistics, a decile is any of the nine values that divide the sorted data into ten equal parts, so that each part represents 1/10 of the sample or population. Thus:
• The 1st decile cuts off the lowest 10% of data, i. e., the 10th percentile. • The 5th decile cuts off lowest 50% of data, i. e., the 50th percentile, 2nd quartile, or median. • The 9th decile cuts off lowest 90% of data, i. e., the 90th percentile.
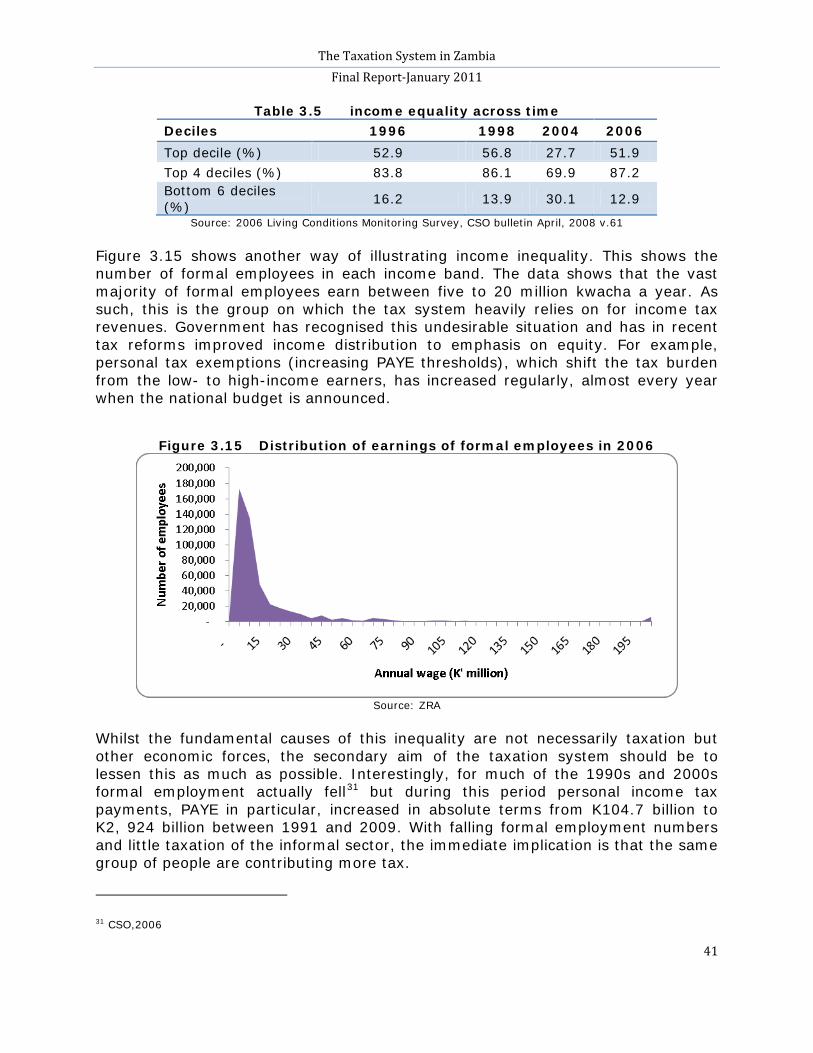
The Taxation System in Zambia Final Report-January 2011
41
Table 3.5 income equality across time Deciles 1996 1998 2004 2006 Top decile (%) 52.9 56.8 27.7 51.9 Top 4 deciles (%) 83.8 86.1 69.9 87.2 Bottom 6 deciles (%) 16.2 13.9 30.1 12.9
Source: 2006 Living Conditions Monitoring Survey, CSO bulletin April, 2008 v.61 Figure 3.15 shows another way of illustrating income inequality. This shows the number of formal employees in each income band. The data shows that the vast majority of formal employees earn between five to 20 million kwacha a year. As such, this is the group on which the tax system heavily relies on for income tax revenues. Government has recognised this undesirable situation and has in recent tax reforms improved income distribution to emphasis on equity. For example, personal tax exemptions (increasing PAYE thresholds), which shift the tax burden from the low- to high-income earners, has increased regularly, almost every year when the national budget is announced.
Figure 3.15 Distribution of earnings of formal employees in 2006
Source: ZRA
Whilst the fundamental causes of this inequality are not necessarily taxation but other economic forces, the secondary aim of the taxation system should be to lessen this as much as possible. Interestingly, for much of the 1990s and 2000s formal employment actually fell31
31 CSO,2006
but during this period personal income tax payments, PAYE in particular, increased in absolute terms from K104.7 billion to K2, 924 billion between 1991 and 2009. With falling formal employment numbers and little taxation of the informal sector, the immediate implication is that the same group of people are contributing more tax.
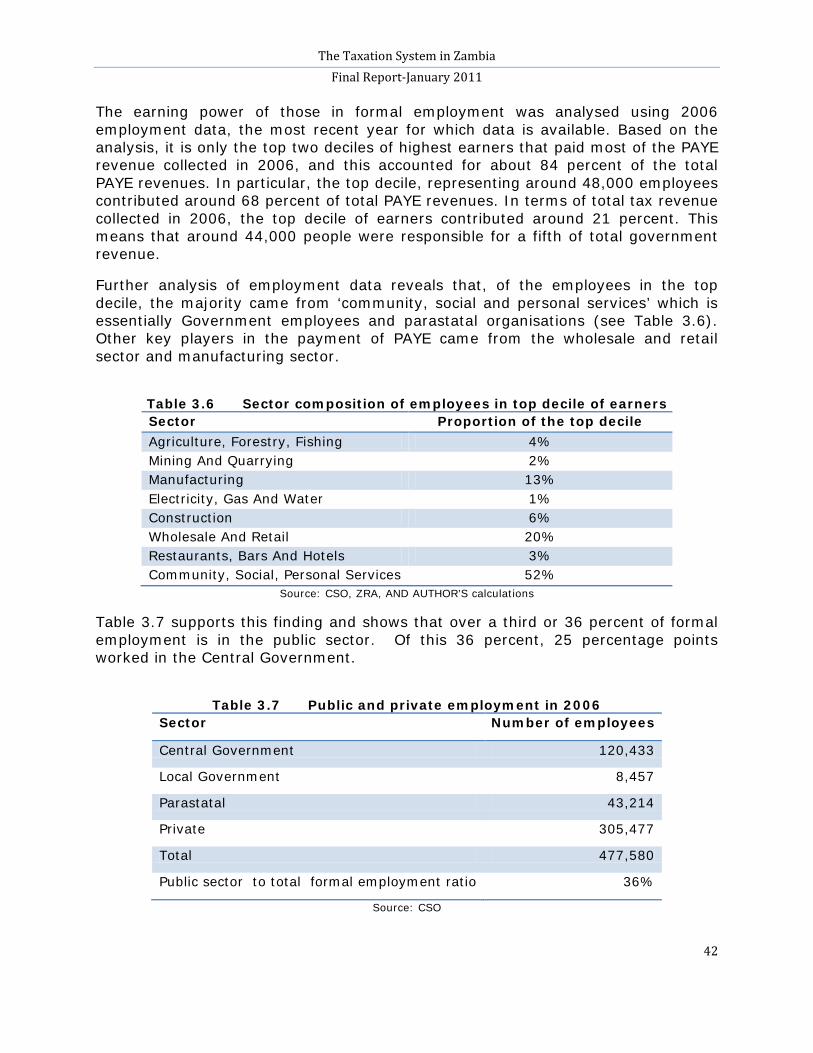
The Taxation System in Zambia Final Report-January 2011
42
The earning power of those in formal employment was analysed using 2006 employment data, the most recent year for which data is available. Based on the analysis, it is only the top two deciles of highest earners that paid most of the PAYE revenue collected in 2006, and this accounted for about 84 percent of the total PAYE revenues. In particular, the top decile, representing around 48,000 employees contributed around 68 percent of total PAYE revenues. In terms of total tax revenue collected in 2006, the top decile of earners contributed around 21 percent. This means that around 44,000 people were responsible for a fifth of total government revenue.
Further analysis of employment data reveals that, of the employees in the top decile, the majority came from ‘community, social and personal services’ which is essentially Government employees and parastatal organisations (see Table 3.6). Other key players in the payment of PAYE came from the wholesale and retail sector and manufacturing sector.
Table 3.6 Sector composition of employees in top decile of earners Sector Proportion of the top decile Agriculture, Forestry, Fishing 4% Mining And Quarrying 2% Manufacturing 13% Electricity, Gas And Water 1% Construction 6% Wholesale And Retail 20% Restaurants, Bars And Hotels 3% Community, Social, Personal Services 52%
Source: CSO, ZRA, AND AUTHOR’S calculations
Table 3.7 supports this finding and shows that over a third or 36 percent of formal employment is in the public sector. Of this 36 percent, 25 percentage points worked in the Central Government.
Table 3.7 Public and private employment in 2006
Sector Number of employees
Central Government 120,433
Local Government 8,457
Parastatal 43,214
Private 305,477
Total 477,580
Public sector to total formal employment ratio 36%
Source: CSO
The Taxation System in Zambia Final Report-January 2011
43
The implication of the findings in this section emphasise the fact that most tax is borne by few individuals (447, 580) in the formal sector. Such a system is likely to be inequitable. Gorter (2004) presented evidence that bottom wage earners in Zambia paid more tax than the equivalent workers in other countries in COMESA. Additionally, the tax burden was found to decrease with increased gross household income.
Fairness of the personal income tax system
Presently, Zambia’s Personal Income Tax (PIT) system is not equitable. Too much of the burden is on low- and middle-income individuals, and less on high-income individuals. There are two main areas that have given rise to this situation. Firstly, there is a lack of wealth taxation within the country, as discussed earlier, and consequently about 98 percent of all PIT revenue comes from PAYE. Income from capital, such as property or shares is not efficiently and effectively taxed. Since wealthy individuals derive much of their income from these assets rather than from salaries, the PIT system is regressive, resulting in taxing the middle-class more than the high-class. Secondly, PAYE deductions favour high-income individuals. Deductions could be made on PAYE from mortgage interest, pension and saving fund payments. However, these sort of payments are mainly made by the well off, since few can afford mortgages or structured savings plans.
3.4 RECOMMENDATIONS
1. Increase contribution of VAT. The tax system must move towards a more predictable and stable tax structure that relies more on consumption taxes, like domestic VAT and local excise duties and less on income taxes and trade taxes (this is supported by the OECD’s annual report, 2008). However, collection and policy rigidities inherent in these consumption taxes must first be addressed. For example, there must be a good balance between exempt and zero-rated goods and services. This requires moral and economic judgment especially on goods and services that are considered “essential” for the poor. To make VAT administration efficient, the tax system must avoid creating provisions that encourage tax evasion or avoidance. For example, the VAT relief given to tourists operations in Livingstone only and to diplomats creates opportunities for tax planning, tax evasion and tax avoidance.
2. Improve VAT refund administration. The high tax refunds that go to the mining sector (over 90%) which over time have dictated the performance of VAT as a tax type. While refunding VAT to exporters such as mining companies is correct, there appears to be large channels through which firms supplying the mines may be avoiding their tax obligations. The VAT refund system needs to be studied to ensure that it is not being abused. There should be greater investment in VAT administration processes and a major review of exemptions to review their cost effectiveness and impact on the VAT tax base.
The Taxation System in Zambia Final Report-January 2011
44
3. Broaden the tax base. By spreading taxation to other sectors and individuals, including the informal sector there will be relief on the middle-class and a few economic sectors that are faced with the highest burden of taxation.
The Taxation System in Zambia Final Report-January 2011
45
PART 4 TAX INCENTIVES
4.1 INTRODUCTION Part 4 discusses the tax incentives that are offered in the Zambian tax system. It first explains the arguments for and against tax incentives and provides some empirical investigation on the matter. It explains the complex network of taxes and incentives that are used to promote growth, and provides an indication of their cost and asks what the benefits have been. It then suggests how such a tax system might be improved.
4.2 ARGUMENTS IN SUPPORT OF TAX INCENTIVES The principle rationale for tax incentives is to strengthen economic growth by encouraging worthwhile investment. The common argument in support of tax incentives is that, if designed well, they can encourage investment in the economy
Summary of key points
• Tax incentives can be used to promote growth, but there are many concerns over their application.
• Incentives can cause significant revenue loss without a corresponding increase in economic welfare. Further, tax incentives can create opportunities for revenue leakage and also promote inequality
• Income tax, VAT and trade tax incentives are common in Zambia.
• Currently the impact of trade tax incentives are easier to quantify than domestic tax incentives.
• For most incentives, the expected costs and benefits are hardly understood before implementation.
• To manage tax incentives the study has recommended the following:
• costing incentives and providing independent oversight;
• undertake further analysis on the costs and benefits of incentives;
• improve oversight on allocation of discretionary measures;
• design incentives that are administratively feasible;
• avoid incentives that can be abused; and
• adopt a simplified uniform tax rate
The Taxation System in Zambia Final Report-January 2011
46
and thereby support economic growth.32
4.3 ARGUMENTS AGAINST TAX INCENTIVES
These can be justified if they bring about positive externalities resulting from investments. Another common argument is that while incentives may reduce tax revenue in the short-term, by stimulating investments taxable income maybe generated in future. Further, proponents argue that tax incentives have been successfully used to attract and grow the economy in countries such as Malaysia, Ireland, South Korea, Taiwan and Mauritius. The Government of Zambia has argued that it faces pressure to attract investment, and has to compete with tax breaks offered elsewhere.
Those who argue against tax incentives insist that they may not be the most cost effective way to attract investment, other policies like removing red tape, building infrastructure, and the like, can be more effective and create their own positive spill-over effects. The consensus of the World Bank, IMF and most economic studies in the literature is in support of a gradual reduction in tax incentives, particularly in developing countries33. Most literature argues that incentives often go against the core principles of efficiency, equity and simplicity. Further, in countries with developing tax authorities, tax incentives can often pose a major problem for tax administration leading to tax revenue leakage. This section limits its discussion to three common problems with tax incentives.
Taxes may reduce the expected return of a project while tax incentives or even subsidies can increase the expected return. Hsaio-Yun Chen (2002) illustrated how typical investnment decisions can be influenced by incentves. Figure 4.1 illustrates this. When deciding where to invest, investors estimate how much return they can make under each option available and choose the one expected to deliver the highest return. When analysing investment choices the common practice is to use two values: one is the expected return that can be made in the country on some project; the other is the hurdle rate. The hurdle rate is the cost for the investor to raise the capital to be invested plus a premium to compensate for the riskiness of the project. Therefore, a project in a political volatile country will have a higher hurdle rate than one in a peaceful country. As long as the expected return of the project is above the hurdle rate there will be investment.
Unnecessary revenue loss
32 Nathan MSI Group, ‘Effectiveness and Economic Impact of Tax Incentives in the SADC region’, 2004.
33 Report on effectiveness and Economic Impact of Tax Incentives in the SADC Region, SADC Tax Subcommittee, SADC Trade, submitted by Nathan−MSI Group, under contract no. PCE-I-00-98-00016-00, February 2004).
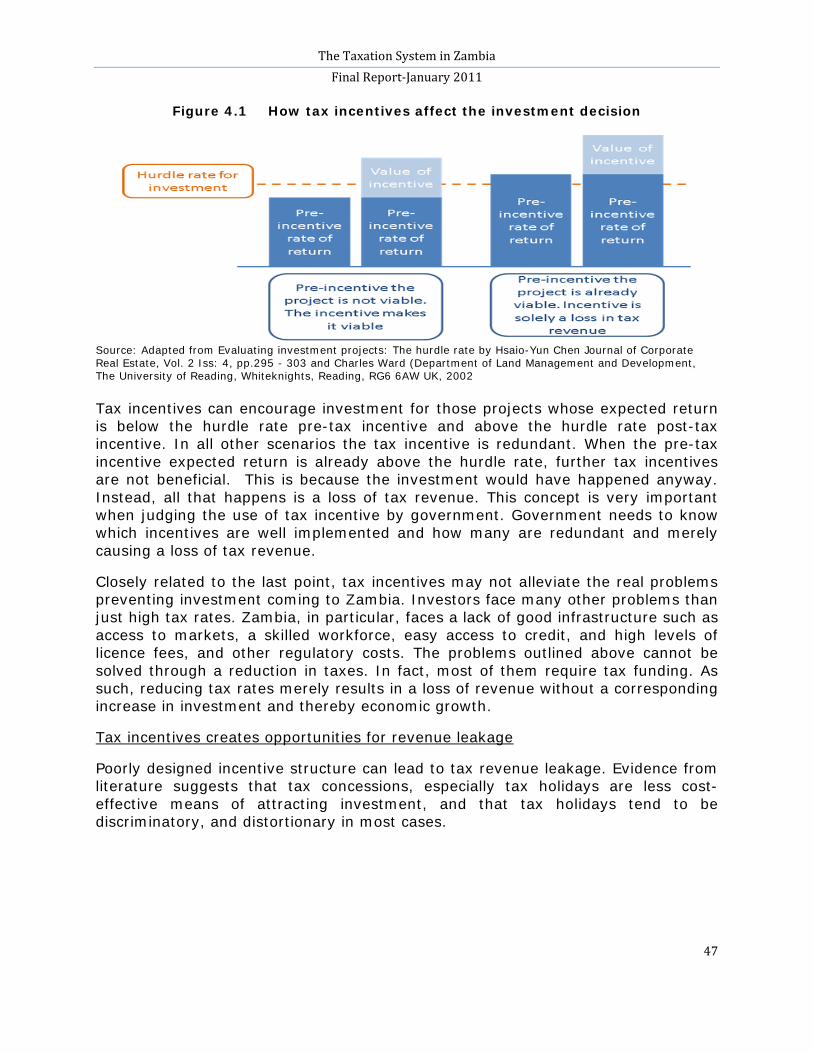
The Taxation System in Zambia Final Report-January 2011
47
Figure 4.1 How tax incentives affect the investment decision
Source: Adapted from Evaluating investment projects: The hurdle rate by Hsaio-Yun Chen Journal of Corporate Real Estate, Vol. 2 Iss: 4, pp.295 - 303 and Charles Ward (Department of Land Management and Development, The University of Reading, Whiteknights, Reading, RG6 6AW UK, 2002 Tax incentives can encourage investment for those projects whose expected return is below the hurdle rate pre-tax incentive and above the hurdle rate post-tax incentive. In all other scenarios the tax incentive is redundant. When the pre-tax incentive expected return is already above the hurdle rate, further tax incentives are not beneficial. This is because the investment would have happened anyway. Instead, all that happens is a loss of tax revenue. This concept is very important when judging the use of tax incentive by government. Government needs to know which incentives are well implemented and how many are redundant and merely causing a loss of tax revenue.
Closely related to the last point, tax incentives may not alleviate the real problems preventing investment coming to Zambia. Investors face many other problems than just high tax rates. Zambia, in particular, faces a lack of good infrastructure such as access to markets, a skilled workforce, easy access to credit, and high levels of licence fees, and other regulatory costs. The problems outlined above cannot be solved through a reduction in taxes. In fact, most of them require tax funding. As such, reducing tax rates merely results in a loss of revenue without a corresponding increase in investment and thereby economic growth.
Poorly designed incentive structure can lead to tax revenue leakage. Evidence from literature suggests that tax concessions, especially tax holidays are less cost-effective means of attracting investment, and that tax holidays tend to be discriminatory, and distortionary in most cases.
Tax incentives creates opportunities for revenue leakage
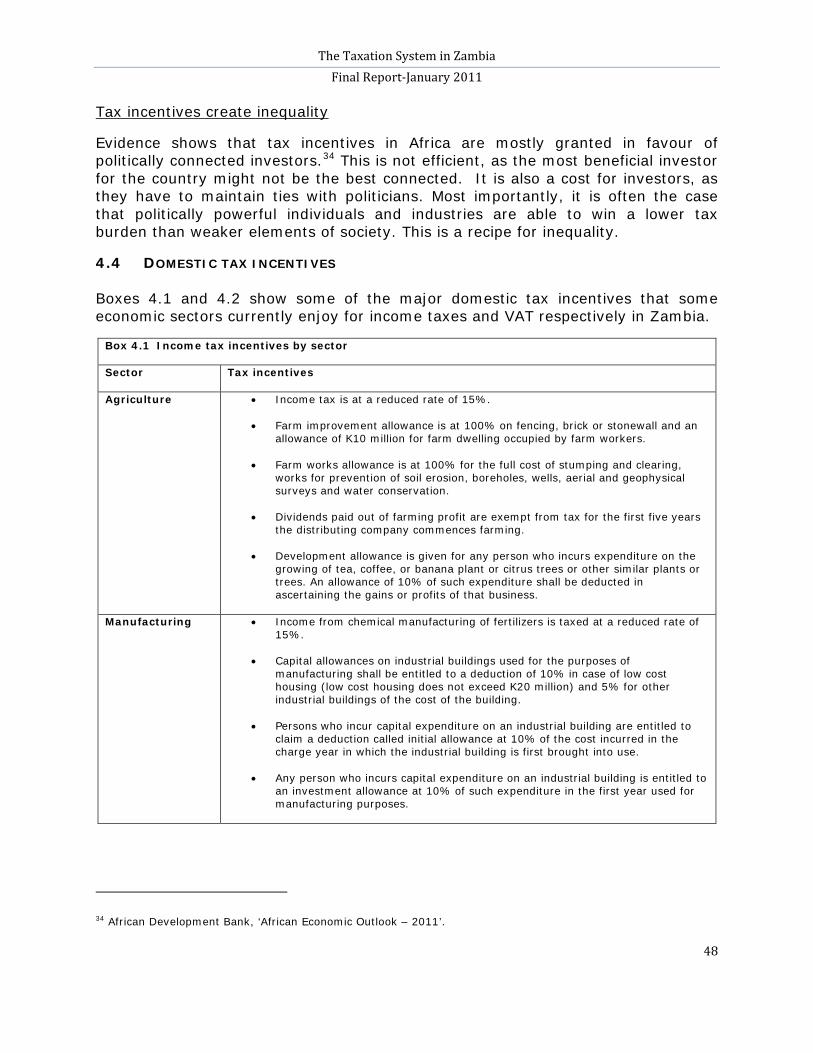
The Taxation System in Zambia Final Report-January 2011
48
Evidence shows that tax incentives in Africa are mostly granted in favour of politically connected investors.
Tax incentives create inequality
34
4.4 DOMESTIC TAX INCENTIVES
This is not efficient, as the most beneficial investor for the country might not be the best connected. It is also a cost for investors, as they have to maintain ties with politicians. Most importantly, it is often the case that politically powerful individuals and industries are able to win a lower tax burden than weaker elements of society. This is a recipe for inequality.
Boxes 4.1 and 4.2 show some of the major domestic tax incentives that some economic sectors currently enjoy for income taxes and VAT respectively in Zambia.
Box 4.1 Income tax incentives by sector
Sector Tax incentives
Agriculture
• Income tax is at a reduced rate of 15%.
• Farm improvement allowance is at 100% on fencing, brick or stonewall and an allowance of K10 million for farm dwelling occupied by farm workers.
• Farm works allowance is at 100% for the full cost of stumping and clearing, works for prevention of soil erosion, boreholes, wells, aerial and geophysical surveys and water conservation.
• Dividends paid out of farming profit are exempt from tax for the first five years the distributing company commences farming.
• Development allowance is given for any person who incurs expenditure on the growing of tea, coffee, or banana plant or citrus trees or other similar plants or trees. An allowance of 10% of such expenditure shall be deducted in ascertaining the gains or profits of that business.
Manufacturing
• Income from chemical manufacturing of fertilizers is taxed at a reduced rate of 15%.
• Capital allowances on industrial buildings used for the purposes of manufacturing shall be entitled to a deduction of 10% in case of low cost housing (low cost housing does not exceed K20 million) and 5% for other industrial buildings of the cost of the building.
• Persons who incur capital expenditure on an industrial building are entitled to claim a deduction called initial allowance at 10% of the cost incurred in the charge year in which the industrial building is first brought into use.
• Any person who incurs capital expenditure on an industrial building is entitled to an investment allowance at 10% of such expenditure in the first year used for manufacturing purposes.
34 African Development Bank, ‘African Economic Outlook – 2011’.
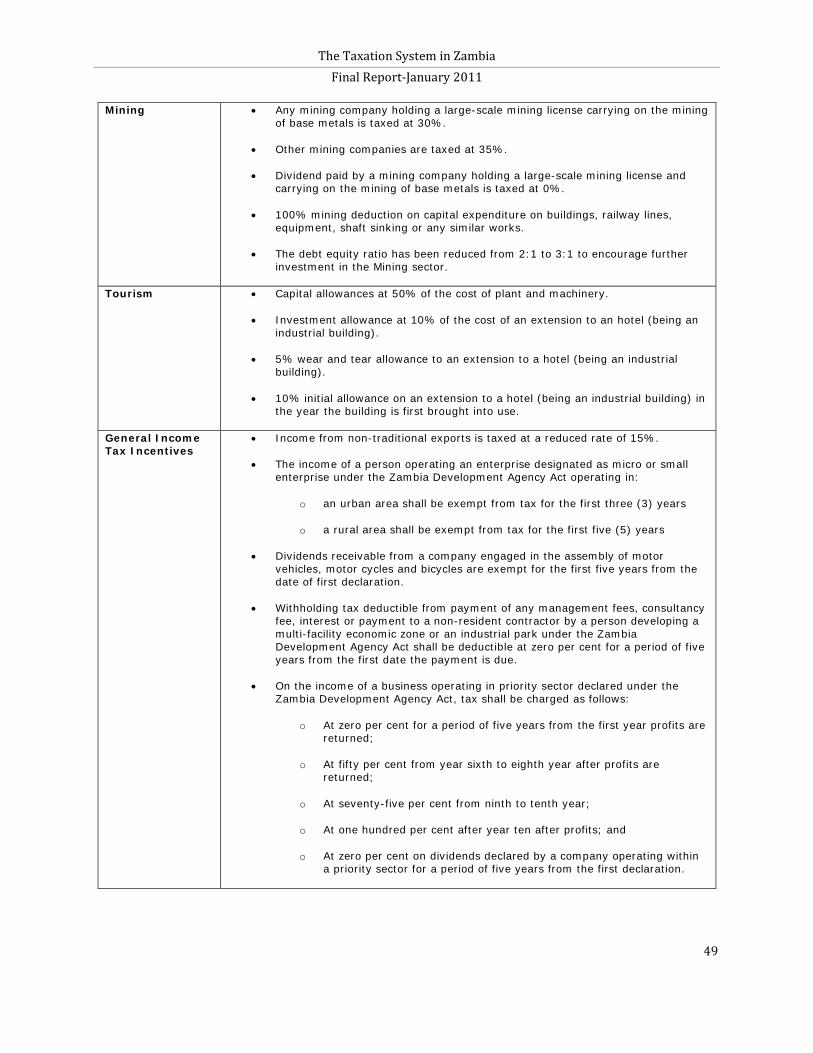
The Taxation System in Zambia Final Report-January 2011
49
Mining
• Any mining company holding a large-scale mining license carrying on the mining of base metals is taxed at 30%.
• Other mining companies are taxed at 35%.
• Dividend paid by a mining company holding a large-scale mining license and carrying on the mining of base metals is taxed at 0%.
• 100% mining deduction on capital expenditure on buildings, railway lines, equipment, shaft sinking or any similar works.
• The debt equity ratio has been reduced from 2:1 to 3:1 to encourage further investment in the Mining sector.
Tourism
• Capital allowances at 50% of the cost of plant and machinery.
• Investment allowance at 10% of the cost of an extension to an hotel (being an industrial building).
• 5% wear and tear allowance to an extension to a hotel (being an industrial building).
• 10% initial allowance on an extension to a hotel (being an industrial building) in the year the building is first brought into use.
General Income Tax Incentives
• Income from non-traditional exports is taxed at a reduced rate of 15%.
• The income of a person operating an enterprise designated as micro or small enterprise under the Zambia Development Agency Act operating in:
o an urban area shall be exempt from tax for the first three (3) years
o a rural area shall be exempt from tax for the first five (5) years
• Dividends receivable from a company engaged in the assembly of motor vehicles, motor cycles and bicycles are exempt for the first five years from the date of first declaration.
• Withholding tax deductible from payment of any management fees, consultancy fee, interest or payment to a non-resident contractor by a person developing a multi-facility economic zone or an industrial park under the Zambia Development Agency Act shall be deductible at zero per cent for a period of five years from the first date the payment is due.
• On the income of a business operating in priority sector declared under the Zambia Development Agency Act, tax shall be charged as follows:
o At zero per cent for a period of five years from the first year profits are returned;
o At fifty per cent from year sixth to eighth year after profits are returned;
o At seventy-five per cent from ninth to tenth year;
o At one hundred per cent after year ten after profits; and
o At zero per cent on dividends declared by a company operating within a priority sector for a period of five years from the first declaration.
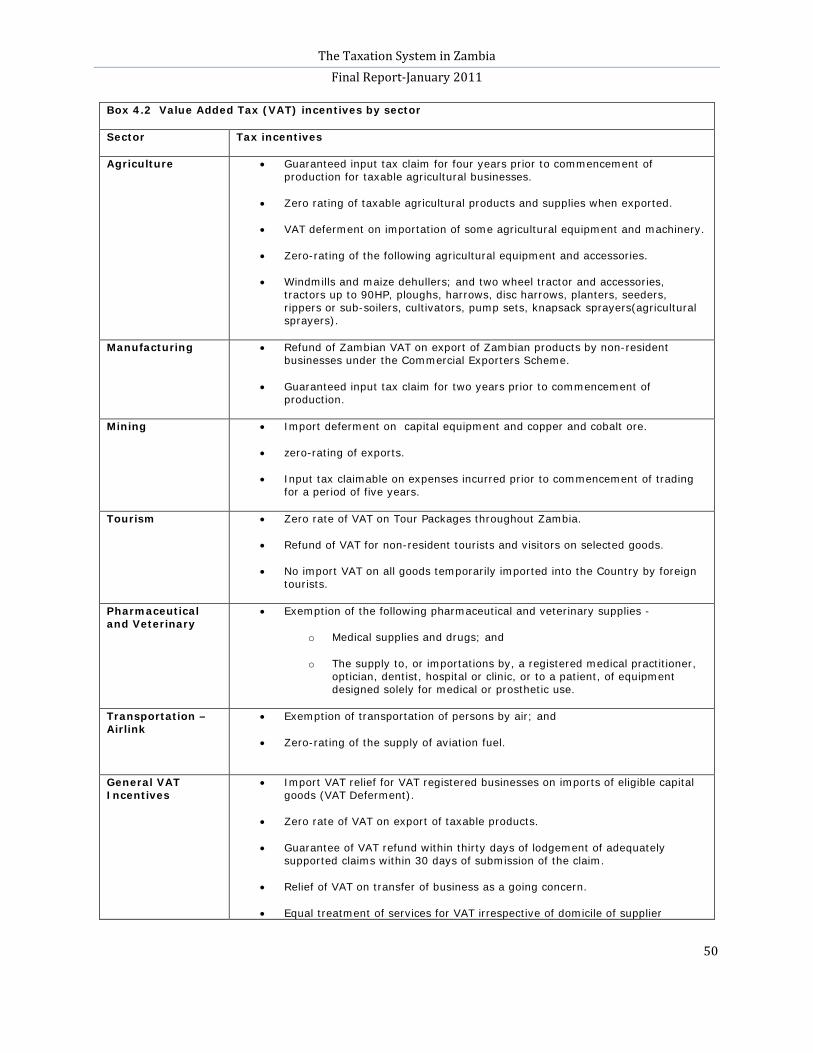
The Taxation System in Zambia Final Report-January 2011
50
Box 4.2 Value Added Tax (VAT) incentives by sector
Sector Tax incentives
Agriculture
• Guaranteed input tax claim for four years prior to commencement of production for taxable agricultural businesses.
• Zero rating of taxable agricultural products and supplies when exported.
• VAT deferment on importation of some agricultural equipment and machinery.
• Zero-rating of the following agricultural equipment and accessories.
• Windmills and maize dehullers; and two wheel tractor and accessories, tractors up to 90HP, ploughs, harrows, disc harrows, planters, seeders, rippers or sub-soilers, cultivators, pump sets, knapsack sprayers(agricultural sprayers).
Manufacturing
• Refund of Zambian VAT on export of Zambian products by non-resident businesses under the Commercial Exporters Scheme.
• Guaranteed input tax claim for two years prior to commencement of production.
Mining
• Import deferment on capital equipment and copper and cobalt ore.
• zero-rating of exports.
• Input tax claimable on expenses incurred prior to commencement of trading for a period of five years.
Tourism
• Zero rate of VAT on Tour Packages throughout Zambia.
• Refund of VAT for non-resident tourists and visitors on selected goods.
• No import VAT on all goods temporarily imported into the Country by foreign tourists.
Pharmaceutical and Veterinary
• Exemption of the following pharmaceutical and veterinary supplies -
o Medical supplies and drugs; and
o The supply to, or importations by, a registered medical practitioner, optician, dentist, hospital or clinic, or to a patient, of equipment designed solely for medical or prosthetic use.
Transportation – Airlink
• Exemption of transportation of persons by air; and
• Zero-rating of the supply of aviation fuel.
General VAT Incentives
• Import VAT relief for VAT registered businesses on imports of eligible capital goods (VAT Deferment).
• Zero rate of VAT on export of taxable products.
• Guarantee of VAT refund within thirty days of lodgement of adequately supported claims within 30 days of submission of the claim.
• Relief of VAT on transfer of business as a going concern.
• Equal treatment of services for VAT irrespective of domicile of supplier
The Taxation System in Zambia Final Report-January 2011
51
(Reverse VAT).
• Cash accounting for VAT for members of the Association of Building and Civil Engineering Contractors.
• Guaranteed VAT input tax claim for three months prior to VAT registration for businesses that have already commenced trading.
• Re-introduction of voluntary registration for compliant businesses whose turnover is below K200 million per annum.
• Registered businesses are allowed to re-claim 20 percent of input VAT paid on petrol.
• Exemption of interest component of finance Leases.
• Zero rating of VAT for investors in manufacturing, agriculture, etc operating in tax free zones.
As demonstrated in Boxes 4.1 and 4.2, income tax and VAT have a wide range of incentives. Prominent among these are those that deal with tax credits and depreciation allowances. The impact of domestic tax incentives is very difficult to quantify and information is not readily available. These measures are mostly implemented without much analysis on expected costs and benefits.
4.5 TRADE TAX INCENTIVES The structure of trade incentives under various trade protocols is detailed in Box 4.3.
Box 4.3 Trade protocols
Type Description COMESA
The COMESA protocol on trade offers zero tariff on intra-COMESA trade. In 2009, the revenue foregone under this protocol stood at K136 billion.35
SADC
Zambia is heavily dependent on intra-SADC trade, sourcing about 57 percent of its imports from other SADC members.36 The revenue foregone under the SADC protocol in 2009 was well over K365 billion with South Africa accounting for K337 billion.37
Multi-Facility Economic Zones
The SADC protocol on trade including the Southern African Customs Union (SACU) protocol is likely to worsen the revenue loss for Zambia as the tariff phase down is to be accelerated with the SADC Customs Union expected to be in place in 2012.
Zambia has embraced the concept of Multi-Facility Economic Zones (MFEZ) that proposes a package of incentives aimed at establishing a suitable environment for increased domestic industrial growth, export promotion, development of a market-oriented production and private sector development.
The primary goals of MFEZs are to provide foreign exchange earnings by promoting non-traditional exports, to provide jobs, generate income, and to attract foreign direct investment and attendant technology transfer and knowledge spill over. Domestic, international, or joint venture firms operating in these zones are expected to typically
35 ZRA, 2009 36 Richard Filmer and Stella Mushiri, Customs Revenue Implications of the SADC Trade Protocol, 2001 37 ZRA, 2009
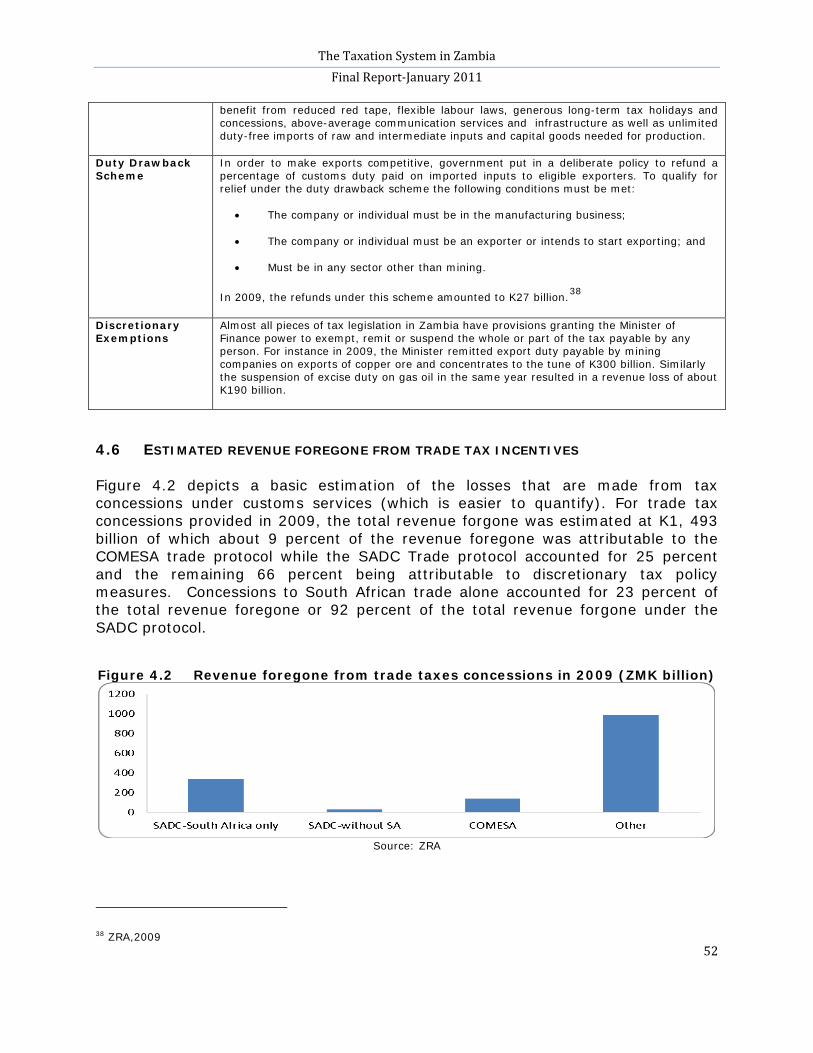
The Taxation System in Zambia Final Report-January 2011
52
benefit from reduced red tape, flexible labour laws, generous long-term tax holidays and concessions, above-average communication services and infrastructure as well as unlimited duty-free imports of raw and intermediate inputs and capital goods needed for production.
Duty Drawback Scheme
In order to make exports competitive, government put in a deliberate policy to refund a percentage of customs duty paid on imported inputs to eligible exporters. To qualify for relief under the duty drawback scheme the following conditions must be met:
• The company or individual must be in the manufacturing business;
• The company or individual must be an exporter or intends to start exporting; and
• Must be in any sector other than mining.
In 2009, the refunds under this scheme amounted to K27 billion.38
Discretionary Exemptions
Almost all pieces of tax legislation in Zambia have provisions granting the Minister of Finance power to exempt, remit or suspend the whole or part of the tax payable by any person. For instance in 2009, the Minister remitted export duty payable by mining companies on exports of copper ore and concentrates to the tune of K300 billion. Similarly the suspension of excise duty on gas oil in the same year resulted in a revenue loss of about K190 billion.
4.6 ESTIMATED REVENUE FOREGONE FROM TRADE TAX INCENTIVES Figure 4.2 depicts a basic estimation of the losses that are made from tax concessions under customs services (which is easier to quantify). For trade tax concessions provided in 2009, the total revenue forgone was estimated at K1, 493 billion of which about 9 percent of the revenue foregone was attributable to the COMESA trade protocol while the SADC Trade protocol accounted for 25 percent and the remaining 66 percent being attributable to discretionary tax policy measures. Concessions to South African trade alone accounted for 23 percent of the total revenue foregone or 92 percent of the total revenue forgone under the SADC protocol.
Figure 4.2 Revenue foregone from trade taxes concessions in 2009 (ZMK billion)
Source: ZRA
38 ZRA,2009
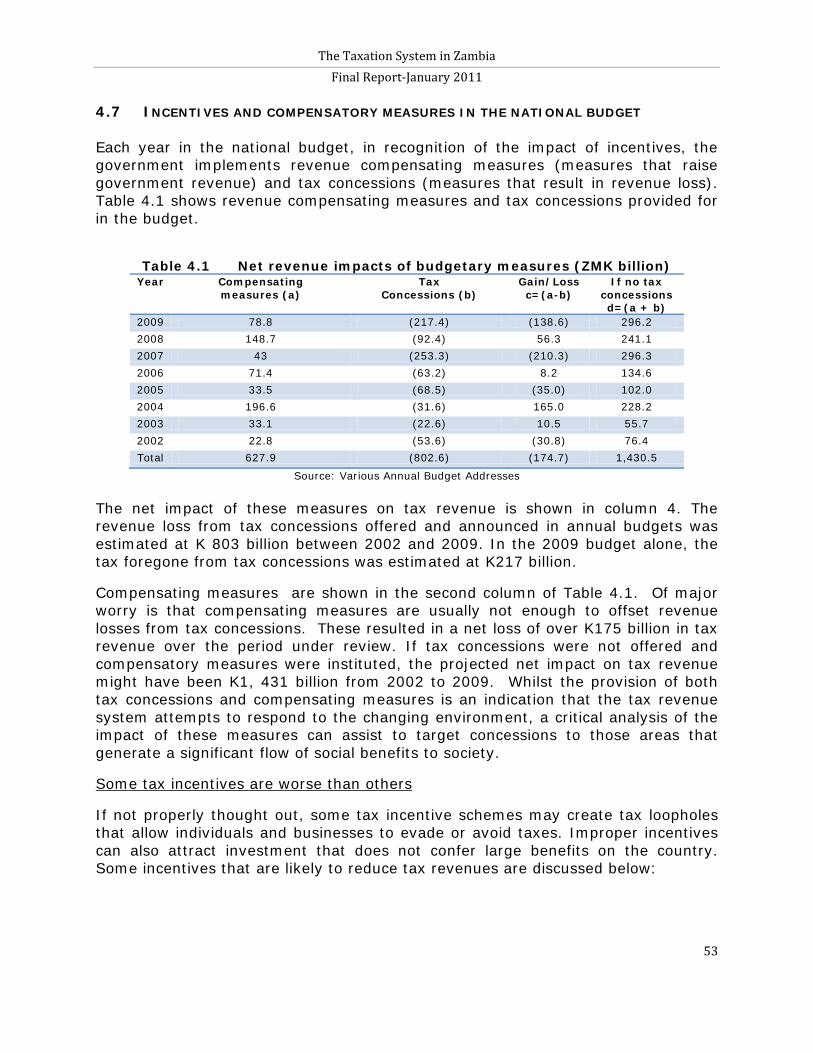
The Taxation System in Zambia Final Report-January 2011
53
4.7 INCENTIVES AND COMPENSATORY MEASURES IN THE NATIONAL BUDGET Each year in the national budget, in recognition of the impact of incentives, the government implements revenue compensating measures (measures that raise government revenue) and tax concessions (measures that result in revenue loss). Table 4.1 shows revenue compensating measures and tax concessions provided for in the budget.
Table 4.1 Net revenue impacts of budgetary measures (ZMK billion)
Year Compensating measures (a)
Tax Concessions (b)
Gain/Loss c=(a-b)
If no tax concessions d=(a + b)
2009 78.8 (217.4) (138.6) 296.2 2008 148.7 (92.4) 56.3 241.1 2007 43 (253.3) (210.3) 296.3 2006 71.4 (63.2) 8.2 134.6 2005 33.5 (68.5) (35.0) 102.0 2004 196.6 (31.6) 165.0 228.2 2003 33.1 (22.6) 10.5 55.7 2002 22.8 (53.6) (30.8) 76.4 Total 627.9 (802.6) (174.7) 1,430.5
Source: Various Annual Budget Addresses The net impact of these measures on tax revenue is shown in column 4. The revenue loss from tax concessions offered and announced in annual budgets was estimated at K 803 billion between 2002 and 2009. In the 2009 budget alone, the tax foregone from tax concessions was estimated at K217 billion.
Compensating measures are shown in the second column of Table 4.1. Of major worry is that compensating measures are usually not enough to offset revenue losses from tax concessions. These resulted in a net loss of over K175 billion in tax revenue over the period under review. If tax concessions were not offered and compensatory measures were instituted, the projected net impact on tax revenue might have been K1, 431 billion from 2002 to 2009. Whilst the provision of both tax concessions and compensating measures is an indication that the tax revenue system attempts to respond to the changing environment, a critical analysis of the impact of these measures can assist to target concessions to those areas that generate a significant flow of social benefits to society.
If not properly thought out, some tax incentive schemes may create tax loopholes that allow individuals and businesses to evade or avoid taxes. Improper incentives can also attract investment that does not confer large benefits on the country. Some incentives that are likely to reduce tax revenues are discussed below:
Some tax incentives are worse than others
The Taxation System in Zambia Final Report-January 2011
54
Tax holidays
The Zambia Development Agency (ZDA) incentive regime makes large use of tax holidays (meaning no payment or payment at reduced CIT rates for a number of years), particularly in the MFEZs. This study argues that tax holidays are of most benefit to “short-term” investors who do not plan to operate in a country for the long-term. In general, these short-term investors are likely to be less beneficial for the country in terms of employment and spillovers.
For long-term investors, the tax holiday represents a small proportion of the number of years of their planned projects so it does not weigh as heavily on their investment decision. Instead, the long-term statutory rate, quality of infrastructure, and such, are more important. Tax holidays also provide an avenue for transfer pricing for multinational firms. For instance, a shell company of a multinational can be set up in Zambia to benefit from the tax holiday. As soon as that holiday expires, the shell company is disbanded. In fact, the same strategy can be followed by a domestic firm which sets up a subsidiary to benefit from the tax holiday. As such, there is a risk that no real economic benefits are conferred to the economy.
Multi-Facility Economic Zones
Incentives offered under MFEZs are a further example that has the potential to reduce tax revenue in the short-run and increase the cost of tax administration. There is a significant risk of tax leakage from interactions with the domestic economy. A major challenge is how to manage MFEZs across the country that will be at various stages of development given ZRA’s limited tax administration resources. In the absence of a clearer definition of policy and operational guidelines, monitoring of activities within the MFEZs will remain a major challenge. For instance, there is need for a strategy to ensure that goods that are bought from MFEZs do not enter the domestic market without permission and payment of the applicable duties.
Duty Drawback Scheme
The Duty Drawback Scheme faces the danger of potential revenue leakage similar to the case of MFEZs. Without a strong tax administration, goods designated as exports could easily be sold on the domestic market instead. This may create economic distortions, through unfair competition and revenue loss through fraudulent duty refund claims. While the figures involved might look minimal, the concern is more on the credibility of the scheme and the accompanying distortions.
4.8 PROPOSALS TO MANAGE TAX INCENTIVES Tax expenditure budgeting
This study has argued that, while tax incentives can lead to welfare enhancing investment and growth, they can also be misapplied resulting in unnecessary loss of revenue and increased opportunities for tax evasion and avoidance. The basic message is that incentives should not be given out freely under the assumption that
The Taxation System in Zambia Final Report-January 2011
55
they are always beneficial. Instead, critical analysis and oversight should be applied.
This section proposes one mechanism of oversight that can be applied, which is, tax expenditure budgeting. Many countries include the immediate ‘cost’ of their tax incentives within their budget. This recognises that a tax incentive causes a reduction in tax revenue, which should be catered for in the national budget. If the revenue foregone from tax incentives is calculated then included within the national budget, then parliamentary oversight can be applied to incentives as to any other government expenditure.
There is one significant problem with budgeting for tax expenditures though, estimating revenue foregone is not straightforward. For example, this study has shown that, for trade taxes, Zambia’s data systems are fairly advanced and can provide sufficient information to form a reasonable estimate. However, currently, data systems for domestic taxes are insufficient for this purpose and more technological and financial investment is needed in this area.
There are some countries that use similar methods to tax expenditure budgeting. Malawi and Mozambique have established a ceiling for the value of tax incentives that must be approved by government each year. Tanzania is testing another method where government issues vouchers that are redeemable in lieu of taxes due, with a limit on the value of vouchers each year.39
Move towards a flat rate company income tax rate
As a way of providing incentive, the Zambian tax system has multiple income tax rates for different industries: 15 percent for agriculture, 30 percent for mining and 35 percent for all other businesses. The financial sector has a higher company tax rate on high profits. The 2011 national budget has proposed the same for the Telecommunications sector while taxpayers in Multi-Facility Economic Zones (MFEZ) are expected to benefit from reduced income tax rates.
The combined effect of numerous tax types on the same tax base has the potential to result in high effective taxation. For instance, to import a motor vehicle, at the current rates, the effective taxation is close to 90 percent, which is an incentive for smuggling or under-valuation. Equally, excise duties are on average, close to 100 percent, which also encourages tax evasion tendencies. It is the view of this study that the tax system must consider reducing tax rates on some activities where multiple taxation rates or string of taxes is applied. Moving towards a flat rate company income tax rate can result in reasonable control of high effective tax rates that may cause tax leakages.
South Korea in 1997 reduced the number of taxes from 31 to 13 and recorded some compliance successes. Most countries around the world avoid such a multiple
39 Nathan MSI Group, ‘Effectiveness and Economic Impact of Tax Incentives in the SADC region’, 2004.
The Taxation System in Zambia Final Report-January 2011
56
rate structure, but instead have chosen a uniform, but low rate across all sectors40. This study supports the practices in other countries because it supports equity and is administratively efficient41
4.9 RECOMMENDATIONS
. It is also advantageous to the country because firms stop relying on costly rent seeking to win discretionary tax incentives from Government. This view point is supported by Alcock. O, (2003) who states that many taxes and rate structures are harmful, as they become determinants for foreign and local businesses and consumers decisions on where to invest or what to consume. This means that investors and consumers have an incentive to tilt investment and consumption respectively, towards sectors that are dimmed tax friendly at the expense of decisions that may have more value addition.
1. Improve oversight on the allocation of budget discretionary
measures. Discretionary incentives currently issued by the Minister of Finance must be done with the concurrence of Parliament and should be properly debated by various stakeholders. Further, they must be announced early and with a clear start and end time to allow for tax planning
2. Set up Tax Expenditure Budgeting (TEB) procedures. TEB can form the basis for Parliamentary oversight of tax incentives. TEB requires a solid and reliable quantification of impact of both domestics and trade tax incentives.
3. Further analysis on the costs and benefits of incentives. Both trade and domestic tax incentives must be further reviewed to ensure that they are optimal, promote social welfare, and do not weaken the productivity of the revenue system. This includes those provisions under trade liberalisation. It would be prudent to establish a committee within Government and other stakeholders to identify beneficial and non-beneficial incentives from trade liberalisation.
4. Control high effective tax rates that may cause tax leakages. The combined effect of numerous tax types on the same tax base has the potential to result in high effective taxation.
5. Avoid incentives that can be abused. Incentives that are susceptible to abuse, such as tax holidays, must not be allowed as they complicate tax administration and make it susceptible to fraud and tax evasion tendencies.
40 Korea Institute of Public Finance report of 1997 41 It is expected that those who do not support this view point will argue, for example, that a uniform rate would increase tax burden on the agricultural sector and perpetuate poverty for the majority poor resource farmers. A counter argument is the current 15 percent incentive rate on agriculture also benefits the “well off” large commercial farms, who will grow even bigger. This will result in increased inequality between the rich and the poor farmers.
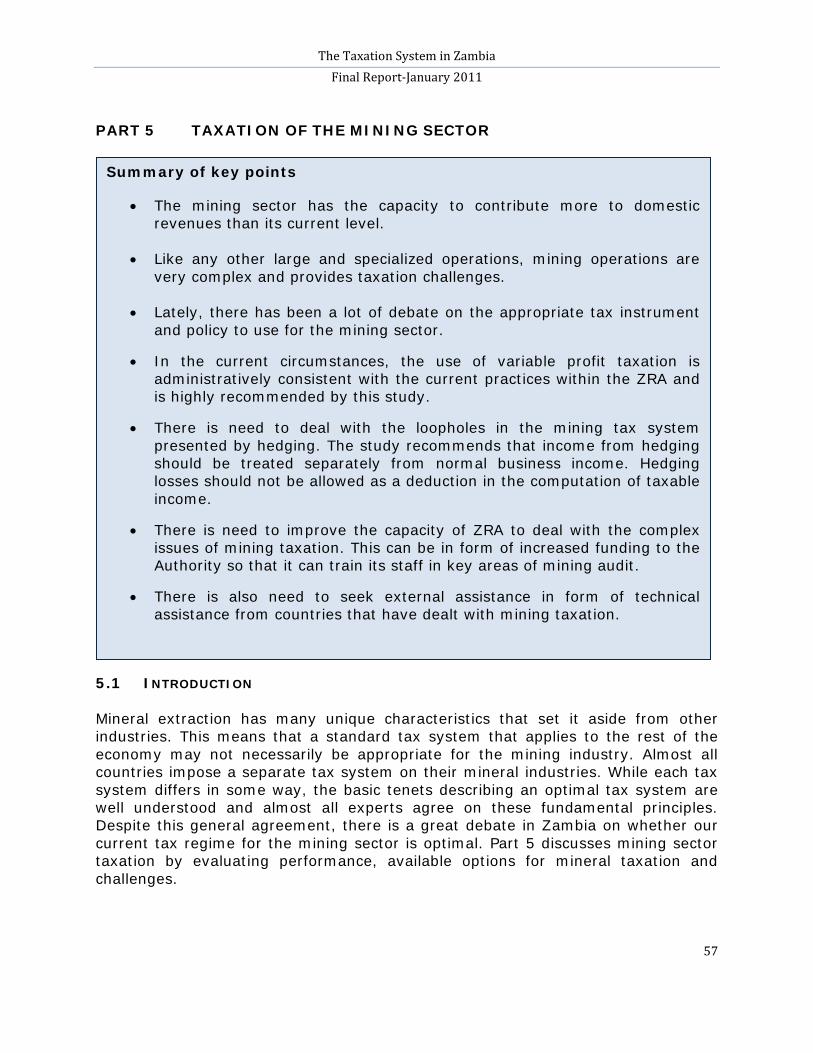
The Taxation System in Zambia Final Report-January 2011
57
PART 5 TAXATION OF THE MINING SECTOR
5.1 INTRODUCTION Mineral extraction has many unique characteristics that set it aside from other industries. This means that a standard tax system that applies to the rest of the economy may not necessarily be appropriate for the mining industry. Almost all countries impose a separate tax system on their mineral industries. While each tax system differs in some way, the basic tenets describing an optimal tax system are well understood and almost all experts agree on these fundamental principles. Despite this general agreement, there is a great debate in Zambia on whether our current tax regime for the mining sector is optimal. Part 5 discusses mining sector taxation by evaluating performance, available options for mineral taxation and challenges.
Summary of key points
• The mining sector has the capacity to contribute more to domestic revenues than its current level.
• Like any other large and specialized operations, mining operations are
very complex and provides taxation challenges.
• Lately, there has been a lot of debate on the appropriate tax instrument and policy to use for the mining sector.
• In the current circumstances, the use of variable profit taxation is administratively consistent with the current practices within the ZRA and is highly recommended by this study.
• There is need to deal with the loopholes in the mining tax system presented by hedging. The study recommends that income from hedging should be treated separately from normal business income. Hedging losses should not be allowed as a deduction in the computation of taxable income.
• There is need to improve the capacity of ZRA to deal with the complex issues of mining taxation. This can be in form of increased funding to the Authority so that it can train its staff in key areas of mining audit.
• There is also need to seek external assistance in form of technical assistance from countries that have dealt with mining taxation.
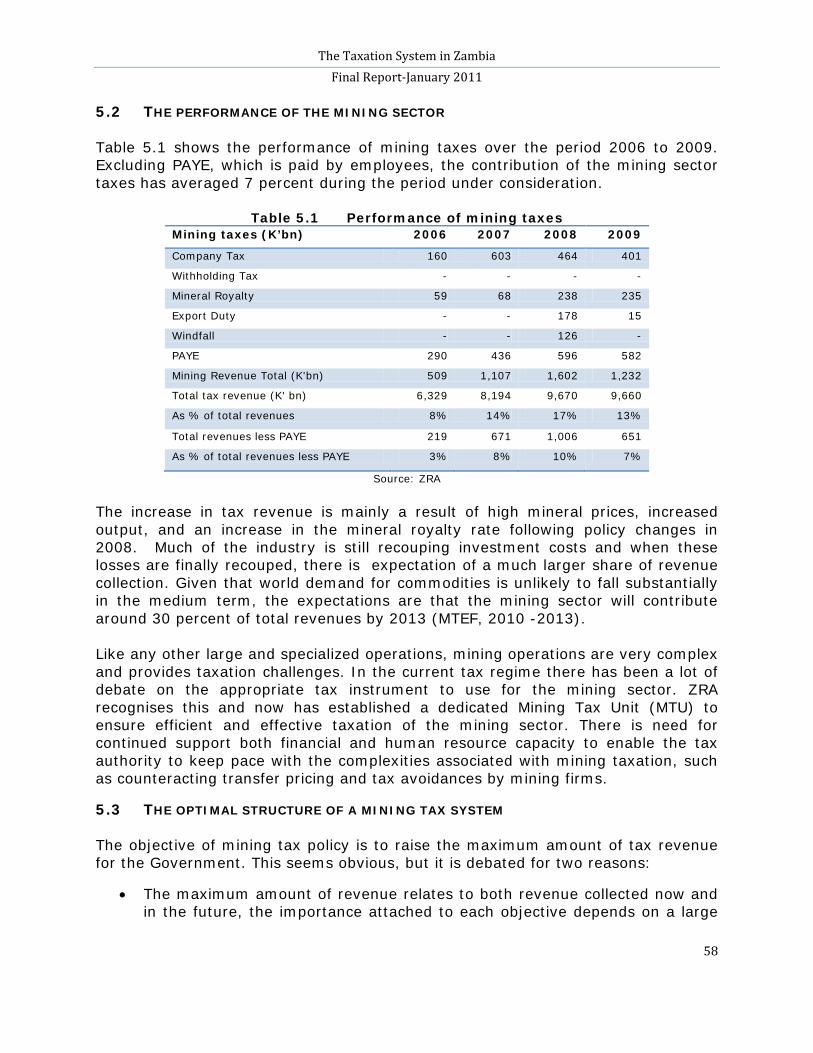
The Taxation System in Zambia Final Report-January 2011
58
5.2 THE PERFORMANCE OF THE MINING SECTOR Table 5.1 shows the performance of mining taxes over the period 2006 to 2009. Excluding PAYE, which is paid by employees, the contribution of the mining sector taxes has averaged 7 percent during the period under consideration.
Table 5.1 Performance of mining taxes Mining taxes (K’bn) 2006 2007 2008 2009
Company Tax 160 603 464 401
Withholding Tax - - - -
Mineral Royalty 59 68 238 235
Export Duty - - 178 15
Windfall - - 126 -
PAYE 290 436 596 582
Mining Revenue Total (K'bn) 509 1,107 1,602 1,232
Total tax revenue (K' bn) 6,329 8,194 9,670 9,660
As % of total revenues 8% 14% 17% 13%
Total revenues less PAYE 219 671 1,006 651
As % of total revenues less PAYE 3% 8% 10% 7%
Source: ZRA The increase in tax revenue is mainly a result of high mineral prices, increased output, and an increase in the mineral royalty rate following policy changes in 2008. Much of the industry is still recouping investment costs and when these losses are finally recouped, there is expectation of a much larger share of revenue collection. Given that world demand for commodities is unlikely to fall substantially in the medium term, the expectations are that the mining sector will contribute around 30 percent of total revenues by 2013 (MTEF, 2010 -2013). Like any other large and specialized operations, mining operations are very complex and provides taxation challenges. In the current tax regime there has been a lot of debate on the appropriate tax instrument to use for the mining sector. ZRA recognises this and now has established a dedicated Mining Tax Unit (MTU) to ensure efficient and effective taxation of the mining sector. There is need for continued support both financial and human resource capacity to enable the tax authority to keep pace with the complexities associated with mining taxation, such as counteracting transfer pricing and tax avoidances by mining firms.
5.3 THE OPTIMAL STRUCTURE OF A MINING TAX SYSTEM The objective of mining tax policy is to raise the maximum amount of tax revenue for the Government. This seems obvious, but it is debated for two reasons:
• The maximum amount of revenue relates to both revenue collected now and in the future, the importance attached to each objective depends on a large
The Taxation System in Zambia Final Report-January 2011
59
number to factors. For instance, in general, developing country governments need money sooner rather than later compared to developed countries.
• There are other benefits to mining other than just revenue maximization (employment is cited the most). Often, a policy that tries to maximise tax revenue may decrease these other benefits. The mining industry in Zambia contributes no more than 8 percent of total formal employment42
In balancing near- and far-term revenues, there is need to protect investment prospects to ensure there actually will be revenue to collect in the future. To do this while maximising revenue collection, tax policy must meet the following criteria:
. While this is important, the potential contribution to tax revenues is far higher. However, for Zambia, protecting mining employment at the expense of tax revenue is not advisable. The mining tax revenues can be used to spur more economic growth and may create higher levels of employment.
1. Have a competitive tax regime. The tax burden in the mining sector should be comparable to other copper producing countries, after accounting for differences in other investment factors like political stability;
2. Reduce opportunities for tax avoidance and evasion. The tax regime
should balance the need for optimal tax policies with the need to minimise the costs and technical challenges associated with tax administration efforts;
3. Give a ‘fair’ share of returns to both firm and government. The tax
regime should allow firms enough return to remain viable when mineral prices are low, but allow Government to obtain a fair share of returns when prices are high;
4. Tax according to the ability for firms to pay. The tax regime should
adhere to the ‘ability to pay’ principle. The tax burden for low cost firms should be higher than for high cost firms insofar as the cost difference relates to factors other than differences in operational efficiency.
5.4 A SIMPLE GUIDE TO MINERAL POLICY FORMATION IN ZAMBIA
Here the basic methodology of mining tax policy is outlined. It involves choices that depend on certain variables, as described above. A developing country like Zambia should concentrate on maximising tax revenues. There may be other benefits, like employment, but, due to the capital-intensive nature of mining, these will not be large. The country should avoid policies that maximise these secondary benefits at the expense of the primary benefit, which is tax revenue.
42 CSO labour Survey of 2007
The Taxation System in Zambia Final Report-January 2011
60
• Tax revenues should be maximised over the entire course of mineral extraction. In other words, this means extracting the most tax revenue in the present period without overly harming investment prospects that will yield revenue in the future. But this is a difficult balancing act because countries may play it too safe and safeguard investment prospects at the cost of lower tax revenues today.
• Additionally, revenues today are worth more than revenues in the future. Governments can use cash today to investment in the economy to yield greater growth in the future. However, this preference for revenues sooner rather than later can go against the ability of mining companies to pay taxes today without damaging their financial positions.
• Taxes that keep the incentives for production in place are best in a perfect world. The theoretically best tax type is a ‘resource rent tax’. This type of tax allows a firm just enough to pay its costs and its investors, and taxes any surplus profit. Zambia’s variable profit tax is an approximation of this sort of tax. This tax type can be applied to whole mining industries where costs structures are very different without hurting some mines over others. However, there are some problems cited as an argument against such taxes. Typical problems that might move a country away from adopting such a tax are: the preference for revenues sooner rather than later; particularly high risks and costs faced by companies; and the inability of tax authorities to audit companies properly. The answer can be to design tax structures that simulate some of the characteristics of a resource rent tax while addressing some of these issues.
5.5 DESCRIPTION OF CURRENT AND PAST REGIMES This section describes the current mining tax regime, possible modifications and assess these according to the criteria above (Section 5.4). The study will not, however, assess the previous regimes in detail (the Development Agreements (DA) or the 2008 regime). Table 5.2 compares these three recent tax systems according to the main elements of each system.
This study argues that none of these three regimes are close to optimal, although the current regime is most likely the best out of the three. The following reasons support the argument:
• The terms of the Development Agreements may well have been too generous towards mining firms. The regime also failed to capture benefits for the Government when commodity prices rose from 2005 to 2008.
• The 2008 regime swung too far the other way. It led to a comparatively high average effective tax rate and resulted in high burdens at high prices. In particular, it was poorly designed and implemented. For instance, the windfall tax was not made deductable against company income tax payments, which greatly increased the burden of taxation.
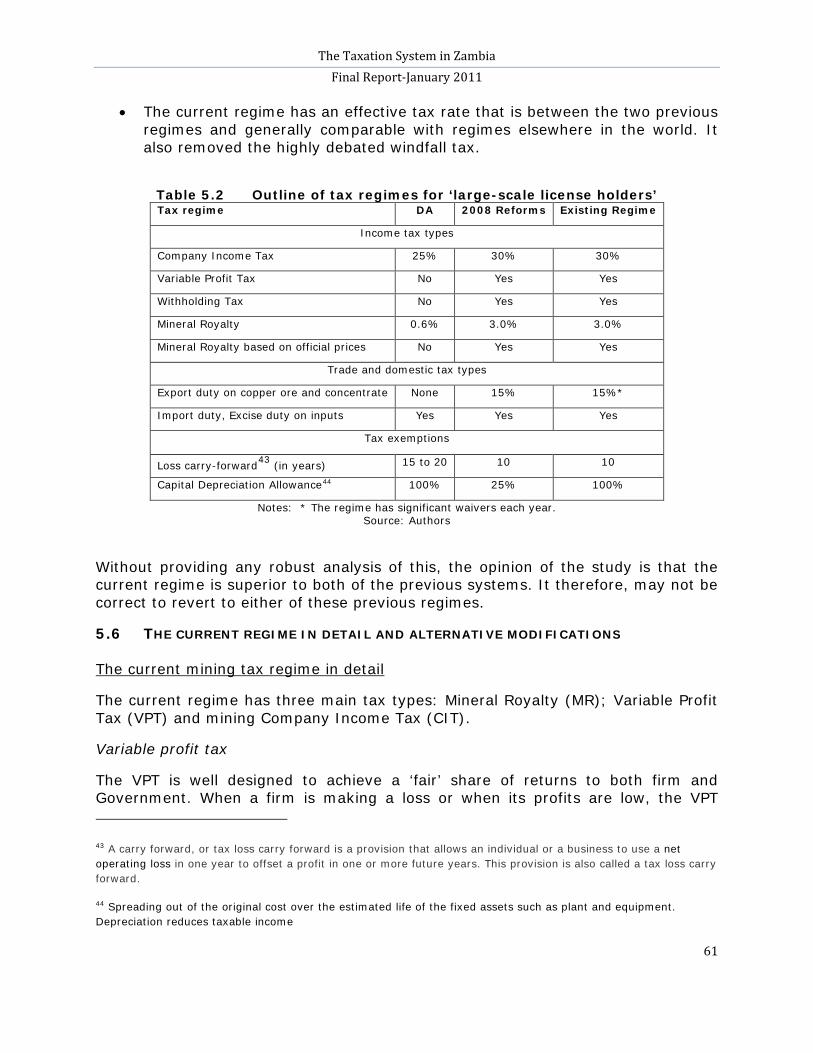
The Taxation System in Zambia Final Report-January 2011
61
• The current regime has an effective tax rate that is between the two previous regimes and generally comparable with regimes elsewhere in the world. It also removed the highly debated windfall tax.
Table 5.2 Outline of tax regimes for ‘large-scale license holders’ Tax regime DA 2008 Reforms Existing Regime
Income tax types
Company Income Tax 25% 30% 30%
Variable Profit Tax No Yes Yes
Withholding Tax No Yes Yes
Mineral Royalty 0.6% 3.0% 3.0%
Mineral Royalty based on official prices No Yes Yes
Trade and domestic tax types
Export duty on copper ore and concentrate None 15% 15%*
Import duty, Excise duty on inputs Yes Yes Yes
Tax exemptions
Loss carry-forward43 15 to 20 (in years) 10 10
Capital Depreciation Allowance44 100% 25% 100%
Notes: * The regime has significant waivers each year. Source: Authors
Without providing any robust analysis of this, the opinion of the study is that the current regime is superior to both of the previous systems. It therefore, may not be correct to revert to either of these previous regimes.
5.6 THE CURRENT REGIME IN DETAIL AND ALTERNATIVE MODIFICATIONS
The current regime has three main tax types: Mineral Royalty (MR); Variable Profit Tax (VPT) and mining Company Income Tax (CIT).
The current mining tax regime in detail
Variable profit tax
The VPT is well designed to achieve a ‘fair’ share of returns to both firm and Government. When a firm is making a loss or when its profits are low, the VPT
43 A carry forward, or tax loss carry forward is a provision that allows an individual or a business to use a net operating loss in one year to offset a profit in one or more future years. This provision is also called a tax loss carry forward.
44 Spreading out of the original cost over the estimated life of the fixed assets such as plant and equipment. Depreciation reduces taxable income
The Taxation System in Zambia Final Report-January 2011
62
burden is zero. This allows the firm to make a sufficient profit to continue business operations and satisfy investors with a basic return on their money. However, when profits are high, the VPT burden increases, such that it captures the windfall profits.
VPT also adheres to the criterion on the ability of the firm to pay. Since VPT is based on profits, a high-cost firm will pay less tax than a low-cost firm, everything else being equal will. A low-cost firm will pay more, but then its ability to pay is higher. While very small modifications might be made to the rates of the VPT, in general, it is the best tax to have. There are, however, some potential problems with its use. A VPT will not produce sufficient tax revenues in the early part of a mining project. This is because mines tend to have lower profits in the early years because of their high start-up costs. There is a high risk that firms will try to mask their profits so that, even in the mature stage of their operations, they may continue to pay little or no VPT. The tax authority therefore needs to develop the capacity to audit such mines and ascertain accurately the levels of profitability.
Mineral Royalty
The problem of the VPT is fixed, to some extent, by also levying the Mineral Royalty tax. As this is based on the amount of sales revenue, rather than profit, that a mine earns, the MR will always provide the Government with at least some revenue. However, the MR fails against the desirable criterion of achieving a ‘fair’ share of returns to both firm and Government and adherence to the ability of the firm to pay. Firms have to pay the MR even if they do not make a profit, nor is it able to capture very high profits. As such, it is not advisable for a tax regime to rely too heavily on MR alone.
Mining Company Income Tax
The CIT is, in almost every way, an inferior tax to the VPT. It has the same defects as the VPT, but does not even meet the criteria on achieving a ‘fair’ share of returns to both firm and government as effectively. However, it is still used extensively because of the principle of ‘double taxation’, which is explained in the Box 5.1 below. VPT is not applicable to the ‘double taxation’ principle so it is not advisable to rely solely on this tax.
Box 5.1 The ‘global income principle’ or ‘double taxation’ Most developed countries apply the ‘global income principle’ for the calculation of corporate income taxes of multinational companies. This principle states that the equivalent tax payment in Zambia (i.e. company income tax) can be used as credit by the parent company to deduct from its own income tax payments. For instance, a Zambian mining subsidiary earns income and is taxed 30 percent. The remaining profit is transferred to the parent company where the tax rate might be 35 percent, but since tax has already been paid in Zambia, the remaining income is taxed only at 5 percent. This is useful to know since Zambia can increase its tax rate up to 35 percent without harming the multinational in any way – overall tax paid is the same. The only difference is that now all tax is paid in Zambia and none overseas. However, this system of tax credits only works if the subsidiary and the parent pay similar taxes. If Zambia only levies a mineral royalty and the UK, for instance, only levies a CIT then MR payments will not be credited against payments in the UK.
The Taxation System in Zambia Final Report-January 2011
63
The study has demonstrated that the current regime fails in one important respect. By using the VPT there is a great risk that firms mask their profits and pay little or no VPT if the tax authority does not have sufficient capacity. Measuring the capacity of a tax authority to administer the VPT requires more analysis outside the scope of this study, and is essentially a value judgement that will have to be made by policy makers.
Proposed modifications to the current tax regime
Meanwhile, the study makes it clear that a return to the 2008 style windfall tax is not advisable because of the following flaws:
• Windfall tax was not made deductable against other taxes, meaning, the amount that firms would have to pay in windfall tax was not deducted from the taxable profit used to calculate company income tax. This would have led to very large tax payments for mining firms. This meant that the tax drastically failed and violated the criterion of achieving a ‘fair’ share of returns to both firm and government and adherence to the ability of the firm to pay. These left otherwise highly profitable firms with losses or insufficient returns for their investors. In this situation, high-cost firms were particularly damaged.
• Windfall tax was not indexed to any form of inflation measure. While this problem did not become apparent straight away, if left, it would have meant that the windfall tax becoming increasingly regressive over time.
Scope for modifications
The name of a policy is often as important as the details. It might be the case that the name ‘windfall tax’ has negative connotations given these critical flaws in the windfall tax that was actually levied in 2008. Any suggestion of introducing a windfall tax might now be associated with this past tax. However, there are many variants of this tax that might be more acceptable to both Government and industry. While this study does not support a return to the old windfall tax, there might be scope for alternatives. This choice depends on the capacity of the tax authority. Capacity is principally determined by two variables that are in the control of policy makers:
• Internal processes of the tax authority. The quality of staff, the use of ICT in a correct and appropriate manner, the audit processes, the use of appropriate skills (accountants and engineers), etc all determine capacity to audit mining firms. These are themselves determined by the level of funding, technical assistance, and a proper incentive scheme.
• Loopholes in the tax regime. As with all processes, tax administration is likely to exhibit declining marginal productivity. In other words, simply throwing money at the tax authority may not be enough. There are many incidences in the current tax regime in which firms can avoid taxes that a tax authority cannot easily stop. Closing these loopholes does two things:
The Taxation System in Zambia Final Report-January 2011
64
it reduces tax leakage so more revenue is collected; and it reduces the difficulties faced by the authority so less extra funding is needed. The Government wins on both counts.
The optimal tax regime
The study argues that the variable profit tax is probably the optimal tax regime given strong tax authority capacity. The necessary action for such a regime to work as expected is to strengthen the capacity of the revenue authority. However, since increasing capacity cannot be done instantaneously, in the short to medium term, the Government may consider the following options:
Option 1 Modified full windfall tax with progression to variable profit tax in the future
A tax based on the sales revenue of a firm rather than its profits (windfall tax) is not consistent with the desire to capturing tax when prices are high, and not discriminating against high-cost firm. The windfall tax uses the mineral price as a proxy for the profitability, however, higher prices cause higher tax rates. With the use of proxies, the actual profitability of the firm may be over stated.
Meanwhile, the variable profit tax rate changes with the profitability of the firm, so it almost directly satisfies criteria of capturing tax when prices are high. In support of VPT, all firms face the same mineral price so a high-cost firm will make fewer profits than a low-cost firm will. This will mean that it will pay a different amount of variable profit tax, because the VPT is MTEF based on profits. Under the windfall tax however, both high- and low-cost firms will pay the same amount of tax, despite the low-cost firm making more profits, which creates inequality and is against the principle of taxation.
As the capacity of the revenue authority is being built or for some reason the windfall is re-introduced, it could be modified further to limit some inbuilt deficiencies. The study proposes three ways:
1. Change the number of price thresholds at which the tax rate changes. The 2008 windfall tax design had three price thresholds. A way to make the tax burden more graduated might be to add additional price thresholds with different rates.
2. Change the level of each threshold or the corresponding rate. The price thresholds used in the 2008 regime could be changed to better reflect profitability of firms. If the industry can successfully argue that the windfall tax is too burdensome, then these thresholds might be increased, or the corresponding rates reduced.
3. Levy different rates for ‘high-cost firms’ and ‘low-costs firms’ according to some proxy. Alberta, one of the major mining provinces of
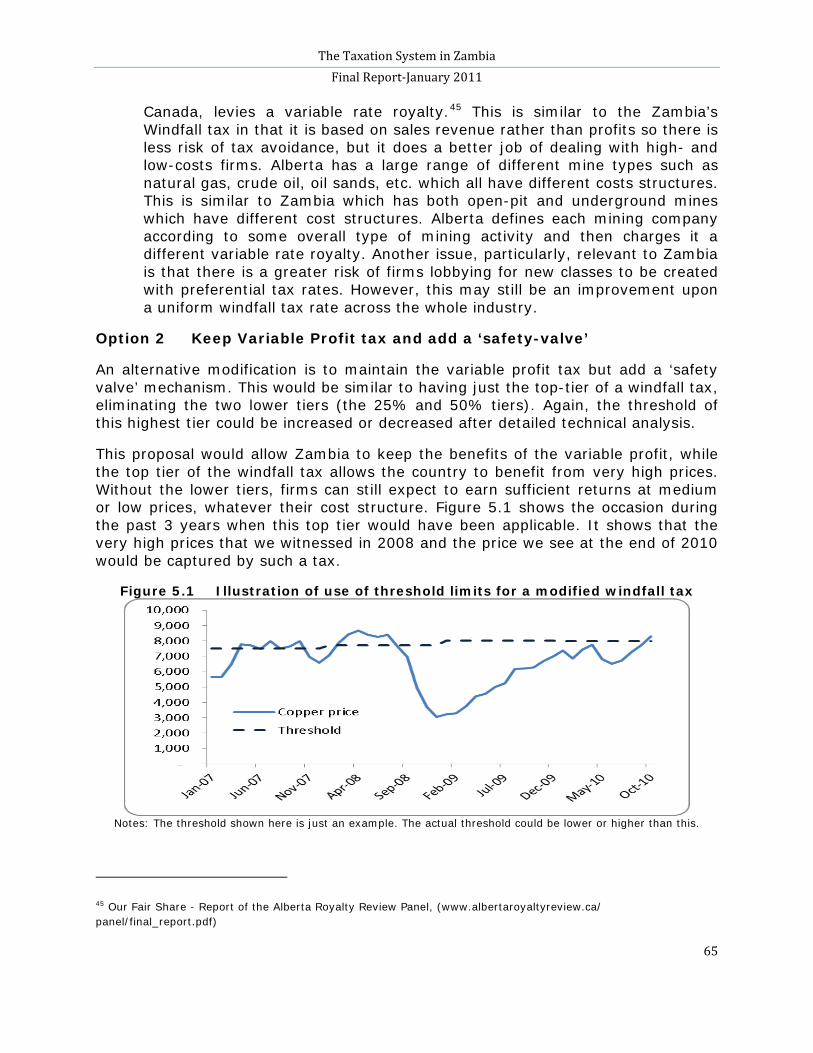
The Taxation System in Zambia Final Report-January 2011
65
Canada, levies a variable rate royalty.45
Option 2 Keep Variable Profit tax and add a ‘safety-valve’
This is similar to the Zambia’s Windfall tax in that it is based on sales revenue rather than profits so there is less risk of tax avoidance, but it does a better job of dealing with high- and low-costs firms. Alberta has a large range of different mine types such as natural gas, crude oil, oil sands, etc. which all have different costs structures. This is similar to Zambia which has both open-pit and underground mines which have different cost structures. Alberta defines each mining company according to some overall type of mining activity and then charges it a different variable rate royalty. Another issue, particularly, relevant to Zambia is that there is a greater risk of firms lobbying for new classes to be created with preferential tax rates. However, this may still be an improvement upon a uniform windfall tax rate across the whole industry.
An alternative modification is to maintain the variable profit tax but add a ‘safety valve’ mechanism. This would be similar to having just the top-tier of a windfall tax, eliminating the two lower tiers (the 25% and 50% tiers). Again, the threshold of this highest tier could be increased or decreased after detailed technical analysis.
This proposal would allow Zambia to keep the benefits of the variable profit, while the top tier of the windfall tax allows the country to benefit from very high prices. Without the lower tiers, firms can still expect to earn sufficient returns at medium or low prices, whatever their cost structure. Figure 5.1 shows the occasion during the past 3 years when this top tier would have been applicable. It shows that the very high prices that we witnessed in 2008 and the price we see at the end of 2010 would be captured by such a tax.
Figure 5.1 Illustration of use of threshold limits for a modified windfall tax
Notes: The threshold shown here is just an example. The actual threshold could be lower or higher than this.
45 Our Fair Share - Report of the Alberta Royalty Review Panel, (www.albertaroyaltyreview.ca/ panel/final_report.pdf)
The Taxation System in Zambia Final Report-January 2011
66
The use of one threshold, acts as a “safety-valve” since at times of very high prices, there are increased demands from the population to change the tax regime. It is the view of this study that tax regime changes should be avoided as it creates uncertainty for investors, which will contribute to a fall in investment.
5.7 TAX LOOPHOLES IN MINING TAXATION Among various types of loopholes in taxation, the hedging loophole is very common in mining taxation. Hedging relates to the practice of buying and selling derivatives like options and futures to protect a business from volatile prices and costs. It is considered a legitimate and very useful operation. However, firms can use the same practice of buying and selling derivatives as a loophole to reduce a company’s tax payments. The procedure is complex but relates to the idea of shifting income from a subsidiary in Zambia to a subsidiary in a low tax country like Switzerland, in the same manner as transfer pricing in other operations. The company deliberately makes a loss on derivative trading in Zambia and a profit in the Swiss subsidiary. The loss in Zambia reduces the taxable profits, while the extra profit in Switzerland is not taxed. For the multinational company as a whole, the amount of tax it has to pay has fallen.
This practice only works if the losses from hedging or derivative trading are allowed to offset profit from the rest of the firm’s operations. By making a law to separate the two incomes (income from hedging and income from the rest of the business), this tax loophole is closed. Now the firm can make losses on hedging, but it will still have to pay tax on its profits from the rest of the business. Such a law will not offer any disadvantages because the firm can still continue hedging normally if it wants, and any profit from hedging will still be taxed as normal. The 2008 tax regime recognised the problem and closed the loophole, but the current regime still contains this tax loophole, allowing hedging losses to be used against normal business income. While it is very difficult to estimate how much money Zambia is losing from this loophole, the study speculates that this is sufficiently high.
5.8 REFORMING TAX MINING REGIMES In deciding what policies are appropriate, it is very important for the Government to maintain a strong dialogue with both the mining industry and other stakeholders – the people. Policies affect both parties and if one of them is not comfortable with a decision, it may lead to instability in the future. Such instability is detrimental to everyone concerned. Meanwhile, investors need to be assured of stable taxes in the future before they decide to invest, without this investment does not occur and the industry declines.
Other countries have shown that a strong reform process can be maintained. Alberta has recently reformed its’ variable rate royalty with strong consultation from the industry and other stakeholders, while offering incumbent firms a
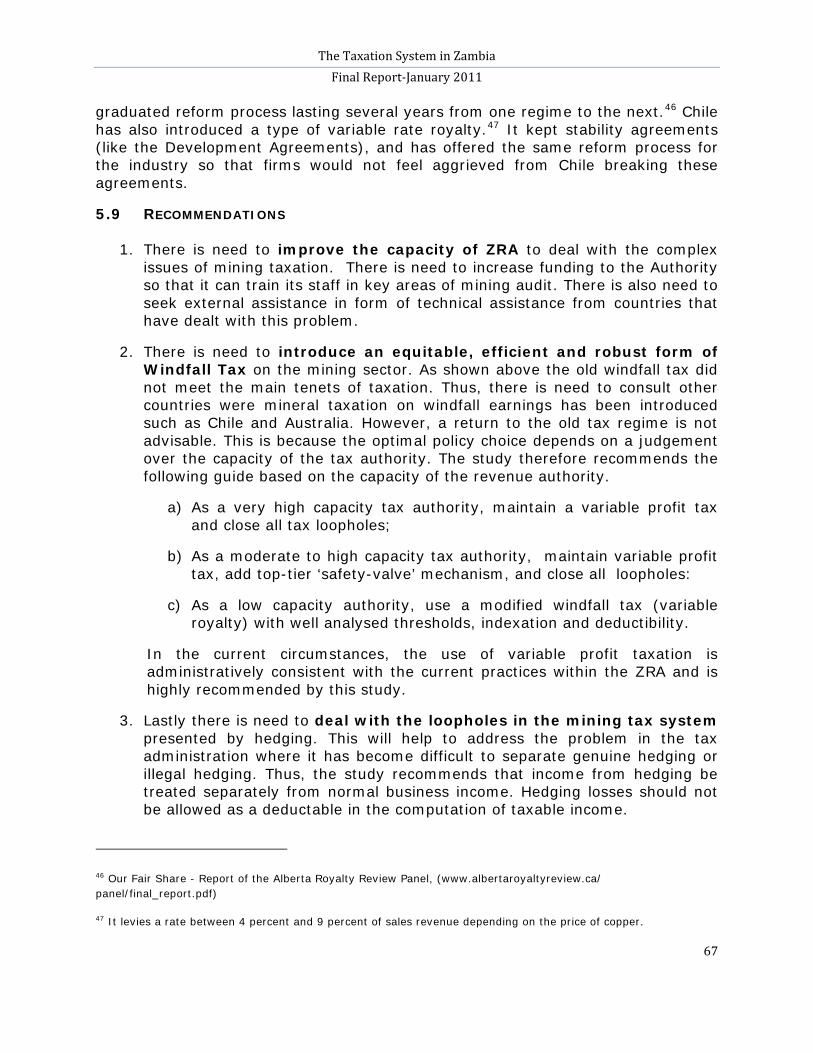
The Taxation System in Zambia Final Report-January 2011
67
graduated reform process lasting several years from one regime to the next.46 Chile has also introduced a type of variable rate royalty.47
5.9 RECOMMENDATIONS
It kept stability agreements (like the Development Agreements), and has offered the same reform process for the industry so that firms would not feel aggrieved from Chile breaking these agreements.
1. There is need to improve the capacity of ZRA to deal with the complex
issues of mining taxation. There is need to increase funding to the Authority so that it can train its staff in key areas of mining audit. There is also need to seek external assistance in form of technical assistance from countries that have dealt with this problem.
2. There is need to introduce an equitable, efficient and robust form of Windfall Tax on the mining sector. As shown above the old windfall tax did not meet the main tenets of taxation. Thus, there is need to consult other countries were mineral taxation on windfall earnings has been introduced such as Chile and Australia. However, a return to the old tax regime is not advisable. This is because the optimal policy choice depends on a judgement over the capacity of the tax authority. The study therefore recommends the following guide based on the capacity of the revenue authority.
a) As a very high capacity tax authority, maintain a variable profit tax and close all tax loopholes;
b) As a moderate to high capacity tax authority, maintain variable profit tax, add top-tier ‘safety-valve’ mechanism, and close all loopholes:
c) As a low capacity authority, use a modified windfall tax (variable royalty) with well analysed thresholds, indexation and deductibility.
In the current circumstances, the use of variable profit taxation is administratively consistent with the current practices within the ZRA and is highly recommended by this study.
3. Lastly there is need to deal with the loopholes in the mining tax system presented by hedging. This will help to address the problem in the tax administration where it has become difficult to separate genuine hedging or illegal hedging. Thus, the study recommends that income from hedging be treated separately from normal business income. Hedging losses should not be allowed as a deductable in the computation of taxable income.
46 Our Fair Share - Report of the Alberta Royalty Review Panel, (www.albertaroyaltyreview.ca/ panel/final_report.pdf)
47 It levies a rate between 4 percent and 9 percent of sales revenue depending on the price of copper.
The Taxation System in Zambia Final Report-January 2011
68
PART 6 INFORMAL SECTOR TAXATION
Summary of key points
• Despite the growing importance of the informal sector in the economy, its contribution to tax revenue has remained poor.
• Nevertheless, the informal sector presents an opportunity for growing Zambia’s tax base to meet funding requirements for the Government.
• There is enough justification to extend taxation to the informal sector to enhance tax revenue productivity and attain equity in bearing the tax burden.
• The lack of formal sector jobs and the high costs of doing business in the formal sector has greatly contributed to the growth of the informal sector.
• Zambia has in place a presumptive tax regime for the informal sector that is simplified and aims to deal with factors hindering the participation of the informal sector in taxation.
• However, the performance of these taxes have not been impressive due to several challenges that need to be addressed.
• The key challenges in informal sector taxation are: o a cash-based economy that reduces ability to audit transactions; o lack of resources or skills for proper record keeping; o the labour intensive nature of tax administration; o bias towards cost effective taxation of the formal sector; and o susceptibility to political interference.
• To improve informal sector taxation, the following recommendations are
made:
o contract out tax administration responsibilities to local councils; o reduce business fees and levies imposed by local councils; o use peer pressure mechanisms to collect taxes ;and o undertake innovative strategies for taxpayer education and
services.
The Taxation System in Zambia Final Report-January 2011
69
6.1 INTRODUCTION Part 6 discusses the challenges of informal sector taxation in Zambia. The motivation for the analysis is Zambia’s continued over reliance on formal sector taxation to raise revenue despite a growing informal sector. This Part presents a descriptive analysis of the state of informal sector taxation in Zambia and starts by defining the informal sector, its’ structure, conduct and size. Later, the discussion focuses on the performance and challenges faced in informal sector taxation. To conclude this Part, the study makes recommendations on the best options for taxing the informal sector.
6.2 DEFINITION OF THE INFORMAL SECTOR AND RATIONALE FOR TAXATION In this study, the term informal sector is broadly defined as small and medium businesses regardless of whether they are within or outside the established control structures such as Patent and Company Registration Agency (PACRA), National Pension Scheme Authority (NAPSA), and ZRA. Thus, for the purpose of this study, the informal sector includes the vast majority of individuals and firms involved in subsistence or near subsistence activities; and those that deliberately avoid inclusion in the formal tax and levy systems.
There are various arguments on who should rightfully be in the informal sector and who should not. Based on poverty considerations, it is commonly argued that formalizing the subsistence and collecting taxes from them may drive them further into poverty. Others argue that individuals and firms involved in businesses and generating income, but deliberating not within established control structures, must be taxed equitably as others in same categories. Without doubt, for both the subsistence population and those in businesses, some form of formalization can be beneficial to the economy. For the subsistence population, provisions of skills such as basic record keeping can provide a major step towards graduating them into mainstream formal businesses. On the other hand, for those in business but not yet formalized, it is important to understand and address the factors that hinder them from becoming formalized. Reducing informality is beneficial to the country as it makes it possible to have access to untapped tax revenue and also reduces the inequitable burden of taxation on formal firms and employees.
With respect to Zambia, despite the growing importance of the informal sector in the economy its contribution to tax revenue has been poor. There are several reasons that have sparked interest in informal sector taxation in Zambia. Firstly, Zambia is struggling to raise the necessary resources to finance the ever-growing demand for social services, such as, water, education and health. It is estimated that the demand for social services in Zambia will continue growing as the population keeps rising by an average birth rate of 3 percent in the last five years.48
48 CSO, 2010
The Taxation System in Zambia Final Report-January 2011
70
In addition, Zambia’s population has more than doubled over the last 30 years rising from 5.7 million in 1980 to over 13.2 million estimated for 2010.49
Secondly, in as much as the revenue system is contributing fairly to the national budget, total domestic revenues are not sufficient to wipe out budget deficits. Consequently, the Government has continued to register budget deficits averaging five percent of GDP over the last five years.
50
There is, therefore, enough justification to extend taxation to the informal sector to enhance tax revenue productivity and attain equity in bearing the tax burden. Stakeholders have argued that failure to capture Small Medium Enterprises (SMEs) into the tax net has resulted in a heavy tax burden on the few taxpayers in the formal sector as well as compromising or discouraging compliance of those who are in the tax net. In their joint 2010 Budget submission to Government, JCTR-CSPR-Caritas stated as follows: “…Government will require courageous and innovative ways to raise revenue from the informal sector… to lessen the burden on the already overtaxed formal sector.”.
It is in this regard that the informal sector presents an opportunity for growing Zambia’s tax base to meet the ever-growing demand for social services and development in general.
51 In the 2004 budget speech, when introducing the presumptive tax regime for the informal sector,52 the then Minister of Finance and National Planning called for increased informal sector taxation as it was the engine of growth. In a recent article entitled “Tax the informal sector, urges RB” President Banda urged the ZRA “…to capture the informal sector because it had the potential to contribute to the treasury and mitigate the burden on the formal sector”.53
It is also justified to tax the informal sector because non-taxation results in distortion of economic activities by attracting entrepreneurs to activities they would not have gone into if full tax obligations were applied.
54 Another important reason that has justified the need to extend taxation to the informal sector has been the theoretical argument that improved tax collection in this sector has a positive impact on the general tax compliance in society. In his paper, Terkper (2003) notes that ignoring informal sector activities will lower compliance morale and increase the risk of generalised non-compliance.55 Alm et al. (2003) also found that the higher the size of the informal sector, the lower the compliance rate. Further, there is evidence from Latin America suggesting that tax compliance in the formal sector is higher in countries that have a relatively small informal sector.56
Table 6.1 shows that the countries with a large informal sector tend to have a lower tax to GDP ratio or lower tax productivity than those with a smaller informal sector.
49 Census Report 2000, CSO website 50 ZRA annual report, 2008 51 Press release, 5th August 2009 52 MFNP, 2003 Budget 53 Times of Zambia, 2/04/2010 54 Stern, 2006 55 Terkper, 2003 56 Torgler, 2003
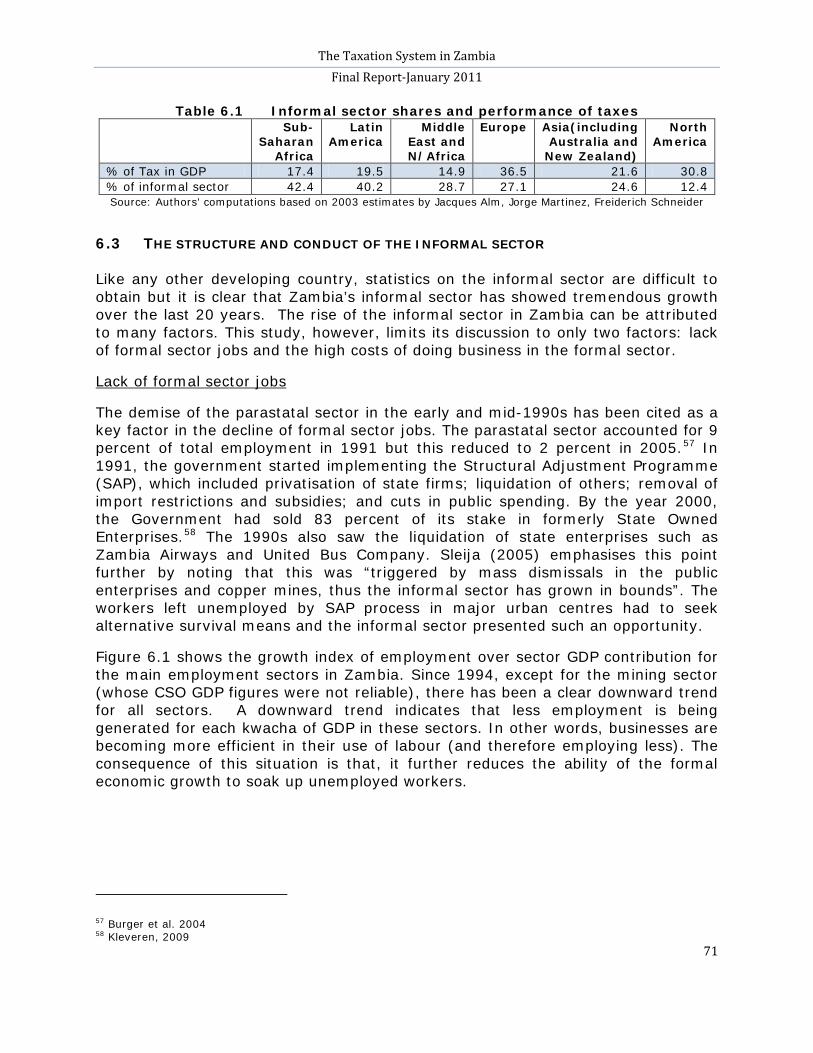
The Taxation System in Zambia Final Report-January 2011
71
Table 6.1 Informal sector shares and performance of taxes Sub-
Saharan Africa
Latin America
Middle East and N/Africa
Europe Asia(including Australia and
New Zealand)
North America
% of Tax in GDP 17.4 19.5 14.9 36.5 21.6 30.8 % of informal sector 42.4 40.2 28.7 27.1 24.6 12.4 Source: Authors’ computations based on 2003 estimates by Jacques Alm, Jorge Martinez, Freiderich Schneider
6.3 THE STRUCTURE AND CONDUCT OF THE INFORMAL SECTOR Like any other developing country, statistics on the informal sector are difficult to obtain but it is clear that Zambia’s informal sector has showed tremendous growth over the last 20 years. The rise of the informal sector in Zambia can be attributed to many factors. This study, however, limits its discussion to only two factors: lack of formal sector jobs and the high costs of doing business in the formal sector.
The demise of the parastatal sector in the early and mid-1990s has been cited as a key factor in the decline of formal sector jobs. The parastatal sector accounted for 9 percent of total employment in 1991 but this reduced to 2 percent in 2005.
Lack of formal sector jobs
57 In 1991, the government started implementing the Structural Adjustment Programme (SAP), which included privatisation of state firms; liquidation of others; removal of import restrictions and subsidies; and cuts in public spending. By the year 2000, the Government had sold 83 percent of its stake in formerly State Owned Enterprises.58
Figure 6.1 shows the growth index of employment over sector GDP contribution for the main employment sectors in Zambia. Since 1994, except for the mining sector (whose CSO GDP figures were not reliable), there has been a clear downward trend for all sectors. A downward trend indicates that less employment is being generated for each kwacha of GDP in these sectors. In other words, businesses are becoming more efficient in their use of labour (and therefore employing less). The consequence of this situation is that, it further reduces the ability of the formal economic growth to soak up unemployed workers.
The 1990s also saw the liquidation of state enterprises such as Zambia Airways and United Bus Company. Sleija (2005) emphasises this point further by noting that this was “triggered by mass dismissals in the public enterprises and copper mines, thus the informal sector has grown in bounds”. The workers left unemployed by SAP process in major urban centres had to seek alternative survival means and the informal sector presented such an opportunity.
57 Burger et al. 2004 58 Kleveren, 2009
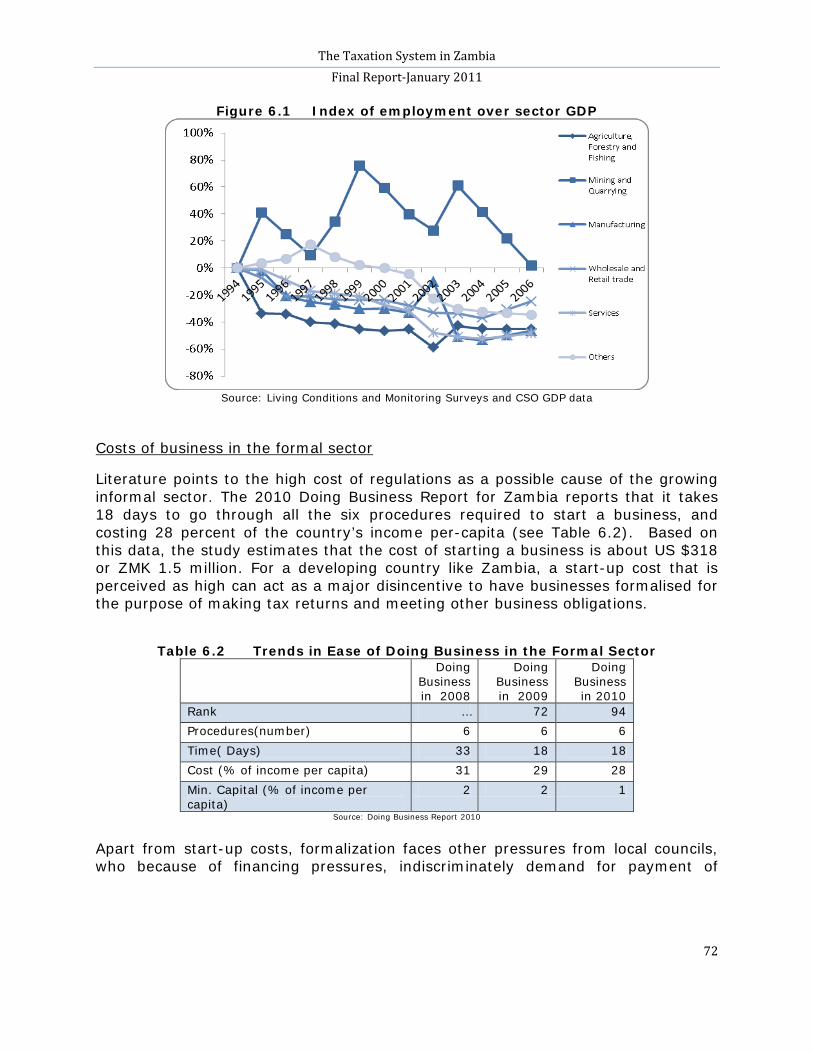
The Taxation System in Zambia Final Report-January 2011
72
Figure 6.1 Index of employment over sector GDP
Source: Living Conditions and Monitoring Surveys and CSO GDP data
Literature points to the high cost of regulations as a possible cause of the growing informal sector. The 2010 Doing Business Report for Zambia reports that it takes 18 days to go through all the six procedures required to start a business, and costing 28 percent of the country’s income per-capita (see Table 6.2). Based on this data, the study estimates that the cost of starting a business is about US $318 or ZMK 1.5 million. For a developing country like Zambia, a start-up cost that is perceived as high can act as a major disincentive to have businesses formalised for the purpose of making tax returns and meeting other business obligations.
Costs of business in the formal sector
Table 6.2 Trends in Ease of Doing Business in the Formal Sector
Doing Business in 2008
Doing Business in 2009
Doing Business in 2010
Rank … 72 94 Procedures(number) 6 6 6 Time( Days) 33 18 18 Cost (% of income per capita) 31 29 28 Min. Capital (% of income per capita)
2 2 1
Source: Doing Business Report 2010
Apart from start-up costs, formalization faces other pressures from local councils, who because of financing pressures, indiscriminately demand for payment of
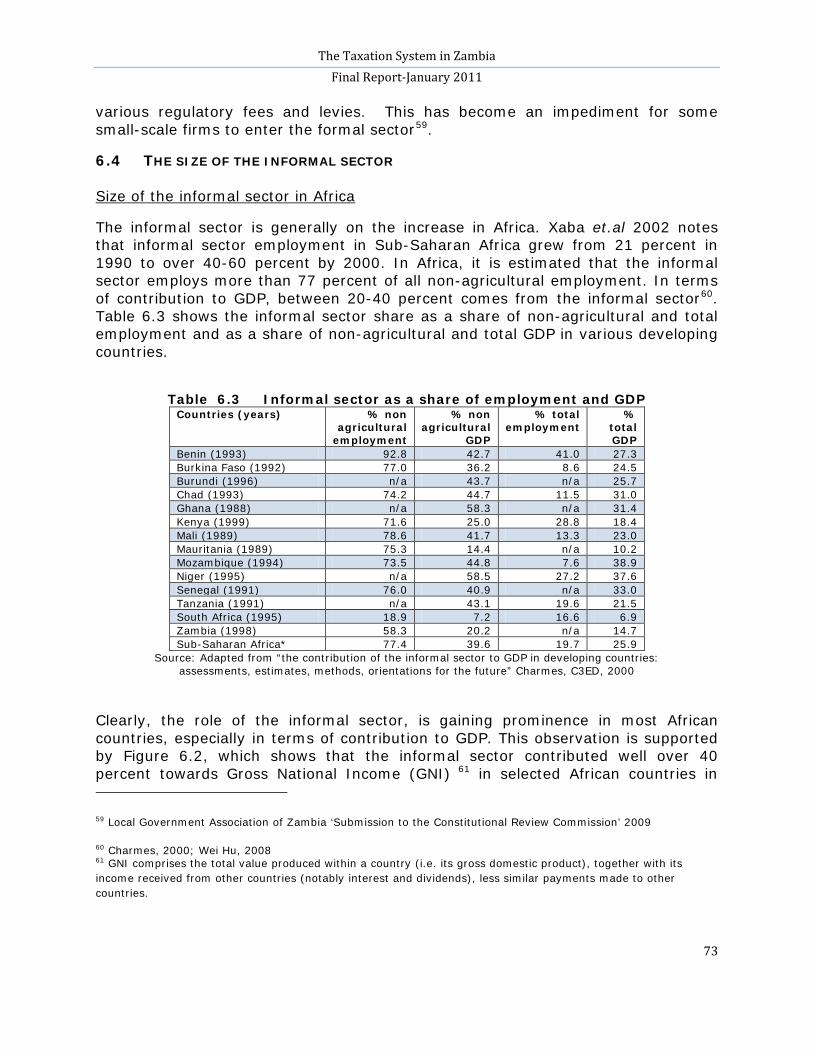
The Taxation System in Zambia Final Report-January 2011
73
various regulatory fees and levies. This has become an impediment for some small-scale firms to enter the formal sector59
6.4 THE SIZE OF THE INFORMAL SECTOR
.
The informal sector is generally on the increase in Africa. Xaba et.al 2002 notes that informal sector employment in Sub-Saharan Africa grew from 21 percent in 1990 to over 40-60 percent by 2000. In Africa, it is estimated that the informal sector employs more than 77 percent of all non-agricultural employment. In terms of contribution to GDP, between 20-40 percent comes from the informal sector
Size of the informal sector in Africa
60
. Table 6.3 shows the informal sector share as a share of non-agricultural and total employment and as a share of non-agricultural and total GDP in various developing countries.
Table 6.3 Informal sector as a share of employment and GDP Countries (years) % non
agricultural employment
% non agricultural
GDP
% total employment
% total GDP
Benin (1993) 92.8 42.7 41.0 27.3 Burkina Faso (1992) 77.0 36.2 8.6 24.5 Burundi (1996) n/a 43.7 n/a 25.7 Chad (1993) 74.2 44.7 11.5 31.0 Ghana (1988) n/a 58.3 n/a 31.4 Kenya (1999) 71.6 25.0 28.8 18.4 Mali (1989) 78.6 41.7 13.3 23.0 Mauritania (1989) 75.3 14.4 n/a 10.2 Mozambique (1994) 73.5 44.8 7.6 38.9 Niger (1995) n/a 58.5 27.2 37.6 Senegal (1991) 76.0 40.9 n/a 33.0 Tanzania (1991) n/a 43.1 19.6 21.5 South Africa (1995) 18.9 7.2 16.6 6.9 Zambia (1998) 58.3 20.2 n/a 14.7 Sub-Saharan Africa* 77.4 39.6 19.7 25.9
Source: Adapted from “the contribution of the informal sector to GDP in developing countries: assessments, estimates, methods, orientations for the future” Charmes, C3ED, 2000
Clearly, the role of the informal sector, is gaining prominence in most African countries, especially in terms of contribution to GDP. This observation is supported by Figure 6.2, which shows that the informal sector contributed well over 40 percent towards Gross National Income (GNI) 61
59 Local Government Association of Zambia ‘Submission to the Constitutional Review Commission’ 2009
in selected African countries in
60 Charmes, 2000; Wei Hu, 2008 61 GNI comprises the total value produced within a country (i.e. its gross domestic product), together with its income received from other countries (notably interest and dividends), less similar payments made to other countries.
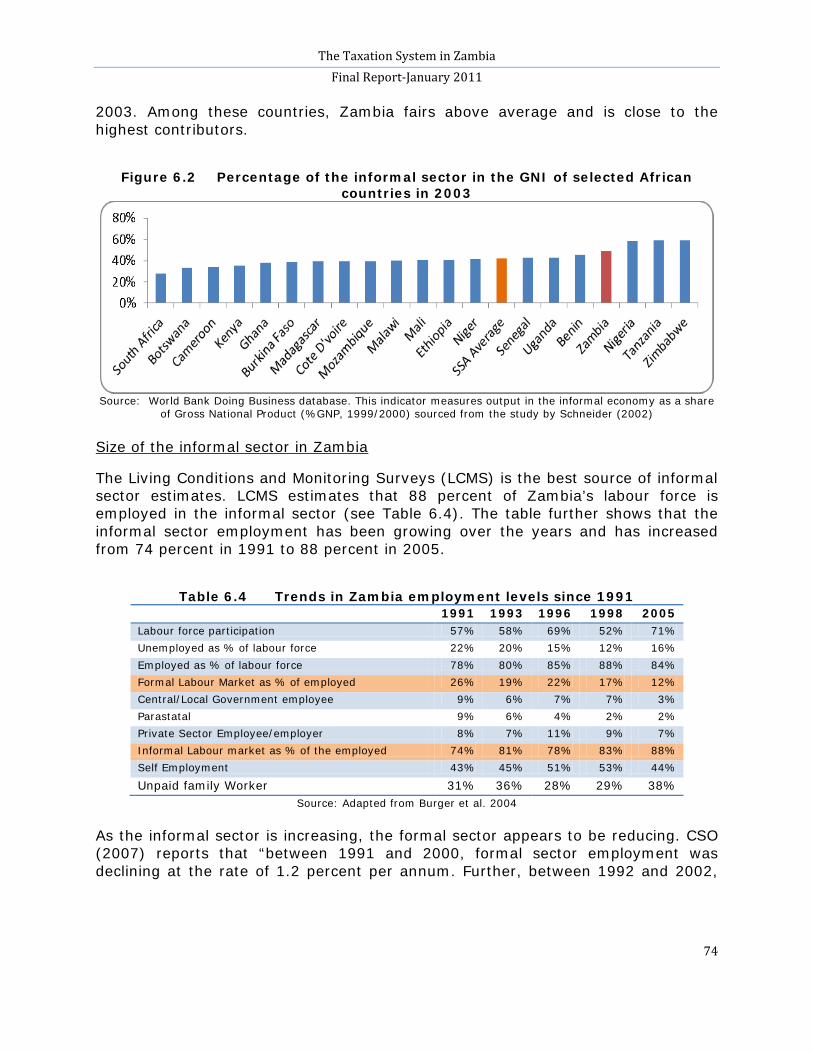
The Taxation System in Zambia Final Report-January 2011
74
2003. Among these countries, Zambia fairs above average and is close to the highest contributors.
Figure 6.2 Percentage of the informal sector in the GNI of selected African
countries in 2003
Source: World Bank Doing Business database. This indicator measures output in the informal economy as a share
of Gross National Product (%GNP, 1999/2000) sourced from the study by Schneider (2002)
The Living Conditions and Monitoring Surveys (LCMS) is the best source of informal sector estimates. LCMS estimates that 88 percent of Zambia’s labour force is employed in the informal sector (see Table 6.4). The table further shows that the informal sector employment has been growing over the years and has increased from 74 percent in 1991 to 88 percent in 2005.
Size of the informal sector in Zambia
Table 6.4 Trends in Zambia employment levels since 1991
1991 1993 1996 1998 2005 Labour force participation 57% 58% 69% 52% 71% Unemployed as % of labour force 22% 20% 15% 12% 16% Employed as % of labour force 78% 80% 85% 88% 84% Formal Labour Market as % of employed 26% 19% 22% 17% 12% Central/Local Government employee 9% 6% 7% 7% 3% Parastatal 9% 6% 4% 2% 2% Private Sector Employee/employer 8% 7% 11% 9% 7% Informal Labour market as % of the employed 74% 81% 78% 83% 88% Self Employment 43% 45% 51% 53% 44%
Unpaid family Worker 31% 36% 28% 29% 38% Source: Adapted from Burger et al. 2004
As the informal sector is increasing, the formal sector appears to be reducing. CSO (2007) reports that “between 1991 and 2000, formal sector employment was declining at the rate of 1.2 percent per annum. Further, between 1992 and 2002,
The Taxation System in Zambia Final Report-January 2011
75
formal employment fell from 600,000 workers to a low of 450,000”62
The last time unemployment was measured in Zambia, was through the CSO 2007 Labour Force Survey which estimated an overall unemployment rate of 16 percent (the share of the labour force that was unemployed in the last seven days), compared with 10 percent measured in 1999. Gill, Fruitman and Dar (2000) estimated that in 1993, Zambia had two million people employed in the informal sector while only about 600,000 were in the formal sector. Another study by Maarten van Klaveren et.al (2009) estimated 3.6 million as the size of the informal sector in 2005. Based on past studies and using a population growth rate of 3 percent this study approximates the size to have grown to around 4 million by 2009.
. Muuka, G (2004) demonstrated that, in recent years, employment has declined in the key sectors of mining and manufacturing and the generation of real jobs in the economy has continued to lag behind the growth in the labour force. The Global Policy Network (2001) notes that, since the early 1990s, the trend in the formal sector employment has declined. Further, in 1997, out of a total labour force estimated at 4.2 million workers, only 11 percent were employed in the formal sector. The remaining 89 percent of the labour force was either unemployed or employed in the informal sector. Other researchers, Charmes (2000), estimated that the informal sector employs about 58.3 percent Zambians in non-agricultural employment.
The evidence presented above confirms that the informal sector employment has been growing while the formal sector employment has been shrinking. CSO (1993) estimated that about 122,500 young people in the country enter the labour market every year without any hope of finding gainful employment. The informal sector is therefore absorbing most of the new entrants. Further evidence of the growing importance of the informal sector can be seen in the proliferation of informal sector associations representing the various interests of their members in various locations. Table 6.5 shows a sample of some of the informal sector representative organisations and their membership.
The large membership for some associations, like Zambia Chamber of Small and Medium Business Association (ZCSMBA), and the diverse interests and geographical spread emphasise the fact that the informal sector is growing across the country. Zambia’s informal sector has become large and diverse spanning activities such as fishing, mining, manufacturing, construction, transportation, hair salons, retail trading, subsistence farming, car repairing, selling vegetables, music, tailoring, carpentry etc.63
62 CSO labour Survey of 2007
63 Koyi, 2006
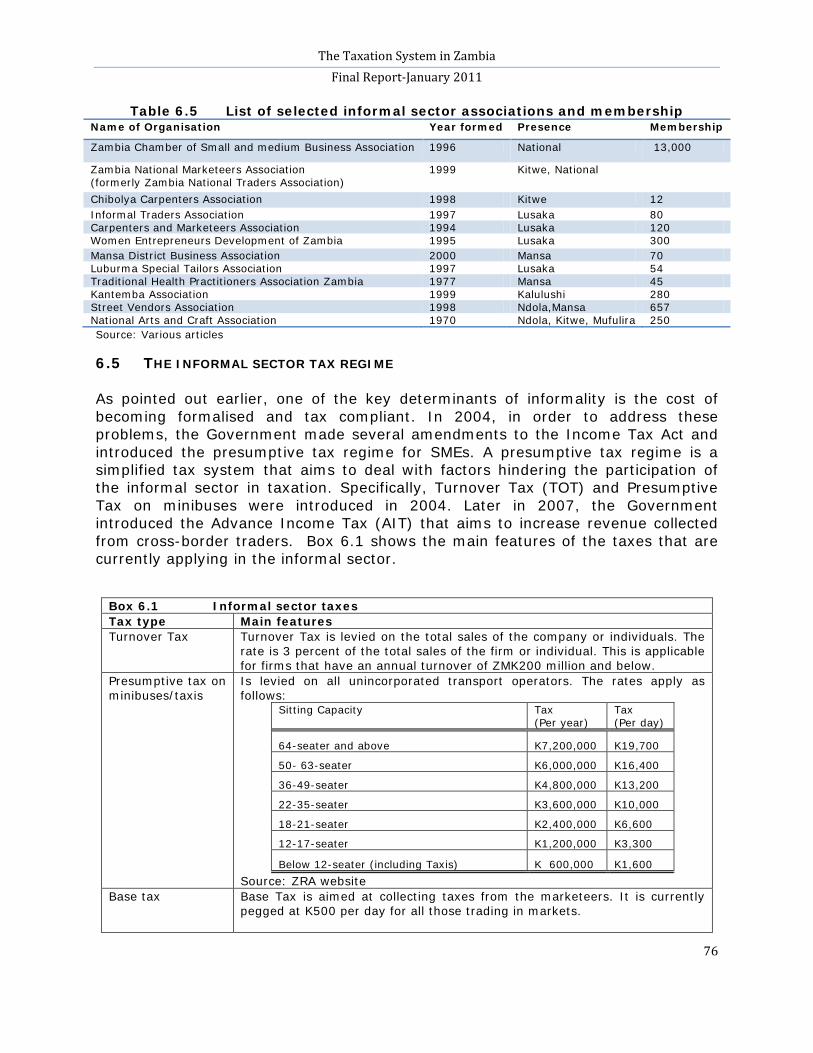
The Taxation System in Zambia Final Report-January 2011
76
Table 6.5 List of selected informal sector associations and membership Name of Organisation Year formed Presence Membership
Zambia Chamber of Small and medium Business Association 1996 National 13,000
Zambia National Marketeers Association (formerly Zambia National Traders Association)
1999 Kitwe, National
Chibolya Carpenters Association 1998 Kitwe 12 Informal Traders Association 1997 Lusaka 80 Carpenters and Marketeers Association 1994 Lusaka 120 Women Entrepreneurs Development of Zambia 1995 Lusaka 300 Mansa District Business Association 2000 Mansa 70 Luburma Special Tailors Association 1997 Lusaka 54 Traditional Health Practitioners Association Zambia 1977 Mansa 45 Kantemba Association 1999 Kalulushi 280 Street Vendors Association 1998 Ndola,Mansa 657 National Arts and Craft Association 1970 Ndola, Kitwe, Mufulira 250 Source: Various articles
6.5 THE INFORMAL SECTOR TAX REGIME As pointed out earlier, one of the key determinants of informality is the cost of becoming formalised and tax compliant. In 2004, in order to address these problems, the Government made several amendments to the Income Tax Act and introduced the presumptive tax regime for SMEs. A presumptive tax regime is a simplified tax system that aims to deal with factors hindering the participation of the informal sector in taxation. Specifically, Turnover Tax (TOT) and Presumptive Tax on minibuses were introduced in 2004. Later in 2007, the Government introduced the Advance Income Tax (AIT) that aims to increase revenue collected from cross-border traders. Box 6.1 shows the main features of the taxes that are currently applying in the informal sector.
Box 6.1 Informal sector taxes Tax type Main features Turnover Tax Turnover Tax is levied on the total sales of the company or individuals. The
rate is 3 percent of the total sales of the firm or individual. This is applicable for firms that have an annual turnover of ZMK200 million and below.
Presumptive tax on minibuses/taxis
Is levied on all unincorporated transport operators. The rates apply as follows:
Sitting Capacity Tax (Per year)
Tax (Per day)
64-seater and above K7,200,000 K19,700
50- 63-seater K6,000,000 K16,400
36-49-seater K4,800,000 K13,200
22-35-seater K3,600,000 K10,000
18-21-seater K2,400,000 K6,600
12-17-seater K1,200,000 K3,300
Below 12-seater (including Taxis) K 600,000 K1,600 Source: ZRA website
Base tax Base Tax is aimed at collecting taxes from the marketeers. It is currently pegged at K500 per day for all those trading in markets.
The Taxation System in Zambia Final Report-January 2011
77
Advance Income Tax (AIT).
Lastly, the country also has for the last three years implemented the advance income tax. The advance income tax is specifically targeted at the cross border traders and it is levied at 6 percent. It is a tax charged on all imports of unregistered or partially compliant with value exceeding US $500. The tax is designed in such a way that the individuals are given a leeway to claim the tax if they file in their annual returns or to consider it as a final tax.
Presumptive tax on mini buses and taxis
For presumptive taxes, firms or individuals are supposed to file an annual tax return to ZRA. However, taxpayers are also allowed to make regular payments, and these remittances can be monthly or quarterly. This has been done to help firms who may experience cash flow problems should they require a huge lump sum payment at the end of the income tax year. Agents appointed by the ZRA administer the presumptive tax on minibuses/taxis and base tax. For this, agents are paid a commission and they have no further powers apart from collecting revenue. The agents are selected through a competitive tender process and they are paid a commission rate commensurate with their bid. The commission rates range from 10 percent to 15 percent of collections. To make compliance easy, ZRA designed the tax in such a way that operators are allowed to pay a fixed amount each day the bus is in operation. To simplify the tax, taxpayers are not required to file in any tax return.
Turnover tax
For TOT, the three percent charged on a firm’s turnover is a final tax to make compliance easy for the taxpayers. Thus, firms are not necessarily required to keep strict books of accounts in order to determine their profit but they are only required to keep track of their total sales.
Advance Income Tax
AIT is levied at six percent of Value for Duty Purposes (VDP) but is not a final tax. It is charged on all imports with value exceeding US $500 declared by importers / individuals who are not registered with ZRA or who have no evidence of paying in-land taxes. The tax is designed in such a way that the individuals are given a leeway to claim the tax, at the end of each charge year, if they file in their annual returns or they get registered. This tax aims to address tax evasion by commercial importers who are not registered for taxes in-land.
6.6 THE PERFORMANCE OF INFORMAL SECTOR TAXES
Since the introduction of informal sector taxes in 2004, the performance has been upward. In 2004, ZRA collected K5.4 billion, which rose to K15.0 billion in 2006 and K90.9 billion in 2009. As a share of total income tax collection, the informal sector contributed 0.3 percent to total income tax in 2004; reaching 0.9 percent in 2007 and rose to 1.8 percent in 2009 (see Table 6.6).
Contribution of informal sector taxes
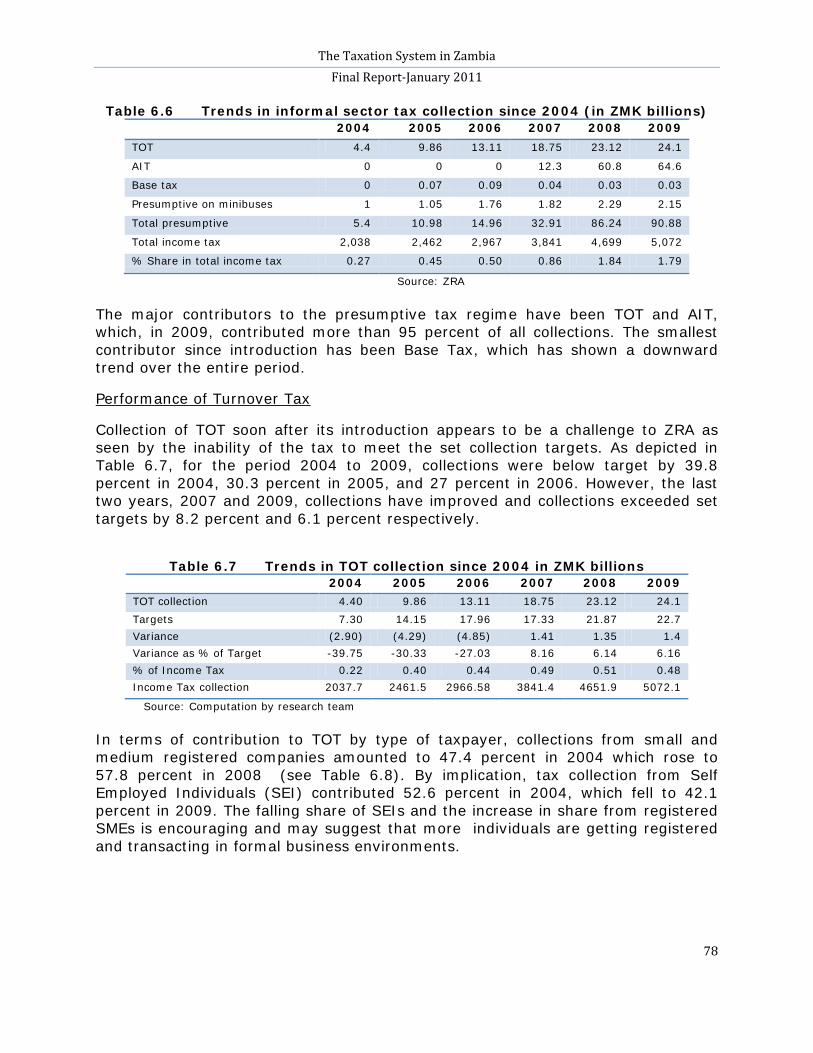
The Taxation System in Zambia Final Report-January 2011
78
Table 6.6 Trends in informal sector tax collection since 2004 (in ZMK billions) 2004 2005 2006 2007 2008 2009 TOT 4.4 9.86 13.11 18.75 23.12 24.1
AIT 0 0 0 12.3 60.8 64.6
Base tax 0 0.07 0.09 0.04 0.03 0.03
Presumptive on minibuses 1 1.05 1.76 1.82 2.29 2.15
Total presumptive 5.4 10.98 14.96 32.91 86.24 90.88
Total income tax 2,038 2,462 2,967 3,841 4,699 5,072
% Share in total income tax 0.27 0.45 0.50 0.86 1.84 1.79
Source: ZRA The major contributors to the presumptive tax regime have been TOT and AIT, which, in 2009, contributed more than 95 percent of all collections. The smallest contributor since introduction has been Base Tax, which has shown a downward trend over the entire period.
Collection of TOT soon after its introduction appears to be a challenge to ZRA as seen by the inability of the tax to meet the set collection targets. As depicted in Table 6.7, for the period 2004 to 2009, collections were below target by 39.8 percent in 2004, 30.3 percent in 2005, and 27 percent in 2006. However, the last two years, 2007 and 2009, collections have improved and collections exceeded set targets by 8.2 percent and 6.1 percent respectively.
Performance of Turnover Tax
Table 6.7 Trends in TOT collection since 2004 in ZMK billions
2004 2005 2006 2007 2008 2009 TOT collection 4.40 9.86 13.11 18.75 23.12 24.1 Targets 7.30 14.15 17.96 17.33 21.87 22.7 Variance (2.90) (4.29) (4.85) 1.41 1.35 1.4 Variance as % of Target -39.75 -30.33 -27.03 8.16 6.14 6.16 % of Income Tax 0.22 0.40 0.44 0.49 0.51 0.48 Income Tax collection 2037.7 2461.5 2966.58 3841.4 4651.9 5072.1
Source: Computation by research team In terms of contribution to TOT by type of taxpayer, collections from small and medium registered companies amounted to 47.4 percent in 2004 which rose to 57.8 percent in 2008 (see Table 6.8). By implication, tax collection from Self Employed Individuals (SEI) contributed 52.6 percent in 2004, which fell to 42.1 percent in 2009. The falling share of SEIs and the increase in share from registered SMEs is encouraging and may suggest that more individuals are getting registered and transacting in formal business environments.
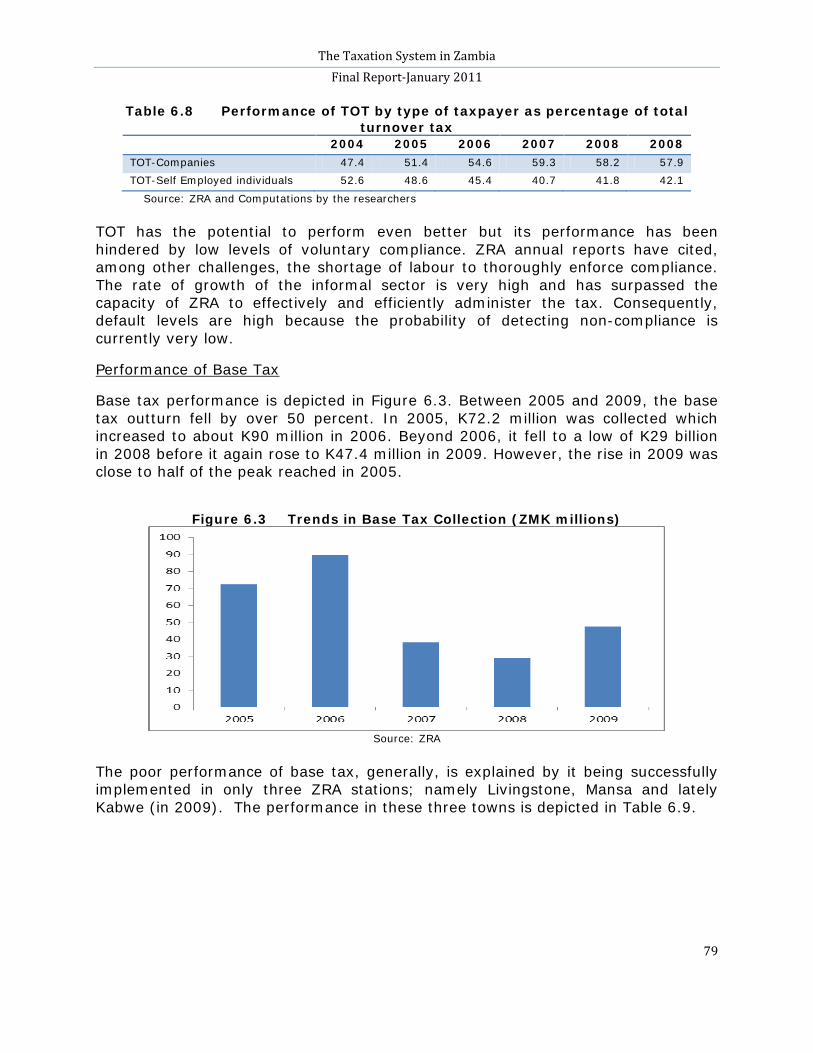
The Taxation System in Zambia Final Report-January 2011
79
Table 6.8 Performance of TOT by type of taxpayer as percentage of total turnover tax
2004 2005 2006 2007 2008 2008 TOT-Companies 47.4 51.4 54.6 59.3 58.2 57.9 TOT-Self Employed individuals 52.6 48.6 45.4 40.7 41.8 42.1
Source: ZRA and Computations by the researchers TOT has the potential to perform even better but its performance has been hindered by low levels of voluntary compliance. ZRA annual reports have cited, among other challenges, the shortage of labour to thoroughly enforce compliance. The rate of growth of the informal sector is very high and has surpassed the capacity of ZRA to effectively and efficiently administer the tax. Consequently, default levels are high because the probability of detecting non-compliance is currently very low.
Base tax performance is depicted in Figure 6.3. Between 2005 and 2009, the base tax outturn fell by over 50 percent. In 2005, K72.2 million was collected which increased to about K90 million in 2006. Beyond 2006, it fell to a low of K29 billion in 2008 before it again rose to K47.4 million in 2009. However, the rise in 2009 was close to half of the peak reached in 2005.
Performance of Base Tax
Figure 6.3 Trends in Base Tax Collection (ZMK millions)
Source: ZRA
The poor performance of base tax, generally, is explained by it being successfully implemented in only three ZRA stations; namely Livingstone, Mansa and lately Kabwe (in 2009). The performance in these three towns is depicted in Table 6.9.
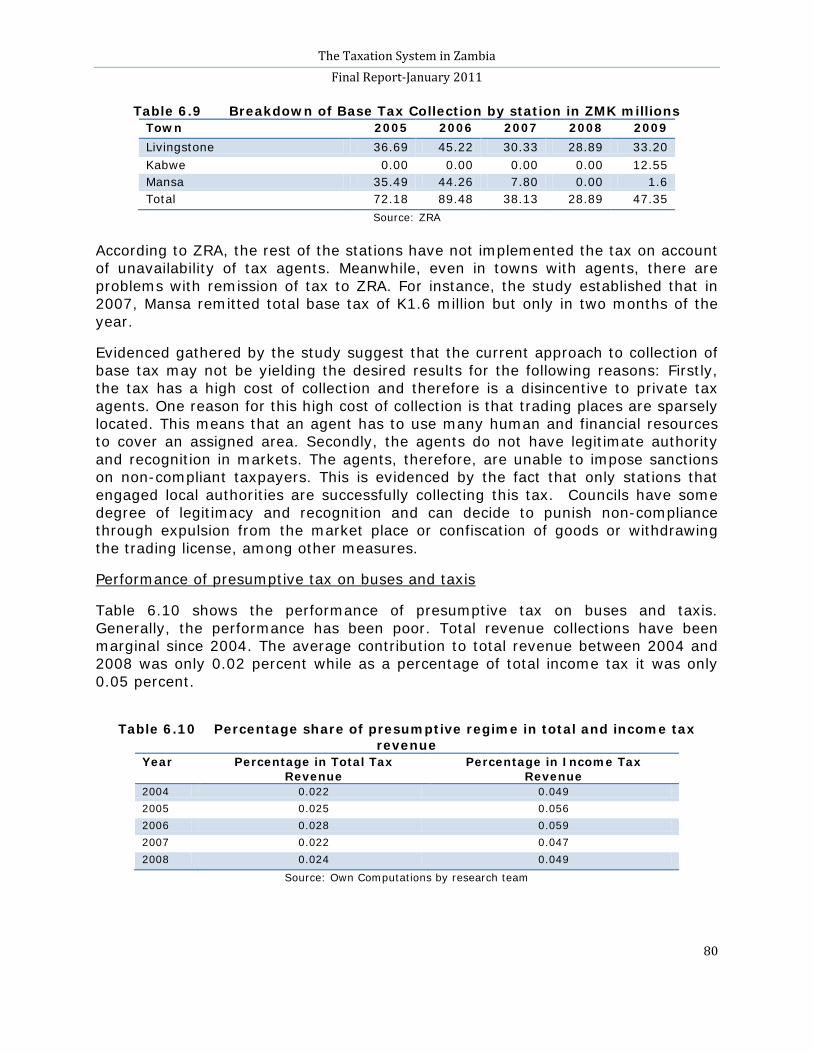
The Taxation System in Zambia Final Report-January 2011
80
Table 6.9 Breakdown of Base Tax Collection by station in ZMK millions Town 2005 2006 2007 2008 2009 Livingstone 36.69 45.22 30.33 28.89 33.20 Kabwe 0.00 0.00 0.00 0.00 12.55 Mansa 35.49 44.26 7.80 0.00 1.6 Total 72.18 89.48 38.13 28.89 47.35
Source: ZRA According to ZRA, the rest of the stations have not implemented the tax on account of unavailability of tax agents. Meanwhile, even in towns with agents, there are problems with remission of tax to ZRA. For instance, the study established that in 2007, Mansa remitted total base tax of K1.6 million but only in two months of the year.
Evidenced gathered by the study suggest that the current approach to collection of base tax may not be yielding the desired results for the following reasons: Firstly, the tax has a high cost of collection and therefore is a disincentive to private tax agents. One reason for this high cost of collection is that trading places are sparsely located. This means that an agent has to use many human and financial resources to cover an assigned area. Secondly, the agents do not have legitimate authority and recognition in markets. The agents, therefore, are unable to impose sanctions on non-compliant taxpayers. This is evidenced by the fact that only stations that engaged local authorities are successfully collecting this tax. Councils have some degree of legitimacy and recognition and can decide to punish non-compliance through expulsion from the market place or confiscation of goods or withdrawing the trading license, among other measures.
Table 6.10 shows the performance of presumptive tax on buses and taxis. Generally, the performance has been poor. Total revenue collections have been marginal since 2004. The average contribution to total revenue between 2004 and 2008 was only 0.02 percent while as a percentage of total income tax it was only 0.05 percent.
Performance of presumptive tax on buses and taxis
Table 6.10 Percentage share of presumptive regime in total and income tax
revenue Year Percentage in Total Tax
Revenue Percentage in Income Tax
Revenue 2004 0.022 0.049 2005 0.025 0.056 2006 0.028 0.059 2007 0.022 0.047 2008 0.024 0.049
Source: Own Computations by research team
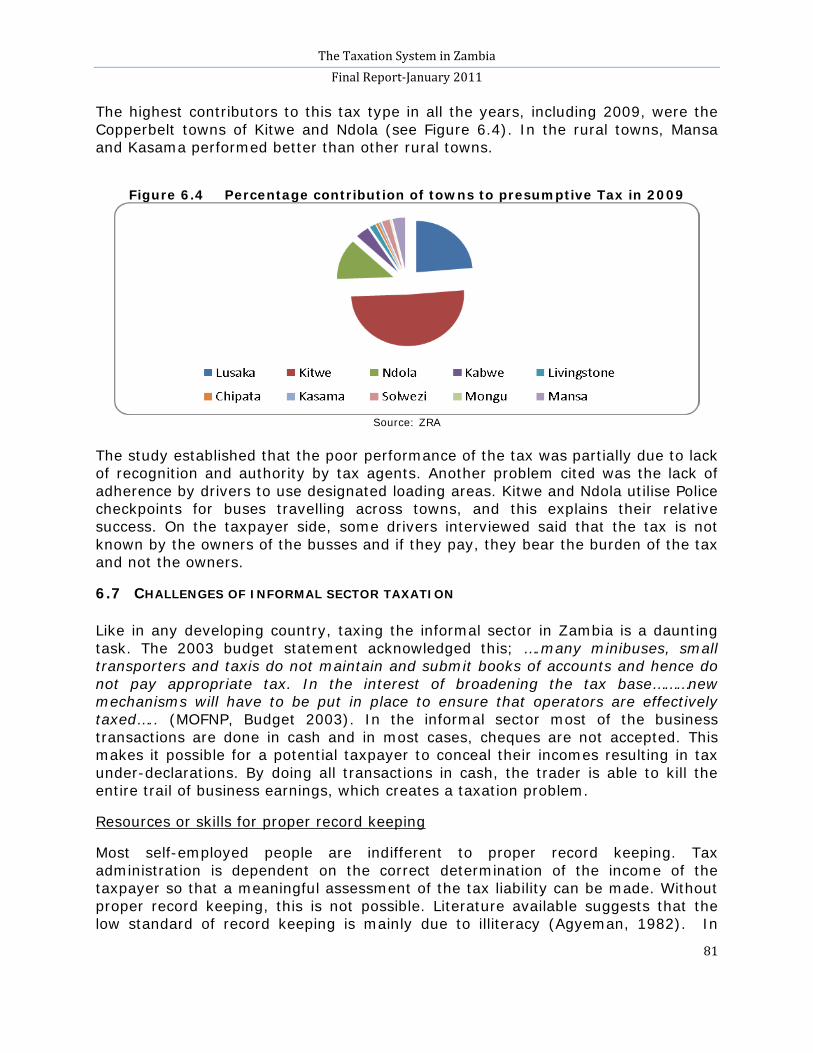
The Taxation System in Zambia Final Report-January 2011
81
The highest contributors to this tax type in all the years, including 2009, were the Copperbelt towns of Kitwe and Ndola (see Figure 6.4). In the rural towns, Mansa and Kasama performed better than other rural towns.
Figure 6.4 Percentage contribution of towns to presumptive Tax in 2009
Source: ZRA
The study established that the poor performance of the tax was partially due to lack of recognition and authority by tax agents. Another problem cited was the lack of adherence by drivers to use designated loading areas. Kitwe and Ndola utilise Police checkpoints for buses travelling across towns, and this explains their relative success. On the taxpayer side, some drivers interviewed said that the tax is not known by the owners of the busses and if they pay, they bear the burden of the tax and not the owners.
6.7 CHALLENGES OF INFORMAL SECTOR TAXATION Like in any developing country, taxing the informal sector in Zambia is a daunting task. The 2003 budget statement acknowledged this; ….many minibuses, small transporters and taxis do not maintain and submit books of accounts and hence do not pay appropriate tax. In the interest of broadening the tax base………new mechanisms will have to be put in place to ensure that operators are effectively taxed….. (MOFNP, Budget 2003). In the informal sector most of the business transactions are done in cash and in most cases, cheques are not accepted. This makes it possible for a potential taxpayer to conceal their incomes resulting in tax under-declarations. By doing all transactions in cash, the trader is able to kill the entire trail of business earnings, which creates a taxation problem.
Most self-employed people are indifferent to proper record keeping. Tax administration is dependent on the correct determination of the income of the taxpayer so that a meaningful assessment of the tax liability can be made. Without proper record keeping, this is not possible. Literature available suggests that the low standard of record keeping is mainly due to illiteracy (Agyeman, 1982). In
Resources or skills for proper record keeping
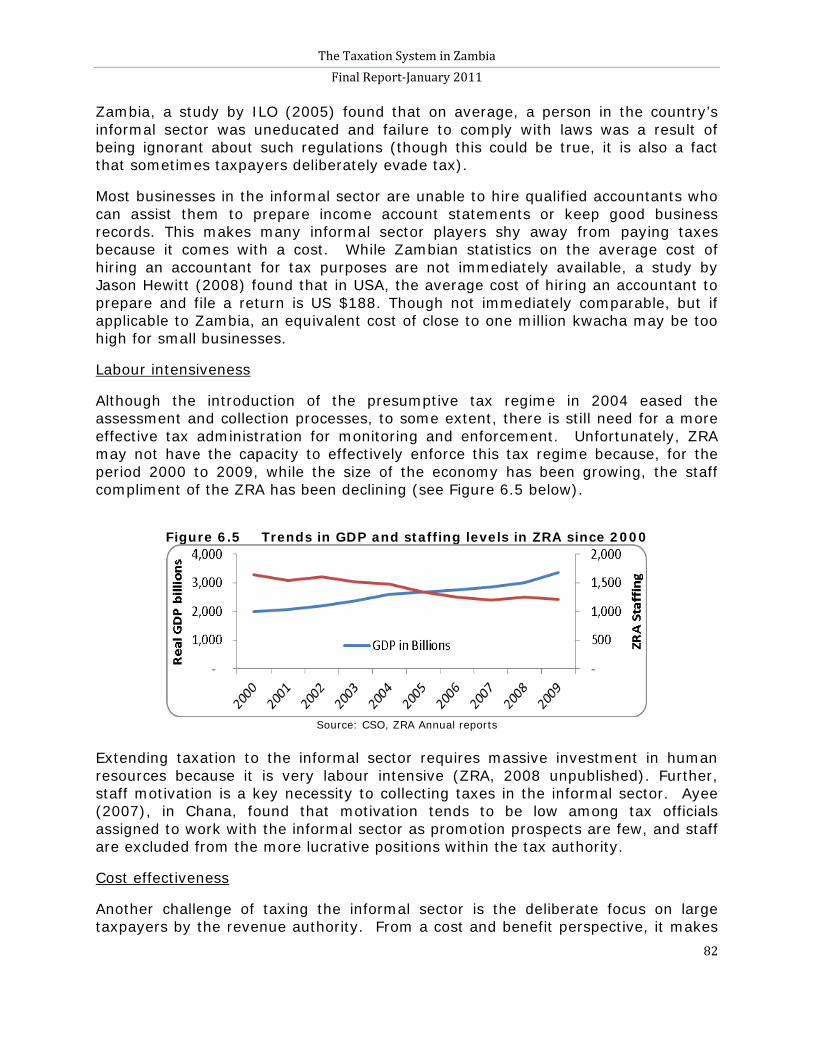
The Taxation System in Zambia Final Report-January 2011
82
Zambia, a study by ILO (2005) found that on average, a person in the country’s informal sector was uneducated and failure to comply with laws was a result of being ignorant about such regulations (though this could be true, it is also a fact that sometimes taxpayers deliberately evade tax).
Most businesses in the informal sector are unable to hire qualified accountants who can assist them to prepare income account statements or keep good business records. This makes many informal sector players shy away from paying taxes because it comes with a cost. While Zambian statistics on the average cost of hiring an accountant for tax purposes are not immediately available, a study by Jason Hewitt (2008) found that in USA, the average cost of hiring an accountant to prepare and file a return is US $188. Though not immediately comparable, but if applicable to Zambia, an equivalent cost of close to one million kwacha may be too high for small businesses.
Although the introduction of the presumptive tax regime in 2004 eased the assessment and collection processes, to some extent, there is still need for a more effective tax administration for monitoring and enforcement. Unfortunately, ZRA may not have the capacity to effectively enforce this tax regime because, for the period 2000 to 2009, while the size of the economy has been growing, the staff compliment of the ZRA has been declining (see Figure 6.5 below).
Labour intensiveness
Figure 6.5 Trends in GDP and staffing levels in ZRA since 2000
Source: CSO, ZRA Annual reports
Extending taxation to the informal sector requires massive investment in human resources because it is very labour intensive (ZRA, 2008 unpublished). Further, staff motivation is a key necessity to collecting taxes in the informal sector. Ayee (2007), in Chana, found that motivation tends to be low among tax officials assigned to work with the informal sector as promotion prospects are few, and staff are excluded from the more lucrative positions within the tax authority.
Another challenge of taxing the informal sector is the deliberate focus on large taxpayers by the revenue authority. From a cost and benefit perspective, it makes
Cost effectiveness
The Taxation System in Zambia Final Report-January 2011
83
sense to concentrate collection efforts on the formal sector especially for a resource-constrained authority. This is because one kwacha of funding can produce more tax revenue when applied to large formal firms than to informal firms. This view was observed by Prichard (2009) who argued that “many large firms consequently complain that they are unfairly targeted by tax administrations that are eager to reach revenue targets and more inclined to pursue readily available large firms than make the effort to tax many smaller firms”.
Another challenge that the tax authorities face in the taxation of the informal sector is the occasional political interference. Without doubt, the informal sector constitutes a substantial vote bank for politicians in Zambia and Africa in general. Consequently, there have been what Tendler (2002) calls the ‘devil’s deal’ that is, an unspoken arrangement between politicians and the informal sector operators: “ …If you vote for me… I will not collect taxes from you; I will not make you comply with other tax, environmental or labour regulations; and I will keep the police and inspectors from harassing you…” (Tendler 2002). Prichard (2009) reported that “the final challenge to informal sector taxation is political. Because low-income taxpayers contribute relatively little revenue, but have a potentially large political voice, politicians have potentially strong incentives to exempt the informal sector from taxation in exchange for political support”. Consequently, public officials and politicians are willing to turn a blind eye to informal activities in order to retain their support base.
Political interference
6.8 RECOMMENDATIONS
1. Contract out administration responsibilities to local councils
Since the administration of some informal sector taxes are too costly in terms of time and human resources, if undertaken solely by the tax authority, the study recommends that such taxes be contracted out. However, these should not be to individual agents but to institutions that have some legitimacy and control such as councils for base tax and Road Transport and Safety Agency (RTSA) for presumptive tax. Based on the study findings, local councils, if given authority to collect this tax, will assist to eliminate the problem of high cost of collection problem as the council have established structures in most of these markets64
. Moreover, most councils have employees or agents who operate from their markets on permanent basis.
64 For example, the Lusaka City Council has established an independent unit called the Lusaka Markets unit (LMU) which specifically controls all market in the City. In addition, they have authority as to who operates from their market and hence they can issue credible threats for non-compliance. Although there are concerns that the council might decide not remit the taxes collected. However, this can be remedied through treasury reducing funding to the council by the amount that is not remitted to ZRA.
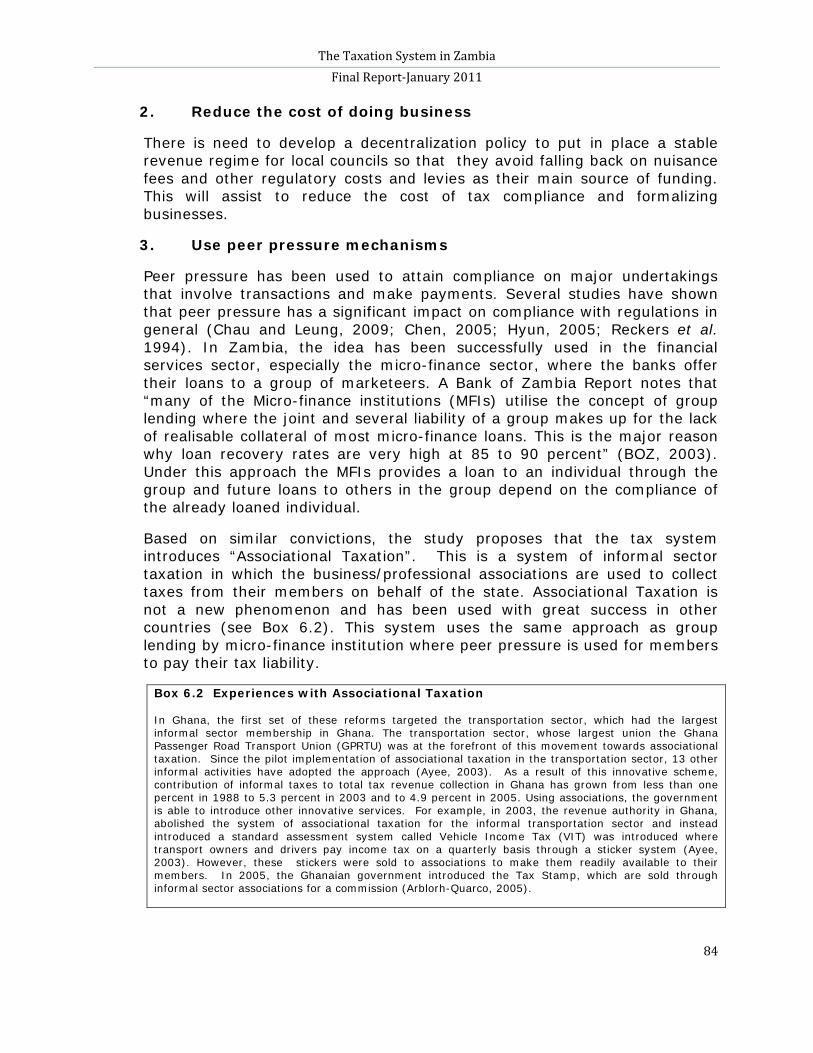
The Taxation System in Zambia Final Report-January 2011
84
2. Reduce the cost of doing business
There is need to develop a decentralization policy to put in place a stable revenue regime for local councils so that they avoid falling back on nuisance fees and other regulatory costs and levies as their main source of funding. This will assist to reduce the cost of tax compliance and formalizing businesses.
3. Use peer pressure mechanisms
Peer pressure has been used to attain compliance on major undertakings that involve transactions and make payments. Several studies have shown that peer pressure has a significant impact on compliance with regulations in general (Chau and Leung, 2009; Chen, 2005; Hyun, 2005; Reckers et al. 1994). In Zambia, the idea has been successfully used in the financial services sector, especially the micro-finance sector, where the banks offer their loans to a group of marketeers. A Bank of Zambia Report notes that “many of the Micro-finance institutions (MFIs) utilise the concept of group lending where the joint and several liability of a group makes up for the lack of realisable collateral of most micro-finance loans. This is the major reason why loan recovery rates are very high at 85 to 90 percent” (BOZ, 2003). Under this approach the MFIs provides a loan to an individual through the group and future loans to others in the group depend on the compliance of the already loaned individual.
Based on similar convictions, the study proposes that the tax system introduces “Associational Taxation”. This is a system of informal sector taxation in which the business/professional associations are used to collect taxes from their members on behalf of the state. Associational Taxation is not a new phenomenon and has been used with great success in other countries (see Box 6.2). This system uses the same approach as group lending by micro-finance institution where peer pressure is used for members to pay their tax liability.
Box 6.2 Experiences with Associational Taxation
In Ghana, the first set of these reforms targeted the transportation sector, which had the largest informal sector membership in Ghana. The transportation sector, whose largest union the Ghana Passenger Road Transport Union (GPRTU) was at the forefront of this movement towards associational taxation. Since the pilot implementation of associational taxation in the transportation sector, 13 other informal activities have adopted the approach (Ayee, 2003). As a result of this innovative scheme, contribution of informal taxes to total tax revenue collection in Ghana has grown from less than one percent in 1988 to 5.3 percent in 2003 and to 4.9 percent in 2005. Using associations, the government is able to introduce other innovative services. For example, in 2003, the revenue authority in Ghana, abolished the system of associational taxation for the informal transportation sector and instead introduced a standard assessment system called Vehicle Income Tax (VIT) was introduced where transport owners and drivers pay income tax on a quarterly basis through a sticker system (Ayee, 2003). However, these stickers were sold to associations to make them readily available to their members. In 2005, the Ghanaian government introduced the Tax Stamp, which are sold through informal sector associations for a commission (Arblorh-Quarco, 2005).

The Taxation System in Zambia Final Report-January 2011
85
4. Use informal sector associations to increase taxpayer education
Another factor that has impeded the performance of the base tax is lack of knowledge among taxpayers. The study recommends that the tax authority develops a taxpayer education model that effectively uses representative informal sector associations.
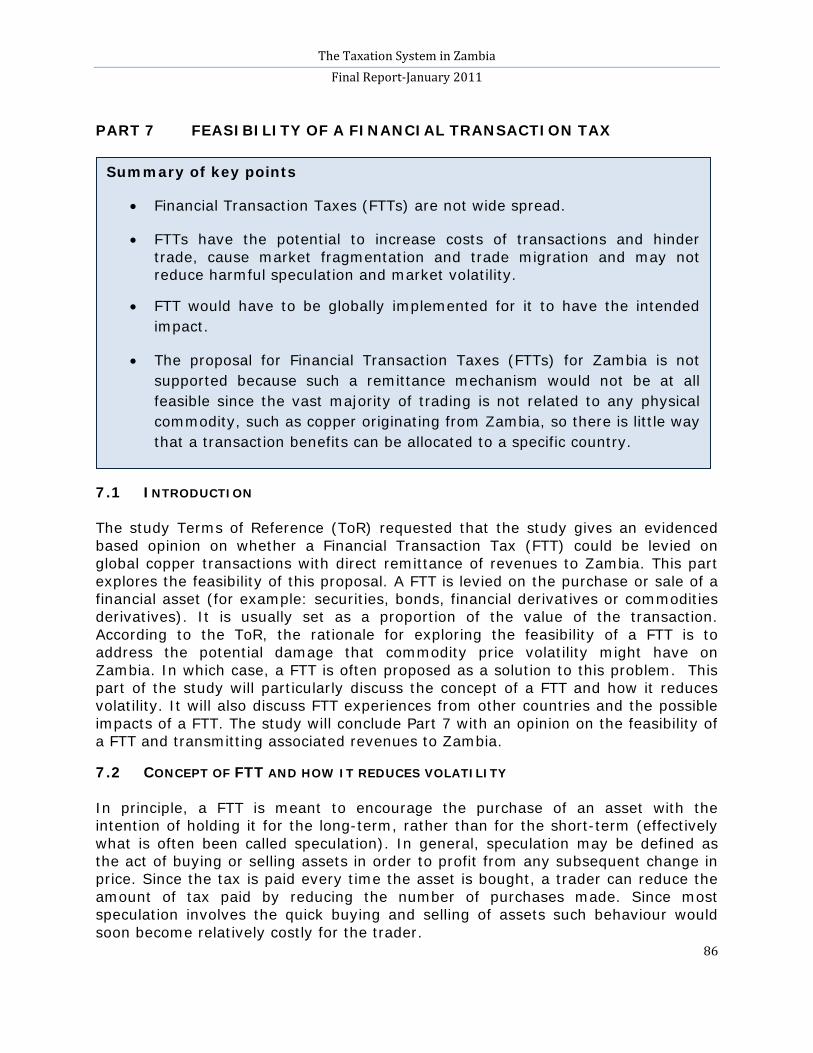
The Taxation System in Zambia Final Report-January 2011
86
PART 7 FEASIBILITY OF A FINANCIAL TRANSACTION TAX
7.1 INTRODUCTION The study Terms of Reference (ToR) requested that the study gives an evidenced based opinion on whether a Financial Transaction Tax (FTT) could be levied on global copper transactions with direct remittance of revenues to Zambia. This part explores the feasibility of this proposal. A FTT is levied on the purchase or sale of a financial asset (for example: securities, bonds, financial derivatives or commodities derivatives). It is usually set as a proportion of the value of the transaction. According to the ToR, the rationale for exploring the feasibility of a FTT is to address the potential damage that commodity price volatility might have on Zambia. In which case, a FTT is often proposed as a solution to this problem. This part of the study will particularly discuss the concept of a FTT and how it reduces volatility. It will also discuss FTT experiences from other countries and the possible impacts of a FTT. The study will conclude Part 7 with an opinion on the feasibility of a FTT and transmitting associated revenues to Zambia.
7.2 CONCEPT OF FTT AND HOW IT REDUCES VOLATILITY In principle, a FTT is meant to encourage the purchase of an asset with the intention of holding it for the long-term, rather than for the short-term (effectively what is often been called speculation). In general, speculation may be defined as the act of buying or selling assets in order to profit from any subsequent change in price. Since the tax is paid every time the asset is bought, a trader can reduce the amount of tax paid by reducing the number of purchases made. Since most speculation involves the quick buying and selling of assets such behaviour would soon become relatively costly for the trader.
Summary of key points
• Financial Transaction Taxes (FTTs) are not wide spread.
• FTTs have the potential to increase costs of transactions and hinder trade, cause market fragmentation and trade migration and may not reduce harmful speculation and market volatility.
• FTT would have to be globally implemented for it to have the intended impact.
• The proposal for Financial Transaction Taxes (FTTs) for Zambia is not supported because such a remittance mechanism would not be at all feasible since the vast majority of trading is not related to any physical commodity, such as copper originating from Zambia, so there is little way that a transaction benefits can be allocated to a specific country.
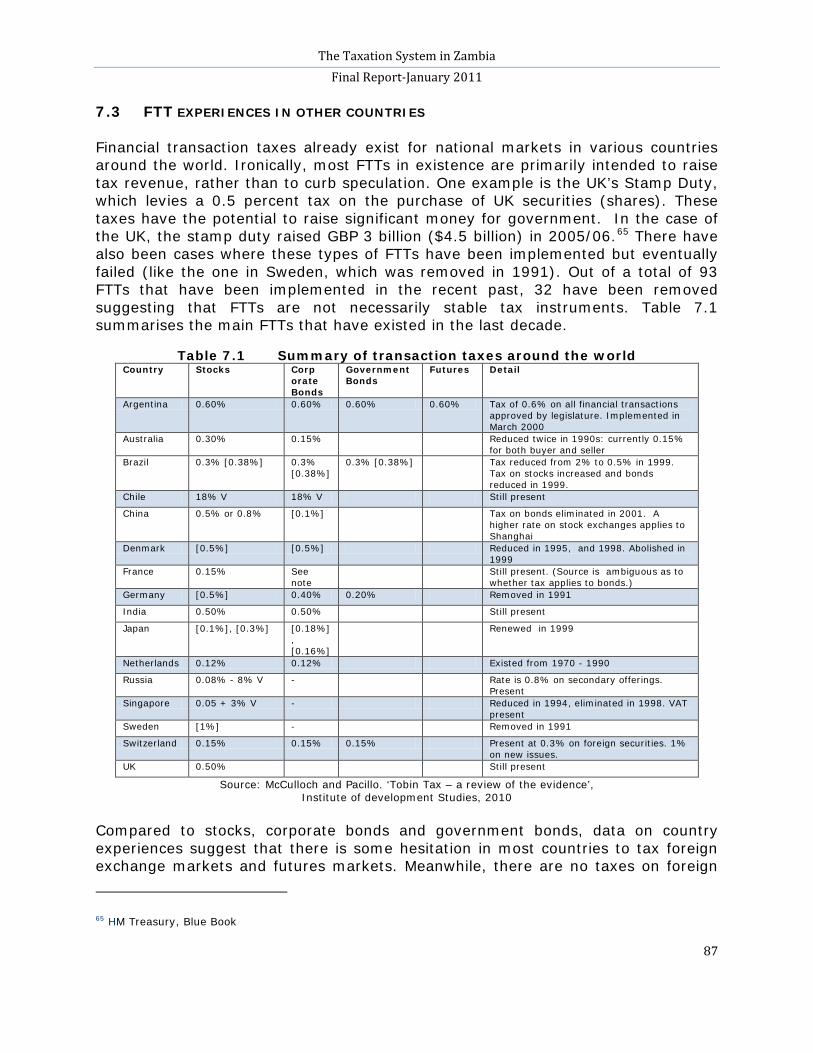
The Taxation System in Zambia Final Report-January 2011
87
7.3 FTT EXPERIENCES IN OTHER COUNTRIES Financial transaction taxes already exist for national markets in various countries around the world. Ironically, most FTTs in existence are primarily intended to raise tax revenue, rather than to curb speculation. One example is the UK’s Stamp Duty, which levies a 0.5 percent tax on the purchase of UK securities (shares). These taxes have the potential to raise significant money for government. In the case of the UK, the stamp duty raised GBP 3 billion ($4.5 billion) in 2005/06.65
Table 7.1 Summary of transaction taxes around the world
There have also been cases where these types of FTTs have been implemented but eventually failed (like the one in Sweden, which was removed in 1991). Out of a total of 93 FTTs that have been implemented in the recent past, 32 have been removed suggesting that FTTs are not necessarily stable tax instruments. Table 7.1 summarises the main FTTs that have existed in the last decade.
Country Stocks Corp orate Bonds
Government Bonds
Futures Detail
Argentina 0.60% 0.60% 0.60% 0.60% Tax of 0.6% on all financial transactions approved by legislature. Implemented in March 2000
Australia 0.30% 0.15% Reduced twice in 1990s: currently 0.15% for both buyer and seller
Brazil 0.3% [0.38%] 0.3% [0.38%]
0.3% [0.38%] Tax reduced from 2% to 0.5% in 1999. Tax on stocks increased and bonds reduced in 1999.
Chile 18% V 18% V Still present
China 0.5% or 0.8% [0.1%] Tax on bonds eliminated in 2001. A higher rate on stock exchanges applies to Shanghai
Denmark [0.5%] [0.5%] Reduced in 1995, and 1998. Abolished in 1999
France 0.15% See note
Still present. (Source is ambiguous as to whether tax applies to bonds.)
Germany [0.5%] 0.40% 0.20% Removed in 1991
India 0.50% 0.50% Still present
Japan [0.1%], [0.3%] [0.18%], [0.16%]
Renewed in 1999
Netherlands 0.12% 0.12% Existed from 1970 - 1990
Russia 0.08% - 8% V - Rate is 0.8% on secondary offerings. Present
Singapore 0.05 + 3% V - Reduced in 1994, eliminated in 1998. VAT present
Sweden [1%] - Removed in 1991
Switzerland 0.15% 0.15% 0.15% Present at 0.3% on foreign securities. 1% on new issues.
UK 0.50% Still present
Source: McCulloch and Pacillo. ‘Tobin Tax – a review of the evidence’, Institute of development Studies, 2010
Compared to stocks, corporate bonds and government bonds, data on country experiences suggest that there is some hesitation in most countries to tax foreign exchange markets and futures markets. Meanwhile, there are no taxes on foreign
65 HM Treasury, Blue Book
The Taxation System in Zambia Final Report-January 2011
88
exchange markets, which are the often-quoted market in which a FTT would successfully deliver the most revenue. Furthermore, any proposal to levy a FTT on commodity transactions actually relates to a tax on futures trading since almost all standardised trading on global markets are in the form of derivatives like futures. The sample in Table 7.1 also shows that only Argentina has done this, which is worrisome for the potential feasibility of the proposal. FTTs exist in various forms, and clearly their implementation has not been done on a large scale because most are specific to individual countries.
7.4 IMPACT OF A FTT
A number of studies have quantified the effects of a transaction tax. They often do this by analysing the effects of a rise in any form of transaction costs, of which a FTT is one type of such a cost. For example, Oxera (2007), estimated that
FTT is a cost
stamp duty abolition would likely increase total trading activity in UK listed companies by around 14.4 percent66
The single greatest argument against the imposition of an FTT is that a FTT comes with a cost and has the potential to reduce the incentive to trade as it makes each trade costlier. This results in a reduction in the number of trades on the market. If there are a large number of traders in the market at any one time, then it is more likely that a seller or buyer will be able to find a willing counterpart to transact with on appropriate terms. As the number of traders declines, it becomes harder to find a counterpart to trade with. Businesses have to either wait until a counterpart arrives, or alter the terms of the transaction to attract wiling counterparties (i.e. reduce your asking price if you are a seller). Either way, a cost is imposed on someone in the economy. By reducing the number of trades and the number of trading opportunities, an FTT imposes extra costs on all the traders. There is enough evidence of the impact of low liquidity and few players in the market. For example, the recent financial crisis of 2008/9 was a clear demonstration of what happens when liquidity falls sharply. A fall in liquidity was a primary reason why central banks had to start buying assets, such as mortgage-backed securities, from the private markets.
, meaning that the FFT cost was a considerable hindrance to trade.
If a FTT is not uniformly applied to all possible trading markets, there is the chance that some traders will shift their trading activity to markets that are not taxed. This can have two effects. Firstly, the amount of revenue that can be earned from the tax is reduced. Secondly, trading activity becomes fragmented across different markets which may be less transparent than the taxed markets. Transparency (the
Market fragmentation and trading migration
66 Oxera 2007
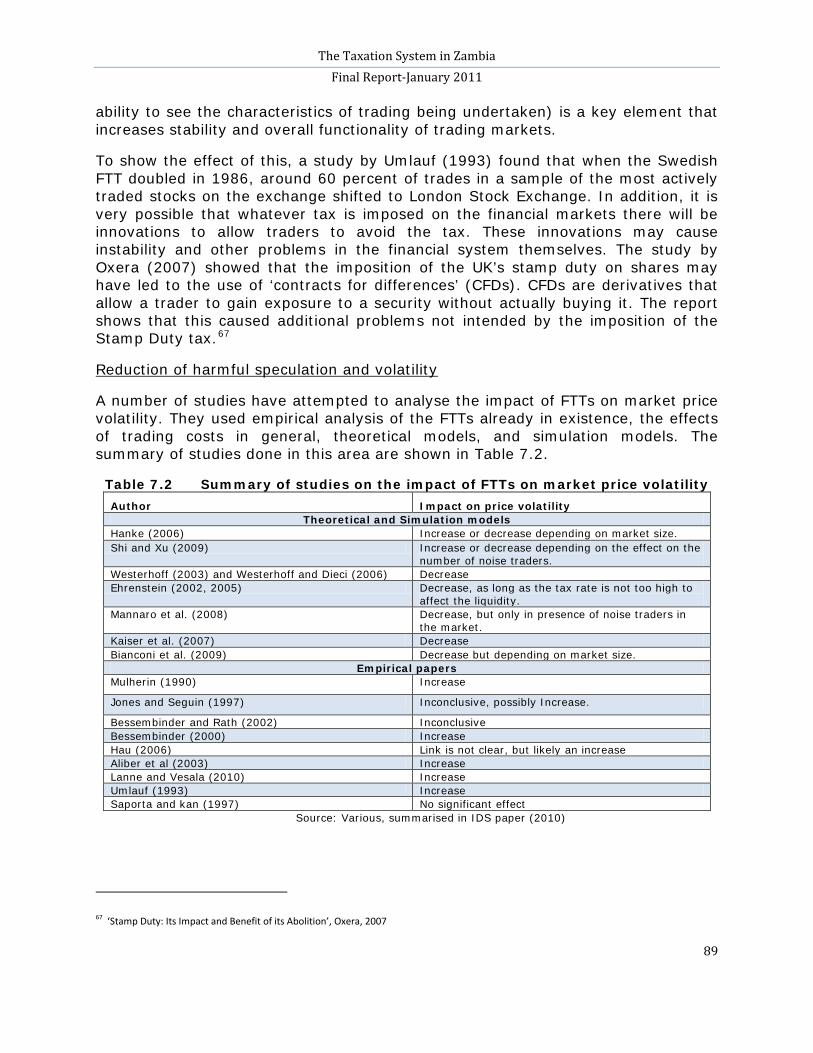
The Taxation System in Zambia Final Report-January 2011
89
ability to see the characteristics of trading being undertaken) is a key element that increases stability and overall functionality of trading markets.
To show the effect of this, a study by Umlauf (1993) found that when the Swedish FTT doubled in 1986, around 60 percent of trades in a sample of the most actively traded stocks on the exchange shifted to London Stock Exchange. In addition, it is very possible that whatever tax is imposed on the financial markets there will be innovations to allow traders to avoid the tax. These innovations may cause instability and other problems in the financial system themselves. The study by Oxera (2007) showed that the imposition of the UK’s stamp duty on shares may have led to the use of ‘contracts for differences’ (CFDs). CFDs are derivatives that allow a trader to gain exposure to a security without actually buying it. The report shows that this caused additional problems not intended by the imposition of the Stamp Duty tax.67
A number of studies have attempted to analyse the impact of FTTs on market price volatility. They used empirical analysis of the FTTs already in existence, the effects of trading costs in general, theoretical models, and simulation models. The summary of studies done in this area are shown in Table 7.2.
Reduction of harmful speculation and volatility
Table 7.2 Summary of studies on the impact of FTTs on market price volatility Author Impact on price volatility
Theoretical and Simulation models Hanke (2006) Increase or decrease depending on market size. Shi and Xu (2009) Increase or decrease depending on the effect on the
number of noise traders. Westerhoff (2003) and Westerhoff and Dieci (2006) Decrease Ehrenstein (2002, 2005) Decrease, as long as the tax rate is not too high to
affect the liquidity. Mannaro et al. (2008) Decrease, but only in presence of noise traders in
the market. Kaiser et al. (2007) Decrease Bianconi et al. (2009) Decrease but depending on market size.
Empirical papers Mulherin (1990) Increase
Jones and Seguin (1997) Inconclusive, possibly Increase.
Bessembinder and Rath (2002) Inconclusive Bessembinder (2000) Increase Hau (2006) Link is not clear, but likely an increase Aliber et al (2003) Increase Lanne and Vesala (2010) Increase Umlauf (1993) Increase Saporta and kan (1997) No significant effect
Source: Various, summarised in IDS paper (2010)
67 ‘Stamp Duty: Its Impact and Benefit of its Abolition’, Oxera, 2007
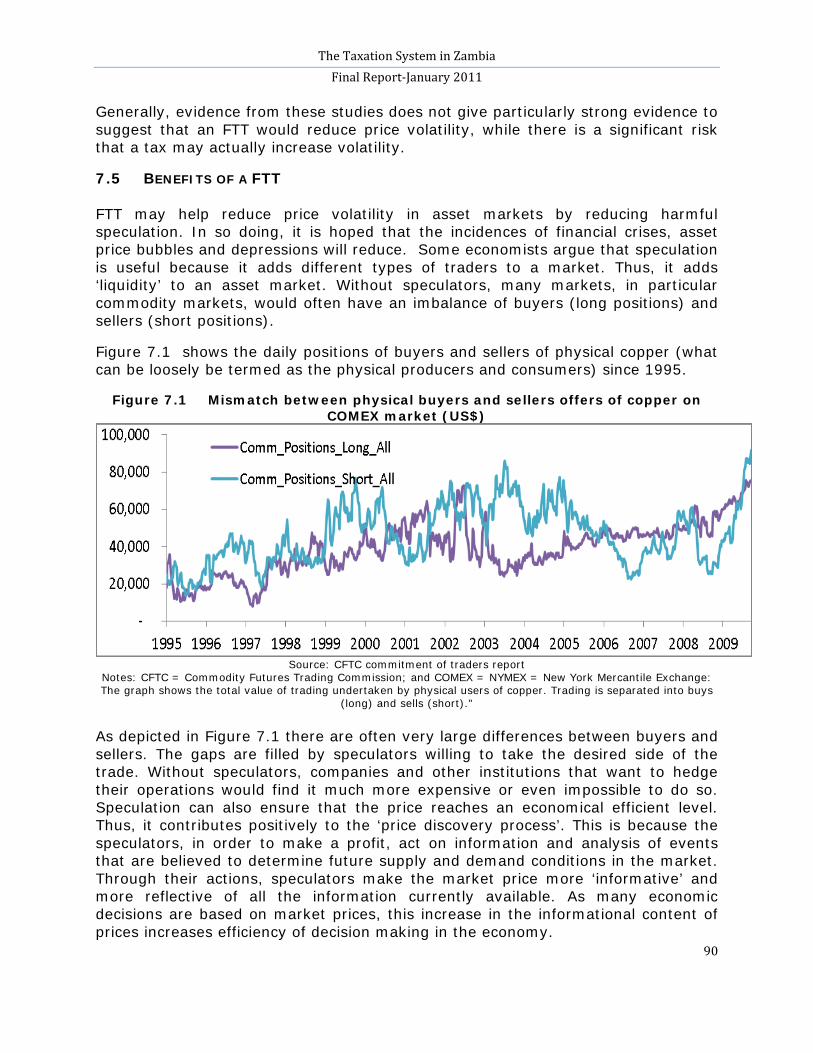
The Taxation System in Zambia Final Report-January 2011
90
Generally, evidence from these studies does not give particularly strong evidence to suggest that an FTT would reduce price volatility, while there is a significant risk that a tax may actually increase volatility.
7.5 BENEFITS OF A FTT FTT may help reduce price volatility in asset markets by reducing harmful speculation. In so doing, it is hoped that the incidences of financial crises, asset price bubbles and depressions will reduce. Some economists argue that speculation is useful because it adds different types of traders to a market. Thus, it adds ‘liquidity’ to an asset market. Without speculators, many markets, in particular commodity markets, would often have an imbalance of buyers (long positions) and sellers (short positions).
Figure 7.1 shows the daily positions of buyers and sellers of physical copper (what can be loosely be termed as the physical producers and consumers) since 1995.
Figure 7.1 Mismatch between physical buyers and sellers offers of copper on COMEX market (US$)
Source: CFTC commitment of traders report
Notes: CFTC = Commodity Futures Trading Commission; and COMEX = NYMEX = New York Mercantile Exchange: The graph shows the total value of trading undertaken by physical users of copper. Trading is separated into buys
(long) and sells (short)." As depicted in Figure 7.1 there are often very large differences between buyers and sellers. The gaps are filled by speculators willing to take the desired side of the trade. Without speculators, companies and other institutions that want to hedge their operations would find it much more expensive or even impossible to do so. Speculation can also ensure that the price reaches an economical efficient level. Thus, it contributes positively to the ‘price discovery process’. This is because the speculators, in order to make a profit, act on information and analysis of events that are believed to determine future supply and demand conditions in the market. Through their actions, speculators make the market price more ‘informative’ and more reflective of all the information currently available. As many economic decisions are based on market prices, this increase in the informational content of prices increases efficiency of decision making in the economy.
The Taxation System in Zambia Final Report-January 2011
91
7.6 TECHNICAL FEASIBILITY OF A FTT
A common argument (by the IMF and UK HM Treasury) is that a FTT would have to be globally implemented for it to have the intended impact. If this is not the case, for instance, if Europe implemented the tax but not America, there is the possibility that trading volumes (and with it the profits from related financial services) would migrate. If a FTT is not implemented across a wide range of countries, the corresponding tax revenue will be smaller. Further, if a FTT has to be imposed across the entire world it will take a far larger political commitment.
Global and international commitment
For every underlying assets such as equities, bonds, foreign exchange and commodities there are a large number of instruments that are traded such as options, futures, swaps, securitisations, etc. If it is decided that commodities will be taxed then one must decide which of the associated instruments to tax. If some are taxed but not others it may lead to trading migration to the untaxed instruments, as instruments can be substitutes for each other. However, some instruments may not be feasible to migrate to, due to their complexity in taxation.
Choice of taxation instrument
7.7 Feasibility of a transaction tax with direct remittance of revenues Commodities such as copper are predominantly sold under three methods:
1) Spot transaction on exchange where the commodity is sold immediately to a counterparty using a trading exchange;
2) Future/Forward/Option transaction where the commodity is agreed to be transacted sometime in the future;68
3) Off-exchange transaction where two parties agree to transact as part of an individual agreement. For instance, this may take the form of an agreement that says a producer will sell all the commodity it can produce in a year for a given price, ignoring what the world market price might be.
69
Most trade for common mineral commodities fall into the second category. In the case of Zambia, transactions involving futures and options (‘derivatives’) are usually ‘financial’ and no physical commodity is transacted. Instead, the agreement is netted out before the contract matures. In effect, this allows traders to bet or hedge on the changes in price without having to actually own or hold the commodity itself.
68 An option is actually an agreement to allow one counterparty the right to choose to buy or sell the commodity, but it may not necessarily do so.
69 Contracts between some mining firms in Zambia and trading agents can be put under this category.
The Taxation System in Zambia Final Report-January 2011
92
Almost all spot and derivative trade (physical or financial) are undertaken on commodity exchanges. The largest market in terms of volumes of trade are: Chicago Mercantile Exchange, London Metal Exchange, and COMEX. These commodity exchanges are merely electronic versions of a physical market; they cannot influence the market price of commodities in any way. They instead employ sophisticated systems to enable trades to be transacted with very small costs at high speed. The advantage of using commodity exchanges is that they provide some opportunity for utilizing a transaction tax since they are centralised electronic systems, and financial transaction taxes can easily be levied with very little administrative costs. However, the use of futures markets and associated speculations would make it very difficult to follow the transactions that happen on everyday basis and with different commitments.
Almost 99 percent of the value of copper trading is not related to actual physical trading of copper. Consequently, both producers, consumers and speculators trade copper contracts which never actually result in physical copper exchanging hands. Instead, the contracts are ‘netted out’ before delivery is made.70
Based on the discussion above, the study concludes that, there is no feasible way to tell how much of the global trading is for Zambian copper and how much is for other countries in the world. As such, there is no possible way to calculate the proper share of FTT revenues that should be remitted to Zambia. This is because there is no direct link between the value of copper produced in Zambia and the value of copper contracts traded in the world.
This leaves the one (1) percent of copper trading to which actual physical deliver is derived. However, even these contracts cannot be connected to actual Zambian copper. A contract will specify delivery of the required tonnes of copper from anywhere in order to satisfy the terms of the contract. Even if a mining company with operations in Zambia holds such a contract, it may or may not use Zambian copper.
7.8 RECOMMENDATIONS 1) This study supports the imposition of a global FTT in a similar manner advocated
by groups such as the ‘Robin Hood’ campaign71
. This is because revenues from such transactions could be used for international development or other ‘global public goods’ and would help to transfer wealth from the rich to the poor and eventually reduce poverty world-wide.
70 Netting out involved buying an exact opposite contract to the one a trader already holds. One contract will be to buy $100 of copper the other one to sell $100 of copper. The two cancel out leaving the trader with no obligation to buy or sell copper.
71 A tax on banks that would give billions to tackle poverty and climate change, here and abroad. This tax on the financial sector has the power to raise hundreds of billions every year globally. It could give a vital boost to the NHS, our schools, and the fight against child poverty in the UK – as well as tackling poverty and climate change around the world.
The Taxation System in Zambia Final Report-January 2011
93
2) With regard to the ToR proposal of a FTT levied on commodities in which revenues can be remitted back to Zambia, this study is not supportive. This is because such a remittance mechanism would not be at all feasible since the vast majority of trading is not related to any physical commodity so there is little way that a trade can be allocated to a specific country.
The Taxation System in Zambia Final Report-January 2011
94
PART 8 CONCLUSION AND SUMMARY OF RECOMMENDATIONS
8.1 CONCLUSION This study has endeavoured to contribute to the existing body of knowledge on the tax system in Zambia by identifying the key challenges and possible success factors. The information generated by this study would be used by the JCTR as research, education, and advocacy tools to lobby relevant authorities on how the current tax system can be best utilized and reorganised in order to attain social justice. The study will assist the JCTR to fully comprehend the taxation system in Zambia with the aim of forming knowledgeable and evidence based opinions on how it affects social justice.
The study findings are summarised as follows;
• The Zambian tax system has performed well in terms of meeting set targets and increasing domestic revenues in the national budget. However, Zambia has not fully exploited other sources of revenue that can supplement tax revenues. Notwithstanding its successes, the tax system has many tax types, rates and incentives and therefore relatively complex and faces numerous challenges. Some incentives used in Zambia represent serious problems for revenue leakage and administration
• In the last decade, the tax system has shown signs of becoming less
productive. Underlying this trend is the fall in trade tax revenues and a long-term decline in VAT. In particular, the income tax system is not fair, with a high burden especially on the middle-class and some economic sectors.
• The mining sector has the capacity to contribute more to domestic revenues
than its current level. Lately there has been a lot of debate on the appropriate tax instrument and policy to use for the mining sector.
• Despite the growing importance of the informal sector in the economy, its contribution to tax revenue has been poor. Nevertheless, the informal sector presents an opportunity for growing Zambia’s tax base. Zambia has in place a tax regime for the informal sector although its performance has not been impressive. Administrating the informal sector has several challenges such as a cash-based economy that reduces ability to audit transactions , improper record keeping and political interference
• Financial Transaction Taxes already exist in various forms. However, there
are real technical problems with implementation of an FTT in Zambia.
The Taxation System in Zambia Final Report-January 2011
95
8.2 RECOMMENDATIONS
Structure and performance of the tax system
With respect to the structure and performance of the tax system, the study recommends that there is continued strong funding and policy support to ZRA. Taxpayer education and taxpayer services must be enhanced to improve tax compliance and reduce the cost compliance. The Government must consider introducing taxes on wealth transactions and lastly, all supplementary sources of revenue must be exploited through appropriate policy and institutional reforms.
Incentives
The study has recommended analysis on the costs and benefits of incentives must be undertaken, which may include undertaking Tax Expenditure Budgeting. The government should minimise discretionary provision of incentives by involving Parliamentary oversight.
The use of variable profit taxation is administratively consistent with the current practices within the ZRA and is highly recommended as an optimal tax instrument.
Mining taxation
The tax system must consider contracting out tax administration responsibilities to local councils; regulate fees and levies imposed by local councils; and use peer pressure mechanisms as avenues for collecting taxes and undertaking taxpayer education and services.
Informal sector taxation
A FTT levied on commodities is not feasible. This is because such a tax remittance mechanism would not be at all feasible since there is little way that a physical trade can be allocated to a specific country like Zambia.
Financial Transaction Tax
The Taxation System in Zambia Final Report-January 2011
96
REFERENCES Agyeman. E.D, (1982). "Principles of Ghana Taxation" (Accra: Business Books). Alcock. O, (2003). “CARICOM Tax Harmonization: Implications of the Effects on Investment for Regional Integration”, Regional Tax Policy and Administration Unit, Guyana, South America. Alm, James, Jorge Martinez-Vazquez, and Friedrich Schneider, (2003). ‘Sizing’ the Problem of the Hard-To-Tax” a paper presented at The AYSPS ‘Hard to Tax’ conference Arblor-Quarco, (2005). "The re-launch of the Stamp Tax", IRS, 28/09/2005 Ayee, Joseph, 2007. “Building Tax Compliance through reprocity with government” paper presented at FIAS regional Conference on ‘Enterprise Formalization in Africa’ Ayee, Joseph, 2007. “The Organizational Culture of Tax Officials in Ghana”, African Journal of Public Administration and Management Beneria. L, (2001). “Changing Employment Patterns and the Informalization of Jobs: General Trends and Gender Dimensions”, ILO: Geneva Bird, Richard M. and Oliver Oldman, eds. (1975). "Taxation in Developing Countries" , Fourth Edition, Baltimore and London: Johns Hopkins University Press Brown. C.V, and Jackson. P.M, (1978) Public Sector Economics (Oxford: Martin Brown). Bwalya. S, Phiri. E., and Mpembamoto. K, (2009), "How non-state actors lobby to influence budget outcomes in Zambia", IPPG Occasional Paper, JEL classification: D72, H30. Lusaka, Zambia. Castells, M., A. Portes and L.A Benton (1989), "The Informal economy: Studies in advanced and Less Developed Countries", John Hopkins University Press: Baltimore Castells, Manuel and Alejandro Portes. (1989), “World Underneath: the Origins, Dynamics, and Effects of the informal Economy”. In A. Portes, M. Castells, and L.A. Benton, eds., The Informal Economy: Studies in Advanced and Less Developed Countries. Baltimore: Johns Hopkins University Press. Charmes. J, (2000), "The Contribution of Informal Sector to GDP in Developing Countries: Assessment, Estimates, Methods, Orientations for the Future", 4th Meeting of the Delhi Group on Informal sector Statistics, Geneva 28-30 August 2000, 14p.
The Taxation System in Zambia Final Report-January 2011
97
Charmes, J. 2000. “Size, Trends and Productivity of Women’s Work in the Informal Sector” Chau Gerald and Patrick Leung, (2009), “A critical review of Fischer tax compliance model: A research synthesis”, Journal of accounting and Taxation Vol. 1(2) Chen. N, 2005. “Disaggregate Theories and Firm Compliance Behavior”, IGSD/INECE discussion paper Cling, Nguyn, Hnu Chí, Mireille, Roubaud and Torelli, (2010), "Comparing the informal sector in Vietnam and Africa" CSO (2007c) Labour Force Survey Report (LFS – 2005). Lusaka CSO 1991,1993. Priority Surveys. Lusaka CSO labour Survey of 2007 CSO, 1996, 1998, and 2004. Living Conditions and Monitoring Survey. Lusaka Feige. E. L, ed. (1989). “The Underground Economies: Tax Evasion and Information Distortion” (Cambridge, New York, Melbourne: Cambridge University Press). Feige. E.L, 1990. “Defining and Estimating Underground and Informal Economies” the New Institutional Economics Approach”. World Development 18,7. Friedman. S, (2003), “Sending Them a Message: Culture, Tax Collection and Governance in South Africa”, Policy: Issues and Actors, Vol. 16, no. 3 (June): 1-17. Gill, Indermit, Fluitman, Fred and Amit Dar, Eds. (2000). “Vocational Education and Training Reform: Matching Skills to Markets and Budgets”, A Joint Study of the World Bank and the ILO, New York: Oxford University Press, pp. 389-400. Global Policy Network. (2001) “Zambia: Socio-Economic Issues and Unionization”. [Online], at: http:// www.globalpolicynetwork.org. Gorter. J, (2004), "Reform of the Zambian Tax System" – DFID selected papers, Tax Policy Issues in Zambia, 2006, Fringila, Zambia. GRZ, 2002. National Decentralization Policy, Lusaka. Hougaard C.,Chamberlain D., and Assefa. 2009. “Towards a strategy for micro-insurance development in Zambia: A market and regulatory Analysis”. Cenfri. South Africa
The Taxation System in Zambia Final Report-January 2011
98
Ilho, Yoo.,(2000) “Experience With Tax Reform In The Republic Of Korea” Asia-Pacific Development Journal, Vol. 7, No. 2, December 2000 ILO (2009), Guide to the new Millennium Development Goals. Employment Indicators, including the full set of Decent Work Indicators, Geneva: ILO International Academy of African Business and Development (IAABD,2002). Proceedings of the International Academy of African Business and Development (IAABD) International Conference, Port Elizabeth, South Africa; April 3-6. IRS, 2006, Speech by the Commissioner of Internal Revenue at the launch of the Stamp Tax. 28/08/05 Jackson Hewitt, average fees for 2008, from Annual Report to Shareholders JCTR-CSPR-CARITAS Pre-budget 2010: “Economic growth with equity: Investing in the dignity of the people” Press release (5/08/09) Klaveren M., Tijdens K, Hughie-Williams M., Nuria R., 2009. “An overview of women’s work and employment in Zambia”, AIAS; Amsterdarm Korea Institute of Public Finance, 1997. “Reform Proposal in Tax System and Tax Administration”. In Korean Koyi, Grayson (2006b). “Trade Union Involvement in the Informal Economy in Zambia”. Draft Paper to be presented at the FES/LARRI Regional Workshop on Dealing with the Informal Economy: A Challenge for Trade Unions in Southern Africa, 17-19 October, Windhoek Maarten van Klaveren ,Tijdens, Melanie Hughie-Williams and Nuria Ramos Martin, (2009). “Decisions for Life MDG3 Project Country Report no. 4” Revised edition, University of Amsterdam. Mining in Zambiahttp://www.zambiamining.co.zm/mininginzambia.htm MOFNP, Budget Speech 2003 Mulenga, C (2005), “Broadening the Tax Bas to the Informal Sector”, DFID selected papers, Tax Policy in Zambia, Lusaka, Zambia, 2005 Muuka, Gerry. (2004). “Africa’s Informal Sector with Zambia as a Case Study: A Challenge to Scholars to Close the Knowledge Gap” Journal of Business and Public Affairs
Nathan MSI Group, ‘Effectiveness and Economic Impact of Tax Incentives in the SADC region’, 2004.
The Taxation System in Zambia Final Report-January 2011
99
Olken Benjamin, 2008. Informal Taxation. NBR: Washington Report on effectiveness and Economic Impact of Tax Incentives in the SADC Region, SADC Tax Subcommittee, SADC Trade, submitted by Nathan−MSI Group, under contract no. PCE-I-00-98-00016-00, February 2004). Richard E. Stern and Paul A. Barbour, (2005) “Designing a Small Business Tax System that Enhances Growth: Lessons from Africa” FIAS, World Bank Group, December, 2005. Richard Filmer and Stella Mushiri, “Customs Revenue Implications of the SADC Trade Protocol”, 2001 Sector of the Informal, Paper presented at the Annual IAFFE Conference, Istanbul, 15-17 August 2003. Stern R. and Baurbor P. 2006. “Designing a small business tax system that enhances growth: lessons from Africa”, World Bank: Washington Stiglitz J (2000) "Economics of the Public Sector", Third Edition New York: W.W. Norton & Co. The Brenthurst Foundation. “Strengthening Africa’s economic performance - Mobilising Zambia”, Discussion Paper 2010 / 02 Various Annual Budget Addresses World Bank. (1990). World Development Report 1990 on Poverty. Oxford University press. World Bank. (2001). “The Informal Economy and Local Economic Development”, online at: http:// www.worldbank.org/urban/led/ informal_economy.html, visited 12/03/2002. Zambia Revenue Authority, Annual Reports 1996-2009