Embed Size (px)
Citation preview
Report On
THE TEXAS HORSE INDUSTRY
Developed by
Department of Department of Department ofAnimal Science Large Animal Medicine & Surgery Agricultural Economics
as part of
The Texas Horse Industry Quality Audit Initiative
produced by
The Texas Agricultural Extension Service
January, 1998
_______________________Pete G. Gibbs, Professor & Extension Horse Specialist - Animal ScienceGary D. Potter, Professor & Equine Science Section Leader - Animal ScienceLonnie L. Jones, Professor - Agricultural EconomicsMichael R. Benefield, Former Extension Assistant - Animal ScienceJohn W. McNeill, Associate Department Head & Extension Program Leader - Animal ScienceBryan H. Johnson, Head of Department - Animal ScienceBill Moyer, Head of Large Animal Medicine & Surgery - College of Veterinary Medicine
THE TEXAS HORSE INDUSTRY
2
SUMMARY STATEMENTS
! Texas is home for over 1 million horses, representing approximately 15% of all horses nationwide.
! Texas leads the nation in number of registered
C American Quarter HorsesC American Paint HorsesC Appaloosa HorsesC American Miniature Horses
Texas is second only to California in total
C Arabian HorsesC Thoroughbred Breeding Stallions
!! 953,983 Texans are horse industry participants and there are 288,839 Texas horse owners. These owners each have an average of 3.7 horses.
!! FTE employment across the Texas horse industry exceeds 43,000 people and compares with the Rubber Products, Agricultural Forestry & Fishery Services, Wood Products & Transportation Services Industries.
!! The majority of participants associate with horses for “Quality of Life” reasons. There is significant crossover in use of horses for pleasure/recreation and showing/competition.
! Horseowners have $13 billion invested in barns, towing vehicles, trailers, tack and related equipment and spend $2.1 billion annually just to maintain their horses.
! In showing and racing alone, almost 300,000 owners, family members & volunteers spend $3 billion per year attending competitive events with over 250,000 horses.
! Texas horses are valued at $4.2 billion.
! Annual cash receipts for horses bought/sold exceeds $354 million. Horse receipts are over 2 times greater than the combined total for hogs, sheep and lambs, and are 1.1 times the total receipts for Texas wheat.
! Total impact of the horse industry to Texas economy exceeds $11 billion annually.
THE TEXAS HORSE INDUSTRY
3
P.G. Gibbs, G.D. Potter, L.L. Jones, M.R. Benefield, J.W. McNeill, B.H. Johnson, and W. Moyer
Texas A&M University, College Station, Texas
Texas is recognized as horse country by people throughout the nation and world whoknow about horses. Major breed associations which serve the global horse industry, such as theAmerican Quarter Horse Association (AQHA) and the American Paint Horse Association(APHA), are headquartered in Texas. Other widely recognized horse industry groups, like theNational Cutting Horse Association, are located here as well. In 1996, seven of the 40 Nationallevel horse shows held across the U.S. were held in Texas, 1,2 more than any other state. The thirdlargest AQHA show in the nation occurs annually in Texas during the Houston Livestock Showand Rodeo.3 Another major AQHA show listed in the top 20 is held during the Ft. WorthLivestock Show and Rodeo. The second largest APHA show in the country takes place inNacogdoches, Texas.4 In fact, both AQHA and APHA approve more shows in Texas than in anyother state. Texas is also home for five race tracks, three of which are very new Class I tracks.There are lots of horses in Texas, and many people utilize them for a variety of purposes. Unfortunately, people with limited exposure to agriculture and the horse industry may notrecognize the role that horses play in the lives of Texas citizens. Furthermore, the impact of thehorse industry on Texas is often perceived as insignificant by people who have little first handknowledge of this industry that revolves around the use of horses. Thus, this study was conductedto quantify the size, scope and economic significance of this very important industry in Texas. The study is the culmination of in-state survey work and reviews of several other studies of thehorse industry. The results reported herein are part of the Texas Horse Industry Quality AuditInitiative.
EQUINE POPULATION
There are apparently, approximately 1,066,800 equines in Texas.5 That populationestimate is derived from a 1993 report that estimated the Texas equine population starting withhard data obtained from mandatory vaccination of horses in 1972 to avoid an epidemic ofVenezuelan Equine Encephalomyelitis. The adjustments due to annual growth are based on datathat include both registered and unregistered equines, thereby accounting for horses that are notlikely represented in other, more recent estimates.2
Not all breeds are able to maintain current figures on new registrations and total horsecount. However, the larger associations maintain a database of information, which permits acloser look at Texas horses and how this state compares with other states. Shown in Table 1 aredata obtained from 12 breeds reflecting calendar year 1996, and the total estimate for bothregistered and unregistered horses in Texas.
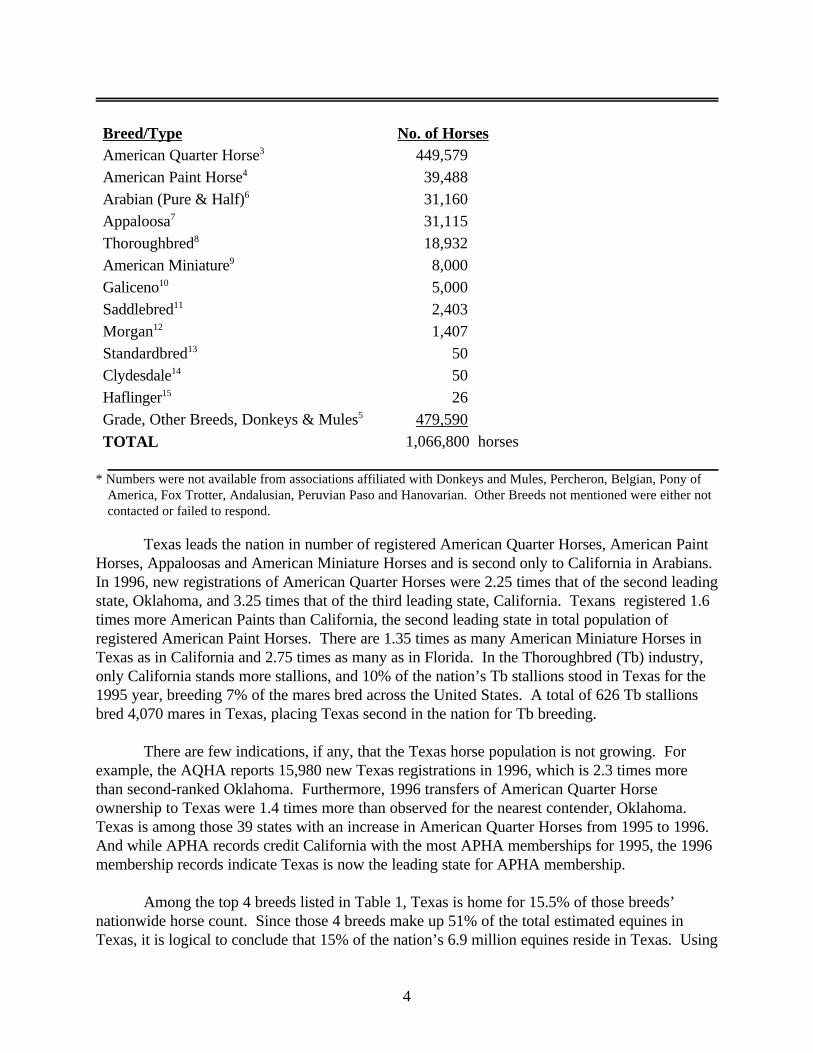
Table 1. Texas horse population by breed or type.*
4
Breed/Type No. of HorsesAmerican Quarter Horse3 449,579American Paint Horse4 39,488Arabian (Pure & Half)6 31,160Appaloosa7 31,115Thoroughbred8 18,932American Miniature9 8,000Galiceno10 5,000Saddlebred11 2,403Morgan12 1,407Standardbred13 50Clydesdale14 50Haflinger15 26Grade, Other Breeds, Donkeys & Mules5 479,590
TOTAL
1,066,800 horses
* Numbers were not available from associations affiliated with Donkeys and Mules, Percheron, Belgian, Pony ofAmerica, Fox Trotter, Andalusian, Peruvian Paso and Hanovarian. Other Breeds not mentioned were either notcontacted or failed to respond.
Texas leads the nation in number of registered American Quarter Horses, American PaintHorses, Appaloosas and American Miniature Horses and is second only to California in Arabians. In 1996, new registrations of American Quarter Horses were 2.25 times that of the second leadingstate, Oklahoma, and 3.25 times that of the third leading state, California. Texans registered 1.6times more American Paints than California, the second leading state in total population ofregistered American Paint Horses. There are 1.35 times as many American Miniature Horses inTexas as in California and 2.75 times as many as in Florida. In the Thoroughbred (Tb) industry,only California stands more stallions, and 10% of the nation’s Tb stallions stood in Texas for the1995 year, breeding 7% of the mares bred across the United States. A total of 626 Tb stallionsbred 4,070 mares in Texas, placing Texas second in the nation for Tb breeding.
There are few indications, if any, that the Texas horse population is not growing. Forexample, the AQHA reports 15,980 new Texas registrations in 1996, which is 2.3 times morethan second-ranked Oklahoma. Furthermore, 1996 transfers of American Quarter Horseownership to Texas were 1.4 times more than observed for the nearest contender, Oklahoma. Texas is among those 39 states with an increase in American Quarter Horses from 1995 to 1996. And while APHA records credit California with the most APHA memberships for 1995, the 1996membership records indicate Texas is now the leading state for APHA membership.
Among the top 4 breeds listed in Table 1, Texas is home for 15.5% of those breeds’nationwide horse count. Since those 4 breeds make up 51% of the total estimated equines inTexas, it is logical to conclude that 15% of the nation’s 6.9 million equines reside in Texas. Using
5
that figure provides an estimate of 1,035,000 equines, which is very similar to the previouslymentioned population of 1,066,800 estimated from the horse industry within the state.
REASONS FOR HORSE OWNERSHIP AND USE
Horses are part of the social fabric of Texas. It has been common knowledge for yearsthat they make important contributions to the livelihood and well-being of people. A recent eightcounty survey16 focused on some of the reasons why Texans own and use horses. A 34%response to the survey was achieved and 91% of respondents cite more than one reason forhaving horses. In fact, 61% list four or more reasons (seeTable 2). Ownership and use of horsescontributes to the quality of life for 63% of respondents.
Table 2. Reasons for ownership and use of horses by respondents in an eight countysurvey.16
Reason %Improved Quality of Life 63Relaxation/Decreased Stress 61Means of Physical Fitness 35Enjoy Competition 74Value for Children 50Buy/Sell Business 26Train for Profit 13Breeding/Raising Foals 44Other 9
Over half of all respondents identify quality of life, relaxation/stress management andcompetition as multiple reasons for their horse involvement.
Without exception, every respondent that identifies quality of life as a reason for owninghorses further characterizes reasons for horse involvement. Of those identifying horse ownershipand use as a quality of life issue, 79% also list competition, and 76% also list stressreduction/relaxation as reasons for owning horses. One-half identify physical fitness as a reasonfor horse ownership and use. Among those identifying quality of life, 62% indicate that horses area useful vehicle for youth development. One-half of respondents associate breeding mares andraising foals with quality of life. In fact, a breakeven analysis study of Texas breeding farmssuggests that many breeding operations are motivated by factors other than profit.17 Only 29%link the buying/selling business with quality of life, and even fewer (15%) associate training horsesfor profit with quality of life.
Across all respondents, 85% identify both an interest in competition and value forchildren, verifying the well known fact that youth like to compete with horses in a variety ofactivities. In the Texas 4-H horse program alone, 9,300 4-H horse project members actually ride
6
or use horses and other equines, and 10% of them qualify for and show in the State Finals inAbilene. Nationwide, 4 of the 15 largest AQHA youth shows are held in Texas3, and there are 2.4times as many AQHA youth members in Texas as in California. Furthermore, 73% of allrespondents identify both competition and relaxation/stress reduction.
All but one of the survey respondents who use horses for leisure riding are also involved insome type of competitive activity. This is consistent with the AHC report1 that significantcrossover exists between competitive and recreational or leisure horse involvement. According tothe APHA’s subscriber survey18, 74% show American Paint horses in competition, mostly asamateurs.
Of those people whose reasons for horse involvement include breeding mares and raisingfoals, 42% also identify buying/selling of horses as an area of industry involvement.16
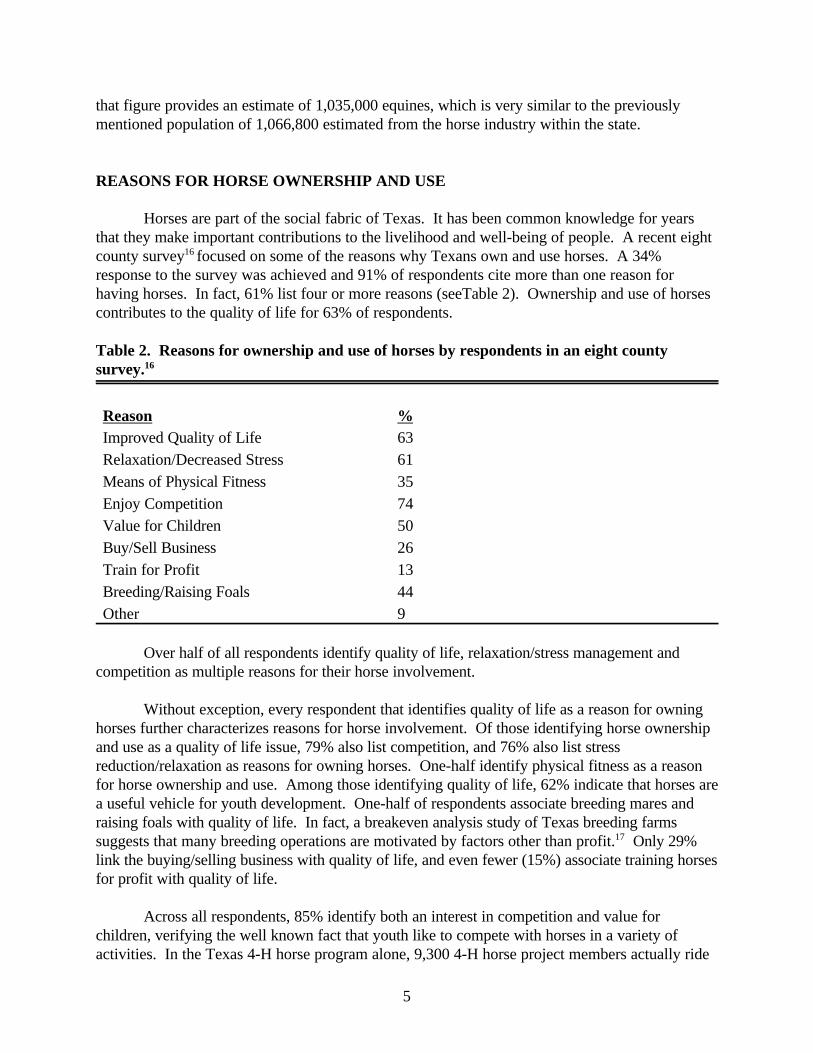
The ownership, care, management and use of equines by survey respondents ischaracterized as 40% recreational, 15% recreation/business combined, 30% secondary businessand 15% primary business. Results of that survey16, combined with AHC findings1,2 and an earlierpopulation estimate study5 profile Texas owners by horse use or intended purpose as shown inFigure 1.
Figure 1. Useor Purpose ofTexas Horses
In the eight county survey16, performance horses represent 16 different categories ofactivity or competitive use. A closer evaluation of riding horse owners indicates that 35% ofperformance horses are used for competitive, cattle-related events and ranch or feedlot work. Infact, there is significant crossover because all but three of respondents who use horses for ranch
7
or feedlot work are also involved in some type of competition. Almost 12% of horses are usedfor various hunter-type activities and 22% are involved in western show events or activities. Useof performance horses also includes leisure riding, endurance, competitive trail, driving and speedevents. In Abilene, Texas alone, the Taylor County Expo Center19 hosts some 66 horse relatedactivities annually that cover 165 days. With an estimated impact of $20.2 million to theeconomy, those events serve horse people with cutting, roping, timed event, western show andenglish show horses. In Texas, as with the nation as a whole, the multiple use of horses acrossthe recreation, competitive and work categories is evident.
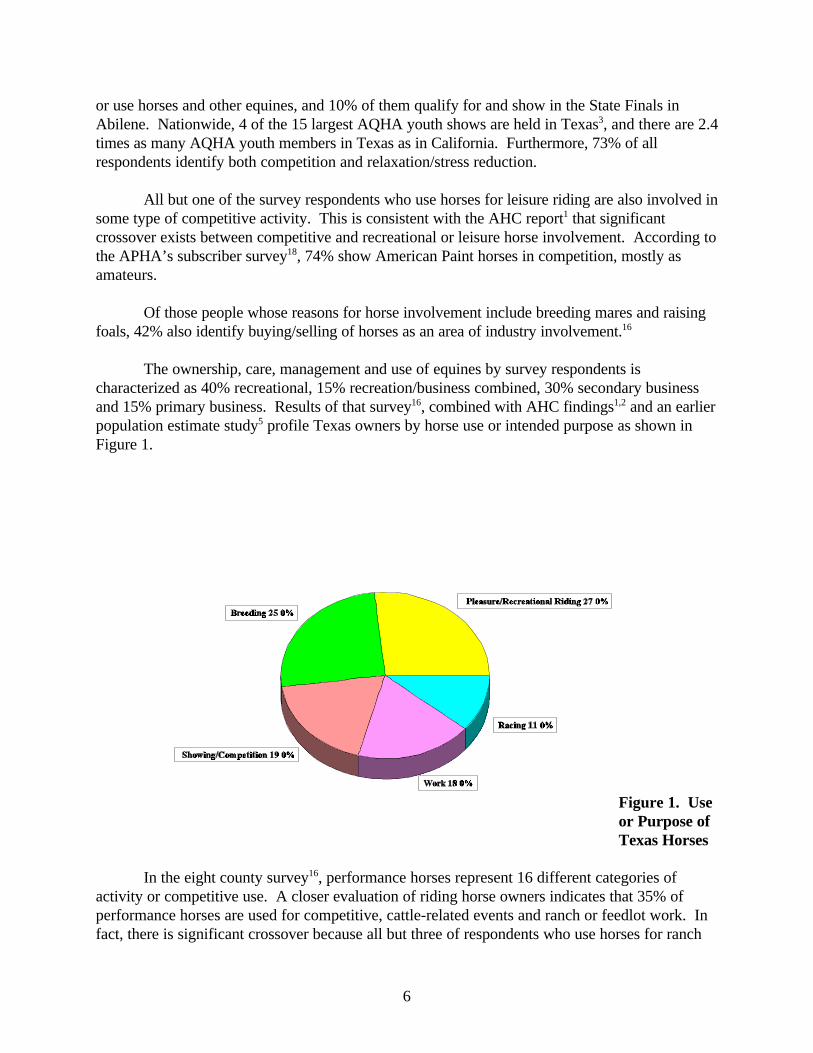
According to the AHC1, horseowners in the U.S. have an average of 3.50 horses. However, the AHC focus study on Texas2 suggests that owners are equivalent to 27% of the totalnumber of horses (3.7 per owner). Thus, with just over a million horses, Texas horse ownerstotal 288,839. Median income for horseowner families across the U.S. is $60,000 annually.1 From another survey16 , median income for Texas horse owning households is somewhat similar,$68,500. Total annual income from any/all sources for responding horse owners is quite variable(Figure 2). However, 15% report annual incomes in the $20-40,000 range, which is similar toprevious figures from AQHA’s member survey.20 Total annual income in excess of $100,000 isreported by 23% of respondents, compared to 21% reported for the nation by the AHC.1
Figure 2. Totalannual income from any/all sources by horse owning respondents in an eightcounty survey.16
Among respondents to a Texas Tb industry survey8, those with total income of $49,000or less equal 23.5%, almost identical to the eight county survey.16 Tb owners with income in the$50,000 to $99,000 range are lower than other horseowners in general, primarily due to a largerpercentage (45.5%) reporting incomes of $100,000 or more.
8
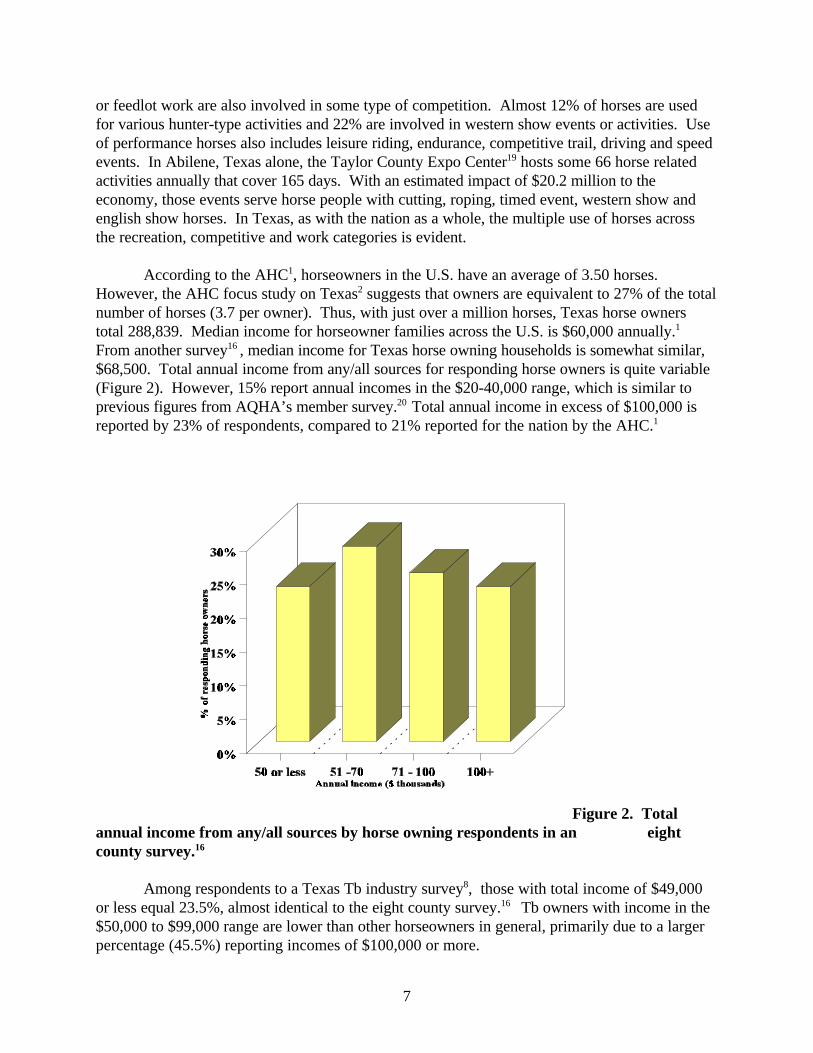
One-third of respondents representing multiple breeds indicate absolutely no contributionfrom horses to their total yearly income (Figure 3). Another one-third report that 10% or less ofyearly income is derived from horse involvement.
Figure 3. Percentage of total yearly income derived from horses by respondents to an eight county survey.16
INDUSTRY PARTICIPANTS
The AHC reports include nationwide participation1 and statewide involvement2
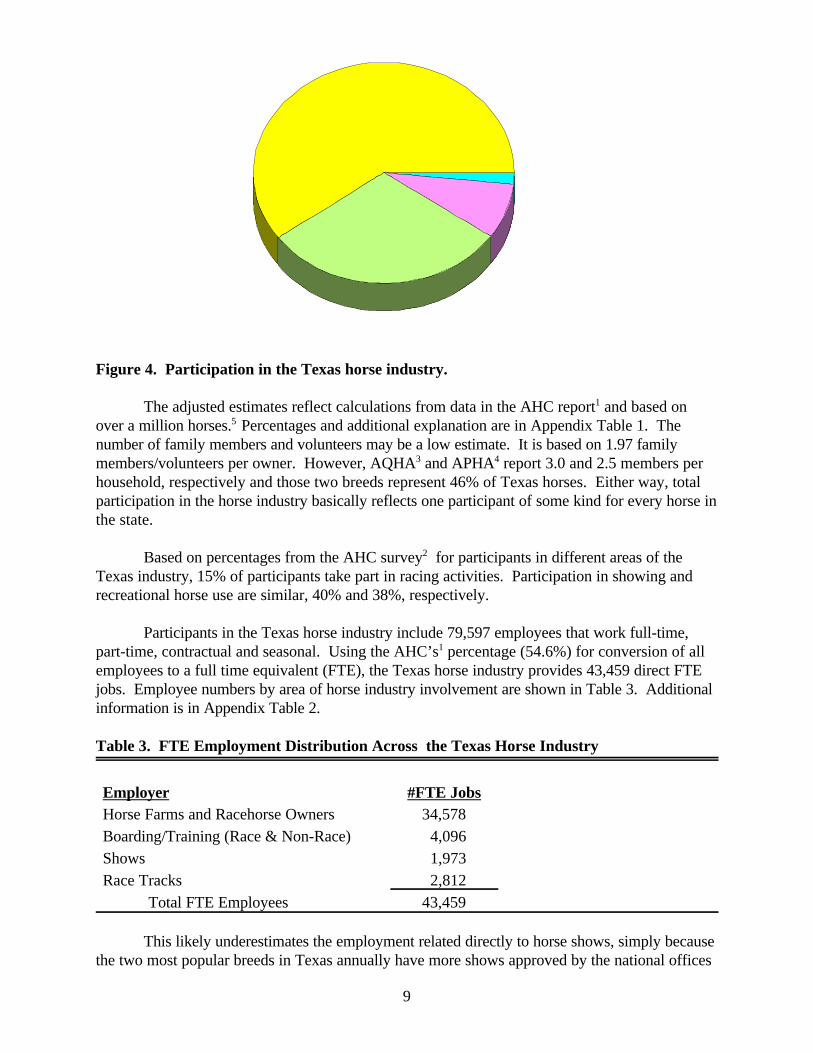
by horseowners, non-owner service providers and employees working for owners, serviceproviders, racetracks and horse show groups, as well as family members and volunteers. Basedon the internal estimate of the horse population, the AHC ratios indicate that 953,983 people inTexas fit the classification of a horse industry participant. This is expressed on a percentage basisby category of participation in Figure 4.
9
Figure 4. Participation in the Texas horse industry.
The adjusted estimates reflect calculations from data in the AHC report1 and based onover a million horses.5 Percentages and additional explanation are in Appendix Table 1. Thenumber of family members and volunteers may be a low estimate. It is based on 1.97 familymembers/volunteers per owner. However, AQHA3 and APHA4 report 3.0 and 2.5 members perhousehold, respectively and those two breeds represent 46% of Texas horses. Either way, totalparticipation in the horse industry basically reflects one participant of some kind for every horse inthe state.
Based on percentages from the AHC survey2 for participants in different areas of theTexas industry, 15% of participants take part in racing activities. Participation in showing andrecreational horse use are similar, 40% and 38%, respectively.
Participants in the Texas horse industry include 79,597 employees that work full-time,part-time, contractual and seasonal. Using the AHC’s1 percentage (54.6%) for conversion of allemployees to a full time equivalent (FTE), the Texas horse industry provides 43,459 direct FTEjobs. Employee numbers by area of horse industry involvement are shown in Table 3. Additionalinformation is in Appendix Table 2.
Table 3. FTE Employment Distribution Across the Texas Horse Industry
Employer #FTE JobsHorse Farms and Racehorse Owners 34,578Boarding/Training (Race & Non-Race) 4,096Shows 1,973Race Tracks 2,812 Total FTE Employees 43,459
This likely underestimates the employment related directly to horse shows, simply becausethe two most popular breeds in Texas annually have more shows approved by the national offices
10
than any other state.3,4 Furthermore, the state’s size and number of counties suggest a highernumber of local, non-association approved shows than other states. Horse farms provide overhalf (52.6%) of all FTE equine-related jobs in Texas. Employment by boarding/training facilitiesfor non-racing horses is essentially equal to that of similar facilities for race horses.
Nationwide, employment in the horse industry amounts to 77% of employment in themotion picture industry. It is 1.4 times higher than railroad transportation employment and 1.6times the number of people in radio and television broadcasting.2
In Texas, the horse industry employs 64% as many people as the feedlot, range and ranch-fed cattle industry. Horse industry employees are 2.9 times greater than the total employed by thepoultry/egg, sheep/lamb/goat and hog/pig/swine industries combined. The horse industry employs94% as many people as the cotton, feed grain and food grain industries combined.21
Employment in the Texas horse industry does not even begin to compare with retail orwholesale trade, construction or oil mining industries.21 Furthermore, it employs less than half ofthose employed by industries such as industrial machinery, electrical equipment and banking. However, the total horse industry employee estimate compares with several other major industriesas shown in Table 4.
Table 4. Similarities in employment by certain Texas industries.
Industry # of EmployeesAir Transportation 80,945Utilities 60,549Landscape & Horticultural Services 53,124Rubber Products 47,694Agricultural, Forestry, Fishery Services 46,079Wood Products 44,675
Horse 43,459Stone, Glass & Clay 40,389Transportation Services 40,005Scientific Instruments 38,883
According to calculations made from AHC data2, every direct industry job generates anaverage of 2.39 indirect and induced jobs. Those jobs represent 70.5 % of all jobs and total103,867. Indirect FTE jobs are created from spending by horse industry suppliers while inducedFTE jobs are those that come about because of spending by direct industry employees. By addingdirect, indirect and induced jobs, the horse industry impacts Texas employment by eitherproviding or generating 147,326 jobs.
11
INVESTMENT BY HORSE OWNERS
Barns and Land
According to the Texas survey, 83% of horseowners have barns, while 11% board theirhorses, and the remaining 6% keep horses either on land without a barn or at somebody else’sfacility.16 Consequently, there are an estimated 239,000 barns in Texas that are associated withhorse ownership and use of some kind. Reported ranges in barn values are in Table 5. Medianbarn value is $13,000.
Table 5. Ranges in barn values by owners responding to an eight county survey.16
% of Barn Owners Range in Barn Values Average by Group29% $500 - $5,000 $3,38020% 5,500 - 10,000 9,30016% 13,000 - 18,000 16,0009% 20,000 - 25,000 22,750
16% 30,000 - 55,000 44,10010% 55,000 - 500,000 237,000
Values of individual barns by survey respondents range from $500 to $500,000. The twomost commonly reported values for horse-related barns are $5,000 (11%) and $10,000 (16%) forowners of barns. Of those people who have barns for their horses, the inventory value equals$3,787 per horse. Thus, the total inventory value of horse barns and holding facilities in Texas is$3.36 billion with an average barn value of $14,012. In Texas, roughly 886,890 horses are ownedby households that have barns of some type. Owners report spending 3% of barn value annuallyon repairs and maintenance.
Approximately 11% of owners board their horses at some facility for a fee16, meaning thatabout 117,348 horses are in boarding facilities. The remaining 6% of owners keep 64,000 horseson land without a barn or else at somebody’s facility without a direct fee for boarding.
Texas horse owners keep horses on land that is owned and/or leased ranging from oneacre to literally thousands of acres. Suburban horse keeping on small acreage is quite evidentthroughout the state, representing the use of horses for recreation, competition and even smallbreeding enterprises. However, there are numerous ranches in Texas that keep and breed largenumbers of horses. For example, AQHA reports29 that the Four Sixes (6666) Ranch keeps aremuda of 240 geldings for use in the management of 8,500 head of cattle. The W.T. WaggonerEstate, headquartered in Vernon, Texas runs 12,000 cows on over a half million acres with aremuda of 150 ranch geldings. With such variation in land holdings, it is difficult to assess theacreage devoted to horses. Many owners also have cattle, sheep and goats. For instance, amongThoroughbred owners alone, 54% also own cattle and 10% own sheep or goats.8 The multi-specie ownership often results in larger reported acreage than might be expected.
12
Trucks and Trailers
All but one of the respondents in the eight county survey report owning a towing vehicleand trailer.16 Average prices and end-of-year 1996 values, determined either by actual orestimated depreciation, are shown in Table 6.
Table 6. Average purchase prices and end-of-year values for towing vehicles and trailersreported by horse owners in an eight county survey.16
ItemAverage
Purchase PriceAverage
End Of Year ValueTowing Vehicle $22,948 $18,037
Horse Trailer 8,729 7,660
Total $31,677 $25,697
Original purchase prices of towing vehicles range from $1,800 for a used pickup to$42,000 for a new vehicle. Average price of $22,948 is similar to $21,646 reported in anothersurvey.18 Initial purchase prices of trailers range from $150 for a used trailer to $45,000 for a newtrailer. Average trailer price of $8,729 is comparable to $9,340 in other survey work.18
Using end-of-year 1996 values supplied by horse owners for vehicles and trailers, the totalinventory value of towing vehicles and trailers in Texas is determined estimating that 98% ofhorse owners have such equipment.16 The inventory value of towing vehicles (pickups, trucks,suburbans, etc.) totals $5,091,399,225. Obviously, not all of that inventory can be attributedentirely to the horse industry, because such vehicles often are used for multiple purposes. Theinventory value for all Texas horse trailers is $2,162,228,645. Combined inventory value is$7,253,627,870.
Tack and Related Equipment
The average horse owning household has invested $7,858 in saddles, bridles, halters,saddle pads, blankets/sheets, brushes, protective boots/leg wraps and chaps.16 It would bedifficult to represent this on a per horse basis, because many items have been acquired overnumerous years and several horses. Even so, without determining depreciated value, the newprice inventory value of tack for all horse owning households is $2,395,118,400. This translatesinto an average investment of $2500 per horse industry participant. Furthermore, the averagehorse owning household spends $1,518 annually on hats, boots and other horse related apparel.
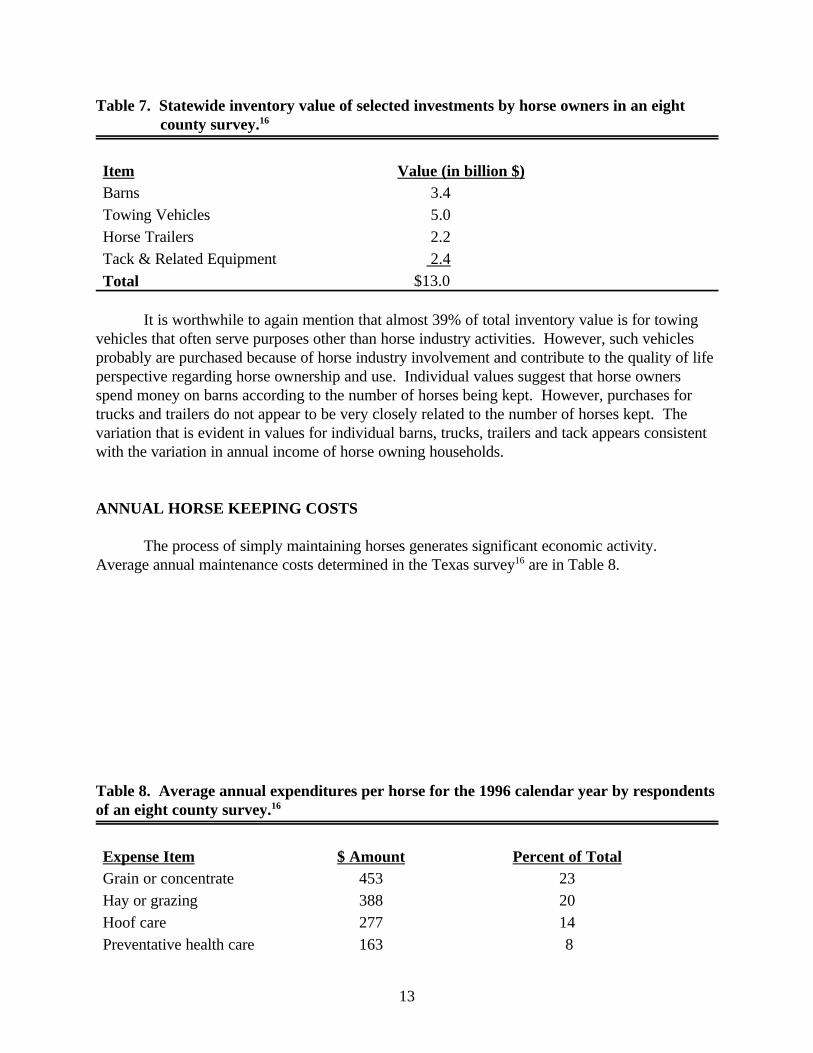
Table 7 contains the overall inventory value of specific investments by horse owners inTexas. Prices or value for land, related equipment such as tractors and other equipment are notincluded.
13
Table 7. Statewide inventory value of selected investments by horse owners in an eight county survey.16
Item Value (in billion $)Barns 3.4Towing Vehicles 5.0Horse Trailers 2.2Tack & Related Equipment 2.4
Total $13.0
It is worthwhile to again mention that almost 39% of total inventory value is for towingvehicles that often serve purposes other than horse industry activities. However, such vehiclesprobably are purchased because of horse industry involvement and contribute to the quality of lifeperspective regarding horse ownership and use. Individual values suggest that horse ownersspend money on barns according to the number of horses being kept. However, purchases fortrucks and trailers do not appear to be very closely related to the number of horses kept. Thevariation that is evident in values for individual barns, trucks, trailers and tack appears consistentwith the variation in annual income of horse owning households.
ANNUAL HORSE KEEPING COSTS
The process of simply maintaining horses generates significant economic activity. Average annual maintenance costs determined in the Texas survey16 are in Table 8.
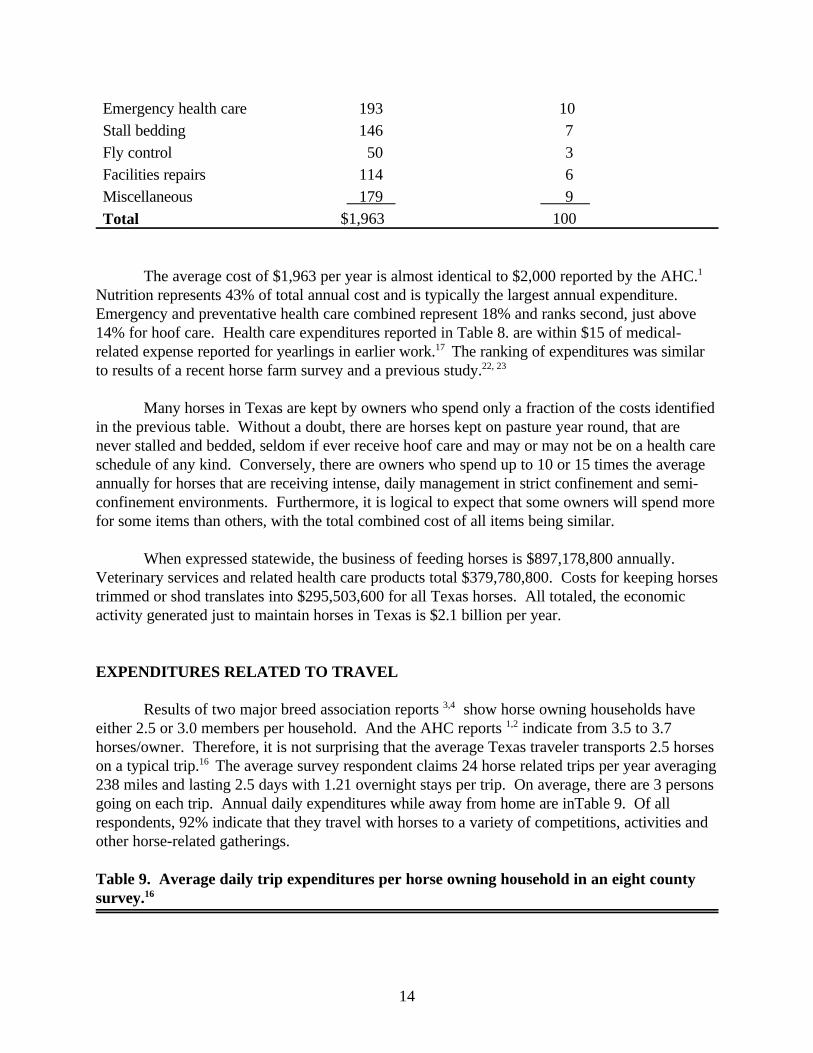
Table 8. Average annual expenditures per horse for the 1996 calendar year by respondentsof an eight county survey.16
Expense Item $ Amount Percent of TotalGrain or concentrate 453 23Hay or grazing 388 20Hoof care 277 14Preventative health care 163 8
14
Emergency health care 193 10Stall bedding 146 7Fly control 50 3Facilities repairs 114 6Miscellaneous 179 9
Total $1,963 100
The average cost of $1,963 per year is almost identical to $2,000 reported by the AHC.1 Nutrition represents 43% of total annual cost and is typically the largest annual expenditure. Emergency and preventative health care combined represent 18% and ranks second, just above14% for hoof care. Health care expenditures reported in Table 8. are within $15 of medical-related expense reported for yearlings in earlier work.17 The ranking of expenditures was similarto results of a recent horse farm survey and a previous study.22, 23
Many horses in Texas are kept by owners who spend only a fraction of the costs identifiedin the previous table. Without a doubt, there are horses kept on pasture year round, that arenever stalled and bedded, seldom if ever receive hoof care and may or may not be on a health careschedule of any kind. Conversely, there are owners who spend up to 10 or 15 times the averageannually for horses that are receiving intense, daily management in strict confinement and semi-confinement environments. Furthermore, it is logical to expect that some owners will spend morefor some items than others, with the total combined cost of all items being similar.
When expressed statewide, the business of feeding horses is $897,178,800 annually. Veterinary services and related health care products total $379,780,800. Costs for keeping horsestrimmed or shod translates into $295,503,600 for all Texas horses. All totaled, the economicactivity generated just to maintain horses in Texas is $2.1 billion per year.
EXPENDITURES RELATED TO TRAVEL
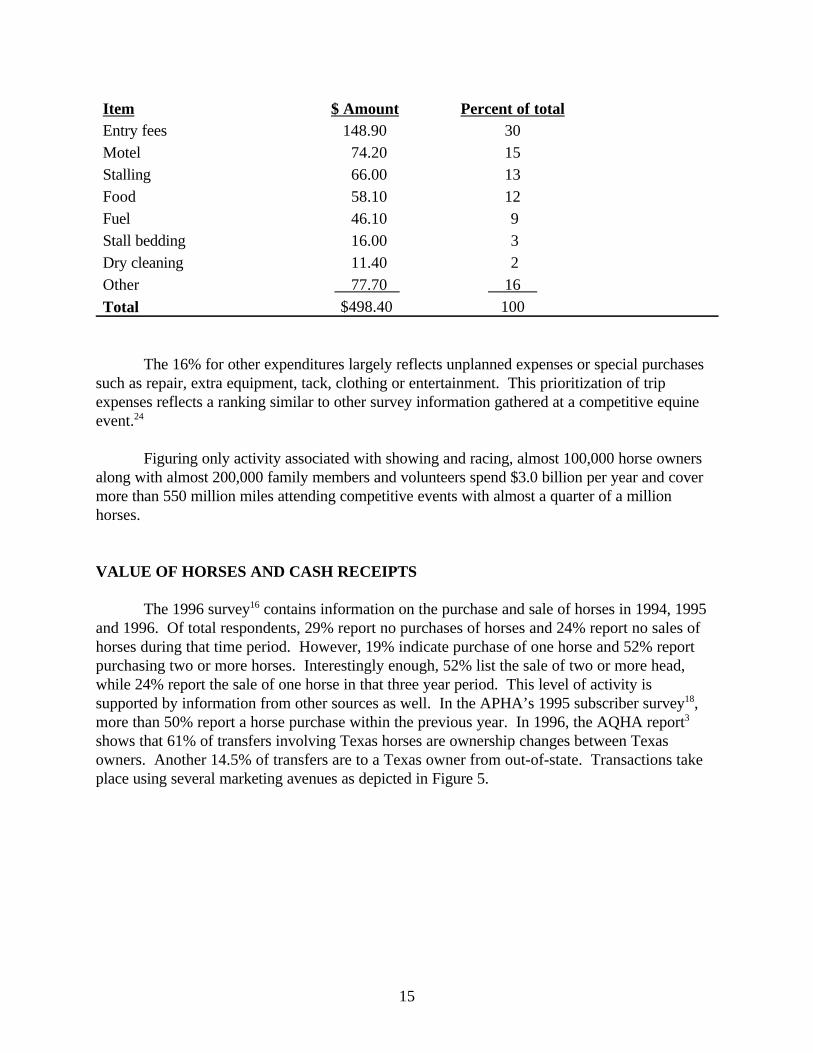
Results of two major breed association reports 3,4 show horse owning households haveeither 2.5 or 3.0 members per household. And the AHC reports 1,2 indicate from 3.5 to 3.7horses/owner. Therefore, it is not surprising that the average Texas traveler transports 2.5 horseson a typical trip.16 The average survey respondent claims 24 horse related trips per year averaging238 miles and lasting 2.5 days with 1.21 overnight stays per trip. On average, there are 3 personsgoing on each trip. Annual daily expenditures while away from home are inTable 9. Of allrespondents, 92% indicate that they travel with horses to a variety of competitions, activities andother horse-related gatherings.
Table 9. Average daily trip expenditures per horse owning household in an eight countysurvey.16
15
Item $ Amount Percent of totalEntry fees 148.90 30Motel 74.20 15Stalling 66.00 13Food 58.10 12Fuel 46.10 9Stall bedding 16.00 3Dry cleaning 11.40 2Other 77.70 16
Total $498.40 100
The 16% for other expenditures largely reflects unplanned expenses or special purchasessuch as repair, extra equipment, tack, clothing or entertainment. This prioritization of tripexpenses reflects a ranking similar to other survey information gathered at a competitive equineevent.24
Figuring only activity associated with showing and racing, almost 100,000 horse ownersalong with almost 200,000 family members and volunteers spend $3.0 billion per year and covermore than 550 million miles attending competitive events with almost a quarter of a millionhorses.
VALUE OF HORSES AND CASH RECEIPTS
The 1996 survey16 contains information on the purchase and sale of horses in 1994, 1995and 1996. Of total respondents, 29% report no purchases of horses and 24% report no sales ofhorses during that time period. However, 19% indicate purchase of one horse and 52% reportpurchasing two or more horses. Interestingly enough, 52% list the sale of two or more head,while 24% report the sale of one horse in that three year period. This level of activity issupported by information from other sources as well. In the APHA’s 1995 subscriber survey18,more than 50% report a horse purchase within the previous year. In 1996, the AQHA report3
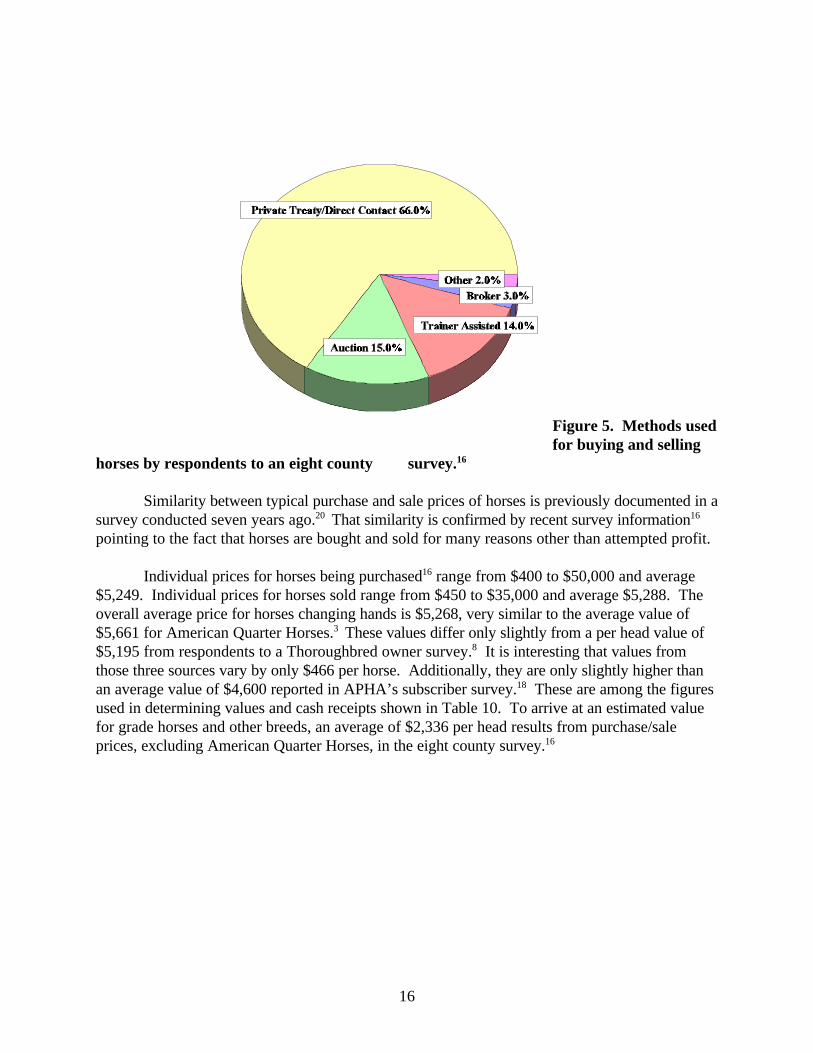
shows that 61% of transfers involving Texas horses are ownership changes between Texasowners. Another 14.5% of transfers are to a Texas owner from out-of-state. Transactions takeplace using several marketing avenues as depicted in Figure 5.
16
Figure 5. Methods usedfor buying and selling
horses by respondents to an eight county survey.16
Similarity between typical purchase and sale prices of horses is previously documented in asurvey conducted seven years ago.20 That similarity is confirmed by recent survey information16
pointing to the fact that horses are bought and sold for many reasons other than attempted profit.
Individual prices for horses being purchased16 range from $400 to $50,000 and average$5,249. Individual prices for horses sold range from $450 to $35,000 and average $5,288. Theoverall average price for horses changing hands is $5,268, very similar to the average value of$5,661 for American Quarter Horses.3 These values differ only slightly from a per head value of$5,195 from respondents to a Thoroughbred owner survey.8 It is interesting that values fromthose three sources vary by only $466 per horse. Additionally, they are only slightly higher thanan average value of $4,600 reported in APHA’s subscriber survey.18 These are among the figuresused in determining values and cash receipts shown in Table 10. To arrive at an estimated valuefor grade horses and other breeds, an average of $2,336 per head results from purchase/saleprices, excluding American Quarter Horses, in the eight county survey.16
17
Table 10. Values and percentages used to estimate total value and 1996 cash receipts forTexas horses.
Breed or Type $Value
(per head)Total $Value
%Transfers
TotalTransfers
CashReceipts
Quarter Horse 5,661 2,545,066,719 7.4 33,269 188,335,809
Paint 4,660 181,644,800 12.4 4,897 22,526,200
Arabian 5,268 164,150,880 7.8 2,430 12,801,240
Thorougbred 5,195 98,351,740 7.4 1,401 7,278,195
Other Registered 5,268 253,132,668 7.4 3,556 18,733,008
Grade/Others 2,336 956,903,296 7.4 30,598 71,476,928
Slaughter 575 38,009,800 66,104 38,009,800
Totals $4,237,259,903 $142,255 $354,161,180
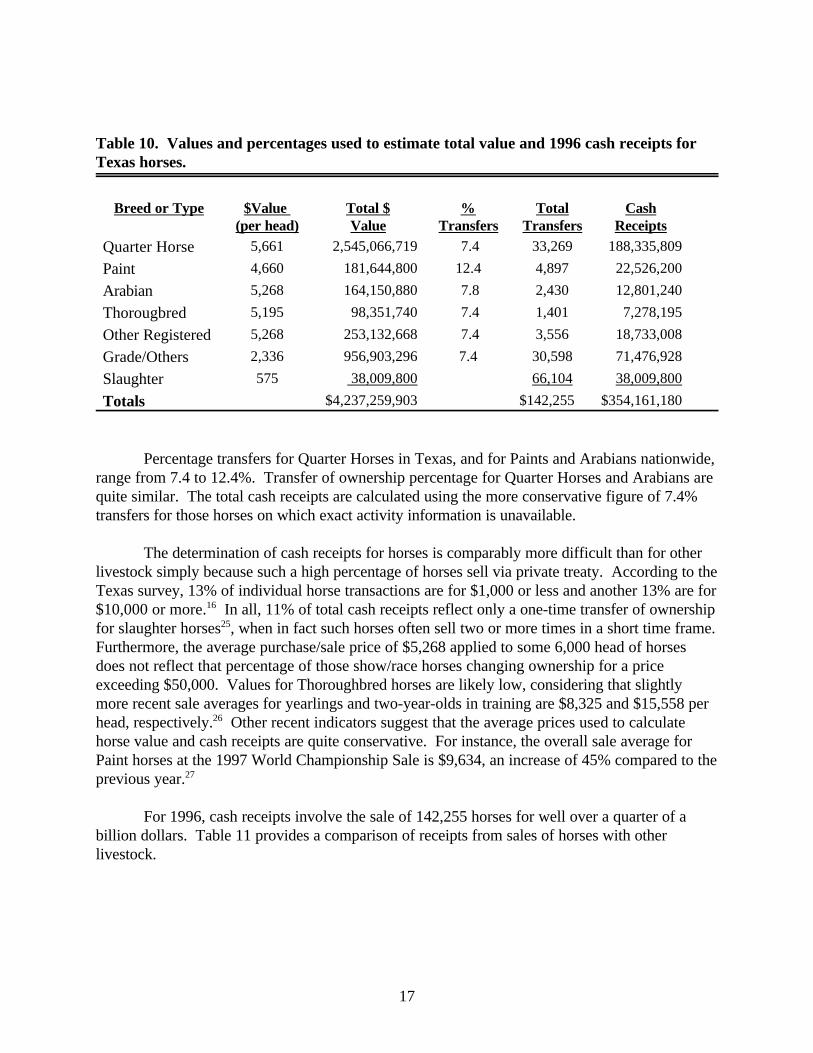
Percentage transfers for Quarter Horses in Texas, and for Paints and Arabians nationwide,range from 7.4 to 12.4%. Transfer of ownership percentage for Quarter Horses and Arabians arequite similar. The total cash receipts are calculated using the more conservative figure of 7.4%transfers for those horses on which exact activity information is unavailable.
The determination of cash receipts for horses is comparably more difficult than for otherlivestock simply because such a high percentage of horses sell via private treaty. According to theTexas survey, 13% of individual horse transactions are for $1,000 or less and another 13% are for$10,000 or more.16 In all, 11% of total cash receipts reflect only a one-time transfer of ownershipfor slaughter horses25, when in fact such horses often sell two or more times in a short time frame. Furthermore, the average purchase/sale price of $5,268 applied to some 6,000 head of horsesdoes not reflect that percentage of those show/race horses changing ownership for a priceexceeding $50,000. Values for Thoroughbred horses are likely low, considering that slightlymore recent sale averages for yearlings and two-year-olds in training are $8,325 and $15,558 perhead, respectively.26 Other recent indicators suggest that the average prices used to calculatehorse value and cash receipts are quite conservative. For instance, the overall sale average forPaint horses at the 1997 World Championship Sale is $9,634, an increase of 45% compared to theprevious year.27
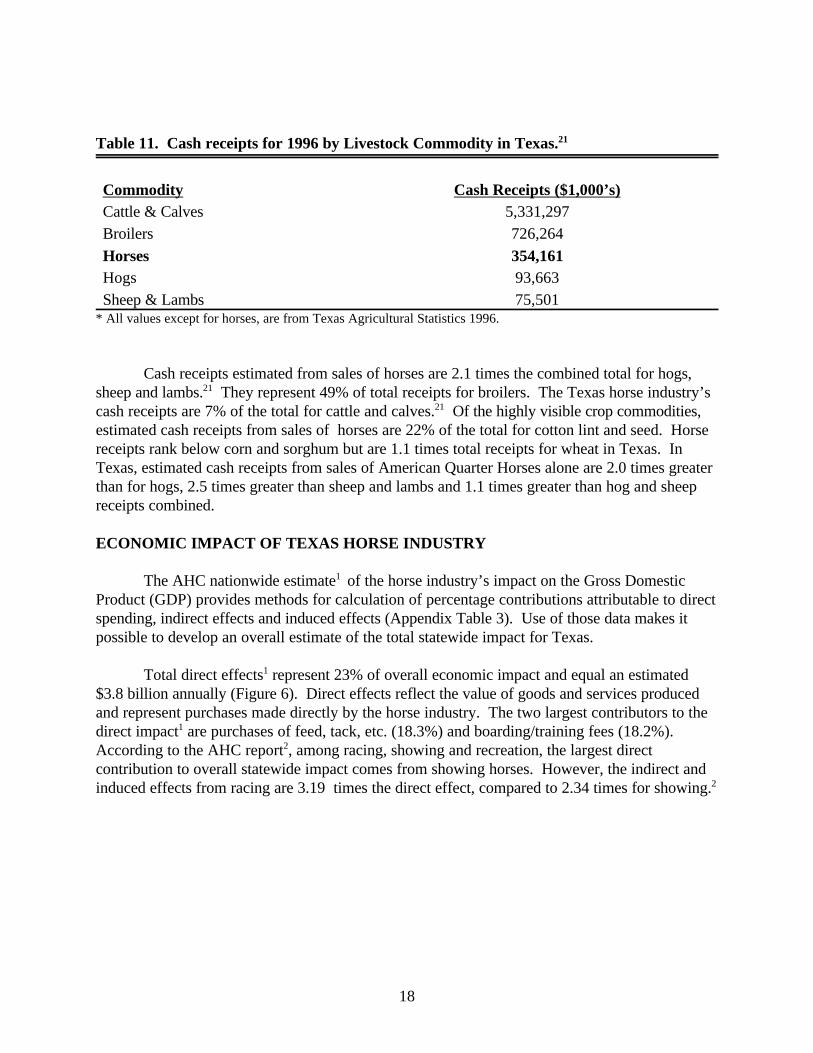
For 1996, cash receipts involve the sale of 142,255 horses for well over a quarter of abillion dollars. Table 11 provides a comparison of receipts from sales of horses with otherlivestock.
18
Table 11. Cash receipts for 1996 by Livestock Commodity in Texas.21
Commodity Cash Receipts ($1,000’s)Cattle & Calves 5,331,297Broilers 726,264
Horses 354,161Hogs 93,663Sheep & Lambs 75,501
* All values except for horses, are from Texas Agricultural Statistics 1996.
Cash receipts estimated from sales of horses are 2.1 times the combined total for hogs,sheep and lambs.21 They represent 49% of total receipts for broilers. The Texas horse industry’scash receipts are 7% of the total for cattle and calves.21 Of the highly visible crop commodities,estimated cash receipts from sales of horses are 22% of the total for cotton lint and seed. Horsereceipts rank below corn and sorghum but are 1.1 times total receipts for wheat in Texas. InTexas, estimated cash receipts from sales of American Quarter Horses alone are 2.0 times greaterthan for hogs, 2.5 times greater than sheep and lambs and 1.1 times greater than hog and sheepreceipts combined.
ECONOMIC IMPACT OF TEXAS HORSE INDUSTRY
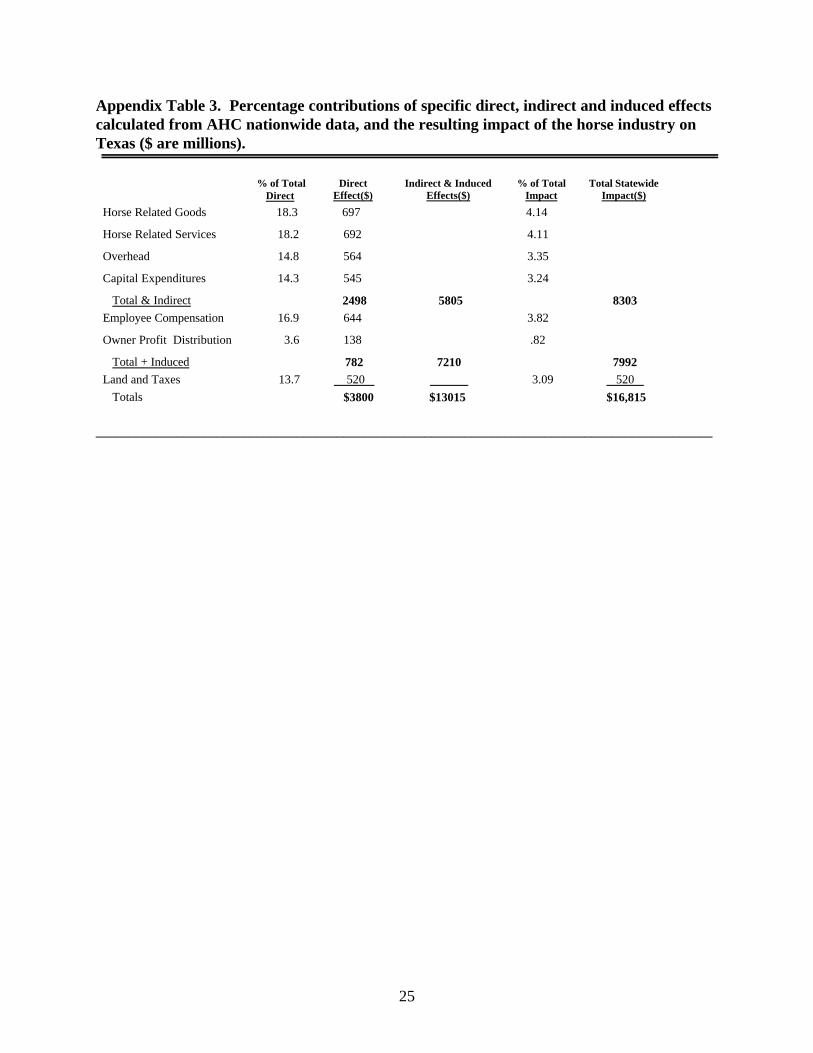
The AHC nationwide estimate1 of the horse industry’s impact on the Gross DomesticProduct (GDP) provides methods for calculation of percentage contributions attributable to directspending, indirect effects and induced effects (Appendix Table 3). Use of those data makes itpossible to develop an overall estimate of the total statewide impact for Texas.
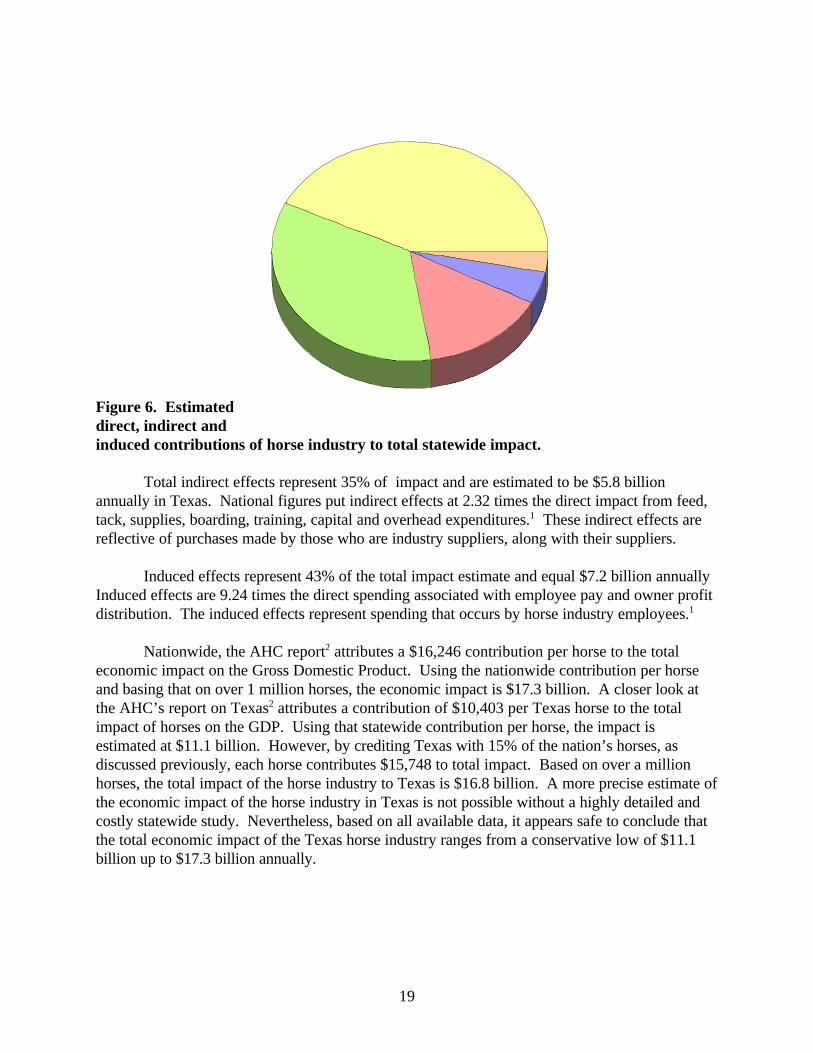
Total direct effects1 represent 23% of overall economic impact and equal an estimated$3.8 billion annually (Figure 6). Direct effects reflect the value of goods and services producedand represent purchases made directly by the horse industry. The two largest contributors to thedirect impact1 are purchases of feed, tack, etc. (18.3%) and boarding/training fees (18.2%). According to the AHC report2, among racing, showing and recreation, the largest directcontribution to overall statewide impact comes from showing horses. However, the indirect andinduced effects from racing are 3.19 times the direct effect, compared to 2.34 times for showing.2
19
Figure 6. Estimateddirect, indirect andinduced contributions of horse industry to total statewide impact.
Total indirect effects represent 35% of impact and are estimated to be $5.8 billionannually in Texas. National figures put indirect effects at 2.32 times the direct impact from feed,tack, supplies, boarding, training, capital and overhead expenditures.1 These indirect effects arereflective of purchases made by those who are industry suppliers, along with their suppliers.
Induced effects represent 43% of the total impact estimate and equal $7.2 billion annuallyInduced effects are 9.24 times the direct spending associated with employee pay and owner profitdistribution. The induced effects represent spending that occurs by horse industry employees.1
Nationwide, the AHC report2 attributes a $16,246 contribution per horse to the totaleconomic impact on the Gross Domestic Product. Using the nationwide contribution per horseand basing that on over 1 million horses, the economic impact is $17.3 billion. A closer look atthe AHC’s report on Texas2 attributes a contribution of $10,403 per Texas horse to the totalimpact of horses on the GDP. Using that statewide contribution per horse, the impact isestimated at $11.1 billion. However, by crediting Texas with 15% of the nation’s horses, asdiscussed previously, each horse contributes $15,748 to total impact. Based on over a millionhorses, the total impact of the horse industry to Texas is $16.8 billion. A more precise estimate ofthe economic impact of the horse industry in Texas is not possible without a highly detailed andcostly statewide study. Nevertheless, based on all available data, it appears safe to conclude thatthe total economic impact of the Texas horse industry ranges from a conservative low of $11.1billion up to $17.3 billion annually.
20
SUMMARY
The Texas horse industry is significant in the lives of people who keep, use and enjoyhorses, and it makes a noticeable contribution to the economy of the state. Almost one millionparticipants are involved in various aspects of an industry revolving around just over one millionhorses. Contributions that horses make to the quality of life for Texas citizens are welldocumented. The Texas horse industry generates or provides over 140,000 full-time-equivalentjobs, yet many people participate simply for the pleasure and recreational benefits obtained frominvolvement with horses.
Over a quarter of a million households have billions of dollars invested in horses and horserelated equipment. Travel with Texas horses creates well over $3 billion in travel relatedspending, and the enjoyment of competition has a bigger direct effect on the economic impactthan racing alone, or on just the pure recreational use of horses. However, indirect and inducedeffects from racing make a comparably higher contribution to total impact.
Texas horses play many roles and many have multiple use for competition and recreationalor leisure riding. The demand for horses is met, in part, by the use of over 200,000 horses forbreeding purposes. Part of a strong Texas heritage exists yet today with the continuing use ofhorses for field work, ranch work and feedlot duties. And even though Texas has long been homefor some well known race horses, this state’s presence in the total racing industry continues togrow. Texas citizens at all socio-economic levels own horses at a wide variety of prices. It alladds up to an industry with a multi-billion dollar impact on the economy and significant impact onthe lives of many Texas citizens.
21
References and Contacts
1. A.H.C. 1996. The economic impact of the horse industry in the United States. Volume 1: National Summary. American Horse Council Foundation report prepared by PolicyEconomics Practice, Barents Group LLC. December, 1996. 43 pages.
2. A.H.C. 1996. The economic impact of the horse industry in the United States. Volume 2: Estimates for eleven focus states. American Horse Council Foundation report prepared byPolicy Economics Practice, Barents Group LLC. January, 1996 35 pages.
3. A.Q.H.A. 1996. American Quarter Horse Association Annual Report for the year. P.O. Box200, Amarillo, Texas. 79168. 40 pages.
4. A.P.H.A. 1996. American Paint Horse Association annual report. P.O. Box 961023, Ft.Worth, Texas. 76161. 29 pages.
5. Jones, L.L., D.D. Householder, P.G. Gibbs and G.D. Potter. 1993. Population estimates forthe Texas horse industry. Departmental Information Report No. 94-2. Texas A&MUniversity. 25 pages.
6a. A.R.H.A. 1996. Arabian Horse Registry of America. 12000 Zuni St., Westminster,Colorado. 80234-2300.
6b. I.A.H.A. 1996. International Arabian Horse Association. P.O. Box 33696, Denver,Colorado. 80233-0696.
7. A.H.C. 1996. Appaloosa Horse Club, Inc.
8. T.T.B.A. 1996. TTBA Membership Survey. Texas Thoroughbred Breeders Association. P.O. Box 14967, Austin, Texas. 78761.
9. A.M.H.A. 1996. American Miniature Horse Association, Inc. Alvarado, Texas.
10. G.H.B.A. 1996. Galiceno Horse Breeders Association. Box 219, Godley, Texas. 76044.
11. A.S.H.A. 1995 American Saddlebred Horse Association. 4093 Iron Works Pike,Lexington, Kentucky. 40511-8434.
12. A.M.H.A. 1996. American Morgan Horse Association, Inc. P.O. Box 960, Shelburne,Vermont. 05482-0960.
13. U.S.T.A. 1996. United States Trotting Association. 750 Michigan Avenue, Columbus,Ohio. 43215-1191.
22
14. C.B.U.S.A. 1996. Clydesdale breeders of the U.S.A. 17378 Kelly Road, Pecatonica,Illinois. 61063.
15. H.A.A. 1996. Haflinger Association of America. Hemlock, Michigan.
16. Gibbs, P.G., M.R. Benefield, G.D. Potter, J.. McNeill, B.H. Johnson and W. Moyer. 1997. Profile of horse ownership and use in 8 Texas counties - Phase 2 of the Texas horseindustry quality audit. In Proc. 15th Eq. Nutr. Physiol. Soc. Ft. Worth, Texas. p. 321-325.
17. Outlaw, J.L., R.C. Sayles and L.L. Jones. 1995. Economic break-even analysis of Texashorse breeding farms. Departmental Information Report No. 95-2. Department ofAgricultural Economics. Texas A&M University. College Station, Texas.
18. A.P.H.A. 1995. Paint Horse Journal Subscriber Profile. Ft. Worth, Texas. 5 pages.
19. McMillan, T. 1996. Report on equine activities. Taylor County Exposition Center. Abilene, Texas.
20. A.Q.H.A. 1994. The AQHA member survey and activity index. American Quarter HorseAssociation. Amarillo, Texas. 16 pages.
21. Texas Agricultural Statistics. 1996. Texas Agricultural Statistics Service. TexasDepartment of Agriculture. Austin, Texas. 159 pages.
22. Merck, Ag-Vet, D.D. Householder and P.G. Gibbs. 1990. Texas horseowners study of 4Texas counties. Texas Agricultural Extension Service. College Station, Texas.
23. Gibbs, P.G. N.D. Cohen and E.T. Dresser. 1997. Early management of race-bred weanlingsand yearlings on Texas farms - Phase 1 of the Texas horse industry quality audit. In Proc.15th Eq. Nutr. Physiol. Soc. Ft. Worth, Texas. p. 203-208.
24. Finch, G. 1989. Evaluation of the Athens, Texas’ AQHA Summer Jubilee. HendersonCounty Extension. Texas Agricultural Extension Service. Texas A&M UniversitySystem. College Station, Texas.
25. Sherrill, K. 1996. Number of horses slaughtered in Texas. State Comptroller’s Office. Austin, Texas.
26. T.T.B.A. 1997. Fasig-Tipton Co., Inc. Texas Summer yearling sale. In the Texas Thoroughbred. September/October issue. Texas Thoroughbred Breeder’s Association. Austin, Texas.
27. A.P.H.A. 1997. Paint world sets new records. In the APHA Judges Newsletter. Fall issue. American Paint Horse Association. Ft. Worth, Texas.
23
28. Fitch, P. 1997. Employment figures for Texas racetracks and racehorse owners. The Texas Racing Commission. Austin, Texas.
29. A.Q.H.A. 1997. AQHA Update. Fall Issue. The American Quarter Horse Association. Volume 10, No. 2. p. 15-16.
24
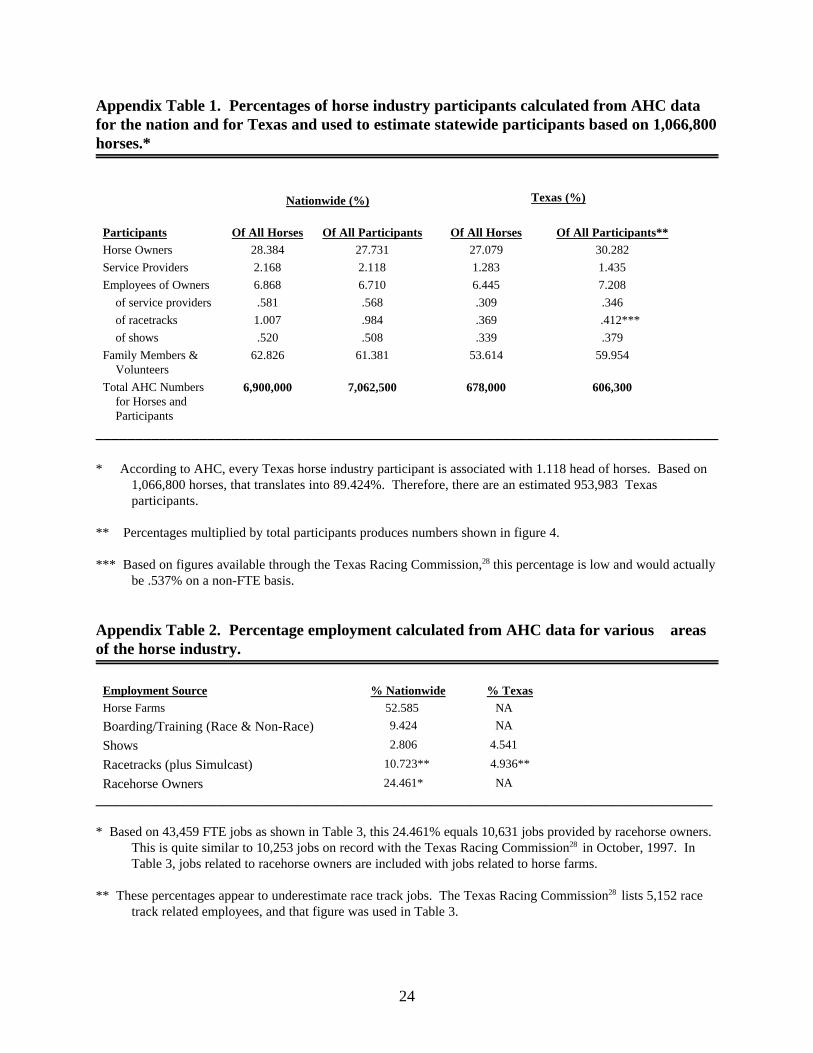
Appendix Table 1. Percentages of horse industry participants calculated from AHC datafor the nation and for Texas and used to estimate statewide participants based on 1,066,800horses.*
Nationwide (%) Texas (%)
Participants Of All Horses Of All Participants Of All Horses Of All Participants**Horse Owners 28.384 27.731 27.079 30.282
Service Providers 2.168 2.118 1.283 1.435
Employees of Owners 6.868 6.710 6.445 7.208
of service providers .581 .568 .309 .346
of racetracks 1.007 .984 .369 .412***
of shows .520 .508 .339 .379
Family Members & Volunteers
62.826 61.381 53.614 59.954
Total AHC Numbers for Horses and Participants
6,900,000 7,062,500 678,000 606,300
______________________________________________________________________________
* According to AHC, every Texas horse industry participant is associated with 1.118 head of horses. Based on1,066,800 horses, that translates into 89.424%. Therefore, there are an estimated 953,983 Texasparticipants.
** Percentages multiplied by total participants produces numbers shown in figure 4.
*** Based on figures available through the Texas Racing Commission,28 this percentage is low and would actuallybe .537% on a non-FTE basis.
Appendix Table 2. Percentage employment calculated from AHC data for various areasof the horse industry.
Employment Source % Nationwide % TexasHorse Farms 52.585 NA
Boarding/Training (Race & Non-Race) 9.424 NA
Shows 2.806 4.541
Racetracks (plus Simulcast) 10.723** 4.936**
Racehorse Owners 24.461* NA
____________________________________________________________________________________________
* Based on 43,459 FTE jobs as shown in Table 3, this 24.461% equals 10,631 jobs provided by racehorse owners. This is quite similar to 10,253 jobs on record with the Texas Racing Commission28 in October, 1997. InTable 3, jobs related to racehorse owners are included with jobs related to horse farms.
** These percentages appear to underestimate race track jobs. The Texas Racing Commission28 lists 5,152 racetrack related employees, and that figure was used in Table 3.
25
Appendix Table 3. Percentage contributions of specific direct, indirect and induced effectscalculated from AHC nationwide data, and the resulting impact of the horse industry onTexas ($ are millions).
% of TotalDirect
DirectEffect($)
Indirect & InducedEffects($)
% of TotalImpact
Total StatewideImpact($)
Horse Related Goods 18.3 697 4.14
Horse Related Services 18.2 692 4.11
Overhead 14.8 564 3.35
Capital Expenditures 14.3 545 3.24
Total & Indirect 2498 5805 8303Employee Compensation 16.9 644 3.82
Owner Profit Distribution 3.6 138 .82
Total + Induced 782 7210 7992Land and Taxes 13.7 520 3.09 520
Totals $3800 $13015 $16,815
____________________________________________________________________________________________
26
Author Acknowledgments
The Texas Horse Industry Quality Audit project began with input from John W. McNeill,Associate Department Head for Extension - Animal Science. He encouraged a process to startassessing the status and needs of the Texas horse industry and contributed to the design of thestudy.
Bryan H. Johnson, Head of the Animal Science Department, helped provide the start upfunding by support of a $2,200 mini-grant for the audit work from the Houston Livestock Show& Rodeo. He served on the design team and all planning meetings.
Bill Moyer, Head of Large Animal Medicine and Surgery at Texas A&M’s College ofVeterinary Medicine, appropriated $7,500 in funding over the course of 12 months. That supportkept the project tracking. He played a role in decisions on data collections.
Michael Benefield, former Extension Assistant for Animal Science/4-H, assisted incontacts with individual breed registries and in compiling various audit information.
Lonnie L. Jones, Professor of Agricultural Economics, developed the report onPopulation Estimates for the Texas Horse Industry which serves as a basis for determining theindustry’s overall size and impact. He provided critical review of the procedures used inestimating economic impact.
Gary D. Potter, Professor and Equine Science Section Leader in Animal Science,contributed information, organizational details, data interpretation and critical review of phase 2work and this overall report.
Pete G. Gibbs, Professor and Extension Horse Specialist, was charged with theresponsibility of giving lead to the project as a formal plan-of-work objective. He developed thesurveys, conducted routine communication with project team members, assembled the datagenerated both in-state and obtained from other sources.
Resource and Support Acknowledgements
Noah D. Cohen, Assistant Professor of Large Animal Medicine and Surgery, and E.T.Dresser, Graduate Student, participated in phase 1. This first phase was a joint effort betweenthe Department of Animal Science and Large Animal Medicine and Surgery. It targeted Quarterhorse and Thoroughbred farms in Texas to gather information on early management of race-bredweanlings and yearlings. A 54% response rate was achieved from the 110 farms originallyidentified with assistance from the Texas Quarter Horse Association and the TexasThoroughbred Breeders’ Association. Results of that study were published in the proceedings

27
of the Equine Nutrition and Physiology Society and presented at the 15th society meeting inMay, 1997.
Eight County Extension Agents participated in phase 2: Wes Allison - Walker County,Gary Antilley - King County, Robert Devin - Randall County, Jerry Jackson - Wood County,Greg Kaase - Brazos County, Earnest Kiker - Midland County, Robert Roark - AndrewsCounty and Doug Shores - Harris County. A survey was developed and then distributed to horseowners. With a 34% response, data was gathered on horse ownership and use representing 12breeds of horses. Results were also published in the proceedings of the 15th Equine Nutrition andPhysiology Society. Portions of that study were also published in the December, 1997proceedings of the 43rd Annual American Association of Equine Practitioners Convention.
The American Quarter Horse Association, particularly through Trigg Rentfro, and theAmerican Paint Horse Association supplied annual report and activity index information. TheTexas Thoroughbred Breeders Association provided contact sources for Thoroughbredinformation and helped with interpretation of some of their membership survey data.
Kang Yu, Agricultural Economics graduate student, provided comparables foremployment figures and output of various Texas industries.
Gary Preuss, State Comptroller’s Office in Austin, assisted with gross state product andemployment data for different industries.
Patricia Fitch with the Texas Racing Commission provided race track and racehorseowner employment figures.
The American Horse Council’s reports on the Economic Impact of the Horse Industry,which were prepared by the Barent’s Group LLC, must be acknowledged for providing overallsupport and visibility to the horse industry. Those two copyrighted volumes contain valuableinformation that permitted calculation of percentages used in making adjustments to Texasnumbers and values in this report. Both American Horse Council publications are referencednumerous times throughout this report.