Embed Size (px)
Citation preview
The TH17 Cell, IL23, and IL17 in PsA, SpA, and Psoriasis:
Pathobiology and Therapeutic Targeting
Philip Mease MD
Director, Rheumatology Research, Swedish Medical Center
Clinical Professor, University of Washington School of Medicine
Seattle, WA
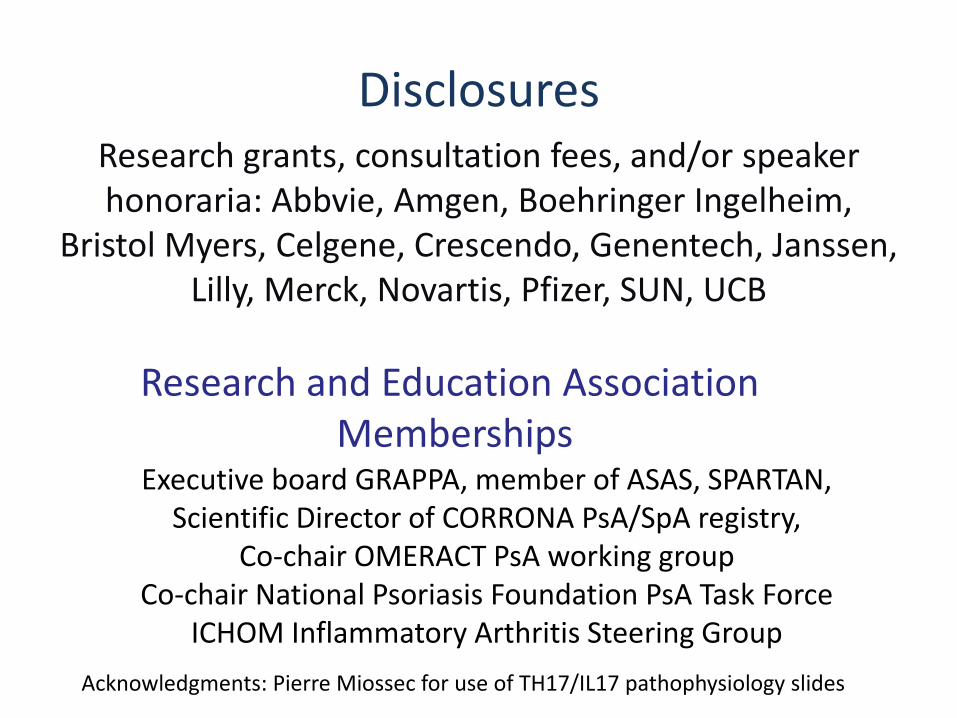
DisclosuresResearch grants, consultation fees, and/or speaker honoraria: Abbvie, Amgen, Boehringer Ingelheim,
Bristol Myers, Celgene, Crescendo, Genentech, Janssen, Lilly, Merck, Novartis, Pfizer, SUN, UCB
Executive board GRAPPA, member of ASAS, SPARTAN, Scientific Director of CORRONA PsA/SpA registry,
Co-chair OMERACT PsA working groupCo-chair National Psoriasis Foundation PsA Task Force
ICHOM Inflammatory Arthritis Steering Group
Research and Education Association Memberships
Acknowledgments: Pierre Miossec for use of TH17/IL17 pathophysiology slides
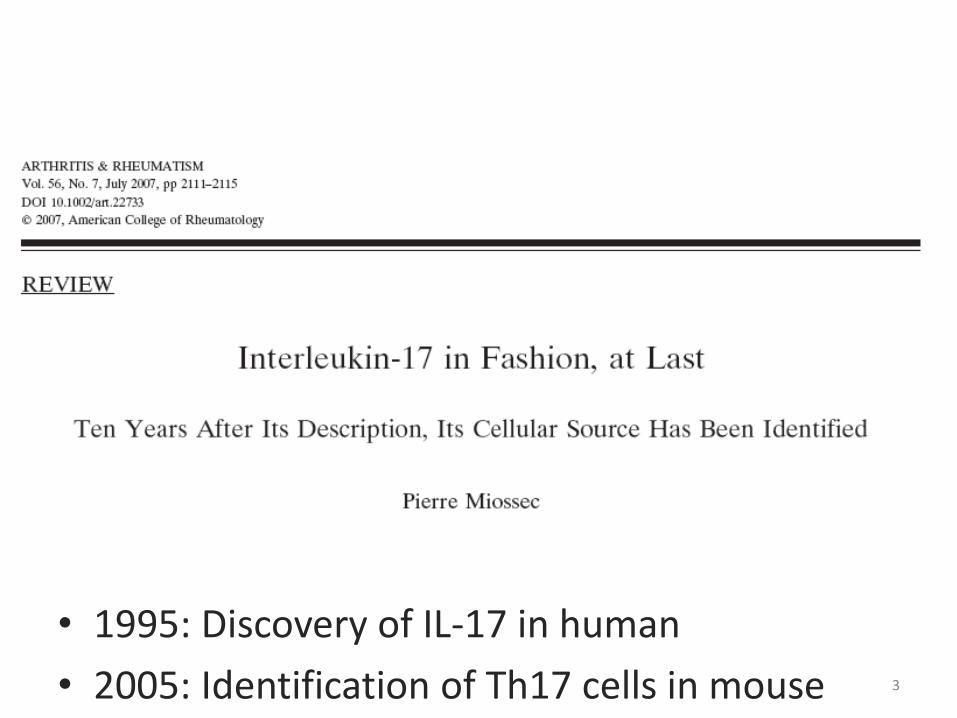
• 1995: Discovery of IL-17 in human
• 2005: Identification of Th17 cells in mouse 3
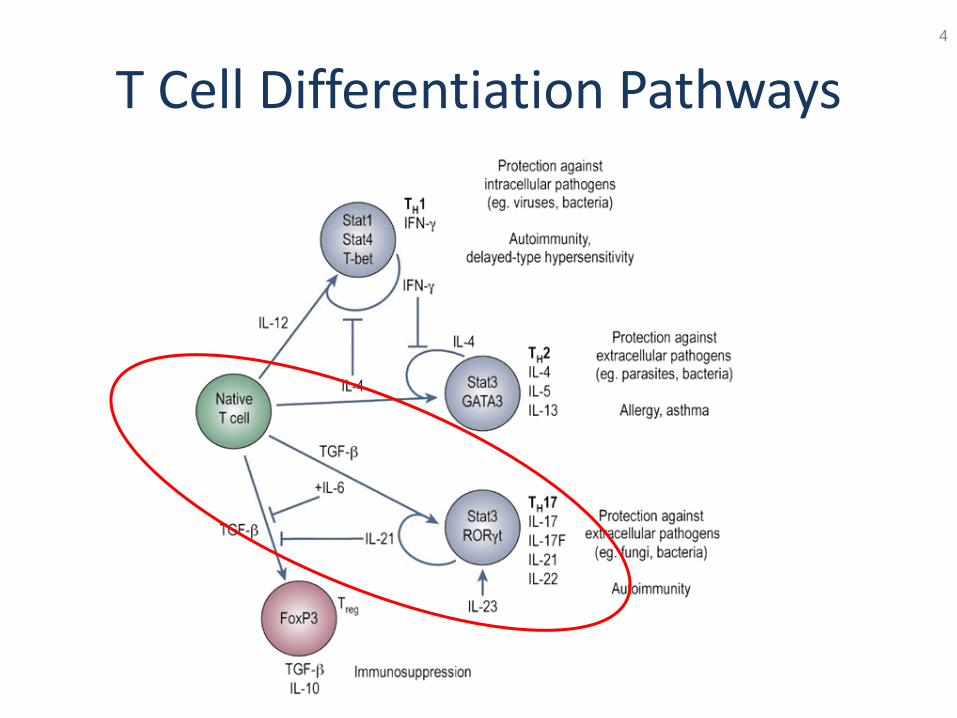
T Cell Differentiation Pathways4

Autocrine Signaling Through IL-21 Promotes
the Development of TH17 Cells
5
RAR, retinoic acid receptor; ROR, RAR-related orphan receptor.
Permission granted from Palmer and Weaver.
Palmer MT, Weaver CT. Nature. 2007;448(7152):416-418.
Dendritic
cell
Naive precursor
T cell
TH17 cell
TGF-β
IL-6
Pathogens
IL-21
IL-23
IL-21
IL-23R
ROR-ɣ ROR-ɣ
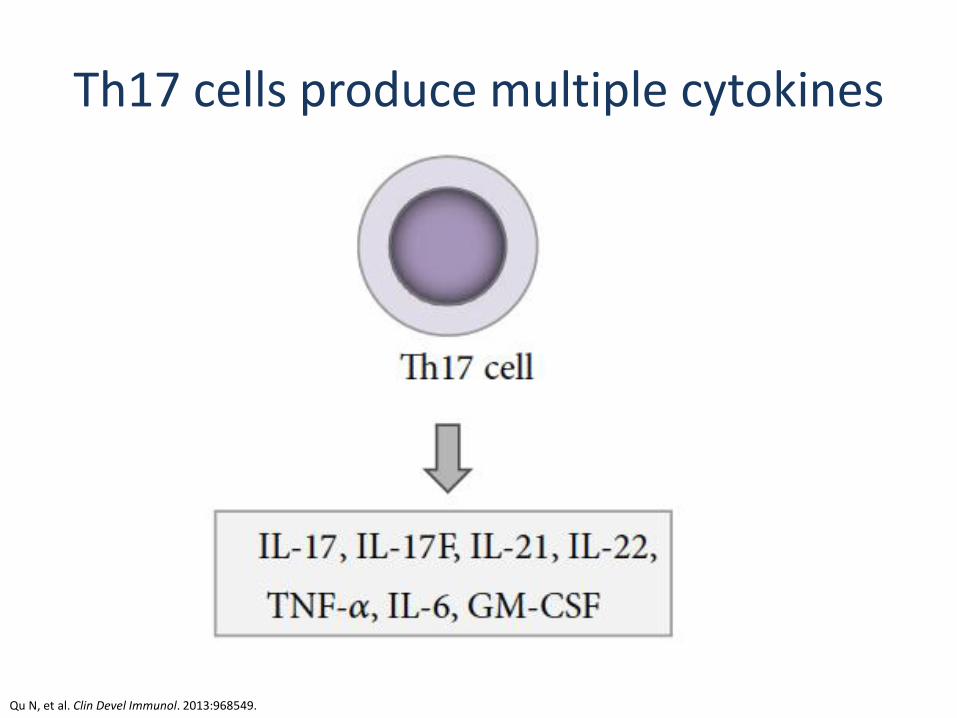
Th17 cells produce multiple cytokines
Qu N, et al. Clin Devel Immunol. 2013:968549.
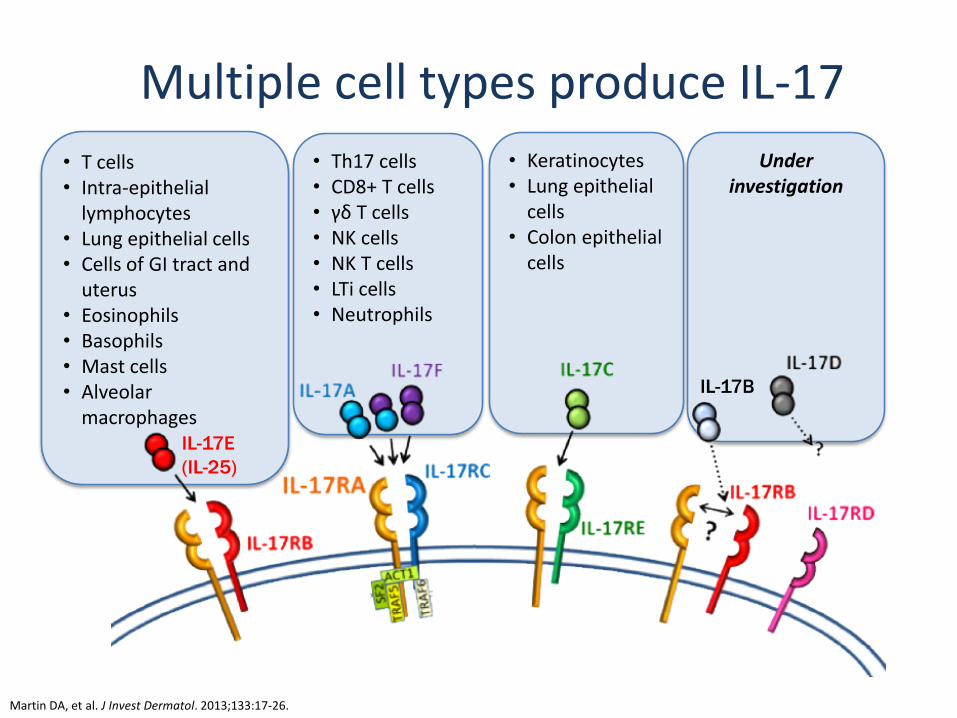
Under investigation
• Th17 cells• CD8+ T cells• γδ T cells• NK cells• NK T cells• LTi cells• Neutrophils
• Keratinocytes• Lung epithelial
cells• Colon epithelial
cells
Multiple cell types produce IL-17
Martin DA, et al. J Invest Dermatol. 2013;133:17-26.
• T cells• Intra-epithelial
lymphocytes• Lung epithelial cells• Cells of GI tract and
uterus • Eosinophils• Basophils• Mast cells• Alveolar
macrophagesIL-17E
(IL-25)
IL-17B
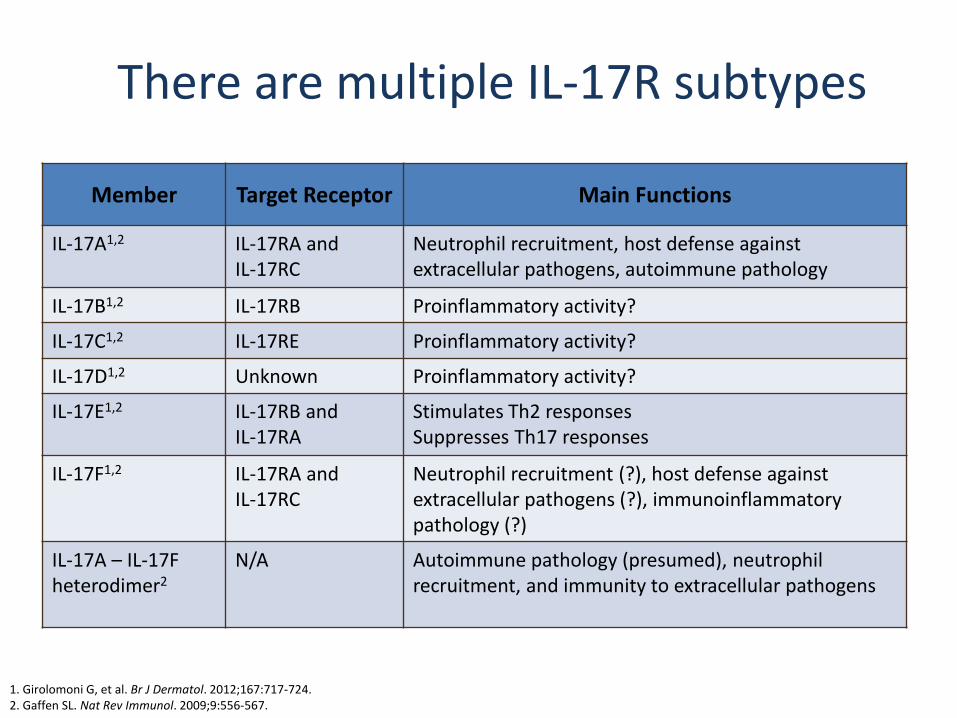
There are multiple IL-17R subtypes
Member Target Receptor Main Functions
IL-17A1,2 IL-17RA and IL-17RC
Neutrophil recruitment, host defense against extracellular pathogens, autoimmune pathology
IL-17B1,2 IL-17RB Proinflammatory activity?
IL-17C1,2 IL-17RE Proinflammatory activity?
IL-17D1,2 Unknown Proinflammatory activity?
IL-17E1,2 IL-17RB and IL-17RA
Stimulates Th2 responsesSuppresses Th17 responses
IL-17F1,2 IL-17RA and IL-17RC
Neutrophil recruitment (?), host defense against extracellular pathogens (?), immunoinflammatorypathology (?)
IL-17A – IL-17F heterodimer2
N/A Autoimmune pathology (presumed), neutrophil recruitment, and immunity to extracellular pathogens
1. Girolomoni G, et al. Br J Dermatol. 2012;167:717-724.2. Gaffen SL. Nat Rev Immunol. 2009;9:556-567.
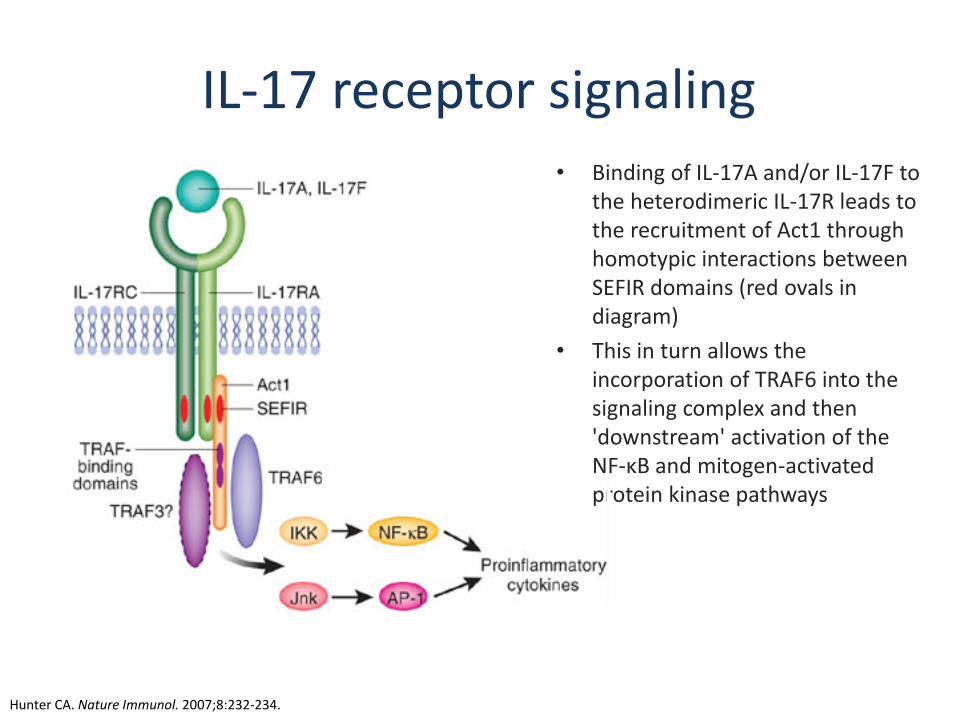
IL-17 receptor signaling • Binding of IL-17A and/or IL-17F to
the heterodimeric IL-17R leads to the recruitment of Act1 through homotypic interactions between SEFIR domains (red ovals in diagram)
• This in turn allows the incorporation of TRAF6 into the signaling complex and then 'downstream' activation of the NF-κB and mitogen-activated protein kinase pathways
Hunter CA. Nature Immunol. 2007;8:232-234.
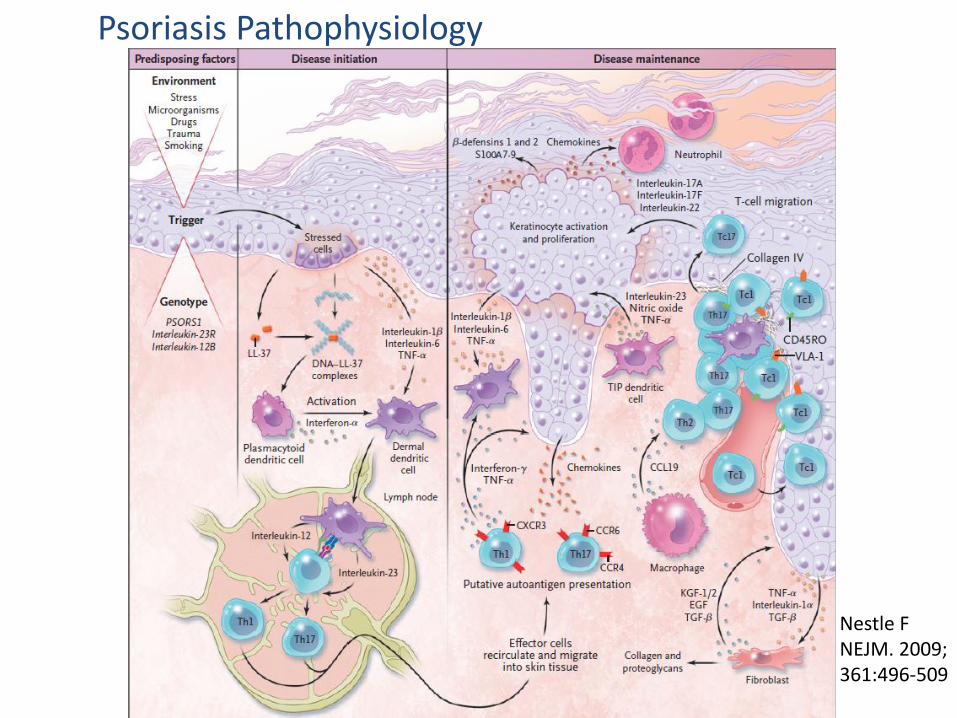
Psoriasis Pathophysiology
Nestle FNEJM. 2009; 361:496-509
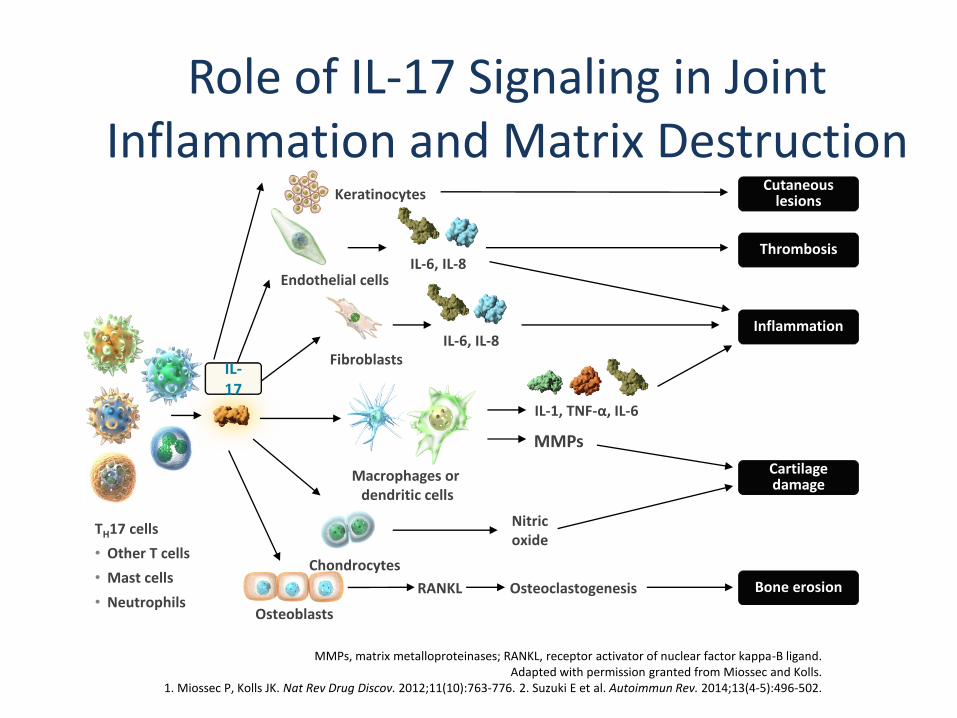
Role of IL-17 Signaling in Joint Inflammation and Matrix Destruction
MMPs, matrix metalloproteinases; RANKL, receptor activator of nuclear factor kappa-B ligand.Adapted with permission granted from Miossec and Kolls.
1. Miossec P, Kolls JK. Nat Rev Drug Discov. 2012;11(10):763-776. 2. Suzuki E et al. Autoimmun Rev. 2014;13(4-5):496-502.
TH17 cells
• Other T cells
• Mast cells
• Neutrophils
Endothelial cells
Fibroblasts
Macrophages or dendritic cells
Chondrocytes
RANKL Osteoclastogenesis
Nitricoxide
MMPs
IL-1, TNF-α, IL-6
IL-6, IL-8
IL-6, IL-8
Osteoblasts
Cartilage damage
Bone erosion
Inflammation
Thrombosis
IL-17
Cutaneous lesionsKeratinocytes
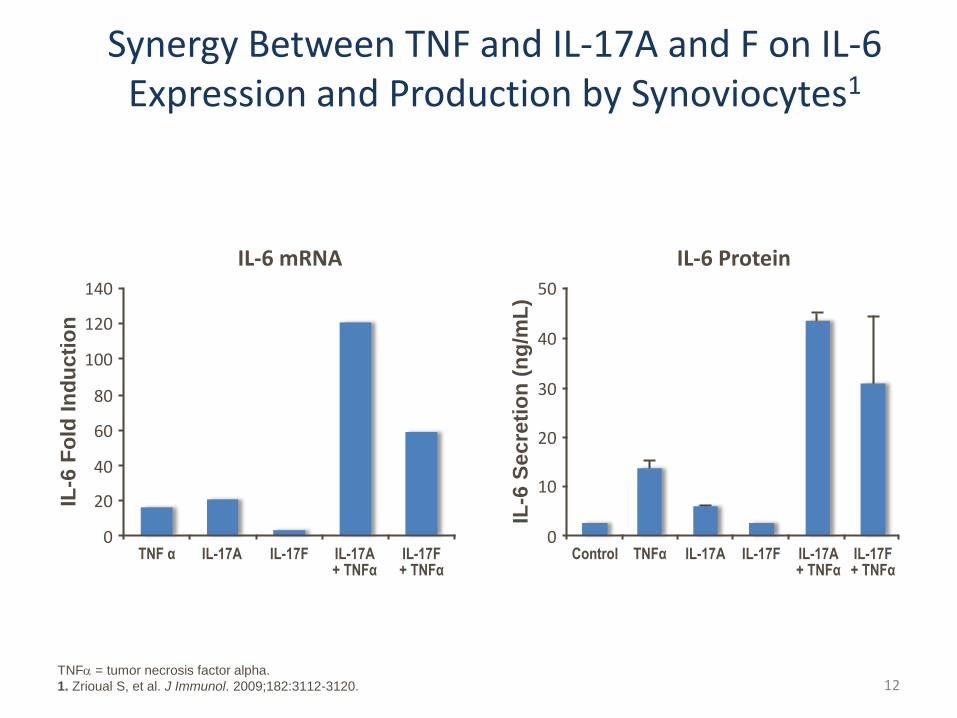
Synergy Between TNF and IL-17A and F on IL-6 Expression and Production by Synoviocytes1
IL-6 Protein
IL-6
Sec
reti
on
(n
g/m
L)
0
30
10
40
50
20
IL-17F+ TNFα
Control IL-17A IL-17F IL-17A+ TNFα
IL-6 mRNA
IL-6
Fo
ld I
nd
ucti
on
0
80
20
100
140
120
40
60
IL-17F+ TNFα
TNF α IL-17A IL-17F IL-17A+ TNFα
TNFα
TNFa = tumor necrosis factor alpha.
1. Zrioual S, et al. J Immunol. 2009;182:3112-3120. 12
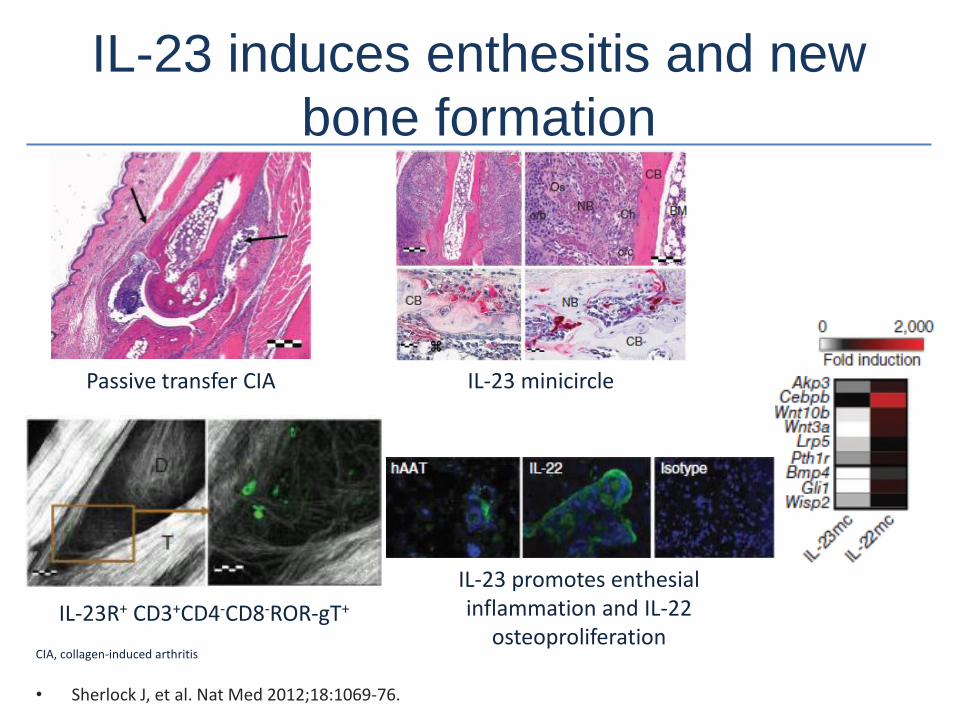
IL-23 induces enthesitis and new
bone formation
• Sherlock J, et al. Nat Med 2012;18:1069-76.
CIA, collagen-induced arthritis
Passive transfer CIA IL-23 minicircle
IL-23 promotes enthesialinflammation and IL-22
osteoproliferationIL-23R+ CD3+CD4-CD8-ROR-gT+
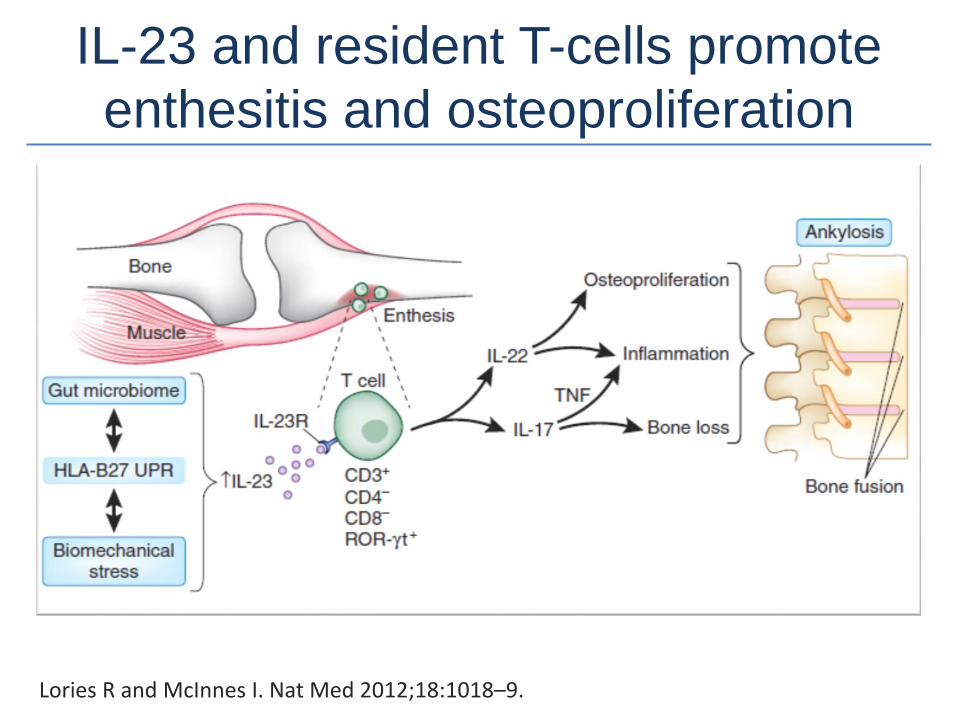
IL-23 and resident T-cells promote
enthesitis and osteoproliferation
Lories R and McInnes I. Nat Med 2012;18:1018–9.
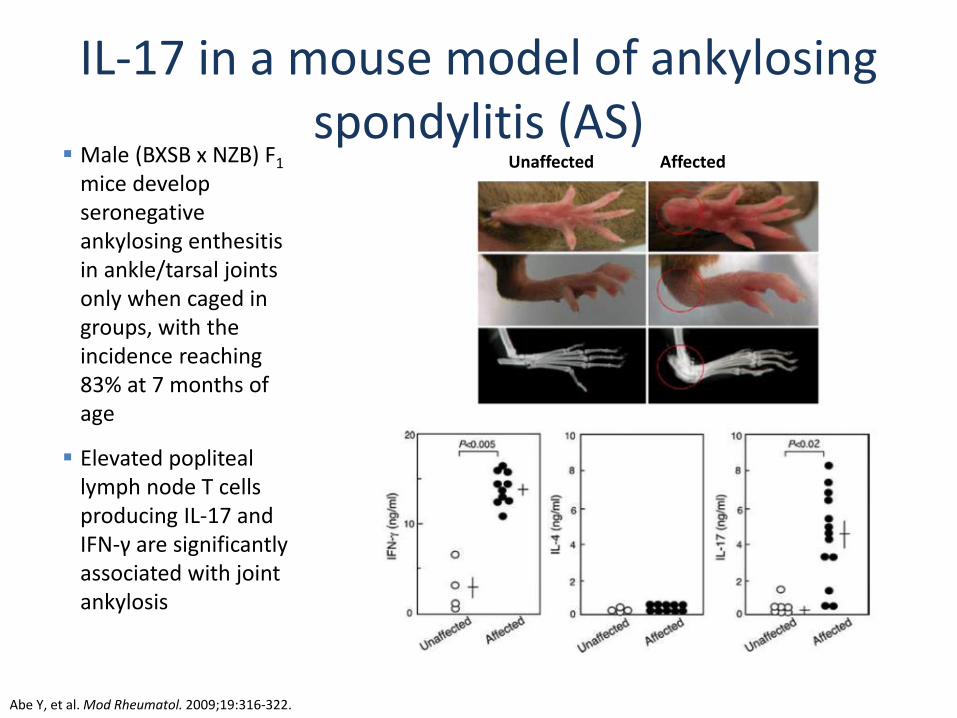
IL-17 in a mouse model of ankylosing spondylitis (AS)
Abe Y, et al. Mod Rheumatol. 2009;19:316-322.
Unaffected Affected Male (BXSB x NZB) F1
mice develop seronegative ankylosing enthesitis in ankle/tarsal joints only when caged in groups, with the incidence reaching 83% at 7 months of age
Elevated popliteal lymph node T cells producing IL-17 and IFN-γ are significantly associated with joint ankylosis
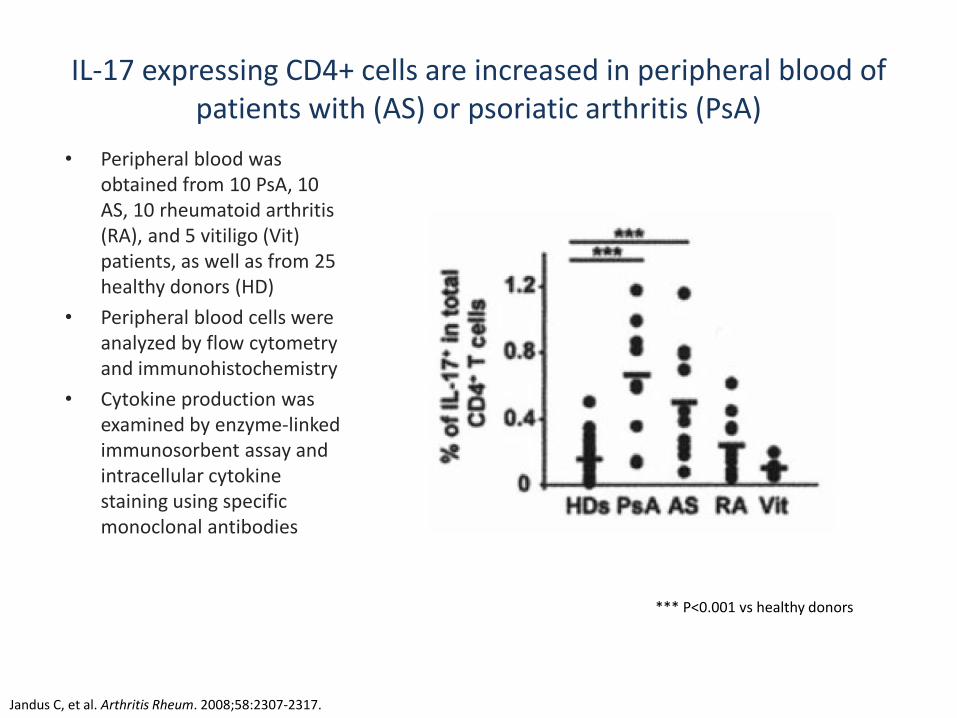
IL-17 expressing CD4+ cells are increased in peripheral blood of patients with (AS) or psoriatic arthritis (PsA)
• Peripheral blood was obtained from 10 PsA, 10 AS, 10 rheumatoid arthritis (RA), and 5 vitiligo (Vit) patients, as well as from 25 healthy donors (HD)
• Peripheral blood cells were analyzed by flow cytometry and immunohistochemistry
• Cytokine production was examined by enzyme-linked immunosorbent assay and intracellular cytokine staining using specific monoclonal antibodies
Jandus C, et al. Arthritis Rheum. 2008;58:2307-2317.
*** P<0.001 vs healthy donors
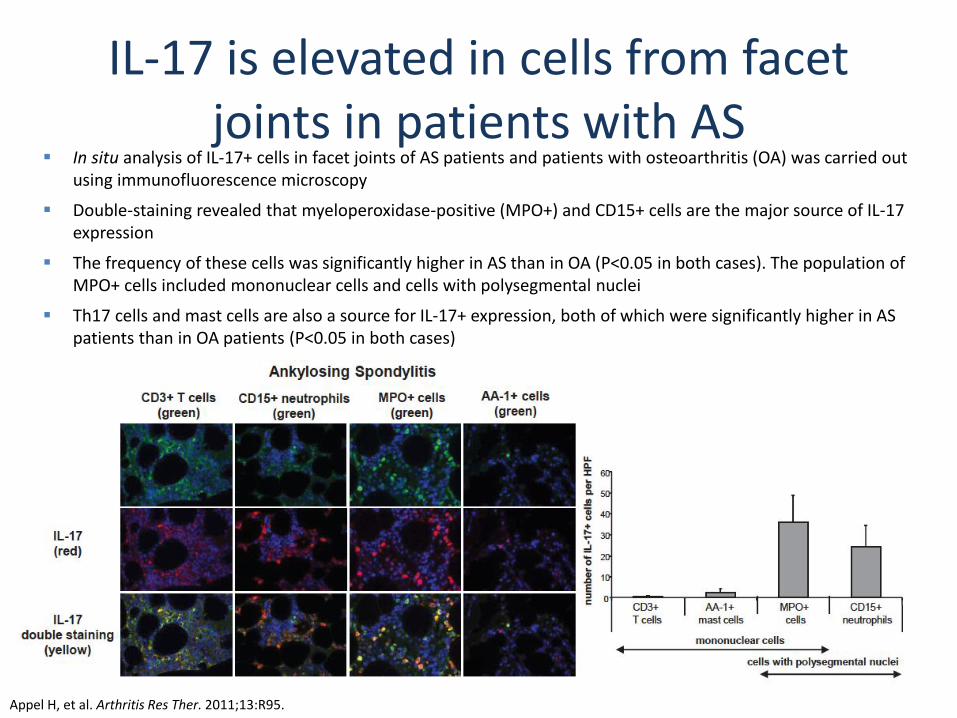
IL-17 is elevated in cells from facet joints in patients with AS
In situ analysis of IL-17+ cells in facet joints of AS patients and patients with osteoarthritis (OA) was carried out using immunofluorescence microscopy
Double-staining revealed that myeloperoxidase-positive (MPO+) and CD15+ cells are the major source of IL-17 expression
The frequency of these cells was significantly higher in AS than in OA (P<0.05 in both cases). The population of MPO+ cells included mononuclear cells and cells with polysegmental nuclei
Th17 cells and mast cells are also a source for IL-17+ expression, both of which were significantly higher in AS patients than in OA patients (P<0.05 in both cases)
Appel H, et al. Arthritis Res Ther. 2011;13:R95.
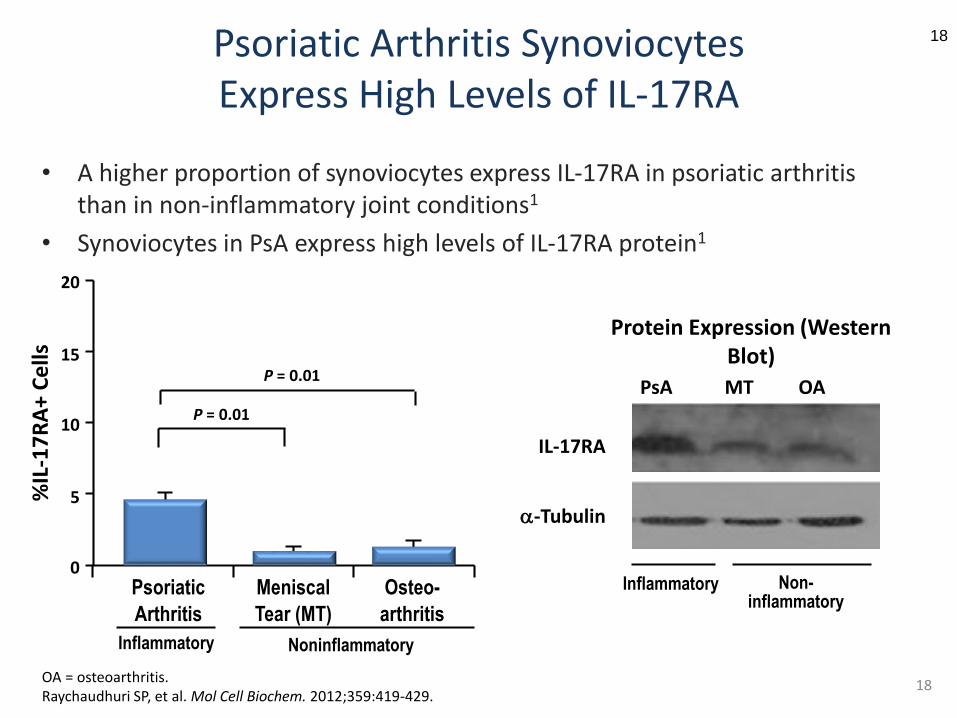
Psoriatic Arthritis SynoviocytesExpress High Levels of IL-17RA
18
• A higher proportion of synoviocytes express IL-17RA in psoriatic arthritis than in non-inflammatory joint conditions1
• Synoviocytes in PsA express high levels of IL-17RA protein1
OA = osteoarthritis.Raychaudhuri SP, et al. Mol Cell Biochem. 2012;359:419-429.
20
15
10
5
0
%IL
-17
RA
+ C
ells
Psoriatic
Arthritis
Meniscal
Tear (MT)
P = 0.01
P = 0.01
Osteo-
arthritis
Inflammatory Noninflammatory
PsA MT OA
IL-17RA
a-Tubulin
Protein Expression (Western Blot)
Inflammatory Non-inflammatory
18
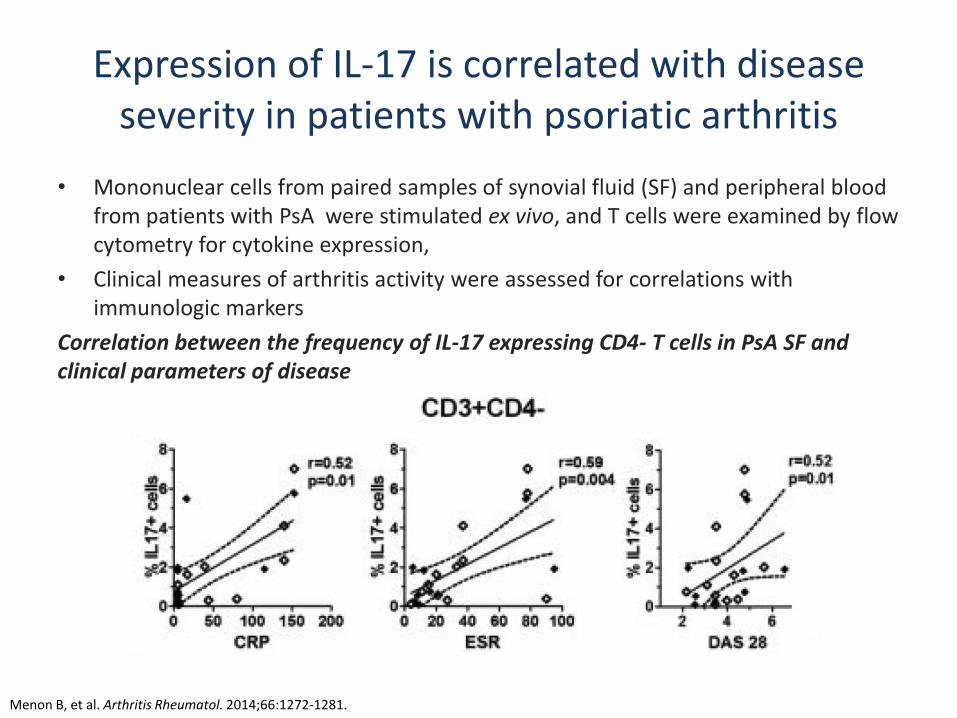
Expression of IL-17 is correlated with disease severity in patients with psoriatic arthritis
• Mononuclear cells from paired samples of synovial fluid (SF) and peripheral blood from patients with PsA were stimulated ex vivo, and T cells were examined by flow cytometry for cytokine expression,
• Clinical measures of arthritis activity were assessed for correlations with immunologic markers
Correlation between the frequency of IL-17 expressing CD4- T cells in PsA SF and clinical parameters of disease
Menon B, et al. Arthritis Rheumatol. 2014;66:1272-1281.
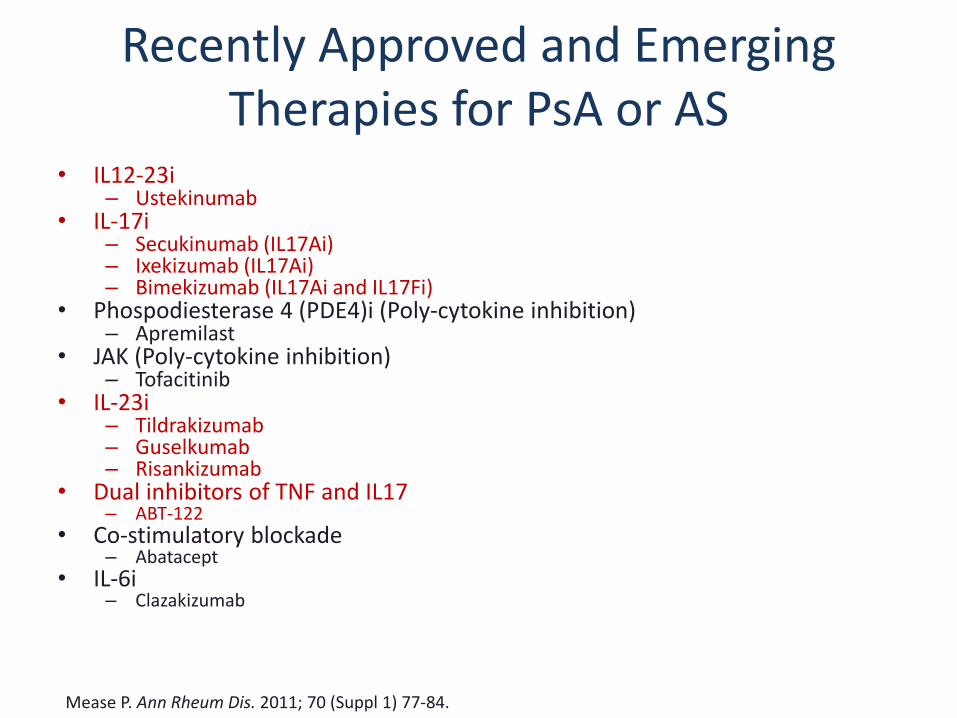
Recently Approved and Emerging Therapies for PsA or AS
• IL12-23i– Ustekinumab
• IL-17i– Secukinumab (IL17Ai)– Ixekizumab (IL17Ai)– Bimekizumab (IL17Ai and IL17Fi)
• Phospodiesterase 4 (PDE4)i (Poly-cytokine inhibition)– Apremilast
• JAK (Poly-cytokine inhibition)– Tofacitinib
• IL-23i– Tildrakizumab– Guselkumab– Risankizumab
• Dual inhibitors of TNF and IL17– ABT-122
• Co-stimulatory blockade– Abatacept
• IL-6i– Clazakizumab
Mease P. Ann Rheum Dis. 2011; 70 (Suppl 1) 77-84.
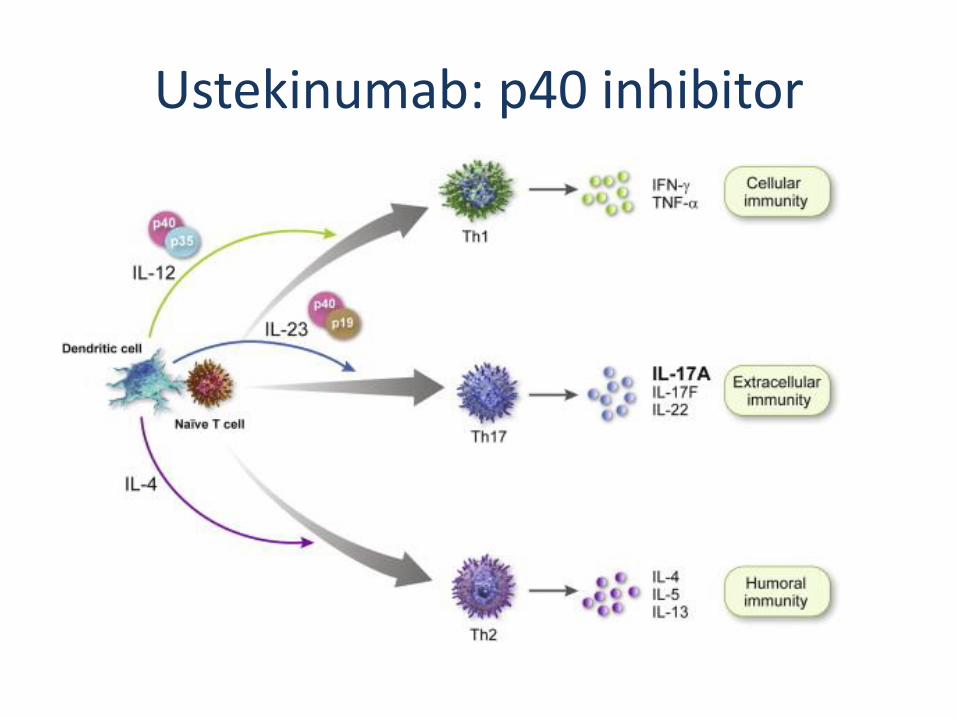
Ustekinumab: p40 inhibitor
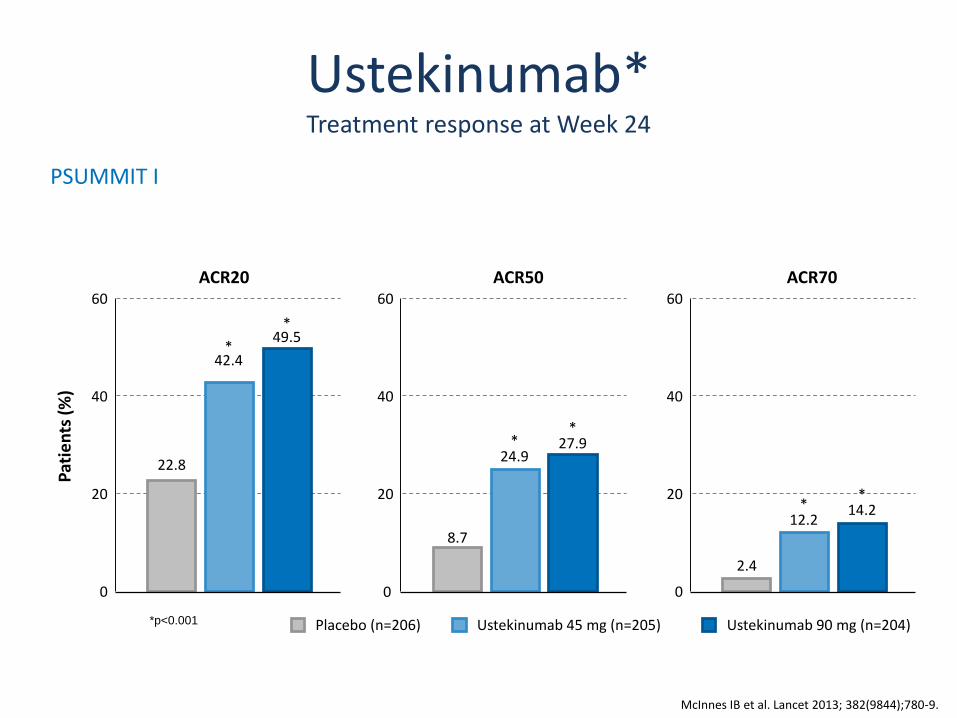
Ustekinumab*Treatment response at Week 24
*p<0.001 Placebo (n=206) Ustekinumab 90 mg (n=204)Ustekinumab 45 mg (n=205)
60
40
20
0
Pat
ien
ts(%
)
22.8
*42.4
*49.5
ACR2060
40
20
8.7
*24.9
*27.9
ACR5060
40
20
0
2.4
*12.2
*14.2
ACR70
PSUMMIT I
McInnes IB et al. Lancet 2013; 382(9844);780-9.
0
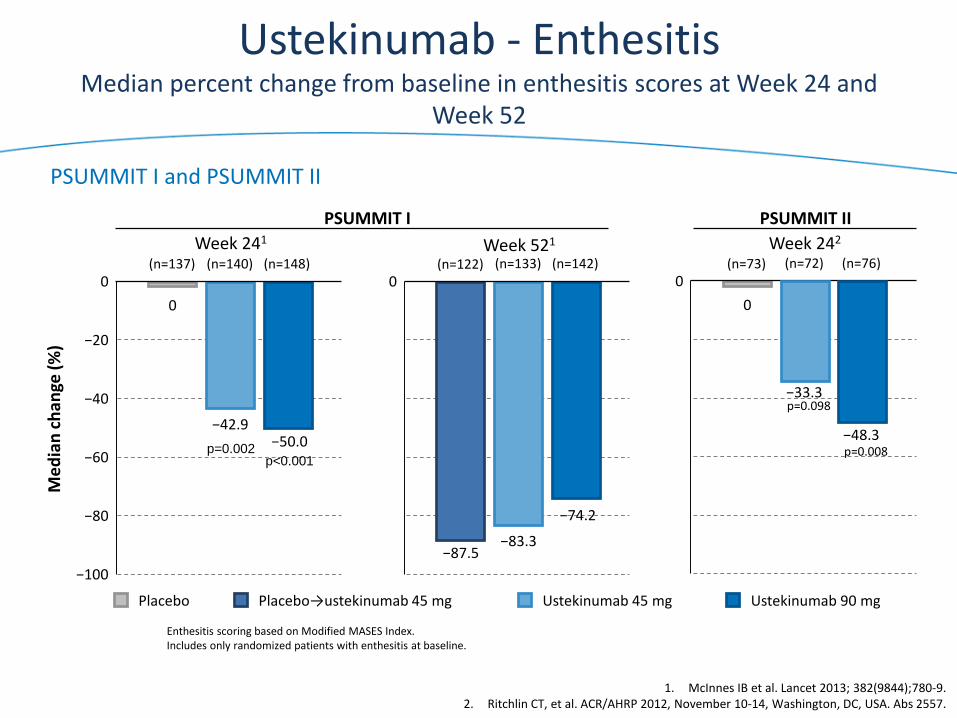
Ustekinumab - EnthesitisMedian percent change from baseline in enthesitis scores at Week 24 and
Week 52
0
Me
dia
nch
ange
(%)
−40
−80
−100
0
−20
−60 p<0.001p=0.002
−42.9−50.0
Enthesitis scoring based on Modified MASES Index.Includes only randomized patients with enthesitis at baseline.
(n=148)(n=140)(n=137)0
−33.3
−48.3
0
p=0.008
p=0.098
(n=76)(n=72)(n=73)0
−87.5−83.3
−74.2
(n=142)(n=133)(n=122)
PSUMMIT I
1. McInnes IB et al. Lancet 2013; 382(9844);780-9.2. Ritchlin CT, et al. ACR/AHRP 2012, November 10-14, Washington, DC, USA. Abs 2557.
Week 241
PSUMMIT II
Week 242Week 521
PSUMMIT I and PSUMMIT II
Placebo→ustekinumab 45 mg Ustekinumab 90 mgUstekinumab 45 mgPlacebo
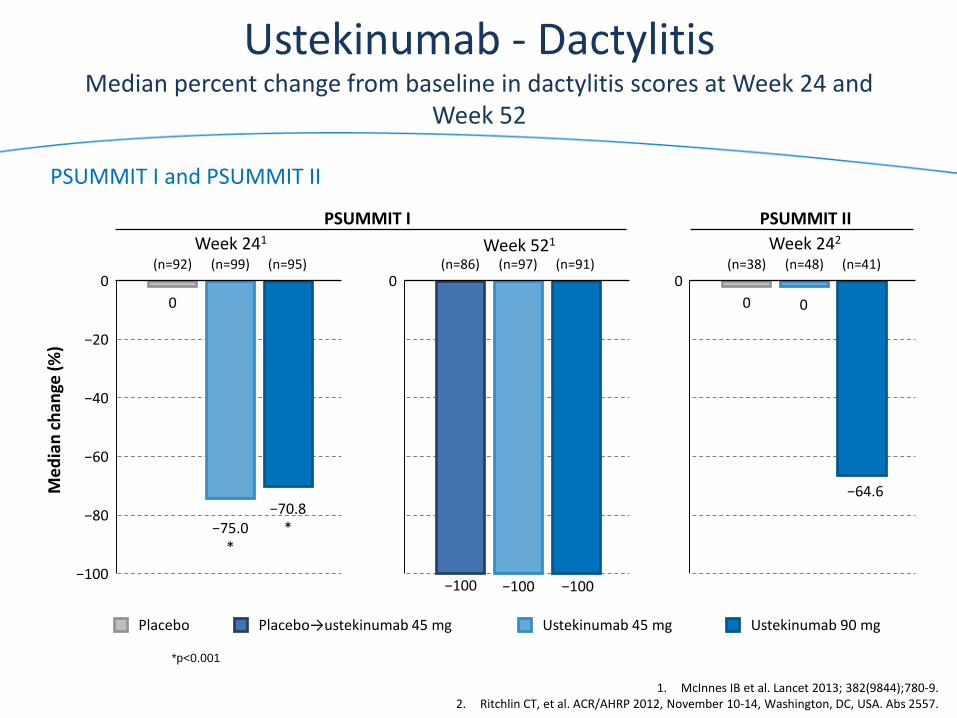
Ustekinumab - DactylitisMedian percent change from baseline in dactylitis scores at Week 24 and
Week 52
0
Me
dia
nch
ange
(%)
−40
−80
−100
0
−20
−60
−75.0*
0
−100 −100 −100
(n=91)(n=97)(n=86)
−70.8*
(n=95)(n=99)(n=92)0
0
−64.6
0
(n=41)(n=48)(n=38)
PSUMMIT I
Week 241
PSUMMIT II
Week 242Week 521
PSUMMIT I and PSUMMIT II
Placebo→ustekinumab 45 mg Ustekinumab 90 mgUstekinumab 45 mgPlacebo
*p<0.001
1. McInnes IB et al. Lancet 2013; 382(9844);780-9.2. Ritchlin CT, et al. ACR/AHRP 2012, November 10-14, Washington, DC, USA. Abs 2557.
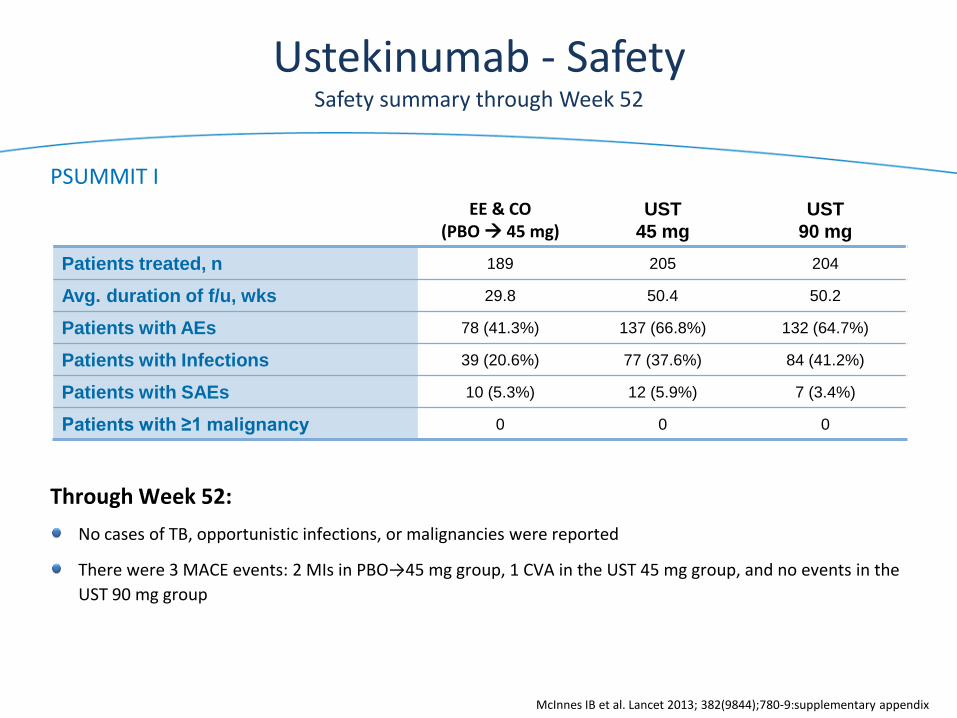
EE & CO(PBO 45 mg)
UST
45 mg
UST
90 mg
Patients treated, n 189 205 204
Avg. duration of f/u, wks 29.8 50.4 50.2
Patients with AEs 78 (41.3%) 137 (66.8%) 132 (64.7%)
Patients with Infections 39 (20.6%) 77 (37.6%) 84 (41.2%)
Patients with SAEs 10 (5.3%) 12 (5.9%) 7 (3.4%)
Patients with ≥1 malignancy 0 0 0
Ustekinumab - SafetySafety summary through Week 52
PSUMMIT I
Through Week 52:
No cases of TB, opportunistic infections, or malignancies were reported
There were 3 MACE events: 2 MIs in PBO→45 mg group, 1 CVA in the UST 45 mg group, and no events in the
UST 90 mg group
McInnes IB et al. Lancet 2013; 382(9844);780-9:supplementary appendix
Copyright 2013 TREG Consultants LLC
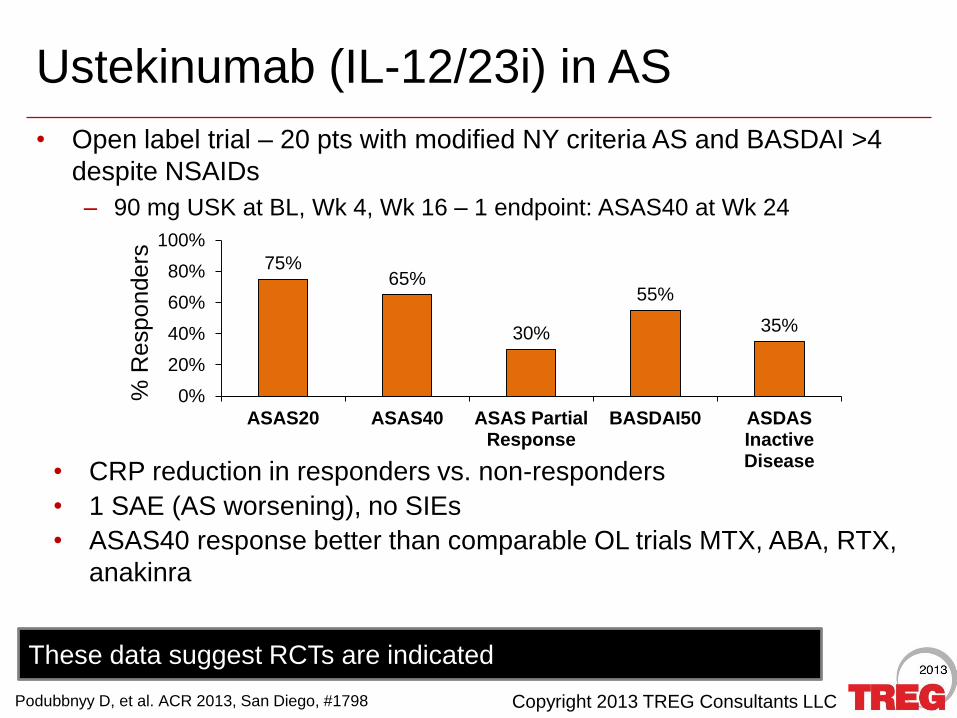
• Open label trial – 20 pts with modified NY criteria AS and BASDAI >4
despite NSAIDs
– 90 mg USK at BL, Wk 4, Wk 16 – 1 endpoint: ASAS40 at Wk 24
Ustekinumab (IL-12/23i) in AS
75%65%
30%
55%
35%
0%
20%
40%
60%
80%
100%
ASAS20 ASAS40 ASAS PartialResponse
BASDAI50 ASDASInactiveDisease
% R
esponders
• CRP reduction in responders vs. non-responders
• 1 SAE (AS worsening), no SIEs
• ASAS40 response better than comparable OL trials MTX, ABA, RTX,
anakinra
These data suggest RCTs are indicated
Podubbnyy D, et al. ACR 2013, San Diego, #1798
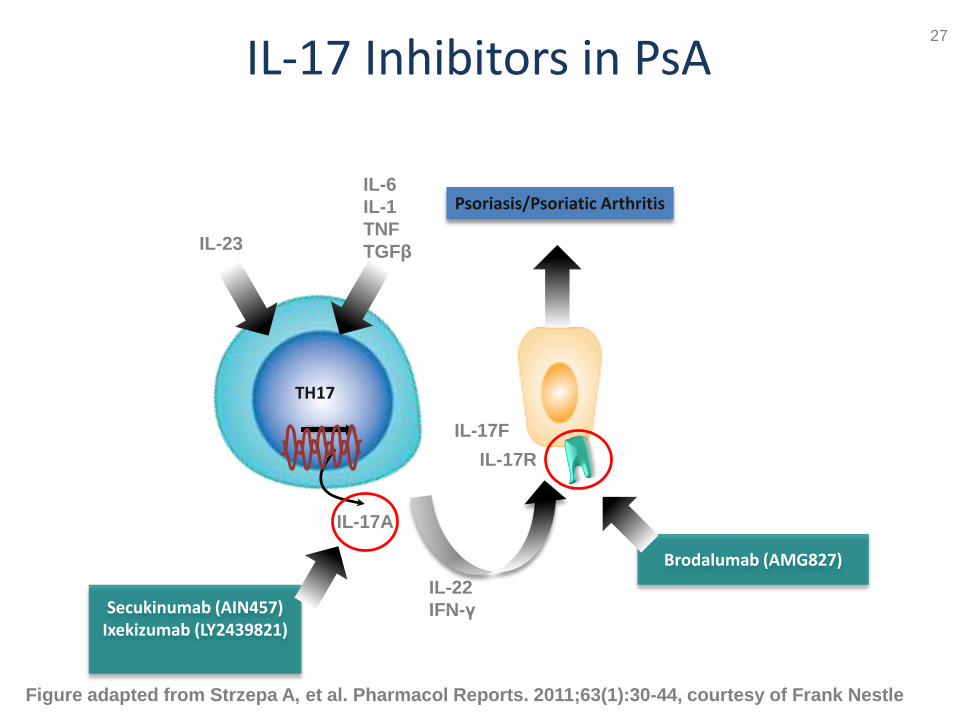
IL-17 Inhibitors in PsA
Figure adapted from Strzepa A, et al. Pharmacol Reports. 2011;63(1):30-44, courtesy of Frank Nestle
Secukinumab (AIN457)Ixekizumab (LY2439821)
Brodalumab (AMG827)
Psoriasis/Psoriatic ArthritisIL-6
IL-1
TNF
TGFβIL-23
TH17
IL-17A
IL-17R
IL-22
IFN-γ
IL-17F
27
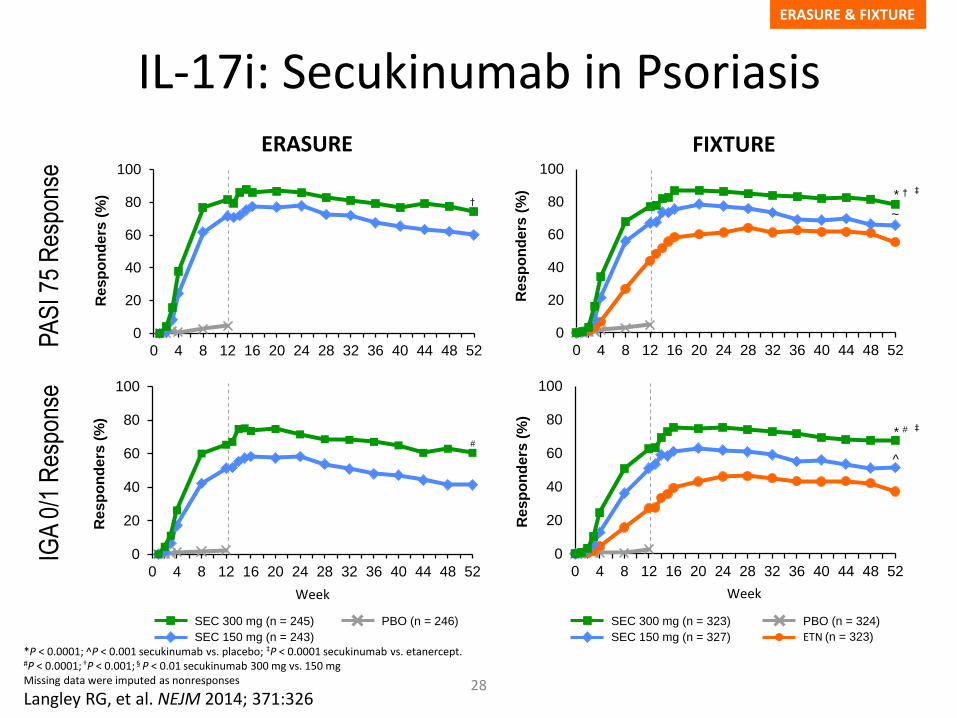
IL-17i: Secukinumab in Psoriasis
*P < 0.0001; ̂ P < 0.001 secukinumab vs. placebo; ‡P < 0.0001 secukinumab vs. etanercept.#P < 0.0001; †P < 0.001; § P < 0.01 secukinumab 300 mg vs. 150 mgMissing data were imputed as nonresponses
Langley RG, et al. NEJM 2014; 371:326
0
20
40
60
80
100
0 4 8 12 16 20 24 28 32 36 40 44 48 52
* †
~
PA
SI 7
5 R
espo
nse
0
20
40
60
80
100
0 4 8 12 16 20 24 28 32 36 40 44 48 52
Re
sp
on
de
rs (
%)
†
SEC 300 mg (n = 245)
SEC 150 mg (n = 243)
PBO (n = 246) SEC 300 mg (n = 323)
SEC 150 mg (n = 327)
PBO (n = 324)
ETN (n = 323)
ERASURE FIXTURE
ERASURE & FIXTURE
Re
sp
on
de
rs (
%) ‡
Week Week
28
IGA
0/1
Res
pons
e
0
20
40
60
80
100
0 4 8 12 16 20 24 28 32 36 40 44 48 52
#
0
20
40
60
80
100
0 4 8 12 16 20 24 28 32 36 40 44 48 52
* #
^
Re
sp
on
de
rs (
%)
Re
sp
on
de
rs (
%)
‡
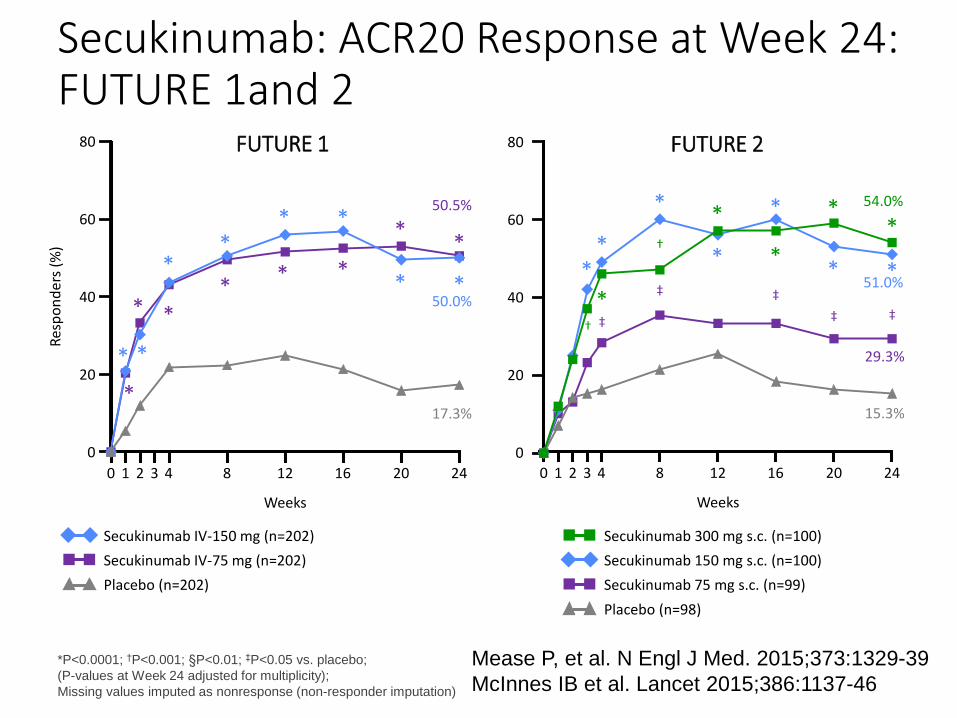
Secukinumab: ACR20 Response at Week 24:FUTURE 1and 2
0 4 248 12 16 201 2
Weeks
51.0%
29.3%
15.3%
3
54.0%
**
†
*
*
†
*
* *
*
*
*
*
*
‡
‡
‡
‡ ‡
0 4 248 12 16 201 2
Weeks
50.0%
50.5%
17.3%
3
*
*
*
*
*
*
*
*
*
*
*
*
*
*
*
*
Secukinumab 300 mg s.c. (n=100)
Secukinumab 150 mg s.c. (n=100)
Secukinumab 75 mg s.c. (n=99)
Placebo (n=98)
Secukinumab IV-150 mg (n=202)
Secukinumab IV-75 mg (n=202)
Placebo (n=202)
Res
po
nd
ers
(%)
FUTURE 1 FUTURE 2
*P<0.0001; †P<0.001; §P<0.01; ‡P<0.05 vs. placebo;
(P-values at Week 24 adjusted for multiplicity);
Missing values imputed as nonresponse (non-responder imputation)
80
60
40
20
0
80
60
40
20
0
Mease P, et al. N Engl J Med. 2015;373:1329-39
McInnes IB et al. Lancet 2015;386:1137-46
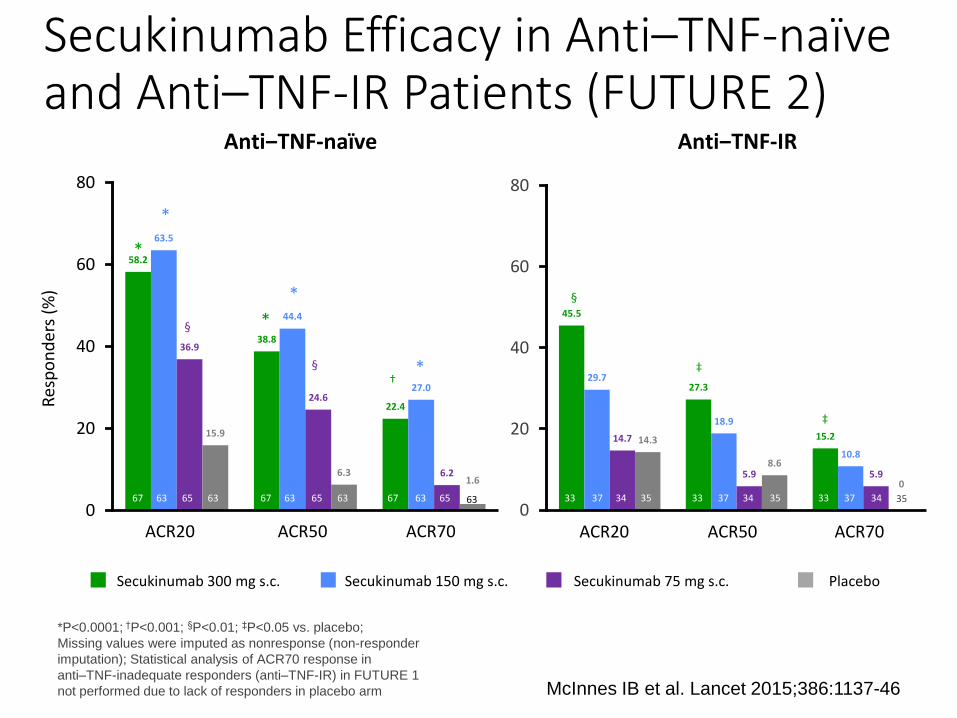
45.5
27.3
15.2
29.7
18.9
10.8
14.7
5.9 5.9
14.3
8.6
0
0
20
40
60
80
58.2
38.8
22.4
63.5
44.4
27.0
36.9
24.6
6.2
15.9
6.31.6
0
20
40
60
80
Secukinumab 300 mg s.c. Secukinumab 75 mg s.c. PlaceboSecukinumab 150 mg s.c.
*P<0.0001; †P<0.001; §P<0.01; ‡P<0.05 vs. placebo;
Missing values were imputed as nonresponse (non-responder
imputation); Statistical analysis of ACR70 response in
anti–TNF-inadequate responders (anti–TNF-IR) in FUTURE 1
not performed due to lack of responders in placebo arm McInnes IB et al. Lancet 2015;386:1137-46
Secukinumab Efficacy in Anti–TNF-naïve and Anti–TNF-IR Patients (FUTURE 2)
Anti‒TNF-IR
ACR50 ACR70ACR20
33 37 34 35 3733 34 35 3733 34 35
Anti‒TNF-naïve
Res
po
nd
ers
(%)
ACR20 ACR50 ACR70
6367 63 65 6763 63 65 63 67 63 65
‡
§
*
§
*
*
*
*†
‡
§
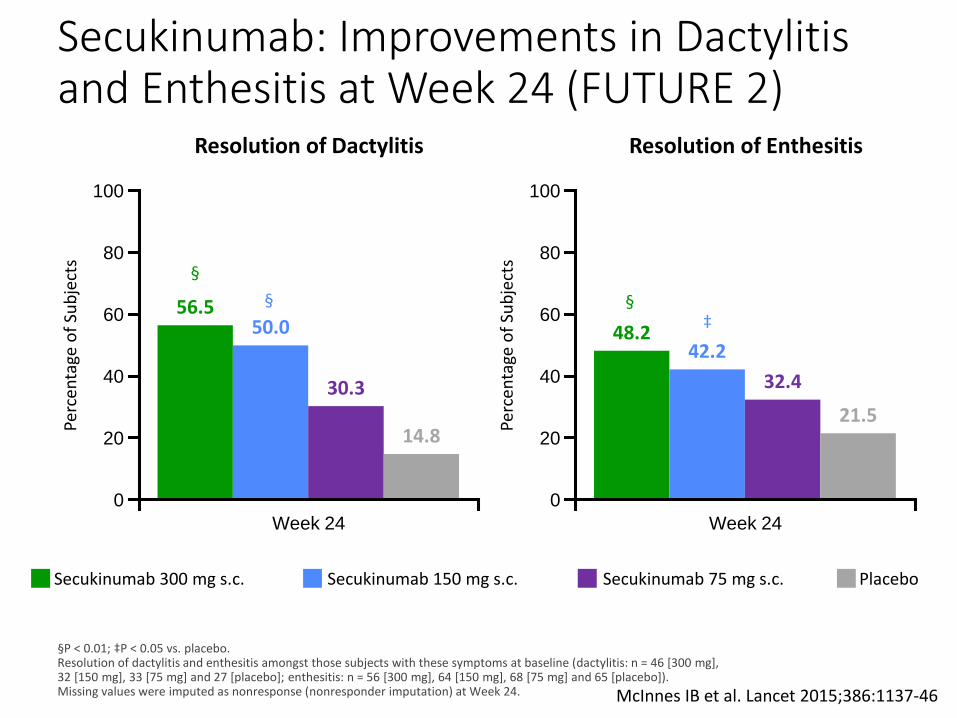
56.550.0
30.3
14.8
48.242.2
32.4
21.5
Secukinumab: Improvements in Dactylitisand Enthesitis at Week 24 (FUTURE 2)
§P < 0.01; ‡P < 0.05 vs. placebo. Resolution of dactylitis and enthesitis amongst those subjects with these symptoms at baseline (dactylitis: n = 46 [300 mg], 32 [150 mg], 33 [75 mg] and 27 [placebo]; enthesitis: n = 56 [300 mg], 64 [150 mg], 68 [75 mg] and 65 [placebo]). Missing values were imputed as nonresponse (nonresponder imputation) at Week 24.
100
Perc
enta
ge o
f Su
bje
cts 80
60
0
100
Perc
enta
ge o
f Su
bje
cts 80
60
0
Week 24 Week 24
40
20
40
20
Resolution of Dactylitis Resolution of Enthesitis
§
§ §‡
Secukinumab 300 mg s.c. Secukinumab 75 mg s.c. PlaceboSecukinumab 150 mg s.c.
McInnes IB et al. Lancet 2015;386:1137-46
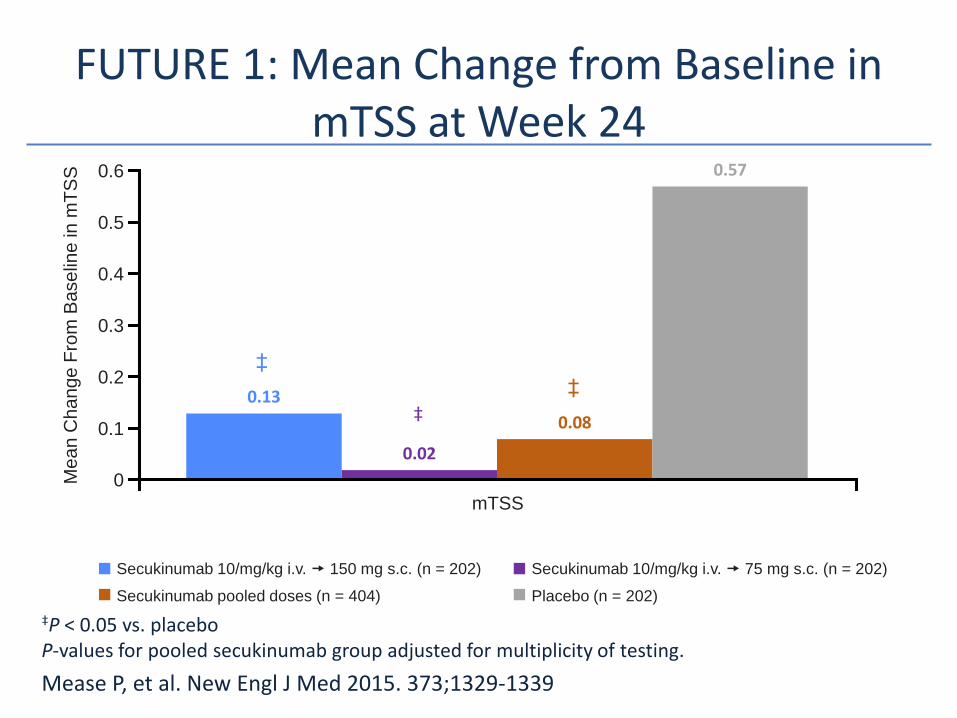
0.13
0.02
0.08
0.57
0.5
0.6
FUTURE 1: Mean Change from Baseline in mTSS at Week 24
‡P < 0.05 vs. placeboP-values for pooled secukinumab group adjusted for multiplicity of testing.
Mease P, et al. New Engl J Med 2015. 373;1329-1339
Secukinumab 10/mg/kg i.v. 75 mg s.c. (n = 202)
Placebo (n = 202)
Secukinumab 10/mg/kg i.v. 150 mg s.c. (n = 202)
Secukinumab pooled doses (n = 404)
mTSS
0.4
0.3
0.2
0Me
an
Change F
rom
Ba
se
line
in
mT
SS
0.1
‡
‡
‡
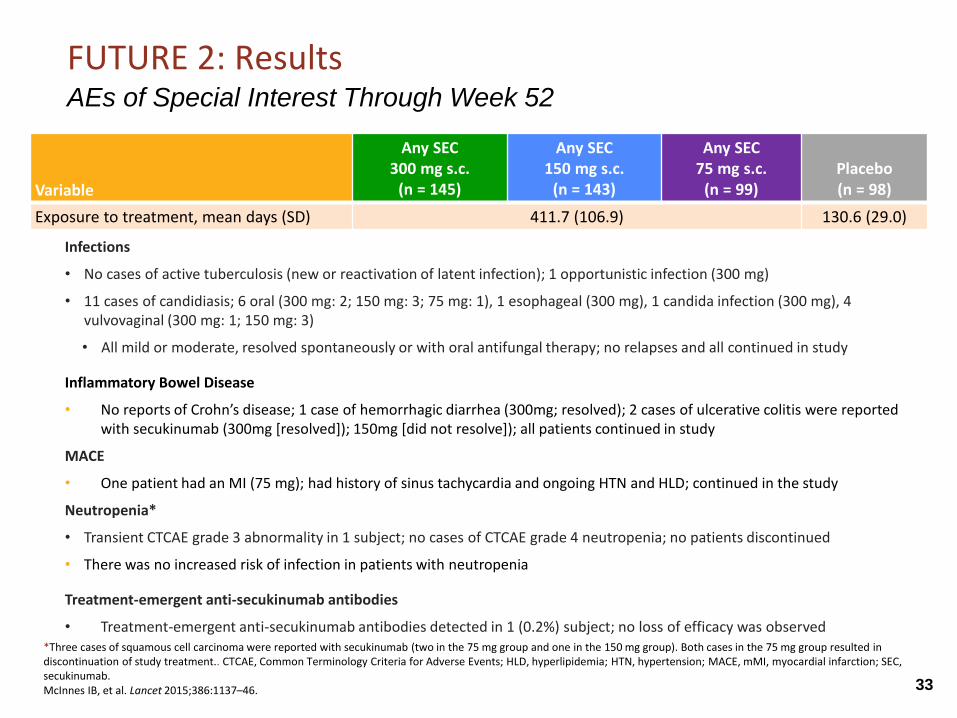
Infections
• No cases of active tuberculosis (new or reactivation of latent infection); 1 opportunistic infection (300 mg)
• 11 cases of candidiasis; 6 oral (300 mg: 2; 150 mg: 3; 75 mg: 1), 1 esophageal (300 mg), 1 candida infection (300 mg), 4 vulvovaginal (300 mg: 1; 150 mg: 3)
• All mild or moderate, resolved spontaneously or with oral antifungal therapy; no relapses and all continued in study
Inflammatory Bowel Disease
• No reports of Crohn’s disease; 1 case of hemorrhagic diarrhea (300mg; resolved); 2 cases of ulcerative colitis were reported with secukinumab (300mg [resolved]); 150mg [did not resolve]); all patients continued in study
MACE
• One patient had an MI (75 mg); had history of sinus tachycardia and ongoing HTN and HLD; continued in the study
Neutropenia*
• Transient CTCAE grade 3 abnormality in 1 subject; no cases of CTCAE grade 4 neutropenia; no patients discontinued
• There was no increased risk of infection in patients with neutropenia
Treatment-emergent anti-secukinumab antibodies
• Treatment-emergent anti-secukinumab antibodies detected in 1 (0.2%) subject; no loss of efficacy was observed
FUTURE 2: ResultsAEs of Special Interest Through Week 52
Variable
Any SEC300 mg s.c.
(n = 145)
Any SEC150 mg s.c.
(n = 143)
Any SEC75 mg s.c.
(n = 99)Placebo (n = 98)
Exposure to treatment, mean days (SD) 411.7 (106.9) 130.6 (29.0)
*Three cases of squamous cell carcinoma were reported with secukinumab (two in the 75 mg group and one in the 150 mg group). Both cases in the 75 mg group resulted in discontinuation of study treatment.. CTCAE, Common Terminology Criteria for Adverse Events; HLD, hyperlipidemia; HTN, hypertension; MACE, mMI, myocardial infarction; SEC, secukinumab.McInnes IB, et al. Lancet 2015;386:1137–46. 33
Copyright 2014 TREG Consultants LLC
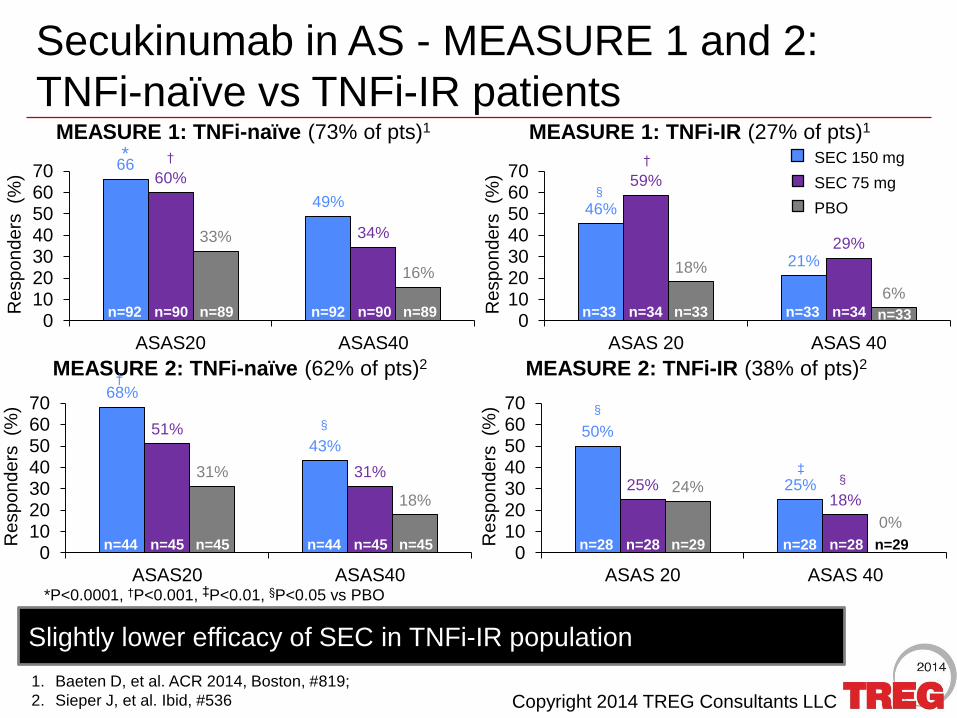
46%
21%
59%
29%
18%
6%
010203040506070
ASAS 20 ASAS 40
Secukinumab in AS - MEASURE 1 and 2:
TNFi-naïve vs TNFi-IR patients
66
49%
60%
34%33%
16%
010203040506070
ASAS20 ASAS40
SEC 150 mg
SEC 75 mg
PBO
Re
sp
on
de
rs (%
)
Re
sp
on
de
rs (%
)
MEASURE 1: TNFi-naïve (73% of pts)1 MEASURE 1: TNFi-IR (27% of pts)1
1. Baeten D, et al. ACR 2014, Boston, #819;
2. Sieper J, et al. Ibid, #536
* † †
§
Slightly lower efficacy of SEC in TNFi-IR population
n=92 n=90 n=89 n=92 n=90 n=89
*P<0.0001, †P<0.001, ‡P<0.01, §P<0.05 vs PBO
50%
25%25%18%
24%
0%
010203040506070
ASAS 20 ASAS 40
MEASURE 2: TNFi-naïve (62% of pts)2 MEASURE 2: TNFi-IR (38% of pts)2
68%
43%51%
31%31%
18%
010203040506070
ASAS20 ASAS40
Re
sp
on
de
rs (%
)
Re
sp
on
de
rs (%
)
n=44 n=45 n=45 n=44 n=45 n=45
†
§
n=28 n=28 n=29 n=28 n=28 n=29
§
§‡
n=33 n=34 n=33 n=33 n=34 n=33
Copyright 2015 TREG Consultants LLC
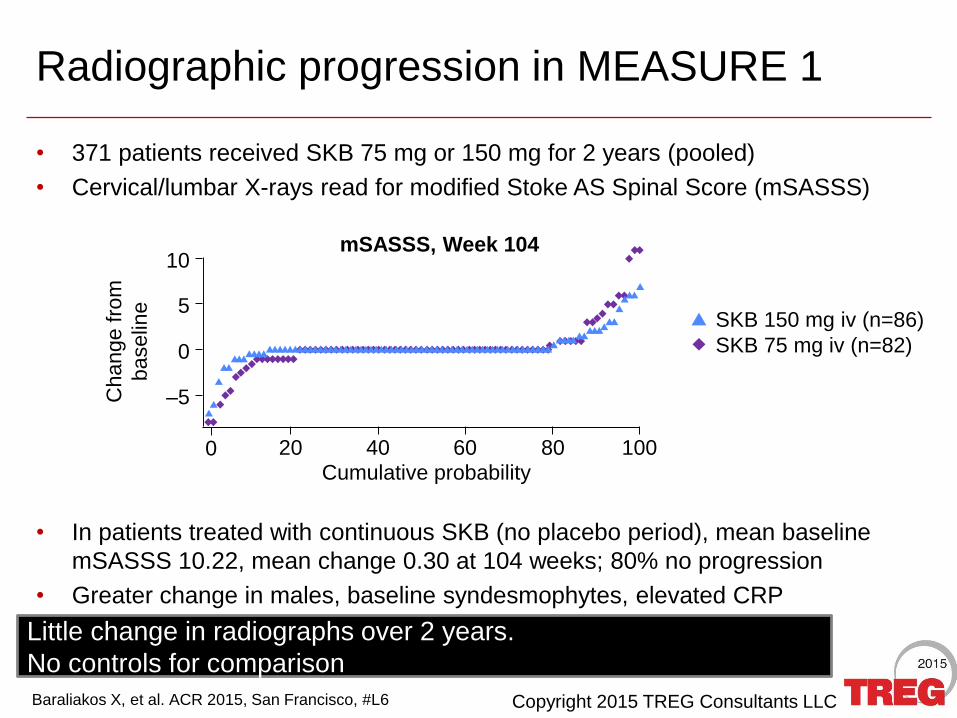
Radiographic progression in MEASURE 1
• 371 patients received SKB 75 mg or 150 mg for 2 years (pooled)
• Cervical/lumbar X-rays read for modified Stoke AS Spinal Score (mSASSS)
• In patients treated with continuous SKB (no placebo period), mean baseline
mSASSS 10.22, mean change 0.30 at 104 weeks; 80% no progression
• Greater change in males, baseline syndesmophytes, elevated CRP
Baraliakos X, et al. ACR 2015, San Francisco, #L6
Little change in radiographs over 2 years.
No controls for comparison
Change f
rom
baselin
e 5
Cumulative probability
–5
10
0
0 20 40 60 80 100
SKB 150 mg iv (n=86)
SKB 75 mg iv (n=82)
mSASSS, Week 104
Copyright 2016 TREG Consultants LLC
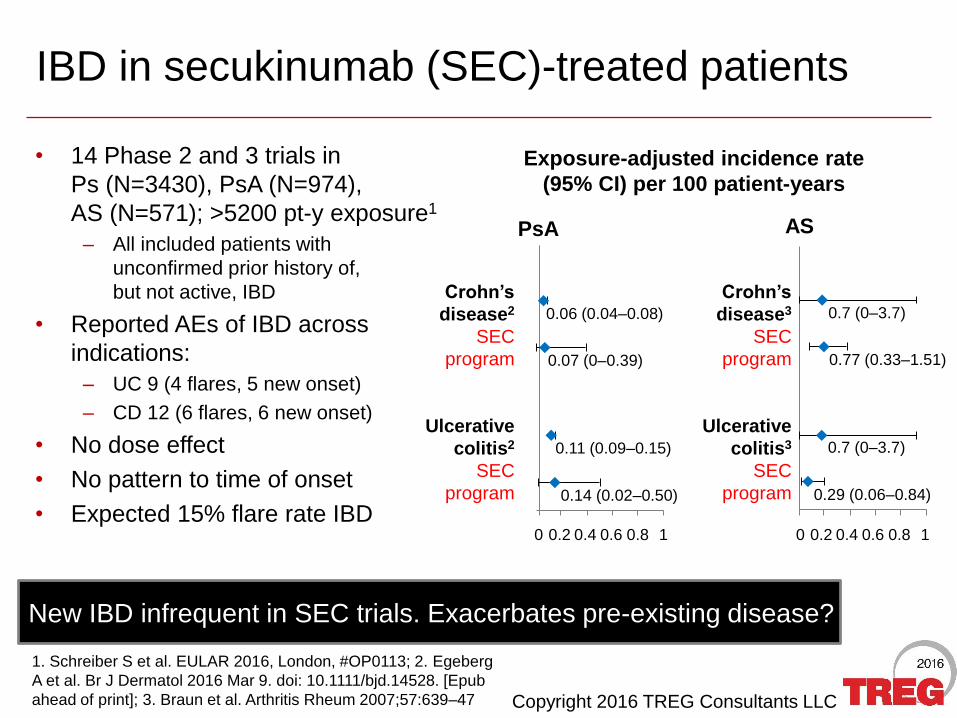
IBD in secukinumab (SEC)-treated patients
• 14 Phase 2 and 3 trials in
Ps (N=3430), PsA (N=974),
AS (N=571); >5200 pt-y exposure1
– All included patients with
unconfirmed prior history of,
but not active, IBD
• Reported AEs of IBD across
indications:
– UC 9 (4 flares, 5 new onset)
– CD 12 (6 flares, 6 new onset)
• No dose effect
• No pattern to time of onset
• Expected 15% flare rate IBD
1. Schreiber S et al. EULAR 2016, London, #OP0113; 2. Egeberg
A et al. Br J Dermatol 2016 Mar 9. doi: 10.1111/bjd.14528. [Epub
ahead of print]; 3. Braun et al. Arthritis Rheum 2007;57:639–47
New IBD infrequent in SEC trials. Exacerbates pre-existing disease?
AS
0.29 (0.06–0.84)
0.7 (0–3.7)
0.77 (0.33–1.51)
0.7 (0–3.7)
Crohn’s
disease3
SEC
program
Ulcerative
colitis3
SEC
program
0.2 0.80.4 0.60 1
0.14 (0.02–0.50)
0.11 (0.09–0.15)
0.07 (0–0.39)
0.06 (0.04–0.08)
Crohn’s
disease2
SEC
program
Ulcerative
colitis2
SEC
program
PsA
Exposure-adjusted incidence rate
(95% CI) per 100 patient-years
0.2 0.80.4 0.60 1
Copyright 2015 TREG Consultants LLC
-4
-2
0
2
4
6
8
0 20 40 60 80 100
mT
SS
ch
an
ge
fro
m B
L
Cumulative probability
10 6 3
54
3724
7156
43
8068
53
0
20
40
60
80
100
PASI 75 PASI 90 PASI 100
Re
sp
on
de
rs (
%)
3015
6
57
3926
58
40
23
6247
34
0
20
40
60
80
100
ACR20 ACR50 ACR70
Re
sp
on
de
rs (
%)
PASI responses at Week 24
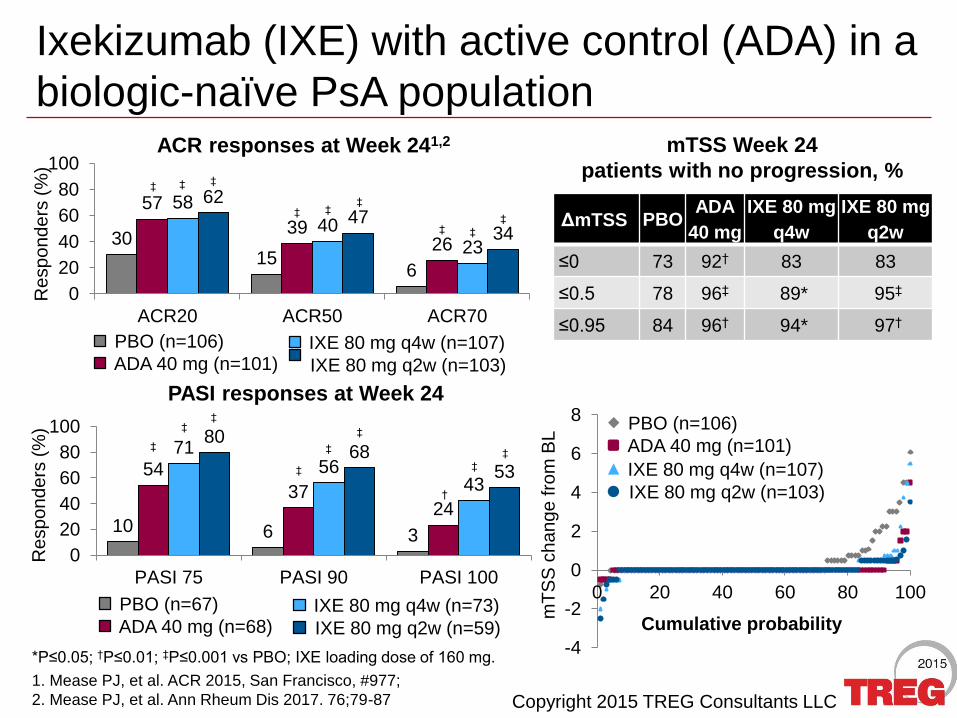
Ixekizumab (IXE) with active control (ADA) in a
biologic-naïve PsA population
*P≤0.05; †P≤0.01; ‡P≤0.001 vs PBO; IXE loading dose of 160 mg.
ACR responses at Week 241,2
ΔmTSS PBOADA
40 mg
IXE 80 mg
q4w
IXE 80 mg
q2w
≤0 73 92† 83 83
≤0.5 78 96‡ 89* 95‡
≤0.95 84 96† 94* 97†
mTSS Week 24
patients with no progression, %
PBO (n=106)
ADA 40 mg (n=101) IXE 80 mg q4w (n=107)
IXE 80 mg q2w (n=103)
PBO (n=67)
ADA 40 mg (n=68) IXE 80 mg q4w (n=73)
IXE 80 mg q2w (n=59)
PBO (n=106)
ADA 40 mg (n=101)
IXE 80 mg q4w (n=107)
IXE 80 mg q2w (n=103)
‡ ‡ ‡
‡ ‡‡
‡ ‡
‡
‡
‡‡
‡
‡
‡
†
‡
‡
1. Mease PJ, et al. ACR 2015, San Francisco, #977;
2. Mease PJ, et al. Ann Rheum Dis 2017. 76;79-87
Copyright 2015 TREG Consultants LLC
29 2649 4949 49
64 58
0
50
100
2819
35 33284347 39
0
50
100
Co
mp
lete
resp
on
de
rs (
%)
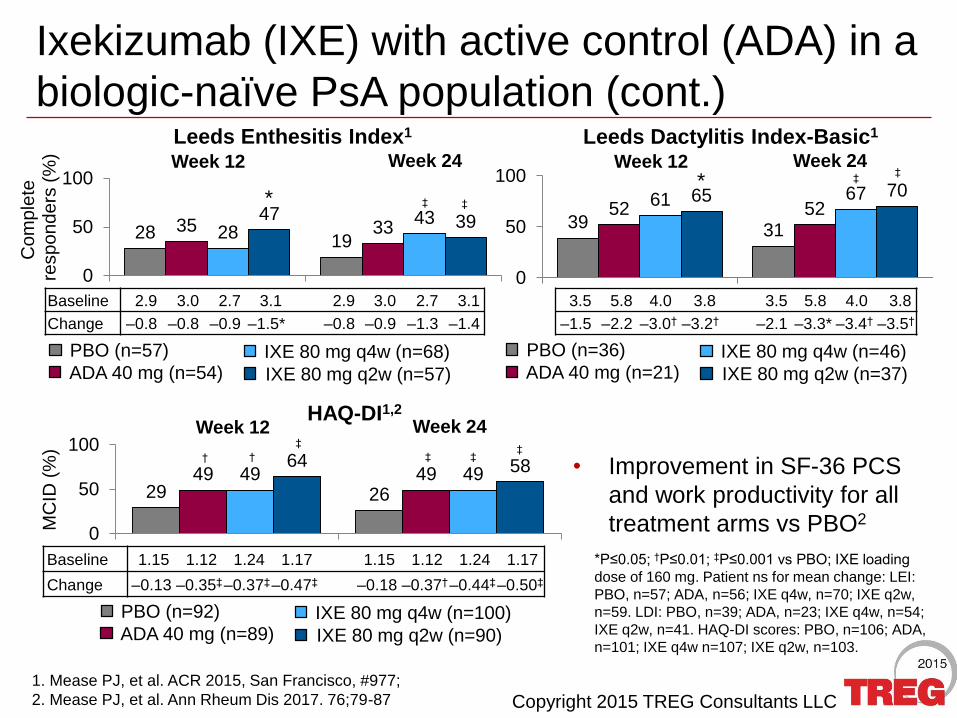
Ixekizumab (IXE) with active control (ADA) in a
biologic-naïve PsA population (cont.)
• Improvement in SF-36 PCS
and work productivity for all
treatment arms vs PBO2
1. Mease PJ, et al. ACR 2015, San Francisco, #977;
2. Mease PJ, et al. Ann Rheum Dis 2017. 76;79-87
39 3152 52
61 6765 70
0
50
100
b
Leeds Enthesitis Index1 Leeds Dactylitis Index-Basic1
HAQ-DI1,2
MC
ID (
%)
Baseline 2.9 3.0 2.7 3.1 2.9 3.0 2.7 3.1
Change –0.8 –0.8 –0.9 –1.5* –0.8 –0.9 –1.3 –1.4
3.5 5.8 4.0 3.8 3.5 5.8 4.0 3.8
–1.5 –2.2 –3.0† –3.2† –2.1 –3.3* –3.4† –3.5†
Week 12 Week 24
Baseline 1.15 1.12 1.24 1.17 1.15 1.12 1.24 1.17
Change –0.13 –0.35‡–0.37‡–0.47‡ –0.18 –0.37†–0.44‡–0.50‡
PBO (n=57)
ADA 40 mg (n=54) IXE 80 mg q4w (n=68)
IXE 80 mg q2w (n=57)
PBO (n=92)
ADA 40 mg (n=89) IXE 80 mg q4w (n=100)
IXE 80 mg q2w (n=90)
PBO (n=36)
ADA 40 mg (n=21) IXE 80 mg q4w (n=46)
IXE 80 mg q2w (n=37)
* ‡ ‡
* ‡‡
Week 12 Week 24 Week 12 Week 24
†
‡
† ‡‡
‡
*P≤0.05; †P≤0.01; ‡P≤0.001 vs PBO; IXE loading
dose of 160 mg. Patient ns for mean change: LEI:
PBO, n=57; ADA, n=56; IXE q4w, n=70; IXE q2w,
n=59. LDI: PBO, n=39; ADA, n=23; IXE q4w, n=54;
IXE q2w, n=41. HAQ-DI scores: PBO, n=106; ADA,
n=101; IXE q4w n=107; IXE q2w, n=103.
2716 33
Week52
Week12
Week24
4715 33
384 20
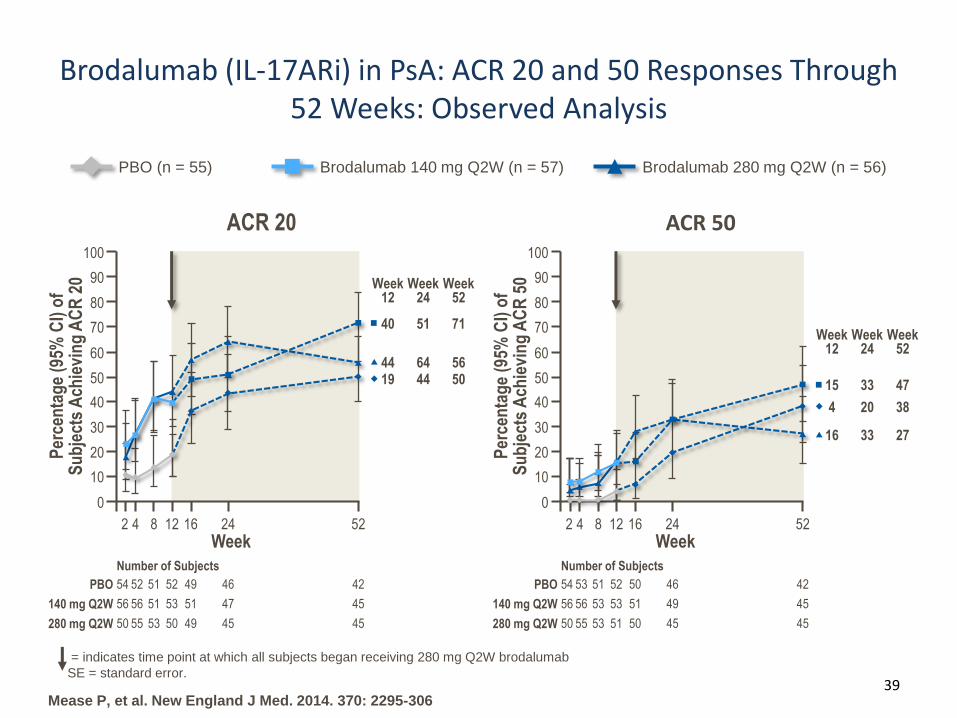
Brodalumab (IL-17ARi) in PsA: ACR 20 and 50 Responses Through 52 Weeks: Observed Analysis
39
= indicates time point at which all subjects began receiving 280 mg Q2W brodalumab
SE = standard error.
Brodalumab 280 mg Q2W (n = 56)PBO (n = 55) Brodalumab 140 mg Q2W (n = 57)
Mease P, et al. New England J Med. 2014. 370: 2295-306
ACR 50
Per
cen
tag
e (9
5% C
I) o
f S
ub
ject
s A
chie
vin
g A
CR
50
Week
100
0
20
30
40
50
60
90
80
70
10
242 4 8 12 16 52
280 mg Q2W
PBO
140 mg Q2W
4550 55 53 51 50 45
4654 53 51 52 50 42
4956 56 53 53 51 45
Number of Subjects
ACR 20
Per
cen
tag
e (9
5% C
I) o
f S
ub
ject
s A
chie
vin
g A
CR
20
Week
5019 44
Week52
Week12
Week24
7140 51
5644 64
100
0
20
30
40
50
60
90
80
70
10
242 4 8 12 16 52
280 mg Q2W
PBO
140 mg Q2W
4550 55 53 50 49 45
4654 52 51 52 49 42
4756 56 51 53 51 45
Number of Subjects
Copyright 2016 TREG Consultants LLC
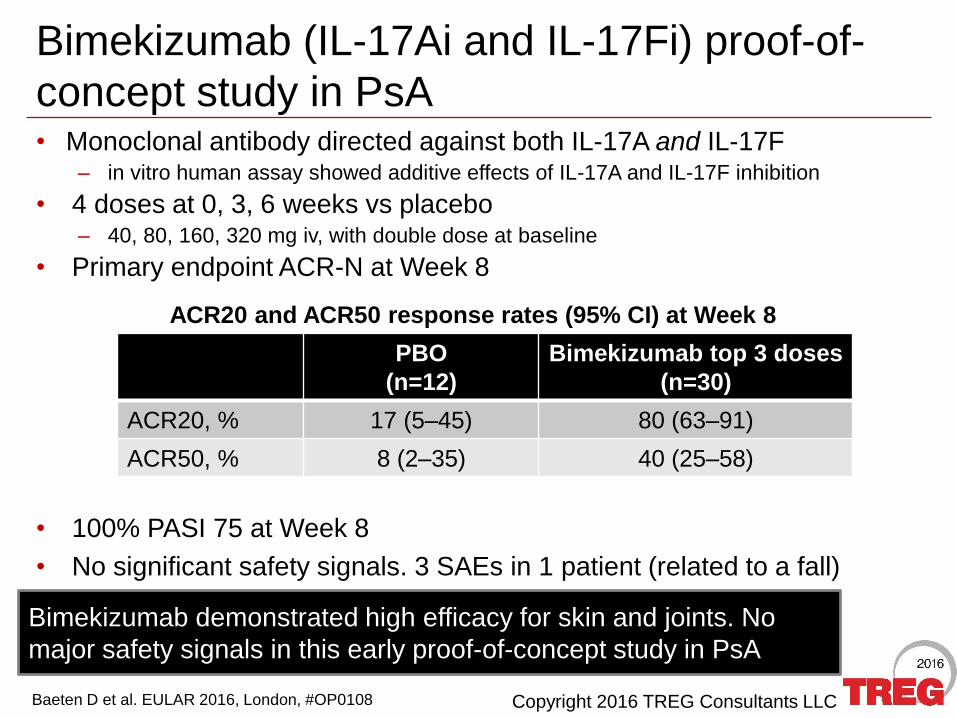
Bimekizumab (IL-17Ai and IL-17Fi) proof-of-
concept study in PsA
Baeten D et al. EULAR 2016, London, #OP0108
• Monoclonal antibody directed against both IL-17A and IL-17F– in vitro human assay showed additive effects of IL-17A and IL-17F inhibition
• 4 doses at 0, 3, 6 weeks vs placebo– 40, 80, 160, 320 mg iv, with double dose at baseline
• Primary endpoint ACR-N at Week 8
ACR20 and ACR50 response rates (95% CI) at Week 8
Bimekizumab demonstrated high efficacy for skin and joints. No
major safety signals in this early proof-of-concept study in PsA
• 100% PASI 75 at Week 8
• No significant safety signals. 3 SAEs in 1 patient (related to a fall)
PBO
(n=12)
Bimekizumab top 3 doses
(n=30)
ACR20, % 17 (5–45) 80 (63–91)
ACR50, % 8 (2–35) 40 (25–58)
Copyright 2016 TREG Consultants LLC
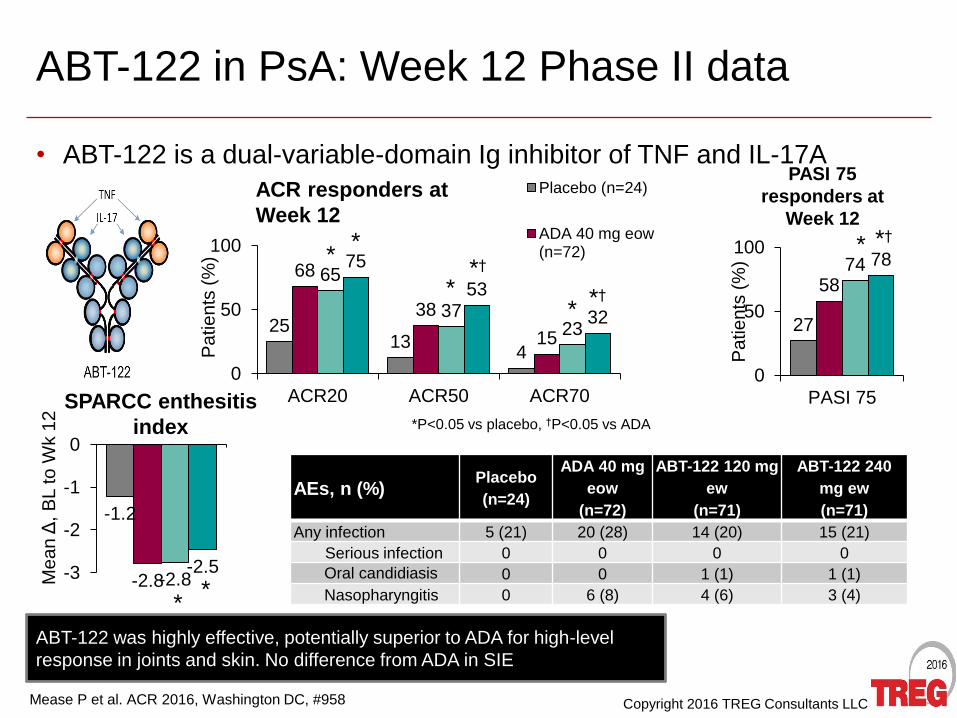
ABT-122 in PsA: Week 12 Phase II data
• ABT-122 is a dual-variable-domain Ig inhibitor of TNF and IL-17A
Mease P et al. ACR 2016, Washington DC, #958
*P<0.05 vs placebo, †P<0.05 vs ADA
2513
4
68
38
15
65
3723
75
53
32
0
50
100
ACR20 ACR50 ACR70
Pa
tie
nts
(%
)Placebo (n=24)
ADA 40 mg eow(n=72)
ACR responders at
Week 12
**
*†
** *†
27
5874 78
0
50
100
PASI 75
Pa
tie
nts
(%
)
PASI 75
responders at
Week 12
* *†
-1.2
-2.8-2.8-2.5-3
-2
-1
0
Mean change frombaseline SPARCC
enthesitis index at Week12
Me
an
Δ, B
L to
Wk 1
2
SPARCC enthesitis
index
**
AEs, n (%)Placebo
(n=24)
ADA 40 mg
eow
(n=72)
ABT-122 120 mg
ew
(n=71)
ABT-122 240
mg ew
(n=71)
Any infection 5 (21) 20 (28) 14 (20) 15 (21)
Serious infection 0 0 0 0
Oral candidiasis 0 0 1 (1) 1 (1)
Nasopharyngitis 0 6 (8) 4 (6) 3 (4)
ABT-122 was highly effective, potentially superior to ADA for high-level
response in joints and skin. No difference from ADA in SIE
Copyright 2016 TREG Consultants LLC
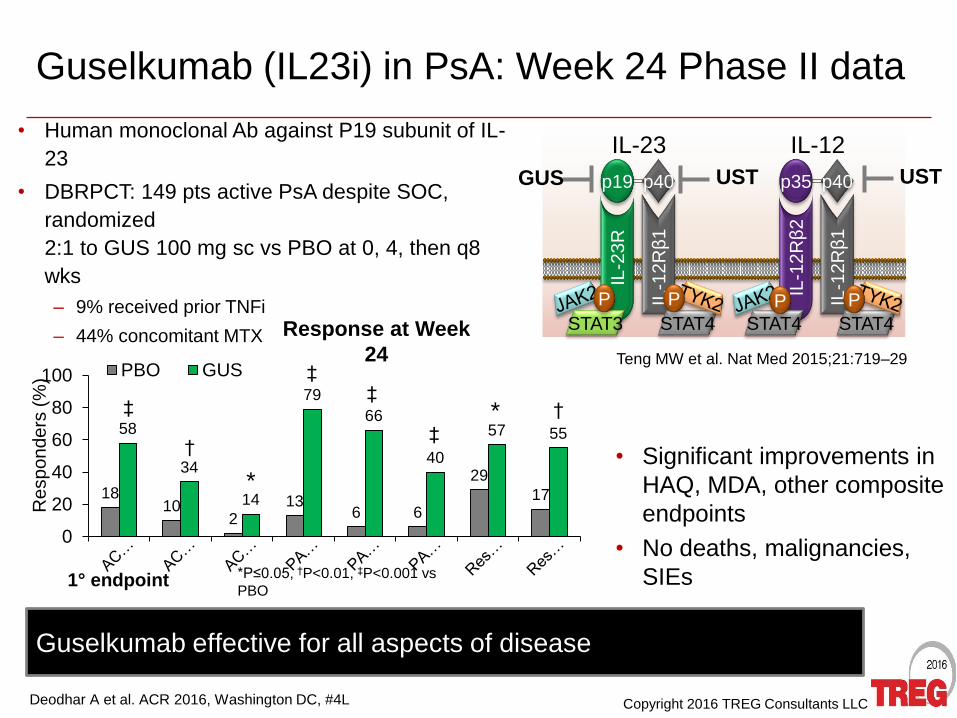
Guselkumab (IL23i) in PsA: Week 24 Phase II data
• Human monoclonal Ab against P19 subunit of IL-
23
• DBRPCT: 149 pts active PsA despite SOC,
randomized
2:1 to GUS 100 mg sc vs PBO at 0, 4, then q8
wks
– 9% received prior TNFi
– 44% concomitant MTX
Deodhar A et al. ACR 2016, Washington DC, #4L
Guselkumab effective for all aspects of disease
Response at Week
24
• Significant improvements in
HAQ, MDA, other composite
endpoints
• No deaths, malignancies,
SIEs
p19
IL-2
3R
p40
IL-1
2R
β1
STAT3
P
STAT4
P
IL-23
p35
IL-1
2R
β2
p40
IL-1
2R
β1
STAT4
P
STAT4
P
IL-12
GUS
Teng MW et al. Nat Med 2015;21:719–29
1810
213
6 6
29
17
58
34
14
79
66
40
57 55
0
20
40
60
80
100
Re
sp
on
de
rs (
%) PBO GUS
USTUST
1° endpoint *P≤0.05, †P<0.01, ‡P<0.001 vs
PBO
*
*
‡
†
‡‡
‡
†

T Cell Differentiation Pathways43