Embed Size (px)
Citation preview
N A T I O N A L A E R O N A U T I C S A N D S P A C E A D M I N I S T R A T I O N
Technical Report 32-7070
The Thermal Conduction Process in Carbonaceous Chars
Robert G. Nagler
GPO PRICE $
I
I (THRU)
CFSTl PRICE(S) $
IACCESSION NUMBER)
'(PAGES) Hard copy (HC)
Microfiche (MF) (CATEGORY)
ff 653 July 65 : '- J E T P R O P U L S I O N L A B O R A T O R Y
C A L I F O R N I A I N S T I T U T E O F T E C H N O L O G Y
P A S A D E N A , C A L I F O R N I A
February 1 , 1967
https://ntrs.nasa.gov/search.jsp?R=19670007227 2018-06-20T04:20:11+00:00Z
. b
N A T I O N A L A E R O N A U T I C S A N D S P A C E A D M I N I S T R A T I O N
Technical Report 32-7070
The Thermal Conduction Process in Carbonaceous Chars
Robert G. Nagler
Approved by:
H. Martens, M a h g e r
Materials Section
J E T P R O P U L S I O N L A B O R A T O R Y
C A L I F O R N I A I N S T I T U T E OF T E C H N O L O G Y
P A S A D E N A , C A L I F O R N I A
February 1, 1967
T€CHN/CAl REPORT 32- IO IO
Copyright @ 1967 Jet Propulsion Laboratory
California Institute of Technology
Prepared Under Contract No. N A S 7-100 National Aeronautics 8 Space Administration
Contents
1 . Background . . . . . . . . . . . . . . . . . . . . . . . . . 1
II . Micro Char-Conductance . . . . . . . . . . . . . . . . . . . . 1
111 . Available Experimental Measurements . . . . . . . . . . . . . . 3
IV . Correlation with Theory . . . . . . . . . . . . . . . . . . . . 6
V . Implications for the Ablative Designer . . . . . . . . . . . . . . 11
Nomenclature . . . . . . . . . . . . . . . . . . . . . . . . . 12
References . . . . . . . . . . . . . . . . . . . . . . . . . . . 13
Tu bles
1 . Identification of test materials . . . . . . . . . . . . . . . . . . 2
2 . Char characterization data (from Refs . 6 and 7) . . . . . . . . . . . . 7
Figures
1 . Effective thermal conductivity of high density S0/50 phenolic nylon (powder) chars . . . . . . . . . . . . . . . . . . . . . . . 3
2 . Effective thermal conductivity of high density SO/SO phenolic nylon (cloth) chars . . . . . . . . . . . . . . . . . . . . . . . . 4
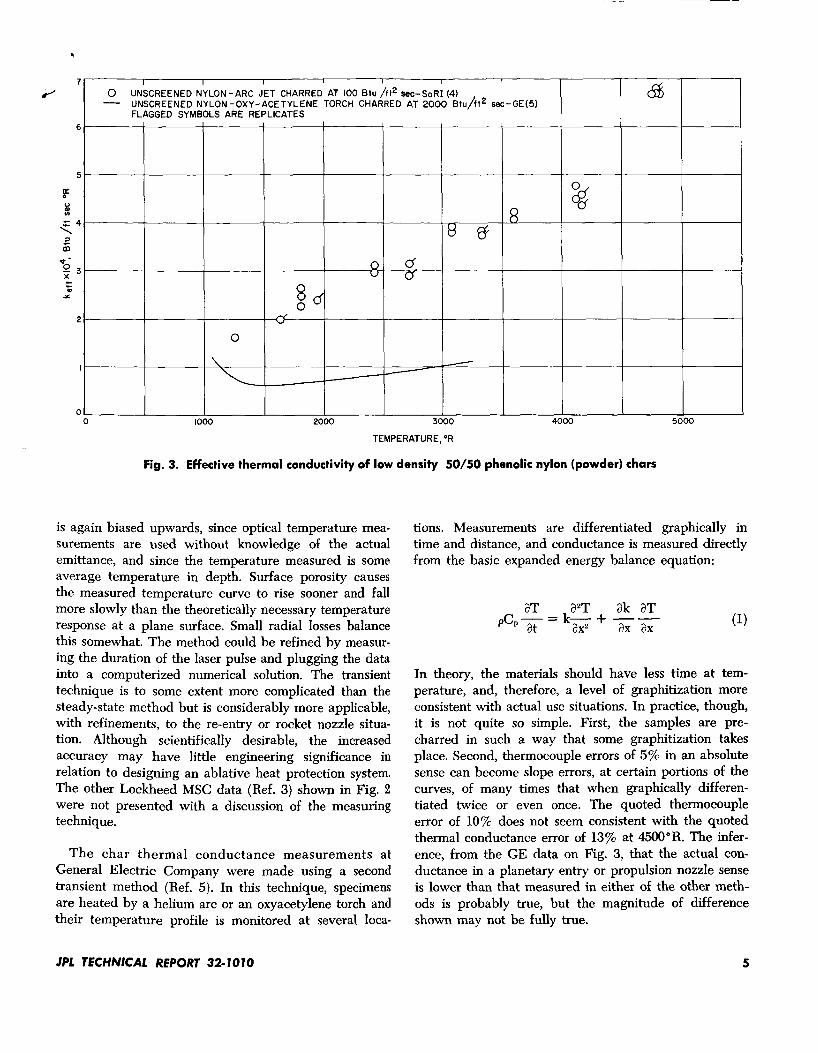
3 . Effective thermal conductivity of low density 50/SO phenolic nylon (powder) chars . . . . . . . . . . . . . . . . . . . . . . . 5
6
8
9
4 . Curve-fitting high density phenolic nylon conductance data . . . . . . . . 5 . Time effects on char conductance . . . . . . . . . . . . . . . . . 6 . Photomicrographs of typical chars (50X). (Ref . 6) . . . . . . . . . . .
7 . Visual differences in phenolic nylon chars made with graded nylon powder (1OX) . . . . . . . . . . . . . . . . . . . . . . . 10
8 . A further look at the effect of heat treatment on the thermal conductance of chars . . . . . . . . . . . . . . . . . . . . . 11
JPL TECHNICAL REPORT 32- IO IO iii
iv
Abstract
Conductive heat transfer in porous carbonaceous chars has been considered in relation to the extent of char graphitization due to the time-temperature history of a particular degraded phenolic nylon sample. The available data on the con- ductance of phenolic nylon chars have been analyzed and their practical value in application to entry or propulsion thermal protection systems has been estimated. Measured values of conductance appear conservative for atmospheric entry or one-shot propulsion devices, but nonconservative for propulsion devices with several restarts. Chars can be tailored to produce the best attainable insulation capability or the strongest char, but not both. A compromise is necessary to com- bine both properties.
J P l TECHNICAL REPORT 32- 10 10
8
b-
The Thermal Conduction Process
in Carbonaceous Chars
1. Background most graphitic material the phonon transfer process is - Ablative thermal protection systems have found wide
use in the last decade for both atmospheric entry and propulsion devices. Several recent reports (Refs. 1, 2, and 3) have shown that the thermal conductance1 of the ablative residue or char is one of the major determinants of the thickness of ablative material necessary to hold the temperature of an ablator-structure bond-line below
considered to be dominant. A phonon is an empirical term which is used to represent the energy transfer in solids due to the sum of interactions between the normal modes of vibration of the molecules. This is essentially a collision process. What is normally measured as solid conduction is a combination of this collision transfer and radiant transfer between individual molecules.
some predetermined design value. Accurate determina- tion of the thermal conductance, especially at high tem- peratures, is necessary to provide reliable designs and realistic ablator weights.
A look at each of the solid conduction mechanisms in relation to a carbon char from an ablation material might be apropos. The rate of collision (translational, rota- tional, and vibrational) is a function of the size of the
II. Micro Char-Conductance
The energy level of any atom consists of the sum of its translational, rotational, vibrational, and internal- potential energies. An atom can change its energy level by collision with other atoms or by radiant or small par- ticle emission or absorption. In graphitic crystallites, this can take the form of elastic wave or lattice vibration transfer (phonon transfer) or of electronic transfer. For
'Conductance, rather than conductivity, is used throughout this report to prevent definition arguments.
atom, the spacing between atoms, the mean free path (which is related to but usually longer than the spacing between atoms), the number of electrons in the outer shell, and any chemical bonding forces as well as the actual level of thermal or velocity energy in the atom. In a carbon char, the size of the atoms and the number of electrons in the outer shell are essentially constant. The atom spacing, the mean free path, and the bonding forces, though, are a function of the degree of ordering (including distortion effects) of the atoms, which can range from amorphous carbon to graphite under realistic temperatures and pressure. As a char becomes graphitic,
JPL TECHNICAL REPORT 32- IO IO 1
a number of phenomena take place. The size of the indi- vidual crystallites increases through incorporation of dis- organized carbon into the lattice and through grain or crystallite boundary displacement. The crystallites them- selves become more ordered through the healing of lat- tice distortions and through a general decrease in the average interlayer spacing. As the average interlayer spacing decreases, collisions will take place more fre- quently and conductance will increase. Since the spacing in graphitic crystallites is smaller in the direction parallel to the layer planes, the final solid conduction path in a carbon char will be a zigzag along these planes.
Phenolic resin
Evercoat Co., EC-201
Evercoat Co., EC-201
Evercoat Co., EC-201
Evercoat Co., EC-201
Evercoat Co., EC-201
Union Carbide "Bakelite" BRP-5549
Union Carbide "Bakelite" BRP-5549
At the same time, each atom is radiating energy in all directions in some temperature-dependent wavelength distribution. When there is a temperature difference be- tween atoms, there is a net radiant heat transfer in the direction of the lower temperature. In the solid portion
Average f iber Nylon 6-6 f i l ler or powder
diam., mils 36 Fabricator x
Nominal Nominal
~~
50 Stern and Stern 13 50 Westech Plastic 6 Chemical
A-2571 cloth Co. for Lockheed MSC
50 Stern and Stern 9.5 50 Westech Plastic 6 Chemical
A-2951 cloth Co. for Lockheed MSC
50 Stern and Stern 4.5 50 Westech Plastic 6 Chemical
A-2553 cloth Co. for Lockheed MSC
60 Burlington 8.5 40 Westech Plastic 6 Chemical
Industries Co. for Lockheed MSC
13080 cloth
50 Westech Plastic 6 Chemical 50 Burlington 8.5 Industries Co. for Lockheed MSC
13080 cloth
NASA Amer Research 50 Du Pont "Zytel" 14 50 103 ground Center for JPL powder
NASA Amer Research 50 Du Pont "Zytel'' 7 50 103 ground Center for JPL powder
4 of the char, this radiant transfer is small, because the differential temperature between adjacent atoms is small, and most of the net transfer is due to collision processes (phonon transfer). On the edge of the pores, though, this is not true, It is not unrealistic to find tem- perature gradients in chars during atmospheric entry of 32,000"R/in. Also, it is not unusual to find pores in the order of 1/32 in. In such a situation, the temperature differential across the full length of the pore could be as much as 1000"R. If the two absolute temperatures were 4000 and 3000"R, then the radiant transfer from the hot end would be approximately 4 times that from the cooler end. In such a situation, radiant transfer does make a significant contribution.
Union Carbide "Bakelite" BRP-5549
A somewhat different collision transfer process is tak- ing place in the gaseous phase. This convective heat transfer process includes a major translational exchange
50 Du Pont "Zytel" 8 50 NASA langley Research 103 ground Center powder
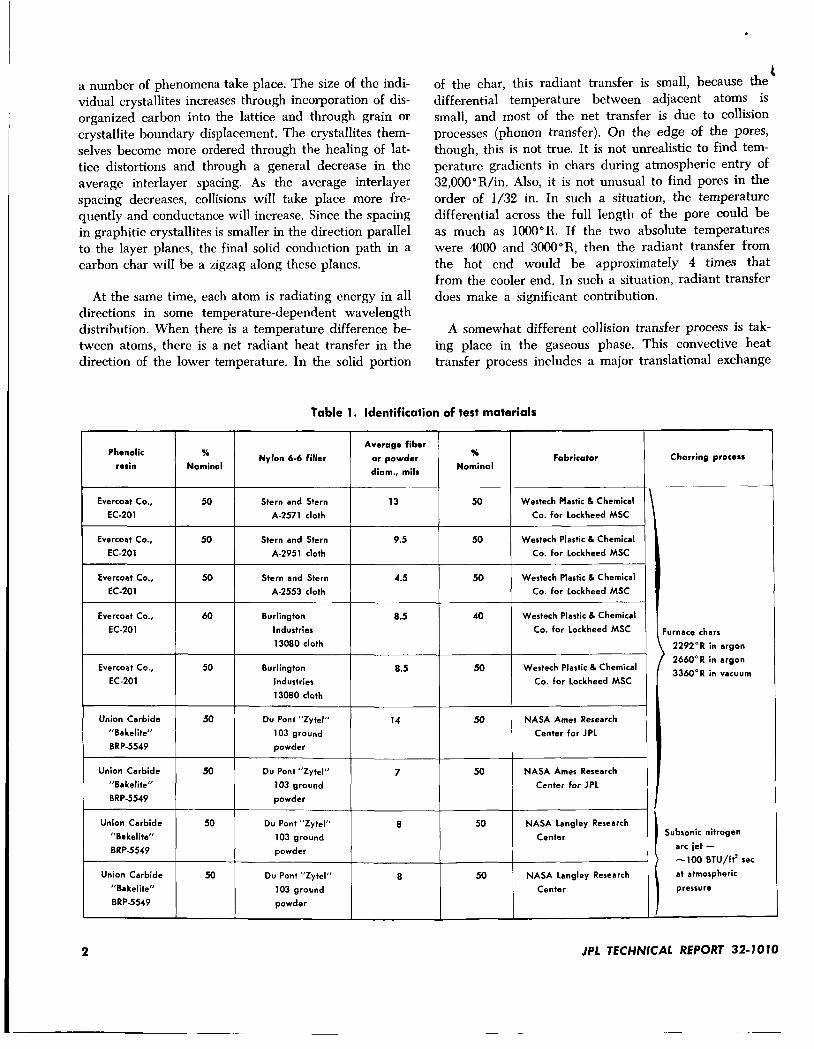
Table 1. Identification of test materials
I I I I
Union Carbide Du Pont "Zytel" "Bakelite" 103 ground
8RP-5549 1 1 powder
NASA langley Research 1 50 j Center
Charring process
~
urnace chars 2292"R in argon 2660"R in argon 3360"R in vacuum
Subsonic nitrogen
arc jet - -100 BTU/ft2 sec at atmospheric
pressure
2 JPL TECHNICAL REPORT 32-1010
. rhithin the gaseous phase as well as the usual atom-to-
atom collision interactions already mentioned.
Thermal conduction in a char is, thus, a combination of solid, gaseous, and radiant conduction, all of which are functions of the temperature gradient across the char. Solid conduction is additionally dependent on the lattice-vibration mean free path while gaseous con- duction is a function of the pressure gradient. Radiant conduction is dependent on the size and shape of the individual pores.
111. Available Experimental Measurements
In general, measurements of char conductance are difficult to make and even more difficult to interpret. Most elevated temperature measurements on chars are unreported. Some experimenters use equipment which is not applicable to the situation in which the data will be used and few have done enough characterization of the char to know either what they have or how it might
resemble a char derived from a planetary entry or pro- pulsion nozzle heat pulse.
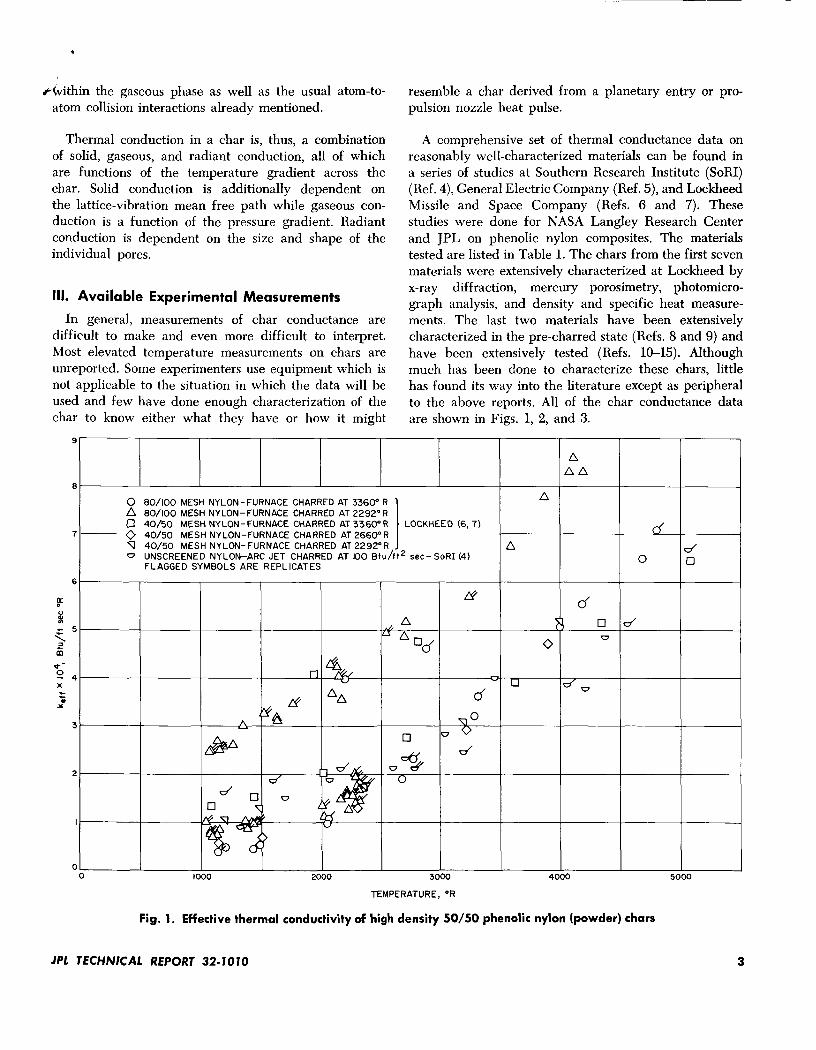
A comprehensive set of thermal conductance data on reasonably well-characterized materials can be found in a series of studies at Southern Research Institute (SORI) (Ref. 4), General Electric Company (Ref. 5), and Lockheed Missile and Space Company (Refs. 6 and 7). These studies were done for NASA Langley Research Center and JPL on phenolic nylon composites. The materials tested are listed in Table 1. The chars from the first seven materials were extensively characterized at Lockheed by x-ray diffraction, mercury porosimetry, photomicro- graph analysis, and density and specific heat measure- ments. The last two materials have been extensively characterized in the pre-charred state (Refs. 8 and 9) and have been extensively tested (Refs. 10-15). Although much has been done to characterize these chars, little has found its way into the literature except as peripheral to the above reports. All of the char conductance data are shown in Figs. 1, 2, and 3.
0 A U
- 0 1 0
4 0 h O MESH NYLON-FURNACE CHARRED AT 3360'R LOCKHEED (6,71
80/100 MESH NYLON-FURNACE CHARRED AT 3360' R 80/100 MESH NYLON-FURNACE CHARRED AT 2292'R
40/50 MESH NYLON-FURNACE CHARRED AT 2660"R 40/50 MESH NYLON-FURNACE CHARRED AT 2292"R
- I UNSCREENED NYLON-ARC JET CHARRED AT IO0 Btu/f t2 s e c - S O R I (4) FLAGGED SYMBOLS ARE REPLICATES
I I I I I 1000 2000 3000
TEMPERATURE, "R
Fig. 1. Effective thermal conductivity of high density 50/50 phenolic nylon (powder) chars
JPL TECHNICAL REPORT 32- IO 10 3
9
E
7
6
F 0
v)
- 5
5 z 0'
9 4 X c r 0 s
3
2
C
I 0 13 MIL FlEERS-50+/50NY-FURNACE CHARRED AT 2292' R A 13 MIL FlEERS-50+/50NY-FURNACE CHARRED AT 3360' R
- 0 9.5 M I L FlEERS-50+/50NY-FURNACE CHARRED AT 2292' R 0 9.5 MIL FlEERS-50+/50NY-FURNACE CHARRED AT 3360" R
4.5 M I L F18ERS-50Q/50NY-FURNACE CHARRED AT 2292' R
0 x x
J C M J-
u 4.5 M I L FIEERS-5Ok)50NY-FURNACE CHARRED AT 2660' R - n 4.5 MIL FlEERS-504/50NY-FURNACE CHARRED AT 3360" R
D 8.5 MIL FIEERS-60Q/40NY-FURNACE CHARRED AT 2292" R
Y
3c + x 4- u
8.5 M I L FIBERS-604/40NY-FURNACE CHARRED AT 3360" R a 8.5 MIL FlEERS-50+/50NY-FURNACE CHARRED AT 2292" R w 8.5 MIL FlEERS-50+/50NY-FURNACE CHARRED AT 3360' R
X UNIDENTIFIED-50+/50NY-FURNACE CHARRED AT 2460" R
I I 1 I 1 I "
- + UNIDENTlFIED-50+/50NY-FURNACE CHARRED AT 1460" R
UNIDENTIFIED-50+/50NY-FURNACE CHARRED AT 3460" R FLAGGED SYMBOLS ARE REPLICATES
*
I I I* I I I + I I I I
* o:+ *
I d cy a >
~
1000 2000 3000 4000 5000
*
TEMPERATURE, O R
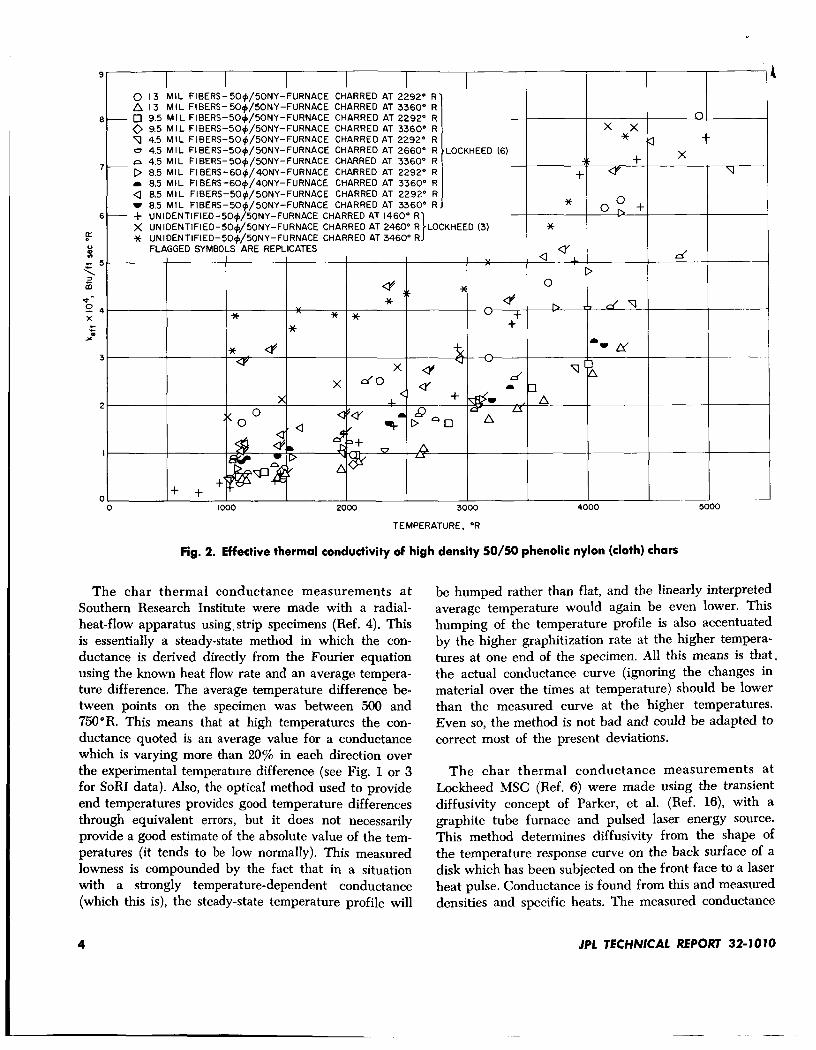
Fig. 2. Effective thermal conductivity of high density 50/50 phenolic nylon (cloth) chars
d 0
" c. C Y C f V * d
* n * * v +
The char thermal conductance measurements a t Southern Research Institute were made with a radial- heat-flow apparatus using, strip specimens (Ref. 4). This is essentially a steady-state method in which the con- ductance is derived directly from the Fourier equation using the known heat flow rate and an average tempera- ture difference. The average temperature difference be- tween points on the specimen was between 500 and 750"R. This means that at high temperatures the con- ductance quoted is an average value for a conductance which is varying more than 20% in each direction over the experimental temperature difference (see Fig. 1 or 3 for SORI data). Also, the optical method used to provide end temperatures provides good temperature differences through equivalent errors, but it does not necessarily provide a good estimate of the absolute value of the tem- peratures (it tends to be low normally). This measured lowness is compounded by the fact that in a situation with a strongly temperature-dependent conductance (which this is), the steady-state temperature profile will
be humped rather than flat, and the linearly interpreted average temperature would again be even lower. This humping of the temperature profile is also accentuated by the higher graphitization rate at the higher tempera- tures at one end of the specimen. All this means is that. the actual conductance curve (ignoring the changes in material over the times at temperature) should be lower than the measured curve at the higher temperatures. Even so, the method is not bad and could be adapted to correct most of the present deviations.
The char thermal conductance measurements at Lockheed MSC (Ref. 6) were made using the transient diffusivity concept of Parker, et al. (Ref. 16), with a graphite tube furnace and pulsed laser energy source. This method determines diffusivity from the shape of the temperature response curve on the back surface of a disk which has been subjected on the front face to a laser heat pulse. Conductance is found from this and measured densities and specific heats. The measured conductance
4 JPL TECHNICAL REPORT 32- 10 10
I
1 5000
Fig. 3. Effective thermal conductivity of low density 50/50 phenolic nylon (powder) chars
is again biased upwards, since optical temperature mea- surements are used without knowledge of the actual emittance, and since the temperature measured is some average temperature in depth. Surface porosity causes the measured temperature curve to rise sooner and fall more slowly than the theoretically necessary temperature response at a plane surface. Small radial losses balance this somewhat. The method could be refined by measur- ing the duration of the laser pulse and plugging the data into a computerized numerical solution. The transient technique is to some extent more complicated than the steady-state method but is considerably more applicable, with refinements, to the re-entry or rocket nozzle situa- tion. Although scientifically desirable, the increased accuracy may have little engineering significance in relation to designing an ablative heat protection system. The other Lockheed MSC data (Ref. 3) shown in Fig. 2 were not presented with a discussion of the measuring technique.
The char thermal conductance measurements at General Electric Company were made using a second transient method (Ref. 5). In this technique, specimens are heated by a helium arc or an oxyacetylene torch and their temperature profile is monitored at several loca-
tions. Measurements are differentiated graphically in time and distance, and conductance is measured directly from the basic expanded energy balance equation:
In theory, the materials should have less time at tem- perature, and, therefore, a level of graphitization more consistent with actual use situations. In practice, though, it is not quite so simple. First, the samples are pre- charred in such a way that some graphitization takes place. Second, thermocouple errors of 5% in an absolute sense can become slope errors, at certain portions of the curves, of many times that when graphically differen- tiated twice or even once. The quoted thermocouple error of 10% does not seem consistent with the quoted thermal conductance error of 13% at 4500"R. The infer- ence, from the GE data on Fig. 3, that the actual con- ductance in a planetary entry or propulsion nozzle sense is lower than that measured in either of the other meth- ods is probably true, but the magnitude of difference shown may not be fully true.
JPL TECHNICAL REPORT 32-1010 5
IV. Correlation with Theory
The experimental char conductance data do not cor- relate well with theory. As discussed earlier, the con- ductance process in a char is a combination of solid, gaseous, and radiant conduction. Calculations show that the gaseous conduction contribution is small compared to the others for many of the problems of interest in ablation technology. This smallness is normally caused by the opposing mass flow due to gas evolution during ablation. For the particular data used in this report, gas conduction does not appear to be a problem. Replicate samples run at Lockheed MSC (Ref. 6 ) with argon at atmospheric pressure or with a vacuum showed no sig- nificant difference. In char samples with significant gas conductance effects, the data should be taken on evacu- ated chars rather than inert atmospheres at standard pressures.
Solid conduction, even without graphitization taking place, is such a complicated process that for a first-cut
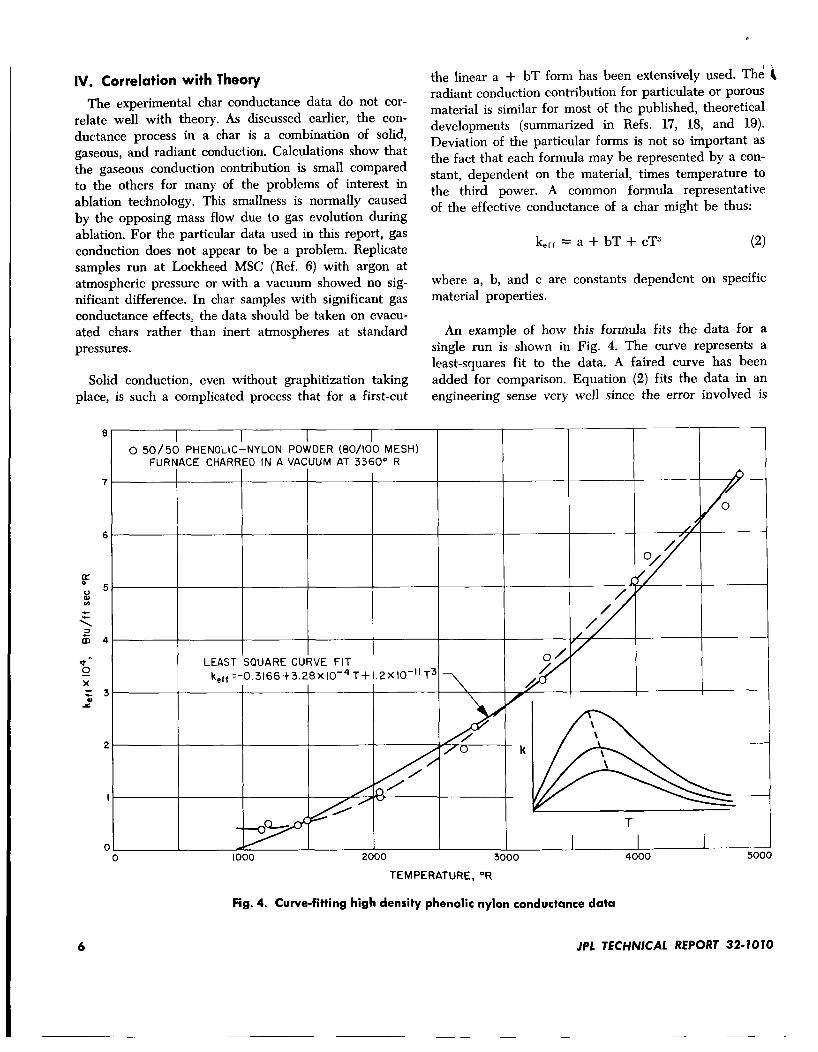
the linear a + bT form has been extensively used. The 4 radiant conduction contribution for particulate or porous material is similar for most of the published, theoretical developments (summarized in Refs. 17, 18, and 19). Deviation of the particular forms is not so important as the fact that each formula may be represented by a con- stant, dependent on the material, times temperature to the third power. A common formula representative of the effective conductance of a char might be thus:
(2) kerf = a + bT + cT3
where a, b, and c are constants dependent on specific material properties.
An example of how this formula fits the data for a single run is shown in Fig. 4. The curve represents a least-squares fit to the data. A faired curve has been added for comparison. Equation (2) fits the data in an engineering sense very well since the error involved is
8
0 50/50 PHENOLIC-NYLON POWDER (80/100 MESH) FURNACE CHARRED IN A VACUUM AT 3360° R
TEMPERATURE, OR
Fig. 4. Curve-fitting high density phenolic nylon conductance data
6 JPL TECHNKAL REPORT 32-1 0 10
i j ,small for the overall effects of the ablation insulation process for which it might be used. Scientifically, though, the curve is the wrong shape and none of the other data of Figs. 1,2, or 3 fit any better. This is not too surprising since there is a complicated graphitization2 process go- ing on at the same time. The shape of the conductance curve for carbon and graphite materials is shown in the lower right-hand corner of Fig. 4. The peak conductance rises and moves to a lower temperature as the degree of graphitization increases. Temperature functions repre- senting this curve shape, combined with a radiant trans- fer term, show less agreement with the experimental data than the simple representation above.
Aher
- - 400
600 - 400 -
1600 -
1600 - -
1200 -
1200 -
A critical look at Figs. 1, 2, and 3 will provide the conclusion that whatever effective conductance is de- rived from these data probably will be incorrect. As per- haps might be expected, arc jet chars have a higher conductance at low temperatures than oven chars. This is expected since the arc jet chars have been exposed to
'Graphitization as used here is the same in idea but different in magnitude from that normally used since maximum crystallite growth is still very small.
Average
- - 68.3
71.3
66.5
66.5
77.1
65.6
73.0
70.8
74.7
69.0
60.9
68.4
55.2
68.7
Nylon form
Powder 50%
Cloth 50%
40%
50%
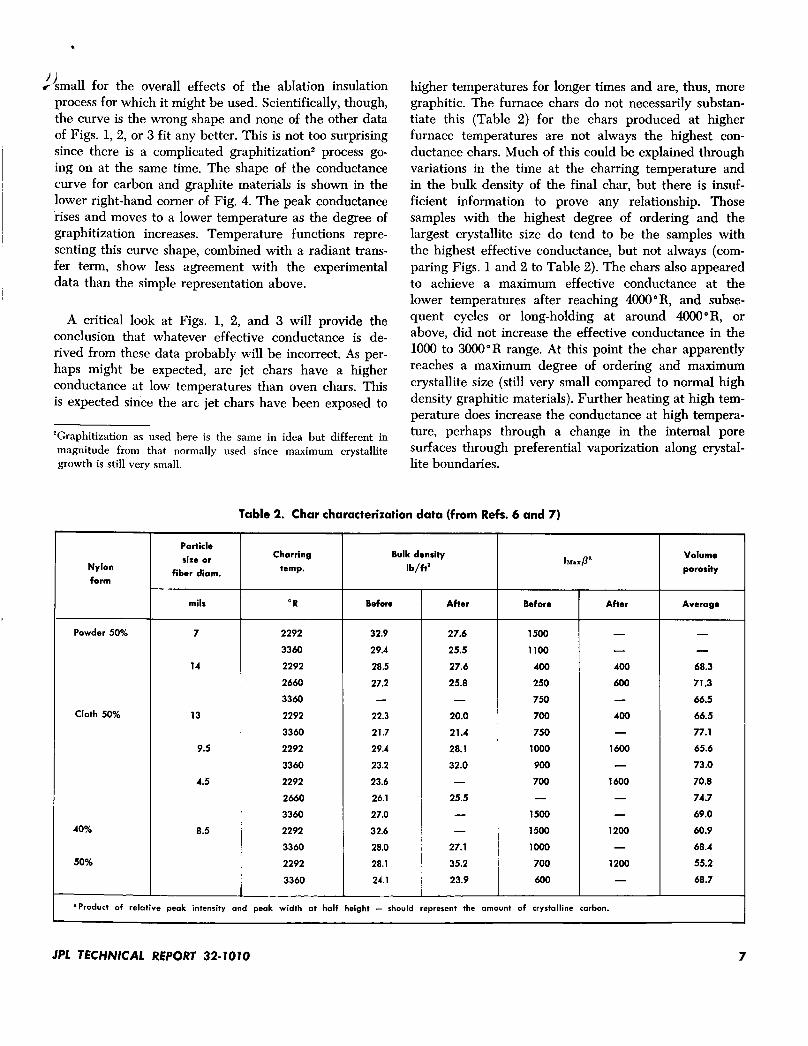
higher temperatures for longer times and are, thus, more graphitic. The furnace chars do not necessarily substan- tiate this (Table 2) for the chars produced at higher furnace temperatures are not always the highest con- ductance chars. Much of this could be explained through variations in the time at the charring temperature and in the bulk density of the final char, but there is insuf- ficient information to prove any relationship. Those samples with the highest degree of ordering and the largest crystallite size do tend to be the samples with the highest effective conductance, but not always (com- paring Figs. 1 and 2 to Table 2). The chars also appeared to achieve a maximum effective conductance at the lower temperatures after reaching 4000"R, and subse- quent cycles or long-holding at around 4000"R, or above, did not increase the effective conductance in the 1000 to 3000"R range. At this point the char apparently reaches a maximum degree of ordering and maximum crystallite size (still very small compared to normal high density graphitic materials). Further heating at high tem- perature does increase the conductance at high tempera- ture, perhaps through a change in the internal pore surfaces through preferential vaporization along crystal- lite boundaries.
Table 2. Char characterization data (from Refs. 6 and 7)
Particle sire or Charring Bulk density I temp. I Ib/ft2 fiber diam.
~~ ~
2292
3360
2292
2660
3360
2292
3360
2292
3360
2292
2660
3360
2292
3360
2292
3360
Before
32.9
29.4
28.5
27.2 -
22.3
21.7
29.4
23.2
23.6
26.1
27.0
32.6
28.0
28.1
24.1
After
27.6
25.5
27.6
25.8 -
20.0
21.4
28.1
32.0 -
25.5 - -
27.1
35.2
23.9
Volume porosity
Before
1500
1100
400
250
750
700
750
1000
900
700 -
1500
1500
1000
700
600
nProduct of relotive peak intensity and peak width at half height - should represent the amount of crystalline carbon.
JPL TECHNICAL REPORT 32- 10 IO 7
9
e
7
6
F 0 al In
- 5
3 z *- 2 4 X r r m
x
?
2
C 0
I
1 1000 2000 3000
TEMPERATURE, O R
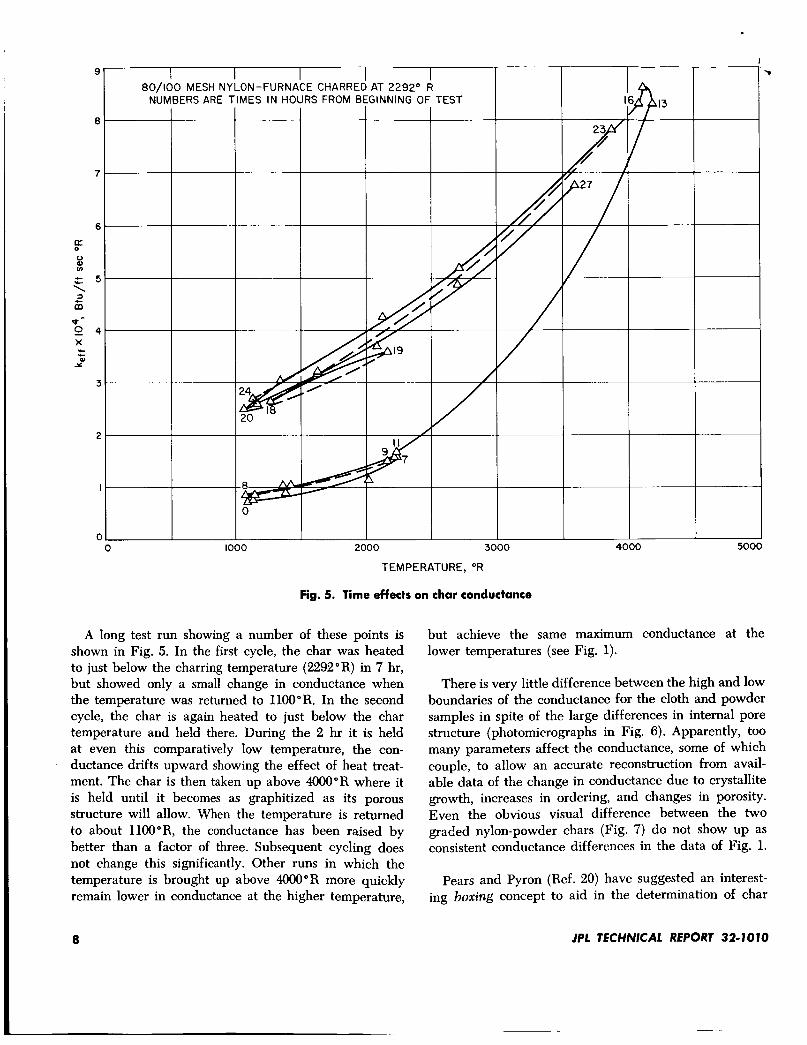
Fig. 5. Time effects on char conductance
4000 500
A long test run showing a number of these points is shown in Fig. 5. In the first cycle, the char was heated to just below the charring temperature (2292"R) in 7 hr, but showed only a small change in conductance when the temperature was returned to 1100"R. In the second cycle, the char is again heated to just below the char temperature and held there. During the 2 hr it is held at even this comparatively low temperature, the con- ductance drifts upward showing the effect of heat treat- ment. The char is then taken up above 4000"R where it is held until it becomes as graphitized as its porous structure will allow. When the temperature is returned to about 1100" R, the conductance has been raised by better than a factor of three. Subsequent cycling does not change this significantly. Other runs in which the temperature is brought up above 4000"R more quickly remain lower in conductance at the higher temperature,
but achieve the same maximum conductance at the lower temperatures (see Fig. 1).
There is very little difference between the high and low boundaries of the conductance for the cloth and powder samples in spite of the large differences in internal pore structure (photomicrographs in Fig. 6). Apparently, too many parameters affect the conductance, some of which couple, to allow an accurate reconstruction from avail- able data of the change in conductance due to crystallite growth, increases in ordering, and changes in porosity. Even the obvious visual difference between the two graded nylon-powder chars (Fig. 7) do not show up as consistent conductance differences in the data of Fig. 1.
Pears and Pyron (Ref. 20) have suggested an interest- ing boxing concept to aid in the determination of char
8 I P L TECHNICAL REPORT 32-1010
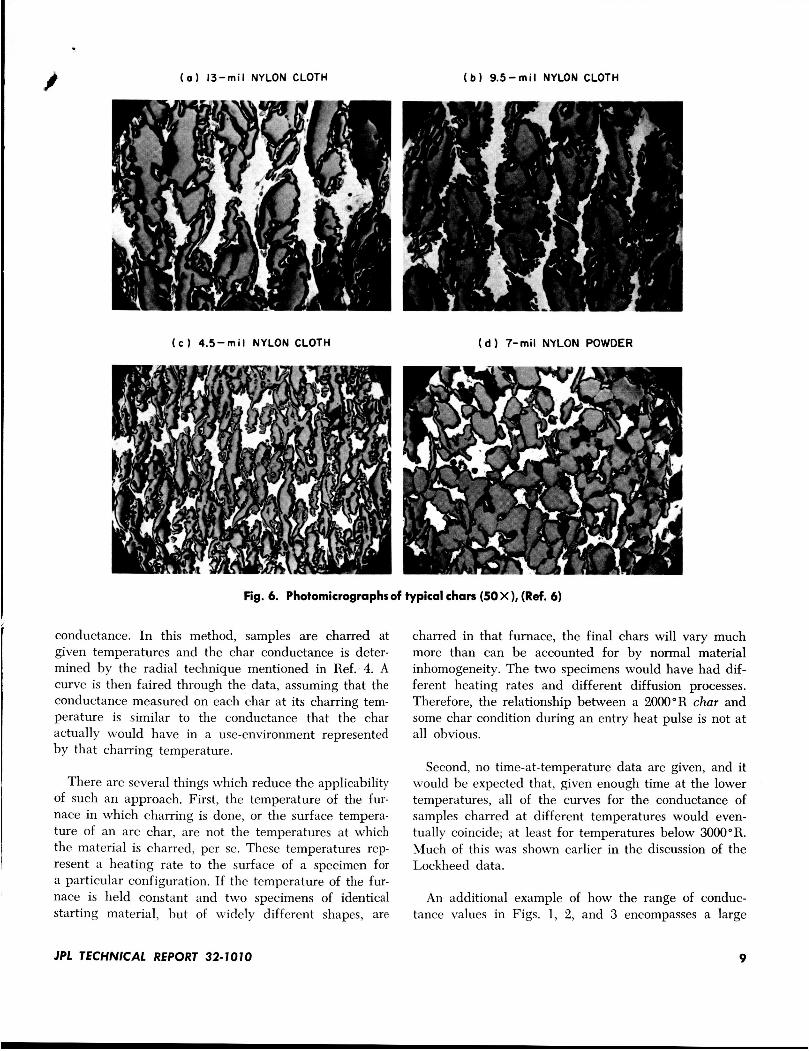
. ( 0 1 13-mil NYLON CLOTH 1 ( b l 9.5-mil NYLON CLOTH
( c ) 4.5-mil NYLON CLOTH ( d ) 7-mil NYLON POWDER
Fig. 6. Photomicrographsof typical chars (50X), (Ref. 6)
conductance. In this method, samples are charred at given temperatures and the char conductance is deter- mined by the radial technique mentioned in Ref:4. A curve is then faired through the data, assuming that the conductance measured on each char at its charring tem- perature is similar to the conductance that the char actually would have in a use-environment represented by that charring temperature.
There are several things which reduce the applicability of such an approach. First, the temperature of the fur- nace in which charring is done, or the surface tempera- ture of an arc char, are not the temperatures at which the material is charred, per se. These temperatures rep- resent a heating rate to the surface of a specimen for a particular configuration. If the temperature of the fur- nace is held constant and two specimens of identical starting material, but of widely different shapes, are
charred in that furnace, the final chars will vary much more than can be accounted for by normal material inhomogeneity. The two specimens would have had dif- ferent heating rates and different diffusion processes. Therefore, the relationship between a 2000"R char and some char condition during an entry heat pulse is not at all obvious.
Second, no time-at-temperature data are given, and it would be expected that, given enough time at the lower temperatures, all of the curves for the conductance of samples charred at different temperatures would even- tually coincide; at least for temperatures below 3000"R. Much of this was shown earlier in the discussion of the Lockheed data.
An additional example of how the range of conduc- tance values in Figs. 1, 2, and 3 encompasses a large
JPL TKHNICAL REPORT 32-1010 9
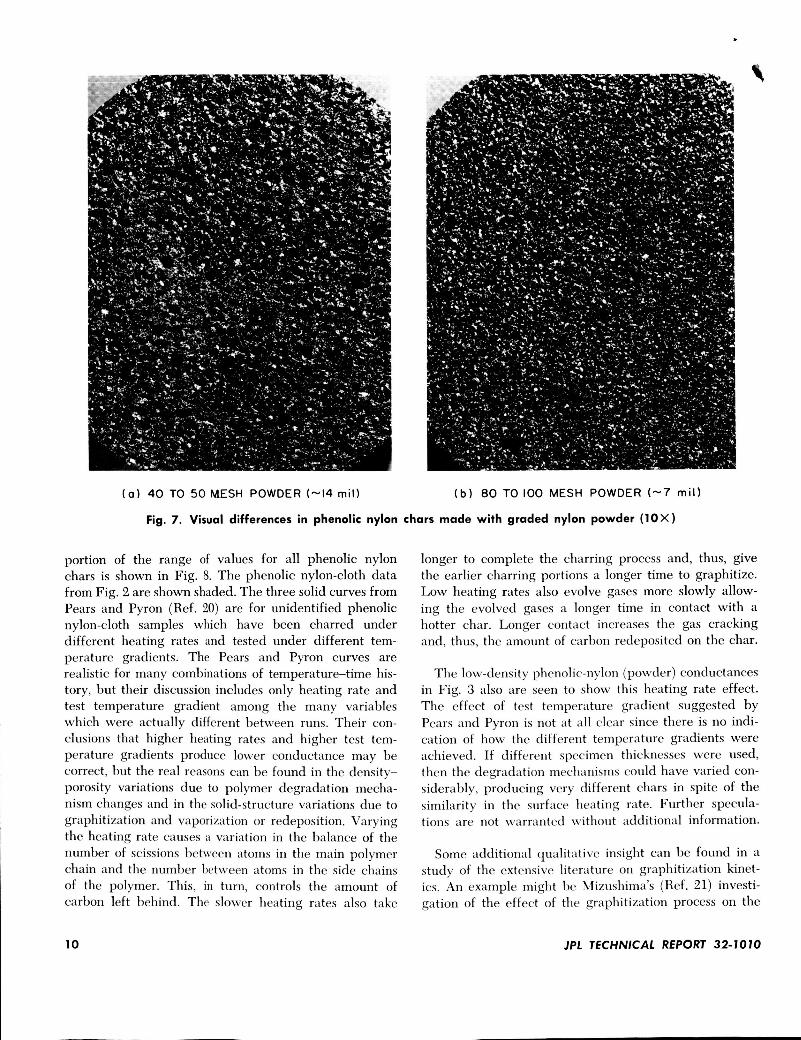
( a ) 40 TO 50 MESH POWDER (-14 mil) ( b ) 80 TO 100 MESH POWDER (-7 mi l )
Fig. 7. Visual differences in phenolic nylon chars made with graded nylon powder (1OX)
portion of the range of values for all phenolic nylon chars is shown in Fig. 8. The phenolic nylon-cloth data from Fig. 2 are shown shaded. The three solid curves from Pears and Pyron (Ref. 20) are for unidentified phenolic nylon-cloth samples which have been charred under different heating rates and tested under different tem- perature gradients. The Pears and Pyron curves are realistic for many combinations of temperature-time his- tory, but their discussion includes only heating rate and test temperature gradient among the many variables which were actually different between runs. Their con- clusions that higher heating rates and higher test tem- perature gradients produce lower conductance may be correct, but the real reasons can be found in the density- porosity variations due to polymer degradation mecha- nism changes and in the solid-structure variations due to graphitization and vaporization or redeposition. Varying the heating rate causes a variation in the balance of the number of scissions between atoms in the main polymer chain and the number between atoms in the side chains of the polymer. This, in turn, controls the amount of carbon left behind. The slower heating rates also take
longer to complete the charring process and, thus, give the earlier charring portions a longer time to graphitize. Low heating rates also evolve gases more slowly allow- ing the evolved gases a longer time in contact with a hotter char. Longer contact increases the gas cracking and, thus, the amount of carbon redeposited on the char.
The low-density phenolic-nylon (powder) conductances in Fig. 3 also are seen to show this heating rate effect. The effect of test temperature gradient suggested by Pears and Pyron is not at all clear since there is no indi- cation of how the different temperature gradients were achieved. If different specimen thicknesses were used, then the degradation mechanisms could have varied con- siderably, producing very different chars in spite of the similarity in the surface heating rate. Further specula- tions are not warranted without additional information.
Some additional qualitative insight can be found in a study of the extensive literature on graphitization kinet- ics. An example might be Mizushima’s (Ref. 21) investi- gation of the effect of the graphitization process on the
10 JPL TECHNlCAL REPORT 32- IO 10
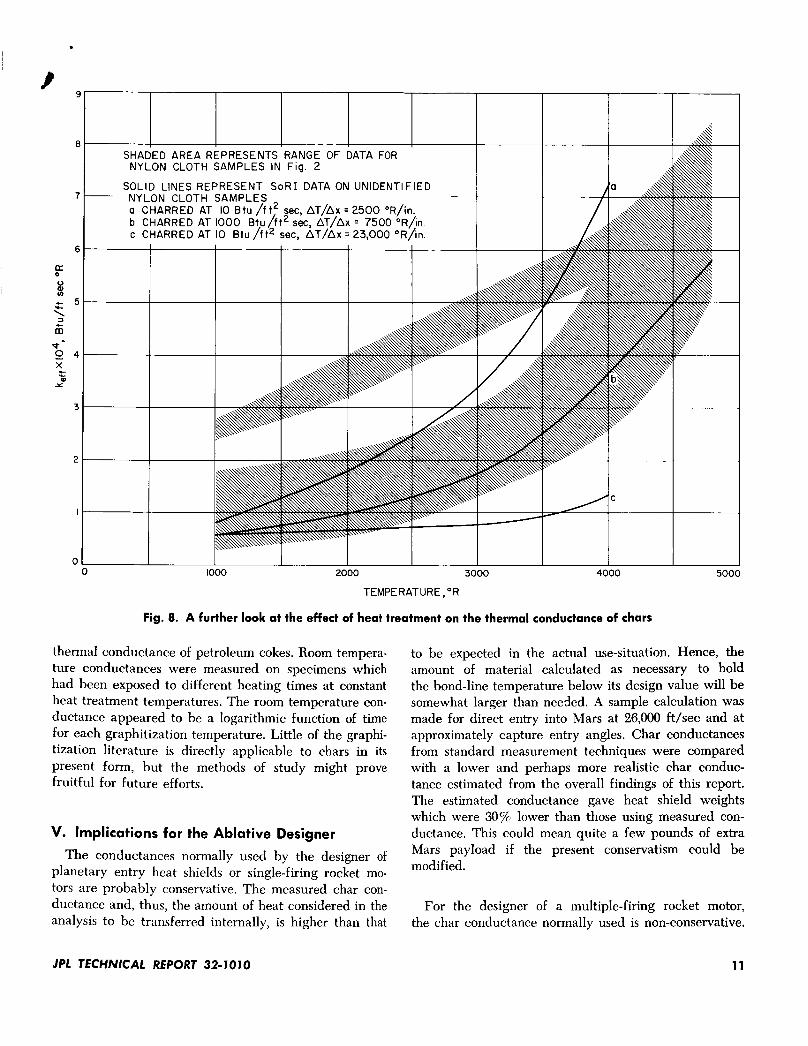
SHADED AREA REPRESENTS RANGE O F DATA FOR
SOLID LINES REPRESENT SORI DATA ON UNIDENTIFIED 'a
NYLON CLOTH SAMPLES IN Fig. 2 , - NYLON CLOTH SAMPLES - f
a b
CHARRED AT CHARRED AT
c CHARRED AT IO Btu /ff2 sec, AT/Ax = 23,000 OR;/in. I I I I I
I
' IO Btu /f tL sec, AT/Ax = 2500 "R/in. 1000 Btu /f t 2 sec. AT/Ax = 7500 OR/in.
1000 2000 3000
TEMPERATURE, OR
4000 5000
Fig. 8. A further look at the effect of heat treatment on the thermal conductance of chars
thermal conductance of petroleum cokes. Room tempera- ture conductances were measured on specimens which had been exposed to different heating times at constant heat treatment temperatures. The room temperature con- ductance appeared to be a logarithmic function of time for each graphitization temperature. Little of the graphi- tization literature is directly applicable to chars in its present form, but the methods of study might prove fruitful for future efforts.
V. Implications for the Ablative Designer
The conductances normally used by the designer of planetary entry heat shields or single-firing rocket mo- tors are probably conservative. The measured char con- ductance and, thus, the amount of heat considered in the analysis to be transferred internally, is higher than that
to be expected in the actual use-situation. Hence, the amount of material calculated as necessary to hold the bond-line temperature below its design value will be somewhat larger than needed. A sample calculation was made for direct entry into Mars at 26,000 ft/sec and at approximately capture entry angles. Char conductances from standard measurement techniques were compared with a lower and perhaps more realistic char conduc- tance estimated from the overall findings of this report. The estimated conductance gave heat shield weights which were 30% lower than those using measured con- ductance. This could mean quite a few pounds of extra Mars payload if the present conservatism could be modified.
For the designer of a multiple-firing rocket motor, the char conductance normally used is non-conservative.
JPL TECHNICAL REPORT 32-101 0 11
On the first firing, the char conductance used is prob- ably high, as above, but as the motor cools, the con- ductance stays higher (Fig. 5), causing an underestimate of the heat transferred internally. This higher-than- estimated heat transfer would continue during later firings. Burnout earlier than predicted could be the final result.
To obtain the actual conductance of a char would take a systematic study of the charring process in each com- posite material of interest, integrated with an improved short-time conductance measurement technique. Such a conductance would probably not agree with the effec- tive conductances determined by inverse solution of the energy equation (Ref. 22), since in such a case conduc- tance becomes a catch-all to account for all other unex- plained or unrecognized phenomena as well.
Chars can be tailored to two extremes for a given resin-filler system. The best insulation capability is pro- duced by the system with the lowest conductance. The lowest conductance is achieved in a material which leaves the least char with the largest average void size. Ideally, three major parameters can be juggled for an
\ optimum system. The first is the use of a completely vaporizing or degrading filler of the largest filler diam- eter consistent with structural integrity of the char. (Powder is normally more reproducible from sample to sample than the cloth.) The second parameter is the use of a resin system with minimum cyclic carbon ring structures that provide a reasonably large char yield. The third parameter is the use of the highest heating rates practical during degradation, reducing the contact time between the evolved gases and the hot char and changing the ratio of side chain to main chain scissions to favor less char yield.
The second extreme represents the best char strength and ablation efficiency. To achieve this condition, the filler system should have the smallest particle size pos- sible in a homogeneous regular three-dimensional matrix, and the resin system should have a large carbon ring content in its main chain. This combination will produce maximum char strength. The use of lowest possible heat- ing rate and, thus, the highest possible contact time be- tween the evolving gases and the char will provide even stronger chars. Since most designers want both extremes in one material, some compromise is necessary to meet the requirements for any particular system.
Nomenclature
k kef*
t
T
X
P
constants
specific heat
conductance
effective conductance
time
temperature
distance
density
12 JPL TECHNICAL REPORT 32-1010
References
1. Nagler, R. G., “Preliminary Analysis of the Importance of Material Properties and Thermal Inputs on Heat Shield for Mars Entry,” J . Spacecraft and Rock- ets,Vol. 3, pp. 693-699, May 1966.
2. Tick, Sanford J., Huson, George R., and Griese, Richard, “Design of Ablative Thrust Chambers and Their Materials,” AIAA Paper No. 64-261, 1st AIAA Annual Meeting, Washington, D. C., June 29-July 2, 1964.
3. Kratsch, K. M., Hearne, L. F., and McChesney, H. R., “Thermal Performance of Heat Shield Composites During Planetary Entry,” Engineering Problems of Manned Znterplanetay Exploration, A I M : New York, 1963.
4. Wilson, R. Gale, Compiler, “Thermophysical Properties of Six Charring Ab- lators from 140” to 700°K and Two Chars from 800” to 3000”K,” NASA TN D-2991, Langley Research Center, Oct. 1965.
5. Final Report, “Transient Delamination of the Thermal Conductivity of a Low Density Phenolic Nylon Char,” General Electric Company for NASA Langley Research Center Contract No. NAS 1-2979-1, July 1965.
6. Cunnington, G. R., Bradshaw, W., and Smith, F. J., “Thermal Conductance of Polymer Chars,” Lockheed MSC for JPL Contract 950868, Mar. 15, 1965.
7. Cunnington, G. R., Lockheed MSC, Personal Communication, Sept. 3, 1965.
8. Keller, L. B., “Development of Characterized and Reproducible Syntactic Foam of Phenolic Nylon for Heat Shields,” Final Report, Hughes Aircraft Company for NASA Ames Research Center Contract NAS 2-2739, Dec. 1965.
9. Parker, John A., “Needs for Characterization and Process Control of Low- Density Composites for Aerospace Application,” International Conference of the Society of Plastics Industries, New York, June 6, 1966.
10. Hiester, Nevin K., and Clark, Carroll F., “Feasibility of Standard Evaluation Procedures for Ablating Materials,” Final Report, Stanford Research Institute for NASA Contract No. NASr-49(15), May 31, 1965.
11. Stroud, C. W., “A Study of the Chemical Reaction Zone in Charring Ablators During Thermal Degradation,” A. I. Ch. E. Meeting, Dallas, Tex., Feb. 2-9, 1966.
12. Lundel, J. H., Wakefield, R. M., and Jones, J. W., “Experimental Investiga- tion of a Charring Ablative Material Exposed to Combined Convective and Radiative Heating in Oxidizing and Non-Oxidizing Environments,” AIAA Entry Technology Conference, Williamsburg, Va., Oct. 12-14, 1964.
13. Swann, R. T., Brewer, W. D., and Clark, R. K., “Effect of Composition and Density on the Ablative Performance of Phenolic Nylon,” 8th Meeting of SAMPE, San Francisco, Calif., May 528,1965.
14. Clark, Ronald K., “Effect of Environmental Parameters on the Performance of Low-Density Silicone-Resin and Phenolic Nylon Ablation Materials,” NASA TN D-2543, Jan. 1965.
JPL TECHNlCAL REPORT 32- IO IO 13
References (contd)
14
15. Swann, Robert T., Dow, Marvin B., and Tompkins, Stephen S., “Analysis of the Effects of Environmental Conditions on the Performance of Charring Ablators, 1. Spacecraft and Rockets, Vol. 3, pp. 61-67, Jan. 1966.
16. Parker, W. J., Jenkins, R. J., Butler, C. P., and Abbott, G. L., “Flash Method of Determining Thermal Diffusivity, Heat Capacity, and Thermal Conduc- tivity,’’ I . Applied Physics, Vol. 32, 1961.
17. Chen, John C., and Churchill, Stuart W., “Radiant Heat Transfer in Packed Beds,” A. 1. Ch. E . Journal, Vol. 9, pp. 35-41, Jan. 1963.
18. Larkin, Bert K., and Churchill, Stuart W., “Heat Transfer by Radiation Through Porous Insulations,” A. 1. Ch. E . Jourml, Vol. 5, pp. 467-474, Dec. 1959.
19. Godbee, Herschel Willcox, “Thermal Conductivity of Magnesia, Alumina, and Zirconia Powders in Air at Atmospheric Pressure from 200°F to 1500”F,” Ph. D. Thesis, School of Chemical Engineering, Georgia Institute of Tech- nology, July 1963.
20. Pears, C. D., and Pyron, C. M., Jr., “The Thermal Conductivity of Ablative Materials by the ‘Boxing’ Analysis,” Vol. 2, The Fifth Conference on Thermal Conductivity, Denver, Colo., Oct. 20-22, 1965.
21. Mizushima, Senchi, “Rate of Graphitization of Carbon,” Proceedings of the Fifth Conference on Carbon, Vol. 2, Permagon Press, New York, 1963,
22. Brazel, J. P., Tanzilli, R. A., and Begany, A. R., “Determination of the Thermal Performance of Char Under Heating Conditions Simulating Atmo- spheric Entry,” AIAA Paper No. 65-640, Thermophysics Specialist Confer- ence, Monterey, Calif., Sept. 13-15, 1965.
pp. 439-447.
JPL TECHNICAL REPORT 32- IO 10