Embed Size (px)
Citation preview
The three-dimensional cephalogram: Theory, technique, and clinical application
Barry Grayson, DDS, Court Cutting, MD, Fred L. Bookstein, PhD,* Hiechun Kim, BS, and Joseph G. McCarthy, MD New York, N.Y., and Ann Arbor, Mich.
The Eiroadbent-Bolto? cephalostat produces intrinsically three-dimensional information about cranial form. Yet in the clinical setting, this information has been used primarily two dimensions at a time in the separate study of lateral or posteroanterior cephalograms. In this article we demonstrate an exipedient use of existing cephalostat-based data sets to derive certain analyses of three-dimensional form. The technique is essentially the same as that of the Broadbent-Bolton “‘Orientator,” an exploitation of the geometry of the cephalostat to simulate stereophotogrammetry. The three-dimensional method supports the usual biometrics of landmark locations, and takes advantage of a norrnative data base that is suited for semiautomatic analysis of syndromic data. The principal drawback of the method is its inability to represent curving form in three dimensions. However, in comparison with computed tomography (CT), it involves low radiation dose, is simpler to obtain, has an available normative data base, and is more practical for quantitative or long-term serial analysis. (AM J ORTHOD DENTOFAC ORTHOP 1988;94:327-37.)
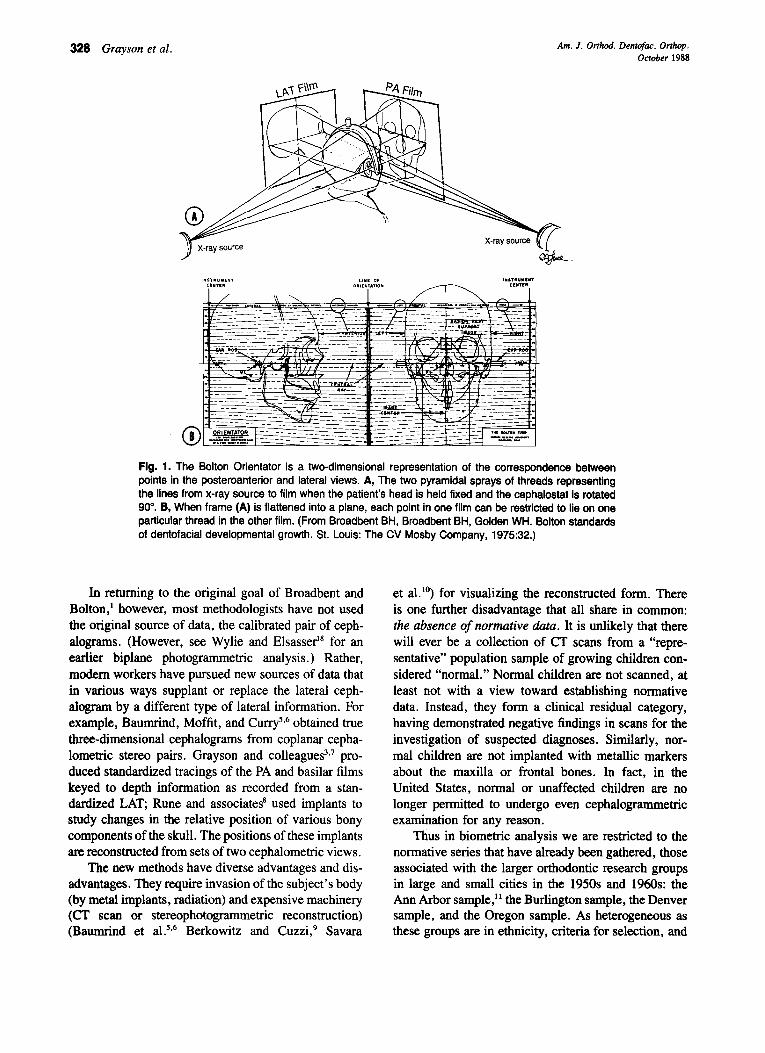
C ephalometrics is a three-dimensional en- terprise. From the very first introduction of the cephalostat, Broadbent and Bolton’ stressed the im- portance of coordinating the lateral (LAT) with the pos- teroanterior (PA) films to arrive at a distortion-free def- inition of cramofacial form. For this purpose they de- scribed the Orient&or, an acetate overlay to be placed over both standardized cephalograms (LAT and PA) after they were oriented jointly along their common Frankfort horizontal plane. One can imagine that in the exposure of a pair of cephalograms it is not the patient’s head that is turned, but instead the cephalostat itself. The LAT and I?A films would in this case occupy po- sitions at 90” to each other, approximately 150 cm above the floor of the cephalostat room. By keeping the films in register with respect to the head, one can draw the rays connecting the x-ray source to each landmark of either film as threads in space. The result (Fig. 1, A) is a pair of pyramidal sprays of thread, intersecting at approximately 90” throughout the interior of the space occupied in reality by the patient’s head. The pair of films can be flattened into one plane by unfolding them along the “corner” at which they approach each other, with each bunclle of threads (x-ray paths) flattened to
From the Institute for Rec~nshuctive Plastic Surgery, New York University. This research was supported in part by NM Grant DE-03568 to Joseph G. McCarthy. *Center for Human Growth and Development, The University of Michigan.
the side of the other film at the appropriate distance. The result is the modified scene in Fig. 1, B. The Orientator is the diagram of the flattened threads. When it is superimposed over the abutted pair of films, the points in each film that correspond to any particular locus in the other can be visualized.
Broadbent and Bolton’ used the Orientator to correct for the distortion inherent in the spread of the ceph- alostatic x-ray beam. We may imagine that, freed of the conventions of x-ray projection, we are instead truly reconstructing the locations of landmarks in space. The principle of the Orientator then becomes identical with that of one standard photogrammetric tool for this pur- pose, the ray intersection method (see below).
The orthodontic community paid little attention to the PA cephalogram shortly after its introduction by Broadbent. Because the clinical problems encountered by most orthodontists were symmetric, they appeared to be adequately recorded by the lateral view alone; whatever the distortion was between left and right sides in this conventionalized representation, it was nearly invariant from case to case and could be ignored. In recent years, as orthodontists have become “cranio- facial orthopedists” treating more severe, often asym- metric craniofacial anomalies, the limitations of the lateral cephalogram have become obvious. For exam- ple, the lateral cephalogram (LAT) by itself is of little clinical value in the evaluation of a patient with uni- lateral craniofacial microsomia.3~4
327
328 Grayson et al. Am. J. Orthod. Dentofac. Orthop. October 1988
Fig. 1. The Bolton Orientator is a two-dimensional representation of the correspondence between points in the posteroanterior and lateral views. A, The two pyramidal sprays of threads representing the lines from x-ray source to film when the patient’s head is held fixed and the cephalostat is rotated 90”. B, When frame (A) is flattened into a plane, each point in one film can be restricted to lie on one particular thread in the other film. (From Broadbent BH, Broadbent BH, Golden WH. Bolton standards of dentofacial developmental growth. St. Louis: The CV Mosby Company, 197532.)
In returning to the original goal of Broadbent and Bolton,’ however, most methodologists have not used the original source of data, the calibrated pair of ceph- alograms. (However, see Wylie and Elsasser’8 for an earlier biplane photogrammetric analysis.) Rather, modem workers have pursued new sources of data that in various ways supplant or replace the lateral ceph- alogram by a different type of lateral information. For example, Baumrind, Moffit, and CU~$,~ obtained true three-dimensional cephalograms from coplanar cepha- lomehic stereo pairs. Grayson and colleagues3*7 pro- duced standardized tracings of the PA and basilar films keyed to depth information as recorded from a stan- dardized LAT; Rune and associates’ used implants to study changes in the relative position of various bony components of the skull. The positions of these implants are reconstructed from sets of two cephalometric views.
The new methods have diverse advantages and dis- advantages. They require invasion of the subject’s body (by metal implants, radiation) and expensive machinery (CT scan or stereophotogrammetric reconstruction) (Baumrind et al.5~~ Berkowitz and Cuzzi,’ Savara
et al.“) for visualizing the reconstructed form. There is one further disadvantage that all share in common: the absence of normative data. It is unlikely that there will ever be a collection of CT scans from a “repre- sentative” population sample of growing children con- sidered “normal.” Normal children are not scanned, at least not with a view toward establishing normative data. Instead, they form a clinical residual category, having demonstrated negative findings in scans for the investigation of suspected diagnoses. Similarly, nor- mal children are not implanted with metallic markers about the maxilla or frontal bones. In fact, in the United States, normal or unaffected children are no longer permitted to undergo even cephalogrammetric examination for any reason.
Thus in biometric analysis we are restricted to the normative series that have already been gathered, those associated with the larger orthodontic research groups in large and small cities in the 1950s and 1960s: the Ann Arbor sample,” the Burlington sample, the Denver sample, and the Oregon sample. As heterogeneous as these groups are in ethnicity, criteria for selection, and
Volume 94 Number 4
Three-dimensional cephalogram 329
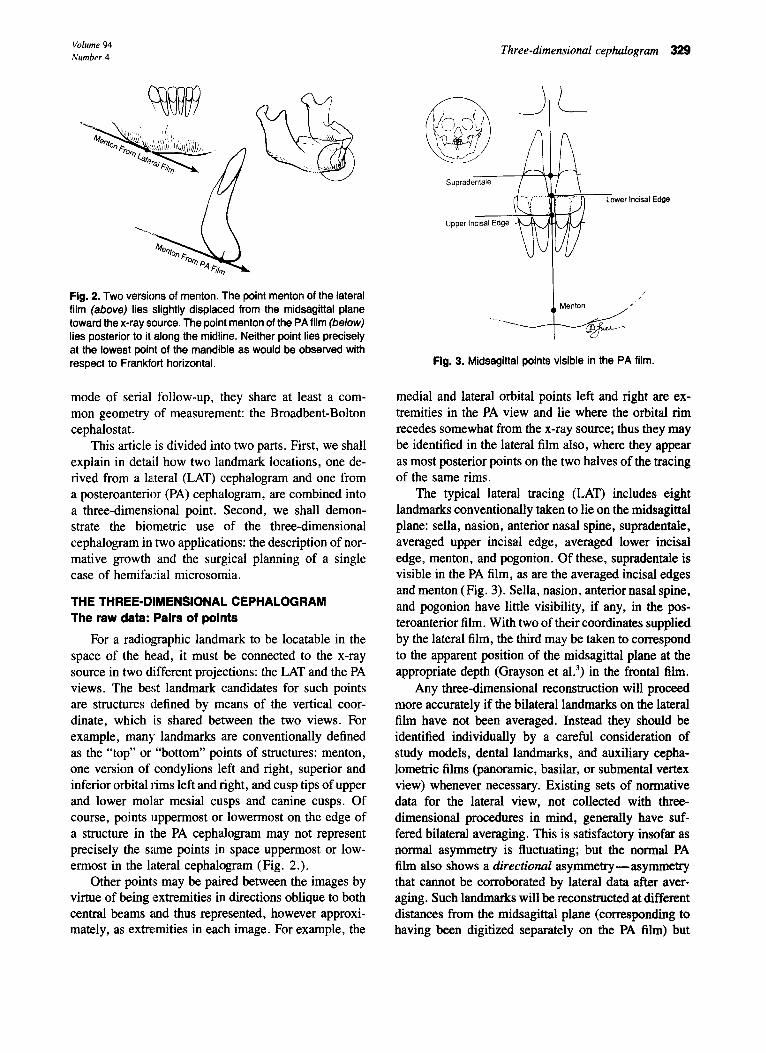
Fig. 2. Two versions of menton. The point menton of the lateral film (above) lies slightly displaced from the midsagittal plane toward the x-ray source. The point menton of the PA film (below) lies posterior to it along the midline. Neither point lies precisely at the lowest point of the mandible as would be observed with respect to Frankfort horizontal.
mode of serial follow-up, they share at least a com- mon geometry of measurement: the Broadbent-Bolton cephalostat.
This article is divided into two parts. First, we shall explain in detail how two landmark locations, one de- rived from a laiteral (LAT) cephalogram and one from a posteroanterior (PA) cephalogram, are combined into a three-dimensional point. Second, we shall demon- strate the biometric use of the three-dimensional cephalogram in two applications: the description of nor- mative growth and the surgical planning of a single case of hemifacial microsomia.
THE THREE-DIMENSIONAL CEPHALOGRAM The raw data: Pairs of points
For a radiographic landmark to be locatable in the space of the head, it must be connected to the x-ray source in two different projections: the LAT and the PA views. The best landmark candidates for such points are structures defined by means of the vertical coor- dinate, which is shared between the two views. For example, many landmarks are conventionally defined as the “top” or “bottom” points of structures: menton, one version of condylions left and right, superior and inferior orbital rims left and right, and cusp tips of upper and lower molar mesial cusps and canine cusps. Of course, points uppermost or lowermost on the edge of a structure in the PA cephalogram may not represent precisely the same points in space uppermost or low- ermost in the lateral cephalogram (Fig. 2.).
Other points may be paired between the images by virtue of being extremities in directions oblique to both central beams and thus represented, however approxi- mately, as extremities in each image. For example, the
LOW!1 k&al Edge
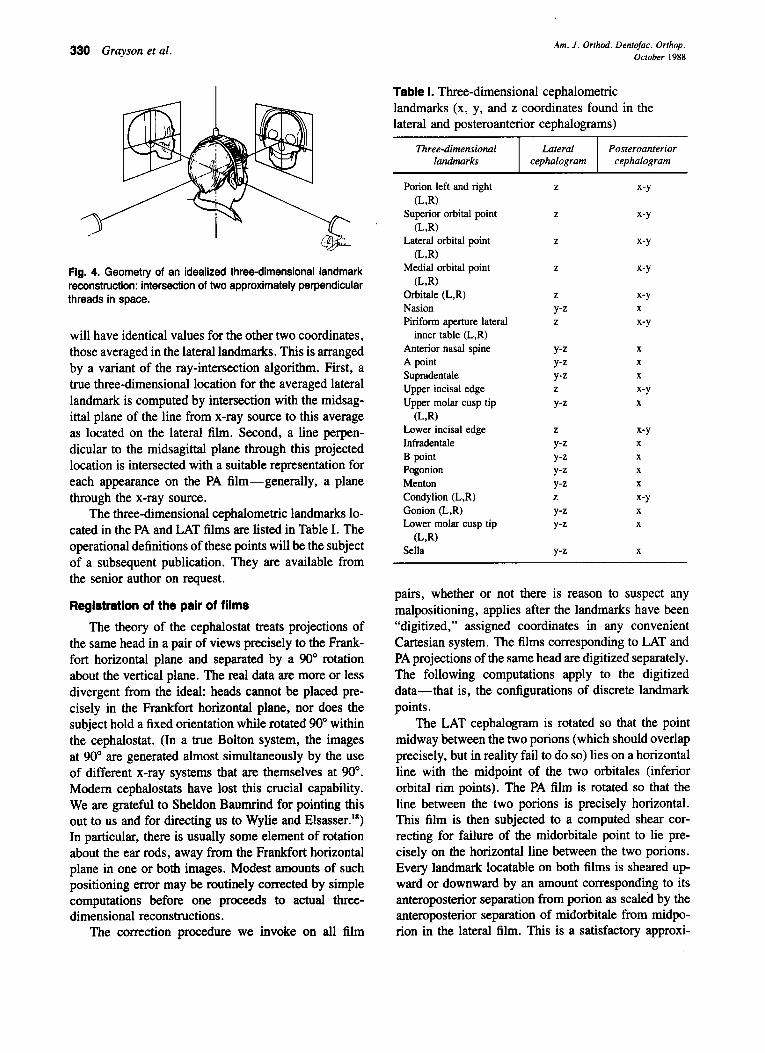
Fig. 3. Midsagittal points visible in the PA film.
medial and lateral orbital points left and right are ex- tremities in the PA view and lie where the orbital rim recedes somewhat from the x-ray source; thus they may be identified in the lateral film also, where they appear as most posterior points on the two halves of the tracing of the same rims.
The typical lateral tracing (LAT) includes eight landmarks conventionally taken to lie on the midsagittal plane: sella, nasion, anterior nasal spine, supradentale, averaged upper incisal edge, averaged lower incisal edge, menton, and pogonion. Of these, supradentale is visible in the PA film, as are the averaged incisal edges and menton (Fig. 3). Sella, nasion, anterior nasal spine, and pogonion have little visibility, if any, in the pos- teroanterior film. With two of their coordinates supplied by the lateral film, the third may be taken to correspond to the apparent position of the midsagittal plane at the appropriate depth (Grayson et aL3) in the frontal film.
Any three-dimensional reconstruction will proceed more accurately if the bilateral landmarks on the lateral film have not been averaged. Instead they should be identified individually by a careful consideration of study models, dental landmarks, and auxiliary cepha- lometric films (panoramic, basilar, or submental vertex view) whenever necessary. Existing sets of normative data for the lateral view, not collected with three- dimensional procedures in mind, generally have suf- fered bilateral averaging. This is satisfactory insofar as normal asymmetry is fluctuating; but the normal PA film also shows a directional asymmetry-asymmetry that cannot be corroborated by lateral data after aver- aging. Such landmarks will be reconstructed at different distances from the midsagittal plane (corresponding to having been digitized separately on the PA film) but
330 Grayson et al. Am. J. Orthod. Dentofac. Orthop. October 1988
Fig. 4. Geometry of an idealized three-dimensional landmark reconstruction: intersection of two approximately perpendicular threads in space.
will have identical values for the other two coordinates, those averaged in the lateral landmarks. This is arranged by a variant of the ray-intersection algorithm. First, a true three-dimensional location for the averaged lateral landmark is computed by intersection with the midsag- ittal plane of the line from x-ray source to this average as located on the lateral film. Second, a line perpen- dicular to the midsagittal plane through this projected location is intersected with a suitable representation for each appearance on the PA film-generally, a plane through the x-ray source.
The three-dimensional cephalometric landmarks lo- cated in the PA and LAT films are listed in Table I. The operational definitions of these points will be the subject of a subsequent publication. They are available from the senior author on request.
Registration of the pair of films
The theory of the cephalostat treats projections of the same head in a pair of views precisely to the Frank- fort horizontal plane and separated by a 90” rotation about the vertical plane. The real data are more or less divergent from the ideal: heads cannot be placed pre- cisely in the Frankfort horizontal plane, nor does the subject hold a fixed orientation while rotated 90” within the cephalostat. (In a true Bolton system, the images at 90” are generated almost simultaneously by the use of different x-ray systems that are themselves at 90”. Modem cephalostats have lost this crucial capability. We are grateful to Sheldon Baumrind for pointing this out to us and for directing us to Wylie and Elsasser.‘*) In particular, there is usually some element of rotation about the ear rods, away from the Frankfort horizontal plane in one or both images. Modest amounts of such positioning error may be routinely corrected by simple computations before one proceeds to actual three- dimensional reconstructions.
The correction procedure we invoke on all film
Table I. Three-dimensional cephalometric landmarks (x, y, and z coordinates found in the lateral and posteroanterior cephalograms)
Three-dimensional Lateral landmarks cephalogram
Posteroanterior cephalogram
Porion left and right WV
Superior orbital point U-3)
Lateral orbital point 0-J)
Medial orbital point 0-J)
Orbitale (L,R) Nasion Piriform aperture lateral
inner table (L,R) Anterior nasal spine
z X-Y
z X-Y
z X-Y
z X-Y
2 X-Y Y-2 X
2 X-Y
Y-2 X
A point Supradentale Upper incisal edge Upper molar cusp tip
U-J9 Lower incisal edge Infradentale B point Pogonion Menton Condylion (L,R) Gonion (L,R) Lower molar cusp tip
(LR) Sella
Y-Z Y-Z 2
Y-Z
2
Y-Z Y-Z Y-Z Y-Z Z
Y-Z Y-Z
Y-Z
X
X
X-Y X
X-Y X
X
X
X
X-Y X
X
X
pairs, whether or not there is reason to suspect any malpositioning, applies after the landmarks have been “digitized,” assigned coordinates in any convenient Cartesian system. The films corresponding to LAT and PA projections of the same head are digitized separately. The following computations apply to the digitized data-that is, the configurations of discrete landmark points.
The LAT cephalogram is rotated so that the point midway between the two porions (which should overlap precisely, but in reality fail to do so) lies on a horizontal line with the midpoint of the two orbitales (inferior orbital rim points). The PA film is rotated so that the line between the two pox-ions is precisely horizontal. This film is then subjected to a computed shear cor- recting for failure of the midorbitale point to lie pre- cisely on the horizontal line between the two porions. Every landmark locatable on both films is sheared up- ward or downward by an amount corresponding to its anteroposterior separation from porion as scaled by the anteroposterior separation of midorbitale from midpo- rion in the lateral film. This is a satisfactory approxi-
Volume 94 Number 4
Three-dimensional cephalogram 331
10 b I \En
Fig. 5. A set of reconstructed, three-dimensional landmarks is represented by a wire frame, the various structures rotating in a computer-graphic display. These are seven still frames from such a moving display. This patient is discussed further in con- nection with Figs. 14 and 15.
mation to the correct procedure, a three-dimensional rotation, for all angles of rotation small enough to be encountered in practice. Such a correction could not be applied to reconstruct the original PA cephalogram as it would have been seen in the absence of position- ing error; it applies only to reconstruction of the con-
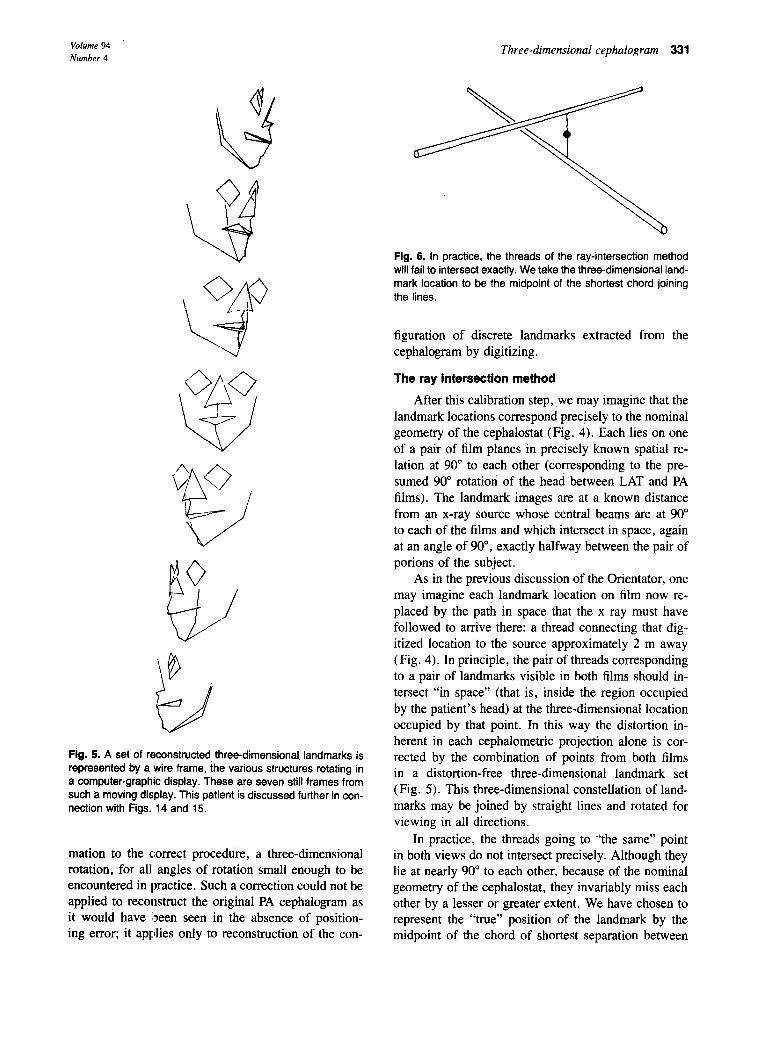
Fig. 6. In practice, the threads of the ray-intersection method will fail to intersect exactly. We take the three-dimensional land- mark location to be the midpoint of the shortest chord joining the lines.
figuration of discrete landmarks extracted from the cephalogram by digitizing.
The ray intersection method
After this calibration step, we may imagine that the landmark locations correspond precisely to the nominal geometry of the cephalostat (Fig. 4). Each lies on one of a pair of film planes in precisely known spatial re- lation at 90” to each other (corresponding to the pre- sumed 90” rotation of the head between LAT and PA films). The landmark images are at a known distance from an x-ray source whose central beams are at 90” to each of the films and which intersect in space, again at an angle of 90”, exactly halfway between the pair of porions of the subject.
As in the previous discussion of the Orientator, one may imagine each landmark location on film now re- placed by the path in space that the x ray must have followed to arrive there: a thread connecting that dig- itized location to the source approximately 2 m away (Fig. 4). In principle, the pair of threads corresponding to a pair of landmarks visible in both films should in- tersect “in space” (that is, inside the region occupied by the patient’s head) at the three-dimensional location occupied by that point. In this way the distortion in- herent in each cephalometric projection alone is cor- rected by the combination of points from both films in a distortion-free three-dimensional landmark set (Fig. 5). This three-dimensional constellation of land- marks may be joined by straight lines and rotated for viewing in all directions.
In practice, the threads going to “the same” point in both views do not intersect precisely. Although they lie at nearly 90” to each other, because of the nominal geometry of the cephalostat, they invariably miss each other by a lesser or greater extent. We have chosen to represent the “true” position of the landmark by the midpoint of the chord of shortest separation between
332 Grayson et al. Am. J. Orthod. Dentofac. Orthop. October 1988
the two threads in space (Fig. 6). For threads so nearly perpendicular to each other as these, this midpoint is approximately the same as the point arrived at by (1) accepting the mediolateral (X) coordinate from the PA film after correction for beam spreading with infor- mation from the lateral film, (2) accepting the antero- posterior (Z) coordinate from the lateral film after cor- rection for beam spreading with information from the PA film, and (3) averaging the two vertical coordinates (Y), one from each film, each after correction for beam spreading.
This type of three-dimensional reconstruction is sus- ceptible to several inherent errors and limitations. One fundamental difficulty,is associated with the assumption that “corresponding” landmarks in LAT and PA films actually pertain to the same three-dimensional point on the skull. For the landmarks that are defined as “bot- toms” of structures (for example, orbitale), it is clear that this correspondence is guaranteed only for points lying precisely in the plane formed by the pair of central beams, the Frankfort horizontal plane. At other sites, the quality of the “three-dimensional correspondence” between points traced from the LAT and PA projections depends on the relationship of the central beam to the curved surface on which we search for a landmark. For instance, when a coordinate system is assigned in a two-dimensional film, menton can be defined unam- biguously as a single point; but on a dry skull, one can see that the PA film’s “menton” is slightly posterior to the lateral “menton,” resulting purely from considera- tions of beam geometry, and that neither point is pre- cisely at the bottom of the mandible (Fig. 2).
For landmarks other than “tops” and “bottoms,” beam geometry generates discrepancy by a different mechanism: it determines which outlines of curving surfaces we see when looking at a three-dimensional object. The mesial-incisal edge of the maxillary central incisor, for example, is curved sharply in all directions. Thus the spatial location of this landmark seen in the lateral film is not far from the spatial location of the point seen in the PA film. But when landmarks are taken from surfaces that are broadly curved in one or both directions, such as the gonial region, then the bony points seen in the LAT and PA films are distinctly dif- ferent, and the pair of reconstructed lines in space can fail to intersect by a considerable amount. (For gonion the problem is made worse by the fact that there is no such point on the solid skull-that is, we are combining a pair of artifacts, one from each of a pair of projections. There is no point of “sharpest curvature” on the solid skull in this region of the mandibular border.)
Whenever points on the solid skull corresponding
to landmarks found in the LAT and PA film lie in sys- tematically different locations, the reconstructed three- dimensional point will not actually lie on the skeleton, but instead will be close to it in a consistent fashion. This phenomenon is analogous to the use of the gonial intersect landmark, intersection of two double tangents to the mandibular border in two-dimensional cephalo- metrics. Although the three-dimensional gonion iies consistently lateral to the bony skull, this does not pre- clude its use in an analytic manner.
As mentioned previously, certain landmarks-for example, anterior nasal spine-are not in fact visible in both films; rather, the position in one film is imputed with information from the other. This is equivalent to assigning two coordinates (Y and Z) of the point from one of the films (in this case the lateral) and obtaining the third (X) from the PA film. Such a computation is a generalization of the ray-intersection method. When the geometry of the cephalostat is taken into account, this computation is equivalent to the intersection of a plane in space (corresponding to the X coordinate of ANS observed in the PA film) with a line (the thread through the LAT film at the Y-Z location of ANS).
Some inherent flaws and errors of this scheme in- clude tracing and digitizing errors, failure of the potions to superimpose in the lateral film, and the finite size of the x-ray source.
Norms
In the clinical examples to be presented in this ar- title, reference is made to two different sourcesof nor- mative data: the Bolton standards’ and the University of Michigan School Study.” Both are deficient in the lateral vieti.in that they present only averages of the two sides, tracings or landmark locations, rather than true paired landmarks or curves ,as they embody dif- ferent degrees of beam spreading. Consequently the reported ray-intersection algorithm has been modified so that bilateral points from the lateral view are rep- resented by threads through a midsagittal location and perpendicular to the film plane, rather than joining the actually digitized film point (which we ,do not have) to the actual x-ray source in the nominal cephlostat ge- ometry.
The two normative data bases suit different pur- poses. The Rolton norms are tracings from which one can extract subsets of landmarks ad lib. The Michigan norms comprise landmark locations only, in a list not necessarily suited to our current needs. The lateral data set incorporates all 59 of the landmarks biometrically summarized by Riolo and associates.” The data base of digitized tracings underlying these coordinate data
Volume 94 Number 4
Three-dimensional cephalogram 333
:!.48% per yr.
COA
1.53x per yr.
-d7
COL
C MEN
COR b
3.28% per yr.
GOR MEN
2.10%
R per yr.
3.02% per yr.
WR
d7
WL 1.95% per yr.
MEN D
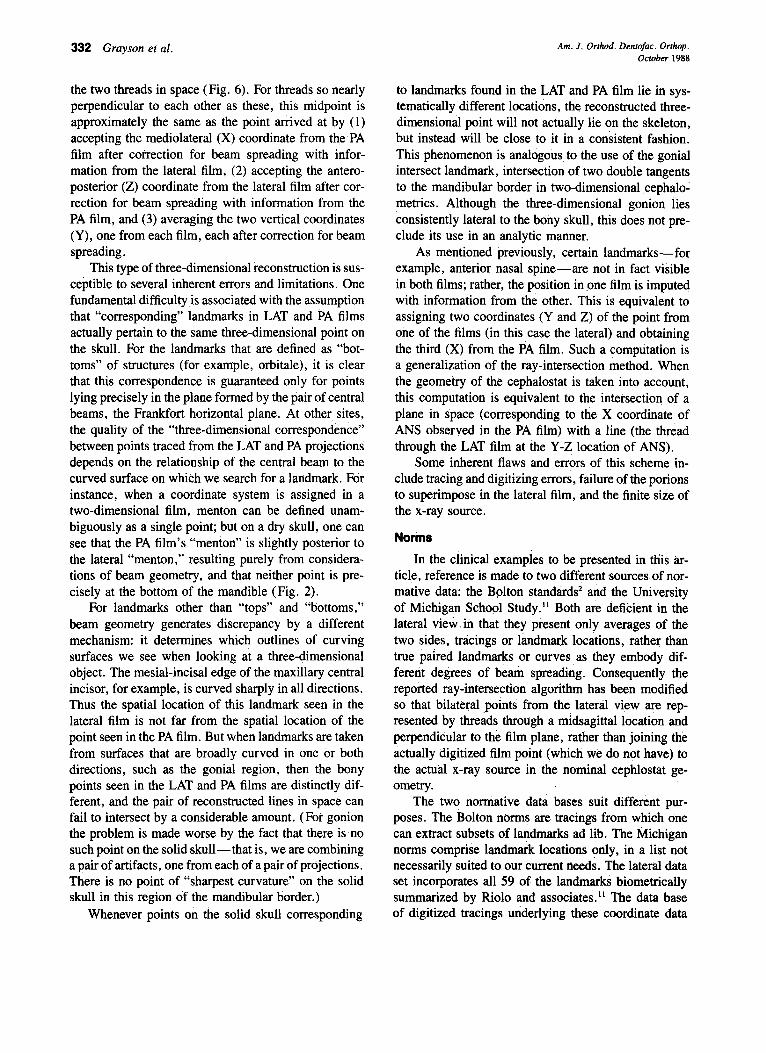
Fig. 7. Mean growth represented by the changes in four tri- angles relating five points (gonions left and right, condylions left and right, menton) for 12 boys observed at ages 8 and 12. GOR = Right gonion, GOL = left gonion, COR = right con- dylion, COL = ILeft condylion, MEN = menton. All triangles have been rotattad to lie flat in the plane of this diagram before averaging. The interpretation of these findings is the subject of the next five illustrations.
now stands at some 1200, representing nearly 200 chil- dren followed more-or-less annually during the late 1950s and early 1960s. The corresponding analysis of posteroanterior films for these children was begun in 1984. At present the PA archive includes approximately 850 films for 114 of the subjects with the longest serial records. We digitized 68 landmarks of which 12 of the more common:ly visible are shared with the lateral data set: menton, nasion, averaged lower and upper incisal edges, and left and right condylion, gonion, orbitale, and porion. The count of film-pairs that can be put into true registration is reduced from the full sample to 403, occurring principally to the absence of porion in many of the lateral films.
The Bolton tracings are of course “ideals” only. The Michigan data base, while permitting biometric analysis, corresponds to the children of the primarily upper-middle-class professoriat of the University of Michigan circa 1960, children who were sent to the University’s laboratory school rather than into the pub- lic system.
CLINICAL EXAMPLES
The three-dimensional data set can serve the cli- nician and investigator in various ways: description of normal and abnormal anatomies, documentation of nor- mal and abnormal patterns of growth, study of growth after surgical intervention, description of relapse after surgery, and presurgical simulation and planning. The cephalometric analysis of these data permits study of
2.43% COR Per Yr.
1.53%
d7
COL per yr.
MEN
3-D View
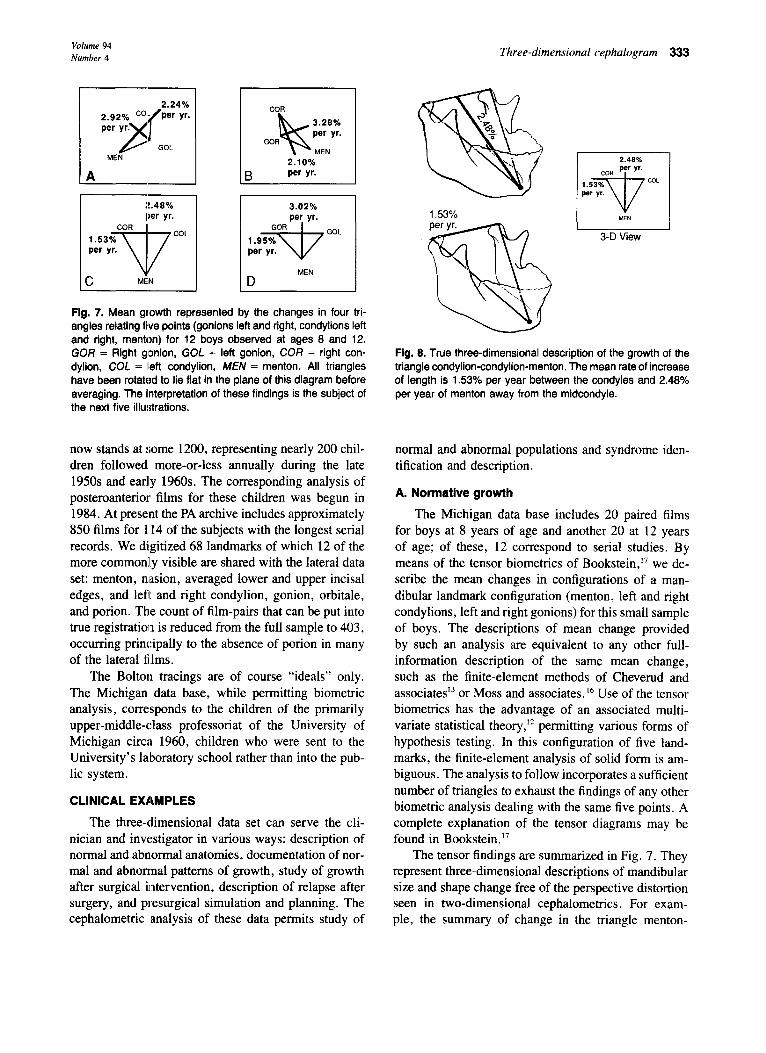
Fig. 8. True three-dimensional description of the growth of the triangle condylion-condylion-menton. The mean rate of increase of length is 1.53% per year between the condyles and 2.48% per year of menton away from the midcondyle.
normal and abnormal populations and syndrome iden- tification and description.
A. Normative growth
The Michigan data base includes 20 paired films for boys at 8 years of age and another 20 at 12 years of age; of these, 12 correspond to serial studies. By means of the tensor biometrics of Bookstein,” we de- scribe the mean changes in configurations of a man- dibular landmark configuration (menton, left and right condylions, left and right gonions) for this small sample of boys. The descriptions of mean change provided by such an analysis are equivalent to any other full- information description of the same mean change, such as the finite-element methods of Cheverud and associatesI or Moss and associates. I6 Use of the tensor biometrics has the advantage of an associated multi- variate statistical theory,” permitting various forms of hypothesis testing. In this configuration of five land- marks, the finite-element analysis of solid form is am- biguous. The analysis to follow incorporates a sufficient number of triangles to exhaust the findings of any other biometric analysis dealing with the same five points. A complete explanation of the tensor diagrams may be found in Bookstein.”
The tensor findings are summarized in Fig. 7. They represent three-dimensional descriptions of mandibular size and shape change free of the perspective distortion seen in two-dimensional cephalometrics. For exam- ple, the summary of change in the triangle menton-
334 Grayson et al. Am. J. Orthod. Dentofac. Orthop. October 1988
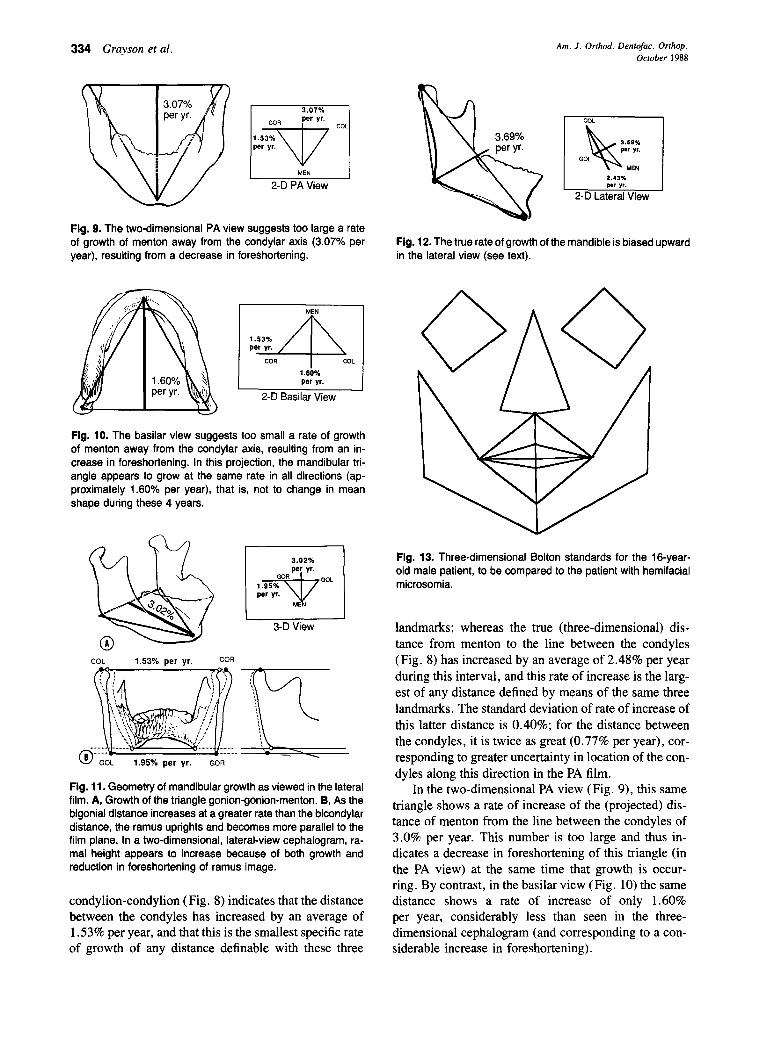
Fig. 9. The two-dimensional PA view suggests too large a rate of growth of menton away from the condylar axis (3.07% per year), resulting from a decrease in foreshortening.
1.60% per yr.
2-D Basilar View
Fig. 10. The basilar view suggests too small a rate of growth of menton away from the condylar axis, resulting from an in- crease in foreshortening. In this projection, the mandibular tri- angle appears to grow at the same rate in all directions (ap- proximately 1.60% per year), that is, not to change in mean shape during these 4 years.
3.02%
Flg. 11. Geometry of mandibular growth as viewed in the lateral film. A, Growth of the triangle gonion-gonion-menton. 6, As the bigonial distance increases at a greater rate than the bicondylar distance, the ramus uprights and becomes more parallel to the film plane. In a two-dimensional, lateral-view cephalogram, ra- mal height appears to increase because of both growth and reduction in foreshortening of ramus image.
condylion-condylion ( Fig. 8) indicates that the distance between the condyles has increased by an average of 1.53% per year, and that this is the smallest specific rate of growth of any distance definable with these three
Fig. 12. The true rate of growth of the mandible is biased upward in the lateral view (see text).
Flg. 13. Three-dimensional Bolton standards for the 16-year- old male patient, to be compared to the patient with hemifacial microsomia.
landmarks: whereas the true (three-dimensional) dis- tance from menton to the line between the condyles (Fig. 8) has increased by an average of 2.48% per year during this interval, and this rate of increase is the larg- est of any distance defined by means of the same three landmarks. The standard deviation of rate of increase of this latter distance is 0.40%; for the distance between the condyles, it is twice as great (0.77% per year), cor- responding to greater uncertainty in location of the con- dyles along this direction in the PA film.
In the two-dimensional PA view (Fig. 9), this same triangle shows a rate of increase of the (projected) dis- tance of menton from the line between the condyles of 3.0% per year. This number is too large and thus in- dicates a decrease in foreshortening of this triangle (in the PA view) at the same time that growth is occur- ring. By contrast, in the basilar view (Fig. 10) the same distance shows a rate of increase of only 1.60% per year, considerably less than seen in the three- dimensional cephalogram (and corresponding to a con- siderable increase in foreshortening).
Volume 94 Number 4
Three-dimensional cephalogram 335
Fig. 14. View of the patient and wire-frame drawing of his starting form (also seen in Fig. 5).
Turning now to the triangle menton-gonion-gonion (Fig. 11, A), we see that the distance between the gonions grow:s most slowly (about 1.95% per year), while the distance of menton from the bigonial line grows at more than 3% per year. The rate of change is exaggerated in the PA view by a decrease of foreshor- tening as the menton grows downward. The change in projected dista.nce appears to be at a rate of more than 4.5% per year in the PA; a basilar view, in which foreshortening is increasing, indicates a rate of growth of about 2.8% per year, which is less than the true rate.
As the bigonial distance is growing relatively faster than the bicondylar distance, the observed changes of distance in the lateral view of the mandible are likewise altered by foreshortening (Fig. 11, B). The rate of in- crease of mandibular “width,” as measured along the bisector of the gonial angle, is nearly the largest of any distance involving menton, gonion, and condylion (Fig. 12). The ‘tensor analysis of the lateral cephalogram overstates both. this rate and the rate of growth in the perpendicular direction. During the course of normal growth, the whole lateral view of the mandible “rotates to face the camera.” While the lateral view increases in apparent area by about 5.9% per year, the triangle of landmarks in space increases in area by only about 5.2% per year.
Fig. 15. Mock surgery on three-dimensional cephalogram com- bining computer optimization to match the Bolton 16-year male patient with modifications introduced by the clinician. The image can be viewed and evaluated from any direction.
B. A surgical simulation
The authors have previously published’4,‘5 an ap- plication of these three-dimensional landmark config- urations to the semiautomated planning of craniofacial surgery. For the simulation of the surgical procedure, the landmarks of a data set are divided into skeletal units that are left unseparated by the particular os- teotomies to be performed. For example, a LeFort III
336 Grayson et al. Am. J. Orthod. Dentofac. Orthop. October 1988
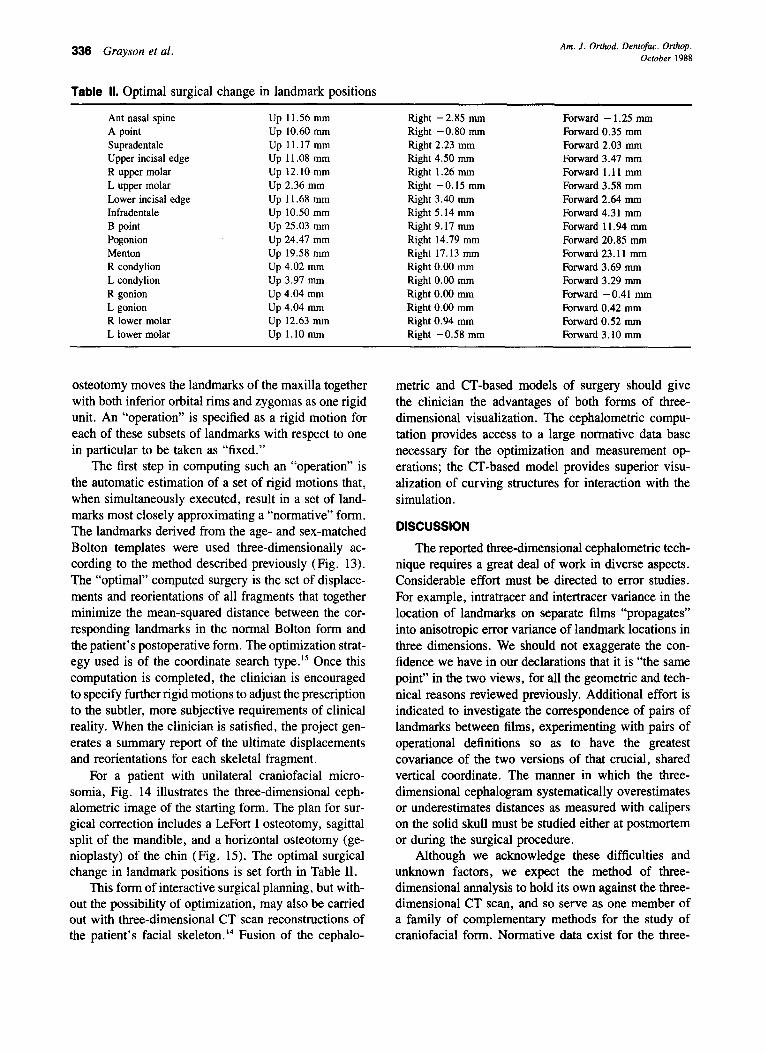
Table II. Optimal surgical change in landmark positions
Ant nasal spine A point Supradentale Upper incisal edge R upper molar L upper molar Lower incisal edge Infradentale B point Pogonion Menton R condylion L condylion R gonion L gonion R lower molar L lower molar
Up 11.56 mm Up 10.60 mm Up 11.17 mm Up 11.08 mm up 12.10 mm Up 2.36 mm Up 11.68 mm Up 10.50 mm Up 25.03 mm Up 24.47 mm Up 19.58 mm Up 4.02 mm Up 3.97 mm Up 4.04 mm Up 4.04 mm Up 12.63 mm Up 1.10 mm
Right -2.85 mm Right -0.80 mm Right 2.23 mm Right 4.50 mm Right 1.26 mm Right -0.15 mm Right 3.40 mm Right 5.14 mm Right 9.17 mm Right 14.79 mm Right 17.13 mm Right 0.00 mm Right 0.00 mm Right 0.00 mm Right 0.00 mm Right 0.94 mm Right -0.58 mm
Forward - 1.25 mm Forward 0.35 mm Forward 2.03 mm Forward 3.47 mm Forward 1.11 mm Forward 3.58 mm Forward 2.64 mm Forward 4.31 mm Forward 11.94 mm Forward 20.85 mm Forward 23.11 mm Forward 3.69 mm Forward 3.29 mm Forward -0.41 mm Forward 0.42 mm Fbrward 0.52 mm Forward 3.10 mm
osteotomy moves the landmarks of the maxilla together with both inferior orbital rims and zygomas as one rigid unit. An “operation” is specified as a rigid motion for each of these subsets of landmarks with respect to one in particular to be taken as “fixed.”
The first step in computing such an “operation” is the automatic estimation of a set of rigid motions that, when simultaneously executed, result in a set of land- marks most closely approximating a “normative” form. The landmarks derived from the age- and sex-matched Bolton templates were used three-dimensionally ac- cording to the method described previously (Fig. 13). The “optimal” computed surgery is the set of displace- ments and reorientations of all fragments that together minimize the mean-squared distance between the cor- responding landmarks in the normal Bolton form and the patient’s postoperative form. The optimization strat- egy used is of the coordinate search type.ls Once this computation is completed, the clinician is encouraged to specify further rigid motions to adjust the prescription to the subtler, more subjective requirements of clinical reality. When the clinician is satisfied, the project gen- erates a summary report of the ultimate displacements and reorientations for each skeletal fragment.
For a patient with unilateral craniofacial micro- somia, Fig. 14 illustrates the three-dimensional ceph- alometric image of the starting form. The plan for sur- gical correction includes a LeFort I osteotomy, sagittal split of the mandible, and a horizontal osteotomy (ge- nioplasty) of the chin (Fig. 15). The optimal surgical change in landmark positions is set forth in Table II.
This form of interactive surgical planning, but with- out the possibility of optimization, may also be carried out with three-dimensional CT scan reconstructions of the patient’s facial skeleton.14 Fusion of the cephalo-
metric and CT-based models of surgery should give the clinician the advantages of both forms of three- dimensional visualization. The cephalometric compu- tation provides access to a large normative data base necessary for the optimization and measurement op- erations; the CT-based model provides superior visu- alization of curving structures for interaction with the simulation.
DISCUSSION
The reported three-dimensional cephalometric tech- nique requires a great deal of work in diverse aspects. Considerable effort must be directed to error studies. For example, intratracer and intertracer variance in the location of landmarks on separate films “propagates” into anisotropic error variance of landmark locations in three dimensions. We should not exaggerate the con- fidence we have in our declarations that it is “the same point” in the two views, for all the geometric and tech- nical reasons reviewed previously. Additional effort is indicated to investigate the correspondence of pairs of landmarks between films, experimenting with pairs of operational definitions so as to have the greatest covariance of the two versions of that crucial, shared vertical coordinate. The manner in which the three- dimensional cephalogram systematically overestimates or underestimates distances as measured with calipers on the solid skull must be studied either at postmortem or during the surgical procedure.
Although we acknowledge these difficulties and unknown factors, we expect the method of three- dimensional annalysis to hold its own against the three- dimensional CT scan, and so serve as one member of a family of complementary methods for the study of craniofacial form. Normative data exist for the three-
Volume 94 Number 4
dimensional cephalogram, whereas such data are un- likely ever to exist for the more extensive visualizations of the CT scan. A pair of cephalograms involves ap- proximately 26 mrad skin dose to the subject; by com- parison, a closely spaced series of CT slices totals about 6.5 rad. Hence it is much more practical to anticipate a three-dimensional cephalogram to be repeated, as for longitudinal studies of growth and relapse after surgical treatment. Moreover, the cost of a pair of cephalograms is a negligible: fraction of the cost of a CT scan. The young patient does not need to be sedated in the course of this procedure.
Archives of cephalogram pairs have been collected over decades of orthodontic treatment and research. With these data one could proceed immediately with three-dimensional study of large populations of treated cases. As we noted in our first example, changes in the geometry of the face may not be well detected in pro- jected images:, three-dimensionalization improves the precision of ce:phalometric analysis in the study of cra- niofacial treatment. In the same example, we demon- strated that morphometric methods already exist for the analysis of three-dimensional landmark data, whereas they are emerg,ing very slowly for analyses of the com- parable CT data.
Mock surgery, originally introduced as a two- dimensional te,chnique, gains in accuracy when it has access to the three-dimensional record; its tie is likewise enhanced to the corresponding computation carried out with data from the CT scan. Because of the existence of normative data, a first step in surgical planning with the three-dimensional cephalogram can be com- puted automatically. The three-dimensional cephalo- gram serves as the link between the CT scan and the norms for this computation.
In all these applications, three-dimensional cepha- lometric data may be recorded and manipulated by the use of equipment no more sophisticated than the now- ubiquitous personal computer. The only requirements are simple algebra and simple graphics.
For all these reasons, our preliminary studies en- courage us to expand and explore this system for study- ing pairs of cephalograms in three dimensions.
We are gratl:ful to Robert E. Moyers for access to un- published data from the University of Michigan University School Study, maintained by NIH Grant DE-03610.
REFERENCES 1. Broadbent BH. A new x-ray technique and its application to
orthodontia. Angle Orthod 1931;1:45. 2. Broadbent BH, Broadbent BH, Golden W. Bolton standards of
3.
4.
5.
6.
I.
8.
9.
10.
11.
12.
13.
14.
15.
16.
17.
18.
Three-dimensional cephalogram 337
dentofacial developmental growth. St. Louis: The CV Mosby Company, 1975. Grayson BH, McCarthy JG, Bookstein F. Analysis of cranio- facial asymmetry by multiplane cephalometry. AM J ORTHOD 1983;84:217. Grayson BH, Boral S, Eisig S, Kolber A, McCarthy JG. Uni- lateral craniofacial microsomia: I. Mandibular analysis. AM J ORTHOD 1983;84:225. Baumrind S, Moffit F, Curry S. Three-dimension x-ray stereo- metry from paired coplanar images. A progress report. AM J ORTHOD 1983;84:313. Baumrind S, Moffit F, Curry S. The geometry of three- dimensional measurement from paired coplanar x-ray images. AM J ORTHOD 1983;84:313. Grayson BH, LaBatto F, McCarthy JG. The basilar multiplane cephalometric analysis. Part I. Landmark identification and trac- ing methodology. Part II. Method of analysis and its application to the study of craniofacial anomalies. AM J ORTHOD 1985; 88:503. Rune B, Sarnas KV, Selvik G, Jacobsson S. Roentgen stereo- metry with the aid of metallic implants in hemifacial microsomia. AM J ORTHOD 1983;84:231. Berkowitz S, Cuzzi J. Biosterometric analysis of surgically cor- rected abnormal aces. AM J ORTHOD 1977;72:526. Savara BS, Miller SH, Demuth RJ, Kawamoto HK. Bioster- eometrics and computer graphics for patients with craniofacial malformations: diagnosis and treatment planning. Plast Reconstr Surg 1985;75:495. Riolo ML, Moyers RE, McNamara JS, Hunter WS. An atlas of craniofacial growth. Monograph 2., Craniofacial Growth Series. Ann Arbor: 1974. Center for Human Growth and Development, University of Michigan. Bookstein FL. Size and shape spaces for landmark data in two dimensions. Stat Sci 1986;l: 182. Cheverud JM, Lewis J, Bachrach W, Lew W. The measurement of form and variation in form: an application of three- dimensional quantitative morphology by finite-element methods. Am J Phys Anthrop. 1983;63: 15 1. Cutting CB, Bookstein FL, Grayson BH, Fellingham L, McCarthy JG. Three-dimensional computer-assisted design of craniofacial surgical procedures: optimization and interaction with cephalometric and CT-based models. Plast Reconstr Surg 1986;87:877. Cutting CB, Grayson BH, Bookstein FL, McCarthy JG. Three- dimensional computer aided planning and evaluation of facial and orthognathic surgery. Clin Plast Surg 1986;13:3. Moss ML, Skalak R, Pate1 H, Sen K, Moss-Salentijn L, Shi- nozuka M, Vilmann H. Finite element method modeling of cra- niofacial growth. AM J ORTHOD 1985;87:453. Bookstein FL. On the cephalometrics of skeletal change. AM J ORTHOD 1982;82:177. Wylie WL, Elsasser WA. Undistorted vertical projections of the head from lateral and posteroanterior roentgenograms. Am J Roentgen Radium Ther. 1948;60:414.
Reprint requests to: Dr. Barry Grayson Institute of Reconstructive Plastic Surgery NYU Medical Center 550 First Ave. New York, NY 10016
![Global sensitivity analysis using sparse high dimensional ... · of high dimensional systems [19]. Recently this technique has become popular and widely used by practitioners (e.g](https://img.pdfslide.net/doc/110x75/604fdddd0341767ef067fe66/global-sensitivity-analysis-using-sparse-high-dimensional-of-high-dimensional.jpg)