Embed Size (px)
Citation preview
THE THREE-FACTOR EATING QUESTIONNAIRE-R18 IS ABLE TO DETERMINE
DIFFERENT EATING BEHAVIORS AND FOOD PATTERNS IN CONGREGATE MEAL
PARTICIPANTS
by
JESSICA DENAE FURMAN
(Under the Direction of Mary Ann Johnson)
ABSTRACT
The purpose of this study was to analyze the construct validity of the Three-Factor
Eating Questionnaire – Revised 18-item (TFEQ-R18) in congregate meal participants, and to
assess the eating behaviors elucidated from this questionnaire with food intake. Participants
were older adults (n = 124, mean (SD) age = 75 (8) years, 76% women, 56% White, 44%
Black, and 51% obese (BMI > 30 kg/m2)) receiving congregate meals. The TFEQ-R18
measures cognitive restraint (CR), uncontrolled eating (UE), and emotional eating (EE), and
the 6 food groups assessed with a short food frequency questionnaire were sweets, salty
snacks, fruits, vegetables, whole grains, and milk. The TFEQ-R18 was found to have
acceptable construct validity and reliability in this sample. Robust associations were seen
with UE and vegetables, and with EE and salty snacks. These results suggest that the TFEQ-
R18 is a valid measure of CR, UE, and EE, and may be useful in development of nutrition
interventions in congregate meal participants.
INDEX WORDS: TFEQ-R18; Older adult; Congregate meal participant; Eating
behavior; Cognitive restraint; Uncontrolled eating; Emotional eating;
Three-Factor Eating Questionnaire; OAANP
THE THREE-FACTOR EATING QUESTIONNAIRE-R18 IS ABLE TO DETERMINE
DIFFERENT EATING BEHAVIORS AND FOOD PATTERNS IN CONGREGATE MEAL
PARTICIPANTS
by
JESSICA DENAE FURMAN
BS, University of Florida, 2001
BA, University of Florida, 2001
BS, Georgia Institute of Technology, 2010
A Thesis Submitted to the Graduate Faculty of The University of Georgia in Partial
Fulfillment of the Requirements for the Degree
MASTER OF SCIENCE
ATHENS, GEORGIA
2012
© 2012
Jessica Denae Furman
All Rights Reserved
THE THREE-FACTOR EATING QUESTIONNAIRE-R18 IS ABLE TO DETERMINE
DIFFERENT EATING BEHAVIORS AND FOOD PATTERNS IN CONGREGATE MEAL
PARTICIPANTS
by
JESSICA DENAE FURMAN
Major Professor: Mary Ann Johnson
Committee: Kerstin Gerst
William P. Flatt
Electronic Version Approved:
Maureen Grasso
Dean of the Graduate School
The University of Georgia
May 2012
iv
ACKNOWLEDGEMENTS
First and foremost, I wish to thank my mom and my dad for giving me the courage
and belief needed for graduate school. My mother, the most sincere, compassionate and
amazing woman I know, has encouraged me during every step of my academic endeavors. I
am extremely appreciative of her unending support. My father’s memory guides me with
constant inspiration and motivation to pursue a path that I love, not a path which returns
immediate gratification. I cannot imagine my graduate studies, my life, or this work,
complete without these two people.
My deepest appreciation goes to my advisor, Dr. Mary Ann Johnson, whom has given
me enthusiastic support, dedication, and indispensable insight during my graduate studies. It
has been an absolute honor to work with her, and I am very thankful for the circumstances
that have allowed me to do so. My gratitude extends indefinitely.
Special thanks to Dr. Katie Porter; without her, this thesis would have remained a
dream. To Dr. David Garton, my friend and mentor for many years, special thanks for the
substantial contributions he has made to my growth and progress in the sciences. Thank you.
Finally, I share the credit of my successes with all of my friends, my family, my
classmates, and my professors. Thank you for the constant challenges to be a better student,
a better researcher, and a better person.
v
TABLE OF CONTENTS
Page
ACKNOWLEDGEMENTS ............................................................................................... iv
LIST OF TABLES ............................................................................................................ vii
CHAPTER
1 INTRODUCTION .............................................................................................1
2 LITERATURE REVIEW ..................................................................................4
Older Adults .................................................................................................4
Older Americans Act Nutrition Program .....................................................5
Selected Digestive and Metabolic Changes in Older Adults .......................6
Nutritional Risks in Congregate Meal Participants .....................................7
Obesity in Older Adults ...............................................................................8
Three-Factor Eating Questionnaire – Revised 18-Item Version..................9
Eating Behaviors and Disordered Eating ...................................................12
Comfort Food .............................................................................................16
Eating Behaviors and Other Health Conditions .........................................18
Food Frequency Questionnaires ................................................................19
Psychometrics and Construct Validity .......................................................21
3 THE THREE-FACTOR EATING QUESTIONNAIRE-R18 IS ABLE TO
DETERMINE DIFFERENT EATING BEHAVIORS AND FOOD
PATTERNS IN CONGREGATE MEAL PARTICIPANTS ..........................24
vi
Abstract ......................................................................................................25
Introduction ................................................................................................26
Methods......................................................................................................27
Results ........................................................................................................32
Discussion ..................................................................................................36
4 SUMMARY .....................................................................................................53
REFERENCES ..................................................................................................................58
APPENDICES
A Three-Factor Eating Questionnaire – Revised 18-Item ...................................63
B Short Food Frequency Questionnaire ..............................................................65
vii
LIST OF TABLES
Page
TABLE 3.1: Characteristics of Participants.......................................................................44
TABLE 3.2: Summary of Multitrait/Multi-item Testing of the TFEQ-R18 ......................45
TABLE 3.3: Pearson Correlations of Multitrait/Multi-item Testing of the TFEQ-R18 ....46
TABLE 3.4: Average Intake of Food Category by Dichotomized Eating Behaviors .......47
TABLE 3.5: Spearman Correlation Coefficients of Food Group Intake with Eating
Behavior, By Gender .............................................................................................48
TABLE 3.6: Logistic Regression Models Exploring Associations between Eating
Behavior and Food Group Category .....................................................................49
TABLE 3.7: R-Squared Values from Logistic Regression Models Exploring
Associations between Eating Behavior and Food Group Category ......................51
1
CHAPTER 1
INTRODUCTION
The older adult population (65+) is growing at a rapid rate with rapidly changing needs.
Currently older adults represent 13.1% of the US population, and this number is expected to
rise to at least 19.3% within 20 years (AOA 2011). With age, the prevalence of chronic
health conditions increases, and it has been estimated that among older adults, at least 80%
have at least one chronic disease (Wolff et al 2002). Similar to most states, Georgia has
experienced a surge in the older adult population. The state of Georgia has had the 5th
highest increase (31.4%) in the nation for number of persons 65 and older from 2000 to 2010
(AOA 2011).
To support this older population, the Older Americans Act Nutrition Program (OAANP) was
established to lessen food insecurity and hunger, promote socialization, health, and well-
being, and delay adverse nutrition-related health conditions through health promotion and
prevention services for persons aged 60 and over. To carry out these goals, OAANP
authorizes funding for distribution of congregate (Title III C1) and home-delivered meals
(Title III C2) targeted to individuals with the greatest social and economic needs (AOA
2012). Typically, congregate meal participants receive 5 lunches per week, but depending on
the funding and need in various states and localities, participants might receive fewer meals
or more meals such as breakfast and/or weekend meals. Participants have high levels of
obesity and obesity-related disorders (Penn et al 2009, Brewer et al 2010) and moderate to
2
high levels of nutritional risk (Quigley et al 2008). Nationally it has been found that older
adults (60 years and older) have higher levels of overweight (BMI ≥ 25 to < 30), obesity
(BMI ≥ 30), Class 2 obesity (BMI ≥ 35), and Class 3 obesity (BMI ≥ 40) than the overall
population (Flegal et al 2012). In Georgia this prevalence has been found to be even higher
than the national averages (Penn et al 2009, Porter and Johnson 2011). Thus, it is of great
interest to explore factors that may be associated with obesity in this population.
Eating behaviors, such as cognitive restraint (CR), uncontrolled eating (UE), and emotional
eating (EE), have been suggested as possible factors relating to overweight and obesity
(Anglé et al 2009, Porter and Johnson 2011, Provencher et al 2003). These behaviors have
been well studied among adult and adolescent obese and healthy weight populations, but are
less well studied in older populations (Mangweth-Matzek et al 2006). The Three-Factor
Eating Questionnaire – Revised 18 (TFEQ-R18) is an 18-item instrument used to identify
these eating behaviors. This questionnaire, originally developed in an obese adult population
(Karlsson et al 2000), has shown acceptable reliability and validity in adolescents and adults,
and obese and non-obese samples (Anglé et al 2009, Karlsson et al 2000, de Lauzon et al
2004). The TFEQ-R18 is a common tool in current research measuring eating behaviors, and
the few construct validities that have been conducted have shown good acceptability and
reliability, but little is known about its validity in diverse populations, e.g., older adults and
subgroups of the older adult population such as congregate meal participants.
Due to the increasing older adult population and high prevalence of obesity in Georgia, the
purpose of the current study was to determine the validity and reliability of the TFEQ-R18 in
3
a sample of congregate meal participants, and the relationship of the 3 assessed eating
behaviors with food intake. The study was conducted in 4 senior centers in Northeast
Georgia that have OAANP and provide congregate meals.
Chapter 2 is a review of the literature outlining demographics and health of the older adult
population, history of the TFEQ-R18 and the 3 eating behaviors assessed by this
questionnaire, analysis involved in measuring construct validity, and food frequency
questionnaires.
Chapter 3 is a manuscript to be submitted to the journal of Journal of Nutrition in
Gerontology and Geriatrics. This chapter includes the methods, results, discussion of the
outcomes of the questionnaire’s construct validity analysis and relationships elucidated
between eating behaviors with food intake, and data tables.
Chapter 4 presents a summary of the major findings and conclusions of this study.
4
CHAPTER 2
LITERATURE REVIEW
Older Adults
The percentage of the US population over 65 years of age has grown significantly over the
last century, and this trend is projected to continue. In 2010, older adults numbered 40.4
million, or 13.1% of the total population, and are expected to reach approximately 72.1
million by 2030, representing nearly one-fifth (19.3%) of the US population. Since 1900 the
number of older adults 65 years and older is 13 times higher (from 3.1 million to 40.4
million) and the percentage of the total population has more than tripled (from 4.1% to
13.1%). The oldest group (100+) is 53% larger than it was in 1990. The state of Georgia has
had the 5th
highest increase (31.4%) in the nation for number of persons 65 and older from
2000 to 2010. In the nation, one of every 5 elderly African-Americans (18.0%) was poor in
2009, compared to 6.8% of elderly Whites and 18.0% of elderly Hispanics. In Georgia,
10.7% of elderly persons are below poverty line, only eclipsed by 7 other states (KY, LA,
MS, NM, NY, ND, SD) and the District of Columbia. As reported by older Americans, 87%
listed Social Security as the major source of income in 2008 (AOA 2011).
The increase in older adults has led to a greater prevalence of chronic health conditions in the
total population. The majority of older persons have at least one chronic health condition and
many have multiple conditions. The prevalence of chronic conditions increases with age;
approximately 74% of those aged 65 – 69 have at least one chronic health condition, and
5
88% above the age of 85 also report at least one chronic condition (Wolff et al 2002).
During 2007-2009, the most frequently reported conditions were: 50% diagnosed arthritis,
34% uncontrolled hypertension, 32% cardiovascular disease, 23% any cancer, 19% diabetes,
and 14% sinusitis (AOA 2011). Forty-three percent of all Medicare recipients reported
chronic conditions related to endocrine, nutritional, and metabolic disorders (Wolff et al
2002). Only 40% reported their health status as excellent or good overall health compared to
64% of all aged persons 18 – 64 years. Additionally, 37% of older persons reported a
disability in 2010 (AOA 2011). Disability increases with age, and there is a strong
relationship between reported health status and disability status (Wolff et al 2002).
Older Americans Act Nutrition Program
To support this older population, the Older Americans Act (OAA) was established in 1965 at
the federal and state levels to provide community social services. To assist the most
vulnerable of this population, the Older Americans Act Nutrition Program (OAANP) was
established under Title III of the OAA (AOA 2012). The purpose of OAANP in the
population aged 60 and over is to lessen food insecurity and hunger, promote socialization,
health, and well-being, and delay adverse nutrition-related health conditions through health
promotion and prevention services. To carry out these goals, OAANP distributes funds for
congregate (Title III C1) and home-delivered meals (Title III C2) to be provided for
individuals with the greatest social and economic needs. The targeted population includes
minority and low-income individuals, rural-dwellers, individuals with limited English
language proficiency, and individuals at risk for institutional care. In 2010, the OAANP
6
received approximately $819 million to provide 96.4 million congregate meals and 145.5
million home-delivered meals to over 2.6 million individuals (AOA 2012).
In Georgia, the state is divided into 12 Area Agencies on Aging (AAA). The purpose of
these AAAs, “is to improve the life of seniors and persons with disabilities in the State of
Georgia through education, information sharing, collaboration, and advocacy” (G4A 2012).
The Northeast Georgia AAA provides many aging services, including congregate meals at 13
senior centers in the region, which are supported through the OAANP (G4A 2012).
Selected Digestive and Metabolic Changes in Older Adults
As individuals age, they may eat less and often make different food choices, despite a high
prevalence of overweight and obesity in the elderly (Donini et al 2003, Flegal 2012). In
general, there is a reported decline in food intake and an associated loss in motivation to eat,
indicating that there may be physiological or social contributing factors, or a combination of
both. Conversely, as a function of age older adults have a decreased basal metabolic rate,
which can lead to weight gain in individuals who fail to decrease food intake corresponding
to the age-related decline in energy expenditure. Commonly however, a decrease in body
weight occurs in individuals over the age of 70 years who do not eat enough to meet energy
demands. Anorexia of aging has largely been defined as a physiological effect associated
with aging which manifests itself as a reduction in desire to eat and pleasure in eating. This
reduction in energy intake usually leads to lower consumption of foods and beverages. This
reduced consumption can also be the result of slower gastric emptying, reduced senses of
taste and smell, and physical factors such as ill-fitting dentures or poor dentition.
7
Additionally, older individuals are major users of prescription medications, many of which
can cause malabsorption of nutrients, loss of appetite, and gastrointestinal distress. Some
studies have found that older adults tend to consume less energy-dense foods and fast foods,
but consume more energy-dilute grains, vegetables and fruits (Donini et al 2003,
Drewnowski and Shultz 2001).
Nutritional Risks in Congregate Meal Participants
Nutrition-related risk factors that can influence older adult health include inadequate food
and nutrient intake, poor dentition, chewing and swallowing problems, poverty, food
insecurity, living and eating alone, social isolation, polypharmacy, functional disabilities,
diet-related diseases, and minority status (Quigley et al 2008). Using the Nutrition Screening
Initiative (NSI) Checklist instrument, which identifies the warning signs of nutritional risk,
Quigley et al found that 56% of Oklahoma congregate meal participants were at moderate or
high nutritional risk. Among respondents at moderate or high nutritional risk, the most
common affirmative responses included, “having an illness or condition that affected food
eaten; eating alone; taking 3 or more medications; and inability to shop, cook, and feed
themselves” (Quigley et al 2008). Similarly in another study of community-dwelling
individuals aged 60 years and greater, there were associations of higher mortality with eating
alone, taking 3 or more medications, and difficulty cooking, shopping, and eating (Sahyoun
et al 1997). All of these characteristics are potential target areas of nutrition intervention
programs.
8
Obesity in Older Adults
In the year these data were collected, 2010, the prevalence of obesity in these studies was
51% (50% men and 53% women, Porter and Johnson 2011), while the national average in
older men and women aged 60 years and older was 37% and 42%, respectively nationally
(Flegal et al 2012). It has been found that older adults participating in OAANP’s Georgia
congregate meals have even higher levels of overweight and obesity compared to the national
averages (Penn et al 2009, Porter and Johnson 2011).
The prevalence of BMI-defined obesity in US adults continues to exceed 30% in most age
groups, but is starting to show some signs of leveling off. From 1999 to 2010, obesity
showed no significant increase in women overall, but the increases were statistically
significant for non-Hispanic Black women (59% prevalence for BMI ≥ 30) and Mexican
American women (45% prevalence for BMI ≥ 30). During 2009-2010, the prevalence of
BMI ≥ 30 in non-Hispanic White women was 32%, in non-Hispanic Black women was 59%,
and in Mexican-American women was 45%. During this same period for all men, there was
a linear trend for an increase, but the most recently reported two years (2009-2010) did not
differ significantly from the previous 6 years (Flegal et al 2012).
Obesity has shown strong positive associations with chronic conditions, physical function,
disability and mental health (Penn et al 2009, Porter and Johnson 2011, Villareal et al 2005)
as well as eating behaviors defined as CR, UE, and EE, as assessed by the TFEQ-R18 (Anglé
et al 2009, de Lauzon-Guillian et al 2006, Porter and Johnson 2011). Moreover, and due to
these positive associations and increased risks, obesity is associated with decreased survival
9
and quality of life, and an increased risk of institutionalization and serious medical
complications (Villareal et al 2005). A recent study investigating the impact of obesity on
chronic health conditions in Georgia’s congregate meal participants found that there was a
significant association between reported chronic health conditions and obesity (Penn et al
2009). Robust positive associations of obesity (BMI ≥ 30) were seen with number of health
conditions, hypertension (82% of obese sample), joint pain (81%), arthritis (79%),
hyperlipidemia (62%), and diabetes (45%) (Penn et al 2009).
Three-Factor Eating Questionnaire and Revised 18-Item Version
To identify eating behaviors related to food choices, questionnaires have been developed to
describe these behaviors, such as the Dutch Eating Behavior Questionnaire (DEBQ) (van
Strien et al 1986) and the Three-Factor Eating Questionnaire (TFEQ) (Stunkard and Messick
1985). Some questionnaires are lengthy to administer (46 to 51 items), which may limit their
use in multifactorial epidemiological studies where multiple questionnaires are obligatory.
The original TFEQ was a 51-item tool constructed by Stunkard and Messick in an obese
sample (n = 220) that defined three measures of eating behaviors: (1) cognitive restraint of
eating, (2) disinhibition, and (3) hunger. Using principal component analysis, Karlsson and
colleagues derived the 18-item revised version (TFEQ-R18) (Karlsson et al 2000) from the
original 51-item TFEQ (Stunkard and Messick 1985), increasing relevancy of the tool while
reducing length and respondent burden. The TFEQ-R18 comprises questions related to
assessing cognitive restraint (CR, 6 items), uncontrolled eating (UE, 9 items), and emotional
eating (EE, 3 items) and identifies 3 different eating behavior scales corresponding to CR
(conscious and regular restriction of one’s food intake in an attempt to control body weight
10
and body shape), UE (overconsumption of food due to a variety of stimuli, associated
feelings of being out of control, and subjective feelings of hunger), and EE (tendency to eat
in response to negative emotional feelings or mood such as depression, anxiety or sadness).
Each question is answered on a 4-point Likert scale (e.g., 1 = never, 2 = rarely, 3 =
sometimes, 4 = always); higher values indicate the potential presence of the eating behavior.
The TFEQ-R18 was developed among Swedish obese adults (aged 37-57 years, n = 4,377) in
2000 (Karlsson et al 2000). In 2004, the construct validity of the TFEQ-R18 was analyzed
by de Lauzon and colleagues in a sample of French adults (n = 529) and teenagers and young
adults (n = 358) of weight classifications representative of the general population (de Lauzon
et al 2004). The TFEQ-R18 was found to be a valid and reliable tool applicable to the
general population. In 2009, Anglé and colleagues examined the applicability of the TFEQ-
R18 in a large sample of young Finnish females aged 17 to 20 years (n = 2,997) (Anglé et al
2009). The factor structure of the TFEQ-R18 was verified by principal component analysis
with Varimax rotation; the original factor structure was replicated and the instrument was
found to be structurally valid. Konttinen and colleagues verified the internal reliability
coefficients (Cronbach’s alpha) of 2 scales of the TFEQ-R18, CR and EE, and found these
scales to be satisfactorily reliable in 25-64 year old Finnish men (n = 1,679) and women (n =
2,035); UE was not analyzed, nor were item convergent or item discriminate validity
determined (Konttinen et al 2010a).
In research by de Lauzon et al, one CR item was found discrepant in convergent validity in
the adult and teenage groups (“How frequently do you avoid "stocking up" on tempting
11
foods?” 1 = almost never, 2 = seldom, 3 = usually, 4 = almost always). Discriminate
validity in the adult group had a single item discrepancy in the UE scale (de Lauzon et al
2004). Overall this questionnaire has shown satisfactory reliability and validity when
analyzed in adolescents and adults, obese and non-obese samples. The TFEQ-R18 is a
common tool used in current research and the few construct validity studies that have been
reported have shown good reliability, but little is known about its validity in diverse
populations, e.g., older adults and subpopulations of older adults, such as congregate meal
participants.
In the current data collected during summer 2010 from congregate meal participants at 4
senior centers in the Northeast Georgia AAA region, slight modifications were made to the
TFEQ-R18. As previously reported (Porter and Johnson 2011), for all items “I” was adapted
to “you”, as questions were read to participants, and item 1 was modified from, “When I
smell a sizzling steak or juicy piece of meat, I find it very difficult to keep from eating, even
if I have just finished a meal.” to “When you see any of your favorite foods, do you find it
very difficult to keep from eating, even if you have just finished a meal?” These changes
were implemented to improve measurement in assessing difficulty controlling eating when
attracted by an external stimulus in this population. This single-item change has similarly
been made and validated in a previous study (Anglé et al 2009). Specific components of
identified eating behaviors have been strongly associated with food choices in the general
population, and can be useful in developing tools for nutrition education interventions and
weight management counseling.
12
Eating Behaviors and Disordered Eating
The psychology and sociology of eating behaviors require further investigation given the
increasing prevalence worldwide of obesity and other health conditions. Eating disorders
and disordered eating, while similar in phrasing, are distinctly different. Eating disorders are
classified by the DSM-IV or American Psychological Association (APA) and include
anorexia nervosa, bulimia nervosa, and eating disorders not otherwise specified (EDNOS)
(APA 2008). Eating disorders have shown positive associations with physical health
consequences including death, gastrointestinal problems, endocrine disorders, cardiovascular
and pulmonary conditions, diminished bone mineral density, and mental health problems
(Hudson et al 2007, Mitchell and Crow 2006). Disordered eating, which has not been
officially defined by any authoritative body, does share some concepts that are also assessed
by the TFEQ-R18. The term disordered eating is used to describe an unhealthy relationship
with food, such as binge eating, skipping meals for weight loss, restricting certain types of
food, eating to cope with stress or emotional distress, and frequent and strict dieting (Pereira
and Alvarenga 2007). However, because there are no official definitions of disordered
eating, the TFEQ-R18 cannot be considered a definitive questionnaire to measure the
absence, presence, or extent of disordered eating, nor is it assumed to be a predictive tool of
eating disorders. Disordered eating behaviors may be risk factors for the development of
eating disorders (APA 2008), but research is ongoing (Reba-Harrelson et al 2009).
Prevalence of eating disorders and disordered eating in the population is speculative at least
in part because of the stigma associated with these conditions and potential underreporting
(APA 2008).
13
Eating behaviors that deviate from the norm are most commonly associated with the young
female population; however this singular population focus is inaccurate. Mangweth-Matzek
and colleagues found that in women aged 60-70 years, irrespective of body weight or BMI,
the majority reported dissatisfaction with body weight and body shape, and 4% demonstrated
an eating disorder, closely resembling occurrence in younger populations (Mangweth-Matzek
et al 2006).
Cognitive Restraint
The concept of restraint is the conscious and regular restriction of one’s food intake in an
attempt to control body weight and body shape (Karlsson et al 2000). Individuals with high
restrained eating possess high awareness of the quantity and type of food consumed, and
consume less food than desired. Restrained eating is not the same as dieting. Studies have
shown that individuals demonstrating CR, coupled with low UE and low EE, are associated
with successful, maintained weight loss or weight maintenance (Foster et al 1998, Keränen et
al 2009). High CR scores have been positively associated with healthier food choices
(Konttinen et al 2010a, de Lauzon et al 2004) such as green vegetables, fish, and reduced-fat
foods, and negatively associated with candy/chocolate, potatoes, and French fries (de Lauzon
et al 2004). In adults it has been found that individuals with the highest levels of CR
reported the lowest energy and fat intake, highest fiber and carbohydrate intake, and the
greatest weight loss (Keränen et al 2011, Provencher et al 2003); however, high CR also has
been associated with obesity (Anglé et al 2009, de Lauzon-Guillian et al 2006, Porter and
Johnson 2011). Several studies have shown that women display higher levels of CR than
men (de Lauzon et al 2004, Provencher et al 2003). In female university students, an
14
increasingly significant likelihood of following a lacto-ovo or vegan diet paralleled the level
of dietary restraint (McLean and Barr 2003).
Overall there are mixed results regarding whether high CR is associated with low energy
intake and/or energy intakes below daily requirements (McLean and Barr 2003, Provencher
et al 2003). It has been suggested to separate CR into 2 subscales: rigid and flexible restraint.
Rigid restraint is defined as an uncompromising approach to eating, dieting, and weight,
whereas flexible restraint is a more mediated approach to eating, dieting, and weight which,
for example, “fattening” foods are eaten in limited amounts without associated feelings of
guilt (Provencher et al 2003, Westenhoefer et al 1999). In women, rigid restraint has been
shown to be positively and significantly related to weight, BMI and body fat, whereas
flexible restraint was negatively correlated with body fat and waist circumference
(Provencher et al 2003). Importantly, high rigid restraint has been associated with high UE,
which suggests an individual following a strict and rigid diet could lead to episodes of loss of
control over eating. High flexible restraint has been associated with lower disinhibition,
possibly leading to a lower level of loss of control, and greater likelihood of weight loss or
weight maintenance (Provencher et al 2003, Westenhoefer et al 1999).
Uncontrolled Eating
UE refers to the overconsumption of food due to a variety of stimuli, associated feelings of
being out of control, and subjective feelings of hunger (Anglé et al 2009, Karlsson et al
2000). High UE scores have been associated with obesity (Anglé et al 2009, Porter and
Johnson 2011), increased levels of dysphoria (Foster et al 1998), and episodes of binge eating
15
(Foster et al 1998). Higher UE is supported by a strong relationship with binge eating
severity (Foster et al 1998). In adults it has been shown that individuals that demonstrate UE
report the highest energy and fat intake (Keränen et al 2011, Provencher et al 2003). More
specifically, in adults UE has been positively associated with energy-dense high-fat foods,
comfort foods such as casseroles/side dishes, pork products, potatoes, yogurt, and green
vegetables (women and men combined sample), cheese only in women, and fruit only in men
(de Lauzon et al 2004).
Provencher et al (2003) found that obese men and women exhibited higher UE scores than
their overweight and non-obese counterparts. Although the research is limited, there may be
some gender differences such as women may display higher levels of UE than men
(Provencher et al 2003) and teenage and young adult boys may have higher levels of UE than
their female equivalents, but no significant gender difference was seen in adults (de Lauzon
et al 2004).
Emotional Eating
EE consists of the tendency to eat in response to negative emotional feelings or mood such as
depression, anxiety or sadness (Anglé et al 2009, Konttinen et al 2010a). Emotions have
been found to affect eating behavior along the entire process of ingestion: motivation to eat,
food choice, response to food, eating speed, and amount ingested (Macht 2008). Some
previous research suggests that EE is associated with obesity (Anglé et al 2009, Porter and
Johnson 2011), but this association has not been seen consistently (Konttinen et al 2010a). In
adults, several studies have shown that women display higher levels of EE than men (de
16
Lauzon et al 2004, Konttinen et al 2010a, Provencher et al 2003). EE has shown strong
positive association with yogurt, pasta and cereal grains (de Lauzon et al 2004), sweet and
salty snack foods such as cakes, pastries, cookies, peanuts, and sweet beverages (Konttinen et
al 2010a, de Lauzon et al 2004, Macht 2008), and nuts, seeds, and fruit only in women, and
negative associations with alcoholic drinks in women (de Lauzon et al 2004).
Comfort Food
Food is a fundamental part of our well-being and quality of life, and extends beyond simply
satisfying hunger needs and providing nourishment. Specific foods can become symbolic
and particular food habits can be derived from emotional, social, religious, and cultural
experiences. During times of stress, eating behaviors are often driven by the consumption of
comfort foods. Comfort food consumption has been seen as a response to emotional stress,
and consequently, a strong factor in food selection made by individuals that demonstrate EE.
Comfort foods are foods whose consumption induces some level of improved emotional state
by relieving negative psychological affects or by increasing positive feelings (Wansink et al
2003). Comfort food selection can be attributed to a combination of physiological and
psychological stimuli. Physiological impetuses behind food choices can involve the body’s
natural response to correct nutrient and energy imbalances, while psychological motivations
can be driven by the pleasure derived from certain food choices. In a recent survey of adults
(n = 411), Wansink et al found that 60% of the most preferred comfort foods were snack-
related and relatively high in salt or sugar (23% potato chips, 14% ice cream, 12% cookies,
11% candy/chocolate) (Wansink et al 2003), foods typically classified as energy-dense and
nutrient-poor.

17
Comfort food preferences have been shown to differ by age and by gender. Wansink and
colleagues found significant differences between male and female preferences, as well as age
(n = 1005) (Wansink et al 2003). Females tend to prefer comfort foods that are snack-related
(candy/chocolate, ice cream), but males prefer more nutritious meal-related comfort foods
(pizza/pasta, steak/beef, casseroles/side dishes, and soup). Females also rank vegetables and
salads as comfort foods more than males. There are also varying resultant feelings that
encompass comfort food selection and consumption. Individuals that consume more meal-
related comfort foods tend to feel less guilty and healthier than those who consume more
snack-related comfort foods. Regardless of choice, no comfort food selections by females
cultivate healthy feelings, and most males feel relatively healthier than females based on
comfort food consumption. Similarly, consumption of comfort foods by females, regardless
of being snack- or meal-related, tends to make females feel relatively guiltier than males
(Wansink et al 2003).
By age, significant differences have also been seen in comfort food selection. Younger
people (18-34 years) tend to prefer snack-related comfort foods (potato chips, ice cream,
cookies, candy/chocolate), most commonly potato chips, compared to adults and older
individuals (35-54 and 55+ years, respectively). The older age groups were more likely to
choose meal-related comfort foods (steak/beef, casseroles/side dishes, vegetables/salads, and
soup). Individuals over the age of 55 years ranked soup and steak/beef burgers highest for
comfort food preferences (Wansink et al 2003).
18
Eating Behaviors and Other Health Conditions
In our current obesogenic environment, eating behaviors are one group of factors that have
been proposed to account for individual differences in the susceptibility to gaining weight.
Restrained eating, which has been researched most extensively, has shown mixed results
demonstrating a causal link between obesity and dietary restraint (Karlsson et al 2000). EE
has shown a strong positive association (r = 0.31, n = 3714) to depression in both adult men
and women, and both of these factors were related to a higher body mass (Konttinen et al
2010a, Konttinen et al 2010b). Conversely, restrained eating and depressive symptoms were
unrelated (Konttinen et al 2010a).
Recent research has revealed significant associations of eating behaviors and mental health
with obesity in older adults (Porter and Johnson 2011). When obesity was defined as BMI (>
30 kg/m2), it was positively associated with CR, UE, EE, depression, anxiety, and stress in
correlation analyses (n = 113) (Porter and Johnson 2011). Additional research exploring
associations of EE in adult populations in Finland (n = 3714) has revealed that men and
women demonstrating higher EE scores consumed more sweet energy-dense foods (cookies,
buns, other sweet-baked items, chocolate) independent of depressive symptoms. In men, EE
was also associated with a greater consumption of non-sweet energy dense foods (pizza,
hamburgers, French fries, chips, popcorn, and mayonnaise-based salads). Neither gender
displayed any association of EE with fruit and vegetable consumption. Restrained eating was
associated with healthier food choices (i.e., higher fruit and vegetable consumption) and
lower sweet and non-sweet energy-dense foods (Konttinen et al 2010a).
19
Food Frequency Questionnaires
Food frequency questionnaires (FFQ) are designed to assess an individual’s nutrient intake
and habitual food consumption through past recall. FFQs are used in intervention studies to
measure the composition of total diet and dietary change, observational studies to compare
food and dietary intakes between groups, and epidemiological studies to examine
relationships between diet and disease (Wirfält et al 1998). FFQs have been criticized for
imprecise data measurements and unreliable or reproducible results (Schaefer et al 2000), but
compared to biochemical measures of intake and dietary records, these questionnaires are
very advantageous in terms of cost to administer and participant burden. These advantages
are particularly important because they allow large sample populations to be enrolled in
prospective studies and repeated assessments of diet during the follow-up period (Willett
2001).
The Block FFQ and the Willett FFQ are two widely used assessment tools. In a study of
obese adult women (n = 101), Wirfält et al found that the Block 60-item reduced FFQ and the
Willett 153-item FFQ were reliable and reproducible measurements of food intake compared
to 3 24-hour dietary recalls (Wirfält et al 1998). However, it was also found that the reduced
60-item Block FFQ showed an overall energy underestimation bias, but was more accurate in
categorizing percent energy from fat and carbohydrate intake than the 153-item Willett FFQ.
The Willett FFQ was more successful classifying individuals’ vitamin A and calcium intakes
than the Block FFQ and showed no overall energy underestimation bias (Willett 2001,
Wirfält et al 1998).
20
To improve accuracy of FFQs and reduce underestimation biases, it has been suggested that
questionnaires focus attention on trying to measure dietary behaviors. Questions about
habitual dietary practices (e.g., “How many servings of vegetables do you usually eat each
day?”) may be more accurately and easily recalled than specific portion sizes and frequencies
of a long list of foods (Kristal 2005). There are multiple challenges when collecting dietary
intake, particularly in recalling past intakes over a period of time (Kristal 2005). An older
adult population adds further challenges due to potential impairments in cognition, hearing,
and vision. However, utilization of the FFQ in short, simplified or standard form is thought
to be an effective method of capturing dietary patterns in older adults, because it requires
generic memory recall rather than short term memory of detailed descriptions (Huang et al
2011). In a recent study by Huang et al (2011), a simplified food frequency questionnaire,
without portion sizes, was validated in an elderly population. This study aimed to
demonstrate the validity of the simplified version while reducing the burden placed on
respondents, and found that portion size estimations do not necessarily improve validity of
FFQs. Multiple other studies have also produced comparable FFQ validity and maintain
reproducibility for a number or nutrients by level of cognitive function in the older adult
population (Klipstein-Grobusch et al 1998, Tucker et al 1999). FFQs and/or individual food
group questions have been found to confirm positive associations of serum vitamin B12
concentrations with animal food intake (Johnson et al 2003) and serum vitamin D
concentrations with milk intake (Johnson et al 2008) in congregate meal participants. In
individuals 65 years and older, biomarkers of calcium and riboflavin status were associated
positively with dairy intake, while serum vitamin C concentrations were associated with fruit
intake (Huang et al 2011). Plasma carotenoid concentrations have also shown significant
21
positive associations with the intake of fruit- and vegetable-containing carotenoids in
individuals 67 years and older (Tucker et al 1999). These findings provide a strong
foundation for examining dietary patterns of older individuals through the use of FFQs and
individual food group questions.
Psychometrics and Construct Validity
There is a need for valid and effective instruments to evaluate behaviors and conditions that
are applicable to a wide range of populations. Psychometrics is the field of study concerned
with the theory and technique of psychological measurement. The field is primarily
concerned with the construction and validation of measurement instruments such
as questionnaires, tests, and personality assessments. Construct validity refers to whether
a scale measures or correlates with the theorized construct (e.g., CR, UE, EE) that it purports
to measure. In other words, it is the extent to which the scale to be measured is actually
measured. A construct is not restricted to one set of observable indicators or attributes, but
commonly encompasses several indicators. Construct validity can be evaluated by statistical
methods to determine if a common factor underlies several measurements using different
observable indicators (Cronbach and Meehl 1955, Nunnally 1978).
Evaluation of construct validity requires determining the correlations of the measure to be
examined in regards to variables that are known to be related to the construct (purportedly
measured by the instrument). This is consistent with the multitrait/multi-item matrix of
examining construct validity described in Campbell and Fiske's landmark paper (Campbell
and Fiske 1959). Correlations that fit the expected pattern contribute evidence of construct
22
validity. Construct validity is a judgment based on the accumulation of correlations from
numerous studies using the instrument under evaluation (Cronbach and Meehl 1955,
Nunnally 1978). This study evaluated the construct validity of the TFEQ-R18; it has not
been validated exclusively in an older population or in congregate meal participants, but the
instrument has been validated in several general populations (Anglé et al 2009, Karlsson et al
2000, de Lauzon et al 2004). Acceptable construct validity will add to accumulating
evidence of this tool’s applicability in diverse populations.
For the establishment of construct validity, convergent validity and discriminate validity
must be met (Campbell and Fiske 1959). Item convergent validity is confirmed when each
item in a questionnaire substantially correlates to the scale that it was assumed to represent.
Item-discriminant validity is confirmed when items correlate significantly higher within their
assigned scale than with all other scales. Scaling fulfillment is fulfilled by the proportion of
items in a scale that meet both discriminant and convergent validity. To examine convergent
and discriminate validity, multitrait/multi-item analysis is frequently employed, which
presents the intercorrelations resulting from each trait measured against all other traits in the
construct (Campbell and Fiske 1959). Previous researchers have demonstrated this concept
analyzing the TFEQ-R18 (Karlsson et al 2000, de Lauzon et al 2004).
Internal-consistency reliability of a scale is estimated by Cronbach’s alpha coefficients
(Cronbach and Meehl 1955). Questionnaires are generally deemed reliable when the
Cronbach’s alpha is between 0.7 and 0.9, with an expected range of 0 to 1 (de Lauzon et al
2004). The advantage of using the Cronbach’s alpha measure in a new sample (i.e.,
23
congregate meal participants, older adults) is if coefficients are similar to those found by
other researchers, then under the testing conditions and sample, this questionnaire can have
reliability similar to other published reports. Adjustments to the scales can be made if
needed. If validity and reliability are found unacceptable, then factor analysis can be used to
derive a new factor structure and new scales (Anglé et al 2009).
24
CHAPTER 3
THE THREE-FACTOR EATING QUESTIONNAIRE-R18 IS ABLE TO
DETERMINE DIFFERENT EATING BEHAVIORS AND FOOD PATTERNS IN
CONGREGATE MEAL PARTICIPANTS
Furman JD, Gerst K, Porter KN, Johnson MA. To be submitted to Journal of Nutrition in
Gerontology and Geriatrics.
25
Abstract
The purpose of this study was to determine the construct validity and reliability of the Three-
Factor Eating Questionnaire (revised 18 item, TFEQ-R18), and the relationship of the 3
eating behavior scales, cognitive restraint (CR), uncontrolled eating (UE), and emotional
eating (EE), with food intake. Participants were 60 years and older and received congregate
meals from 4 senior centers in northeast Georgia (n = 124, mean (SD) age = 75 (8) years,
76% women, 55% White, 44% Black, and 51% obese (BMI > 30 kg/m2)). The intake of 6
food groups was assessed with a short food frequency questionnaire (FFQ, sweets, salty
snacks, fruits, vegetables, whole grains, and milk). For the 3 eating behavior scales, item
convergent validity and item discriminate validity analyses were acceptable and within the
range reported in other studies. Cronbach’s alpha analyses confirmed the reliability of the 3
eating behavior scales: CR (alpha = 0.78), UE (alpha = 0.83), and EE (alpha = 0.83). In the
unadjusted analyses, higher CR was associated with significantly higher intake of vegetables,
higher UE was associated with significantly higher intake of sweets, salty snacks, and
vegetables, and higher EE was associated with significantly higher intake of sweets and salty
snacks. There were no associations of any of the eating behaviors with the intake of fruit,
whole grains, or milk in the total sample. Eating behaviors were dichotomized based on the
median split for logistic regression analyses. In multivariate logistic regression analyses
controlling for potential confounders (age, gender, race, and education), higher UE was
associated with a higher intake of vegetables (> 4/day, OR: 2.7, 95% CI 1.06, 6.89, p < 0.05)
and higher EE was associated with a higher intake of salty snacks (> 1/day, OR 3.9, 95% CI
1.58, 9.72, p < 0.01), but there were no other associations of eating behaviors with food
group intake. These findings suggest that the TFEQ-R18 measuring CR, UE, and EE is a
26
valid and reliable measure of eating behaviors, and perhaps should be considered when
designing nutritional interventions to modify the intake of sweets, salty snacks, and
vegetables among congregate meal participants
Introduction
Eating behavior associated with food choices is an important facet associated with health,
development of chronic conditions, and lifestyle choices. To identify eating behaviors
related to food choices, questionnaires have been developed to describe these behaviors, such
as the Dutch Eating Behavior Questionnaire (DEBQ) (van Strien et al 1986) and the Three-
Factor Eating Questionnaire (TFEQ) (Stunkard and Messick 1985). Specific components of
eating behaviors have been strongly associated with food choices in the general population,
and can be useful in developing tools for nutrition education interventions and weight
management counseling. Some questionnaires are lengthy to administer (46 to 51 items),
which may limit their use. Karlsson and colleagues (2000) developed an 18-item revised
version (TFEQ-R18) of the original 51-item TFEQ by Stunkard and Messick (1985). The
TFEQ-R18 identifies 3 different eating behavior scales corresponding to CR (conscious and
regular restriction of one’s food intake in an attempt to control body weight and body shape),
UE (overconsumption of food due to a variety of stimuli, associated feelings of being out of
control, and subjective feelings of hunger), and EE (tendency to eat in response to negative
emotional feelings or mood such as depression, anxiety or sadness). The TFEQ-R18 was
developed among obese individuals and has been validated in non-obese samples of
adolescents and adults (Anglé et al 2009, Karlsson et al 2000, de Lauzon et al 2004).
27
The older adult population is growing in the United States and as of 2010, represents 13.1%
of the population, a figure estimated to increase to 19.3% by 2030 (AOA 2011). The Older
Americans Act Nutrition Program (OAANP) targets individuals aged 60 years or older,
minority older adults, and those living in rural areas to provide food and nutrition assistance,
such as congregate meals distributed as 5 lunches per week. Congregate meal participants
are characterized by high levels of obesity and obesity-related disorders in Georgia (Penn et
al 2009, Brewer et al 2010), thus it is of interest to explore factors that may be associated
with obesity in this population. Porter and Johnson (2011) recently reported that CR and EE,
as measured by the TFEQ-R18, were associated with obesity in congregate meal participants.
Despite the common use of the TFEQ-R18 in current research, few studies have reported on
the psychometric properties of the tool and little is known about its validity in diverse
populations, e.g., older adults and subgroups of the older adult population such as congregate
meal participants. Thus, the aim of the present study was to evaluate the validity of the
TFEQ-R18 in this sample of congregate meal participants and to determine the relationships
of these 3 eating behaviors, CR, UE, and EE, with the intake of certain food groups.
Methods
Study design
This study was cross-sectional in design and participants were individuals 60 years and older
receiving congregate meals at 4 senior centers in northeast Georgia’s Area Agency on Aging
(AAA) in summer 2010. All methods, questionnaires, and procedures were approved by the
University of Georgia, the Georgia Department of Human Services, and the Athens
Community Council on Aging Institutional Review Boards on Human Subjects. Procedures
28
were explained and consent forms were read to participants, and written informed consent
was obtained from each participant. A total of 124 individuals agreed to participate in the
study. Non-participants (n = 106) were those who were unavailable during the study period,
refused or were uninterested in the study, or were unable to answer questions and/or
understand the informed consent, as determined by the interviewer. Compared to non-
participants, the participants were more likely to be younger (77 and 75 years, respectively, p
< 0.01) and more likely to be Black (30% and 44%, p < 0.05), but there was no statistical
difference in gender (67% and 76% female, p = 0.24).
Three-Factor Eating Questionnaire – R18
Eating behaviors were described using the 18-item Three-Factor Eating Questionnaire
(TFEQ-R18) developed by Karlsson et al (2000). The TFEQ-R18 consists of 18 questions
with response categories on a 4-point Likert scale (e.g., 1 = never, 2 = rarely, 3 = sometimes,
4 = always; see Appendix A). As previously reported (Porter and Johnson 2011), for all
items “I” was adapted to “you”, as questions were read to participants, and item 1 was
modified from, “When I smell a sizzling steak or juicy piece of meat, I find it very difficult to
keep from eating, even if I have just finished a meal.” to “When you see any of your favorite
foods, do you find it very difficult to keep from eating, even if you have just finished a meal?”
These changes were implemented to improve measurement in assessing difficulty controlling
eating when attracted by an external stimulus in this population. This single-item change has
similarly been made and validated in a previous study (Anglé et al 2009). CR is assessed
with 6 questions, UE with 9 questions, and EE with 3 questions, and responses within each
scale were summed into scale scores. Higher scores reflect higher levels of CR, UE, or EE.
29
The mean CR, UE, and EE scale scores (SD) were: CR, 11 (4), UE, 14 (5); and EE, 5 (3).
The median CR, UE, and EE scale scores (range) were: CR, 10 (6 to 21); UE, 13 (9 to 31);
and EE, 4 (3 to 12).
Psychometric analysis procedure
The original TFEQ-R18 was constructed in a Swedish obese population (Karlsson et al 2000)
and was used here in an older adult American population. The construct validity of this tool
has been established in populations of French adolescents and adults (n = 236) (de Lauzon et
al 2004), and Finnish young women (n = 2,997) (Anglé et al 2009), and Finnish adults (n =
3,714) (Konttinen et al 2010a), and therefore the internal validity and reliability of this tool in
our sample had to be confirmed. The internal-consistency reliability of the 3 scales in the
questionnaire was measured using Cronbach’s alpha coefficient with a criterion of 0.7 used
to define adequate internal consistency. A multitrait/multi-item analysis was performed to
test scaling assumptions underlying the construction and scoring of the TFEQ-R18. The aim
of the analysis was to determine the validity and reliability of the TFEQ-R18 by verifying
that each item was strongly correlated to its assigned scale (convergent validity) and more
correlated to its assigned scale than to the other 2 scales (discriminate validity). In this
approach, the correlation between each item and its own scale is corrected for overlap, i.e.,
the scale is calculated without the specific item in the analysis to avoid unreliable correlation
inflation. An item-scale correlation matrix was computed, and the Pearson correlations for
each item were compared across scales. Item convergent validity was demonstrated when
the extent to which each item correlated meaningfully to the scale it was assumed to
represent (r ≥ 0.40, corrected for overlap). Item discriminate validity was indicated when the

30
item correlated more strongly with the scale it was supposed to represent than with all other
scales. As suggested by previous researchers (Karlsson et al 2000, de Lauzon et al 2004),
item-discriminate scale correlations were significantly different by using 2 standard errors of
the correlation matrix (1/√n). Scaling fulfillment was assessed by the proportion of items in
a scale that met both convergent and discriminate validity.
Food groups
Six food groups were assessed that reflect the current targets of nutrition education
interventions designed to increase the intake of fruits, vegetables, whole grains, and milk
products, and to decrease the intake of calorie-dense nutrient-poor foods in this population
(Lee et al 2010). Intakes of sweets and salty snacks (adapted from the Block FFQ), fruits and
vegetables (Hendrix et al 2008; Toobert et al 2000), whole grains (Ellis et al 2005) and milk
(Cheong et al 2003) were assessed as follows: “How many times a day do you eat something
sweet, such as candy, cookies, cakes, pie, donuts, ice cream?” (range = 0 to 7), “How many
times a day do you eat salty snacks, such as chips, French Fries, pretzels?” (range = 0 to 7),
“How many servings of fruits and 100% fruit juices do you usually have each day?” (range =
0 to 7), “How many servings of vegetables do you usually eat each day?” (range = 0 to 7),
“How often do you eat whole wheat or whole grain bread, such as 100% whole wheat
bread?” (range = 0 times per week to 3 times per day), “How often do you eat whole grain
cereals, such as oatmeal, Cheerios , bran flakes or bran cereals?” (range = 0 times per week
to 3 times per day), “How often do you drink milk as a beverage including soy milk?” (range
= 0 times per week to 3 times per day), and “How often do you eat milk on cereal including
soy milk?” (range = 0 times per week to 3 times per day). Summary scores were created for

31
total whole grain and milk intake by summing food categories and then dividing them by 7 to
determine frequency of intake per day. (Appendix B)
Statistical analysis
Descriptive statistics including means, standard deviations, and frequencies, along with
Wilcoxon, chi-square, correlations, Cronbach’s alpha and logistic regression analyses were
calculated (The Statistical Analysis System, SAS, Cary, NC). Because there is no consensus
on what constitutes “low” and “high” CR, UE, or EE, these variables were dichotomized at
the median split for this sample to create “low” and “high” scores as described previously
(Porter and Johnson 2011). Food group variables were dichotomized based on the
distribution of the responses for each variable and/or nutritionally meaningful categories to
represent the lowest 2 tertiles vs. the highest tertile of intake, which was ≥ 2/day for sweets, ≥
1/day for salty snacks, ≥ 3/day for fruits and 100% juice, ≥ 4/day for vegetables, ≥ 2/day for
whole grains, and ≥ 2/day for milk. As described in the psychometric analysis section,
correlation analyses and Cronbach’s alpha coefficients were used to assess validity of the
TFEQ-R18 scales. Multivariate logistic regression analysis was used to identify the
independent variables (eating behaviors, dichotomized) significantly associated with the
dependent variables (specific food group, dichotomized), when controlled for potential
confounders. In these regression analyses, sociodemographic confounding variables
included gender (0 = male or 1= female), race/ethnicity (0 = White or 1 = Black), age (0 = <
70 or 1 = > 70 y, which approximates the lowest tertile vs. the highest two tertiles), and
education (0 = < 8 or 1 = ≥ 8 y, which approximates the lowest quintile vs. the highest four
quintiles of the sample, and reflects a very low level of educational attainment), and BMI (0
32
= < 30 or 1 = ≥ 30); all of these categories were used in a previous study (Porter and Johnson
2011).. Food insecurity was assessed by the NSI checklist question, "Do you always have
enough money to buy the food you need?” with a negative answer indicative of insecurity
(White et al 1992). Because the literature suggests that gender differences occur in the scales
of the TFEQ-R18 (Karlsson et al 2000, Konttinen et al 2010a, de Lauzon et al 2004,
Provencher et al 2003), some analyses were stratified by gender. A level of p < 0.05 was
accepted as statistically significant.
Results
Participants
The characteristics of the study participants are shown in Table 3.1 (n = 124). The mean
(SD) age was 75 (8), 76% were female, and 44% were Black. BMI was 31 (7) and 51% were
obese (BMI ≥ 30). Medical conditions were self-reported: 72% reported hypertension, 61%
arthritis, 36% diabetes, and 30% some form of heart condition (such as angina, congestive
heart failure, heart attack or other heart problems).
Reliability
For each of the 3 TFEQ-R18 scales (CR, UE, and EE), internal-consistency reliability
coefficients (Cronbach’s alpha) were all acceptably above the standard 0.70, but below the
0.90 limit recommended for individual assessment (Table 3.2). The Cronbach’s alpha ranged
from 0.79 (CR) to 0.83 (UE and EE, individually); combining the scales of UE and EE
yielded 0.88. These coefficients are similar to those reported in previously validated
33
populations (Anglé et al 2009, Karlsson et al 2000, Konttinen et al 2010a, de Lauzon et al
2004).
Multitrait/multi-item scaling analysis
Table 3.2 demonstrates reliability estimates and summary of results of multitrait/multi-item
scaling tests of the TFEQ-R18, and Table 3.3 provides the detailed correlations of each item
to each scale comparison. For item convergent validity, the minimum desired scale
correlation values (r ≥ 0.40, corrected for overlap) was exceeded for 5 of 6 CR items, 9 of 9
UE items, and 3 of 3 EE items, and therefore showed very good internal consistency. The
CR item that did not meet minimum value had a correlation of r = 0.35 (item #15). The
discriminate validity test was met by 12 of 12 CR items, 17 of 18 UE items, and 6 of 6 EE
items. The UE item that did not meet the discriminate validity test identified strongly to the
EE scale (item #17). In summary, 5 of 6 CR items, 8 of 9 UE items, and 3 of 3 EE items met
criteria for both convergent and discriminate validity.
Associations of eating behavior with mean food intake
Table 3.4 summarizes the mean intake of the 6 food groups in the low vs. high scales of CR,
UE, and EE. Compared to low CR, high CR was associated with higher intakes of
vegetables in the total sample and in men, but not in women. Compared to low UE, high UE
was associated with higher intakes of sweets, salty snacks, and vegetables in the total sample,
with higher vegetables in men, and with higher sweets in women. Compared to low EE, high
EE was associated with higher intakes of sweets and salty snacks in the total sample, in men,
and in women, and with higher fruits and 100% fruit juice in men.
34
Table 3.5 reports the Spearman correlation coefficients of the 6 food groups by the
dichotomized eating behavior scales. CR was significantly associated with vegetables in the
total sample and in men, but not in women. UE was associated with sweets and salty snacks
in the total sample and in women, and associated with salty snacks only in men, when
analyzed independently. EE was associated with sweets and salty snacks in the total
population, in men, and in women.
Relationships between eating behavior and food intake
Multivariate logistic regression analyses with odds ratios were conducted to determine the
independent associations of eating behaviors (dichotomized) with food group intake
(dependent variable, dichotomized) when controlled for potential confounders (Table 3.6).
When controlled for age, race, education, gender, eating behaviors or obesity, independently
or in combination, several significant associations were seen. CR was not significantly
associated with the intake of any food group, but higher CR did show non-significant
positive associations with the odds of consuming ≥ 4 vegetable servings daily (OR 2.0, 95%
CI 0.88, 4.71, p < 0.10, no controlling factors) and non-significantly decreased the odds of
consuming ≥ 1 salty snacks per day (OR 0.4, 95% CI 0.17, 1.04, p < 0.10 controlling for
sociodemographics, UE, EE, and obesity,). Higher UE significantly increased the odds of
consuming ≥ 4 vegetable servings daily (ranging from OR 2.5, 95% CI 1.05, 5.77, p < 0.05,
no controls, to OR 3.0, 95% CI 1.02, 8.64, p < 0.05, controlling for sociodemographics, CR,
EE, and obesity), and non-significantly increased the odds of consuming ≥ 2 sweets or ≥ 1
salty snacks per day (ranging from OR 2.1, 95% CI 0.98, 4.36, p < 0.10, no controls, to OR
2.3, 95% CI 0.97, 5.38, p < 0.10, no controls). Higher EE significantly increased the odds of
35
consuming ≥ 1 salty snacks per day (ranging from OR 3.2, 95% CI 1.46, 7.18, p < 0.01, no
controls, to OR 4.3, 95% CI 1.54, 11.80, p < 0.01, controlling for sociodemographics, CR,
EE, and obesity) and non-significantly increased the odds of consuming ≥ 2 sweets per day
(ranging from OR 2.1, 95% CI 0.89, 5.16, p < 0.10, no controls, to OR 2.4, 95% CI 0.89,
6.60, p < 0.10, controlling for sociodemographics and obesity). Significant associations were
also seen when controlling for gender and the increased odds of men consuming ≥ 3 fruits or
100% fruit juice daily (OR 3.7, 95% CI 1.21, 11.64, p < 0.05) and ≥ 4 vegetable servings
daily (OR 4.1, 95% CI 1.14, 14.54, p < 0.05). This sample was too small to obtain reliable
estimates from models within each gender group independently, thus, these data are not
reported. R-squared (R2) values (Table 3.7), expressed as proportion of variance explained,
ranged from 0.00 to 0.06 for sweets, 0.00 to 0.15 for salty snacks, 0.00 to 0.07 for fruits and
100% fruit juice, 0.00 to 0.22 for vegetables, 0.00 to 0.06 for whole grains, and 0.00 to 0.05
for milk.
Relationships between eating behaviors
Spearman correlation analysis between eating behaviors showed significant associations
among the continuous scales of the 3 eating behaviors (all p < 0.01) and the correlations (r)
were; CR and UE = 0.32, CR and EE = 0.34, and UE and EE = 0.57. When analyzing
correlations between dichotomized eating behaviors the correlations were (all p < 0.05): CR
and UE = 0.22, CR and EE = 0.25, and UE and EE = 0.38.
36
Discussion
The purpose of this study was to verify the validity of the TFEQ-R18 and its 3 eating
behavior scales in a sample of congregate meal participants and to explore associations of
these eating behaviors with specific food categories. The major findings are that the TFEQ-
R18 is valid in this sample of congregate meal participants and that CR, UE, and EE were
associated with several of the food group intakes in the bivariate analyses, with the most
robust associations being with UE and higher vegetable intake, as well as EE and higher salty
snack intake, that were also detected in the multivariate logistic regression modeling.
The original 51-item TFEQ was developed in an adult weight-loss and dieting population
(Stunkard and Messick 1985), which was revised to an 18-item instrument (TFEQ-R18) in an
obese Swedish population (Karlsson et al 2000). This tool has been validated in French
adolescents and adults (de Lauzon et al 2004), Finnish young women (Anglé et al 2009), and
Finnish adults (Konttinen et al 2010a), but not in older adults or congregate meal
participants. The multitrait/multi-item scaling analysis demonstrated satisfactory internal
consistency of the TFEQ-R18 in this population. Only 1 minor discrepancy was detected in
the CR scale when verifying item convergent validity: the item-scale correlation for item #15
(“How frequently do you avoid ‘stocking up’ on tempting foods?” 1 = almost never, 2 =
seldom, 3 = usually, 4 = almost always) was lower than expected (r = 0.35), while all other
items on this scale were highly correlated. This item did not show high association to any
scale. The presence of 24% reported food insecurity in this sample may attenuate
individuals’ ability to actually “stock up” on any foods. In de Lauzon’s TFEQ-R18
validation in French adolescents and adults (2004), this same item was found to be in item
37
convergent discrepancy, overall suggesting some underlying weakness in this item. The 1
UE item that did not meet the discriminate validity test (“Do you go on eating binges though
you are not hungry?” 1 = never, 2 = rarely, 3 = sometimes, 4 = at least once a week))
identified to the EE scale strongly (r = 0.72). Overall, our findings corroborate the TFEQ-
R18 as a valid measure of these eating behaviors not only in the adolescent, adult, and
general populations, and overweight and obese populations, but also in this sample of
congregate meal participants.
The 3 different eating behaviors were associated with different patterns of reported food
category intake. High CR showed significantly higher number of servings of vegetables
consumed per day than low CR. While this relationship was only seen as a non-significant
trend in the multivariate regression analyses, it does reinforce that presentation of this eating
behavior is an attempt to control body weight through food choices generally deemed
healthier, which is in accord with previously published findings (de Lauzon et al 2004). It
has been suggested to separate cognitive dietary restraint into 2 subscales: rigid and flexible
restraint. Rigid restraint is defined as an uncompromising approach to eating, dieting, and
weight, whereas flexible restraint is a more mediated approach to eating, dieting, and weight
which, for example, “fattening” foods are eaten in limited amounts without associated
feelings of guilt. High flexible restraint has been associated with lower disinhibition,
possibly leading to a lower level of loss of control, and greater likelihood of weight loss or
weight maintenance. High rigid restraint has been associated with high UE, which suggests
an individual following a strict and rigid diet could lead to episodes of loss of control and
overeating (Karlsson et al 2000, Provencher et al 2003, Westenhoefer et al 1999). The high
38
vegetable intake associated with UE seen in this study could be due to the loss of control
exhibited by high (rigid) CR resulting in demonstration and carryover of the same food
choices. High UE and high EE reported significantly higher daily consumption of sweets
and salty snacks, which is consistent with previous studies (Lähteenmäki and Tuorila 1995,
de Lauzon et al 2004). These findings, combined with the single item discriminate
discrepancy, the high correlation between these two eating behaviors, and the collective UE
and EE Cronbach’s alpha (0.88), suggest a strong relationship between UE and EE, which
has also been seen in other adult populations (de Lauzon et al 2004, de Lauzon-Guillian et al
2006). However independently, the construct validity does support the eating behaviors are
separate and independent, but these behaviors may also appear concurrently.
When controlling for demographics the most robust associations of the eating behaviors were
seen with UE and EE. Previous research in this sample has suggested a relationship of these
eating behaviors with obesity (Porter and Johnson 2011), so additional models controlled for
both demographics and obesity. Additional models explored the associations of eating
behaviors controlling for other eating behaviors, demographics, and/or obesity, as previous
research has indicated strong relationships between CR, UE, and EE (de Lauzon et al 2004,
de Lauzon-Guillian et al 2006). In all models, high UE was positively associated with
vegetables in bivariate and multivariate logistic regression analysis with escalating R2 from
0.04 (model with no controls) to 0.22 (model controlling for sociodemographics, CR, EE,
and obesity) suggesting that these variables also explain some of the variance in vegetable
intake Similarly, high EE was positively associated with salty snacks, which was replicated
in bivariate and logistic regression analyses with escalating R2 from 0.07 (model with no

39
controls) to 0.15 (model controlling for sociodemographics, CR, EE, and/or obesity)
suggesting that these variables also explain some of the variance in salty snack intake. In this
model, controlling for obesity did not increase the proportion of variance explained,
suggesting obesity is not related to intake in this model. Other significant associations
between eating behaviors and food intake were eliminated once the confounding factors were
entered into the models.
This study found that associations with mean intake of these 6 reported food categories and
eating behaviors are mostly independent of gender, apart from a few exceptions. Notably,
high EE in men was associated with higher daily consumption of fruit and 100% fruit juice,
but this association was not seen in women or in the total sample, confirming similar findings
in previous papers (de Lauzon et al 2004, Provencher et al 2003). Comfort food preferences
have been seen to vary across gender and age ranges (Wansink et al 2003), but there was
insufficient power to further explore these relationships in logistic regression modeling.
The prevalence of these eating behaviors and the strong associations seen with specific food
categories, specifically those associated strongly with less nutritious food groups are
alarming. This population is currently the target of nutrition education interventions
designed to increase the intake of nutrient-rich foods such as fruits, vegetables, whole grains,
and milk products, and to decrease the intake of calorie-dense nutrient-poor foods such as
sweets and salty snacks. The existence of these eating behaviors and the associated
potentially unmanageable dietary choices in an overwhelmingly obese population lends
40
greater credence to the intensity and magnitude of eating behavior related problems in this
population.
Future studies
A more comprehensive list of food groups may be important in future studies, as well as
determining ways to overcome potential underreporting of “unhealthy” foods. This study did
not employ data from a full-length FFQ, but instead utilized a short FFQ measuring intake of
6 food categories reported in servings or frequency of consumption per day. By relying on
self-reported data, it would therefore be useful to compensate for underreporting and self-
reporting biases. A previous study defined specific foods that tend to be underreported in a
general population, many of which are important to this study (Lafay et al 2000). Namely, it
was found that underreporting individuals most frequently reported lower intakes of food
items rich in fat, carbohydrates, or sugar as consumed less frequently or in smaller quantities
compared to non-underreporters. It was also found that foods systematically underreported
concerned specific food items generally believed to be unhealthy (Lafay et al 2000). Further
research is warranted to relate specific eating behaviors and the tendency to underreport
specific food items or food categories as well as overall energy intake. Understanding this
relationship may be beneficial in the analyses of health, chronic disease, and diet in all
populations.
Because health awareness and access to healthier foods is strongly mediated by social and
economic factors, it would also be of great interest to further understand the dynamics of
eating behaviors across socioeconomic status. In this population, all of the participants are
41
offered 1 congregate meal 5 days per week, 51% were obese, 18% had an education of 8th
grade or lower, and 24% of the respondents reported being food insecure. Although it was
beyond the scope of the present study, it would be important in future studies to determine
the reliability and validity of the TFEQ-R18 in food insecure and obese older adults, as well
as the relationship of food insecurity and disordered eating behaviors.
Limitations
There are some limitations in this study. The study was cross-sectional in design, and thus
conclusions regarding causality or its direction cannot be made regarding findings. Many of
the participants have hearing or vision problems making it difficult to understand and
complete questionnaires; however, interviewers completed this study by reading questions to
participants and recording their respective responses. Congregate meals that meet the
Dietary Guidelines for Americans (USDHHS and USDA 2010) are provided about 5 times
per week and may be a substantial part of food intake, thus there may be a reduction in the
food choices that might be made individually and may dilute and/or distort the relationship of
eating behaviors with food group intake. The recruited population was limited to mobile,
older individuals receiving nutritional assistance, and thus does not reflect all older people
served by OAA Programs or the overall older adult population. The frequency of
consumption, but not portion or serving sizes, was reported for these 6 food categories.
Although the accuracy of FFQs has been questioned (Schaefer et al 2000), the use of food
group categories has been validated in older adults and found to be an accurate predictor of
serum vitamin B12 concentrations (with animal food intake, Johnson et al 2003) and serum
vitamin D concentrations (with milk intake, Johnson et al 2008) in congregate meal
42
participants, and calcium and riboflavin status (with dairy intake, Huang et al 2011) and
serum vitamin C (with fruit intake, Huang et al 2011) in individuals 60 to 65 years and older.
Lastly, the sample population was small and had low representation in certain subgroups that
limited the power to explore relationships of eating behaviors and dietary patterns in men or
other ethnic groups such as Hispanics (76% female; 55% White, 44% Black) (Johnson and
Porter 2011).
Conclusions
In conclusion, this study was able to fill in a research gap for the applicability of the TFEQ-
R18 in this sample of congregate meal participants; it was found to be reliable and valid in
this sample therefore extending its validity. This study adds new information that supports
our interests regarding the interconnectedness of food choices and eating behaviors, and
extends the research of others regarding the associations of food choices and eating behaviors
related to CR, EE, and UE (Anglé et al 2009, Karlsson et al 2000, Konttinen et al 2010a, de
Lauzon et al 2004). This sample population is currently the target of nutrition education
interventions designed to increase the intake nutrient-rich foods, and to decrease the intake of
calorie-dense nutrient-poor foods. This investigation into eating behaviors and the intake of
selected food groups provides needed knowledge and understanding of previously unstudied
risk factors for poor food choices, which can be targeted in order to improve nutrition
education programs for older adults participating in publicly and privately funded food and
nutrition assistance programs. Thus, these findings have the potential to affect project
strategies and focus areas to reduce complications resulting from these problematic eating
43
behaviors, better target nutrition education, and improve counseling for healthy weight
management.
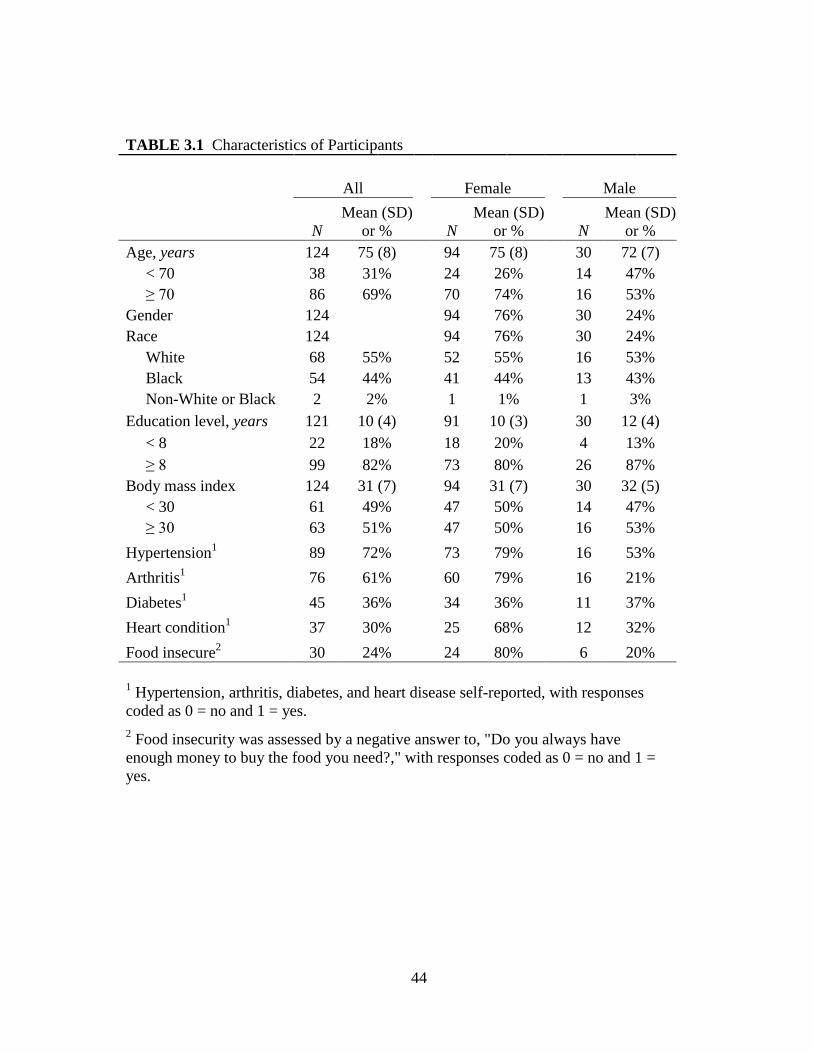
44
TABLE 3.1 Characteristics of Participants
All Female Male
N
Mean (SD)
or % N
Mean (SD)
or % N
Mean (SD)
or %
Age, years 124 75 (8) 94 75 (8) 30 72 (7)
< 70 38 31% 24 26% 14 47%
≥ 70 86 69% 70 74% 16 53%
Gender 124 94 76% 30 24%
Race 124 94 76% 30 24%
White 68 55% 52 55% 16 53%
Black 54 44% 41 44% 13 43%
Non-White or Black 2 2% 1 1% 1 3%
Education level, years 121 10 (4) 91 10 (3) 30 12 (4)
< 8 22 18% 18 20% 4 13%
≥ 8 99 82% 73 80% 26 87%
Body mass index 124 31 (7) 94 31 (7) 30 32 (5)
< 30 61 49% 47 50% 14 47%
≥ 30 63 51% 47 50% 16 53%
Hypertension1 89 72% 73 79% 16 53%
Arthritis1 76 61% 60 79% 16 21%
Diabetes1 45 36% 34 36% 11 37%
Heart condition1 37 30% 25 68% 12 32%
Food insecure2 30 24% 24 80% 6 20%
1 Hypertension, arthritis, diabetes, and heart disease self-reported, with responses
coded as 0 = no and 1 = yes.
2 Food insecurity was assessed by a negative answer to, "Do you always have
enough money to buy the food you need?," with responses coded as 0 = no and 1 =
yes.
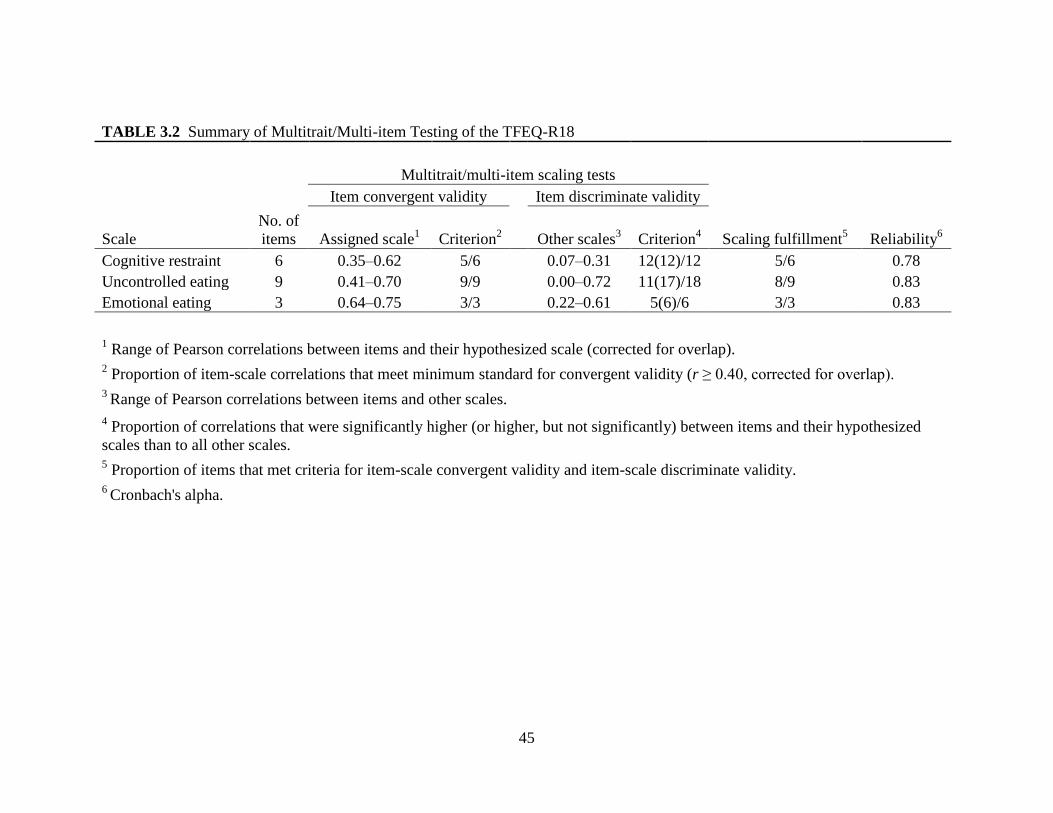
45
TABLE 3.2 Summary of Multitrait/Multi-item Testing of the TFEQ-R18
Multitrait/multi-item scaling tests
Item convergent validity Item discriminate validity
Scale
No. of
items Assigned scale1 Criterion
2 Other scales
3 Criterion
4 Scaling fulfillment
5 Reliability
6
Cognitive restraint 6 0.35–0.62 5/6 0.07–0.31 12(12)/12 5/6 0.78
Uncontrolled eating 9 0.41–0.70 9/9 0.00–0.72 11(17)/18 8/9 0.83
Emotional eating 3 0.64–0.75 3/3 0.22–0.61 5(6)/6 3/3 0.83
1 Range of Pearson correlations between items and their hypothesized scale (corrected for overlap).
2 Proportion of item-scale correlations that meet minimum standard for convergent validity (r ≥ 0.40, corrected for overlap).
3 Range of Pearson correlations between items and other scales.
4 Proportion of correlations that were significantly higher (or higher, but not significantly) between items and their hypothesized
scales than to all other scales. 5 Proportion of items that met criteria for item-scale convergent validity and item-scale discriminate validity.
6 Cronbach's alpha.
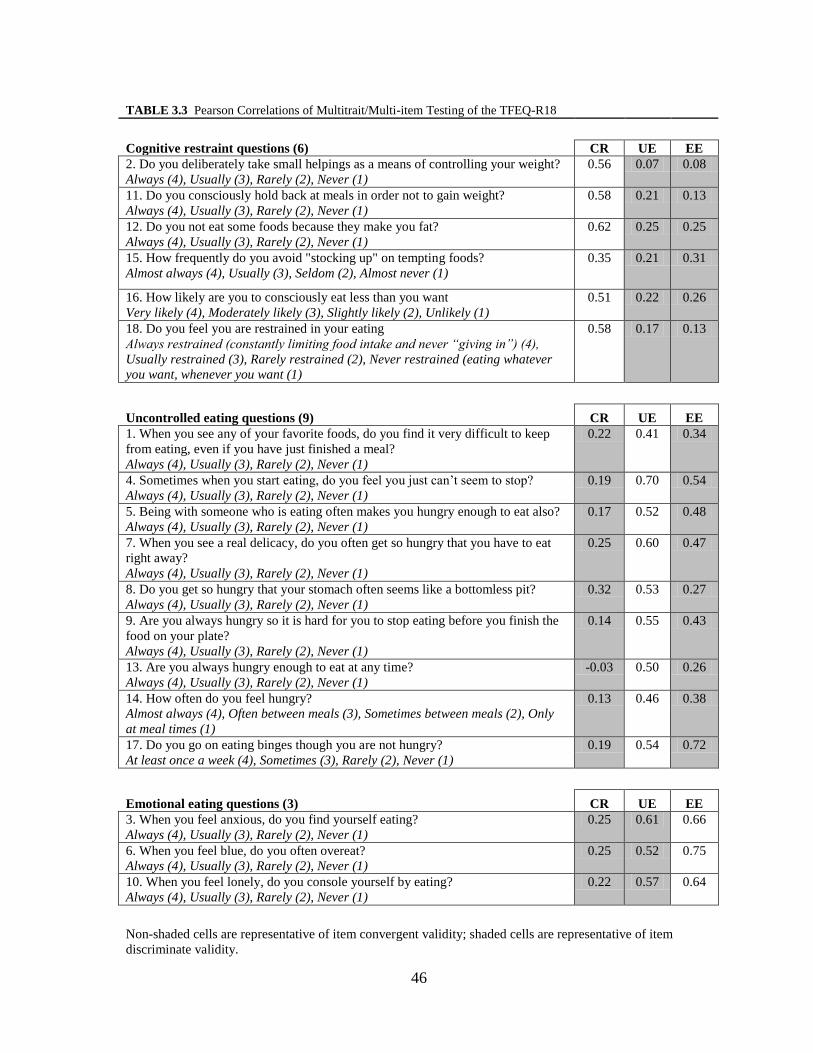
46
TABLE 3.3 Pearson Correlations of Multitrait/Multi-item Testing of the TFEQ-R18
Cognitive restraint questions (6) CR UE EE
2. Do you deliberately take small helpings as a means of controlling your weight?
Always (4), Usually (3), Rarely (2), Never (1)
0.56 0.07 0.08
11. Do you consciously hold back at meals in order not to gain weight?
Always (4), Usually (3), Rarely (2), Never (1)
0.58 0.21 0.13
12. Do you not eat some foods because they make you fat?
Always (4), Usually (3), Rarely (2), Never (1)
0.62 0.25 0.25
15. How frequently do you avoid "stocking up" on tempting foods?
Almost always (4), Usually (3), Seldom (2), Almost never (1)
0.35 0.21 0.31
16. How likely are you to consciously eat less than you want
Very likely (4), Moderately likely (3), Slightly likely (2), Unlikely (1)
0.51 0.22 0.26
18. Do you feel you are restrained in your eating
Always restrained (constantly limiting food intake and never “giving in”) (4),
Usually restrained (3), Rarely restrained (2), Never restrained (eating whatever
you want, whenever you want (1)
0.58 0.17 0.13
Uncontrolled eating questions (9) CR UE EE
1. When you see any of your favorite foods, do you find it very difficult to keep
from eating, even if you have just finished a meal?
Always (4), Usually (3), Rarely (2), Never (1)
0.22 0.41 0.34
4. Sometimes when you start eating, do you feel you just can’t seem to stop?
Always (4), Usually (3), Rarely (2), Never (1)
0.19 0.70 0.54
5. Being with someone who is eating often makes you hungry enough to eat also?
Always (4), Usually (3), Rarely (2), Never (1)
0.17 0.52 0.48
7. When you see a real delicacy, do you often get so hungry that you have to eat
right away?
Always (4), Usually (3), Rarely (2), Never (1)
0.25 0.60 0.47
8. Do you get so hungry that your stomach often seems like a bottomless pit?
Always (4), Usually (3), Rarely (2), Never (1)
0.32 0.53 0.27
9. Are you always hungry so it is hard for you to stop eating before you finish the
food on your plate?
Always (4), Usually (3), Rarely (2), Never (1)
0.14 0.55 0.43
13. Are you always hungry enough to eat at any time?
Always (4), Usually (3), Rarely (2), Never (1)
-0.03 0.50 0.26
14. How often do you feel hungry?
Almost always (4), Often between meals (3), Sometimes between meals (2), Only
at meal times (1)
0.13 0.46 0.38
17. Do you go on eating binges though you are not hungry?
At least once a week (4), Sometimes (3), Rarely (2), Never (1)
0.19 0.54 0.72
Emotional eating questions (3) CR UE EE
3. When you feel anxious, do you find yourself eating?
Always (4), Usually (3), Rarely (2), Never (1)
0.25 0.61 0.66
6. When you feel blue, do you often overeat?
Always (4), Usually (3), Rarely (2), Never (1)
0.25 0.52 0.75
10. When you feel lonely, do you console yourself by eating?
Always (4), Usually (3), Rarely (2), Never (1)
0.22 0.57 0.64
Non-shaded cells are representative of item convergent validity; shaded cells are representative of item
discriminate validity.
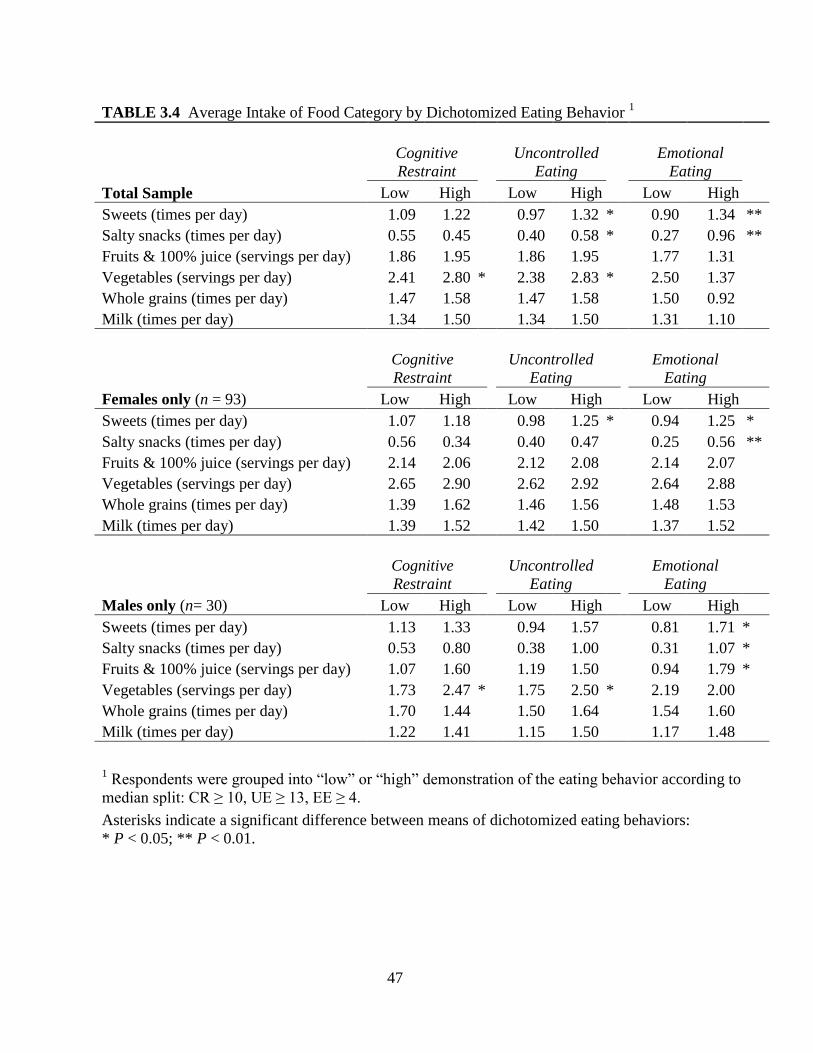
47
TABLE 3.4 Average Intake of Food Category by Dichotomized Eating Behavior 1
Cognitive
Restraint
Uncontrolled
Eating
Emotional
Eating
Total Sample Low High Low High Low High
Sweets (times per day) 1.09 1.22 0.97 1.32 * 0.90 1.34 **
Salty snacks (times per day) 0.55 0.45 0.40 0.58 * 0.27 0.96 **
Fruits & 100% juice (servings per day) 1.86 1.95 1.86 1.95 1.77 1.31
Vegetables (servings per day) 2.41 2.80 * 2.38 2.83 * 2.50 1.37
Whole grains (times per day) 1.47 1.58 1.47 1.58 1.50 0.92
Milk (times per day) 1.34 1.50 1.34 1.50 1.31 1.10
Cognitive
Restraint
Uncontrolled
Eating
Emotional
Eating
Females only (n = 93) Low High Low High Low High
Sweets (times per day) 1.07 1.18 0.98 1.25 * 0.94 1.25 *
Salty snacks (times per day) 0.56 0.34 0.40 0.47 0.25 0.56 **
Fruits & 100% juice (servings per day) 2.14 2.06 2.12 2.08 2.14 2.07
Vegetables (servings per day) 2.65 2.90 2.62 2.92 2.64 2.88
Whole grains (times per day) 1.39 1.62 1.46 1.56 1.48 1.53
Milk (times per day) 1.39 1.52 1.42 1.50 1.37 1.52
Cognitive
Restraint
Uncontrolled
Eating
Emotional
Eating
Males only (n= 30) Low High Low High Low High
Sweets (times per day) 1.13 1.33 0.94 1.57 0.81 1.71 *
Salty snacks (times per day) 0.53 0.80 0.38 1.00 0.31 1.07 *
Fruits & 100% juice (servings per day) 1.07 1.60 1.19 1.50 0.94 1.79 *
Vegetables (servings per day) 1.73 2.47 * 1.75 2.50 * 2.19 2.00
Whole grains (times per day) 1.70 1.44 1.50 1.64 1.54 1.60
Milk (times per day) 1.22 1.41 1.15 1.50 1.17 1.48
1 Respondents were grouped into “low” or “high” demonstration of the eating behavior according to
median split: CR ≥ 10, UE ≥ 13, EE ≥ 4.
Asterisks indicate a significant difference between means of dichotomized eating behaviors:
* P < 0.05; ** P < 0.01.
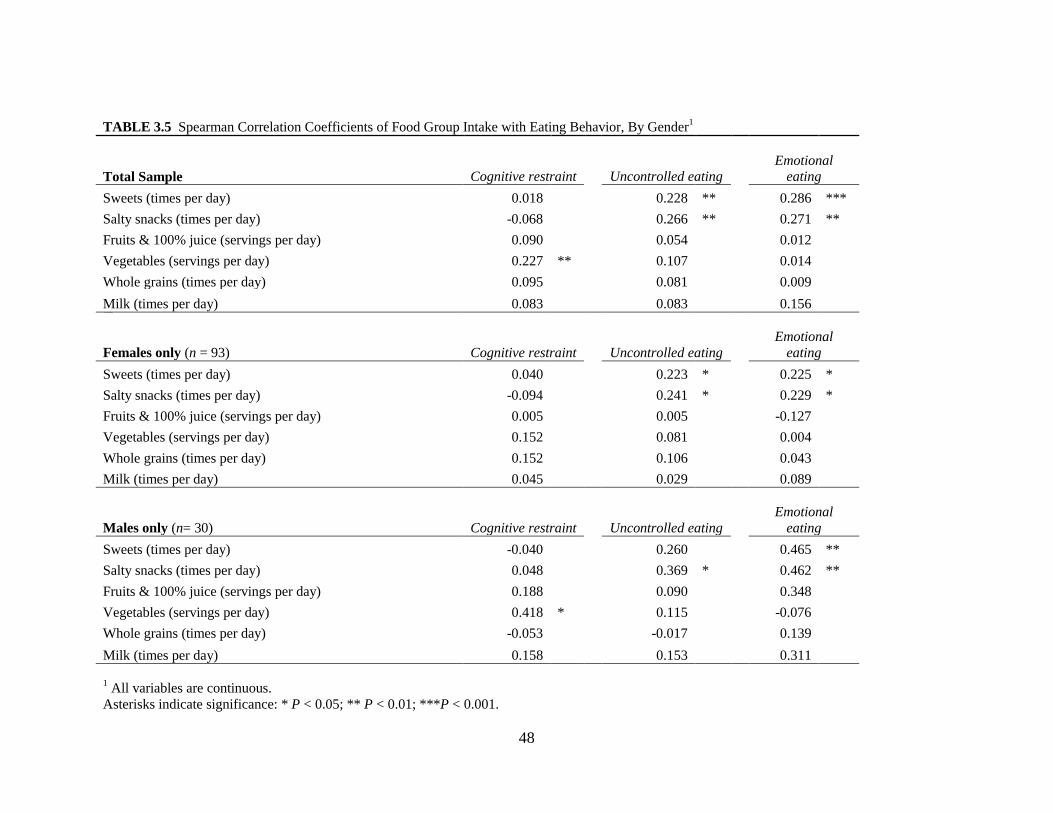
48
TABLE 3.5 Spearman Correlation Coefficients of Food Group Intake with Eating Behavior, By Gender1
Total Sample Cognitive restraint Uncontrolled eating Emotional
eating
Sweets (times per day) 0.018 0.228 ** 0.286 ***
Salty snacks (times per day) -0.068 0.266 ** 0.271 **
Fruits & 100% juice (servings per day) 0.090 0.054 0.012
Vegetables (servings per day) 0.227 ** 0.107 0.014
Whole grains (times per day) 0.095 0.081 0.009
Milk (times per day) 0.083 0.083 0.156
Females only (n = 93) Cognitive restraint Uncontrolled eating
Emotional
eating
Sweets (times per day) 0.040 0.223 * 0.225 *
Salty snacks (times per day) -0.094 0.241 * 0.229 *
Fruits & 100% juice (servings per day) 0.005 0.005 -0.127
Vegetables (servings per day) 0.152 0.081 0.004
Whole grains (times per day) 0.152 0.106 0.043
Milk (times per day) 0.045 0.029 0.089
Males only (n= 30) Cognitive restraint Uncontrolled eating
Emotional
eating
Sweets (times per day) -0.040 0.260 0.465 **
Salty snacks (times per day) 0.048 0.369 * 0.462 **
Fruits & 100% juice (servings per day) 0.188 0.090 0.348
Vegetables (servings per day) 0.418 * 0.115 -0.076
Whole grains (times per day) -0.053 -0.017 0.139
Milk (times per day) 0.158 0.153 0.311
1 All variables are continuous.
Asterisks indicate significance: * P < 0.05; ** P < 0.01; ***P < 0.001.

49
TABLE 3.6 Logistic Regression Models Exploring Associations Between Eating Behavior and Food Category Intake1
Sweets2 Salty snacks
2
Fruits &
100% juice2 Vegetables
2 Whole grains
2 Milk
2
Sociodemographics [OR (95% CI)]3
Age 1.7 (0.68, 4.49) 0.9 (0.42, 2.03) 1.1 (0.50, 2.64) 1.0 (0.41, 2.33) 0.5 (0.23, 1.07) † 0.7 (0.32, 1.58)
Gender 0.7 (0.29, 1.81) 0.5 (0.23, 1.21) 3.7 (1.21, 11.64) * 4.1 (1.14, 14.54) * 0.9 (0.38, 1.99) 1.3 (0.53, 3.12)
Race 1.2 (0.51, 2.67) 1.8 (0.83, 1.70) 1.4 (0.67, 3.12) 0.5 (0.21, 1.14) † 1.1 (0.52, 2.24) 0.7 (0.35, 1.60)
Education 1.6 (0.50, 5.18) 0.6 (0.24, 1.62) 1.0 (0.36, 2.64) - 6 2.1 (0.77, 5.91) 2.0 (0.69, 5.96)
Cognitive Restraint [OR (95% CI)]4 1.1 (0.49, 2.52) 0.7 (0.33, 1.40) 1.3 (0.62, 2.91) 2.0 (0.88, 4.71) † 1.4 (0.69, 2.93) 0.7 (0.34, 1.54)
Sociodemographics 1.2 (0.51, 2.86) 0.7 (0.30, 1.43) 1.2 (0.54, 2.75) 1.7 (0.69, 4.28) 1.4 (0.66, 3.02) 0.7 (0.31, 1.50)
Sociodemographics + Obesity5 1.2 (0.46, 2.91) 0.6 (0.25, 1.33) 1.3 (0.53, 3.06) 1.5 (0.52, 4.18) 1.7 (0.72, 3.80) 0.7 (0.31, 1.70)
Sociodemographics + UE + EE 0.9 (0.36, 2.28) 0.4 (0.17, 1.01) † 1.2 (0.50, 2.75) 1.5 (0.56, 3.91) 1.4 (0.65, 3.17) 0.6 (0.27, 1.41)
Sociodemographics + UE + EE + Obesity5 0.9 (0.36, 2.44) 0.4 (0.17, 1.04) † 1.2 (0.50, 3.02) 1.3 (0.44, 3.85) 1.7 (0.71, 3.83) 0.7 (0.28, 1.60)
Uncontrolled Eating [OR (95% CI)]4 2.3 (0.97, 5.38) † 2.1 (0.98, 4.36) † 1.3 (0.62, 2.91) 2.5 (1.05, 5.77) * 1.1 (0.53, 2.22) 1.1 (0.53, 2.37)
Sociodemographics 2.2 (0.90, 5.40) † 2.0 (0.89, 4.42) † 1.3 (0.57, 2.91) 2.7 (1.06, 6.89) * 1.0 (0.47, 2.16) 1.1 (0.50, 2.38)
Sociodemographics + Obesity5 2.2 (0.88, 5.56) † 2.0 (0.87, 4.44) 1.3 (0.57, 3.07) 2.5 (0.96, 6.63) † 1.1 (0.49, 2.33) 1.2 (0.52, 2.60)
Sociodemographics + CR + EE 1.8 (0.70, 4.85) 1.6 (0.66, 3.97) 1.3 (0.53, 3.17) 3.0 (1.04, 8.76) * 0.9 (0.41, 2.15) 1.1 (0.45, 2.51)
Sociodemographics + CR + EE + Obesity5 1.9 (0.70, 4.95) 1.6 (0.66, 3.98) 1.3 (0.54, 3.25) 3.0 (1.02, 8.64) * 1.0 (0.42, 2.23) 1.1 (0.46, 2.57)
Emotional Eating [OR (95% CI)]4 2.1 (0.89, 5.16) † 3.2 (1.46, 7.18) ** 1.2 (0.54, 2.58) 1.6 (0.68, 3.62) 1.2 (0.56, 2.43) 1.5 (0.70, 3.26)
Sociodemographics 2.4 (0.90, 6.15) † 3.9 (1.58, 9.72) ** 1.0 (0.44, 2.36) 1.1 (0.42, 2.72) 1.0 (0.47, 2.29) 1.3 (0.60, 3.05)
Sociodemographics + Obesity5 2.4 (0.89, 6.60) † 4.1 (1.60, 10.63) ** 1.0 (0.43, 2.48) 0.9 (0.32, 2.41) 1.1 (0.49, 2.61) 1.5 (0.65, 3.62)
Sociodemographics + CR + UE 2.0 (0.71, 5.54) 4.3 (1.57, 11.59) ** 0.9 (0.35, 2.23) 0.6 (0.20, 1.79) 1.0 (0.42, 2.32) 1.5 (0.61, 3.46)
Sociodemographics + CR + UE + Obesity5 2.0 (0.71, 5.89) 4.3 (1.54, 11.80) ** 0.9 (0.36, 2.32) 0.6 (0.18, 1.74) 1.1 (0.45, 2.61) 1.6 (0.63, 3.96)
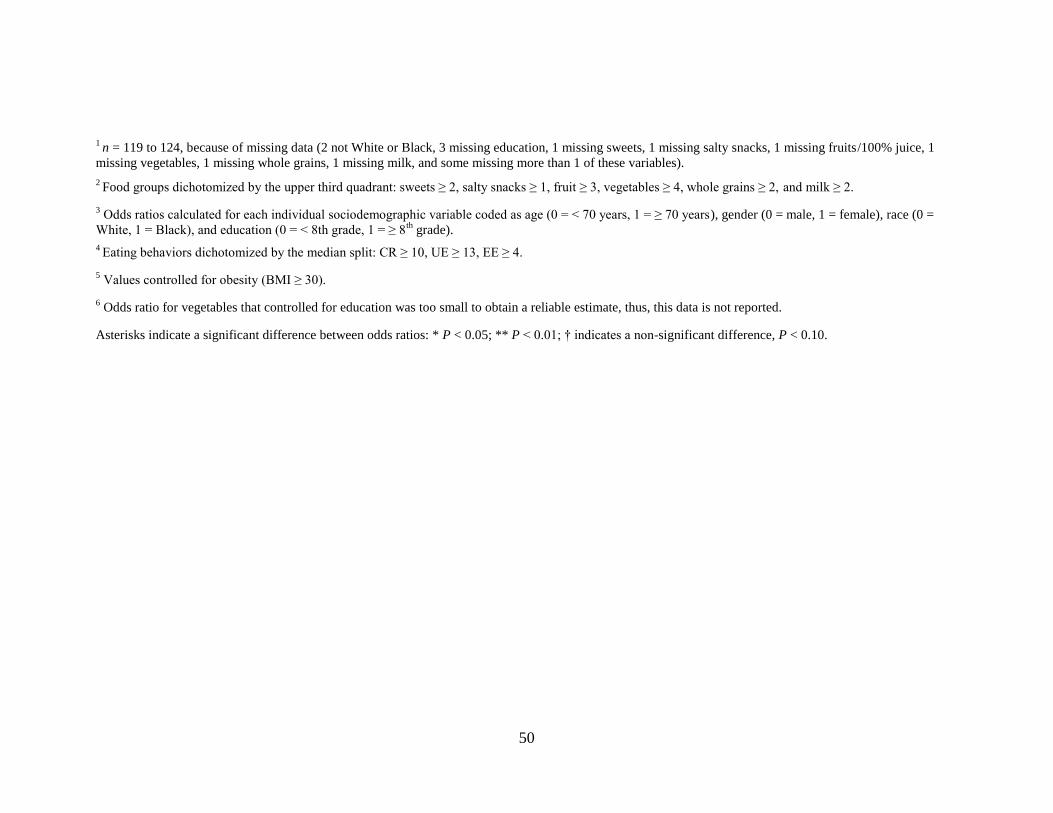
50
1 n = 119 to 124, because of missing data (2 not White or Black, 3 missing education, 1 missing sweets, 1 missing salty snacks, 1 missing fruits/100% juice, 1
missing vegetables, 1 missing whole grains, 1 missing milk, and some missing more than 1 of these variables).
2 Food groups dichotomized by the upper third quadrant: sweets ≥ 2, salty snacks ≥ 1, fruit ≥ 3, vegetables ≥ 4, whole grains ≥ 2, and milk ≥ 2.
3 Odds ratios calculated for each individual sociodemographic variable coded as age (0 = < 70 years, 1 = ≥ 70 years), gender (0 = male, 1 = female), race (0 =
White, 1 = Black), and education (0 = < 8th grade, 1 = ≥ 8th
grade).
4 Eating behaviors dichotomized by the median split: CR ≥ 10, UE ≥ 13, EE ≥ 4.
5 Values controlled for obesity (BMI ≥ 30).
6 Odds ratio for vegetables that controlled for education was too small to obtain a reliable estimate, thus, this data is not reported.
Asterisks indicate a significant difference between odds ratios: * P < 0.05; ** P < 0.01; † indicates a non-significant difference, P < 0.10.
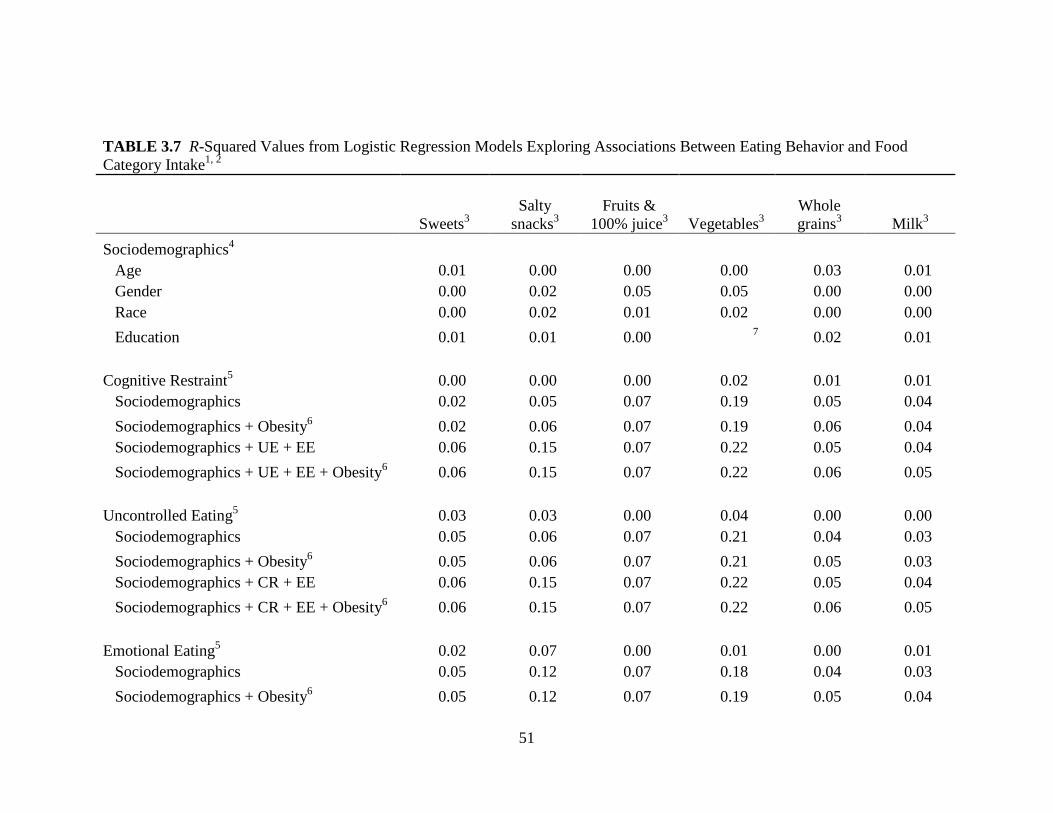
51
TABLE 3.7 R-Squared Values from Logistic Regression Models Exploring Associations Between Eating Behavior and Food
Category Intake1, 2
Sweets3
Salty
snacks3
Fruits &
100% juice3 Vegetables
3
Whole
grains3 Milk
3
Sociodemographics4
Age 0.01 0.00 0.00 0.00 0.03 0.01
Gender 0.00 0.02 0.05 0.05 0.00 0.00
Race 0.00 0.02 0.01 0.02 0.00 0.00
Education 0.01 0.01 0.00 7 0.02 0.01
Cognitive Restraint5 0.00 0.00 0.00 0.02 0.01 0.01
Sociodemographics 0.02 0.05 0.07 0.19 0.05 0.04
Sociodemographics + Obesity6 0.02 0.06 0.07 0.19 0.06 0.04
Sociodemographics + UE + EE 0.06 0.15 0.07 0.22 0.05 0.04
Sociodemographics + UE + EE + Obesity6 0.06 0.15 0.07 0.22 0.06 0.05
Uncontrolled Eating5 0.03 0.03 0.00 0.04 0.00 0.00
Sociodemographics 0.05 0.06 0.07 0.21 0.04 0.03
Sociodemographics + Obesity6 0.05 0.06 0.07 0.21 0.05 0.03
Sociodemographics + CR + EE 0.06 0.15 0.07 0.22 0.05 0.04
Sociodemographics + CR + EE + Obesity6 0.06 0.15 0.07 0.22 0.06 0.05
Emotional Eating5 0.02 0.07 0.00 0.01 0.00 0.01
Sociodemographics 0.05 0.12 0.07 0.18 0.04 0.03
Sociodemographics + Obesity6 0.05 0.12 0.07 0.19 0.05 0.04
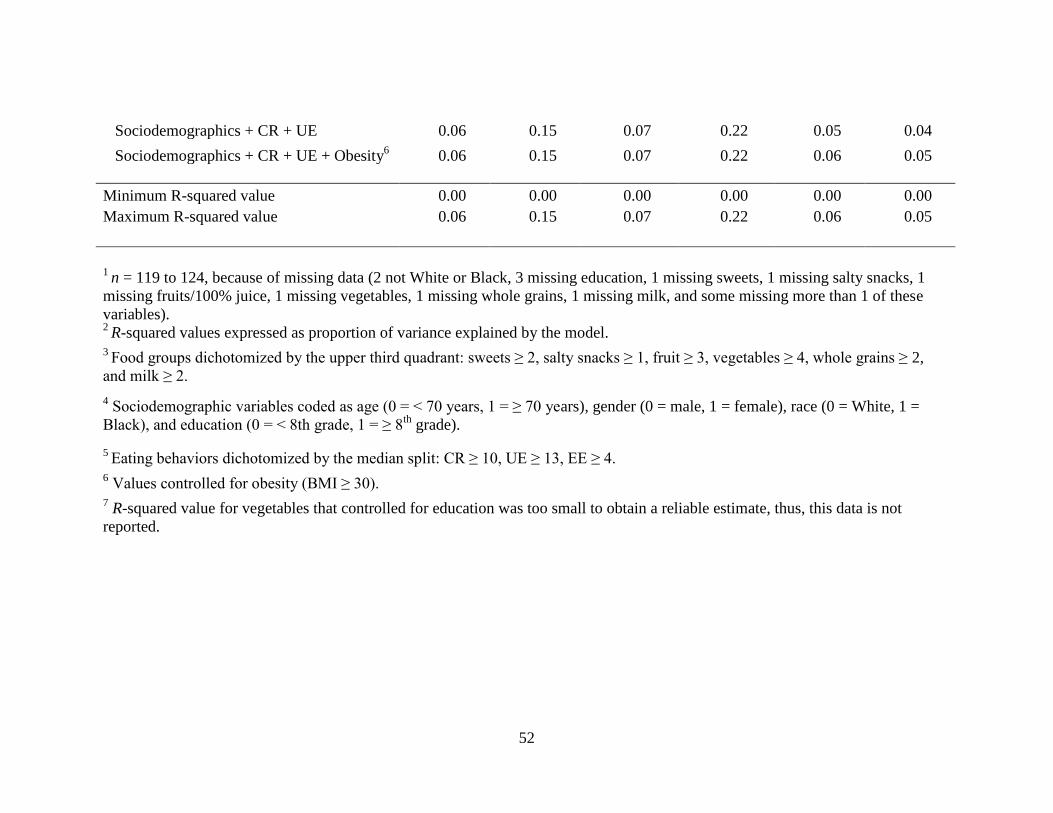
52
Sociodemographics + CR + UE 0.06 0.15 0.07 0.22 0.05 0.04
Sociodemographics + CR + UE + Obesity6 0.06 0.15 0.07 0.22 0.06 0.05
Minimum R-squared value 0.00 0.00 0.00 0.00 0.00 0.00
Maximum R-squared value 0.06 0.15 0.07 0.22 0.06 0.05
1
n = 119 to 124, because of missing data (2 not White or Black, 3 missing education, 1 missing sweets, 1 missing salty snacks, 1
missing fruits/100% juice, 1 missing vegetables, 1 missing whole grains, 1 missing milk, and some missing more than 1 of these
variables). 2
R-squared values expressed as proportion of variance explained by the model. 3
Food groups dichotomized by the upper third quadrant: sweets ≥ 2, salty snacks ≥ 1, fruit ≥ 3, vegetables ≥ 4, whole grains ≥ 2,
and milk ≥ 2.
4 Sociodemographic variables coded as age (0 = < 70 years, 1 = ≥ 70 years), gender (0 = male, 1 = female), race (0 = White, 1 =
Black), and education (0 = < 8th grade, 1 = ≥ 8th
grade).
5 Eating behaviors dichotomized by the median split: CR ≥ 10, UE ≥ 13, EE ≥ 4.
6 Values controlled for obesity (BMI ≥ 30).
7 R-squared value for vegetables that controlled for education was too small to obtain a reliable estimate, thus, this data is not
reported.
53
CHAPTER 4
SUMMARY
The primary goal of this study was to determine if the Three-Factor Eating Questionnaire –
Revised 18-Item (TFEQ-R18) was valid for use in congregate meal participants, and if the
elucidated eating behaviors were associated with specific food intake. The first specific aim
of the study was to determine the construct validity and reliability of the TFEQ-R18 in a
sample of congregate meal participants. The first hypothesis was that the three scales,
cognitive restraint (CR), uncontrolled eating (UE), and emotional eating (EE), would have
acceptable internal validity (convergent and discriminate) and reliability (Cronbach’s alpha).
The second specific aim was to analyze the relationship of eating behaviors identified in the
TFEQ-R18 with the intake of certain food groups. The second hypothesis was that CR
would be positively associated with “healthy foods” such as fruits and vegetables, and UE
and EE would be positively associated with sweet and non-sweet energy-dense foods. The
major findings of this study are that the TFEQ-R18 demonstrates acceptable construct
validity and reliability in this sample of congregate meal participants, and that CR, UE, and
EE were associated with several of the food group intakes in the bivariate analyses, with the
most robust associations seen with UE and higher vegetable intake, as well as EE and higher
salty snack intake, that were detected in the multivariate logistic regression analyses.
The TFEQ-R18 is an 18-item instrument that identifies eating behaviors that may contribute
causally to obesity (e.g., UE or EE) or may be responses to obesity and attempts to lose
54
weight (e.g., CR) (Anglé et al 2009, de Lauzon-Guillian et al 2006, Porter and Johnson
2011). The questionnaire was developed in an obese adult population (Karlsson et al 2000),
and has been validated in large samples of adolescents and adults, and obese and nonobese
individuals (Anglé et al 2009, de Lauzon et al 2004). The TFEQ-R18 is a common tool in
current research and the few construct validity studies that have been conducted have shown
good acceptability, but little has been understood about its validity in diverse populations,
e.g., older adults, congregate meal participants, and other subgroups of older adults. This
study conducted analyses of convergent and discriminate validity using multitrait/multi-item
scaling, which established satisfactory internal consistency of the TFEQ-R18 in this sample.
One discrepancy was detected in the CR scale when verifying item convergent validity while
all other items on this scale were highly correlated. This item did not show high association
to any scale, and this same item was found to be in item convergent discrepancy by others
(de Lauzon et al 2004), overall suggesting some underlying weakness in this item. One item
was found discrepant in discriminate validity tests; this item in the UE scale identified
strongly to the EE scale. Overall, our findings substantiate the TFEQ-R18 as a valid measure
of disordered eating behaviors not only in the adolescent, adult, and general populations, and
average weight and obese populations, but also in this sample of congregate meal
participants.
The 3 different eating behaviors were associated with different patterns of reported food
intake. This study found significant relationships between CR, UE, and EE with specific
food groups. In bivariate analyses, high CR was positively and significantly associated with
higher vegetable intake. In multivariate logistic regression analyses, this finding was no
55
longer seen. In bivariate analyses, high UE was positively and significantly associated with
higher intakes of sweets, salty snacks, and vegetables. In multivariate regression analyses
controlling for demographics and obesity, higher UE significantly increased the odds of
consuming ≥ 4 vegetable servings daily (OR 3.0, 95% CI 1.02, 8.64, p < 0.05), but the
associations of UE with sweets and salty snacks were no longer observed. In bivariate
analyses, high EE was associated with higher intakes of sweets and salty snacks, and
multivariate regression analyses confirmed the relationship with salty snacks, but the
relationship with sweets was no longer seen. High EE significantly increased the odds of
consuming ≥ 1 salty snacks per day (OR 4.3, 95% CI 1.54, 11.80, p < 0.001).
The relationship of higher CR with higher vegetable intake emphasizes that this eating
behavior is an attempt to control body weight through food choices generally deemed
healthier, which is in agreement with previously published findings (de Lauzon et al 2004).
Numerous researchers have suggested dividing CR into 2 subscales: rigid and flexible
restraint. Rigid restraint is defined as an inflexible approach to eating, dieting, and weight,
whereas flexible restraint is a more moderated approach to eating, dieting, and weight. High
rigid restraint has been associated with high UE, possibly leading to events of loss of control
and overeating (Karlsson et al 2000, Provencher et al 2003, Westenhoefer et al 1999). The
high vegetable intake associated with UE seen in this study could be due to the loss of
control exhibited by high (rigid) CR resulting in presentation and carryover of the same food
choices. High UE and high EE reported significantly higher daily consumption of sweets
and salty snacks, which is consistent with previous studies (Lähteenmäki and Tuorila 1995,
de Lauzon et al 2004). These findings, as well as the UE item in discriminate validity
56
discrepancy, add force to the conjecture that a strong relationship exists between UE and EE,
which has been seen in other adult populations (de Lauzon et al 2004, de Lauzon-Guillian et
al 2006).
Overall, this study demonstrated that the TFEQ-R18 is an acceptable instrument for use in
congregate meal participants, and that the prevalence of these disordered eating behaviors
and the strong associations seen to specific food categories, specifically those associated
strongly with less nutritious food groups, needs to be addressed. Future studies could benefit
by including a complete food frequency questionnaire and further explore the food groups
noted above that have shown strong associations to specific eating behaviors, and overall
energy intake. Understanding these relationships may be beneficial in the analyses of mental
and physical health, and chronic disease in all populations. In this population, all of the
respondents are offered 1 congregate meal 5 days per week, 51% were obese, 18% had an
education of 8th
grade or lower, and 24% of the respondents reported being food insecure. It
would also be of interest to examine the relationship of eating behaviors to socioeconomic
status, determine the reliability and validity of the TFEQ-R18 in food insecure and obese
older adults, as well as the relationship of food insecurity and these eating behaviors.
In conclusion, this investigation of the TFEQ-R18 extends the applicability of this instrument
to a wider audience. Congregate meal participants receive approximately 5 healthy mid-day
meals per week that comply with the Dietary Guidelines (USDHHS and USDA 2010), but
the existence of these identified eating behaviors could be influencing the consumption of
foods consumed at other times and perhaps undermine the effectiveness of nutrition
57
education programs that are also offered regularly at these congregate meal sites. Thus, these
findings have the potential to impact nutrition education and intervention programs, enhance
weight management counseling, and may signal the need to involve a multi-disciplinary team
in the promotion of healthy eating habits in this population.

58
REFERENCES
Administration on Aging (AOA): U.S. Department of Health and Human Services. Older
Americans Act and Aging Network. 2012.
http://www.aoa.gov/aoaroot/aoa_programs/hcltc/nutrition_services/index.aspx (accessed 29
March 2012).
Administration on Aging (AOA): U.S. Department of Health and Human Services. A profile
of older Americans: 2011. http://www.aoa.gov/AoARoot/Aging_Statistics/Profile/index.aspx
(accessed 9 April 2011).
American Psychological Association (APA). Eating disorders. 2008.
http://www.apa.org/about/gr/pi/advocacy/2008/eating-disorders.pdf (accessed 10 April
2011).
Anglé S, Engblom J, Eriksson T, Kautiainen S, Saha MT, Lindfors P, et al. Three factor
eating questionnaire-R18 as a measure of uncontrolled eating, cognitive restraint, and
emotional eating in a sample of young Finnish females. Int J Behav Nutr Phys Act.
2009;17(6):41-47.
Brewer DP, Catlett CS, Porter KN, Lee JS, Hausman DB, Reddy S, et al. Physical limitations contribute to food insecurity and the food insecurity-obesity paradox in older adults at senior centers in Georgia. J Nutr Elder. 2010;29(2):150-69.
Campbell DT, Fiske DW. Convergent and discriminant validation by the multitrait-
multimethod matrix. Psychol Bull. 1959;56(2):81-105.
Cheong JMK, Johnson MA, Lewis RD, Fischer JG, Johnson JT. Reduction in modifiable
osteoporosis-related risk factors among older adults in the older Americans nutrition
program. Family Econ. Nutrition Rev. 2003;15(1):83-91.
Cronbach LJ, Meehl PJ. Construct validity in psychological tests. Psychol Bull.
1955;52(4):281-302.
Donini LM, Savina C, Cannella C. Eating habits and appetite control in the elderly: the
anorexia of aging. Int Psychogeriatr. 2003;15(1):73-87.
Drewnowski A, Shultz JM. Impact of aging on eating behaviors, food choices, nutrition, and
health status. J Nutr Health Aging. 2001;5(2):75-9.
59
Ellis J, Johnson MA, Fischer JG, Hargrove JL. Nutrition and health education intervention
for whole grain foods in the Georgia older Americans nutrition programs. J Nutr Elder.
2005;24(3): 67-83.
Flegal KM, Carroll MD, Kit BK, Ogden CL. Prevalence of obesity and trends in the
distribution of body mass index among US adults, 1999-2010. JAMA. 2012;307(5):491-7.
Foster GD, Wadden TA, Swain RM, Stunkard AJ, Platte P, Vogt RA. The eating inventory in
obese women: clinical correlates and relationship to weight loss. Int J Obes Relat Metab
Disord. 1998;22(8):778-85.
Georgia Area Agencies on Aging (G4A). Georgia services for seniors.
http://www.georgiaservicesforseniors.org/About.aspx (accessed 28 April 2011).
Hendrix SJ, Fischer JG, Reddy RD, Lommel TS, Speer EM, Stephens H, et al. Fruit and
vegetable intake and knowledge increased following a community-based intervention in
older adults in Georgia senior centers. J Nutr Elder. 2008;27(1):155-78.
Huang YC, Lee MS, Pan WH, Wahlqvist ML. Validation of a simplified food frequency
questionnaire as used in the Nutrition and Health Survey in Taiwan (NAHSIT) for the
elderly. Asia Pac J Clin Nutr. 2011;20(1):134-40.
Hudson JI, Hiripi E, Pope HG, Kessler RC. The prevalence and correlates of eating disorders
in the National Comorbidity Survey Replication. Biol Psychiatry. 2007;61(3):348-58.
Johnson MA, Hawthorne NA, Brackett WR, Fischer JG, Gunter EW, Allen RH, et al.
Hyperhomocysteinemia and vitamin B-12 deficiency in elderly using Title IIIc nutrition
services. Am J Clin Nutr. 2003;77(1):211-20.
Johnson MA, Fischer JG, Park S. Vitamin D deficiency and insufficiency in the Georgia
Older Americans Nutrition Program. J Nutr Elder. 2008;27(1-2):29-46.
Karlsson J, Persson L-O, Sjöström L, Sullivan M: Psychometric properties and factor
structure of the Three-Factor Eating Questionnaire (TFEQ) in obese men and women.
Results from the Swedish Obese Subjects (SOS) study. Int J Obes Relat Metab Disord.
2000;24(12):1715-25.
Keränen AM, Savolainen MJ, Reponen AH, Kujari ML, Lindeman SM, Bloigu TS, et al. The
effect of eating behavior on weight loss and maintenance during a lifestyle intervention. Prev
Med. 2009;49(1):32-8.
Keränen AM, Strengell K, Savolainen MJ, Laitinen JH. Effect of weight loss intervention on
the association between eating behaviour measured by TFEQ-18 and dietary intake in adults.
Appetite. 2011; 56(1):156-62.
60
Klipstein-Grobusch K, den Breeijen JH, Goldbohm RA, Geleijnse JM, Hofman A, Grobbee
DE, et al. Dietary assessment in the elderly: validation of a semiquantitative food frequency
questionnaire. Eur J Clin Nutr. 1998;52(8):588-96.
Konttinen H, Männistö S, Sarlio-Lähteenkorva S, Silventoinen K, Haukkala A. Emotional
eating, depressive symptoms an self-reported food consumption. A population-based study.
Appetite. 2010a;54:473-9.
Konttinen H, Sarlio-Lähteenkorva S, Silventoinen K, Mannisto S, Haukkala A. Emotional
eating and physical activity self-efficacy as pathways in the association between depressive
symptoms and adiposity indicators. Am J Clin Nutr. 2010b;92(5):1031-9.
Kristal AR, Peters U, Potter JD. Is it time to abandon the food frequency questionnaire?
Cancer Epidemiol Biomarkers. Prev. 2005;14(12):2826-8.
Lafay L, Mennen L, Basdevant A, Charles MA, Borys JM, et al. Does energy intake
underreporting involve all kinds of food or only specific food items? Results from the
Fleurbaix Laventie Ville Santé (FLVS) study. Int J Obes Relat Metab Disord.
2000;24(11):1500-6.
Lähteenmäki L, Tuorila H. Three-factor eating questionnaire and the use and liking of sweet
and fat among dieters. Physiol Behav. 1995;57(1):81-8.
de Lauzon-Guillian B, Basdevant A, Romon M, Karlsson J, Borys JM, Charles MA. Is
restrained eating a risk factor for weight gain in a general population? Am J Clin Nutr.
2006;83:132-8.
de Lauzon B, Romon M, Deschamps V, Lafay L, Borys J-M, Karlsson J, et al. Fleurbaix
Laventie Ville Sante Study Group. The three-factor eating questionnaire-R18 is able to
distinguish among different eating patterns in a general population. J Nutr.
2004;134(9):2372-80.
Lee JS, Fischer JG, Johnson MA. Food insecurity, food and nutrition programs, and aging:
experiences from Georgia. J Nutr Elder. 2010;29(2):116-49.
Mangweth-Matzek B, Rupp CI, Hausmann A, Assmayr K, Mariacher E, Kemmler G, et al.
Never too old for eating disorders or body dissatisfaction: a community study of elderly
women. Int J Eat Disord. 2006;39(7):583-6.
McLean JA, Barr SI. Cognitive dietary restraint is associated with eating behaviors, lifestyle
practices, personality characteristics and menstrual irregularity in college women. Appetite.
2003;40(2):185-92.
Nunnally J. Psychometric Theory. 2nd ed. McGraw-Hill; 1978.
61
Penn DM, Fischer JG, Sun Lee J, Hausman DB, Johnson MA. High BMI and waist
circumference are associated with a high prevalence of comorbidities in Older Americans
Act programs in Georgia senior centers. J Nutr Health Aging. 2009;13(9):827-32.
Pereira RF, Alvarenga M. Disordered eating: identifyidng, treating, preventing and
differentiating it from eating disorders. Diabetes Spectr. 2007;20(3):141-8.
Porter KN, Johnson MA. Obesity is more strongly associated with inappropriate eating
behaviors than with mental health in older adults receiving congregate meals. J Nutr Gerontol
Geriatr. 2011;30(4):403-15.
Provencher V, Drapeau V, Tremblay A, Despres JP, Lemieux S. Eating behaviors and
indexes of body composition in men and women from the Quebec family study. Obes Res.
2003;11(6):783-92.
Quigley KK, Hermann JR ,Warde WD. Nutritional risk among Oklahoma congregate meal
participants. J Nutr Educ Behav. 2008;40(2):89-93.
Reba-Harrelson L, Vol Holle A, Hamer RM, Reyes ML, Bulik CM. Patterns and prevalence of disordered eating and weight control behaviors in women ages 25-45. Eat Weight Disord. 2009;14(4):e190-8.
Sahyoun NR, Jacques PF, Dalla DE, Russell RM. Nutrition Screening Initiative checklist
may be a better awareness/educational tool than a screening one. J Am Diet Assoc.
1997;97(7):760-4.
Schaefer EJ, Augustin JL, Schaefer MM, Rasmussen H, Ordovas JM, Dallal GE, et al. Lack
of efficacy of a food-frequency questionnaire in assessing dietary macronutrient intakes in
subjects consuming diets of known composition. Am J Clin Nutr. 2000;71(3):746-51.
van Strien T, Fritjers JER, Bergers GPA, Defares PB. The Dutch Eating Behavior
Questionnaire (DEBQ) for assessment of restrained, emotional, and external eating behavior.
Int J Eat Disord. 1986;5(2):295-315.
Stunkard AJ, Messick S. The three-factor eating questionnaire to measure dietary restraint,
disinhibition and hunger. J Psychosom Res. 1985;29(1):71-83.
Toobert D, Hampson S, Glasgow R. The summary of diabetes self-care activities measure.
Diabetes Care. 2000;23 (7):943-50.
Tucker KL, Chen H, Vogel S, Wilson PW, Schaefer EJ, Lammi-Keefe CJ. Carotenoid
intakes, assessed by dietary questionnaire, are associated with plasma carotenoid
concentrations in an elderly population. J Nutr. 1999;129(2):438-45.
U.S. Department of Agriculture and U.S. Department of Health and Human Services. Dietary
Guidelines for Americans 2010. Washington DC: U.S. Government Printing Office. 2010.
62
http://www.cnpp.usda.gov/Publications/DietaryGuidelines/2010/PolicyDoc/PolicyDoc.pdf
(accessed March 31, 2012).
Villareal DT, Apovian CM, Kushner RF, Klein S, American Society for Nutrition; NAASO:
The Obesity Society. Obesity in older adults: technical review and position statement of the
American Society for Nutrition and NAASO, The Obesity Society. Am J Clin Nutr.
2005;82(5):923-34.
Wansink B, Cheney MM, Chan N. Exploring comfort food preferences across age and
gender. Physiol Behav. 2003;79(4-5):739-47.
Westenhoefer J, Stunkard AJ, Pudel V. Validation of the flexible and rigid control
dimensions of dietary restraint. Int J Eat Disord. 1999;26(1):53-64.
White JV, Dwyer JT, Posner BM, Ham RJ, Lipschitz DA, Wellman NS. Nutrition screening
initiative: development and implementation of the public awareness checklist and screening
tools. J Am Diet Assoc. 1992;92(2):163-7.
Willett W. Invited commentary: comparison of food frequency questionnaires. Am J
Epidemiol. 1998;148(2):1157-9; discussion 1162-5.
Willett W. Commentary: Dietary diaries versus food frequency questionnaires-a case of
undigestible data. Int J Epidemiol. 2001;30(2):317-9.
Wirfält AKE, Jeffery RW, Elmer PJ. Comparison of food frequency questionnaires: the
reduced Block and Willett questionnaires differ in ranking on nutrient intakes. Am J
Epidemiol. 1998;148(12):1148-56.
Wolff JL, Starfield B, Anderson G. Prevalence, expenditures, and complications of multiple
chronic conditions in the elderly. Arch Intern Med. 2002;162(20):2269-76.
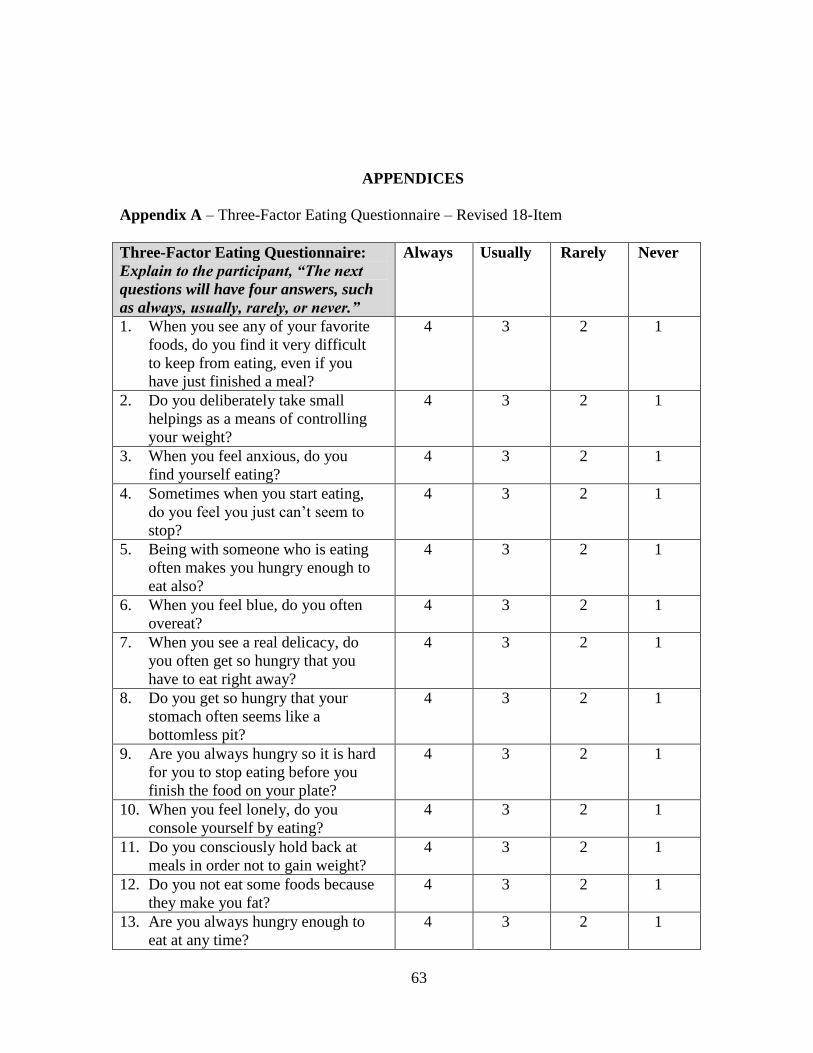
63
APPENDICES
Appendix A – Three-Factor Eating Questionnaire – Revised 18-Item
Three-Factor Eating Questionnaire:
Explain to the participant, “The next
questions will have four answers, such
as always, usually, rarely, or never.”
Always Usually Rarely Never
1. When you see any of your favorite
foods, do you find it very difficult
to keep from eating, even if you
have just finished a meal?
4 3 2 1
2. Do you deliberately take small
helpings as a means of controlling
your weight?
4 3 2 1
3. When you feel anxious, do you
find yourself eating?
4 3 2 1
4. Sometimes when you start eating,
do you feel you just can’t seem to
stop?
4 3 2 1
5. Being with someone who is eating
often makes you hungry enough to
eat also?
4 3 2 1
6. When you feel blue, do you often
overeat?
4 3 2 1
7. When you see a real delicacy, do
you often get so hungry that you
have to eat right away?
4 3 2 1
8. Do you get so hungry that your
stomach often seems like a
bottomless pit?
4 3 2 1
9. Are you always hungry so it is hard
for you to stop eating before you
finish the food on your plate?
4 3 2 1
10. When you feel lonely, do you
console yourself by eating?
4 3 2 1
11. Do you consciously hold back at
meals in order not to gain weight?
4 3 2 1
12. Do you not eat some foods because
they make you fat?
4 3 2 1
13. Are you always hungry enough to
eat at any time?
4 3 2 1

64
14. How often do you feel hungry? Almost
always
(4)
Often
be-
tween
meals
(3)
Some-
times
be-
tween
meals
(2)
Only at
meal
times
(1)
15. How frequently do you avoid
"stocking up" on tempting foods?
Almost
always
(4)
Usually
(3)
Seldom
(2)
Almost
never
(1)
16. How likely are you to consciously
eat less than you want?
Very
likely
(4)
Moder-
ately
likely
(3)
Slightly
likely
(2)
Unlike-
ly
(1)
17. Do you go on eating binges though
you are not hungry?
At least
once a
week
(4)
Some-
times
(3)
Rarely
(2)
Never
(1)
18. Do you feel you are restrained in
your eating? Always restrained
(constantly limiting food intake and
never “giving in”), Usually
restrained, Rarely restrained, or
Never restrained (eating whatever
you want, whenever you want).
Always
(4)
Usually
(3)
Rarely
(2)
Never
(1)
19. The cognitive restraint scale is the sum of items 2, 11, 12, 15, 16, 18.
20. The uncontrolled eating scale is the sum of items 1, 4, 5, 7, 8, 9, 13, 14, and 17.
21. The emotional eating scale is the sum of items 3, 6, and 10.
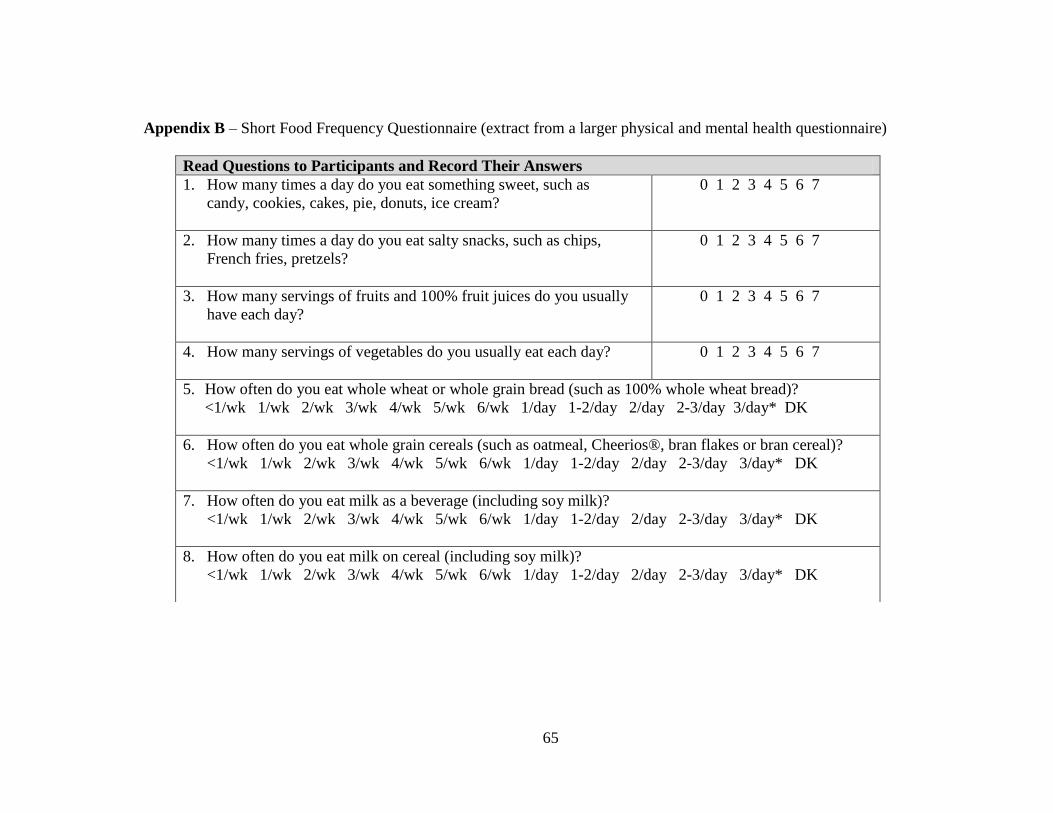
65
Appendix B – Short Food Frequency Questionnaire (extract from a larger physical and mental health questionnaire)
Read Questions to Participants and Record Their Answers
1. How many times a day do you eat something sweet, such as
candy, cookies, cakes, pie, donuts, ice cream?
0 1 2 3 4 5 6 7
2. How many times a day do you eat salty snacks, such as chips,
French fries, pretzels?
0 1 2 3 4 5 6 7
3. How many servings of fruits and 100% fruit juices do you usually
have each day?
0 1 2 3 4 5 6 7
4. How many servings of vegetables do you usually eat each day?
0 1 2 3 4 5 6 7
5. How often do you eat whole wheat or whole grain bread (such as 100% whole wheat bread)?
<1/wk 1/wk 2/wk 3/wk 4/wk 5/wk 6/wk 1/day 1-2/day 2/day 2-3/day 3/day* DK
6. How often do you eat whole grain cereals (such as oatmeal, Cheerios®, bran flakes or bran cereal)?
<1/wk 1/wk 2/wk 3/wk 4/wk 5/wk 6/wk 1/day 1-2/day 2/day 2-3/day 3/day* DK
7. How often do you eat milk as a beverage (including soy milk)?
<1/wk 1/wk 2/wk 3/wk 4/wk 5/wk 6/wk 1/day 1-2/day 2/day 2-3/day 3/day* DK
8. How often do you eat milk on cereal (including soy milk)?
<1/wk 1/wk 2/wk 3/wk 4/wk 5/wk 6/wk 1/day 1-2/day 2/day 2-3/day 3/day* DK


![Mindful Eating and Weight Loss, Results from a Randomized ...Mindful Eating Questionnaire (MEQ) [23] after individuals participate in a 15-week weight management program that incorporates](https://img.pdfslide.net/doc/110x75/600a8eeb4fb9fa7f474a1d2b/mindful-eating-and-weight-loss-results-from-a-randomized-mindful-eating-questionnaire.jpg)