Embed Size (px)
Citation preview

This is a repository copy of The three stages of stress relaxation - Observations for the time-dependent behaviour of brittle rocks based on laboratory testing.
White Rose Research Online URL for this paper:http://eprints.whiterose.ac.uk/112311/
Version: Accepted Version
Article:
Paraskevopoulou, C orcid.org/0000-0002-7063-5592, Perras, M, Diederichs, M et al. (4 more authors) (2017) The three stages of stress relaxation - Observations for the time-dependent behaviour of brittle rocks based on laboratory testing. Engineering Geology, 216. C. pp. 56-75. ISSN 0013-7952
https://doi.org/10.1016/j.enggeo.2016.11.010
For example: © 2017. This manuscript version is made available under the CC-BY-NC-ND 4.0 license http://creativecommons.org/licenses/by-nc-nd/4.0/
[email protected]://eprints.whiterose.ac.uk/
Reuse
Unless indicated otherwise, fulltext items are protected by copyright with all rights reserved. The copyright exception in section 29 of the Copyright, Designs and Patents Act 1988 allows the making of a single copy solely for the purpose of non-commercial research or private study within the limits of fair dealing. The publisher or other rights-holder may allow further reproduction and re-use of this version - refer to the White Rose Research Online record for this item. Where records identify the publisher as the copyright holder, users can verify any specific terms of use on the publisher’s website.
Takedown
If you consider content in White Rose Research Online to be in breach of UK law, please notify us by emailing [email protected] including the URL of the record and the reason for the withdrawal request.

� ����� ��� � ��
The three stages of stress relaxation - Observations for the time-dependentbehaviour of brittle rocks based on laboratory testing
Chrysothemis Paraskevopoulou, Matthew Perras, Mark Diederichs, Flo-rian Amann, Simon Low, Tom Lam, Mark Jensen
PII: S0013-7952(16)30657-3DOI: doi: 10.1016/j.enggeo.2016.11.010Reference: ENGEO 4415
To appear in: Engineering Geology
Received date: 23 April 2016Revised date: 16 September 2016Accepted date: 16 November 2016
Please cite this article as: Paraskevopoulou, Chrysothemis, Perras, Matthew, Diederichs,Mark, Amann, Florian, Low, Simon, Lam, Tom, Jensen, Mark, The three stages of stressrelaxation - Observations for the time-dependent behaviour of brittle rocks based onlaboratory testing, Engineering Geology (2016), doi: 10.1016/j.enggeo.2016.11.010
This is a PDF file of an unedited manuscript that has been accepted for publication.As a service to our customers we are providing this early version of the manuscript.The manuscript will undergo copyediting, typesetting, and review of the resulting proofbefore it is published in its final form. Please note that during the production processerrors may be discovered which could affect the content, and all legal disclaimers thatapply to the journal pertain.

ACC
EPTE
D M
ANU
SCR
IPT
ACCEPTED MANUSCRIPT
Title: The three stages of stress relaxation - Observations for the time-dependent
behaviour of brittle rocks based on laboratory testing
Authors:
Chrysothemis Paraskevopoulou1, Matthew Perras2, Mark Diederichs1, Florian Amann2, Simon
Löw2, Tom Lam3, Mark Jensen3
Corresponding Author:
Chrysothemis Paraskevopoulou
PhD Candidate
Department of Geological Sciences and Geological Engineering, Queen’s University, Kingston,
ON, Canada
email: [email protected], [email protected], [email protected]
telephone: +1 343 333 9241
address : 36 Union St., Miller Hall, Queen’s University, Kingston, ON, Canada K7L3N6
Authors:
Matthew A. Perras
Research Associate and Lecturer in Engineering Geology
Institute of Geology, Swiss Federal Institute of Technology, Zurich, Switzerland
email: [email protected]
Mark S. Diederichs
Professor
Department of Geological Sciences and Geological Engineering, Queen’s University, Kingston,
ON, Canada
email: [email protected]
Florian Amann
Senior Scientist
Institute of Geology, Swiss Federal Institute of Technology, Zurich, Switzerland
email: [email protected]

ACC
EPTE
D M
ANU
SCR
IPT
ACCEPTED MANUSCRIPT
Simon Löw
Professor
Institute of Geology, Swiss Federal Institute of Technology, Zurich, Switzerland
email: [email protected]
Tom Lam
Nuclear Waste Management Organization, Toronto, Ontario, Canada
email: [email protected]
Mark Jensen
Nuclear Waste Management Organization, Toronto, Ontario, Canada
email: [email protected]
Affiliations: 1 Department of Geological Sciences and Geological Engineering, Queen’s University, Kingston,
ON, Canada
2 Institute of Geology, Swiss Federal Institute of Technology, Zurich, Switzerland
3 Nuclear Waste Management Organization, Toronto, ON, Canada
Key words:
time-dependent behaviour, time-dependency, stress relaxation testing, laboratory testing,
stages of stress relaxation, brittle rocks,

ACC
EPTE
D M
ANU
SCR
IPT
ACCEPTED MANUSCRIPT
1 INTRODUCTION (WAS SIMPLIFIED SOME PARTS WERE REMOVED, ACCORDING TO
REVIEWER #1)
Time-dependent behaviour of rock and time-dependent testing methods have been well studied
by many authors at both the laboratory and the tunnel scale (e.g. Wawersik, 1972; Rutter et al.
1978; Chen and Chugh, 1996; Boukharov et al. 1995; Brantut et al. 2013; Ghaboussi and Gioda
1977; Malan, 2002; Schubert et al. 2003; Barla et al. 2010). Time-dependent behaviour of rock
masses have also been studied for landslides (Bizjak and Zupanic, 2007) and forms an
important aspect of the predicted and observed movement of many landslides (Groneng et al.
2010). In a tunnelling environment, long-term time-dependent behaviour can lead to severe
deformation at significant distances behind the face, impacting ground support performance,
tunnelling logistics, and under-estimated preliminary and design stage project costs
(Paraskevopoulou and Benardos, 2013). Time-dependent deformation and behaviour is also
important in the shorter-term, in terms of delayed strain evolution and stress migration within the
near-face region of the tunnel, affecting the optimal timing of support installation and
interpretation of monitoring data. However, in practice most site characterization and laboratory
testing focuses on material properties including strength and deformability within the short
(practically instantaneous) time constraints of standardized testing (ISRM, 1979). The stability
and safety of underground excavations requires such experimental data for numerical prediction
of rock behaviour. Challenges may arise when dealing with in situ stress conditions where time-
dependency issues, such as consolidation, swelling, squeezing, creep or stress relaxation, take
place or when multiple mechanisms occur simultaneously. Goodman (1980) highlighted the
importance of including time as a parameter of rock behaviour analysis.
The purpose of this paper is to give insight into the time-dependent behaviour of brittle rock
materials and the importance of performing laboratory testing, such as stress relaxation tests,
which can be used to determine parameters for input into numerical simulations. This study
focuses on two different types of limestone; the Jurassic limestone from Switzerland, and the
Cobourg limestone from Canada. In the first phase of testing, the Jurassic limestone was used
to examine the testing procedure and the key parameters to be monitored during testing. In a
second phase of testing the time-dependent behaviour of the Cobourg limestone, which is the
potential host rock for a proposed Low and Intermediate Nuclear Waste Repository in Canada,
was examined. According to Damjanac and Fairhurst (2010), a better understanding of the long-
term rock deformability in the design and construction of nuclear waste repositories is a key
behavioural aspect for predicting the ability of the rock to isolate the waste from the biosphere.

ACC
EPTE
D M
ANU
SCR
IPT
ACCEPTED MANUSCRIPT
2 BACKGROUND (SIMPLIFIED, PARAGRAPHS WERE REMOVED, ACCORDING TO
REVIEWER #1)
2.1 Definitions
Time-dependent phenomena can be defined as mechanisms resulting in deforming or
weakening the rock mass over time. In the literature (Barla, 1995; Aydan et al. 1993; Einstein,
1996; Singh 1975) the most widely discussed time-dependent phenomena associated with
tunnelling are creep, consolidation, dilation and swelling. Creep involves time-dependent
distortion (shear strain) without volume change and can result from many complex mechanisms
at the atomic or grain scale. Consolidation is a volume decrease involving the redistribution of
pore fluids or the collapse of pores and open defects. Dilation is the opening of fractures, pores
and defects due to numerous mechanisms including crack damage and dilational shear (with or
without fluid migration). Swelling is a volume change that occurs due to physio-chemical
changes within the rock leading to expansion. These mechanisms can manifest themselves as
apparent visco-elastic (recoverable, time-dependent) behaviour or visco-plastic (non-
recoverable, time-dependent) behaviour. For simplified loading paths, visco-elastic models can
be combined and configured (eg. Lo and Yuen, 1981) in order to phenomenologically simulate
actual deformation that mechanistically may not be purely elastic. Conversely, mechanistic
visco-plastic models can be employed with associated increase in parametric complexity (eg.
Barla et al. 2010).
Tunnel squeezing (Barla, 1995) is an observable result of one or more of the mechanisms
above and is the inelastic closure of the tunnel profile with or without tunnel advance. Some
component of total squeezing can be instantaneous (in practical terms) as a result of short-term
inelastic response to stress change (shearing, dilation), observable after each increment of
tunnel advance. Components of the total deformation may also be delayed due the time-
dependent phenomenon discussed above.
If the support installation is delayed, the rock mass moves into the tunnel and stress
redistribution takes place around it. In contrast, if deformation is restrained through support
installed close to the face, squeezing will lead to delayed load build-up acting on the rock
support system. This build-up will occur regardless of when the support is installed, however,
the magnitude depends on the timing of the support installation (Hoek et al. 2008; Hoek and
Guevara, 2009). Time-dependency can affect the tunnel and support system within the time-
frame of the excavation cycle or it can be observed to continue long after support completion
and tunnel advance.

ACC
EPTE
D M
ANU
SCR
IPT
ACCEPTED MANUSCRIPT
Moreover, during the life span of an underground project, other mechanisms of time-related
effects may take place and influence or change the properties of the excavation damage zone.
This is particularly important in cases where flow through the damage zone is to be minimized,
such as for the case of a nuclear waste repository (Backblom and Conrox, 2008).
2.2 Time-Dependent Models
Researchers generally examine the above mechanisms and responses through laboratory
testing, analytical methods utilizing rheological models comprised of mechanical analogues
and/or empirical models based on curve fitting of experimental data, (Goodman, 1980). The
idealized creep behaviour is often represented mathematically by the Burger’s model, which is
in fact the combination of the Kelvin (delayed manifestation of a constant static response to
altered boundary conditions) and Maxwell (continued strain rate or relaxation over time under
static boundary conditions) models in series (as illustrated in Fig. 1). Deformation that occurs at
constant loading condition through time can be expressed using Eq. 1 (Goodman, 1980), where:
i1 is the axial strain, j1 is the constant axial stress, K is the bulk modulus, さK is Kelvin’s model
viscosity, さM is Maxwell’s model viscosity, GK is Kelvin’s shear modulus, GM is Maxwell’s shear
modulus. さK, さM, GK, GM are the visco-elastic parameters and are considered properties of the
rock. 綱怠岫建岻 噺 態蹄迭苔懲 髪 蹄迭戴弔謎 髪 蹄迭戴弔凪 伐 蹄迭戴弔凪 結貸岫奈嚢俳嚢痛岻 (Eq. 1)
During stress relaxation the strain-state is controlled and remains constant, thus rearranging Eq.
1 for a constant strain component, the material’s stress state is changing according to Eq. 2. 購怠岫建岻 噺 綱怠岷罫暢結貸磐奈謎俳謎痛卑 髪 罫懲結貸磐奈嚢俳嚢痛卑峅 (Eq. 2)
Maxwell and Kelvin models are also mechanical analogues of linear visco-elastic bodies
simulating different material behaviour; when in series however, they comprise the Burger’s
model that is commonly used to simulate creep behaviour.
The Burgers model parameters can be derived from creep test results by fitting the components
to the laboratory data following Goodman’s (1980) approach, for example. According to
Goodman, the visco-elastic parameters (さK, さM, GK, GM) can be estimated by fitting the
experimental results of static load (creep) tests to the mathematical curve of the strain response
of the Burgers model at different time increments and the corresponding strain intercepts.
In reality and embedded in this mathematical concept are the three stages of creep
(summarized by Goodman 1980) that follow the instantaneous response (0th stage) to changed

ACC
EPTE
D M
ANU
SCR
IPT
ACCEPTED MANUSCRIPT
boundary conditions resulting to a constant stress-state. These stages can be interpreted and
simulated as follows:
1st stage or primary or transient creep where the delayed adjustment to a new
equilibrium state takes place through visco-elastic (reversible) deformation, and may be
accompanied by some irreversible behaviour, resulting in strain accumulation with
decreasing rate over time. This stage is commonly simulated with the Kelvin model
analogue.
2nd stage or secondary creep where the material exhibits a consistent strain
accumulation rate over time accompanied by inelastic distortion. The duration or even
existence of this stage can vary depending on the ability of the rock type to transition
from ductile to more brittle materials. The Maxwell visco-elastic model is commonly used
to phenomenologically represent this stage.
3rd stage or tertiary creep where strong non-linear or accelerating strains occur (typically
driving the material to rupture) due to strain-driven weakening, chemically related
strength degradation and/or interaction of growing cracks. Visco-plastic models (Barla et
al. 2010) and/or so-called stress corrosion models (Damjanac and Fairhust, 2010) are
used to simulate tertiary creep.
A combination of Kelvin and Maxwell model components is referred to as the Burgers model
which can be used to simulate stages 1 and 2 in combination.
The three stages of creep have been well studied and occur for many materials and rock types
(Scholz, 1968; Borchert et al. 1984; Goodman, 1980; Ottosen, 1986; Zheng and Weng, 2002).
This conceptual model applies also to relaxation testing data. Therefore, by changing the
boundary conditions of a creep test to a constant strain boundary, conceptually there should
also be three stages of stress relaxation. Adopting the approach described by Goodman (1980),
of determining parameters from static load (creep) tests, the same parameters (i.e. viscosities
and shear moduli) should be derivable from stress relaxation tests, assuming that the rock
material is behaving as a linear visco-elastic Burger’s body in unconfined compression
(illustrated in Fig. 1).
The testing and analysis presented herein focus on stress relaxation testing, i.e., the time-
dependent response of rock under constant (controlled) strain, to understand the behaviour at
the laboratory scale and to verify the hypothesis of three stages of stress relaxation.

ACC
EPTE
D M
ANU
SCR
IPT
ACCEPTED MANUSCRIPT
2.3 Damage Evolution and Failure of Brittle Rocks
The stress relaxation tests were conducted at different axial strain levels which were
representative of driving stress to strength ratios that were determined from baseline
Unconfined Compressive Strength (UCS) testing. UCS testing is governed by the suggested
method from the ISRM (1979) guidelines. Initial analysis was conducted using an average UCS
value from the baseline data and more detailed analysis was conducted using the damage
thresholds, described below, from each individual stress relaxation test.
Ductile deformation processes, including those conventionally associated with creep in
geological materials, involve continuum processes such as dislocation slip or migration of
interstitial atoms and atomic vacancies within crystals, or weak bond migration in clay minerals
(Davis et al. 2012). Such deformation results in distortion (pure or simple shear strain) over
time.
In brittle rocks, however, it is generally accepted that a progressive damage process governs
the failure, which is initially dominated by the initiation and propagation of microcracks in the
direction of the maximum load (Fairhurst and Cook, 1966). In this sense, the primary
manifestation of the initial progressive damage process is non-linear radial extension associated
with comparatively negligible inelastic strain response in the axial loading direction (Bieniawski,
1967).
The stages of the brittle failure process include at least four distinct stages that can be identified
if the stress-strain response is monitored during loading, as shown in Fig. 2. The stages are: i.)
closure of pre-existing cracks; ii) linear elastic behaviour; iii) stable crack growth; and iv)
unstable crack growth, which leads to failure and the peak strength (the point of maximum
stress). Stable crack growth involving cracks aligned parallel to the primary loading direction
initiates at a stress-level that can be defined by analysis of radial strain or acoustic emissions
(Brace et al. 1966; Lajtai, 1998; Eberhardt, 1998; Diederichs et al. 2004). Unstable crack growth
in a UCS sample begins when isolated microcracks interact at a critical crack density (or critical
radial strain) or when conditions exist for propagation of individual cracks significantly beyond
the grain dimension (Martin, 1993; Diederichs, 2003) and ultimately leads to failure. These
damage or crack growth thresholds have been defined by the International Rock Mechanics
Committee on Spall Prediction as CI and CD respectively (Diederichs and Martin, 2010).
Stress-strain curves for brittle rocks can be used to determine the: i) crack initiation stress (CI);
ii) critical damage stress or axial yield stress (CD); and, iii) uniaxial compressive strength (UCS).

ACC
EPTE
D M
ANU
SCR
IPT
ACCEPTED MANUSCRIPT
Many researchers (Bieniawski, 1967; Martin and Chandler, 1994; Martin, 1993; Lajtai, 1998;
Eberhardt, 1998, Diederichs, 1999 and 2003; Diederichs et al. 2004; Diederichs and Martin,
2010, Nicksiar and Martin, 2012; Ghazvinian, 2015) investigated the identification of the
thresholds using various methods (i.e. strain-based or acoustic emission). For instance, the
Crack Initiation (CI) threshold can be determined as the axial stress at reversal point of the
calculated crack volumetric strain according to Diederichs and Martin’s (2010) approach. The
deviation from linearity of the radial strain is another approach used to determine CI (Bieniawski,
1967; Lajtai, 1974; Diederichs et al. 2004), which is free from errors introduced by involving
calculated parameters in the estimation. Critical Damage (CD), the crack coalescence and
interaction threshold (Lockner et al. 1992), is determined as the axial stress at the measured
volumetric strain reversal point (Bieniawski, 1967; Lajtai, 1974; Martin, 1997).
Crack initiation (CI) in a compressive test marks the beginning of the stress-induced damage
process in low porosity brittle rocks. Beyond this point, the cracks initiate in an isolated fashion
at locations where local imperfections lead to internal tensile stress concentrations (Griffith,
1924; Brace et al. 1966; Fonseka et al. 1985). These cracks extend for a limited distance in the
load parallel direction (releasing acoustic emissions and contributing to a non-linear increase in
radial strain as load is increased. At increasing stress levels between CI and CD the cracks
accumulate and grow in a stable manner, with the process arrested in the short-term by a halt in
the load increase. If the load or axial stress is held constant between these thresholds, however,
time-dependent crack growth occurs leading to time-dependent deformation, as illustrated in
Fig. 2. Loading above the critical damage threshold (CD) marks the growth of cracks in an
unstable manner during unconfined compressive testing. If the axial stress is maintained at a
stress level in excess of CD, accelerated creep rates may occur that can lead to a sudden
failure of the specimen (Schmidtke and Lajtai, 1985).
Many researchers (Brace et al. 1966; Podnieks et al. 1968; Beniawski, 1967; Martin, 1997;
Diederichs, 2003, etc.) investigating the inelastic behaviour of rocks indicated that crack
initiation and propagation plays a dominant role in understanding processes related to time-
dependent behaviour. Stress relaxation is one of the phenomena associated with the inelastic
behaviour of rocks, for which the role in rock mechanics has so far only been studied by a few
authors (Peng, 1973; Rutter et al. 1978; Engelder, 1984; Lodus, 1986). This testing method
should also be influenced by crack initiation and propagation processes.

ACC
EPTE
D M
ANU
SCR
IPT
ACCEPTED MANUSCRIPT
2.4 Stress Relaxation of Rocks – Previous Work
According to Hudson and Harrison (1997) creep is defined as increasing strain while the stress
is held constant whereas stress relaxation is defined as decreasing stress while the strain is
held constant. In practice, and especially for the rock near an underground excavation, a rock
element will undergo stress and strain changes during construction and the strain is largely
controlled by the stiffness of the adjacent rock. Time-dependent behaviour will initiate
immediately after excavation and the boundary conditions of rock elements near the excavation
will be somewhere between the ideal conditions (i.e. constant stress or constant strain) leading
to creep and stress relaxation, depending on the location around excavation (Hudson and
Harrison, 1997).
The rock around an underground opening redistributes from a primary stress-state to a
secondary stress-state. As the stress concentration increases during excavation, failure of the
rock may occur and an excavation damage zone develops. After excavation, the rock is then
subjected to this secondary stress-state for a long period of time where time-dependent
processes may take place, influencing the long-term behaviour of the rock and the properties of
the damage zone.
According to Peng and Podnieks (1972) relaxation is the time-dependent behaviour of stress
within a stressed elastic body. It can be demonstrated by holding the deformation constant in
the conventional compressive strength test. To examine the phenomenon of relaxation Peng
and Podnieks (1972) performed relaxation tests on tuff specimens. The testing procedure
involved holding the specimen at constant deformation at points along the stress-strain curve.
The testing results showed that no load drop was observed for samples loaded below stress
levels where the stress-strain curve deviates from linearity (i.e. below the Crack Damage
threshold). However, for points above CD a small load drop was observed and the magnitude of
the load drop increased as the applied load increased. They concluded that the stress relaxation
seems to be closely related to the formation and propagation of cracks.
Peng and Podnieks (1972) also noted that below CD no stress relaxation was observed due to
the fact that the surfaces of the pre-existing microcracks in that region were too small to cause
any appreciable load drop. In addition, Peng (1973) suggested that load relaxation tends to
stabilize the fracture growth within the specimen. More specifically, as the axial deformation is
held constant no external energy is imposed on the specimen, consequently when cracks start
to initiate the load bearing capacity drops and the load must be reduced to prevent any axial
displacement from taking place.

ACC
EPTE
D M
ANU
SCR
IPT
ACCEPTED MANUSCRIPT
Peng (1973) also examined the relaxation behaviour on three rock formations: Arkose
sandstone, Tennessee marble and Berea sandstone. The load was increased until a macro-
crack initiated in the post-failure region. The strain was then held constant and the stress drop
was monitored. When the stress relaxation attains an asymptotic level as shown in Fig. 3 then,
as Peng (1973) stated, the stabilization of crack propagation is achieved. In addition, the
relaxation behaviour of rock indicates that the fractured rock will attain new equilibrium if
sufficient time is given for load relaxation to occur.
Lodus (1986) examined how the rate of drill-ability during excavation correlates with the stress
relaxation pattern within the rock mass by conducting relaxation tests on potassium salt and
marble under uniaxial compressive loading conditions. The results showed that the materials
exhibited more relaxation when subjected to higher stress levels, as shown in Fig. 3. Lodus
(1986) concluded that the energy release due to stress relaxation in an underground opening
could be controlled by reducing the speed of the mechanical tool into the working face and
could be directly evaluated from data acquired from relaxation testing.
Li and Xia (2000) performed a series of relaxation tests in uniaxial compression on a red
sandstone, from the Emei Mountain area in the Sichuan province of China, and claystone, from
the Shenbei coal field in the Liaoning province of China, which are shown in Figure 5-3. It was
observed from their study that both rock types when subjected to stress levels above 75% of
their uniaxial compressive strength failed under constant strain conditions but still exhibited
residual resistance. Li and Xia (2000) suggested that this observation could be used to interpret
the behaviour and assess the load bearing capacity of the pillars in mine sites.
3 LABORATORY TESTING PROGRAM AND METHODS
3.1 Sample Descriptions
The selected Jurassic limestone comes from a quarry north of Zurich, Switzerland, in the tabular
Jura (Fig. 4.a). The samples are a fossile rich packstone, following the classification system of
Dunham (1962), with variable sized vugs ranging from 0.1 – 3 mm and pyrite rich crystal
patches. There are also lime-mudstone blebs ranging from 5 – 30 mm in diameter, mixed within
the packstone framework. 55.6 mm diameter samples were cored from a block measuring 500 x
500 x 150 mm, such that the core long axes (before end face grinding) were 150 mm long. All
the samples were prepared according to the ISRM (1979) requirements.
The Cobourg limestone (Fig. 4.b) comes from the Bowmanville quarry, near Bowmanville,
Ontario, Canada. It is Middle to upper Ordovician in age and also known as the Lindsay

ACC
EPTE
D M
ANU
SCR
IPT
ACCEPTED MANUSCRIPT
Formation in south-central and eastern Ontario. It is of very low porosity, typically < 2% total
porosity (Sterling et al. 2011). The limestone has a characteristic mottled texture, with the light
gray areas being a fossil rich lime-packstone and the dark gray being argillaceous lime-
mudstone. A block measuring 400 x 400 x 700 mm was cored perpendicular to the irregular
bedding marked by the argillaceous banding. Due to the limited volume of material for testing,
not all samples were 150 mm long (before end face grinding), such that the height to diameter
ratio ranges between 2.0 and 3.0. All other sample preparation procedures were conducted
according to the ISRM (1979) requirement.
3.2 Baseline Testing
Baseline Unconfined Compressive Strength (UCS) tests were conducted on 10 cylindrical
samples of Jurassic limestone and 9 cylindrical samples of Cobourg limestone. A modified 2000
kN Walter and Bai servo-controlled rock testing device was utilized. Load was applied in such a
way as to maintain a constant radial displacement rate of 0.01 mm/min. Radial displacement
was measured using single strain gauge that was attached to a chain wrapped around the mid
height of the specimens and the axial strain was measured on the sample surface using two
strain gauges at opposite sides of the specimen.
3.3 Determination of brittle stress thresholds
Baseline Unconfined Compressive Strength (UCS) testing was performed on both Jurassic
limestone and Cobourg limestone to determine the damage thresholds, Crack Initiation (CI) and
Critical Damage (CD), and the peak strength using strain based methods. Several methods
were adopted to determine CI and CD values. More specifically, Lajtai’s (1974) radial strain
method and Diederichs and Martin (2010) crack volumetric strain approach were used to
determine CI thresholds and Lajtai’s (1974) axial strain method and Bieniawski’s (1967)
volumetric strain reversal method were used for CD respectively in UCS tests. The results were
used to determine the load levels for the relaxation testing series.
From the relaxation testing the data collected during the initial loading were used to determine
the Crack Damage thresholds and elastic properties where applicable (i.e. those loaded above
CI). The damage thresholds identified in the relaxation tests, using Lajtai’s (1974) methods,
were closer to the baseline values estimated from UCS testing.
3.4 Defining strain thresholds
The driving stress-ratio has been defined as the axially applied stress level, at a particular stage
in the test, normalized to the average UCS (so-called instantaneous response measured

ACC
EPTE
D M
ANU
SCR
IPT
ACCEPTED MANUSCRIPT
according to ISRM, 1979 standards) and has been used by many other researchers (Schmidtke
and Lajtai, 1985; Lajtai et al. 1991; Lau and Chandler, 2004; Potyondy, 2007; Damjanac and
Fairhurst, 2010) to present long-term (time-dependent) testing results acquired from creep tests.
In order to determine the desired (target) load stress for the start of the relaxation test, the
results from the UCS testing (baseline samples) were used as a reference to find the equivalent
axial displacement or radial displacement (to be used for machine control) in the relaxation
tests. The actual stress level in the sample used for relaxation testing differed (due to material
variability) from the target value by +/- 0.05 to 0.1 MPa, depending on the sample.
3.5 Relaxation Testing under Compression and Testing Procedure
The procedure of the relaxation testing performed and presented in this paper was adapted
from the ASTM (2013) guidelines for structural elements to make it applicable to rock testing.
There is not a suggested testing method for relaxation testing on rocks available from the ISRM.
During the relaxation testing series the lab conditions were monitored and it should be noted
that overall the temperature and humidity conditions were generally maintained within a range
with an average total change of +/- 0.7 oC and 3.5%, respectively.
The first goal of the testing program was to examine the most appropriate method to conduct a
relaxation test on a servo-controlled uniaxial testing machine (Walter and Bai - 2000kN). The
stress relaxation behaviour was examined under both axial strain-controlled and radial strain-
controlled conditions. In the former case, the axial strain was kept constant when the desired
load was reached while in the latter case the radial strain was kept constant. Multi-step and
single-step load tests were conducted. All tests have been performed at stress levels between
CI (or close to CI) and CD. Table 1 summarizes the samples that were tested under the various
conditions.
Two test series have been performed: in a first series Jurassic limestone was utilized to
examine the applicability of various testing procedures (i.e. axial strain-controlled, radial strain-
controlled, multi-step and single-step) for assessing the long-term relaxation behaviour. As a
consequence of the analysis of the first test series, the second test series on Cobourg limestone
was performed utilizing a single-step axial strain-controlled testing procedure.
3.5.1 Axial strain-controlled relaxation tests
3.5.1.1 Multi-step
Multi-step tests were first conducted on 2 Jurassic limestone samples to understand the
behaviour without using many samples. Both consisted of 10 different load levels with the

ACC
EPTE
D M
ANU
SCR
IPT
ACCEPTED MANUSCRIPT
second test load levels overlapping but becoming higher than the first test. The duration of each
level varied from 6 hours to just over 24 hours. The hold time during each test depended on the
sample’s behaviour; and the test was terminated when the load had reached a constant value
where no further load decay (relaxation) was observed.
3.5.1.2 Single-step
Single-step load tests at comparable driving stress ratios as the multi-step load levels were
conducted on14 samples of Jurassic limestone and 16 samples of Cobourg were tested. It
should be stated that the Jurassic samples needed less time to reach linearity in terms of stress
relaxation than the Cobourg samples. As a general trend the Jurassic limestone relaxed within 6
to 24 hours and the Cobourg limestone needed at least 24 to 48 hours, depending on the stress
level to which the sample was subjected.
3.5.2 Radial strain-controlled relaxation tests
3.5.2.1 Multi-step
Another aspect of the testing series presented herein was to examine the rock’s relaxation
response under radial strain-controlled conditions where the radial strain was kept constant and
the axial stress and axial strain were monitored. This testing series included only 3 multi-step
tests on Jurassic limestone samples. All of the samples were tested at different load levels, two
samples were each tested under eight different load levels and one under two load levels. The
hold time differed as the relaxation response of the material under constant radial strain varied
more significantly than the axial, as discussed in the following sections.
4 LABORATORY RESULTS
4.1 Baseline testing and Damage thresholds
The stress-strain relationships of the 10 UCS tests on Jurassic and the 9 UCS tests on Cobourg
limestone are shown in Fig. 5, top and bottom, respectively. The average values estimated for
UCS, CD and CI were 103 MPa, 91 MPa, 39 MPa respectively for the Jurassic limestone and
125 MPa, 111 MPa and 50 MPa for the Cobourg limestone. The results are summarized in
Table A.1 (see Appendices).
4.2 Relaxation Testing
Selective results are presented in this section serving as examples to describe the main
influencing factors during the relaxation process of the two rock types. In these tests, a target

ACC
EPTE
D M
ANU
SCR
IPT
ACCEPTED MANUSCRIPT
constant axial or radial strain is achieved and maintained by controlling the applied axial force
(allowing the applied stress in the sample to rise or fall) through a feedback loop involving
measured axial or radial strain depending on the test configuration.
4.2.1 Axial Strain Controlled Tests
In these tests the target is constant axial strain (maintained by modulating axial force).
4.2.1.1 Multi-step
The decrease in stress relaxation and the change in radial strain for each load level are
illustrated in Fig. 6 on the two samples (i.e. Jura_25R and Jura_26R).
Most tests reached linearity, a steady load level, where no further load decrease took place
(stress relaxation terminated) within the first 6 hours of testing as shown in Figure 5-6, although
most stages were held longer. It was also observed that the relaxation time of each step varied
in relation to the initial applied load, as the load increases the relaxation time increased as well.
4.2.1.2 Single-Step
A selection of the relaxation results of Jurassic and Cobourg samples with respect to stress
decrease and radial strain are shown in Fig. 7. It should be stated that the Jurassic samples
needed less time to reach linearity in terms of stress relaxation than did the Cobourg samples.
Considering the data presented in Fig. 7, given that both rock types were subjected to
approximately the same initial load, the duration is likely related to the stiffness of the samples.
For the same applied load, the axial strain of the Cobourg sample is 0.1% larger than the
Jurassic sample. This means that the amount of strain energy stored in the Cobourg sample is
greater than that of the Jurassic sample and therefore requires more time to dissipate. The
difference in stiffness can be attributed to the argillaceous content of the Cobourg samples
(Armstrong and Carter, 2006). It was observed that the samples relaxed within the first hour
when subjected to a stress level below CI for both rock types, and as the stress levels
approached the CD stress level, the time needed to relax increased relative to the stress
increase as was also seen in the multi-step series.
4.2.2 Single-Step vs. Multi-step tests
The multi-step tests showed that the initial stress relaxation was less than the stress reduction
observed in the single-step tests at the same load level. It was observed that for the initial load
steps in the multi-step tests below CI, shown in Fig. 8, that there was little stress relaxation even
for the initial load step (indicated with the light blue lines in Fig. 8). However, when loaded
above CI, both the first step of a multi-step test and all single-step tests exhibited stress

ACC
EPTE
D M
ANU
SCR
IPT
ACCEPTED MANUSCRIPT
relaxation and also showed circumferential deformation, decrease in radial strain with time. This
is attributed to the damage evolution within the sample where elastic behaviour governs at load
levels below or close to CI and plastic behaviour governs above CI. What is also observed (Fig.
8) is that there is little stress relaxation or change in radial strain for additional steps in the multi-
step tests. For this reason, the authors initially considered that the single-step test method
should be preferred over the multi-step method when trying to determine the maximum
expected relaxation at a given load level.
Time-dependent change in radial strain was observed in some of the relaxation tests as well,
where the radial strain decreased initially following the typical trend and once stress relaxation
ceased the radial strains began to increase once again; for instance, the behaviour of
Jura_26R-g or Jura_25R-e (Fig. 8). The latter was typically observed for the multi-step tests.
For both the single and multi-step tests a continued decrease in radial strain was also observed
after the stress had relaxed (end of non-linear stress and radial strain changes) and reached
linearity; for instance, the behaviour of Jura_30R and Jura_33R shown in Fig. 9.
This has been attributed to a delayed relaxation response and further testing, in combination
with creep tests, are required to fully understand the time-dependent mechanisms acting on the
sample in this phase of the relaxation test.
This has been attributed to a delayed relaxation response and further testing, in combination
with creep tests, are required to fully understand the time-dependent mechanisms acting on the
sample in this phase of the relaxation test.
4.3 Radial Strain Controlled Tests
In these tests a target constant radial strain is achieved and maintained by modulating the axial
force applied by the piston.
The results of two samples (Jura_02R and Jura_07R) under radial strain-controlled conditions
during relaxation are shown in Fig. 10. It was observed that during the first load step the stress
increased and no stress relaxation took place. This also occurred for the second step of the
multi-step test on Jura_02R (Fig. 10).
It is can be seen from Figure 5-10 that the samples behaviour do not show a uniform behaviour,
and is inconsistent with both applied stress levels and time, as stress relaxation is not observed
in all stages. It is also inferred that radial strain-controlled conditions provide a small amount of
confinement which cannot be quantified and more complex mechanisms take place in these
conditions that are closely related to the closure of pre-existing cracks, the initiation, growth and

ACC
EPTE
D M
ANU
SCR
IPT
ACCEPTED MANUSCRIPT
propagation of new cracks in relation to the feedback oscillation. Under compression, the cracks
within the sample tend to open normal to the specimen long axis, but the radial strain is kept
constant and as a result the crack growth is prohibited.
The axial stress readings in the radial strain-controlled tests (Fig. 10) fluctuate more than in the
axial strain-controlled tests (Fig. 6, 7, 8) because of the feedback delay. This appears to be a
small delay in the feedback loop of the servo-machine as the result of the fact that the target
constant strain (radial) is perpendicular to the controlling load (axial) and that the mechanistic
connection between the radial strain and applied load is less direct than in the axial strain-
controlled test. This physical response delay and the resultant control challenges results in more
oscillation of the radial strain-controlled test than in an axial strain-controlled test. It was
expected that there would be less relaxation under radial strain-controlled conditions as the
crack growth is suppressed to some extent but some cracks are allowed to grow because there
are small changes in the radial strain occurring as the feedback mechanism requires an
oscillation and stress relaxation sometimes takes place, although in an inconsistent manner.
4.4 Effect of Temperature and Humidity
Temperature and humidity changes are known to cause strain of limestone and other rocks (for
example: Harvey, 1966; Pimienta et al. 2014). The temperature in the laboratory environment
was controlled and both temperature and the humidity were recorded during the testing. The
stress and the strain response to temperature and humidity change during an axial strain-
controlled single-step test on a sample of Jurassic limestone is presented in Fig. 11. The
sample (Jura_28R) presented herein was selected as an example to show the change in the
laboratory conditions during relaxation testing does not have a great impact on the material’s
behaviour with respect to the magnitude of the relaxation.
As a general trend, the changes in both temperature and humidity during tests did not affect the
results. This is clearly shown in Fig. 11.b where the change in axial stress and volumetric strain
in relation to the change of temperature and humidity is presented. Additionally, it should be
stated that temperature and humidity changes showed no general trend and their influence at
the measured resolution could be considered negligible as implied from Fig. 11.
The overall change of both temperature and humidity of the tests during the relaxation period is
summarized in Table A.2 (see Appendices).
ACC
EPTE
D M
ANU
SCR
IPT
ACCEPTED MANUSCRIPT
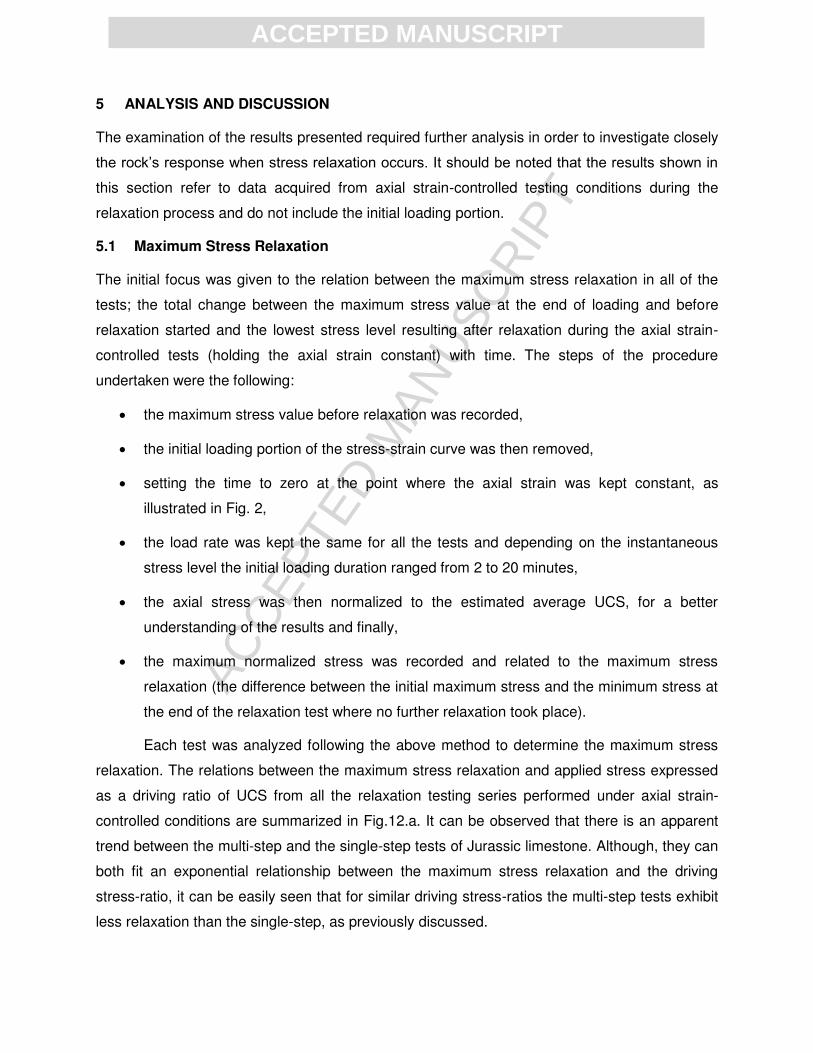
5 ANALYSIS AND DISCUSSION
The examination of the results presented required further analysis in order to investigate closely
the rock’s response when stress relaxation occurs. It should be noted that the results shown in
this section refer to data acquired from axial strain-controlled testing conditions during the
relaxation process and do not include the initial loading portion.
5.1 Maximum Stress Relaxation
The initial focus was given to the relation between the maximum stress relaxation in all of the
tests; the total change between the maximum stress value at the end of loading and before
relaxation started and the lowest stress level resulting after relaxation during the axial strain-
controlled tests (holding the axial strain constant) with time. The steps of the procedure
undertaken were the following:
the maximum stress value before relaxation was recorded,
the initial loading portion of the stress-strain curve was then removed,
setting the time to zero at the point where the axial strain was kept constant, as
illustrated in Fig. 2,
the load rate was kept the same for all the tests and depending on the instantaneous
stress level the initial loading duration ranged from 2 to 20 minutes,
the axial stress was then normalized to the estimated average UCS, for a better
understanding of the results and finally,
the maximum normalized stress was recorded and related to the maximum stress
relaxation (the difference between the initial maximum stress and the minimum stress at
the end of the relaxation test where no further relaxation took place).
Each test was analyzed following the above method to determine the maximum stress
relaxation. The relations between the maximum stress relaxation and applied stress expressed
as a driving ratio of UCS from all the relaxation testing series performed under axial strain-
controlled conditions are summarized in Fig.12.a. It can be observed that there is an apparent
trend between the multi-step and the single-step tests of Jurassic limestone. Although, they can
both fit an exponential relationship between the maximum stress relaxation and the driving
stress-ratio, it can be easily seen that for similar driving stress-ratios the multi-step tests exhibit
less relaxation than the single-step, as previously discussed.

ACC
EPTE
D M
ANU
SCR
IPT
ACCEPTED MANUSCRIPT
The mechanism of the initial drop in stress which occurs rapidly for the first step of any test
(multi- or single-step) was attributed to be associated with the elastic energy within the sample
and load system. Considering this point, a correction procedure was developed to see if the
multi-step maximum stress relaxation results could be corrected to the equivalent single-step at
the same load level. Since the stress drop was associated with only the initial load stage, this
stress drop was added to all subsequent load steps in the multi-step tests, which is shown (Fig.
12.a) as the corrected multi-step series. The corrected multi-step series exhibits similar amounts
of stress relaxation compared with the single-step relaxation at a similar load level. Therefore,
both single- and multi-step test procedures yield similar trends, when corrected, with increasing
driving stress and the multi-step tests can be conducted when limited samples are available. As
it has been already discussed, the Cobourg limestone shows a higher relaxation sensitivity as it
exhibits more stress relaxation than the Jurassic limestone at the same stress levels.
Note that the stress results shown in Fig.12.a in the horizontal axes were normalized by the
peak strength (UCS); however, some samples ended up having values greater than 1 since the
average baseline UCS value was used. The results were then normalized to the Crack Initiation
threshold (CI), as it was determined from the initial loading part of each relaxation test In
Fig.12.b., it is seen that there is an improvement in the fit for the Cobourg samples (higher value
of the coefficient of determination R2) when normalizing by CI which is a directly derived value
from the tested specimen and not an average value from the UCS testing. However, for the
Jurassic limestone the derived CI values from the relaxation tests were more consistent so the
R2 values for the fitted curves have similar values. For these reasons, the authors decided to
introduce the Crack Initiation Stress-Ratio (CISR) by normalizing the applied stress by the CI
value measured on the relaxation sample, where possible, and where loading was below CI the
average CI from the baseline UCS testing was taken. Normalization for each relaxation test is
shown in Fig.12.b, with the values presented in Table A.3 (see Appendices).
Moreover, the time-dependent behaviour discussed in this paper is interpreted to be, in
part, the result of the behaviour of new microcracks, the intensity of which impacts the final UCS
value (Diederichs, 2003). Since the loading phase typically went above the CI level, then new
microcracks should form, at least during the loading phase. Since the radial strain is decreasing
during relaxation, new microcracks are not likely forming or if they are, not in great enough
density to result inincreasing the radial strain. It is perhaps possible that existing microcracks
are extending, however, future testing could use acoustic emission detection to determine what
is happening in terms of new or growth of existing microcracks during relaxation.

ACC
EPTE
D M
ANU
SCR
IPT
ACCEPTED MANUSCRIPT
5.2 Defining the three stages of stress-relaxation
All the single staged test results showed a similar behaviour during stress relaxation, for both
the Jurassic and Cobourg samples. This behaviour can be characterized by three distinct
stages, which were observed in the stress relaxation versus time graphs. The three stages from
the test results performed on a Jurassic sample under axial strain-controlled conditions are
illustrated in Fig. 13. The three stages can also be observed in the radial strain response with
time, although there is a slight delay during the transition from stage to stage when compared to
the transition time of the stress relaxation shown as dt in Fig. 13 and 14.
The authors define and describe the three stages of stress relaxation in Fig. 14. When the axial
deformation is kept constant the stress relaxes with a decreasing rate, this period is defined as
the first stage of stress relaxation (RI). At the end of this stage the stress decrease approaches
a constant rate which marks the transition to the second stage (RII). The third stage of relaxation
(RIII) follows where no further stress relaxation is measureable. At this stage the stress reaches
an asymptote and the stress relaxation process is effectively complete, which has been
observed by others (for example: Peng, 1973; Rutter, 1978; Hao et al. 2014). It was observed
that some samples did not exhibit the second stage of relaxation (RII), as is further discussed in
the following sections.
In addition, the radial strain does not always reach an asymptote, even if the stress is constant,
when the third stage of stress relaxation is reached. In this case the material is subject to a
practically constant axial stress state with ongoing additional absolute radial strain decrease.
This response is possibly related to a combination of three-dimensional visco-elastic response
and crack behaviour during stable propagation (in the axial direction) under constant axial
strain.
5.3 Investigating the three stages of stress relaxation
In this section focus is placed on the material’s behaviour during each stage of stress relaxation.
The analysis presented examines each stage of relaxation as a percentage of the total
behaviour. Each lab testing series is examined and analyzed separately at the beginning and
the results are combined after for discussion.
In the following figures, (Fig. 15, 16, 17, 18, 19), the initial applied stress is normalized to the CI
value derived from each test, defined previously as the Crack Initiation Stress-Ratio. The stress
relaxation (drop) from the applied stress (initial stress-state) for both multi-step and single-step
test series for each stage of relaxation are shown in Figure 5-15. The multi-step series (Fig.

ACC
EPTE
D M
ANU
SCR
IPT
ACCEPTED MANUSCRIPT
15.a) exhibits less relaxation than the single-step for Jurassic limestone (Fig. 15.b). It is clearly
seen that the Cobourg limestone (Fig. 15.c) exhibited more stress relaxation as previously
discussed. It was also noticed that the Jurassic limestone was subjected to a higher stress level
to achieve the same Crack Initiation stress-ratio as with the Cobourg.
The latter could be related to the magnitude of the CI value for each rock type. It is inferred in
Fig. 15 that below the elastic limit, both rock formations are exhibiting similar stress relaxation
and as the stress level increases the behaviour of the two rock types start to deviate.
During each relaxation stage it was observed that a certain amount of stress relaxation (a
percentage of the total stress relaxation, RT) takes place. The magnitude of the relaxation was
examined for each stage of relaxation shown in Fig. 16 as a percentage of the total relaxation.
It can be seen in Fig. 16 that 55% (when the applied stress is closer to CD value) to almost
100% (when the applied stress is below and closer to CI value) of the total stress relaxation (RT)
occurs during the first stage (RI). While the rest (5% to 45%) of the total stress relaxation takes
place during the second (RII) or third stage (RIII). There is not always a clear distinction between
the two stages (RII and RIII) since it was observed that some samples did not exhibit a second
stage (RII) and transitioned directly to the third stage (RIII) (Fig. 16).
It should be stated here that there is not a clear trend on how the radial strain follows the stress
relaxation between the stages in relation to the total radial change, since not all the samples
reached a constant value in radial strain and they transitioned into another time-dependent
process i.e. creep. In addition, the mechanisms that take place during stress relaxation that lead
to displacements and strains are complex, as has been previously found. Fig. 17 shows that the
change in radial strain between the stress relaxation stages for the Cobourg limestone does not
follow a consistent pattern between the three stages making it difficult for clear conclusions to
be derived. As has been discussed, there is a delay in response of the radial strain in relation to
the stress relaxation between the three stages. As crack initiation stress-ratio (j/CI) approaches
values of 2.00 which corresponds to the critical damage threshold where crack growth takes
place, radial strain cannot be characterized by a clear trend between the three stages of
relaxation, as shown in Fig. 17.
The material’s response during a relaxation test is summarized in Fig. 18. It illustrates how
much time is needed for the stress to relax in relation to the initial applied stress during each
stage.

ACC
EPTE
D M
ANU
SCR
IPT
ACCEPTED MANUSCRIPT
A 5% to 30% stress drop of the initial stress state during 10 to 80% of the total relaxation time
occurs during the first stage (RI), as seen in Fig.18. During the second stage (RII) the stress
relaxes less than 10-15% of the initial stress within 20 to 100% of the total relaxation time
depending on which the test had reached the third stage and relaxation had been terminated.
The third stage (RIII) begins at 20% to 80% during which less than 10% relaxation of the initial
stress takes place. It is also noticed that the first stage (RI) has the shortest duration compared
to the other two stages (RII and RIII) as shown in Fig. 18. It is interpreted from the stress-strain
curves during the loading stage that the duration of the first stage (RI) is influenced by pre-
existing damage and to a lesser extent on the accumulated damage dependent on the initial
applied stress level.
The relation between the magnitude of stress relaxation occurring in each stage in comparison
to the initial applied stress is shown in Figure 5-19. It can be noted that during the first stage (RI)
below the CI threshold, approximately 5% to 20% of stress relaxation (comparing to the initial
stress) is observed. When the crack initiation stress-ratio is below 0.5, up to 30% of the stress
relaxation occurs in the first stage. In this region the presence of pre-existing cracks creates
more free surfaces to act as springs and the applied stress is not large enough to completely
close or propagate the pre-existing cracks, which could cause increased stress relaxation.
During the other two stages (RII and RIII) the stress drops less than 10% of the initial stress. As
the applied stress increases the closure of pre-existing cracks takes place and the transition to
the plastic behaviour occurs as the initial stress approaches the CD value. To understand this
and relaxation behaviour in more detail the laboratory results presented in this paper were
compared with existing relaxation testing from the literature.
5.4 Estimating and predicting the relaxation behaviour of rocks
The authors also examined the relationship between standard mechanical properties and the
stress relaxation behaviour of the samples tested as part of this research and other rock types
reported in the literature. Focus was given to relating both the Crack Initiation Stress-ratio and
the elastic Young’s Modulus to the maximum stress relaxation and the time period to terminate
the relaxation process (i.e. when the stress drop reaches a constant value). The Young’s
Modulus was normalized to CI and is referred as the Young’s Modulus Stress-ratio (E/CI). The
selection of the two parameters (CI and Young’s Modulus) was made as they can be easily
estimated from a relaxation test or from reported values available in literature. The dataset used
was primarily focused on the lab results acquired from the relaxation testing on the two different
types of limestone (Jurassic and Cobourg) and later was enriched using uniaxial relaxation

ACC
EPTE
D M
ANU
SCR
IPT
ACCEPTED MANUSCRIPT
testing data on various rock types from previous research as shown in Fig. 3 (Peng and
Podnieks, 1972; Peng 1973, Lodus, 1986; Li and Xia, 2000; MODEX, 2002). Knowing the
values of either the Young’s Modulus or CI, one can estimate the maximum stress relaxation
and predict the time that the relaxation is going to occur using the graphs in Fig. 20.
Regarding the data adopted from other researchers presented in Fig. 20 it should be stated that
a direct estimation of the CI values from published data was not feasible in all cases. In cases
where this was not possible (Peng and Podnieks, 1972; Peng, 1973; Lodus, 1986; Li and Xia,
2000; MODEX, 2002) an estimated value of 40% of the UCS (as per Martin et al. 1999) was
used to present the data in a clearer manner.
The trend line shown in Fig. 20.a fits well with the limestone samples tested in this research.
However, the rock types showing a higher relaxation potential (e.g. marble, potassium salt, tuff)
follow a different trend. The latter is related to the stiffness of the samples as shown in Fig. 20.b.
It can be possible then to estimate a rough relaxation behaviour from standard test data. It is
recommended that both graphs (Fig. 20.a and b) to be used for estimating the maximum stress
relaxation behaviour for a target stress state.
The time needed for the stress to completely relax, is shown Fig. 20.c. It is shown that for some
cases (eg. Red sandstone, Arkose sandstone) the time to relaxation decreases as the applied
stress increases (initial target stress). This could be attributed to the fact that the stress increase
fractures the rock, generating more free surfaces for the stress to relax. The influence of
material’s stiffness on the relaxation time is shown in Fig. 20.d. It could be inferred that as the
material becomes more brittle the stress requires less time to relax. This could explain the fact
that the Jurassic limestone needed less time to relax than the Cobourg limestone.
As illustrated in Figure 5-1, stress relaxation tests results, as discussed, can be used to
determine parameters used as inputs in numerical simulations for the time-dependent behaviour
of brittle rocks assuming that the material behaviour can be phenomenologically simulated as a
linear visco-elastic Burgers body. The input parameters are directly related to the values of time-
to-relaxation and the magnitude of maximum relaxation (stress drop). These two values are
examined in this paper using relaxation test data. In the absence of such data, Fig. 20 can be
used to estimate the relaxation behaviour of a material based on conventional mechanical
parameters.
Finally, stress relaxation can govern the behaviour of the pillars in mining environments or
control the face stability in tunnelling. For instance, the in situ conditions cannot be described

ACC
EPTE
D M
ANU
SCR
IPT
ACCEPTED MANUSCRIPT
solely by stress-controlled conditions (constant deviatoric stress during creep behaviour) as
stress relaxation (strain-controlled conditions) may also occur close to the tunnel face and the
overall behaviour of the rock mass can be the result of various time-dependent phenomena in
combination. In this regard, this database serves as a first attempt to give more insight into the
relaxation behaviour of rocks and could be used by engineers and scientists at the preliminary
design stages of underground projects.
CONCLUDING REMARKS (WERE SIMPLIFIED, according to Reviewer #1)
Relaxation is the decrease of applied load at a constant deformation. A relaxation test
represents an inversion of the behaviour observed in more common creep testing. This paper
evaluates and describes the possible procedures that could be used to conduct a relaxation
test.
Relaxation is the decrease of applied load at a constant deformation. A relaxation test
represents an inversion of the behaviour observed in more common creep testing. This paper
evaluates and describes the possible procedures that could be used to conduct a relaxation
test.
It was determined that axial strain-controlled tests provided a more consistent relaxation
response and were less sensitive to testing and control challenges.
Single-step tests are practically more convenient but require more samples to obtain the full
spectrum of behaviour over the full range of loading magnitudes. Multi-step testing has an
advantage in that many data points at different stress levels can be obtained from the same
sample. The authors observed that the single-step tests exhibit more stress relaxation and
should be preferred to a multi-step test unless the results of the multi-step test are corrected by
adding the amount of stress relaxation which occurred in the initial load-stage to each
subsequent stage individually.
For either single or multi-step test (axial control), a testing and data analysis procedure has
been outlined (Section 5.1) and demonstrated.
For comparison of data from different samples (or different rock types), the maximum relaxation
and applied stress levels should be normalized to the crack initiation threshold CI for improved
consistency (as compared to UCS).
Load relaxation occurs whenever a crack is initiated, and when stress relaxation attains an
asymptotic value, then the stabilization of crack propagation is achieved. The results showed

ACC
EPTE
D M
ANU
SCR
IPT
ACCEPTED MANUSCRIPT
that the Jurassic limestone relaxes within 6 to 24 hours and the Cobourg limestone needs at
least 24 to 48 hours, depending on the stress level the sample is subjected. The samples
relaxed within the first hour when subjected to a stress level below CI for both rock types and as
the stress level approached the CD stress level the time needed to relax increased relative to
the stress increase.
Results of this study demonstrate that there are three distinct stages of time-dependent
behaviour observed in relaxation tests based on the standard UCS test configuration for rock.
The authors introduced and defined the three stages (RI, RII, and RIII) of stress relaxation. The
first two stages are linked to the counterpart stages in the creep test (constant stress). The third
stage in the relaxation test presents a very different (inherently stable) behaviour. A comparison
of the two testing behaviours is shown in Fig. 21.
Examining the data in detail, it was observed that 55% (when the applied stress is closer to CD
value) to almost 100% (when the applied stress is below and closer to CI value) of the total
stress relaxation (RT) occurs during the first stage (RI). It was also shown that below CI
threshold during the first stage (RI), an approximate of 5% to 20% of stress relaxation
(comparing to the initial stress) is expected while for the other two stages (RII and RIII) the stress
drops less than 10% of the initial stress. Closer to the elastic region, however, it was observed
the stress relaxes 30% of the initial stress implying the presence of pre-existence damage in the
samples. The closure of the pre-existing cracks takes place with the initial applied stress
increase and the transition to the plastic behaviour occurs as the initial stress approaches the
CD value.
The study presents a well-defined approach to estimate the maximum stress relaxation and
predict the time of the relaxation of various rock formations using the CI value and the Young’s
Modulus.
This analysis presented herein described the procedure and examined the controlling factors
during relaxation testing, discussed the stress relaxation process, defined an analysis method
and related the results to previous studies available in the literature and confirmed the existence
of the three distinct stages during the relaxation process. Further research is required on the
topic to investigate parameters, for instance the change of the rates within the relaxation stages
that could better describe the time-dependent behaviour of rocks creating a database that
engineers and practitioners could easily use as preliminary tools to both estimate the materials’
response and numerically simulate it in complex environments and in-situ conditions where time
has a great impact on the rock mass behaviour.

ACC
EPTE
D M
ANU
SCR
IPT
ACCEPTED MANUSCRIPT
ACKNOWLEDEGMENTS
The authors would like to acknowledge funding for this research from the Nuclear Waste
Organization of Canada (NWMO), The Natural Sciences and Engineering Research Council of
Canada (NSERC) and the Scientific Equipment Grant Program of ETH Zurich. The assistance
of Patric Walter, Julian Felderand, Linus Villiger in sample preparation is greatly appreciated, as
well as sample preparation equipment from Professor Jean-Pierre Burg and fruitful discussions
with Katrin Wild.

ACC
EPTE
D M
ANU
SCR
IPT
ACCEPTED MANUSCRIPT
REFERENCES
Armstrong, D.K., and Carter, T.R. 2006. An Updated Guide to the Subsurface Paleozoic Stratigraphy of Southern Ontario. Ontario Geological Survey, Open File Report 6191.
ASTM 2013. Standard Test Methods for Stress Relaxation for Materials and Structures. E328 – 13.
Aydan, O., Akagi, T., and Kawamoto, T. 1993. The squeezing potential of rocks around tunnels; Theory and prediction. J. Rock Mech Rock Eng. 26(2), pp. 137-63.
Backblom, G,. and Conrox, A.B. 2008. Excvation damage and disturbance in crystalline rock – results from experiments and analyses. SKB Report TR-08-08.
Barla, G., 1995. Squeezing rocks in tunnels, ISRM News Journal, 3/4, pp. 44-49.
Barla, G., Bonini, M., and Debernardi, D. 2010. Time Dependent Deformations in Squeezing Tunnels. International Journal of Geoengineering Case Histories, 2(1), pp. 819-824.
Bieniawski, T., 1967. Mechanism of Brittle Fracture of Rock, parts I, II, and III. Rock Mech.MinSci, 4(4), pp. 395–430.
Bizjak, K.F., and Zupancic, A., 2007. Rheological investigation for the landslide Slano Blato near Ajdovscina (Slovenia). Geologija, 50(1), pp.121–129.
Brace, W.R., Paulding, B.W.Jr., and Scholz, C. 1966. Dilatancy in the fracture of crystalline rocks. J. Geophys. Res., 71, 3939-3953, pp. 40-65.
Borchert, K.M., Hebener, H. and Richter, T. 1984. Creep Calculation on salt by using endochronic material law-compared to other creep formulations. The mechanical behaviour of rock salt. In Proc. of the The Mechanical Behaviour of Rock Salt, edited by H.R. Hardy and M. Langer, Trans Tech Publications, Clauthal Zellerfeld, W. Germany, pp. 573-587.
Boukharov, G.N., Chanda, M.W., and Boukharov, N.G. 1995. The three processes of brittle crystalline rock creep. Int. J. Rock Mech. Min Sci. & Geomech, 32(4), pp. 325-335.
Brantut N., Heap M.J, Meredith, P.G., and Baud, P. 2013. Time-dependent cracking and brittle creep in crustal rocks: a review. J. Struct. Geol., 52, pp. 17–43.
Chen, G., and Chugh, Y. 1996. Estimation of in situ visco-elastic parameter of weak floor strata by plate-loading tests. J. Geotechnical and Geological Engineering, 14(2), pp. 151-167.
Damjanac, B., and Fairhurst, C. 2010. Evidence for a long-term strength threshold in crystalline rock. Rock Mech. Rock Eng., 43(5), pp. 513-531.
Davis, G.H., Reynolds, S.J., and Kluth, CF. 2012. Structural Geology of Rocks and Regions, 3rd Edition. Wiley. New York. ISBN:978-1-118-21505-0. 864 pages
Diederichs, M.S., 1999. Instability of hard rock masses: The role of tensile damage and Relaxation. Ph.D. Thesis, University of Waterloo, Waterloo, ON, Canada.
Diederichs, M.S. 2003. Rock fracture and collapse under low confinement conditions. Rock Mech. Rock Eng. 36 (5), pp. 339-381.
Diederichs, M.S., Kaiser, P.K., and Eberhardt, E. 2004. Damage initiation and propagation in hard rock during tunnelling and the influence of near-face stress rotation. Int J Rock Mech Min Sci., 41(5), pp. 785–812.
Diederichs, M.S. 2007. The 2003 Canadian Geotechnical Colloquium: mechanistic interpretation and practical application of damage and spalling prediction criteria for deep tunnelling. Can Geotech J, 44, pp.1082–1116.

ACC
EPTE
D M
ANU
SCR
IPT
ACCEPTED MANUSCRIPT
Diederichs, M.S., and Martin, C.D. 2010. Measurement of spalling parameters from laboratory testing. In: Proc. of Eurock, Lausanne, Switzerland.
Dunham, J. 1962. Classification of carbonate rocks according to depositional texture, pp. 62-84 and 108-121.
Eberhardt, E., Stead, D., Stimpson, B., and Read, R.S. 1998. Identifying crack initiation and propagation thresholds in brittle rock. Can Geotech J; 35, pp. 222-233.
Eberhardt, E., Stimpson, B. and Stead, D. 1999. Effect of grain size on the initiation and propagation thresholds of stress-induced brittle fractures. Rock Mech. Rock. Eng. 32(2), pp. 81-99.
Einstein, H.H. 1996. Tunnelling in difficult ground – swelling behaviour and identification of swelling rocks. J. Rock Mech. Rock Eng., 29 (3), pp. 113-124.
Engelder, T. 1984. The time-dependent strain relaxation of Algerie granite. Int. J. Rock Mech Min Sci & Geomech, 2(2), pp. 63-73.
Fairhurst, C., and Cook, N.G.W., 1966. The phenomenon of rock splitting parallel to the direction of maximum compression in the neighborhood of a surface. In: Proc. of the First Congress on the International Society of Rock Mechanics, National Laboratory of Civil Engineering, Lisbon, Portugal, 1, pp. 687-692.
Fonseka, G.M., Murrell, S.A.F., and Barnes, P. 1985. Scanning electron microscope and acoustic emission studies of crack development in rocks. Int. J. of Rock Mech. and Min. Sci. and Geomech Abstr., 22(5), pp. 273-289.
Ghaboussi, J., and Gioda, G. 1977. On the time-dependent effects in advancing tunnels. Int J for Numerical and Analytical Methods in Geomechanics, 1, pp. 249-269.
Ghazvnian, E. 2015. Fracture Initiation and Propagation in Low Porosity Crystalline Rocks: Implications for Excavation Damage Zone (EDZ) Mechanics, Ph.D. Thesis, Queen’ s University, Canada.
Glamheden, R., and Hokmark, H. 2010. Creep in jointed rock masses. State of the knowledge. SKB.
Goodman, R. 1980. Introduction to rock mechanics. 1st ed. John Wiley and Sons, New York.
Griffith, A.A. 1924. Theory of rupture. In: Proc of the 1st Int. Congr. Applied Mechanics, Delft, pp. 55-63.
Groneng, G., Lu, M., Nilsen, B., and Jenssen, A., 2010. Modelling of time-dependent behavior of the basal sliding surface of the Åknes rockslide area in western Norway. Engineering Geology, 114, pp. 414-422.
Hao, S.W., Zhang, B.J., Tian, J.F., and Elsworth, D. 2014. Predicting time-to-failure in rock extrapolated from secondary creep, J. Geophys. Res. Solid Earth, 119, pp.1942–1953.
Harvey, D.R. 1967. Thermal Expansion of certain Illinois limestones and dolomites. State of Illinois department of registration and Education, Illinois State Geological Survey, Urbana, Illinois.
Hoek, E., and Brown, T. 1980. Underground Excavations in Rock. London: Institution of Mining and Metallurgy, 527 pages.
Hoek, E., Carranza-Torres, C., Diederichs, M.S., and Corkum, B. 2008. The 2008 Kersten Lecture-Integration of geotechnical and structural design in tunnelling.
Hoek, E., and Guevara, R. 2009. Overcoming squeezing in the Yacambú-Quibor tunnel, Venezuela. Rock Mechanics and Rock Engineering, 42(2), pp. 389 - 418.

ACC
EPTE
D M
ANU
SCR
IPT
ACCEPTED MANUSCRIPT
Hudson, J.A., and Harrison, J.P. 1997. Engineering rock mechanics – an introduction to the principles. Elsevier, Oxford.
ISRM. 1979. Suggested methods for determining the uniaxial compressive strength and deformability of rock materials.
Lajtai, E.Z. 1974. Brittle failure in compresion. Int. J. of Fracture. 10(4), pp. 525-536.
Lajtai, E.Z., Duncan, and Carter, J. 1991. The effect of strain rate on rock strength. Rock Mech. Rock Eng, 24, pp.99-109.
Lajtai, E.Z. 1998. Microscopic fracture processes in a granite. Rock Mech. Rock Eng. 31, pp.237-250.
Lau, J.S.O., and Chandler, A. 2004. N.A. Innovative laboratory testing. Int. J. Rock Mech. Mine Sci. 41, pp.1427–1445.
Li, Y., and Xia, C. 2000. Time-dependent tests on intact rocks in uniaxial compression. Int. J. Rock Mech. Min. Sci. 37, pp. 467-475.
Lin, Q. 2006. Strength Degradation and Damage Micromechanism of Granite under Long-Term Loading, Ph.D. Thesis, University of Hog-Kong.
Lo, K.Y., and Yuen, C.M.K. 1981. Design of tunnel lining in rock for long term time effects. Can Geotech. Journal. 18, pp. 24-39.
Lockner, D.A., Moore, D.E., and Reches, Z. 1992. Microcrack intersection leading to fracture.Rock Mechanics, Rotterdam: Balkema, pp. 807-816.
Lodus, E.V. 1986. The stressed state and stress relaxation in rocks. Institute of Mining, Academy of Sciences of the USSR, Leningrad. 2, pp. 3–11.
Malan, D.F., 2002. Simulating the time-dependent behaviour of excavations in hard rock. Rock Mech. Rock Eng., 35(4), pp. 255-254.
Martin, C.D., Kaiser, P.K., and McCreath, D.R. 1999: Hoek-Brown parameters for predicting the depth of brittle failure around tunnels. Can. Geotech. J. 36(1), pp. 136–151.
Martin, C.D. 1993. The Strength of massive Lac du Bonnet granite around underground openings. Ph.D. Thesis. University of Manitoba.
Martin, C.D. 1997. Seventeenth Canadian Geotechnical Colloquium: The effect of cohesion loss and stress path on brittle rock strength. Can. Geotech. J. 34(5), pp. 698–725.
Martin, D., Chandler, A. 1994: The progressive fracture of Lac du Bonnet granite. Rock Mech. Min. Sci. Geo. 31(6), pp. 643-659.
MODEX-REP. 2002. Experimental Study of the Hydromechanical behaviour of the Callovo-Oxfordian Argillites.
Nicksiar, M., and Martin, C.D. 2012. Evaluation of methods for determining crack initiation in compression tests on low-porosity rocks. Rock Mech Rock Eng, 45(4), pp. 607–617
Ottosen, N.S. 1986. Visco-elastic-viscoplastic formulas for analysis in rock salt cavities. Inter Journal Rock Mech. Min. Struct. & Geomech Abstr. 23(3). pp. 201-212.
Paraskevopoulou, C., Benardos, A. 2013. Assessing the construction cost of tunnel projects. Tunnelling and Underground Space Technology, 38, pp. 497–505.
Pellet, F., Hajdu, A., Deleruyelle, F., Bensus, F., 2005. A visco-plastic model including anisotropic damage for the time-dependent behaviour of rock. Int. J. for Numer. Anal. Meth. Geomech. 29, pp. 941-970.

ACC
EPTE
D M
ANU
SCR
IPT
ACCEPTED MANUSCRIPT
Peng, S.S. 1973. Relaxation and the behaviour of failed rock. Int. J. Rock Mech Min. Sci. & Geomech. 10, pp. 235-246.
Peng, S., and Podnieks E.R. 1972. Relaxation and the behaviour of failed rock. Int, J. Rock Mech. Min. Sci., 9, pp. 699-712.
Pimienta, L., Fortin, J., and Gueguen, Y., 2014. Investigation of elastic weakening in limestone and sandstone samples from moisture adsorption. Geophys. J. Int., 199, pp. 335-347.
Podnieks E.R., Chamberlain, P.G., and Thill R.E.1968. Environmental Effects on Rock Properties, In: Proc. of the Tenth Symposium of Rock Mechanics, University of Missouri at Rolla.
Potyondy, D. 2007. Simulating stress corrosion with a bonded-particle model for rock. Int, J. Rock Mech. Min. Sci. 44, pp. 677-693.
Rutter, E.H., Atkinson, B.K., and Mainprice, D.H. 1978. On the use of stress relaxation testing method in studies of the mechanical behaviour of geological materials. Geophys. J. R. Astr. Soc., 55, pp. 155-170.
Schmidtke, H., and Lajtai, E.Z. 1985. The long term strength of Lac du Bonnet granite. Rock Mech. Min. Sci. Geo., 22, pp. 461–465.
Scholz, C.H. 1968. Mechanism of creep in brittle rock. J of Geophysical Research, 73(10), pp. 3295-3302.
Schubert, W., Button, E.A., Sellner P.J., and Solak, T. 2003. Analysis of time-dependent displacements of tunnels. J. Rock Mechanics, 21(5), pp. 96-103.
Singh, D.P. 1975. A study of creep of rocks. Int. J. Rock Mech Sci & Geomech, 12, pp. 271-276.
Sterling, S., Jackson, R., Walsh, R., Heagle, D., and Clark, I. 2011. Assessment of porosity data and gas phase presence in DGR cores. NWMO Technical Report, TR-08-34.
Wawesik, W.R. 1972. Time-dependent rock behaviour in uniaxial compression. In: Proc. of the 14th Rock Mechanics Symposium, University of Pennsylvania, pp. 85-106.
Zheng, S.F., and Weng, G.J. 2002. A new constitutive equation for the long-term creep of polymers based on physical aging. European J. of Mechanics A/Solids, 21, pp. 411-421.

ACC
EPTE
D M
ANU
SCR
IPT
ACCEPTED MANUSCRIPT
Table I. Summary of the relaxation testing types. For each multi-step test, 10 strain levels were
tested.
Rock Formation Jurassic limestone Cobourg limestone
Type of Test Axial-controlled Radial-controlled Axial-controlled Radial-controlled
Load Level(s) Single-
step
Multi-
step
Single-
step
Multi-
step
Single-
step
Multi-
step
Single-
step
Multi-
step
Number of
Samples 14 2 -- 3 16 -- -- --
Total 19 16
Table A.1. Results from Baseline testing for a. Jurassic limestone and b. Cobourg limestone
a. Values for Jurassic limestone b. Values for Cobourg limestone
Sample Name
UCS (MPa)
CD (MPa)
CI (MPa)
E* (GPa)
Poisson's ratio*
Sample Name
UCS (MPa)
CD (MPa)
CI (MPa)
E* (GPa)
Poisson's ratio*
JURA_1U 66 53 27 103 0.26 CBRG_1U 104 93 45 38 0.24
JURA_2U 114 89 40 73 0.12 CBRG_3U 146 132 56 37 0.18
JURA_3U 88 74 36 125 0.29 CBRG_4U 122 111 44 45 0.17
JURA_4U 112 100 46 86 0.26 CBRG_5U 136 110 52 47 0.16
JURA_5U 126 102 45 101 0.29 CBRG_6U 132 113 52 46 0.15
JURA_6U 101 97 35 71 0.18 CBRG_7U 107 96 47 36 0.13
JURA_7U 68 64 22 95 0.22 CBRG_8U 94 84 37 37 0.12
JURA_8U 137 125 50 89 0.25 CBRG_9U 149 136 58 41 0.11
JURA_9U 110 105 42 94 0.21 CBRG_10U 136 124 56 44 0.13
JURA_10U 111 99 44 92 0.22
Avg. 103 91 39 93 0.23 125 111 50 41 0.15
St. Dev. 23 21 9 15 0.05 19 18 7 4 0.04
*The elastic parameters were derived from the linear portion of the complete stress-strain curves.

ACC
EPTE
D M
ANU
SCR
IPT
ACCEPTED MANUSCRIPT
Table A.2. Change in Temperature and Relative Humidity during relaxation time.
Multi-step Single-step
Jura_Axial-Controlled Jura_Axial-Controlled
Sample
Name
Temp
(oC)
RH
(%)
Relaxation Time
(Sec)
Sample
Name
Temp
(oC)
RH
(%)
Relaxation Time
(Sec)
JURA_25R-a -1.5 -- 6994.4 JURA_27R -0.2 0.1 5804.1
JURA_25R-b 0.5 -- 34751.0 JURA_28R -0.4 2.7 37865.3
JURA_25R-c -0.5 -- 48830.4 JURA_29R 0.1 1.0 51576.5
JURA_25R-d 0.0 -- 81246.8 JURA_30R -0.7 0.3 22967.5
JURA_25R-e -0.2 -- 44087.0 JURA_31R 0.0 -2.3 60987.6
JURA_25R-f 0.2 -- 42884.7 JURA_32R -0.4 -0.8 76535.4
JURA_25R-g -0.5 -- 42617.5 JURA_33R -- -- 85140.5
JURA_25R-h 0.3 -- 42775.1 JURA_34R -3.5 12.8 75077.8
JURA_25R-i -0.3 -- 83618.9 JURA_35R -0.1 1.5 52523.4
JURA_25R-j 0.0 -- 4320.8 JURA_36R -0.7 -1.2 270393.1
JURA_26R-a 0.0 -- 20987.1 JURA_39R -4.3 5.2 83222.4
JURA_26R-b -0.2 -- 72472.4 JURA_40R -0.7 5.7 89768.6
JURA_26R-c 0.2 -- 80521.4 JURA_41R -0.7 -2.8 85947.9
JURA_26R-d -0.1 -- 77386.0 JURA_44R 4.4 3.3 70913.501
JURA_26R-e -0.3 -- 35372.5 Cobourg_Axial-Controlled
JURA_26R-f 0.2 -- 50234.3 Sample # Temp
(oC)
RH
(%)
Relaxation Time
(Sec) JURA_26R-g -0.1 -- 91664.0 CBRG_16R -2.7 -3.1 67726.2
JURA_26R-h -0.2 -- 29330.4 CBRG_16R-b** -0.7 -2.5 50240.7
JURA_26R-i 0.2 -- 18401.0 CBRG_17R 0.2 -4.6 5791.9
JURA_26R-j -0.1 -- 86307.9 CBRG_17R-b** -- -- 161120.6
Radial-Controlled CBRG_18R -0.1 7.8 69133.5
Sample # Temp
(oC)
RH
(%)
Relaxation Time
(sec)
CBRG_18R-b** -- -- No relaxation data
JURA_07R-a 1.0 -- 52459.6 CBRG_19R -0.2 -8.6 86046.5
JURA_07R-b 0.5 -- 23029.4 CBRG_20R -0.3 5.6 73728.8
CBRG_21R -- -- 73784.0
CBRG_22R 0.6 -- 132077.0
CBRG_23R -0.3 -- 131298.9
CBRG_24R -1.5 -- 79790.7
CBRG_25R -2.7 -- 193521.5
CBRG_26R -1.8 31.7 247858.8
CBRG_27R 0.3 -4.4 83728.8
CBRG_28R -4.2 5.8 251275.4
CBRG_29R -3.3 -2.9 151099.8
CBRG_30R -1.2 5.2 152054.9
**these samples were tested again to a higher stress level
(-) refers to increase and (+) to decrease

ACC
EPTE
D M
ANU
SCR
IPT
ACCEPTED MANUSCRIPT
Table A.3. Summary of elastic and mechanical properties estimated from Relaxation testing.
a. Values for Jurassic limestone
Sample # CI (MPa)_LL -
Martin & Chandler 1994
CI (MPa)_UL -Martin & Chandler 1994
CI (MPa) - Lajtai_1974 E (GPa) Poisson's
ratio
Driving Stress-ratio
(j/UCS)
JURA_27R 25 34 42 53 0.19 0.51
JURA_28R 25 32 43 55 0.17 0.61
JURA_29R 37 38 48 57 0.16 0.75
JURA_30R 28 40 47 60 0.18 0.88
JURA_31R 21 33 48 57 0.20 0.98
JURA_32R 30 37 48 63 0.15 0.57
JURA_33R 25 33 41 63 0.11 0.46
JURA_34R 22 35 44 58 0.15 0.80
JURA_35R 25 37 45 55 0.16 0.84
JURA_36R 20 36 45 54 0.16 0.95
JURA_39R -- -- -- 59 0.17 0.09
JURA_40R -- -- -- 52 0.12 0.08
JURA_41R -- -- -- 56 0.13 0.09
JURA_25R-a* -- -- -- 54 0.15 0.09
JURA_26R-a* 28 33 42 55 0.14 0.42
b. Values for Cobourg limestone
Sample # CI (MPa)_LL -
Martin & Chandler 1994
CI (MPa)_UL -Martin & Chandler 1994
CI (MPa) - Lajtai_1974 E (GPa) Poisson's
ratio
Driving Stress-ratio
(j/UCS)
CBRG_16R 10 13 20 31 0.09 0.28
CBRG_16R-b** 15 33 35 37 0.09 0.35
CBRG_17R 20 31 37 38 0.15 0.35
CBRG_17R-b** 22 47 45 41 0.16 0.69
CBRG_18R 17 33 36 38 0.12 0.43
CBRG_18R-b** 14 34 41 37 0.09 0.64
CBRG_19R 20 28 33 38 0.12 0.47
CBRG_20R 18 28 34 36 0.13 0.50
CBRG_21R 20 39 39 38 0.11 0.59
CBRG_22R 22 35 33 29 0.09 0.50
CBRG_23R 15 28 32 29 0.12 0.52
CBRG_24R 15 23 34 27 0.07 0.49
CBRG_25R 12 32 37 32 0.13 0.59
CBRG_26R 15 43 42 34 0.17 0.75
CBRG_27R 19 28 40 34 0.13 0.76
CBRG_28R 16 42 45 33 0.13 0.75
CBRG_29R 20 27 32 27 0.12 0.50
CBRG_30R -- -- -- 25 0.08 0.09
*the first stage of the multi-step tests
**these samples were tested again to a higher stress level

ACC
EPTE
D M
ANU
SCR
IPT
ACCEPTED MANUSCRIPT
LIST OF FIGURES
Figure 1. Idealized creep and relaxation behavioural curves (left column) and the equivalent viscoelastic components (Kelvin and Maxwell) which are combined in parallel resulting in the Burgers model representation of the idealized curves (right column). At the bottom the viscoelastic models are illustrated and represented mathematically. Figure 2. Stress - strain response and stages of brittle rock fracture process and time-dependent behaviour of the material exhibiting: creep and/or relaxation depending on the initial loading and stress conditions, (where: jcc – stress level at crack closure, CI – crack initiation, CD – critical damage, UCS – unconfined compressive strength, jc – applied constant stress). Figure 3. Stress relaxation results of various rock types (marble, sandstone, salt), based on data from Peng (1983), Lodus (1986) and Li and Xia (2000). Figure 4. Samples of a.) Jurassic limestone and b.) Cobourg limestone, and c) equipment of static loading testing with the main components labelled. Figure 5. Stress-strain response of limestone: a.) Jurassic Samples and b.) Cobourg Samples tested in Unconfined Compressive Strength conditions. Figure 6. Axial-strain-controlled multi-step relaxation results of two Jurassic samples performed with 10 stress levels each; a) Jura_25R, and b) Jura_26R. Axial stress (blue line), axial strain (brown line) and radial strain (red line) results in relation to relaxation time expressed in seconds. The damage thresholds of CI and CD refer to the average values derived from the UCS baseline tests. and the letters a through j denote the load stage number in the multi-step tests Figure 7. Axial-controlled single-step relaxation results, a.) Axial stress and b.) Radial strain of Jurassic samples, c.) Axial stress, and d.) Radial strain of Cobourg samples in relation to relaxation time expressed in seconds. The number next to ‘Jura_’ and ‘Cbrg_’ denotes the sample name and ‘R’ refers to relaxation. The damage thresholds of CI and CD refer to the average values derived from the UCS baseline tests. The initial load step of each test is illustrated with light blue for stress and light red lines for strain in graphs a. and b. respectively. Figure 8. Comparison of axial-strain-controlled multi-step and single-step tests relaxation results, a.) Axial stress relaxation results normalized by the mean UCS value from the UCS testing; b.) Radial strain results from single-step tests, and c.) Axial stress relaxation results normalized by the mean UCS value from the UCS testing; d.) Radial strain results from multi-step tests of Jurassic samples in relation to relaxation time expressed in seconds. The number next to ‘Jura_’ denotes the sample rock type, ‘R’ refers to relaxation and the following letter (where it exists) denotes the stage number in the multi-load tests i.e.‘Jura_25R-’ and ‘Jura_26R-’ shown in red. The damage thresholds of CI and CD refer to the average values derived from the UCS baseline tests.
Figure 9. Axial stress – radial strain response of Jurassic samples Jura_30R and Jura_33R during relaxation.

ACC
EPTE
D M
ANU
SCR
IPT
ACCEPTED MANUSCRIPT
Figure 10. Radial-strain-controlled multi-step relaxation results of two Jurassic samples (Jura_02R and Jura_07R). Axial stress (blue line), axial strain (brown line) and radial strain (red line) results in relation to relaxation time expressed in seconds. The damage thresholds of CI and CD refer to the average values derived from the UCS baseline tests. Figure 11. a.) Axial stress response of Jura_28R sample to temperature and relative humidity fluctuations during relaxation testing and b.) Volumetric strain response of Jura_28R sample to temperature and relative humidity fluctuations during relaxation testing. Figure 12. a.) Maximum Stress–Relaxation (MPa) to Driving Stress-Ratio normalized to UCS and b.) Maximum Stress – Relaxation (MPa) to Crack Initiation Stress-Ratio CISR (applied initial stress normalized to CI) of the single-step tests on the Jurassic (in blue) and Cobourg (in red) samples, as well as the multi-step tests of the Jurassic samples (in green). ‘Ax’ refers to axial-strain-controlled conditions and ‘ss’ and ‘ms’ denotes single-step load and multi-step load tests, respectively. Figure 13. The three stages of the stress-relaxation process during a relaxation test under axial-strain-controlled conditions illustrated on the Jura_33R sample. Figure 14. The three stages of the stress-relaxation process during a relaxation test under axial-strain-strain controlled conditions. Figure 15. Axial stress relaxation (drop) in relation to the Crack Initiation Stress-ratio (normalized to CI from the testing series) for Jurassic limestone (a. and b.) and Cobourg limestone (c.). ‘Ax’ refers to axial-strain-controlled conditions, ‘ms’ and ‘ss’ denotes the multi-step and single-step load series, respectively. R-0, R-I, R-II and R-III refer to the initial state, the first, the second and the third stage of relaxation, respectively. Figure 16. Percentage of stress relaxation during each relaxation stage in relation to the Crack Initiation Stress-ratio (normalized to CI from the testing series) for Jurassic limestone (a. and b.) and Cobourg limestone (c.). ‘Ax’ refers to axial-strain-controlled conditions, ‘ms’ and ‘ss’ denotes the multi-step and single-step load series, respectively. R-0, R-I, R-II and R-III refer to the initial state, the first, the second and the third stage of relaxation, respectively. Figure 17. Percentage of total change in radial response during each relaxation stage in relation to the Crack Initiation Stress-ratio (normalized to CI from the testing series) for Cobourg limestone. ‘Ax’ refers to axial-strain-controlled conditions and ‘ss’ denotes single-step load series. R-0, R-I, R-II and R-III refer to the initial state, the first, the second and the third stage of relaxation, respectively. Figure 18. Percentage of stress relaxation to the initial (applied) stress in relation to the percentage of relaxation time during each relaxation stage testing series for Jurassic limestone and Cobourg limestone. ‘Ax’ refers to axial-strain-controlled conditions and ‘ss’ denotes the single-step load series. R-0, R-I, R-II and R-III refer to the initial state, the first, the second and the third stage of relaxation, respectively. Figure 19. Percentage of stress relaxation to the initial (applied) stress during each relaxation stage in relation to the to the Crack Initiation Stress-ratio (normalized to CI from the testing series) for Jurassic limestone (a.) and Cobourg limestone (b.). ‘Ax’ refers to axial-strain-controlled conditions and ‘ss’ denotes the single-step load series. R-0, R-I, R-II and R-III refer to the initial state, the first, the second and the third stage of relaxation, respectively.

ACC
EPTE
D M
ANU
SCR
IPT
ACCEPTED MANUSCRIPT
Figure 20. Estimating the maximum stress relaxation and predicting the time to relaxation using a.) Crack Initiation Stress-ratio in relation to the maximum stress relaxation, b.) Young’s Modulus Stress-ratio in relation to the maximum stress relaxation (log scale), c.) Crack Initiation Stress-ratio in relation to the time to relaxation, and d.) Young’s Modulus Stress-ratio in relation to the time to relaxation (log scale). Figure 21. Comparison of the materials response subjected to a.) creep and b.) relaxation. LIST OF TABLES Table 1. Summary of the relaxation testing types. For each multi-step test, 10 strain levels were tested. Table A.1. Results from Baseline testing for a. Jurassic limestone and b. Cobourg limestone Table A.2. Change in Temperature and Relative Humidity during relaxation time. Table A.3. Summary of elastic and mechanical properties estimated from Relaxation testing.

ACC
EPTE
D M
ANU
SCR
IPT
ACCEPTED MANUSCRIPT
Fig. 1
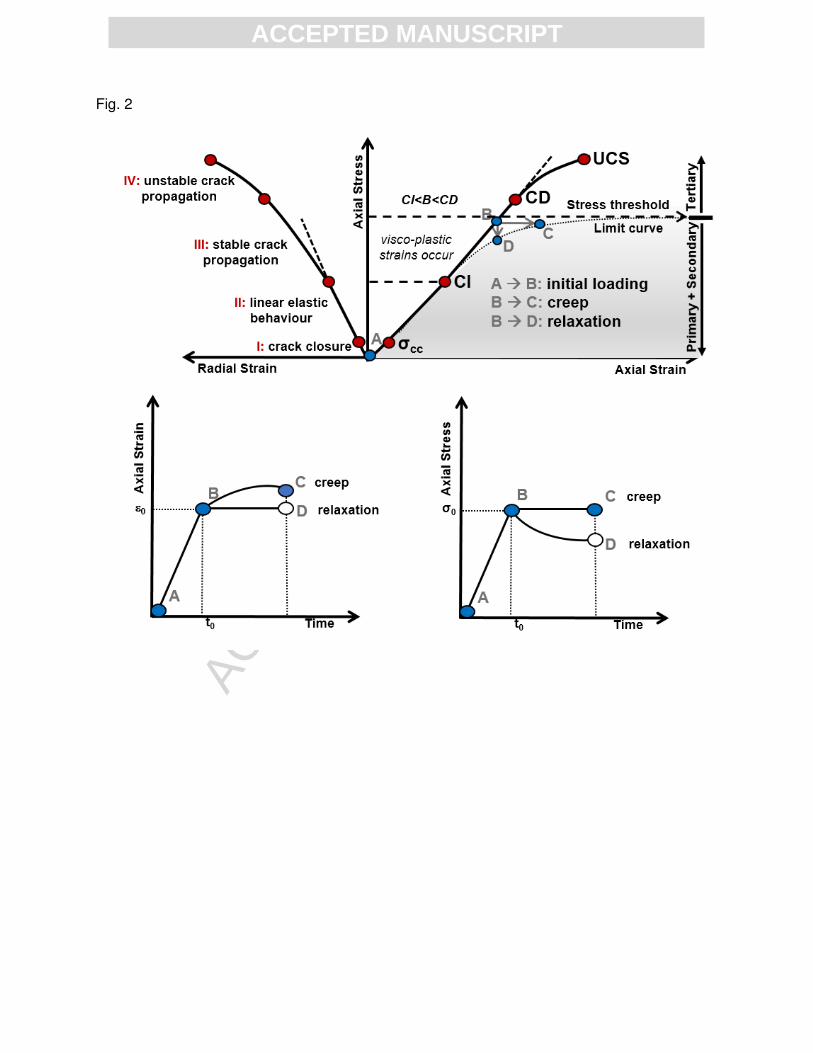
ACC
EPTE
D M
ANU
SCR
IPT
ACCEPTED MANUSCRIPT
Fig. 2

ACC
EPTE
D M
ANU
SCR
IPT
ACCEPTED MANUSCRIPT
Fig. 3

ACC
EPTE
D M
ANU
SCR
IPT
ACCEPTED MANUSCRIPT
Fig. 4

ACC
EPTE
D M
ANU
SCR
IPT
ACCEPTED MANUSCRIPT
Fig. 5

ACC
EPTE
D M
ANU
SCR
IPT
ACCEPTED MANUSCRIPT
Fig. 6

ACC
EPTE
D M
ANU
SCR
IPT
ACCEPTED MANUSCRIPT
Fig. 7

ACC
EPTE
D M
ANU
SCR
IPT
ACCEPTED MANUSCRIPT
Fig. 8

ACC
EPTE
D M
ANU
SCR
IPT
ACCEPTED MANUSCRIPT
Fig. 9

ACC
EPTE
D M
ANU
SCR
IPT
ACCEPTED MANUSCRIPT
Fig. 10

ACC
EPTE
D M
ANU
SCR
IPT
ACCEPTED MANUSCRIPT
Fig. 11

ACC
EPTE
D M
ANU
SCR
IPT
ACCEPTED MANUSCRIPT
Fig. 12

ACC
EPTE
D M
ANU
SCR
IPT
ACCEPTED MANUSCRIPT
Fig. 13

ACC
EPTE
D M
ANU
SCR
IPT
ACCEPTED MANUSCRIPT
Fig. 14

ACC
EPTE
D M
ANU
SCR
IPT
ACCEPTED MANUSCRIPT
Fig. 15

ACC
EPTE
D M
ANU
SCR
IPT
ACCEPTED MANUSCRIPT
Fig. 16

ACC
EPTE
D M
ANU
SCR
IPT
ACCEPTED MANUSCRIPT
Fig. 17

ACC
EPTE
D M
ANU
SCR
IPT
ACCEPTED MANUSCRIPT
Fig. 18

ACC
EPTE
D M
ANU
SCR
IPT
ACCEPTED MANUSCRIPT
Fig. 19

ACC
EPTE
D M
ANU
SCR
IPT
ACCEPTED MANUSCRIPT
Fig. 20

ACC
EPTE
D M
ANU
SCR
IPT
ACCEPTED MANUSCRIPT
Fig. 21

ACC
EPTE
D M
ANU
SCR
IPT
ACCEPTED MANUSCRIPT
Highlghts
• We give insight into the time-dependent behaviour of rock materials and the importance of performing laboratory testing.
• The testing and analysis presented herein focus on stress relaxation testing on brittle rocks, i.e., the time-dependent response of rock under constant (controlled) strain.
• We show that three distinct stages during stress relaxation take place. • We present a data set of stress relaxation test results from various rock types to
estimate and predict the relaxation behaviour of different rock types.