Embed Size (px)
Citation preview
The Tide Turns? Trade, Protectionism, and Slowing Global Growth The 18th Global Trade Alert Report
by Simon J. Evenett and Johannes Fritz
CEPR PRESS
GLOB LTR DE
LERT

CEPR Press
Centre for Economic Policy Research33 Great Sutton StreetLondon EC1V 0DX
Tel: +44 (0) 20 7183 8801Fax: +44 (0)20 7183 8820Email: [email protected]: www.cepr.org
The Tide Turns? Trade, Protectionism, and Slowing Global Growth
© CEPR Press, 2015

TABLE OF CONTENTS
Recent perspectives on protectionism and global trade 4
Executive summary 7
Why the global trade slowdown matters 8
Falling global trade: The facts 12
Did policy target the products that account for much of the fall in world trade? 16
Beggar-thy-neighbour activity in 2015 18
Protectionism since the Great Recession: The three phases 20
Which G20 nations distort commerce most often? 22
Which countries have been hit the most and by whom? 24
Which tradeable sectors have been hit the most? 26
Which policy instruments have been used the most? 28
How significant are trade defence actions? 30
How much do official reports understate protectionism? 32
What’s new in the Global Trade Alert database? 34
What is the Global Trade Alert? 35
Acknowledgements 35
Hold their feet to the fire: The track record of each G20 member
Argentina 38Australia 42Brazil 46Canada 50China 54France 58Germany 62India 66Indonesia 70Italy 74
Japan 78Mexico 82Russia 86Saudi Arabia 90South Africa 94South Korea 98Turkey 102United Kingdom 106United States 110
4 | Global Trade Alert
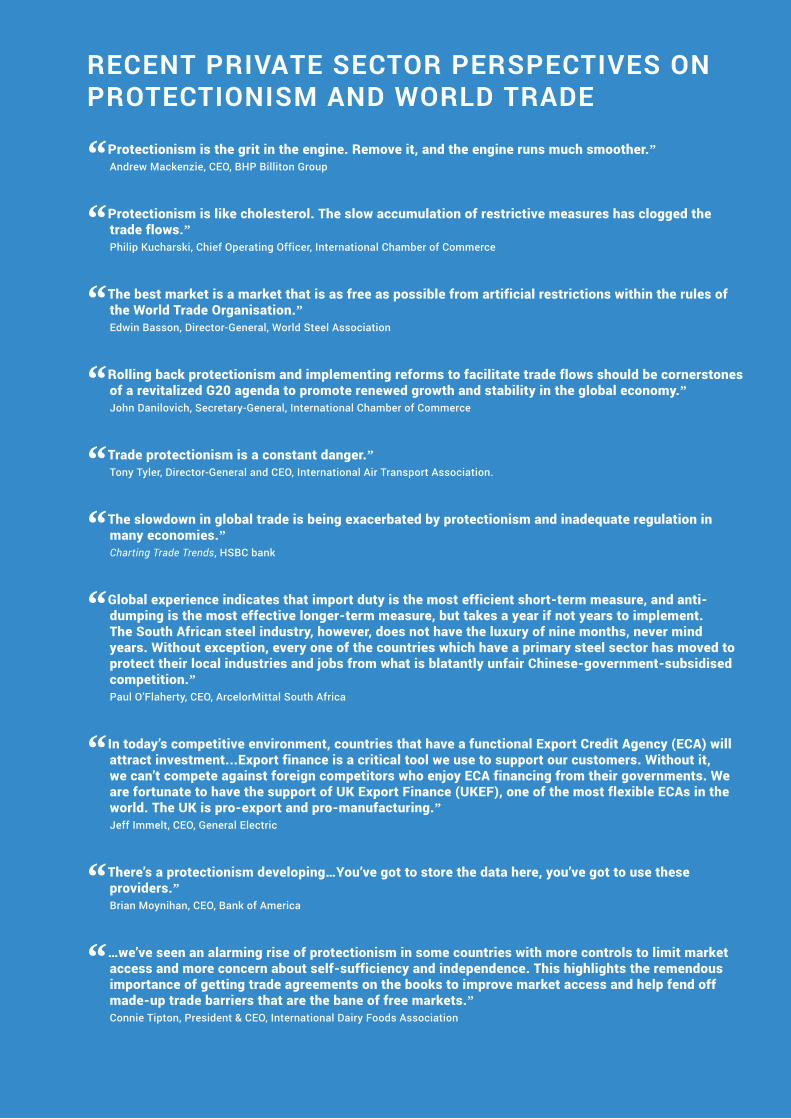
RECENT PRIVATE SECTOR PERSPECTIVES ON PROTECTIONISM AND WORLD TRADE
“Protectionism is the grit in the engine. Remove it, and the engine runs much smoother.”Andrew Mackenzie, CEO, BHP Billiton Group
“Protectionism is like cholesterol. The slow accumulation of restrictive measures has clogged the trade flows.”Philip Kucharski, Chief Operating Officer, International Chamber of Commerce
“The best market is a market that is as free as possible from artificial restrictions within the rules of the World Trade Organisation.”Edwin Basson, Director-General, World Steel Association
“Rolling back protectionism and implementing reforms to facilitate trade flows should be cornerstones of a revitalized G20 agenda to promote renewed growth and stability in the global economy.”John Danilovich, Secretary-General, International Chamber of Commerce
“Trade protectionism is a constant danger.”Tony Tyler, Director-General and CEO, International Air Transport Association.
“The slowdown in global trade is being exacerbated by protectionism and inadequate regulation in many economies.”Charting Trade Trends, HSBC bank
“Global experience indicates that import duty is the most efficient short-term measure, and anti-dumping is the most effective longer-term measure, but takes a year if not years to implement. The South African steel industry, however, does not have the luxury of nine months, never mind years. Without exception, every one of the countries which have a primary steel sector has moved to protect their local industries and jobs from what is blatantly unfair Chinese-government-subsidised competition.”Paul O’Flaherty, CEO, ArcelorMittal South Africa
“In today’s competitive environment, countries that have a functional Export Credit Agency (ECA) will attract investment...Export finance is a critical tool we use to support our customers. Without it, we can’t compete against foreign competitors who enjoy ECA financing from their governments. We are fortunate to have the support of UK Export Finance (UKEF), one of the most flexible ECAs in the world. The UK is pro-export and pro-manufacturing.”Jeff Immelt, CEO, General Electric
“There’s a protectionism developing…You’ve got to store the data here, you’ve got to use these providers.”Brian Moynihan, CEO, Bank of America
“…we’ve seen an alarming rise of protectionism in some countries with more controls to limit market access and more concern about self-sufficiency and independence. This highlights the remendous importance of getting trade agreements on the books to improve market access and help fend off made-up trade barriers that are the bane of free markets.”Connie Tipton, President & CEO, International Dairy Foods Association

The Tide Turns? Trade, Protectionism, and Slowing Global Growth | 5
RECENT GOVERNMENT PERSPECTIVES ON PROTECTIONISM AND WORLD TRADE
“For us import substitution isn’t a fetish. It concerns the most important technologies…One way or another we had to do it ... but now we will have to do it more quickly.”Vladimir Putin, President, Russian Federation
“There are a variety of factors beyond slow economic growth that explain the post-crisis slowdown in global trade. The most notable include diminished incentives to expand trade, the changing composition of global demand and increased protectionism.”Working paper, Bank of Canada
“Well, let me deal very directly with the issue about steel, because we discussed today the importance of the steel industry, and I want a strong and robust British steel industry, and we discussed the problem of global oversupply…And what I would say to steelworkers in Britain is: we will take action here in Britain. We will take action on energy costs. We’ll take action to help make sure that we procure British steel for British projects. Where we can take action on tax and other issues, we will take that action. Where we can take action in the European Union, we will take that action.But actually, the investment we’re talking about today, we’re going to build a nuclear power station in Britain that’s going to have British steel. We’re building Crossrail under the streets of London right now, the biggest construction project anywhere in Europe, employing almost exclusively British steel.The infrastructure partnerships we’re talking about, the investment that we’re opening up, means more demand for British steel, because that’s the way we’re going to make sure procurement works in Britain.”David Cameron, Prime Minister, United Kingdom
“If we look a bit further at our system of licensing and regulation we see it is inconsistent, misguided and even irrational…That [deregulation] is aimed at freeing the private sector, both domestic and foreign, from the time-consuming licensing procedures and misguided protectionism that have caused many companies and industries to suffer for years.”Joko Widodo, President, Republic of Indonesia
“And as they have matured, what we’ve said to [China] is, with power comes responsibility, so now you’ve got to step up. You can’t act as if you are a third-world country and pursue protectionist policies, or engage in dumping, or not protect intellectual property….”Barak Obama, President, United States
“Every country today, given the depressed demand situation, is ensuring that they protect their national interest. However, that it is not to be seen and it shall not go that far as being protectionist.”Nirmala Sitharaman, Union Commerce Minister, India
“Refunding export taxes is the country’s major policy to encourage exports, and it is also common practice internationally. The State Administration of Taxation has always treated quickening export tax rebates as an important task and one of its major targets, as required by the State Council, and a series of measures have been adopted….During January to June [2015], China’s volume of export tax rebates has increased 12.4 percent over the same period last year, which is far higher than the growth of export volumes and has greatly boosted the growth of foreign trade exports.”Wang Shouwen, Vice-Minister of Commerce, China

6 | Global Trade Alert

The Tide Turns? Trade, Protectionism, and Slowing Global Growth | 7
EXECUTIVE SUMMARYThe G20’s principal task of reviving global economic growth has never been easy – it is harder now that world trade is contracting. Measured in value and volume terms world trade has been falling since the end of last year. On average G20 exports have fallen 4.5% since world trade peaked in value in October 2014.
As this report will show, with the exception of Germany, in no other G20 member did improvements in trade balances account for more than a fifth of GDP growth during 2009-2014. Even these gains are now threatened as international commerce contracts. This matters because millions of families depend on jobs at companies meeting foreign customers’ needs. The taxes these exports generate help states tackle a growing list of societal challenges.
This report rejects the benign interpretation that the global trade slowdown is merely a combination of a rising US dollar, falling commodity prices, and the retrenchment of supply chains involving China. This view places too much weight on data on the volume of global exports and ignores the following facts:
Manufactured export prices have fallen since mid-2011.
After recovering in 2010 and the first half of 2011, the total value of world trade stopped growing, plateaued, and then began to fall in nominal terms after October 2014.
The recent fall in the total value of global trade isconcentrated in a small number of product categories – for sure, commodities are well-represented, but falling trade in certain final goods is far more important than in parts.
Shipments of motor vehicles – a key sector with supply chains – have grown 10% since October 2014.
The manufactured products which account for a largershare of the recent fall in global exports happen to be the very products where the G20 has tended to impose more trade restrictions since the beginning of 2014. In contrast, relatively fewer trade restrictions were imposed on motor vehicles over the same period.
The ‘level playing field’ has taken a battering this year. In preparing this report, we found:
Worldwide, governments imposed 539 trade distortions in the first ten months of this year, of which the G20 were responsible for 443.
Easily spotted G20 tariff increases were down 21%, and easier-to-hide subsidies up 47%.
Resort to trade distortions by the G20 is up 40% on the same period last year.
Resort to trade distortions worldwide this year has beentwo-and-a-half times greater than at the same point in 2009, when G20 leaders began to take the threats to global commerce seriously.
Since the crisis erupted, G20 governments have imposed3,581 measures that harmed foreign commercial interests.
81% of all G20-imposed trade distortions remain in force,undercutting claims that crisis-era protectionism is a temporary expedient.
These aggregate developments are borne out on the ground, with growing trade tensions in airlines and steel and over data storage, to choose just three examples. The time has come for the G20 to stop taking for granted the openness of the world trading system and to boost trade’s contribution to economic growth.
What should the G20 do? Realistically, in the near term neither developments at the WTO nor the signing of the Trans-Pacific Partnership will counter falling world trade. While the Agreement on Trade Facilitation is welcome, fewer than a third of WTO members have ratified it to date. Remarkably, ten G20 members (Argentina, Brazil, Canada, India, Indonesia, Mexico, Russia, Saudi Arabia, South Africa, and Turkey) have yet to ratify this accord.
With the multilateral and regional options offering little near-term relief, attention turns to steps the G20 members can take themselves. G20 leaders should request that the incoming Chinese Presidency build support for initiatives to revive global trade without imposing more trade distortions. To that end, the G20 leaders should:
Instruct G20 trade ministers to commission and publish third-party (i) updates on world trade levels on a quarterly basis, (ii) analyses of sectors where trade has shrunk the most or where substantial excess capacity is said to exist, and (iii) estimates of the impact of suspending all nuisance tariffs (3% or less) on goods imported by the G20.
Commit that temporary tariff cuts by G20 members on parts, components and capital goods will last at least two years – reducing uncertainty faced by exporters.
Instruct the IMF to estimate the cost of G20 fiscal incentives given by all levels of government and state-linked companies and banks to stimulate trade and inflows of foreign investment.
Instruct the WTO, OECD, and UNCTAD to propose anupdated version of the protectionist pledge that recognises the full range of crisis-era distortions to commerce.

8 | Global Trade Alert
CHAPTER 2 WHY THE GLOBAL TRADE SLOWDOWN MATTERS
The purpose of this chapter is to explain what is meant by the global trade slowdown and to describe its economic and political significance. The immediate practical relevance to the G20 leaders of this topic is that their trade ministers were said to have discussed the reasons for this slowdown at their meeting on 6 October 2015.1 G20 leaders are expected to have a discussion on the future role of the World Trade Organization (WTO) at their forthcoming summit and it would be strange if a significant development in the world trading system like the global trade slowdown did not colour this ostensibly institutional discussion.
A cyclical or trend phenomenon?“One of the main motors behind the growth of the world economy in recent decades, the expansion of world trade, seems to have entirely lost its mojo.” So wrote Gavyn Davies in one of the earlier analyses of what was to become known as the ‘global trade slowdown’ (Davies 2013). Davies went on to note the evidence for and salience of this matter:
“World trade volume has been virtually stagnant in the 12 months ended mid 2013. Zero growth in world trade is normally a sign of impending global recession, not of sluggish expansion. Furthermore, there are extremely strong reasons for believing that growth in trade is one of the principal contributors to supply-side gains in global GDP, so a slow-down in underlying trade growth involves permanent losses in welfare.”
Having mentioned this cyclical manifestation of the global trade slowdown Davies, like other analysts (Constantinescu et al. 2015), pointed out that over the longer term world trade has grown at twice the rate of world GDP and there are concerns that this relationship has broken down. Any global trade slowdown then can be seen in terms of trends too. Of course, as far as the future integration of the world economy is concerned, it matters a lot whether the slowdown is a cyclical or trend phenomenon.
Measuring the slowdownMany discussions of the global trade slowdown, including in the latest WTO monitoring report on trade measures (WTO 2015), focus on data on export volumes, that is, nominal measures of world trade corrected for changes in exchange rates and prices.2 Moreover, discussions typically proceed in terms of a slower rate of growth of these export volumes. However, as Figure 2.1 shows, the leading measure of world export volumes, assembled by CPB Netherlands Bureau for Economic Policy Analysis, has actually fallen since the end of 2014. World export volumes are currently 2% below their peak, breaking the relentless upward march in export volumes witnessed since 2010.
75
80
85
90
95
100
2010
m01
2010
m05
2010
m09
2011
m01
2011
m05
2011
m09
2012
m01
2012
m05
2012
m09
2013
m01
2013
m05
2013
m09
2014
m01
2014
m05
2014
m09
2015
m01
2015
m05
Index takes value 100 at maxim
um value since
1 January 2010
World export volume World export prices
Manufacturing prices
FIGURE 2.1World export volumes are now falling – not just growing more slowly
Source: CPB (2015).
1 See https://g20.org/turkey-hosted-the-g20-trade-ministers-meeting-in-istanbul/2 Boz et al. (2014) is an exception, reporting both estimates of world export volume and the total value of such exports.

The Tide Turns? Trade, Protectionism, and Slowing Global Growth | 9
Economists, however, are interested in prices as well as quantities. After all, if export volumes are rising but the average price of exports is falling faster, then overall export earnings, and perhaps even the contribution to economic growth, will be declining. For this reason, it is worth examining how export prices have changed over time. Since commodities as well as manufactures are exported, and given that the different factors determine their prices, then it makes sense to differentiate between world export price indices for commodities and those for manufacturing goods. The CPB does this and readers are again referred to Figure 2.1.
While a lot of attention has been given during the past year to the effects of commodity price falls – in particular in the oil price – on the value of trade flows, in fact significant changes in the price of exported manufactured goods have taken place as well. Well before talk of a global trade slowdown become common, the price of manufactured exports had been falling, ever since the second half of 2011. This ended the upward march in manufactured goods prices witnessed since 2002, which, it should be noted, was interrupted briefly by the sharp global trade slowdown of 2009.3
Arguably, a focus on world export volumes data ignores other potentially important developments. After all, to what extent is the fall in manufactured goods prices due to inter-firm rivalry, innovation and cost-cutting, or to more generous trade finance (Donnan 2015) and tax-based incentives to exporters (Evenett et al. 2012, Evenett and Fritz 2015, Evenett 2015)?
Given changes in both export prices and volumes, it makes sense to reprise developments in the total value of world exports. This is complicated by the fact that national export data must be converted into a common currency and that that currency may change in value vis-à-vis other currencies. The currency typically used to report world trade flows is US dollars, and over the past 12 months it has appreciated substantially against other currencies. This implies, if nothing else changed, that the value of export transactions conducted in other currencies would be worth less in US dollars – a pure translation effect. Arguably, it is a concern about such translation effects that appears to lead many analysts to prefer export volume data, but that judgement depends critically on the accuracy with which indices to correct price and exchange rates are constructed.4
The UN COMTRADE database reports data on trade on a monthly and annual basis. Given our interest in both short-term and medium-term developments, the available monthly data were employed to construct aggregate totals for the nominal value of imports each month. Those totals were normalised to create an index whose maximum value takes 100, as this helps compare across series and over time. The totals were calculated with and without the trade UNCTAD regards as “raw materials,” without trade in gold (HS tariff line 7108) and the tariff lines in chapters 25-27 of the Harmonised System (many of which are traded on commodity markets). To smooth out some of the noisy monthly variation, six-month moving averages were calculated and plotted on Figure 2.2.
65.00
70.00
75.00
80.00
85.00
90.00
95.00
100.00
105.00
2010
-M1
2010
-M3
2010
-M5
2010
-M7
2010
-M9
2010
-M11
2011
-M1
2011
-M3
2011
-M5
2011
-M7
2011
-M9
2011
-M11
2012
-M1
2012
-M3
2012
-M5
2012
-M7
2012
-M9
2012
-M11
2013
-M1
2013
-M3
2013
-M5
2013
-M7
2013
-M9
2013
-M11
2014
-M1
2014
-M3
2014
-M5
2014
-M7
2014
-M9
2014
-M11
2015
-M1
2015
-M3
2015
-M5
2015
-M7
Inde
x ta
kes
valu
e 10
0 at
max
imum
val
ue s
ince
1
Janu
ary
2010
World imports
World imports excluding raw materials/commodities
6 per. Mov. Avg. (World imports)
6 per. Mov. Avg. (World imports excluding raw materials/commodities)
FIGURE 2.2The total nominal value of world exports has stagnated since mid-2011 and has fallen sharply since October 2014
Source: Monthly data assembled from the UN COMTRADE database.
3 The CPB data on the price of manufactured exports goes back to 1995. Interestingly, the years 1995 to 2012 saw a trend decline in these prices. This raises the question as to whether the downturn seen since 2011 has some way to go.

10 | Global Trade Alert
What is striking is that the total nominal value of world imports has been stagnant since the middle of 2011 and falling since October 2014. On this measure, world trade bounced back after the 2009 trade collapsed, plateaued, and then declined. Given this variation over time, is it best characterised as a slowdown in the rate of growth of world trade? Indeed, the distinction between trend and cycle employed in discussions of the global trade slowdown may need to be revisited.
It is also noteworthy that the total value of world trade plateaued before the trade-weighted US dollar index started rising against industrialised trading partners (in July 2014)5
or against developing countries (in May 2013).6 This is not to deny the importance of translation effects, but it does cast doubt on attempts to write off recent falls in global trade solely on the grounds that the US dollar has risen sharply during the past year. If translation effects were so important, then given the size of emerging markets’ trade, surely this would have affected global trade totals after mid-2013?
The salience of the global trade slowdownG20 trade ministers are not alone in noticing that global trade patterns are changing. The private sector has as well. Very recently, as reported on 8 November 2015, the CEO of A.P. Moeller-Maersk, owner of the world’s largest shipping line, said that “[t]rade is currently significantly weaker than it normally would be under the growth forecasts we see”. How the private sector revises its plans for investment, market entry, and expansion in the light of changing global trade patterns will be of critical importance.
In thinking through the potential importance of the global trade slowdown, it is worth bearing in mind the following three linkages:
Exports are a source of jobs, often higher-paying jobs.According to JP Morgan, this year US export sectors are shedding 50,000 jobs per month and are a major source of job loss in the American economy, blighting an otherwise improving labour market (JP Morgan 2015).
To the extent that greater exports improve the trade balance (or net exports) then aggregate demand in an economy will increase and if there is enough slack, this will result in higher levels of national income and lower levels of unemployment. Falling exports put this process into reverse.
Governments can react to falling exports in more or less discriminatory ways. One fear is that a government decides to counter falling exports by offering fiscal incentives and subsidised trade finance, with the (often unsaid) goal of stealing market share from other country exporters. Another bad option is to seek to preserve the national trade balance by discriminating against imports, seeking to match a fall in exports with a fall in purchases from abroad. This is another form of beggar-thy-neighbour activity. Preferred alternatives would involve undertaking reforms to improve export performance and negotiating deals with other countries to open up new commercial opportunities around the globe.
In addition to these three consequences of falling exports, the impact of diminished cross-border rivalry on the incentives of managers to cut costs and to innovate should, as Davies argued earlier, be taken into account.
To date, improvement in trade balances have not made much of a contribution to the crisis-era growth of most G20 nations. To demonstrate this point, for each G20 economy we calculated the percentage of GDP growth between 2009 and 2014 that can be accounted for by improvements in the net exports.7 Figure 2.3 shows the sizeable variation in trade-related growth contributions. Strikingly, Germany is the only G20 member where the contribution of trade to short term growth exceeds 20%.
-50
-40
-30
-20
-10
0
10
20
30
40
Brazil
Argentin
a
South
Africa
Canada
Saudi A
rabia
UK
Turkey
Australia
Indonesia USA
France
Japan
Mexico
IndiaChina
Korea
GermanyCo
ntri
butio
n of
impr
oved
trad
e ba
lanc
es
to G
DP
grow
th 2
009-
2014
, %
FIGURE 2.3Improvements in trade balances contributed little to short term growth
of the G20 in the aftermath of the financial collapse
Source: Data taken from World Development Indicators online.
4 In this regard, remarkably few users of export volume indices discuss the strengths and weaknesses of the price indices employed.5 See graph at https://research.stlouisfed.org/fred2/series/DTWEXM.6 See graph at https://research.stlouisfed.org/fred2/series/DTWEXO

The Tide Turns? Trade, Protectionism, and Slowing Global Growth | 11
Furthermore, we correlated that figure with each nation’s exposure to international trade during 2009-2015 (measured as the ratio of total national imports plus exports to GDP). Figure 2.4 shows a positive association between these variables. Countries that engaged more in international commerce in the aftermath of the financial crisis appear to have enjoyed a greater trade-related contribution to national economic growth. On this logic, countries that opened up their economies to more trade, implemented more trade deals, and resisted the temptation to reserve national markets for national firms have received a growth payoff in the crisis era. At the risk of taking the statistical analysis too seriously, every 10-percentage point increase in imports and exports (as a share of GDP) is associated with a 4% increase in trade’s contribution to GDP growth.
In sum, as far as the recent fall in global trade is concerned there is much at stake for the G20 – for short-term macroeconomic performance and jobs, over the medium term for national business environments, and for longer-term growth prospects.
ReferencesBoz, E., M. Brussiüre, and C. Marsilli (2014). “Recent slowdown in global trade: Cyclical or structural”, VoxEU.org, 12 November.
Constantinescu, C, A. Mattoo, and M. Ruta (2015). “The Global Trade Slowdown: Cyclical or Structural”, World Bank Policy Research Working Paper No. 7158, Washington, DC.
Davies, G. (2013), “Why world trade growth has lost its mojo”, Financial Times blog, 29 September.
Donnan, S. (2015). “US Trade: Trailing Behind”, Financial Times, 29 June.
Evenett, S. J. (2015). BRICS Trade Strategy: Time For A Rethink,London: CEPR Press.
Evenett, S. J. and J. Fritz (2015). Throwing Sand In The Wheels: How Foreign Trade Distortions Slowed LDC Export-Led Growth,London: CEPR Press.
Evenett, S. J., J. Fritz, and C. J. Yang (2012). “Beyond Dollar Exchange Rate Targeting: China’s Crisis-Era Export Management Regime”, Oxford Review of Economic Policy.
JP Morgan (2015), “US jobs slowdown confined to export industries so far,” Economics Research Note, 13 October.
World Trade Organization (WTO) (2015), Report on G-20 Trade Measures, 30 October.
y = 0.4254x - 26.386 R = 0.28174
-40
-30
-20
-10
0
10
20
30
40
0 20 60 80 100 120
Cont
ribu
tion
of tr
ade
bala
nce
impr
ovem
ents
to G
DP
grow
th
2009
-201
4, %
Exposure to trade, 2009-2014 (sum of national imports and exports as a percentage of GDP), %
40
FIGURE 2.4G20 members more exposed to trade before the crisis benefited from a greater trade-contribution to short term GDP growth after the financial
collapse
Source: CPB (2015).
7 These calculations were performed for each G20 member using the latest data available from the World Development Indicators. Italy was excluded from the graphs that follow because in real terms its GDP did not grow between 2009 and 2014. Given the disruption to the Russian economy due to sanctions, this economy was also excluded from the charts that follow.

12 | Global Trade Alert
CHAPTER 3 FALLING GLOBAL TRADE: THE FACTS
Analyses of the Global Trade Collapse of 2009 and the Global Trade Slowdown have often distinguished between the various types of products traded across borders. Trade in certain goods, such as parts and components, are thought to be particularly sensitive to changes in demand for final products, with the latter triggering multiple revisions to sourcing decisions along supply chains.2 Moreover, Constantinescu et al. (2015) have argued that the replacement of some outsourcing with domestic production, in particular by Chinese firms, is depressing global trade growth over time.
Other merchandise trade, such as commodities, is subject to substantial price variation, which affects the total nominal value of recorded trade. This is relevant here given the considerable variation in commodity prices over the past 12 months, in particular those relating to energy.
Investment goods trade is affected by other considerations, not least expectations about the future. That investment outlays in many countries are said to be depressed is relevant here, as decisions not to undertake capital expenditures may reduce demand for machines and the like made abroad.
Overall, then, there is little reason to suppose that observed trade in different product categories will react the same way to changing circumstances, such as a US dollar appreciation or slower rates of global economic growth. There may be only so much that can be learned from examining the average changes in world trade over time.
The purpose of this chapter is to decompose the recent fall in the total nominal global trade (from October 2014 to July 2015) between product categories to learn more about how evenly spread is the contraction of trade.
Data employedThe international trade data used in this chapter have been extracted from the UN Monthly COMTRADE database.2
The advantage of using this database is that it contains information on trade flows in 2015, facilitating an analysis of very recent trade flows that may be of considerable interest to policymakers, officials, businesses, and analysts. (In contrast the annual version of the UN COMTRADE database publishes its data with a considerable lag.) There is a price to be paid, however, in using this monthly database in country coverage as not every government has contributed a full set of up-to-date trade data.
Our sample is restricted to the 38 countries that have reported a complete set of monthly import data from 226 trading partners throughout the sample period, taken here to be from January 2010 to July 2015.3 This is the largest sample that can be constructed using this database for which there are no gaps in the reporting nations’ import data. Together, the imports of these 38 countries accounted for 58% of total world imports observed in the annual UN COMTRADE statistics during 2010-2014. For these five years the total value of world trade computed using our 38-nation sample moves very closely over time with the published annual totals for world trade.4
UNCTAD classifies tradeable products into four categories: raw materials, intermediate goods, capital goods, and consumer goods. We were not happy with the fact that some products that trade with reference prices on global markets were subsumed into the latter three categories. We therefore moved gold and all of the tradeable products in chapters 25-27 of the Harmonised System into the first category and relabelled it raw materials/commodities.
1 Various contributors to the Baldwin (2009) and Hoekman (2015) volumes make this point.2 ThebullwhiporForrestereffectisonecharacterisationofthissensitivity.3 For more information about this database see http://comtrade.un.org/monthly/Public/Metadata.aspx.4 The data available after July 2015 is very patchy. This monthly database starts in January 2010.

The Tide Turns? Trade, Protectionism, and Slowing Global Growth | 13
Having done so, it was possible to track on a monthly basis the total nominal value of trade in each of these four categories of tradeable products (see Figure 3.1.) The collapse of the value of raw materials/commodities trade during the past 12 months stands out – standing now at nearly half of its post-2010 peak. The fall was particularly sharp during Q4 2014 and Q1 2015, with some apparent stabilisation in Q2 2015.
The experience with the other three broad product categories is less severe, but their totals are still 10-20% off their peaks in 2014. Even so, the evolution of the series during 2015 for intermediate, consumer, and capital goods is not that different to that witnessed in 2012 and 2013. Put another way, total world trade in these three non-commodities appears to have plateaued since 2012. However, before too many inferences are drawn, it is worth noting that these too are average responses that may supress important product-level variation. Checking the latter is the next step.
Product-level breakdown of the recent global trade fallThe United Nations trade data include information on 1,225 product groupings (technically, they are referred to a tariff lines at the four-digit level of aggregation of the Harmonised System). This data were used to identify the relative contribution of different product categories to the overall change in global trade in the aftermath of the collapse of 2009.
Data on the total monthly trade in each product grouping (referred to as “product” for the remainder of this chapter) were assembled from January 2010 to July 2015. Based on the changes over time in total nominal value of trade value described in the last chapter, this period was split into three phases titled “Bounceback” (covering January 2010
to December 2010), “Stagnation” (covering January 2011 to September 2014) and “Retrenchment” (covering October 2014 to July 2015.) The average annualised nominal growth rates of world trade in these three periods was 17.26%, 1.24%, and -11.83%, respectively.
The distribution of the annualised growth rates of each product for each phase is plotted in the three panels of Figure 3.2. Looking across the phases, there is a clear difference in the spread of the annualised growth rates. The distribution of those growth rates in the Stagnation phase is much tighter around the mean than in the Bounceback and Retrenchment phases. Moreover, the large upper tail (of high annualised growth rates) in the Bounceback phase has its mirror image in a fat lower tail (of negative annualised growth rates) in the Retrenchment phase.
Of course, these distributions treat each product line equally, even though the amount of trade involved can differ substantially. Consequently, for the Retrenchment phase the change in the total value of trade in each product expressed as percentage of the overall fall in world trade was calculated. The products were then ranked in terms of descending contribution to the recent global trade fall. What is particularly striking is that the 11 products making the largest contribution together account for two-thirds of the recent fall in global trade. That is, less than 1% of the product categories account for two-thirds of the contraction in global trade since October 2015.
50.00
60.00
70.00
80.00
90.00
100.00
110.0020
10-M
120
10-M
320
10-M
520
10-M
720
10-M
920
10-M
1120
11-M
120
11-M
320
11-M
520
11-M
720
11-M
920
11-M
1120
12-M
120
12-M
320
12-M
520
12-M
720
12-M
920
12-M
1120
13-M
120
13-M
320
13-M
520
13-M
720
13-M
920
13-M
1120
14-M
120
14-M
320
14-M
520
14-M
720
14-M
920
14-M
1120
15-M
120
15-M
320
15-M
520
15-M
7
Inde
x ta
kes
valu
e 10
0 at
max
imum
val
ue
sinc
e 1
Janu
ary
2010
Raw materials/commodities Intermediate goods
Capital goods Consumer goods
FIGURE 3.1Commodity trade has slumped in 2015 while trade in other goods
at best stagnates
Source: Data assembled from the UN Monthly COMTRADE database.
Phase 1: BouncebackJanuary 2010 - December 2010
Phase 2: StagnationJanuary 2011 - September 2014
Phase 3: RetrenchmentOctober 2014 - July 2015
6%
4%
2%
0%
6%
4%
2%
0%
6%
4%
2%
0%
Annualised growth rate
Phase mean
Phase mean
Phase mean
FIGURE 3.2The variation in average growth rates of trade at the product level—not just the mean growth rate—altered during the recent fall in global trade
14 | Global Trade Alert
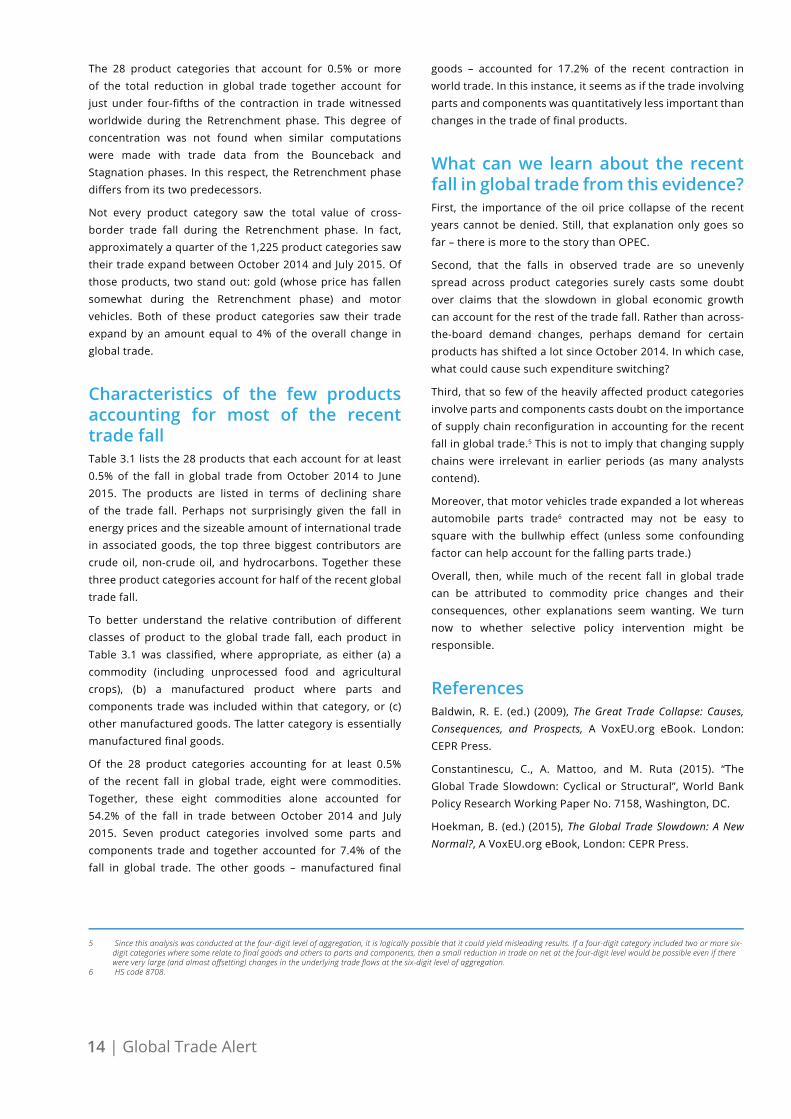
The 28 product categories that account for 0.5% or more of the total reduction in global trade together account for just under four-fifths of the contraction in trade witnessed worldwide during the Retrenchment phase. This degree of concentration was not found when similar computations were made with trade data from the Bounceback and Stagnation phases. In this respect, the Retrenchment phase differs from its two predecessors.
Not every product category saw the total value of cross-border trade fall during the Retrenchment phase. In fact, approximately a quarter of the 1,225 product categories saw their trade expand between October 2014 and July 2015. Of those products, two stand out: gold (whose price has fallen somewhat during the Retrenchment phase) and motor vehicles. Both of these product categories saw their trade expand by an amount equal to 4% of the overall change in global trade.
Characteristics of the few products accounting for most of the recent trade fall Table 3.1 lists the 28 products that each account for at least 0.5% of the fall in global trade from October 2014 to June 2015. The products are listed in terms of declining share of the trade fall. Perhaps not surprisingly given the fall in energy prices and the sizeable amount of international trade in associated goods, the top three biggest contributors are crude oil, non-crude oil, and hydrocarbons. Together these three product categories account for half of the recent global trade fall.
To better understand the relative contribution of different classes of product to the global trade fall, each product in Table 3.1 was classified, where appropriate, as either (a) a commodity (including unprocessed food and agricultural crops), (b) a manufactured product where parts and components trade was included within that category, or (c) other manufactured goods. The latter category is essentially manufactured final goods.
Of the 28 product categories accounting for at least 0.5% of the recent fall in global trade, eight were commodities. Together, these eight commodities alone accounted for 54.2% of the fall in trade between October 2014 and July 2015. Seven product categories involved some parts and components trade and together accounted for 7.4% of the fall in global trade. The other goods – manufactured final
goods – accounted for 17.2% of the recent contraction in world trade. In this instance, it seems as if the trade involving parts and components was quantitatively less important than changes in the trade of final products.
What can we learn about the recent fall in global trade from this evidence? First, the importance of the oil price collapse of the recent years cannot be denied. Still, that explanation only goes so far – there is more to the story than OPEC.
Second, that the falls in observed trade are so unevenly spread across product categories surely casts some doubt over claims that the slowdown in global economic growth can account for the rest of the trade fall. Rather than across-the-board demand changes, perhaps demand for certain products has shifted a lot since October 2014. In which case, what could cause such expenditure switching?
Third, that so few of the heavily affected product categories involve parts and components casts doubt on the importance of supply chain reconfiguration in accounting for the recent fall in global trade.5 This is not to imply that changing supply chains were irrelevant in earlier periods (as many analysts contend).
Moreover, that motor vehicles trade expanded a lot whereas automobile parts trade6 contracted may not be easy to square with the bullwhip effect (unless some confounding factor can help account for the falling parts trade.)
Overall, then, while much of the recent fall in global trade can be attributed to commodity price changes and their consequences, other explanations seem wanting. We turn now to whether selective policy intervention might be responsible.
ReferencesBaldwin, R. E. (ed.) (2009), The Great Trade Collapse: Causes, Consequences, and Prospects, A VoxEU.org eBook. London: CEPR Press.
Constantinescu, C., A. Mattoo, and M. Ruta (2015). “The Global Trade Slowdown: Cyclical or Structural”, World Bank Policy Research Working Paper No. 7158, Washington, DC.
Hoekman, B. (ed.) (2015), The Global Trade Slowdown: A New Normal?, A VoxEU.org eBook, London: CEPR Press.
5 Since this analysis was conducted at the four-digit level of aggregation, it is logically possible that it could yield misleading results. If a four-digit category included two or more six-digitcategorieswheresomerelatetofinalgoodsandotherstopartsandcomponents,thenasmallreductionintradeonnetatthefour-digitlevelwouldbepossibleeveniftherewereverylarge(andalmostoffsetting)changesintheunderlyingtradeflowsatthesix-digitlevelofaggregation.
6 HS code 8708.

The Tide Turns? Trade, Protectionism, and Slowing Global Growth | 15
TABLE 3.1 Twenty eight product categories account for over three-quarters of the fall in global trade
from October 2014 to July 2015
No. HS Code Product descriptionParts or
components in HS code?
Commodity /raw material?
Percentage of world
trade Sep-Nov 2014
Percentage of global trade fall between Oct
2014 and July 2015
1 2709 Crude oil √ 8.20 33.28
2 2710 Non crude oil √ 3.96 10.77
3 2711 Hydrocarbons √ 1.93 6.44
4 8517 Telephone equipment √ 2.84 3.01
5 6110 Sweater 0.65 2.93
6 8471 Data processing machines 2.25 2.80
7 9503 Toys 0.46 1.85
8 8528 TVs 0.72 1.62
9 6202 Women's overcoats 0.23 1.37
10 9504 Video games and other games 0.27 1.24
11 2601 Iron ores √ 0.31 1.08
12 3002 Blood 1.03 0.97
13 8542 Electronic circuits √ 0.96 0.93
14 6201 Men's overcoats 0.16 0.89
15 9505Christmas and other festive
articles0.13 0.85
16 6403 Footwear 0.48 0.82
17 8516Heaters, driers, ovens,
toasters√ 0.35 0.82
18 8708 Motor parts √ 2.47 0.80
19 1001 Wheat √ 0.19 0.74
20 8443 Printing machinery √ 0.65 0.72
21 1806 Chocolate √ 0.20 0.69
22 2701 Coal √ 0.45 0.64
23 9405 Lamps √ 0.35 0.64
24 4011 Tyres 0.56 0.63
25 8523 Magnetic tapes (film) 0.31 0.63
26 7204 Scrap iron and steel 0.24 0.56
27 306 Crustaceans √ 0.21 0.56
28 8473 Parts of electronic machines √ 0.48 0.53
Total 31.06 78.83

16 | Global Trade Alert
CHAPTER 4 DID POLICY TARGET THE PRODUCTS THAT ACCOUNT FOR MUCH OF THE FALL IN WORLD TRADE?
Much – but not all – of the observed fall in global trade since October 2014 can be accounted for by changes in commodity prices and reactions of traders to them. However, there are 20 categories of manufactured good whose trade falls stand out in terms of their contribution to the overall fall in global trade and in contrast to other manufactured goods. Is there anything distinctive about these 20 categories and about trade in motor vehicles, the latter somehow bucking the trend towards lower trade?
One candidate explanation is that the mix of policies used by governments to discriminate against foreign commercial interests differed between these ‘high impact’ product categories and the rest. Since the changes in trade being examined relate to the months after October 2014, it does not make sense to look at policy changes from early in the crisis era. Therefore, we narrowed our focus to policy interventions undertaken since 1 January 2014.
Furthermore, since these are sizeable trade flows that we seek to account for, it may not make much sense to examine the policy interventions by the smaller trading nations. For this reason, we considered only policies implemented by the G20 members since 1 January 2014. If any governments have the heft to shape trade flows, then it would be among this group of large trading nations.
We made use of the Global Trade Alert database to identify policy interventions that discriminated against foreign commercial interests that might have affected trade in all of the four-digit manufacturing product categories (that is, in terms of the UN CPC classification of sectors at the two digit level numbered 24 to 49).1
Policy interventions unlikely to directly affect trade – such as the introduction of visa restrictions – were omitted from the analysis that follows. So were surgical measures, such as anti-dumping and anti-subsidy duties, that target specific firms or trading partners. The focus then is discriminatory interventions likely to harm commercial interests in many trading partners because, if anything, these are the
1 Thisclassificationcanbeaccessedathttp://unstats.un.org/unsd/cr/registry/regcst.asp?Cl=9&Lg=1.Separately,entriesintheGTAdatabaseformerchandisegoodsareclassifiedbyCPCcodeandHarmonisedSystemcode.
0%
10%
20%
30%
40%
50%
60%
70%
80%
90%
100%
All manufacturing Between 0.5% share and 1% share
More than 1% share
Motor vehicles (HS 8703)
Other
Bailouts and non-export-related fiscal incentives
Export incentives and trade finance
Export taxes
Public procurement
Import restrictions
FIGURE 4.1The G20 imposed proportionally more trade restrictions in product
categories that accounted for a greater share of the recent global trade fall

The Tide Turns? Trade, Protectionism, and Slowing Global Growth | 17
interventions that stand any chance of accounting for the recent fall in global trade.
The remaining policies were classified into the following groups:
(Directly) import restricting, which includes tariff increases, import quotas, and import bans.
Public procurement measures where state contracts areshifted away from foreign bidders to local firms.
Export taxes and restrictions.
Export incentives, including subsidised trade finance.
Bailouts and non-export related fiscal incentives (including tax breaks and subsidies).
Other measures.
The first three categories listed above almost surely reduce trade. Shipments from jurisdictions giving export incentives may be higher, but at the expense of other trading partners. Overall, the effects of export incentives on total trade is ambiguous, especially if exporters do not seek contracts abroad because they face uncertainty over whether they are competing against a subsidised rival (competing against a rival is one thing, competing against the rival’s finance ministry is an entirely different matter). To the extent that bailouts and other subsidies allow recipients to continue to trade than would otherwise be the case, then such subsidies may deter retrenchment and withdrawal from export markets.
Data from the GTA database were used to compile evidence on the discriminatory policies used in the following four groups: (a) all manufacturing sectors; (b) those manufacturing product lines where the contribution to the recent global trade fall was between 0.5% and 1.0%; (c) the manufacturing product lines where the contribution to the recent fall in global trade was greater than 1%; and (d) motor vehicles (whose trade actually grew in size).
The distribution of the discriminatory policy interventions made by the G20 nations from 1 January 2014 across these four groups of products is shown in Figure 4.1. An interesting pattern results: compared to the benchmark of all manufacturing sectors, those products that accounted for much of the recent global trade fall were the very products where the G20 employed proportionally more measures that restrict trade.
Moreover, the effect is even more pronounced in the products that each accounted for more than 1% of the recent fall in global trade than in the products that accounted for between 0.5% and 1% of that decline.
Furthermore, motor vehicles saw the lowest proportion of trade-reducing measures. Instead, much more of the discriminatory intervention in motor vehicles was propping up incumbent firms, dulling the incentive to cut capacity and retrench. Indeed, the various export incentives given to firms in this sector may well have fostered exports as well.
The pattern of evidence in Figure 4.1 is suspicious but not conclusive. After all, we have not shown statistically that, controlling for all other factors, the discriminatory policy mix explained why certain manufacturing products were hit harder than others.
If the relevant policy question is turned around to: “Can we be sure that the recent contraction of world trade is entirely benign and unrelated to beggar-thy-neighbour activity?”, then the evidence presented here makes it very hard to discount the role of protectionism entirely.
In which case – and erring on the side of caution now that global trade dynamics appear to be shifting unfavourably – G20 governments ought to take deterring and unwinding trade distortions seriously. This recommendation becomes all the more compelling given the evidence summarised in the chapters that follow of a substantial increase in the rates at which governments have resorted to protectionism in 2015.

18 | Global Trade Alert
CHAPTER 5 BEGGAR-THY-NEIGHBOUR ACTIVITY IN 2015
Between 1 January and 31 October 2015, a total of 539 measures were taken by governments worldwide that harmed foreign traders, investors, workers, or owners of intellectual property. In no previous year have we found so many trade distortions so quickly (see Figure 5.1). Bearing in mind that our initial totals have tended to be revised up substantially over time,1 finding so many trade distortions in 2015 so soon is troubling.
FIGURE 5.1 Measures reported by GTA up to 31 October in year of implementation
0
100
200
300
400
500
600
700
800
2009 2010 2011 2012 2013 2014 2015
Num
ber of implem
ented measures
Total Discriminatory Liberalising
The five most frequently used trade distortions in the year to date are summarised in a pie chart in Figure 5.2. Two-thirds of all trade distortions implemented this year are accounted for by just five types of policy instrument: bailouts/subsidies, trade defence, tariff increases, localisation requirements, and dubious trade finance initiatives.
FIGURE 5.2 Bailouts and subsidies account for a quarter of trade distortions this
year
24%
17%
11% 9%
6%
33%
Bail out / state aid measure Trade defence
Tariff measure Localisation requirement
Trade finance others
2015 saw a resurgence in the resort to subsidies. A total of 170 bailouts and subsidies have been given during the first ten months of this year – almost all of them by G20 governments. These subsidies slow down adjustment in sectors where there is overcapacity, such as aluminium, steel, and shipbuilding. Unlike targeted trade defence measures, bailouts and subsidies tend to distort much more trade as they can alter pricing and investment decisions in foreign as well as home markets. Resort to the second and fourth most commonly used measures – namely, trade defence and localisation requirements – is running at similar levels to last year. In contrast, there has been less resort to tariff increases in 2015 compared to 2014.
1 Forexample,ourfirstcount(publishedinSeptember2009)ofthetradedistortionsimposedinthefirstquarterof2009was77.Now,wehavedocumented263tradedistortionsimplementedinthatquarter.

The Tide Turns? Trade, Protectionism, and Slowing Global Growth | 19
During 2015 a small number of sectors have borne the brunt of discrimination against foreign firms (see Table 5.2). Ten sectors, accounting together for 45% of world imports, have been hit a total of 625 times. Basic metals have been hit the most this year already (84 times) and this reflects, amongst others, the ongoing difficulties in the steel sector. Agriculture and transportation equipment (the latter being an enormous sector, covering 7.5% of world trade) have both been harmed 76 times since the year began.
TABLE 5.2 The top 10 most affected sectors have been hit 625 times this year
Rank SectorNumber of
times hit this year
Percentage of world
trade
1 Basic metals 84 5.36%
2 Agricultural produce 76 2.20%
3 Transport equipment 76 7.53%
4 Special purpose machinery 68 5.32%
5 Basic chemicals 66 5.31%
6Grain mill products and
starches56 1.51%
7Electrical machinery and
apparatus52 6.29%
8 Other chemical products 50 4.97%
9 Fabricated metal products 49 1.42%
10 General purpose machinery 48 4.87%
All other sectors 679 55.22%
The G20 nations are responsible for 443 of the 539 harmful measures implemented this year. As Table 5.1 shows, a ranking of countries in terms of the number of times they have discriminated against foreign commercial interests reveals that the top ten worst nations are all members of the G20.
539harmful measures implemented year to date, 443 by the G20
Resort to trade-distorting subsidies up significantly
H arm concentrated in 10 sectors of w orld economy accounting for 4 5% of w orld imp orts
TABLE 5.1 All of the top 10 nations inflicting the harm most often in 2015 are members of the G20
Rank NationNumber of harmful
measures imposed this year
Nation’s share of world imports in 2014
1 Russian Federation 65 1.6%
2 India 55 2.6%
3 USA 51 13.4%
4 Indonesia 39 1.0%
5 Brazil 38 1.3%
6 Japan 36 4.7%
7 UK 26 4.0%
8 Canada 24 2.6%
9 Turkey 24 1.4%
10 France 23 3.8%
All other nations 631 53.1%
20 | Global Trade Alert
CHAPTER 6 PROTECTIONISM SINCE THE GREAT RECESSION: THE THREE PHASES
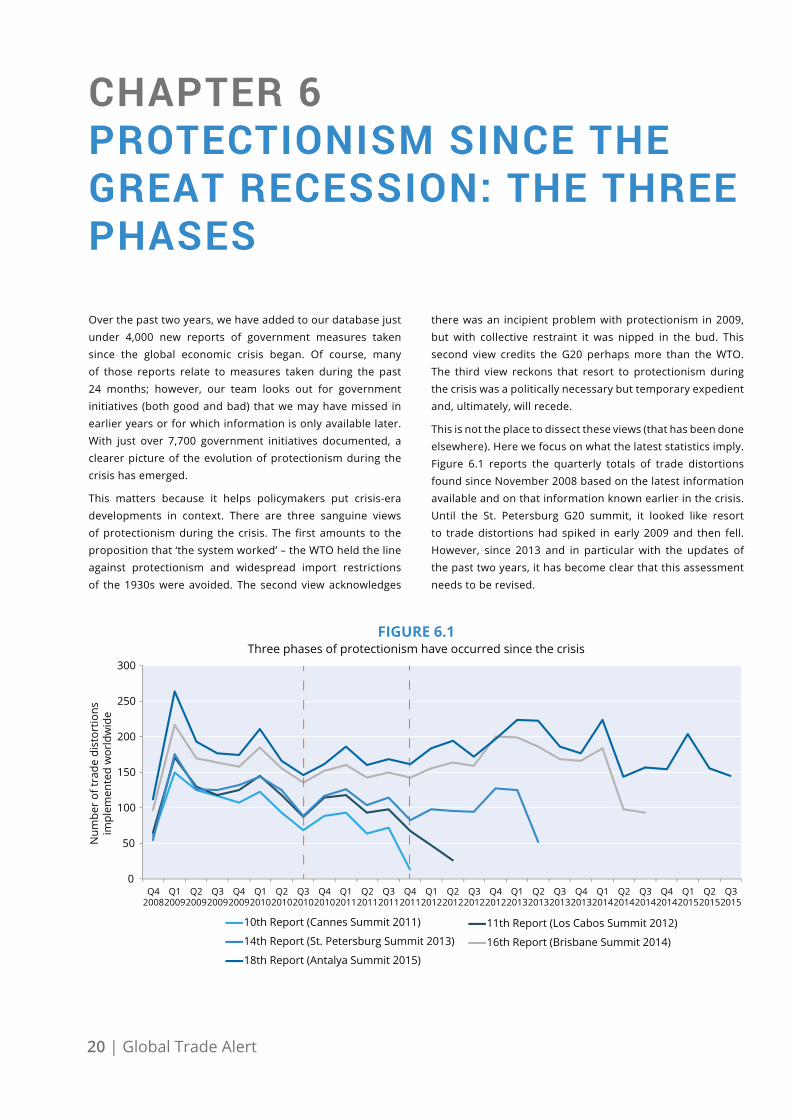
Over the past two years, we have added to our database just under 4,000 new reports of government measures taken since the global economic crisis began. Of course, many of those reports relate to measures taken during the past 24 months; however, our team looks out for government initiatives (both good and bad) that we may have missed in earlier years or for which information is only available later. With just over 7,700 government initiatives documented, a clearer picture of the evolution of protectionism during the crisis has emerged.
This matters because it helps policymakers put crisis-era developments in context. There are three sanguine views of protectionism during the crisis. The first amounts to the proposition that ‘the system worked’ – the WTO held the line against protectionism and widespread import restrictions of the 1930s were avoided. The second view acknowledges
there was an incipient problem with protectionism in 2009, but with collective restraint it was nipped in the bud. This second view credits the G20 perhaps more than the WTO. The third view reckons that resort to protectionism during the crisis was a politically necessary but temporary expedient and, ultimately, will recede.
This is not the place to dissect these views (that has been done elsewhere). Here we focus on what the latest statistics imply. Figure 6.1 reports the quarterly totals of trade distortions found since November 2008 based on the latest information available and on that information known earlier in the crisis. Until the St. Petersburg G20 summit, it looked like resort to trade distortions had spiked in early 2009 and then fell. However, since 2013 and in particular with the updates of the past two years, it has become clear that this assessment needs to be revised.
0
50
100
150
200
250
300
Q42008
Q12009
Q22009
Q32009
Q42009
Q12010
Q22010
Q32010
Q42010
Q12011
Q22011
Q32011
Q42011
Q12012
Q22012
Q32012
Q42012
Q12013
Q22013
Q32013
Q42013
Q12014
Q22014
Q32014
Q42014
Q12015
Q22015
Q32015
Num
ber
of tr
ade
dist
ortio
ns
impl
emen
ted
wor
ldw
ide
10th Report (Cannes Summit 2011) 11th Report (Los Cabos Summit 2012)
14th Report (St. Petersburg Summit 2013) 16th Report (Brisbane Summit 2014)
18th Report (Antalya Summit 2015)
FIGURE 6.1Three phases of protectionism have occurred since the crisis

The Tide Turns? Trade, Protectionism, and Slowing Global Growth | 21
Now three phases of protectionism can be readily identified. Phase I involved a spike in Q1 2009, when 263 trade distortions were implemented worldwide, and then a decline in trade distortions imposed each quarter through to Q3 2010. Phase II followed with a steady increase to 160-170 trade distortions per quarter until Q4 2011. A third phase followed with the quarterly totals rising until the first half of 2013 (where the peak is just less than 225 trade distortions per quarter).
With the fall-off in quarterly rates witnessed since then, it might be tempting to argue that a fourth, more tempered phase has begun. However, given reporting lags, drawing this conclusion might be premature. Figure 6.1 also shows that the first estimates for late 2014 and 2015 are higher than those recorded in 2011 for early 2009. With the inevitable upward revisions over time to the totals for 2014 and 2015, there is a serious risk that the third phase will ultimately result in totals for 2013-2015 that show either a continually rising resort to trade distortions, or a levelling off at a high plateau.
In interpreting the protectionist record, it is important to note that the first two sanguine views cannot account for the strong pick up in protectionism in the third phase. Moreover, as our 17th report showed, many recent trade distortions involve fiscal incentives to export products that compete in third markets against rivals – not import restrictions. The amount of trade affected by the former is multiples of the latter. These measures are whales not minnows.
Data on whether crisis-era trade distortions have been phased out sheds light on the strength of the third sanguine view. Here, Figure 6.2 is useful. That three-fifths of trade distortions imposed in 2009 remain to be unwound casts doubt on such distortions being temporary expedients.
Overall, as our database grows, a better sense of the full range of distortions to 21st century commerce has emerged. This picture points to little room for complacency. At this stage, no-one has the data to conclusively demonstrate that trade distortions and associated interventions ‘caused’ the recent global trade contraction, but it would be imprudent to insist that these factors are unimportant – especially in the light of claims from business to the contrary.
0%5%
10%15%20%25%30%35%40%45%50%
2009 2010 2011 2012 2013 2014 2015 YTD
Percentage harmful measures unwound
FIGURE 6.2Crisis-era protectionism: A temporary expedient?

22 | Global Trade Alert
CHAPTER 7 WHICH G20 NATIONS DISTORT COMMERCE MOST OFTEN?
Informal peer pressure is supposed to be one mechanism by which the G20 nations strengthen their resolve to refrain from protectionism. Bearing in mind that the first G20 pledge to eschew protectionism was made seven years ago in November 2008 and that governments and circumstances change, our purpose here is to provide statistics that facilitate comparisons across the G20.
Our approach here is based on the number of times a government has taken measures that discriminate against foreign commercial interests.1 Such counts are easy to compute in real time and everyone can add as well as interpret totals (in marked contrast to statistical estimates produced by researchers). Figure 7.1 ranks the G20 nations according to the total number of discriminatory measures implemented between November 2008 and the end of October 2015. On this metric, the G20 divides into three groups. A group of five G20 countries clearly stand out as resorting to discrimination most often: India, Russia, the United States, Argentina, and Brazil. These countries have implemented between 281 and 504 measures that harm trading partners’ commercial interests.
A second group of six G20 nations, which have implemented between 197 and 224 protectionist measures over the past seven years, includes Germany, China, Indonesia, the UK, France, and Italy. Finally, the remaining G20 nations have implemented between 18 and 157 trade distortions. The very low total for Saudi Arabia probably reflects difficulties in finding published information on changes in their commercial policies rather than an exemplary record on its part.
It is also useful to compare across time to see if G20 members impose a steady stream of harmful measures. Figure 7.2 is useful in this respect. India, Russia, and the United States have imposed fairly consistently 10-15 harmful measures per quarter over the past seven years. Brazil has engaged in a late spurt of protectionism, as evidenced by the darker red cells from 2013 onwards. In contrast, the rate at which Argentina resorts to protectionism appears to have diminished over time (although that does not mean the earlier discrimination has been phased out). France, Germany, Italy, Japan, and the UK appear to have occasional frenzies of discrimination against foreign commercial interests.
1 Therearetwopotentialobjectionstothisapproach,oneofwhichismorecompellingthananother.Acompellingcriticismisthatcountsofmeasuresdon’tgiveasenseoftheamountofcommerceaffectedandharmdonetotradingpartners.Inthepastyearwe’vemadealotofprogressestimatingtradeaffectedbyprotectionismbutcomprehensiveassessments will have to come in future reports. Estimating the welfare costs of over 5,000 discriminatory measures, however, would be so time-consuming (and controversial given the assumptions that must be made) that demanding such information is tantamount to making the perfect the enemy of the good. In this regard, it is worth noting that few disputetheimportanceofprotectionisminthe1930syetthereareonlyahandfulofstudiesthatestimatethewelfareeffectsofsuchprotectionism.ThelesscompellingcriticismisthatwhattheG-20meantbyprotectionismisdifferentandinvolvesonlyasubsetofthemeasuresconsidereddiscriminatorybyourteam.IftheG-20feltitwasbeingunfairlyjudgedthentheyarefreetospelloutexactlywhatmeasurestheyconsiderprotectionism,astepthatalmostcertainlywon’tendthematter.
2 Availableathttp://www.globaltradealert.org/gta-analysis/brics-trade-strategy-time-rethink.
504478
377344
281
224222213 213 201197157144
108106101 83 79
18
0
100
200
300
400
500
600
Indi
aRu
ssia
USA
Arge
ntin
aBr
azil
Ger
man
yCh
ina
Indo
nesi
aU
KFr
ance
Italy
Turk
eyJa
pan
Cana
daSo
uth
Afri
ca
Aust
ralia
M
exic
oSo
uth
Kore
a Sa
udi A
rabi
a
Tota
l num
ber
of d
iscr
imin
ator
y m
easu
res
impl
emen
ted
Nov
200
8-O
ct 2
015
FIGURE 7.1Protectionism by the G20: A Ranking

The Tide Turns? Trade, Protectionism, and Slowing Global Growth | 23
In Chapter 6, three phases of protectionism were identified since the onset of the crisis (November 2008 to Q3 2010; Q4 2010to Q4 2011; and Q1 2012 onwards). Figure 7.3 breaks the G20 up into the BRICS (including South Africa), the Quad members of the G20 (Canada, Japan, the US, and the EU member states that are part of the G20), and the rest of the G20 and shows what percentage of global protectionism each group was responsible for during each phase of the crisis. An interesting finding is the BRICS’ share of global protectionism has risen from 28% to 33% (see Figure 7.3).
Readers are referred to our 17th report,2 published in July 2015, for a longer examination of the crisis-era policy choices of the BRICS. Balance requires that we make clear that the BRICS tend to liberalise their trade regimes more often than other G20 members, although much of that liberalisation is temporary and renewal of such reform boosts the counts of liberalising measures.
FIGURE 7.2Quarterly resort to protectionism by each G20 member
405 256 938
275 151580
247194
535
515235 740
0%
10%
20%
30%
40%
50%
60%
70%
80%
90%
100%
Phase I Phase II Phase III
BRICS "Quad" Other G20 Rest of world
FIGURE 7.3T h e B R I C S now account for a th ird of global trade
distortions

24 | Global Trade Alert
CHAPTER 8 WHICH COUNTRIES HAVE BEEN HIT THE MOST AND BY WHOM?
The country hit most often by foreign protectionism is China – its commercial interests have suffered 2,429 blows in the seven years from November 2008 to October 2015. Just under half of all protectionism implemented since the crisis began has harmed China’s commercial interests.
The second most hit are the 28 members of the European Union. Since the crisis began, these nations have seen their commercial interests harmed 2,297 times. Interestingly, 256 of those hits involve measures where one EU member state has harmed another EU member.
The third most hit jurisdiction is the United States, whose commercial interests have taken 1,790 hits in the seven years since the first crisis-era G20 summit in November 2008. This year these three most hit jurisdictions have seen their commercial interests hit 286, 272, and 212 times, respectively.
Map 8.1 reveals the number of hits to their commercial interests faced by every nation since the crisis began.
While attention in the run up to G20 summits is often on the largest economic powers, the harm done to other nations
should not be overlooked. For example, with the latest revision to our database the number of measures harming the commercial interests of the Least Developed Countries (LDCs) has risen to 756. At the end of 2014 that total was 494, suggesting that previous estimates of the harm done to LDC commercial interests may need to be revised upwards.
For those interested in the harm done by G20 members to other G20 members, please consult Figure 8.2. The darkest cells in Figure 8.2 indicate the bilateral trading relationships within the G20 where the hits to commercial interests occur most often.
Looking along each row of this figure one can identify which G20 members have hit their fellow G20 members most often – here, Russia and India stand out (both have hit 9 other G20 members more than 150 times). Looking at the columns of this figure, one can identify which G20 members have been hit the most often by other G20 members. In this regard, China stands out as the nation targeted most heavily by other G20 countries. In contrast, Argentina and Saudi Arabia are rarely targeted by other G20 members.
0
1 − 349
350 − 699
700 − 1049
1050 or more
Number of times harmed by protectionist measures that
are currently in force
FIGURE 8.1The global incidence of protectionism, 2008-2015

The Tide Turns? Trade, Protectionism, and Slowing Global Growth | 25
FIGURE 8.2Beggaring thy neighbour: The harm done by each G20 member to its peers

26 | Global Trade Alert
CHAPTER 9 WHICH TRADEABLE SECTORS HAVE BEEN HIT THE MOST?
Since the crisis began, five sectors have seen their commercial interests hit more than 500 times (more than any other trade sectors). These five sectors are agriculture, basic chemicals, basic metals, special purpose machinery, and transport equipment (as shown in Figure 9.2). Of the harmful measures implemented since the crisis began, 40% harm one of these five sectors. Together these sectors account for a quarter of global trade.
In the third phase of crisis-era protectionism that began in 2012 (see Chapter 6), each of these five sectors has been hit approximately 200 times. In this phase, over 44% of all harmful measures imposed affected these five sectors (as opposed to 38% for the first two phases). This finding points to a greater concentration of protectionism in a small number of sectors as global trade slowed down and then fell.
Having said that, this finding is not to be confused with the proposition that sectors with larger shares of global trade necessarily get hit with more protectionism. As Figure 9.1 shows, this relationship appears to break down in sectors accounting for more than 4% of global trade.
For example five sectors, each of which generates more than 4% of global trade, account for less than 3% of global protectionism. These sectors are radio, TV, and communications equipment; wastes and scrapes; office machinery and computers; dairy products; and crude petroleum. It is noteworthy that three of these five sectors are inputs to production processes and that protectionism directed towards such inputs may raise the costs and compromise the performance of downstream buyers, some of whom may compete on world markets.
R = 0.48001
0
0.01
0.02
0.03
0.04
0.05
0.06
0.07
0 0.01 0.02 0.03 0.04 0.05 0.06 0.07 0.08 0.09 0.1
Shar
e of
pro
tect
ioni
sm im
pose
d si
nce
Nov
embe
r 20
08
Share of global imports in 2014
FIGURE 9.1In the largest sectors the relationship between size and exposure to protectionism breaks down

The Tide Turns? Trade, Protectionism, and Slowing Global Growth | 27
Num
ber o
f dis
crim
inat
ory
sect
or h
arm
ing
com
mer
cial
inte
rest
s in
giv
en s
ecto
r
FIGURE 9.2Five tradable sectors have been hit over 500 times since the crisis began

28 | Global Trade Alert
CHAPTER 10 WHICH POLICY INSTRUMENTS HAVE BEEN USED THE MOST?
Governments have plenty of means to discriminate against foreign commercial interests. Analyses of the 1930s emphasised tariff hikes, import quotas and competitive devaluations, and the post-war literature on trade policy has often shone the spotlight on trade defence (anti-dumping and countervailing duty measures) and safeguards (measures against import surges).
Perhaps inevitably, this has coloured the data many analysts look at when assessing the fealty of the G20 to its protectionism pledge. Recognising that desperate governments may have a strong incentive to substitute towards less high-profile and less transparent ways of favouring domestic firms over foreign rivals, our approach has always been to keep an open mind and track the resort to a wide range of policy instruments.
Figure 10.1 shows which policy instruments have been used most often to harm foreign commercial interests since the crisis began. They are not confined to the protectionism of yesteryear. Over the past seven years, resort to measures against dumped and subsidised imports, steps taken to limit import surges, and the provision of subsidies and bailouts in the first place are the most common forms of trade distortion
used. Worldwide, we have been able to document over 2,400 such harmful acts against foreign commercial interests.
Tariff increases are the third most used policy instrument, a reflection perhaps that many WTO members have considerable freedom to raise taxes at the border on imported goods without violating their international obligations. Government regulations on foreign firms to hire local workers, buy local parts and components, and to store data locally are the fourth most used policy instrument and, unlike our report before the last G20 summit, has now broken away from the other top ten policy instruments in terms of frequency of use.
Other than export taxes and restrictions, 70% or more of the other most frequently used harmful measures remain in effect. In the case of localisation requirements, adverse investment measures and public procurement measures biased towards domestic firms, over 90% of these measures remain in effect. Such high percentages have been reported throughout the crisis era and raise concerns that the protectionism being imposed is not temporary and that a permanent deterioration of trading conditions has occurred.
1232 1204
786
435352 318
264 230 221 193
0.00
0.10
0.20
0.30
0.40
0.50
0.60
0.70
0.80
0.90
1.00
0
200
400
600
800
1000
1200
1400
Trad
e de
fenc
e/sa
fegu
ard
Stat
e ai
d
Tar
iff m
easu
re
Loca
lisat
ion
requ
irem
ent
Expo
rt ta
xes
or
rest
rain
t
Trad
e fin
ance
Inve
stm
ent
mea
sure
Expo
rt in
cent
ive
Non
tari
ff m
easu
re(n
.e.s
.)
Publ
ic p
rocu
rem
ent
Share
Num
ber
impo
sed
Number imposed since crisis began (LHS scale) Share still in force (RHS)
FIGURE 10.1Top 10 most used harmful measures since the crisis began
1,232measures against dumped imports, subsidised imports, and import surges imposed
1,204 trade-distorting subsidies and bailouts have been granted
F urth er sh ift tow ards murk y p rotectionism in recent y ears

The Tide Turns? Trade, Protectionism, and Slowing Global Growth | 29
While the mix of measures used to discriminate against foreign commercial interests could have changed over time, in fact, as shown in Figure 10.2, by and large this has not been the case. Still, the share of global totals of protectionism associated with trade defence and tariff increases has fallen in recent years and the shares of trade-distorting subsidies and localisation measures have risen. A further shift towards more murky protectionism has occurred as the global economy and global trade have slowed down.
FIGURE 10.2Little change in the mix of protectionism since the crisis began

30 | Global Trade Alert
CHAPTER 11 HOW SIGNIFICANT ARE TRADE DEFENCE ACTIONS?
Put succinctly, the answer to this question is “not very” – as seen from the perspective of trade flows affected and in spite of the fact that during the crisis era anti-dumping, anti-subsidy, and safeguard actions are the most used instrument to discriminate against foreign commercial interests. This is not to say that for firms facing these measures, threatened by ‘unfair trade’ investigations, or sectors where resort to these measures is rife are trivially affected.
The number of new anti-dumping and anti-subsidy duties implemented per year during the crisis era is fairly stable (see the upper panel of Figure 11.1). Even so, there has been some falling off since 2013. A decline in the number of new safeguards implemented is more perceptible, with the number of new such measures implemented to date in 2015 a third of the total imposed in 2009 (see the lower panel of Figure 11.1).
Over time, some measures lapse and new measures are added. What, then, has happened to the stock of these measures that are still in force? The stock of anti-dumping and anti-subsidy duties that were imposed since 2009 and are still in force has reached almost 1,000 (Figure 1.1.).
In the first instance, under WTO rules these particular measures are supposed to last up to five years, so measures imposed in 2009 and 2010 should have come up, or are coming up, for renewal. It is telling, therefore, that more than 60% of the 2009 measures are still in force, casting doubt on claims that trade defence measures are necessarily temporary. From the perspective of some corporate decision-makers, an anti-dumping duty that is renewed, and can therefore last up to 10 years, is for all intents and purposes a permanent measure given the length of many planning horizons.
With respect to safeguard measures, the situation is different (see the lower panel of Figure 11.1); the total stock of crisis-era safeguard measures still in force has stabilised in the range of 60 to 70. More than half of the safeguard measures undertaken in the early crisis era (specifically 2009 to 2011) have been unwound.
Given the limited number of safeguard actions and the surgical nature of anti-dumping and anti-subsidy actions, it is perhaps not that surprising that the share of world trade potentially covered by these measures is small. Using United Nations trade data, we matched the trade defence and safeguard measures to the underlying trade flows as best we could. Our approach probably overestimates the amount of trade actually affected,1 hence the qualifier “potentially.”
Figure 11.2 shows how little of world trade is affected by trade defence measures imposed during the crisis era. Our estimates of potential trade affected never exceed 2% of world trade. Despite their numbers, then, as far as global trade flows are concerned, anti-dumping, anti-subsidy, and safeguard actions are not where the action is. Some might object – perhaps fairly – to this conclusion. After all, our estimates imply that in 2015, over $300 billion of trade ispotentially affected by these measures, an amount which is just over half of Africa’s total exports.
2 Weuseddataatthe4-digitlevelofdisaggregation,whereasmanytradedefencemeasurestargetevenfinerproductcategoriesand,sometimes,targetspecific(asopposedtoall)firmsshippingfromaparticularexportingnation.

The Tide Turns? Trade, Protectionism, and Slowing Global Growth | 31
0.00
0.10
0.20
0.30
0.40
0.50
0.60
0.70
0.80
0.90
1.00
0
100
200
300
400
500
600
700
800
900
1000
2009 2010 2011 2012 2013 2014 2015
Share
Num
ber
of m
easu
res
New measures implemented in given year (left-hand scale)
Total number of crisis-era measures still in force (left-hand scale)
Share of given year's measures still in force (right-hand scale)
Anti-dumping and anti-subsidy measures
FIGURE 11.1Resort to anti-dumping and anti-subsidy measures far outpaces safeguard actions
0.00
0.10
0.20
0.30
0.40
0.50
0.60
0.70
0.80
0.90
1.00
0
10
20
30
40
50
60
70
80
90
100
2009 2010 2011 2012 2013 2014 2015
Share
Num
ber
of m
easu
res
New measures implemented in given year (left-hand scale)
Total number of crisis-era measures still in force (left-hand scale)
Share of given year's measures still in force (right-hand scale)
Safeguards (import surge) measures
0.00%
0.20%
0.40%
0.60%
0.80%
1.00%
1.20%
1.40%
1.60%
1.80%
2.00%
2009 2010 2011 2012 2013 2014 2015
Perc
enta
ge o
f wor
ld tr
ade
aec
ted
Anti-dumping and anti-subsidy Safeguards Total
FIGURE 11.2Less than 2% of world trade is potentially affected by crisis-era trade defense measures

32 | Global Trade Alert
CHAPTER 12 HOW MUCH DO OFFICIAL REPORTS UNDERSTATE PROTECTIONISM?
The answer to this question can range from 57% to 250%. Much turns on what policies are considered protectionist and which countries’ policy choices are considered.
What the WTO “headline” numbers really captureThe “headline” numbers reported by the WTO Secretariat in their monitoring reports on G20 protectionism depend critically on the following three design choices:
They refer only to “trade restrictive” measures (trade remedy measures, import, export, and “other” measures).
They refer only to the actions of the G20 governments
The totals for a given reporting period are not updated over time, even if new information comes to light.
These three choices should be borne in mind when assessing the WTO’s reports. Depart from any one of these three choices and the number of problematic crisis-era policy interventions rises considerably.
To be fair, the WTO does collect information on “general support measures”, which can include bailouts. But the WTO does not include that information in the totals that are highlighted to policymakers and the press.
The WTO has also assembled a searchable Trade Monitoring Database (TMB) that includes a wider range of measures than those included in its headline numbers. This database includes government interventions by non-G20 as well as G20 governments.
The WTO’s TMB is less than half the size of the GTA databaseA direct comparison of the size of the WTO and GTA databases is possible and the key findings are summarised in Figure 12.1. Whether one focuses on the G20 countries or takes a global perspective, the GTA database contains more than twice as much information as the WTO’s Trade Monitoring
Database. The differences here have nothing to do with the length of the time horizon – the WTO database contains policy initiatives imposed since October 2008, whereas those entries in the GTA database relate to measures announced or implemented since November 2008.
Even in the most traditional areas of trade policy – such as tariff changes and trade remedy actions – the GTA initiative contains more information. This is particularly surprising as governments have to submit information on trade remedy actions to the WTO, in which case collating that information should be straightforward. Moreover, tariff increases are pretty transparent and should be easier to spot. In both cases, more measures have been documented by the GTA team.
0
1000
2000
3000
4000
5000
6000
7000
8000
Total number of entries
Total number of entries relating to
G20
Total number of entries on trade
remedies
Total number of entries on tari s
Additional entries in the GTA WTO TMB
FIGURE 12.1T h e G T A database includes 14 8 % more information about
th e G 20’ s p olicy initiatives

The Tide Turns? Trade, Protectionism, and Slowing Global Growth | 33
Given the larger set of information collected by the GTA – on the G20 and worldwide – it may not be that surprising to learn the WTO’s headline numbers understate the amount of protectionism being imposed, to which we now turn. (Incidentally, the WTO’s reports understate the amount of trade liberalisation as well.)
The WTO “headline” numbers for the G20 understate protectionism by at least 57%The cleanest comparison between the WTO’s headline numbers and comparable totals for the GTA is presented in Table 12.1. Taking the WTO’s reported numbers for the four categories of “trade restrictive” measures and focusing on the same reporting periods, this table compares the number of such measures found by the GTA team to be harmful with those published in the WTO’s trade monitoring reports.
Since October 2008, the WTO found that 1,441 trade restrictive measures have been implemented by the G20. The comparable figure in the GTA database is 57% higher at 2,276. The under-reporting gap of the WTO on this narrow set of protectionist measures has grown over time because the GTA team carries on collecting information on earlier reporting periods with the goal of providing the most extensive coverage possible.
If a broader definition of protectionism is employed – and this is certainly merited, since the WTO’s set of trade restrictive measures covers at most trade in goods, and therefore not other forms of 21st century commerce – then the total number of harmful measures implemented by the G20 nations rises to 3,581. That number is 148% higher than the headline totals reported by the WTO.
For those interested in the quantum of protectionism implemented worldwide, when taking account of all of the ways in which governments can discriminate against foreign commercial interests, the total number of such measures documented by the GTA team rises to 5,072. This latter total is 250% higher than the headline number reported by the WTO.
Overall, no matter what measures are taken and what countries are considered, the official headline totals on the resort to protectionism during the crisis era substantially understate the scale of the problem. Sustained data collection by the GTA team - as described in the next chapter – has opened up sizeable differences in the reported totals of protectionism. These gaps will continue to widen unless the WTO Secretariat changes its practices. For those interested in an open world trading system, it is difficult to see how current official monitoring practice aligns with that goal.
TABLE 12.1 The GTA database contains 57% more “trade restrictive measures” (as defined by the WTO)
WTO report-
ing period
Category of trade restrictive measure Total for a given reporting periodTrade remedy Import Export Other
Total in WTO report
GTA total for same type of
measure
Total in WTO report
GTA total for same type of
measure
Total in WTO report
GTA total for same type of
measure
Total in WTO report
GTA total for same type of mea-sure*
Total in WTO report
GTA total for same type of
measure
Mid-Oct 10 to Apr 11
53 75 52 68 11 23 6 25 122 191
May 11 to mid-Oct 11
44 85 36 52 19 25 9 21 108 183
Mid-Oct 11 to mid-May 12
66 89 39 62 11 13 8 24 124 188
Mid-May 12 to mid-Oct 12
46 71 20 38 4 8 1 23 71 140
Mid-Oct 12 to mid-May 13
67 72 29 62 7 10 6 34 109 178
Mid-May 13 to mid-Nov 13
70 67 36 52 8 15 2 31 116 165
Mid-Nov 13 to mid-May 14
66 87 25 53 17 22 4 29 112 191
Mid-May 14 to mid-Oct 14
54 51 25 40 9 10 5 41 93 142
Mid-Oct 14 to mid-May 15
71 81 32 50 10 16 6 49 119 196
Mid-May 15 to mid-Oct 15
48 52 26 36 11 11 1 29 86 128
Since October 2008
1034 664 207 1441 2276
*GTAcounthereonlyincludesimplementedmeasuresencouraginguseoflocalcontent.
34 | Global Trade Alert
CHAPTER 13 WHAT’S NEW IN THE GLOBAL TRADE ALERT DATABASE?
Since the publication of our last pre-G20 Leaders Summit report in November 2014, the GTA team has added 1,929 measures to the database.1 The total number of measures published by the GTA team since it began operations in June 2009 stands at 7,713. Over the past two years, the GTA database has doubled in size, reflecting in part the greater activities of governments and possibly improved data collection and assessment methods on our part.
Such has been the data collection effort that during the past 12 months:
The number of measures implemented by G20 membersthat have been documented, assessed, and published has risen from 3,449 to 4,866.
The number of measures that almost certainly or likely discriminate against foreign commercial interests in the database has risen from 3,826 to 5,072.
The number of implemented discriminatory trade defencemeasures documented has risen from 1,030 to 1,233.
The number of implemented harmful subsidies and bailoutsdocumented has risen from 825 to 1,204 measures.
The number of implemented tariff increases documented increased from 625 to 786 measures.
The number of harmful localisation measures – whichhave gained in prominence in trade policy deliberations in recent years – that have been documented has risen from 355 to 435.
The identification of “leads” (information about planned or implemented government policy initiatives) is an important matter which has received plenty of attention during 2015. In addition to expanding the number of websites and publications that are consulted on a regular basis, attempts have been made to design ever-more accurate algorithms to search social media sites, such as Twitter. Doing so is an iterative process. In the period from June to October 2015, an average of 32.5 leads were found every week using Twitter.
There was considerable variation in the number of leads found per week, with a standard deviation of 17.
One feature has not changed: the procedures used to assess submissions by the team for publication on the website. Each submission is reviewed by two persons before publication is recommended. Many measures are rejected for publication, often on the grounds that the differences in relative treatment (between domestic and foreign commercial interests) are hard to establish. Certain subsidy measures fall below consistently applied de minimus thresholds and are not published.
A longer account of the data collection and assessment methods used by the GTA team can be found in Section 3.1 of Evenett and Fritz (2015).
ReferenceEvenett, S. J. and J. Fritz (2015), Throwing Sand In The Wheels: How Foreign Trade Distortions Slowed LDC Export-Led Growth,London: CEPR Press.
1 TheadditionofnewmeasurestotheGTAdatabaseisonlyoneindicatorofactivity.Somemeasures,inparticularthenumeroustradedefencemeasures,requireupdatingseveraltimes.
1,929measures added to GTA database in past 12 months
GTA database now includes 7,713 reports on government actions
Coverage of G20 actions rises to 4,866 measures
An average of 32.5 leads found on social media from June to October 2015

The Tide Turns? Trade, Protectionism, and Slowing Global Growth | 35
WHAT IS THE GLOBAL TRADE ALERT? Global Trade Alert provides information in real time on state measures taken during the current global economic downturn that are likely to discriminate against foreign commerce. Global Trade Alert is:
Independent: GTA is a policy-oriented and research initiative of the Centre for Economic Policy Research (CEPR), an independent academic and policy research think-tank based in London, UK. Simon J. Evenett, the co-director of CEPR’s International Trade and Regional Economics Programme, is the coordinator of the GTA.
Comprehensive: GTA complements and goes beyond the WTO, UNCTAD, and OECD’s monitoring initiatives by identifying those trading partners likely to be harmed by state measures. The GTA considers a broader range of policy instruments than other monitoring initiatives.
Accessible: The GTA website allows policy-makers, exporters, the media, and analysts to search the posted government measures by implementing country, by trading partners harmed, and by sector. Third parties can report suspicious state measures and governments have the right to reply to any of their measures listed on the website.
Transparent: The GTA website represents a major step forward in transparency of national policies, reporting not only the measures taken but identifies the implementing country, trading partners likely harmed, and product lines and sectors affected.
Timely: The up-to-date information and informed commentary provided by Global Trade Alert will facilitates assessments of whether the G20 pledge not to “repeat the historic mistakes of protectionism of previous eras” is met, and the bite of multilateral trade rules.
For further information, visit www.GlobalTradeAlert.org
ACKNOWLEDGEMENTS Many individuals contributed to the production of this report. In the past year Ajsun Aly, Nithya Anand, Morgan Boëffard, Steven Chiu, Michael Füglister, Craig van Grasstek, Chintan Jadwani, Josse Jakobsen, Youngchan Kim, Rachel Lee, Piotr Lukaszuk, Iva Mihaylova, and Adelina Selimi documented government policy interventions for possible inclusion in the GTA database. Their diligence and productivity are greatly appreciated.
The format of this report is much different from previous reports and this reflects the advice of the St. Gallen-based GTA team plus feedback over the year from trade policy experts. More than two dozen experts were polled on several options for the revamp of this report and their advice was gratefully received.
To say that Johannes Fritz manages the day-to-day operations of the Global Trade Alert barely does justice to his many contributions to this initiative. For example, this report bears the hallmarks of his dedication, adaptability, and common sense. Anil Shamdasani not only prepared this report for publication in his usual efficient manner but also contributed significantly to its redesign.
The Global Trade Alert is a project of the Centre for Economic Policy Research (CEPR), whose leadership has provided sustained support for this initiative. In the past year Richard Baldwin and Tessa Ogden have offered valuable guidance.
Simon J. Evenett, Coordinator.

36 | Global Trade Alert

The Tide Turns? Trade, Protectionism, and Slowing Global Growth | 37
HOLD THEIR FEET TO THE FIRE: THE TRACK RECORD OF EACH G20 MEMBER

38 | Global Trade Alert
ARGENTINA
0.37% of world imports in 2014
0.36% of world exports in 2014
TOP 10 IMPORT SOURCES IN 2014
SHARE OF ARGENTINA’S IMPORTS
Brazil 22.97%China 17.30%
United States 14.28%Germany 5.68%
Trinidad and Tobago 2.98%Mexico 2.65%
Italy 2.63%France 2.29%Japan 2.22%
Russian Federation 2.17%
TOP 10 EXPORT DESTINATIONS IN 2014
SHARE OF ARGENTINA’S EXPORTS
Brazil 22.34%China 8.29%
United States 6.70%Chile 4.60%
Germany 3.39%India 3.18%
Algeria 3.05%Paraguay 2.80%Canada 2.78%Spain 2.65%
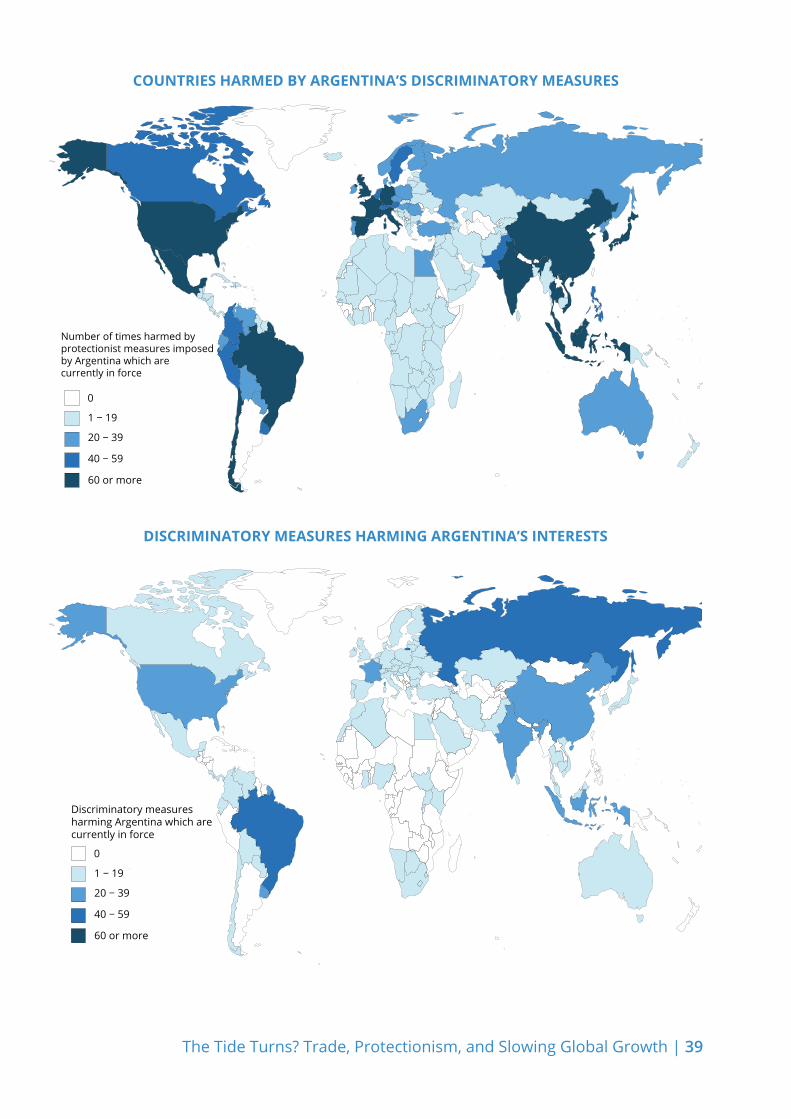
The Tide Turns? Trade, Protectionism, and Slowing Global Growth | 39
DISCRIMINATORY MEASURES HARMING ARGENTINA’S INTERESTS
COUNTRIES HARMED BY ARGENTINA’S DISCRIMINATORY MEASURES
0
1 − 19
20 − 39
40 − 59
60 or more
Discriminatory measuresharming Argentina which arecurrently in force
0
1 − 19
20 − 39
40 − 59
60 or more
Number of times harmed by protectionist measures imposed by Argentina which arecurrently in force

40 | Global Trade Alert
ARGENTINANumber of liberalising measures imposed since November 2008
ARGENTINATrack record of liberaisation

The Tide Turns? Trade, Protectionism, and Slowing Global Growth | 41
ARGENTINANumber of discriminatory measures imposed since November 2008
ARGENTINATrack record of protectionism

42 | Global Trade Alert
AUSTRALIA
1.30% of world imports in 2014
1.43% of world exports in 2014
TOP 10 IMPORT SOURCES IN 2014
SHARE OF AUSTRALIA’S IMPORTS
China 21.21%United States 10.90%
Japan 7.01%Singapore 5.13%Germany 4.88%
South Korea 4.71%Malaysia 4.54%Thailand 4.36%
New Zealand 3.23%United Kingdom 2.51%
TOP 10 EXPORT DESTINATIONS IN 2014
SHARE OF AUSTRALIA’S EXPORTS
China 38.92%Japan 19.25%
South Korea 8.14%United States 4.16%
India 3.96%Hong Kong 3.35%Malaysia 2.46%Indonesia 2.25%Thailand 2.16%
New Zealand 2.06%

The Tide Turns? Trade, Protectionism, and Slowing Global Growth | 43
0
1 − 19
20 − 39
40 − 59
60 or more
Discriminatory measuresharming Australia which arecurrently in force
0
1 − 19
20 − 39
40 − 59
60 or more
Number of times harmed by protectionist measures imposed by Australia which arecurrently in force
DISCRIMINATORY MEASURES HARMING AUSTRALIA’S INTERESTS
COUNTRIES HARMED BY AUSTRALIA’S DISCRIMINATORY MEASURES

44 | Global Trade Alert
AUSTRALIANumber of liberalising measures imposed since November 2008
AUSTRALIATrack record of liberalisation

The Tide Turns? Trade, Protectionism, and Slowing Global Growth | 45
AUSTRALIATrack record of protectionism
AUSTRALIANumber of discriminatory measures imposed since November 2008

46 | Global Trade Alert
BRAZIL
1.31% of world imports in 2014
1.25% of world exports in 2014
TOP 10 IMPORT SOURCES IN 2014
SHARE OF BRAZIL’S IMPORTS
China 16.58%United States 15.67%
Argentina 6.28%Germany 6.14%Nigeria 4.22%
South Korea 3.79%India 2.95%Italy 2.80%
Japan 2.62%France 2.53%
TOP 10 EXPORT DESTINATIONS IN 2014
SHARE OF BRAZIL’S EXPORTS
China 23.60%United States 13.95%
Argentina 6.49%Germany 5.57%
Japan 4.43%Netherlands 2.72%
Chile 2.59%India 2.53%
South Korea 2.24%Mexico 2.04%

The Tide Turns? Trade, Protectionism, and Slowing Global Growth | 47
0
1 − 19
20 − 39
40 − 59
60 or more
Discriminatory measuresharming Brazil which arecurrently in force
DISCRIMINATORY MEASURES HARMING BRAZIL’S INTERESTS
COUNTRIES HARMED BY BRAZIL’S DISCRIMINATORY MEASURES
0
1 − 19
20 − 39
40 − 59
60 or more
Number of times harmed by protectionist measures imposed by Brazil which arecurrently in force

48 | Global Trade Alert
BRAZILNumber of liberalising measures imposed since November 2008
BRAZILTrack record of liberalisation

The Tide Turns? Trade, Protectionism, and Slowing Global Growth | 49
BRAZILNumber of discriminatory measures imposed since November 2008
BRAZILTrack record of protectionism
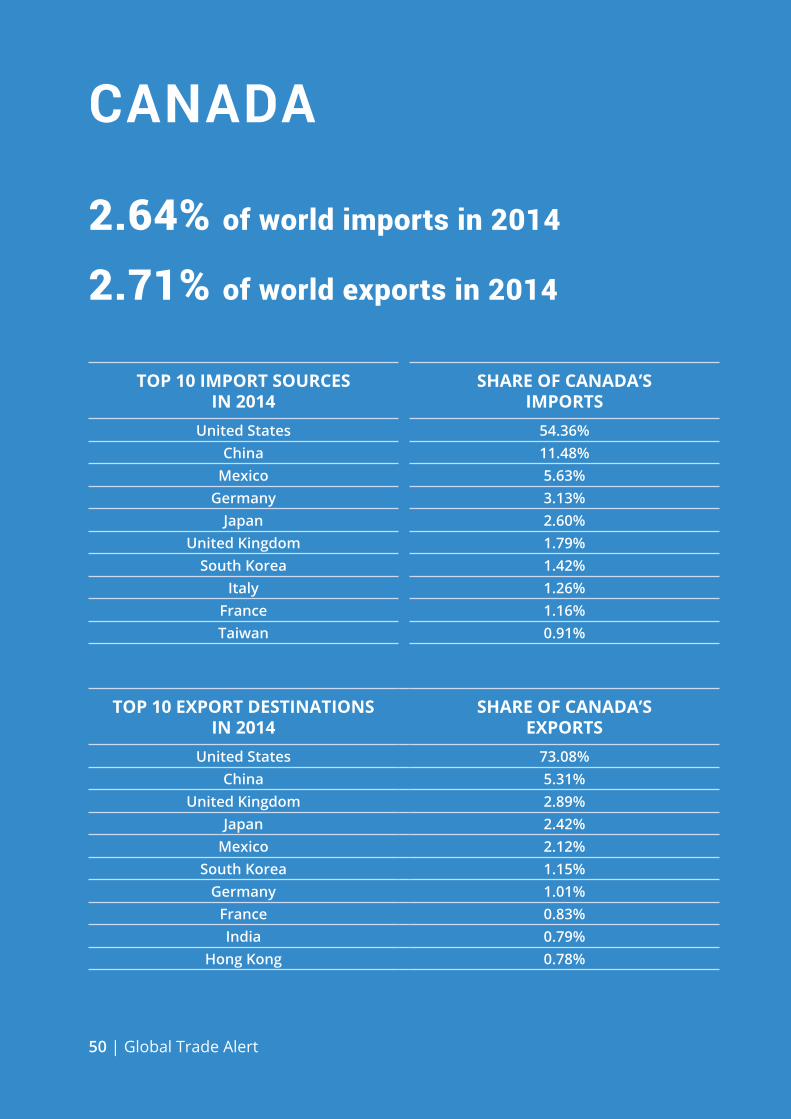
50 | Global Trade Alert
CANADA
2.64% of world imports in 2014
2.71% of world exports in 2014
TOP 10 IMPORT SOURCES IN 2014
SHARE OF CANADA’S IMPORTS
United States 54.36%China 11.48%
Mexico 5.63%Germany 3.13%
Japan 2.60%United Kingdom 1.79%
South Korea 1.42%Italy 1.26%
France 1.16%Taiwan 0.91%
TOP 10 EXPORT DESTINATIONS IN 2014
SHARE OF CANADA’S EXPORTS
United States 73.08%China 5.31%
United Kingdom 2.89%Japan 2.42%
Mexico 2.12%South Korea 1.15%
Germany 1.01%France 0.83%India 0.79%
Hong Kong 0.78%
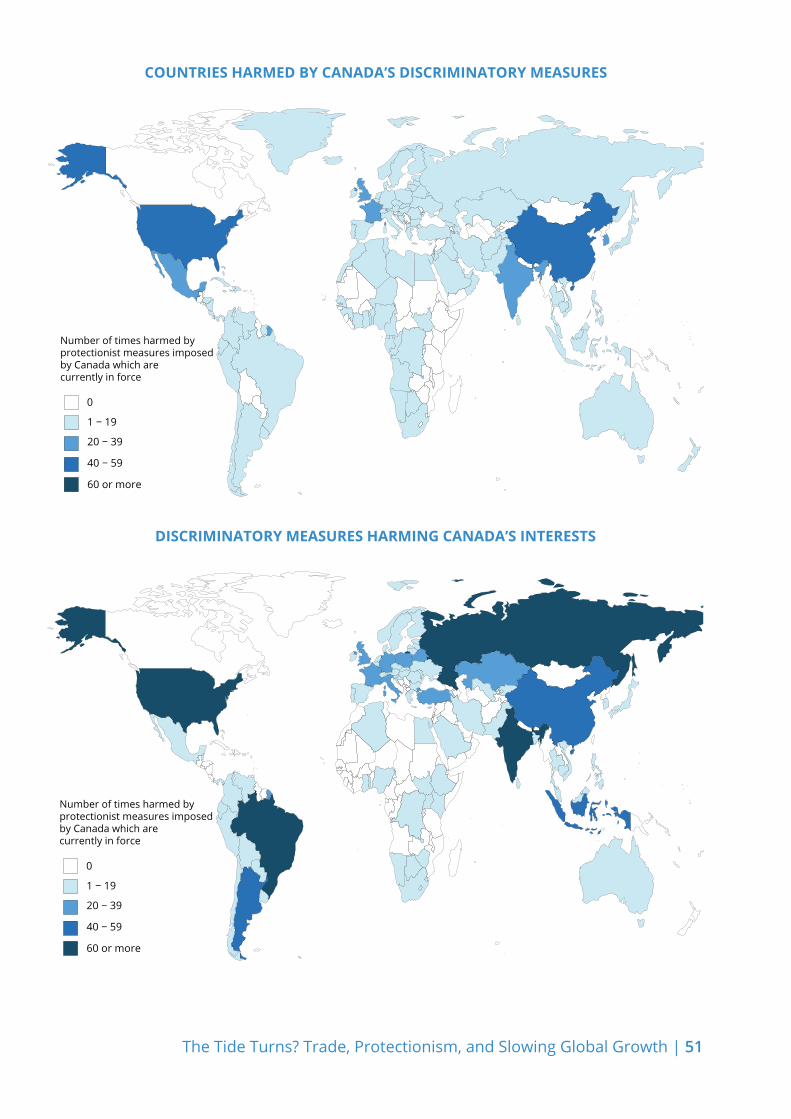
The Tide Turns? Trade, Protectionism, and Slowing Global Growth | 51
0
1 − 19
20 − 39
40 − 59
60 or more
Number of times harmed by protectionist measures imposed by Canada which arecurrently in force
0
1 − 19
20 − 39
40 − 59
60 or more
Number of times harmed by protectionist measures imposed by Canada which arecurrently in force
DISCRIMINATORY MEASURES HARMING CANADA’S INTERESTS
COUNTRIES HARMED BY CANADA’S DISCRIMINATORY MEASURES

52 | Global Trade Alert
CANADANumber of liberalising measures imposed since November 2008
CANADATrack record of liberalisation

The Tide Turns? Trade, Protectionism, and Slowing Global Growth | 53
CANADANumber of discriminatory measures imposed since November 2008
CANADATrack record of protectionism

54 | Global Trade Alert
CHINA
11.19% of world imports in 2014
13.11% of world exports in 2014
TOP 10 IMPORT SOURCES IN 2014
SHARE OF CHINA’S IMPORTS
South Korea 9.71%Japan 8.32%
United States 8.16%Taiwan 7.76%
Germany 5.36%Australia 4.99%Malaysia 2.84%
Brazil 2.64%Saudi Arabia 2.48%South Africa 2.28%
TOP 10 EXPORT DESTINATIONS IN 2014
SHARE OF CHINA’S EXPORTS
United States 20.35%Hong Kong 11.69%
Japan 7.92%Germany 4.67%
South Korea 3.93%Mexico 2.89%
United Kingdom 2.80%India 2.54%
France 2.46%Canada 2.31%
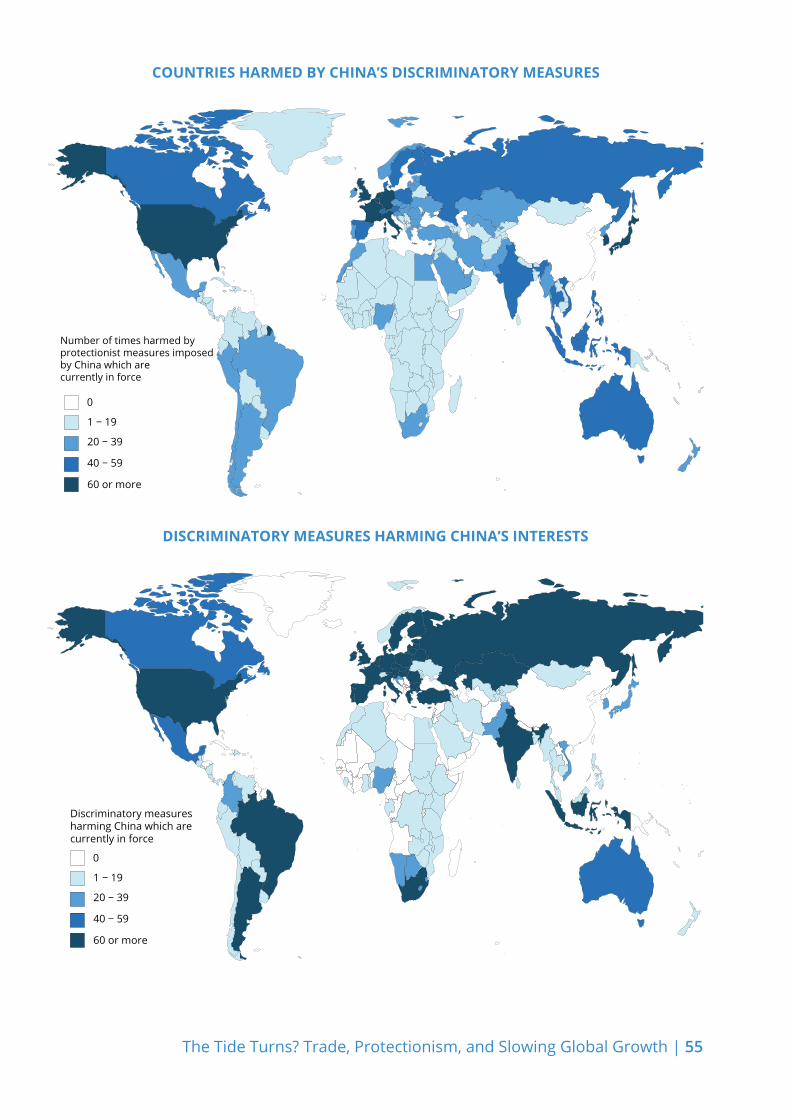
The Tide Turns? Trade, Protectionism, and Slowing Global Growth | 55
0
1 − 19
20 − 39
40 − 59
60 or more
Discriminatory measuresharming China which arecurrently in force
0
1 − 19
20 − 39
40 − 59
60 or more
Number of times harmed by protectionist measures imposed by China which arecurrently in force
DISCRIMINATORY MEASURES HARMING CHINA’S INTERESTS
COUNTRIES HARMED BY CHINA’S DISCRIMINATORY MEASURES

56 | Global Trade Alert
CHINANumber of liberalising measures imposed since November 2008
CHINATrack record of liberalisation

The Tide Turns? Trade, Protectionism, and Slowing Global Growth | 57
CHINATrack record of protectionism
CHINANumber of discriminatory measures imposed since November 2008

58 | Global Trade Alert
FRANCE
3.77% of world imports in 2014
3.24% of world exports in 2014
TOP 10 IMPORT SOURCES IN 2014
SHARE OF FRANCE’S IMPORTS
Germany 17.30%China 8.64%
Belgium 8.10%Italy 7.36%
United States 6.41%Spain 6.01%
Netherlands 4.36%United Kingdom 3.99%
Switzerland 2.58%Russian Federation 2.10%
TOP 10 EXPORT DESTINATIONS IN 2014
SHARE OF FRANCE’S EXPORTS
Germany 15.65%United States 8.28%
Belgium 8.13%United Kingdom 7.67%
Italy 7.15%Spain 6.78%China 4.70%
Netherlands 4.03%Switzerland 3.19%
Japan 2.10%

The Tide Turns? Trade, Protectionism, and Slowing Global Growth | 59
0
1 − 19
20 − 39
40 − 59
60 or more
Discriminatory measuresharming France which arecurrently in force
0
1 − 19
20 − 39
40 − 59
60 or more
Number of times harmed by protectionist measures imposed by France which arecurrently in force
DISCRIMINATORY MEASURES HARMING FRANCE’S INTERESTS
COUNTRIES HARMED BY FRANCE’S DISCRIMINATORY MEASURES

60 | Global Trade Alert
FRANCENumber of liberalising measures imposed since November 2008
FRANCETrack record of liberalisation

The Tide Turns? Trade, Protectionism, and Slowing Global Growth | 61
FRANCETrack record of protectionism
FRANCENumber of discriminatory measures imposed since November 2008

62 | Global Trade Alert
GERMANY
6.99% of world imports in 2014
7.81% of world exports in 2014
TOP 10 IMPORT SOURCES IN 2014
SHARE OF GERMANY’S IMPORTS
Netherlands 8.84%China 8.76%France 7.26%
United States 5.45%Italy 5.24%
Switzerland 4.40%Poland 4.32%
Belgium 4.19%United Kingdom 4.16%
Czech Rep. 4.00%
TOP 10 EXPORT DESTINATIONS IN 2014
SHARE OF GERMANY’S EXPORTS
United States 9.02%France 8.27%China 7.68%
United Kingdom 7.34%Netherlands 6.05%
Italy 5.31%Austria 4.64%Belgium 4.36%
Switzerland 4.35%Poland 3.44%

The Tide Turns? Trade, Protectionism, and Slowing Global Growth | 63
0
1 − 19
20 − 39
40 − 59
60 or more
Discriminatory measuresharming Germany which arecurrently in force
0
1 − 19
20 − 39
40 − 59
60 or more
Number of times harmed by protectionist measures imposed by Germany which arecurrently in force
DISCRIMINATORY MEASURES HARMING GERMANY’S INTERESTS
COUNTRIES HARMED BY GERMANY’S DISCRIMINATORY MEASURES

64 | Global Trade Alert
GERMANYNumber of liberalising measures imposed since November 2008
GERMANYTrack record of liberalisation

The Tide Turns? Trade, Protectionism, and Slowing Global Growth | 65
GERMANYTrack record of protectionism
GERMANYNumber of discriminatory measures imposed since November 2008

66 | Global Trade Alert
INDIA
2.63% of world imports in 2014
1.39% of world exports in 2014
TOP 10 IMPORT SOURCES IN 2014
SHARE OF INDIA’S IMPORTS
China 12.87%Saudi Arabia 7.23%
United Arab Emirates 6.03%Switzerland 4.67%
United States 4.52%Qatar 3.66%Iraq 3.55%
Nigeria 3.46%Indonesia 3.36%
Kuwait 3.32%
TOP 10 EXPORT DESTINATIONS IN 2014
SHARE OF INDIA’S EXPORTS
United States 18.64%United Arab Emirates 7.18%
China 6.74%Hong Kong 5.12%
United Kingdom 4.42%Germany 3.94%Singapore 3.41%
Japan 3.06%Turkey 2.84%France 2.83%

The Tide Turns? Trade, Protectionism, and Slowing Global Growth | 67
0
1 − 19
20 − 39
40 − 59
60 or more
Discriminatory measuresharming India which arecurrently in force
0
1 − 19
20 − 39
40 − 59
60 or more
Number of times harmed by protectionist measures imposed by India which arecurrently in force
DISCRIMINATORY MEASURES HARMING INDIA’S INTERESTS
COUNTRIES HARMED BY INDIA’S DISCRIMINATORY MEASURES

68 | Global Trade Alert
INDIANumber of liberalising measures imposed since November 2008
INDIATrack record of liberalisation

The Tide Turns? Trade, Protectionism, and Slowing Global Growth | 69
INDIATrack record of protectionism
INDIANumber of discriminatory measures imposed since November 2008

70 | Global Trade Alert
INDONESIA
1.02% of world imports in 2014
1.05% of world exports in 2014
TOP 10 IMPORT SOURCES IN 2014
SHARE OF INDONESIA’S IMPORTS
China 17.19%Singapore 14.14%
Japan 9.55%South Korea 6.65%
Malaysia 6.09%Thailand 5.49%
United States 4.60%Saudi Arabia 3.66%
Australia 3.17%Germany 2.30%
TOP 10 EXPORT DESTINATIONS IN 2014
SHARE OF INDONESIA’S EXPORTS
Japan 14.02%China 13.32%
United States 10.53%Singapore 10.21%
India 8.26%South Korea 6.67%
Malaysia 4.61%Thailand 3.96%Australia 2.95%Germany 2.68%

The Tide Turns? Trade, Protectionism, and Slowing Global Growth | 71
0
1 − 19
20 − 39
40 − 59
60 or more
Number of times harmed by protectionist measures imposed by Indonesia which arecurrently in force
0
1 − 19
20 − 39
40 − 59
60 or more
Discriminatory measuresharming Indonesia which arecurrently in force
DISCRIMINATORY MEASURES HARMING INDONESIA’S INTERESTS
COUNTRIES HARMED BY INDONESIA’S DISCRIMINATORY MEASURES

72 | Global Trade Alert
INDONESIANumber of liberalising measures imposed since November 2008
INDONESIATrack record of liberalisation
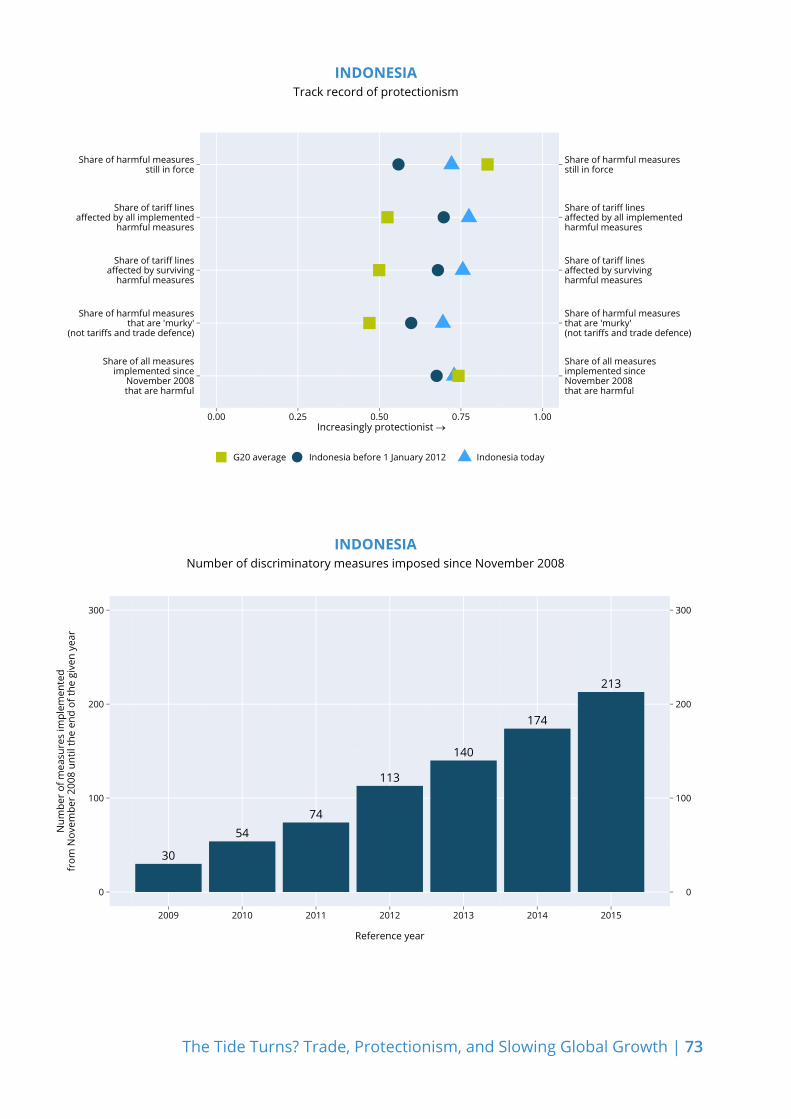
The Tide Turns? Trade, Protectionism, and Slowing Global Growth | 73
INDONESIANumber of discriminatory measures imposed since November 2008
INDONESIATrack record of protectionism

74 | Global Trade Alert
ITALY
2.70% of world imports in 2014
2.74% of world exports in 2014
TOP 10 IMPORT SOURCES IN 2014
SHARE OF ITALY’S IMPORTS
Germany 15.44%France 8.63%China 7.08%
Netherlands 5.55%Spain 4.80%
Russian Federation 4.57%Belgium 4.22%
United States 3.52%Switzerland 2.97%
United Kingdom 2.85%
TOP 10 EXPORT DESTINATIONS IN 2014
SHARE OF ITALY’S EXPORTS
Germany 13.38%France 10.04%
United States 8.79%United Kingdom 5.94%
Switzerland 4.72%Spain 4.31%China 4.00%
Belgium 3.28%Turkey 2.52%Poland 2.38%

The Tide Turns? Trade, Protectionism, and Slowing Global Growth | 75
0
1 − 19
20 − 39
40 − 59
60 or more
Number of times harmed by protectionist measures imposed by Italy which arecurrently in force
0
1 − 19
20 − 39
40 − 59
60 or more
Number of times harmed by protectionist measures imposed by Italy which arecurrently in force
DISCRIMINATORY MEASURES HARMING ITALY’S INTERESTS
COUNTRIES HARMED BY ITALY’S DISCRIMINATORY MEASURES

76 | Global Trade Alert
ITALYNumber of liberalising measures imposed since November 2008
ITALYTrack record of liberalisation
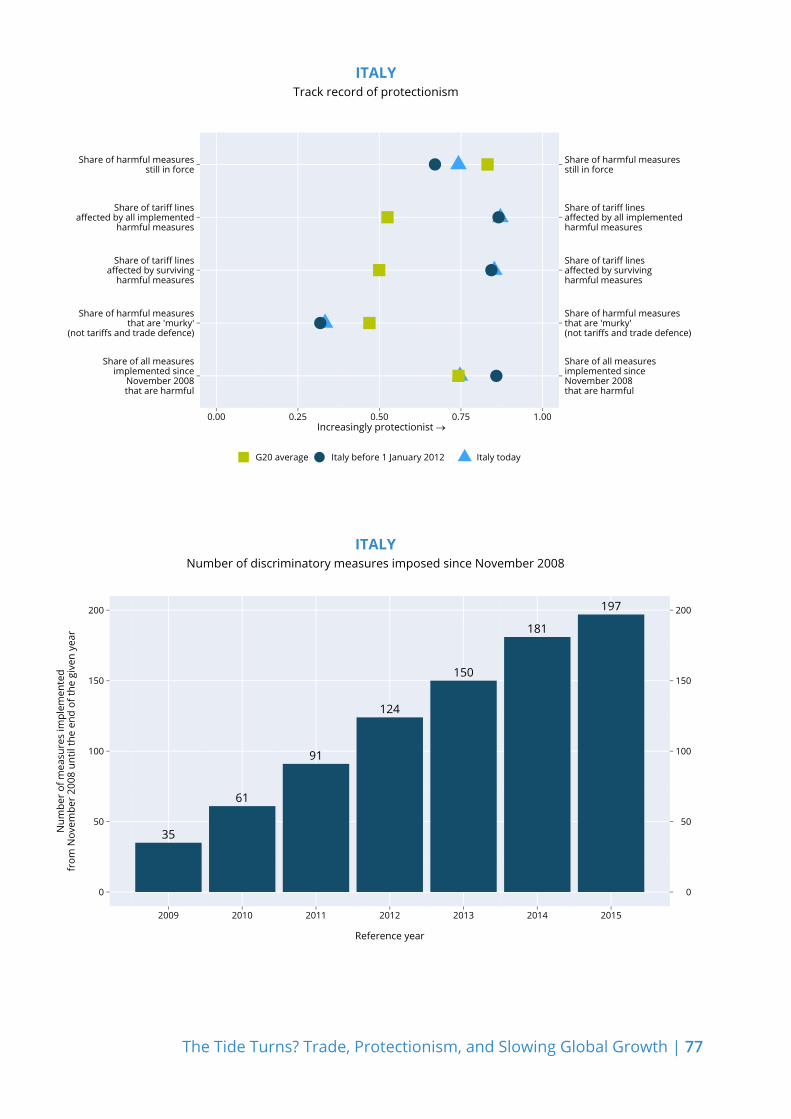
The Tide Turns? Trade, Protectionism, and Slowing Global Growth | 77
ITALYTrack record of protectionism
ITALYNumber of discriminatory measures imposed since November 2008

78 | Global Trade Alert
JAPAN
4.70% of world imports in 2014
4.01% of world exports in 2014
TOP 10 IMPORT SOURCES IN 2014
SHARE OF JAPAN’S IMPORTS
China 22.11%United States 9.05%
Australia 5.88%Saudi Arabia 5.77%
United Arab Emirates 5.06%South Korea 4.21%
Qatar 4.07%Malaysia 3.56%Indonesia 3.14%
Russian Federation 3.09%
TOP 10 EXPORT DESTINATIONS IN 2014
SHARE OF JAPAN’S EXPORTS
China 23.22%United States 19.11%South Korea 7.67%Hong Kong 5.54%
Thailand 5.09%Germany 3.79%Singapore 2.87%
Mexico 2.50%Indonesia 2.42%Malaysia 2.39%

The Tide Turns? Trade, Protectionism, and Slowing Global Growth | 79
0
1 − 19
20 − 39
40 − 59
60 or more
Discriminatory measuresharming Japan which arecurrently in force
0
1 − 19
20 − 39
40 − 59
60 or more
Number of times harmed by protectionist measures imposed by Japan which arecurrently in force
DISCRIMINATORY MEASURES HARMING JAPAN’S INTERESTS
COUNTRIES HARMED BY JAPAN’S DISCRIMINATORY MEASURES

80 | Global Trade Alert
JAPANNumber of liberalising measures imposed since November 2008
JAPANTrack record of liberalisation

The Tide Turns? Trade, Protectionism, and Slowing Global Growth | 81
JAPANNumber of discriminatory measures imposed since November 2008
JAPANTrack record of protectionism

82 | Global Trade Alert
MEXICO
2.29% of world imports in 2014
2.31% of world exports in 2014
TOP 10 IMPORT SOURCES IN 2014
SHARE OF MEXICO’S IMPORTS
United States 48.97%China 16.57%Japan 4.39%
South Korea 3.44%Germany 3.44%Canada 2.51%
Malaysia 1.64%Taiwan 1.59%
Italy 1.30%Spain 1.19%
TOP 10 EXPORT DESTINATIONS IN 2014
SHARE OF MEXICO’S EXPORTS
United States 72.80%Canada 6.44%China 2.77%Spain 1.68%Brazil 1.33%
Colombia 1.31%Germany 1.22%
Japan 1.08%India 0.85%
South Korea 0.81%

The Tide Turns? Trade, Protectionism, and Slowing Global Growth | 83
0
1 − 19
20 − 39
40 − 59
60 or more
Discriminatory measuresharming Mexico which arecurrently in force
DISCRIMINATORY MEASURES HARMING MEXICO’S INTERESTS
COUNTRIES HARMED BY MEXICO’S DISCRIMINATORY MEASURES
0
1 − 19
20 − 39
40 − 59
60 or more
Number of times harmed by protectionist measures imposed by Meico which arecurrently in force
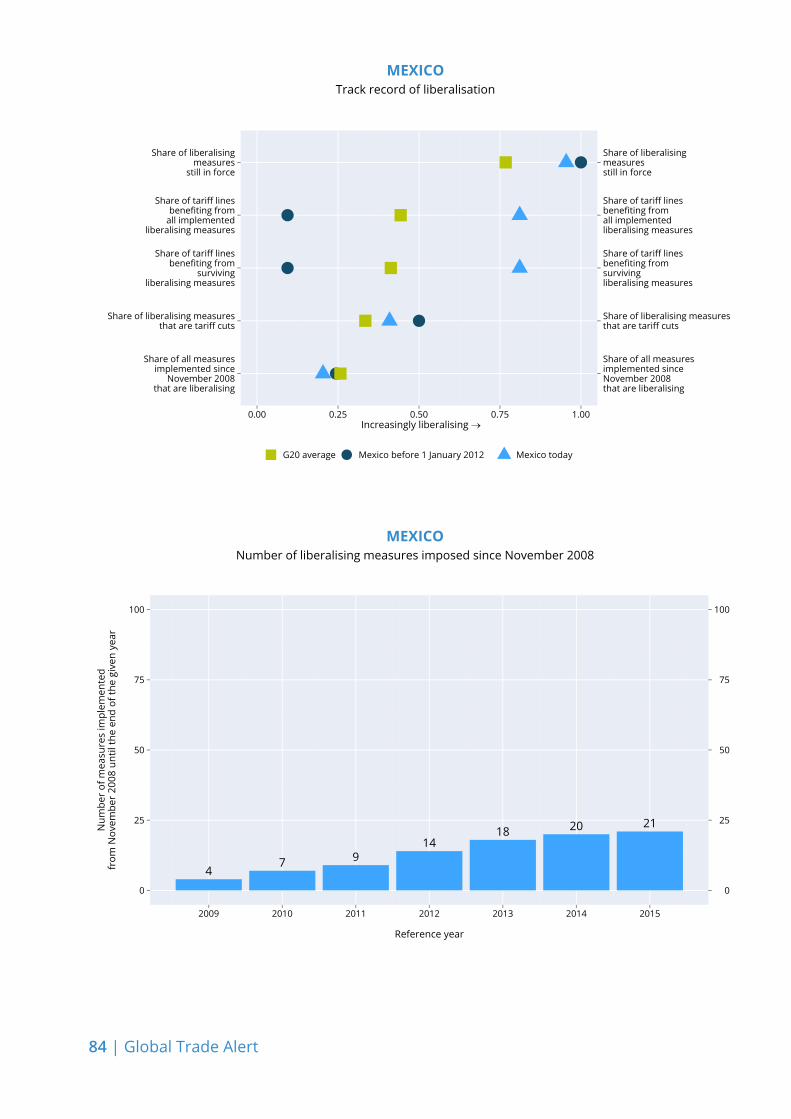
84 | Global Trade Alert
MEXICONumber of liberalising measures imposed since November 2008
MEXICOTrack record of liberalisation

The Tide Turns? Trade, Protectionism, and Slowing Global Growth | 85
MEXICONumber of discriminatory measures imposed since November 2008
MEXICOTrack record of protectionism

86 | Global Trade Alert
RUSSIA
1.64% of world imports in 2014
2.59% of world exports in 2014
TOP 10 IMPORT SOURCES IN 2014
SHARE OF RUSSIA’S IMPORTS
Germany 12.70%Switzerland 7.79%
China 6.80%United Kingdom 5.29%
Belarus 4.28%France 3.80%
Netherlands 3.68%Ireland 3.56%
South Korea 3.49%Ukraine 3.33%
TOP 10 EXPORT DESTINATIONS IN 2014
SHARE OF RUSSIA’S EXPORTS
China 9.19%Germany 8.17%
Japan 5.60%Turkey 5.58%
Netherlands 5.24%United States 5.22%
Poland 5.17%Belarus 4.83%
Italy 4.74%South Korea 3.46%

The Tide Turns? Trade, Protectionism, and Slowing Global Growth | 87
0
1 − 19
20 − 39
40 − 59
60 or more
Discriminatory measuresharming Russia which arecurrently in force
0
1 − 19
20 − 39
40 − 59
60 or more
Number of times harmed by protectionist measures imposed by Russia which arecurrently in force
DISCRIMINATORY MEASURES HARMING RUSSIA’S INTERESTS
COUNTRIES HARMED BY RUSSIA’S DISCRIMINATORY MEASURES

88 | Global Trade Alert
RUSSIANumber of liberalising measures imposed since November 2008
RUSSIATrack record of liberalisation

The Tide Turns? Trade, Protectionism, and Slowing Global Growth | 89
RUSSIANumber of discriminatory measures imposed since November 2008
RUSSIATrack record of protectionism

90 | Global Trade Alert
SAUDI ARABIA
0.90% of world imports in 2014
1.91% of world exports in 2014
TOP 10 IMPORT SOURCES IN 2014
SHARE OF SAUDI ARABIA’S IMPORTS
China 13.07%USA 11.88%India 8.30%
Germany 7.56%South Korea 5.26%
Japan 4.80%United Kingdom 4.37%
Italy 4.07%United Arab Emirates 3.55%
Switzerland 3.18%
TOP 10 EXPORT DESTINATIONS IN 2014
SHARE OF SAUDI ARABIA’S EXPORTS
China 14.54%Japan 14.22%
United States 14.10%South Korea 11.01%
India 9.81%Singapore 4.38%
France 2.82%Bahrain 2.51%Thailand 2.34%
South Africa 2.14%

The Tide Turns? Trade, Protectionism, and Slowing Global Growth | 91
0
1 − 19
20 − 39
40 − 59
60 or more
Discriminatory measuresharming Saudi Arabia whichare currently in force
0
1 − 19
20 − 39
40 − 59
60 or more
Number of times harmed by protectionist measures imposed by Saudi Arabia which arecurrently in force
DISCRIMINATORY MEASURES HARMING SAUDI ARABIA’S INTERESTS
COUNTRIES HARMED BY SAUDI ARABIA’S DISCRIMINATORY MEASURES

92 | Global Trade Alert
SAUDI ARABIANumber of liberalising measures imposed since November 2008
SAUDI ARABIATrack record of liberalisation

The Tide Turns? Trade, Protectionism, and Slowing Global Growth | 93
SAUDI ARABIANumber of discriminatory measures imposed since November 2008
SAUDI ARABIATrack record of protectionism

94 | Global Trade Alert
SOUTH AFRICA
0.57% of world imports in 2014
0.72% of world exports in 2014
TOP 10 IMPORT SOURCES IN 2014
SHARE OF SOUTH AFRICA’S IMPORTS
China 15.53%Germany 10.06%
Saudi Arabia 7.17%United States 6.63%
Nigeria 5.16%India 4.58%Japan 3.80%
United Kingdom 3.29%Italy 2.66%
Thailand 2.39%
TOP 10 EXPORT DESTINATIONS IN 2014
SHARE OF SOUTH AFRICA’S EXPORTS
China 35.47%United States 6.60%
Japan 6.23%United Kingdom 4.80%
India 4.77%Germany 4.76%Botswana 3.94%Hong Kong 3.93%
Zambia 2.46%Mozambique 2.30%

The Tide Turns? Trade, Protectionism, and Slowing Global Growth | 95
0
1 − 19
20 − 39
40 − 59
60 or more
Discriminatory measuresharming South Africa which are currently in force
0
1 − 19
20 − 39
40 − 59
60 or more
Number of times harmed by protectionist measures imposed by South Africa which arecurrently in force
DISCRIMINATORY MEASURES HARMING SOUTH AFRICA’S INTERESTS
COUNTRIES HARMED BY SOUTH AFRICA’S DISCRIMINATORY MEASURES

96 | Global Trade Alert
SOUTH AFRICANumber of liberalising measures imposed since November 2008
SOUTH AFRICATrack record of liberalisation

The Tide Turns? Trade, Protectionism, and Slowing Global Growth | 97
SOUTH AFRICANumber of discriminatory measures imposed since November 2008
SOUTH AFRICATrack record of protectionism

98 | Global Trade Alert
SOUTH KOREA
3.00% of world imports in 2014
3.08% of world exports in 2014
TOP 10 IMPORT SOURCES IN 2014
SHARE OF SOUTH KOREA’S IMPORTS
China 17.15%Japan 10.24%
United States 8.67%Saudi Arabia 6.99%
Qatar 4.90%Germany 4.05%Australia 3.89%Kuwait 3.22%
United Arab Emirates 3.08%Taiwan 2.99%
TOP 10 EXPORT DESTINATIONS IN 2014
SHARE OF SOUTH KOREA’S EXPORTS
China 35.32%United States 12.92%
Japan 6.42%Hong Kong 4.30%Singapore 4.01%
Mexico 2.56%India 2.50%
Indonesia 2.20%Germany 1.98%Australia 1.91%

The Tide Turns? Trade, Protectionism, and Slowing Global Growth | 99
0
1 − 19
20 − 39
40 − 59
60 or more
Number of times harmed by protectionist measures imposed by South Korea which arecurrently in force
0
1 − 19
20 − 39
40 − 59
60 or more
Number of times harmed by protectionist measures imposed by South Korea which arecurrently in force
DISCRIMINATORY MEASURES HARMING SOUTH KOREA’S INTERESTS
COUNTRIES HARMED BY SOUTH KOREA’S DISCRIMINATORY MEASURES

100 | Global Trade Alert
SOUTH KOREANumber of liberalising measures imposed since November 2008
SOUTH KOREATrack record of liberalisation

The Tide Turns? Trade, Protectionism, and Slowing Global Growth | 101
SOUTH KOREANumber of discriminatory measures imposed since November 2008
SOUTH KOREATrack record of protectionism

102 | Global Trade Alert
TURKEY
1.38% of world imports in 2014
0.75% of world exports in 2014
TOP 10 IMPORT SOURCES IN 2014
SHARE OF TURKEY’S IMPORTS
Russian Federation 11.07%China 10.90%
Germany 9.79%United States 5.57%
Italy 5.27%Iran 4.30%
France 3.55%South Korea 3.30%
India 3.02%Spain 2.66%
TOP 10 EXPORT DESTINATIONS IN 2014
SHARE OF TURKEY’S EXPORTS
Germany 13.55%United Kingdom 8.04%
France 6.21%Italy 5.77%
United States 5.60%Spain 4.00%
Russian Federation 3.71%Belgium 3.44%
China 2.82%Switzerland 2.76%

The Tide Turns? Trade, Protectionism, and Slowing Global Growth | 103
0
1 − 19
20 − 39
40 − 59
60 or more
Discriminatory measuresharming Turkey which arecurrently in force
0
1 − 19
20 − 39
40 − 59
60 or more
Number of times harmed by protectionist measures imposed by Turkey which arecurrently in force
DISCRIMINATORY MEASURES HARMING TURKEY’S INTERESTS
COUNTRIES HARMED BY TURKEY’S DISCRIMINATORY MEASURES

104 | Global Trade Alert
TURKEYNumber of liberalising measures imposed since November 2008
TURKEYTrack record of liberalisation
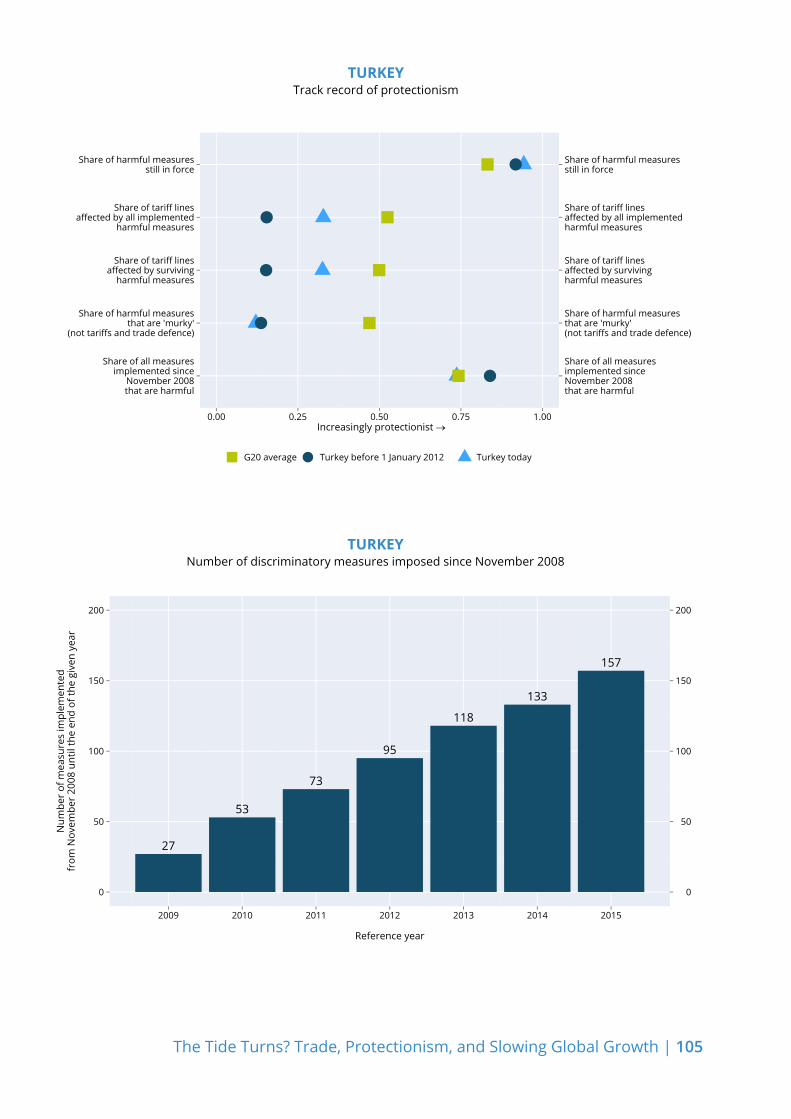
The Tide Turns? Trade, Protectionism, and Slowing Global Growth | 105
TURKEYNumber of discriminatory measures imposed since November 2008
TURKEYTrack record of protectionism
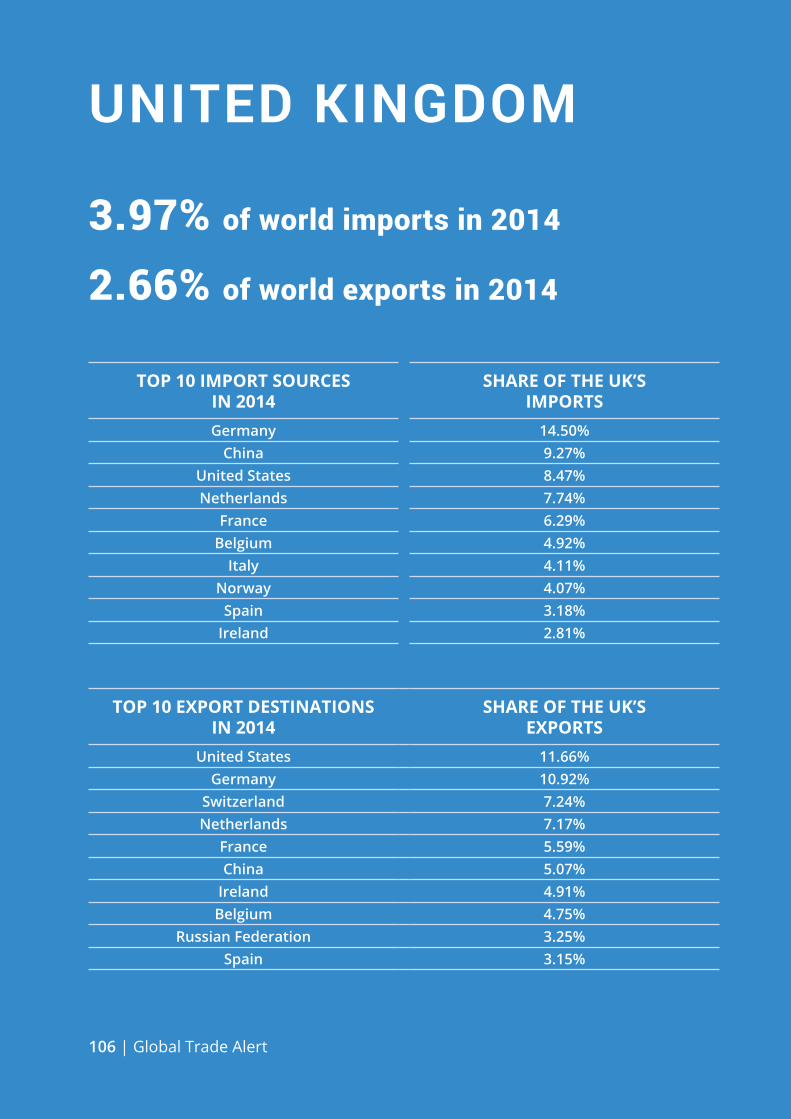
106 | Global Trade Alert
UNITED KINGDOM
3.97% of world imports in 2014
2.66% of world exports in 2014
TOP 10 IMPORT SOURCES IN 2014
SHARE OF THE UK’S IMPORTS
Germany 14.50%China 9.27%
United States 8.47%Netherlands 7.74%
France 6.29%Belgium 4.92%
Italy 4.11%Norway 4.07%
Spain 3.18%Ireland 2.81%
TOP 10 EXPORT DESTINATIONS IN 2014
SHARE OF THE UK’S EXPORTS
United States 11.66%Germany 10.92%
Switzerland 7.24%Netherlands 7.17%
France 5.59%China 5.07%
Ireland 4.91%Belgium 4.75%
Russian Federation 3.25%Spain 3.15%

The Tide Turns? Trade, Protectionism, and Slowing Global Growth | 107
0
1 − 19
20 − 39
40 − 59
60 or more
Discriminatory measuresharming the UK which arecurrently in force
0
1 − 19
20 − 39
40 − 59
60 or more
Number of times harmed by protectionist measures imposed by the UK which arecurrently in force
DISCRIMINATORY MEASURES HARMING THE UK’S INTERESTS
COUNTRIES HARMED BY THE UK’S DISCRIMINATORY MEASURES

108 | Global Trade Alert
UNITED KINGDOMNumber of liberalising measures imposed since November 2008
UNITED KINGDOMTrack record of liberalisation

The Tide Turns? Trade, Protectionism, and Slowing Global Growth | 109
UNITED KINGDOMNumber of discriminatory measures imposed since November 2008
UNITED KINGDOMTrack record of protectionism

110 | Global Trade Alert
UNITED STATES
13.41% of world imports in 2014
8.26% of world exports in 2014
TOP 10 IMPORT SOURCES IN 2014
SHARE OF THE US’ IMPORTS
China 19.91%Canada 14.79%Mexico 12.54%Japan 5.72%
Germany 5.26%South Korea 2.97%
United Kingdom 2.32%Saudi Arabia 2.01%
France 2.00%India 1.93%
TOP 10 EXPORT DESTINATIONS IN 2014
SHARE OF THE US’ EXPORTS
Canada 17.37%Mexico 13.55%China 11.06%Japan 5.15%
Germany 4.62%United Kingdom 4.06%
South Korea 3.15%France 2.90%
Singapore 2.62%Brazil 2.44%

The Tide Turns? Trade, Protectionism, and Slowing Global Growth | 111
0
1 − 19
20 − 39
40 − 59
60 or more
Discriminatory measuresharming the US which arecurrently in force
0
1 − 19
20 − 39
40 − 59
60 or more
Number of times harmed by protectionist measures imposed by the US which arecurrently in force
DISCRIMINATORY MEASURES HARMING THE US’ INTERESTS
COUNTRIES HARMED BY THE US’ DISCRIMINATORY MEASURES

112 | Global Trade Alert
UNITED STATESNumber of liberalising measures imposed since November 2008
UNITED STATESTrack record of liberalisation

The Tide Turns? Trade, Protectionism, and Slowing Global Growth | 113
UNITED STATESTrack record of protectionism
UNITED STATESNumber of discriminatory measures imposed since November 2008

114 | Global Trade Alert
The G20’s principal task of reviving global economic growth has never been easy – it is harder now that world trade is contracting. World trade growth isn’t slowing down – the latest available monthly data compiled for this report suggests that it has been falling in volume and value terms through 2015. On average G20 exports have fallen 4.5% since world trade peaked in value in October 2014.
The 18th report of the Global Trade Alert, published in advance of this weekend’s G20 Leaders Summit in Antalya, Turkey, uses the latest available data on trade flows and on protectionism:
• to highlight the extent of falling world trade,
• to critically evaluate leading explanations for recent global trade dynamics,
• to demonstrate the marked increase in resort to protectionism in 2015,
• and to identify plausible policy initiatives that the G20 should pursue during the coming Chinese Presidency.
CEPR PressCentre for Economic Policy Research33 Great Sutton StreetLondon EC1V 0DX
Tel: +44 (0) 20 7183 8801Fax: +44 (0)20 7183 8820Email: [email protected]: www.cepr.org