Embed Size (px)
Citation preview

A Forrester Total Economic
Impact™ Study
Commissioned By
IBM
Project Director:
Reggie Lau
December 2014
The Total Economic
Impact™ Of
IBM Case Manager

Table Of Contents
Executive Summary .................................................................................... 3
Disclosures .................................................................................................. 5
TEI Framework And Methodology ............................................................ 6
Analysis ........................................................................................................ 7
Financial Summary ................................................................................... 15
IBM Case Manager: Overview .................................................................. 16
Appendix A: Interviewed Customer Description .................................. 17
Appendix B: Total Economic Impact™ Overview ................................. 18
Appendix C: Glossary ............................................................................... 19
Appendix D: Endnotes .............................................................................. 20
ABOUT FORRESTER CONSULTING
Forrester Consulting provides independent and objective research-based
consulting to help leaders succeed in their organizations. Ranging in scope from a
short strategy session to custom projects, Forrester’s Consulting services connect
you directly with research analysts who apply expert insight to your specific
business challenges. For more information, visit forrester.com/consulting.
© 2014, Forrester Research, Inc. All rights reserved. Unauthorized reproduction is strictly prohibited.
Information is based on best available resources. Opinions reflect judgment at the time and are subject to
change. Forrester®, Technographics
®, Forrester Wave, RoleView, TechRadar, and Total Economic Impact
are trademarks of Forrester Research, Inc. All other trademarks are the property of their respective
companies. For additional information, go to www.forrester.com.

3
Executive Summary
In December 2014, IBM commissioned Forrester Consulting
to conduct a Total Economic Impact™ (TEI) study and
examine the potential return on investment (ROI)
enterprises may realize by deploying IBM Case Manager.
The purpose of this study is to provide readers with a
framework to evaluate the potential financial impact of IBM
Case Manager on their organizations.
IBM Case Manager is a case management suite that brings
together documents, business information, flexible workflow,
real time analytics and reporting – all with a rapid solution
development environment. It also provides a case
container (folder) where all the business critical case
artifacts and decisions are maintained over time,
automatically creating an audit trail, as well as a time
stamped case record. To better understand the benefits,
costs, and risks associated with IBM Case Manager,
Forrester interviewed an existing customer with two years of
experience using IBM Case Manager.
Prior to its use of IBM Case Manager, the interviewed
customer was dependent on accessing multiple systems for each case. This required knowledge workers to log in and
gather data from multiple systems, which could take 3 to 4 hours per case. The customer chose IBM out of four vendors for
its out-of-the box flexibility and strength in integrating content, BPM, and case management engines.
IBM CASE MANAGER IMPROVES KNOWLEDGE WORKER EFFICIENCY, CREATES OPPORTUNITIES WITH
ANALYTICS INTEGRATION, AND PROVIDES AUDITABLE CONSISTENCY
Our interview with one existing customer and subsequent financial analysis found that the customer experienced the risk-
adjusted ROI, benefits, and costs shown in Figure 1.1 See Appendix A for a description of the interviewed customer.
The analysis points to benefits of $19,040,360 per year versus costs of $5,626,865, adding up to a net present value (NPV)
of $13,413,496.
FIGURE 1
Financial Summary Showing Three-Year Risk-Adjusted Results
ROI: 238%
NPV: $13,413,496
Payback period: <1 month
Source: Forrester Research, Inc.
“With a strong foundation in BPM,
the case management tool allows us
to validate information prior to
creating a work item so users don't
have to log in to 10 systems and
spend 3 hours gathering data.
Instead, they can spend 3 minutes
looking at gathered data in one
system.”
~ Lead development manager, large US financial
institution

4
› Benefits. The customer experienced the following risk-adjusted benefits:
• Knowledge worker efficiency. This benefit is focused on the efficiency gains experienced by knowledge workers
validating data and processing cases.
• Analytics impact. This benefit centers on the opportunities that the customer has found in cross-selling and
retaining funds based on the ability to link different systems and teams.
• Auditable consistency. This benefit conceptualizes the cost savings and avoidances due to reduced regulatory
fines and auditing costs.
› Costs. The customer experienced the following risk-adjusted costs:
• IBM Case Manager cost. This is the annual fee for IBM Case Manager's licensing and maintenance.
• Internal labor and implementation cost. This is the cost of the customer's resources for both initial and ongoing
development and support for IBM Case Manager and new case designs.
5
Disclosures
The reader should be aware of the following:
› The study is commissioned by IBM and delivered by Forrester Consulting. It is not meant to be used as a competitive
analysis.
› Forrester makes no assumptions as to the potential return on investment that other organizations will receive. Forrester
strongly advises that readers use their own estimates within the framework provided in the report to determine the
appropriateness of an investment in IBM Case Manager.
› IBM reviewed and provided feedback to Forrester, but Forrester maintains editorial control over the study and its findings
and does not accept changes to the study that contradict Forrester's findings or obscure the meaning of the study.
› The customer names for the interviews were provided by IBM. IBM did not participate in customer interviews.

6
TEI Framework And Methodology
INTRODUCTION
From the information provided in the interviews, Forrester has constructed a Total Economic Impact (TEI) framework for
those organizations considering deploying IBM Case Manager. The objective of the framework is to identify the cost, benefit,
flexibility, and risk factors that affect the investment decision.
APPROACH AND METHODOLOGY
Forrester took a multistep approach to evaluate the impact that IBM Case Manager can have on an organization (see Figure
3). Specifically, we:
› Interviewed IBM Case Manager marketing, sales, and/or consulting personnel, along with Forrester analysts, to gather
data relative to IBM Case Manager and the marketplace for IBM Case Manager.
› Interviewed one organization currently using IBM Case Manager to obtain data with respect to costs, benefits, and risks.
› Constructed a financial model representative of the interviews using the TEI methodology. The financial model is
populated with the cost and benefit data obtained from the customer interview and IBM.
› Risk-adjusted the financial model based on issues and concerns the interviewed organization highlighted in interviews.
Risk adjustment is a key part of the TEI methodology. While the interviewed organization provided cost and benefit
estimates, some categories included a broad range of possibilities or had a number of outside forces that might have
raised or lowered the benefit and cost values. For that reason, some cost and benefit totals have been risk-adjusted and
are detailed in each relevant section.
Forrester employed four fundamental elements of TEI in modeling the value of using IBM Case Manager: benefits, costs,
flexibility, and risks.
Given the increasing sophistication that enterprises have regarding ROI analyses related to IT investments, Forrester’s TEI
methodology serves to provide a complete picture of the total economic impact of purchase decisions. Please see Appendix
B for additional information on the TEI methodology.
FIGURE 3
TEI Approach
Source: Forrester Research, Inc.
Perform duediligence
Conductcustomerinterviews
Constructfinancial
model usingTEI framework
Write casestudy

7
Analysis
INTERVIEWED CUSTOMER
For this study, we conducted one interview with an existing customer that has deployed IBM Case Manager. The interviewed
customer is a large US financial institution with the following high-level characteristics:
› Has annual revenue of approximately $30 billion and over $400 billion in managed assets.
› Has approximately 11,000 operational users divided among the front, middle, and back office.
› Provides multiple financial products including retirement plans, investment, insurance, retail, and institutional.
The customer processes 6,000 to 7,000 cases each day. The majority of cases are transaction-based (e.g., withdrawals,
deposits, rollovers, etc.). During processing, each case may be handled by front-, middle-, and back-office operations staff.
Front-office staff are typically client-facing, such as those who operate the contact center. Middle-office staff are the majority
of the knowledge workers who need to validate data and perform due diligence before committing to transactions. Lastly,
back-office staff are typically those at the start or end of a workflow
and either send or receive documentation.
Prior to deploying IBM Case Manager, the customer relied on
middle-office knowledge workers to gather data from multiple
systems. Most cases could take 1 to 1.5 hours, while some
onboarding cases would require more due diligence and take up to
3 to 4 hours. More importantly, there was not an intelligent and
automated method of checking for errors.
To lay the groundwork, the customer implemented IBM master data
management (MDM) in the years preceding IBM Case Manager.
Several years later, the customer tackled the BPM and case
management concerns. They compared four vendors and selected
IBM for its balanced strengths in out-of-the box flexibility and
integration of content, BPM, and case management engines. The
customer launched IBM Case Manager with the following high-level
goals:
› Consolidate multiple systems and automate data gathering and
processes to reduce due diligence effort and errors for
knowledge workers.
› Provide an agnostic, 360-degree view of each case, allowing for
truly omnichannel customer engagement.
› Improve cross-sell and upsell opportunities.
› Improve customer experience.
“We are able to accurately
target customers for specific
investment products based on
their withdrawal frequency
and trends. This allows us to
retain instead of lose. . . .
cross-sell opportunities have
ranges from $25 million to
$50 million each year.”
~ Lead development manager, large US financial
institution

8
INTERVIEW HIGHLIGHTS
The interview revealed the following themes:
› Improvement in knowledge worker efficiency is primarily based on data consolidation and data gathering
automation. Of the 6,000 to 7,000 cases that the customer processes each day, 2.5% to 3% are onboarding cases that
pertain to onboarding an end user to a new financial product. Before the onboarding, a knowledge worker must perform
due diligence and validate all data before the next step in the workflow. The information that needs to be validated would
previously be pulled from three or four systems, which would require the knowledge worker to log in to three to four
systems and gather the proper information. This process took 3 to 4 hours in the past and now takes approximately 3
minutes, representing an approximately 98% efficiency gain. Even the majority of cases that are transaction-related (e.g.,
withdrawals, deposits, rollovers, etc.) have seen 1 to 1.5 hours of data gathering reduce down to 3 minutes. The customer
has since been able to enact larger operational efficiency programs, such as reducing outsourced and offshored work.
› The ability to see each case linked to a single account record from a 360-degree view improves cross-sell, upsell,
and customer experience activities. Linking a single account and programming intelligence to create work items for
adjacent or relevant product teams based on a user's actions and tendencies is a major benefit the customer highlighted.
The customer mentioned two main examples that describe how it has retained over $25 million that would have been
otherwise withdrawn by end users. The first example is related to suggesting different investment products that may
provide a better return than withdrawing cash. The customer would focus on the frequency, amount, and other trends to
determine what investment products might be best suited to or interest the end user. The second example focuses on
providing a solution when an end user meets an error like overdrawing from a pension account. In this case, the system
should automatically generate a work item for the personal loans team to follow up with the end user at the right time.
› Achieving auditable consistency and efficiency is not always quantified but remains an important metric. The
interviewed customer did not experience any regulatory fines or penalties related to poor case management before
implementing IBM Case Manager but mentioned that having all data in one single source has assuredly made it easier for
external auditors to perform due diligence. The customer described how auditing projects that took three to five days will
now take one day. Readers who have experienced fines or penalties may find it helpful to quantify those amounts as a
potential saving and avoidance that IBM Case Manager could achieve. Furthermore, while the customer described
auditing as an external expense from regulatory bodies, organizations that pay for an external auditing company or internal
auditors could also include the cost of these resources as a potential cost reduction as a result of implementing IBM Case
Manager.
9
BENEFITS
This case study had three benefits, two of which the customer experienced and provided feedback and data to quantify:
› Knowledge worker efficiency.
› Analytics impact.
› Auditable consistency.
Knowledge Worker Efficiency
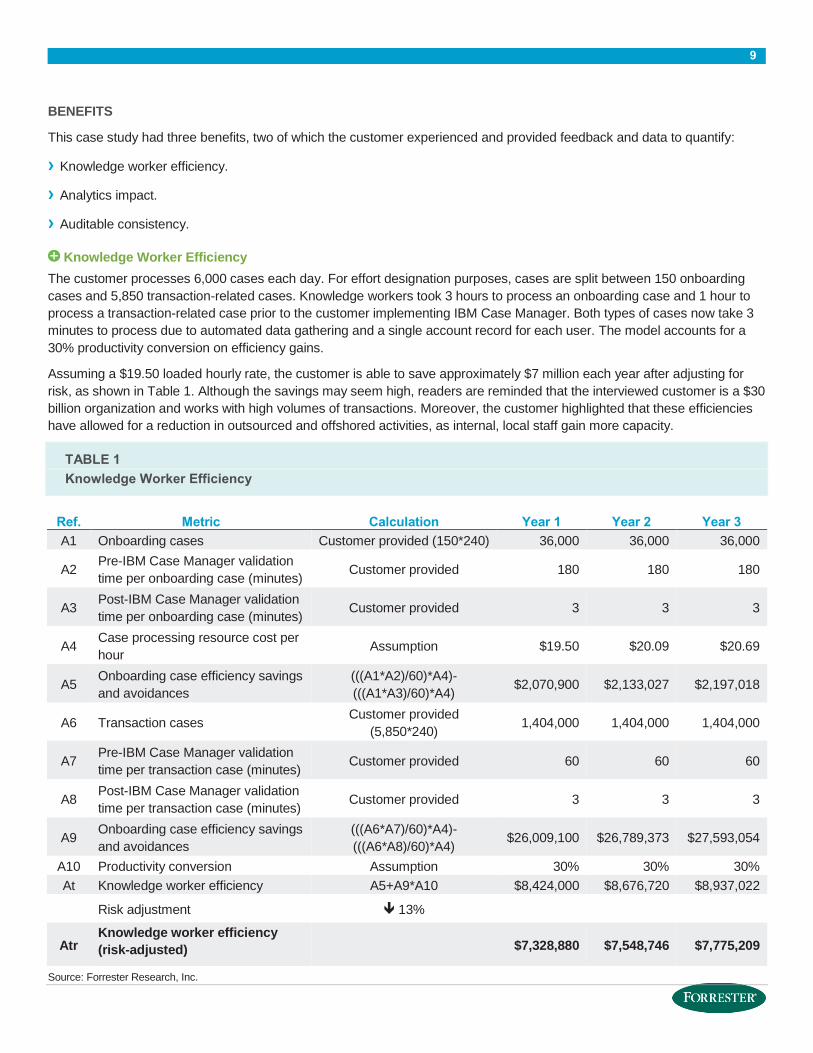
The customer processes 6,000 cases each day. For effort designation purposes, cases are split between 150 onboarding
cases and 5,850 transaction-related cases. Knowledge workers took 3 hours to process an onboarding case and 1 hour to
process a transaction-related case prior to the customer implementing IBM Case Manager. Both types of cases now take 3
minutes to process due to automated data gathering and a single account record for each user. The model accounts for a
30% productivity conversion on efficiency gains.
Assuming a $19.50 loaded hourly rate, the customer is able to save approximately $7 million each year after adjusting for
risk, as shown in Table 1. Although the savings may seem high, readers are reminded that the interviewed customer is a $30
billion organization and works with high volumes of transactions. Moreover, the customer highlighted that these efficiencies
have allowed for a reduction in outsourced and offshored activities, as internal, local staff gain more capacity.
TABLE 1
Knowledge Worker Efficiency
Ref. Metric Calculation Year 1 Year 2 Year 3
A1 Onboarding cases Customer provided (150*240) 36,000 36,000 36,000
A2 Pre-IBM Case Manager validation
time per onboarding case (minutes) Customer provided 180 180 180
A3 Post-IBM Case Manager validation
time per onboarding case (minutes) Customer provided 3 3 3
A4 Case processing resource cost per
hour Assumption $19.50 $20.09 $20.69
A5 Onboarding case efficiency savings
and avoidances
(((A1*A2)/60)*A4)-
(((A1*A3)/60)*A4) $2,070,900 $2,133,027 $2,197,018
A6 Transaction cases Customer provided
(5,850*240) 1,404,000 1,404,000 1,404,000
A7 Pre-IBM Case Manager validation
time per transaction case (minutes) Customer provided 60 60 60
A8 Post-IBM Case Manager validation
time per transaction case (minutes) Customer provided 3 3 3
A9 Onboarding case efficiency savings
and avoidances
(((A6*A7)/60)*A4)-
(((A6*A8)/60)*A4) $26,009,100 $26,789,373 $27,593,054
A10 Productivity conversion Assumption 30% 30% 30%
At Knowledge worker efficiency A5+A9*A10 $8,424,000 $8,676,720 $8,937,022
Risk adjustment 13%
Atr Knowledge worker efficiency
(risk-adjusted) $7,328,880 $7,548,746 $7,775,209
Source: Forrester Research, Inc.
10
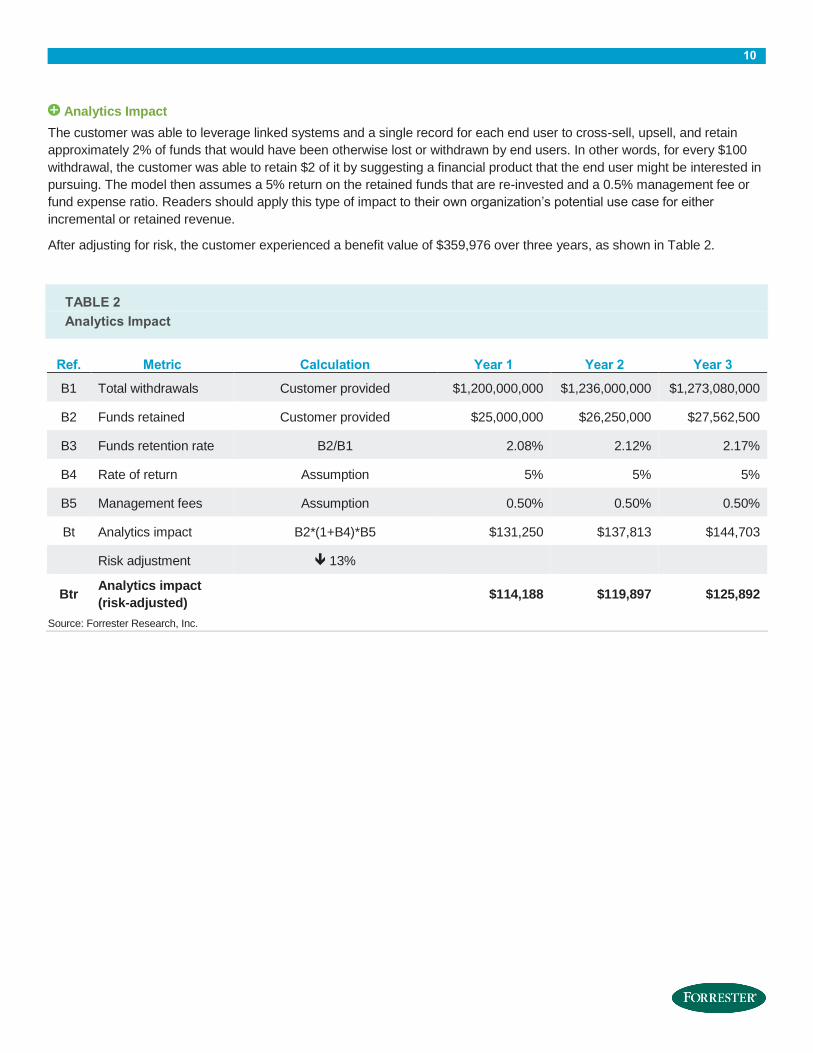
Analytics Impact
The customer was able to leverage linked systems and a single record for each end user to cross-sell, upsell, and retain
approximately 2% of funds that would have been otherwise lost or withdrawn by end users. In other words, for every $100
withdrawal, the customer was able to retain $2 of it by suggesting a financial product that the end user might be interested in
pursuing. The model then assumes a 5% return on the retained funds that are re-invested and a 0.5% management fee or
fund expense ratio. Readers should apply this type of impact to their own organization’s potential use case for either
incremental or retained revenue.
After adjusting for risk, the customer experienced a benefit value of $359,976 over three years, as shown in Table 2.
TABLE 2
Analytics Impact
Ref. Metric Calculation Year 1 Year 2 Year 3
B1 Total withdrawals Customer provided $1,200,000,000 $1,236,000,000 $1,273,080,000
B2 Funds retained Customer provided $25,000,000 $26,250,000 $27,562,500
B3 Funds retention rate B2/B1 2.08% 2.12% 2.17%
B4 Rate of return Assumption 5% 5% 5%
B5 Management fees Assumption 0.50% 0.50% 0.50%
Bt Analytics impact B2*(1+B4)*B5 $131,250 $137,813 $144,703
Risk adjustment 13%
Btr Analytics impact
(risk-adjusted) $114,188 $119,897 $125,892
Source: Forrester Research, Inc.

11
Auditable Consistency
Although the customer was not able to quantify this benefit, there was an agreement that the conceptual model in Table 3
below is a fair way to quantify this benefit if the customer had relevant data. Readers should check with their legal
departments for any past fines or penalties that could have been avoided with better case management. Auditing
requirements and regulations differ by industry; readers should again check with their legal departments regarding their
organization's auditing expenses.
TABLE 3
Auditable Consistency
Ref. Metric Calculation Year 1 Year 2 Year 3
C1 Fines and penalties avoided
C2 Pre-IBM Case Manager auditing hours
C3 Post-IBM Case Manager auditing hours
C4 Auditing resource cost per hour
C5 Auditing savings and avoidances (C2*C4)-(C3*C4)
Ct Auditable consistency C1+C5
Risk adjustment 6%
Ctr Auditable consistency (risk-adjusted)
Source: Forrester Research, Inc.
Total Benefits
Table 4 shows the total of all benefits across the three areas listed above, as well as present values (PVs) discounted at
10%. Over three years, the customer expects risk-adjusted total benefits to be a present value of approximately $19 million.
TABLE 4
Total Benefits (Risk-Adjusted)
Benefit Initial Year 1 Year 2 Year 3 Total Present Value
Knowledge worker efficiency $0 $7,328,880 $7,548,746 $7,775,209 $22,652,835 $18,742,881
Analytics impact $0 $114,188 $119,897 $125,892 $359,976 $297,479
Auditable consistency $0 $0 $0 $0 $0 $0
Total benefits $0 $7,443,068 $7,668,643 $7,901,101 $23,012,811 $19,040,360
Source: Forrester Research, Inc.
12
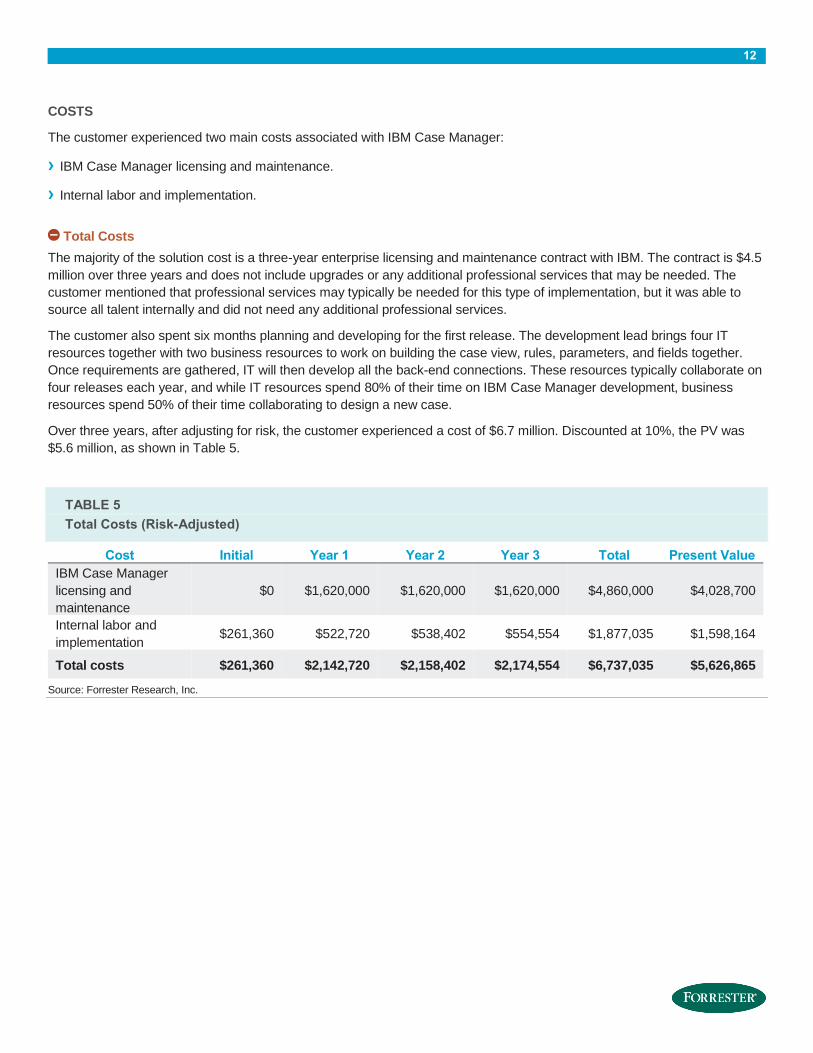
COSTS
The customer experienced two main costs associated with IBM Case Manager:
› IBM Case Manager licensing and maintenance.
› Internal labor and implementation.
Total Costs
The majority of the solution cost is a three-year enterprise licensing and maintenance contract with IBM. The contract is $4.5
million over three years and does not include upgrades or any additional professional services that may be needed. The
customer mentioned that professional services may typically be needed for this type of implementation, but it was able to
source all talent internally and did not need any additional professional services.
The customer also spent six months planning and developing for the first release. The development lead brings four IT
resources together with two business resources to work on building the case view, rules, parameters, and fields together.
Once requirements are gathered, IT will then develop all the back-end connections. These resources typically collaborate on
four releases each year, and while IT resources spend 80% of their time on IBM Case Manager development, business
resources spend 50% of their time collaborating to design a new case.
Over three years, after adjusting for risk, the customer experienced a cost of $6.7 million. Discounted at 10%, the PV was
$5.6 million, as shown in Table 5.
TABLE 5
Total Costs (Risk-Adjusted)
Cost Initial Year 1 Year 2 Year 3 Total Present Value
IBM Case Manager
licensing and
maintenance
$0 $1,620,000 $1,620,000 $1,620,000 $4,860,000 $4,028,700
Internal labor and
implementation $261,360 $522,720 $538,402 $554,554 $1,877,035 $1,598,164
Total costs $261,360 $2,142,720 $2,158,402 $2,174,554 $6,737,035 $5,626,865
Source: Forrester Research, Inc.

13
FLEXIBILITY
Flexibility, as defined by TEI, represents an investment in additional capacity or capability that could be turned into business
benefit for some future additional investment. This provides an organization with the “right” or the ability to engage in future
initiatives but not the obligation to do so. There are multiple scenarios in which a customer might choose to implement IBM
Case Manager and later realize additional uses and business opportunities. Flexibility would also be quantified when
evaluated as part of a specific project (described in more detail in Appendix B).
In the near future, the customer plans to upgrade to the next version of IBM Case Manager. The customer noted that while
the organization is rapidly adopting the tool, the next upgrade will bring an improvement to the user interface.
Furthermore, the customer looks forward to an eventual capability to link social media with its end users' accounts. The
customer envisions the ability to provide the appropriate amount of information about 529 college savings plans after an end
user posts or tweets about having a newborn child. The ability to monitor and link social media would result in upsell
opportunities and make sure current end users are retained and know about the organization’s full product line. The
customer could also improve the customer experience by reviewing the accounts and cases of end users who are posting
negative comments. This would potentially allow the customer to turn a negative situation into a positive experience.
RISKS
Forrester defines two types of risk associated with this analysis: “implementation risk” and “impact risk.” Implementation risk
is the risk that a proposed investment in IBM Case Manager may deviate from the original or expected requirements,
resulting in higher costs than anticipated. Impact risk refers to the risk that the business or technology needs of the
organization may not be met by the investment in IBM Case Manager, resulting in lower overall total benefits. The greater
the uncertainty, the wider the potential range of outcomes for cost and benefit estimates.
TABLE 6
Benefit And Cost Risk Adjustments
Benefits Adjustment
Knowledge worker efficiency 13%
Analytics impact 13%
Auditable consistency 6%
Costs Adjustment
IBM Case Manager licensing and maintenance 8%
Internal labor and implementation 8%
Source: Forrester Research, Inc.
Quantitatively capturing implementation risk and impact risk by directly adjusting the financial estimates results provides
more meaningful and accurate estimates and a more accurate projection of the ROI. In general, risks affect costs by raising
the original estimates, and they affect benefits by reducing the original estimates. The risk-adjusted numbers should be taken
as “realistic” expectations since they represent the expected values considering risk.
The following impact risks that affect benefits are identified as part of the analysis:
› Reduced volume of cases and transactions.

14
› A consolidated foundation prior to IBM Case Manager, leading to marginal improvements in efficiency.
› Low adoption rate.
› Implementation without the business' input on design.
› Not leveraging analytics to cross-sell or upsell.
The following implementation risks that affect costs are identified as part of this analysis:
› Increased pricing from the vendor.
› Urgent need for rapid deployment, causing increased resourcing costs.
Table 6 shows the values used to adjust for risk and uncertainty in the cost and benefit estimates. Readers are urged to
apply their own risk ranges based on their own degree of confidence in the cost and benefit estimates.

15
Financial Summary
The financial results calculated in the Benefits and Costs sections can be used to determine the ROI, NPV, and payback
period for the organization’s investment in IBM Case Manager.
Table 7 below shows the risk-adjusted ROI, NPV, and payback period values. These values are determined by applying the
risk-adjustment values from Table 6 in the Risks section to the unadjusted results in each relevant cost and benefit section.
FIGURE 4
Cash Flow Chart (Risk-Adjusted)
Source: Forrester Research, Inc.
TABLE 7
Cash Flow (Risk-Adjusted)
Initial Year 1 Year 2 Year 3 Total Present Value
Costs ($261,360) ($2,142,720) ($2,158,402) ($2,174,554) ($6,737,035) ($5,626,865)
Benefits $0 $7,443,068 $7,668,643 $7,901,101 $23,012,811 $19,040,360
Net benefits ($261,360) $5,300,348 $5,510,242 $5,726,547 $16,275,776 $13,413,496
ROI 238%
Payback period <1 month
Source: Forrester Research, Inc.
($5,000,000)
$0
$5,000,000
$10,000,000
$15,000,000
$20,000,000
Initial Year 1 Year 2 Year 3
Cas
h F
low
s
Financial Analysis (risk-adjusted)
Total Costs Total Benefits Cumulative Total

16
IBM Case Manager: Overview
The following information is provided by IBM. Forrester has not validated any claims and does not endorse IBM or its
offerings.
IBM Case Manager can optimize case outcomes and increase customer satisfaction by empowering knowledge workers. It
provides case workers access to structured and unstructured information from various types of applications or storage
systems. IBM Case Manager provides flexible process controls, access to powerful analytics and dashboards, and an array
of industry-specific business partner solutions to enable rapid time-to-value.
Suite components include:
› IBM Case Builder allows nonprogrammers to quickly and easily design and try out new case solutions.
› IBM Case Client is the knowledge worker user experience that displays the solutions created by Case Builder.
› IBM Case Foundation provides the powerful content and process platform that Case Manager is built on.
› IBM Content Analytics with Enterprise Search analyzes and visually explores large volumes of unstructured content to
unlock new business insights.
› IBM Sametime delivers unified communications and collaboration software for voice, data, and video.
› IBM Content Navigator provides a collaborative and mobile content experience that delivers better intelligence and control
throughout the organization. It is a component that can be used with various IBM products for mobile-enabled social
business.
› IBM Daeja ViewONE Professional delivers modular, extensible, and powerful document and image viewing.

17
Appendix A: Interviewed Customer Description
For this study, we conducted one interview with an existing customer that has deployed IBM Case Manager. The interviewed
customer is a large US financial institution with the following high-level characteristics:
› Has annual revenue of approximately $30 billion and over $400 billion in managed assets.
› Has approximately 11,000 operational users divided among the front, middle, and back office.
› Provides multiple financial products including retirement plans, investment, insurance, retail, and institutional.
The customer processes 6,000 to 7,000 cases each day. The majority of cases are transaction-based (e.g., withdrawals,
deposits, rollovers, etc.). During processing, each case may be handled by front-, middle-, and back-office operations staff.
Front-office staff are typically client-facing, such as those who operate the contact center. Middle-office staff are the majority
of the knowledge workers who need to validate data and perform due diligence before committing to transactions. Lastly,
back-office staff are typically those at the start or end of a workflow and either send or receive documentation.
Prior to deploying IBM Case Manager, the customer relied on middle-office knowledge workers to gather data from multiple
systems. Most cases could take 1 to 1.5 hours, while some onboarding cases would require more due diligence and take up
to 3 to 4 hours. More importantly, there was not an intelligent and automated method of checking for errors.
To lay the groundwork, the customer implemented IBM master data management in the years preceding IBM Case
Manager. Several years later, the customer tackled the BPM and case management concerns. They compared four vendors
and selected IBM for its balanced strengths in out-of-the-box flexibility and integration of content, BPM, and case
management engines. The customer launched IBM Case Manager with the following high-level goals:
› Consolidate multiple systems and automate data gathering and processes to reduce due diligence effort and errors for
knowledge workers.
› Provide an agnostic, 360-degree view of each case, allowing for truly omnichannel customer engagement.
› Improve cross-sell and upsell opportunities.
› Improve customer experience.
FRAMEWORK ASSUMPTIONS
Table 8 provides the model assumptions that Forrester used
in this analysis.
The discount rate used in the PV and NPV calculations is
10%, and the time horizon used for the financial modeling is
three years. Organizations typically use discount rates
between 8% and 16% based on their current environment.
Readers are urged to consult with their respective
company’s finance department to determine the most
appropriate discount rate to use within their own
organizations.
TABLE 8
Model Assumptions
Ref. Metric Value
X1 Hours per week 40
X2 Weeks per year 52
X3 Hours per year (M-F, 9-5) 2,080
X4 Hours per year (24x7) 8,760
X5 Working days 240
X6 Annual organization growth 3%
PY Prior year
Source: Forrester Research, Inc.

18
Appendix B: Total Economic Impact™ Overview
Total Economic Impact is a methodology developed by Forrester Research that enhances a company’s technology decision-
making processes and assists vendors in communicating the value proposition of their products and services to clients. The
TEI methodology helps companies demonstrate, justify, and realize the tangible value of IT initiatives to both senior
management and other key business stakeholders.
The TEI methodology consists of four components to evaluate investment value: benefits, costs, flexibility, and risks.
BENEFITS
Benefits represent the value delivered to the user organization — IT and/or business units — by the proposed product or
project. Often, product or project justification exercises focus just on IT cost and cost reduction, leaving little room to analyze
the effect of the technology on the entire organization. The TEI methodology and the resulting financial model place equal
weight on the measure of benefits and the measure of costs, allowing for a full examination of the effect of the technology on
the entire organization. Calculation of benefit estimates involves a clear dialogue with the user organization to understand
the specific value that is created. In addition, Forrester also requires that there be a clear line of accountability established
between the measurement and justification of benefit estimates after the project has been completed. This ensures that
benefit estimates tie back directly to the bottom line.
COSTS
Costs represent the investment necessary to capture the value, or benefits, of the proposed project. IT or the business units
may incur costs in the form of fully burdened labor, subcontractors, or materials. Costs consider all the investments and
expenses necessary to deliver the proposed value. In addition, the cost category within TEI captures any incremental costs
over the existing environment for ongoing costs associated with the solution. All costs must be tied to the benefits that are
created.
FLEXIBILITY
Within the TEI methodology, direct benefits represent one part of the investment value. While direct benefits can typically be
the primary way to justify a project, Forrester believes that organizations should be able to measure the strategic value of an
investment. Flexibility represents the value that can be obtained for some future additional investment building on top of the
initial investment already made. For instance, an investment in an enterprisewide upgrade of an office productivity suite can
potentially increase standardization (to increase efficiency) and reduce licensing costs. However, an embedded collaboration
feature may translate to greater worker productivity if activated. The collaboration can only be used with additional
investment in training at some future point. However, having the ability to capture that benefit has a PV that can be
estimated. The flexibility component of TEI captures that value.
RISKS
Risks measure the uncertainty of benefit and cost estimates contained within the investment. Uncertainty is measured in two
ways: 1) the likelihood that the cost and benefit estimates will meet the original projections and 2) the likelihood that the
estimates will be measured and tracked over time. TEI applies a probability density function known as “triangular distribution”
to the values entered. At a minimum, three values are calculated to estimate the underlying range around each cost and
benefit.

19
Appendix C: Glossary
Discount rate: The interest rate used in cash flow analysis to take into account the time value of money. Companies set
their own discount rate based on their business and investment environment. Forrester assumes a yearly discount rate of
10% for this analysis. Organizations typically use discount rates between 8% and 16% based on their current environment.
Readers are urged to consult their respective organizations to determine the most appropriate discount rate to use in their
own environment.
Net present value (NPV): The present or current value of (discounted) future net cash flows given an interest rate (the
discount rate). A positive project NPV normally indicates that the investment should be made, unless other projects have
higher NPVs.
Present value (PV): The present or current value of (discounted) cost and benefit estimates given at an interest rate (the
discount rate). The PV of costs and benefits feed into the total NPV of cash flows.
Payback period: The breakeven point for an investment. This is the point in time at which net benefits (benefits minus costs)
equal initial investment or cost.
Return on investment (ROI): A measure of a project’s expected return in percentage terms. ROI is calculated by dividing
net benefits (benefits minus costs) by costs.
A NOTE ON CASH FLOW TABLES
The following is a note on the cash flow tables used in this study (see the example table below). The initial investment
column contains costs incurred at “time 0” or at the beginning of Year 1. Those costs are not discounted. All other cash flows
in years 1 through 3 are discounted using the discount rate (shown in the Framework Assumptions section) at the end of the
year. PV calculations are calculated for each total cost and benefit estimate. NPV calculations are not calculated until the
summary tables are the sum of the initial investment and the discounted cash flows in each year.
TABLE [EXAMPLE]
Example Table
Ref. Metric Calculation Year 1 Year 2 Year 3
Source: Forrester Research, Inc.

20
Appendix D: Endnotes
1 Forrester risk-adjusts the summary financial metrics to take into account the potential uncertainty of the cost and benefit
estimates. For more information, see the section on Risks.


![IBM KM Case Studies[1]](https://img.pdfslide.net/doc/110x75/5448a05fafaf9f4d088b4c3f/ibm-km-case-studies1.jpg)