Embed Size (px)
Citation preview

The TQM Journal
The influence of cost of quality on the performance of food manufacturing companies: an empirical study
Journal: The TQM Journal
Manuscript ID TQM-01-2021-0026.R2
Manuscript Type: Research Paper
Keywords: Quality costs, Total Quality Management, Food Industry, Company Performance
The TQM Journal

The TQM Journal
The influence of cost of quality on the performance of food
manufacturing companies: an empirical study
AbstractPurpose: Due to the ever-increasing competitive and complex business environments,
food manufacturing companies have to maintain high-quality products while
simultaneously minimizing customers' costs. Cost of quality (COQ) plays a crucial role in
enhancing companies' efficiency and reducing expenditures that can contribute to
companies' competitive performance. This paper investigates the underlying relationship
between the level of COQ practices adoption (prevention, appraisal, internal, and external
failure costs) and organizational performance in Palestinian Food Manufacturing
Companies (PFMC).
Design/Methodology/Approach: A quantitative research methodology using a structured
questionnaire collected data from 119 PFMC. Partial least squares structural equation
modeling was used to analyze collected data.
Findings: Results indicated that COQ adoption has a significant positive effect on the
organizational performance of PFMC. Besides, prevention, external, and internal failure
costs were all associated with a positive impact on organizational performance of PFMC,
whereas appraisal cost did not affect organizational performance.
Originality: This study is considered one of the first studies to investigate COQ practices'
effect on organizational performance in food manufacturing companies in a developing
country context. Thus, it adds significant value to literature responding to calls to tackle
competitiveness issues in current complex business environments.
Keywords: Cost of quality, quality costing system, TQM, food manufacturing, developing
country, organizational performance, Palestine.
1. Introduction
Business organizations face competitive and complex circumstances because of the rapid
growth of technology and the changing socio-economic environment (Psomas et al., 2018).
Customers have become smarter, and thus acquiring new customers or maintaining existing
ones has become a more significant challenge for most companies (Alglawe et al., 2017).
Page 1 of 41 The TQM Journal
123456789101112131415161718192021222324252627282930313233343536373839404142434445464748495051525354555657585960
The TQM Journal
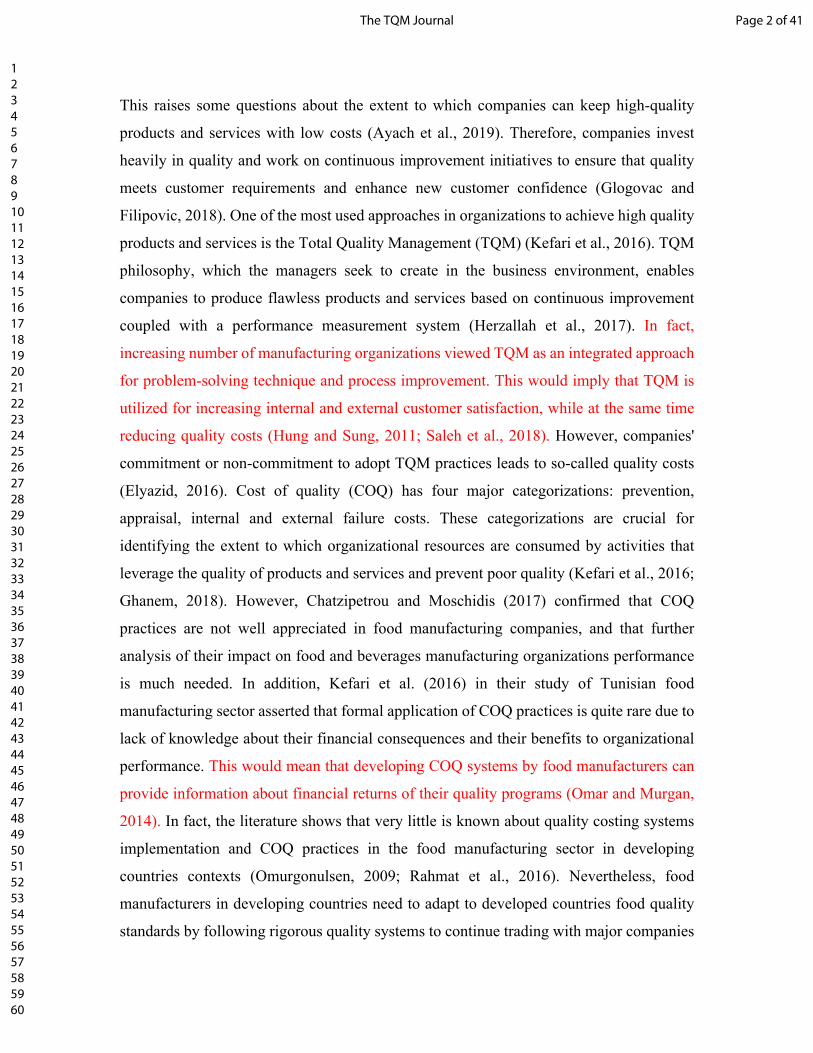
This raises some questions about the extent to which companies can keep high-quality
products and services with low costs (Ayach et al., 2019). Therefore, companies invest
heavily in quality and work on continuous improvement initiatives to ensure that quality
meets customer requirements and enhance new customer confidence (Glogovac and
Filipovic, 2018). One of the most used approaches in organizations to achieve high quality
products and services is the Total Quality Management (TQM) (Kefari et al., 2016). TQM
philosophy, which the managers seek to create in the business environment, enables
companies to produce flawless products and services based on continuous improvement
coupled with a performance measurement system (Herzallah et al., 2017). In fact,
increasing number of manufacturing organizations viewed TQM as an integrated approach
for problem-solving technique and process improvement. This would imply that TQM is
utilized for increasing internal and external customer satisfaction, while at the same time
reducing quality costs (Hung and Sung, 2011; Saleh et al., 2018). However, companies'
commitment or non-commitment to adopt TQM practices leads to so-called quality costs
(Elyazid, 2016). Cost of quality (COQ) has four major categorizations: prevention,
appraisal, internal and external failure costs. These categorizations are crucial for
identifying the extent to which organizational resources are consumed by activities that
leverage the quality of products and services and prevent poor quality (Kefari et al., 2016;
Ghanem, 2018). However, Chatzipetrou and Moschidis (2017) confirmed that COQ
practices are not well appreciated in food manufacturing companies, and that further
analysis of their impact on food and beverages manufacturing organizations performance
is much needed. In addition, Kefari et al. (2016) in their study of Tunisian food
manufacturing sector asserted that formal application of COQ practices is quite rare due to
lack of knowledge about their financial consequences and their benefits to organizational
performance. This would mean that developing COQ systems by food manufacturers can
provide information about financial returns of their quality programs (Omar and Murgan,
2014). In fact, the literature shows that very little is known about quality costing systems
implementation and COQ practices in the food manufacturing sector in developing
countries contexts (Omurgonulsen, 2009; Rahmat et al., 2016). Nevertheless, food
manufacturers in developing countries need to adapt to developed countries food quality
standards by following rigorous quality systems to continue trading with major companies
Page 2 of 41The TQM Journal
123456789101112131415161718192021222324252627282930313233343536373839404142434445464748495051525354555657585960

The TQM Journal
and retailers (Masri and Jaaron, 2017). On top of this, food manufacturing organizations,
in developed and developing countries alike, need to accommodate ever increasing
demands from retailers (i.e., customers) for shorter delivery times, reduced prices, and
improved food safety measures. These resemble powerful global challenges that force
manufacturing industry to keep improving quality management techniques to remain
profitable and competitive (Costa et al., 2018). Emanating from this, this paper examines
the underlying relationship between the level of COQ practices adoption (prevention,
appraisal, internal, and external failure costs) and organizational performance in PFMC. In
the case of PFMC, there is almost no evidence in the quality management literature of
previous empirical studies that explores COQ practices or costing systems, which gives
this study more prominence.
The PFMC is one of Palestine's emerging industries and plays a major role in attracting
investments in this industry and contributing about 4.8% to the GDP (PIPA, 2017).
Conducting such studies in developing country context, especially in difficult and
challenging environments like Palestine, is not unproblematic. Dual environmental
legislations dominate the manufacturing organizations in Palestine: Palestinian National
Authority (PNA) Law and Israeli Authorities Law; these laws are applied in the Occupied
Palestinian Territories (OPT), where the vast majority of Palestinian manufacturers are
placed. The OPT's unique situation results from using these Israeli laws on Palestine's
internal policies, obliging manufacturers to abide by Israeli environmental policies
alongside those of PNA (Zaid et al., 2018). This study is considered one of the first studies
to investigate COQ practices' effect on organizational performance in food manufacturing
companies in a developing country context. Thus, it adds significant value to literature
responding to calls to tackle competitiveness issues in current complex business
environments.
In keeping with its aims, the article is structured as follows: section two illustrates the
concept of COQ and provides the research background on COQ and organizational
performance, followed by section three which presents the research methodology. Next,
data analysis and results are presented in section four. Then, discussion and conclusions
are provided in section five, before presenting the research limitations and future research
work in section six.
Page 3 of 41 The TQM Journal
123456789101112131415161718192021222324252627282930313233343536373839404142434445464748495051525354555657585960

The TQM Journal
2.Theoretical foundation and hypothesis development
2.1. Characterizing COQ
Quality management has recently become a top priority for any company seeking to raise
its performance and achieve success (Mata‐Lima et al., 2016). It is the high quality that
customers demand and the low price that attracts them and enables companies to surpass
the competition (Ayash et al., 2019). Therefore, quality improvement programs are
necessary for any business enterprise to flourish to improve the customer base (Sailaja et
al., 2015). Total Quality Management (TQM) is described as an enterprise-wide
management philosophy to improve organizational management that underlines the need
to meet customer needs and get things correct first-time (Bajaj et al., 2018). It is an
integrated approach for improving product and service quality, increase production, and
thus improve profitability (Iqbal and Asrar ul-Haq, 2018). Still, customer satisfaction and
continuous improvement remain crucial elements in supporting the TQM philosophy (Abu-
Mahfouz, 2019). However, TQM philosophy depends largely on employees’ practices and
attitudes backed up by a quality costing system to evaluate performance (Djekic et al.,
2014; Pattanayak et al., 2019).
COQ dates to Juran and Feigenbaum in the 1950s. They defined it as expenditures related
to efforts and deficiencies related to quality. In other words, the cost is related to
preventing, detecting, and correcting defective work (Farooq et al., 2017). However, there
is no general agreement on a single broad definition of COQ; therefore, there are various
definitions from several different domains (Elyazid, 2016). COQ is those expenses incurred
by an organization to achieve and maintain good quality by eliminating causes of poor
quality. This elimination of causes of poor quality will attain the highest level of customer
satisfaction (Dan, 2017). According to Chatzipetrou and Moschidi (2016), COQ includes
the cost of all the company's efforts to provide a product that can meet the customers' needs.
Djekic et al. (2014) considered COQ to be an indicator of achievement or lack of quality
and has proven to be useful as a comprehensive measure of organizational performance.
On the other hand, Ghanem (2018) explain that it is widely accepted to classify these costs
as conformance and non-conformance costs. This view of COQ classification was
Page 4 of 41The TQM Journal
123456789101112131415161718192021222324252627282930313233343536373839404142434445464748495051525354555657585960

The TQM Journal
supported by the work of Omar and Murgan (2014). At a more subtle level, Juran (1951)
and Feigenbaum (1956) classified the COQ into four main categories that will be followed
in this research:
Prevention costs: these are the costs invested in ensuring quality requirements will be
met (Ayach et al., 2019). Its activities include cost of implementing and controlling the
total quality control system and quality improvement programs (Farooq et al., 2017).
They are also composed of quality planning, marketing, and designing development
for products, purchasing, customer analysis, workforce development and training, and
system development (Lari and Asllani, 2013).
Appraisal cots: these are incurred by conducting a measurement, evaluation, or audit
to ensure quality consistency. These costs include first-time inspection, checking,
process or service audits, testing, calibration of measuring and test equipment, receipt
inspection, and supplier surveillance (Khozein et al., 2013).
Internal failure costs: these costs are related to activities conducted to deal with
products that do not meet quality requirements before reaching the customer
(Pattanayak et al., 2019). These include re-work or correction costs, scrap overtime
costs to cover production losses, and re-inspection costs (Alglawe et al., 2017).
External failure costs: they occur when defects are delivered to the customer
mistakenly (Ahmad et al., 2015). External failure costs increase as the number of
defective units delivered to customers increase (Chopra and Singh, 2015). They include
complaints costs in warranty, product liability costs, and loss of sales costs (Chatzipetro
and Moschidis, 2017).
The above classification led to the formation of the PAF model. It is the most basic and
most normally used cost-quality analysis model (Ayach et al., 2019). It is widely used in
manufacturing because of its straightforward interpretation, and its components can be
easily and directly measured (Farooq et al., 2017; Plewa et al., 2016; Silaga et al., 2015).
The PAF model's basic assumptions are that investment in prevention and evaluation
activities will reduce failure costs and that further investment in prevention activities will
reduce evaluation costs (Glogovac and Filipovic, 2017). Moreover, Snieska et al. (2013)
Page 5 of 41 The TQM Journal
123456789101112131415161718192021222324252627282930313233343536373839404142434445464748495051525354555657585960

The TQM Journal
emphasize that for companies to gain a competitive advantage, they should assess the costs
of prevention, evaluation, internal, and external failures. Today's priority is to provide
customers with the highest quality and best price; this can be achieved by determining
optimal quality costs (Sainis, 2018).
2.2 COQ and organizational performance
Today as global competition remains to grow rigorously, organizations must support their
competitiveness on costs and ensure that their products and services quality match their
clients expectations (Dan, 2017). Ghasghaee and Fathollahi (2014) discussed that the
increasing investment in prevention costs could reduce external failure costs, which can
ultimately enrich client satisfaction levels. Additionally, Ebrahimi and Sadeghi (2013)
explained that successful implementation of quality management requires an effective
COQ system as this can lead to significant improvements in organizational performance.
This is what Herzallah et al. (2014) confirmed in their research that showed that TQM
practices, including COQ, are indirectly related to enhanced financial performance.
Recently, Shafiq et al. (2019) argued that TQM practices can enhance financial and non-
financial results for organizations by providing empirical evidence from the textile sector
in Pakistan. At a more subtle level, Kerfai et al. (2016) settled that companies with COQ
systems encounter fewer internal and external failures than those with no COQ system.
Also, they found that these companies invest more in prevention and appraisal actions than
others. Furthermore, authors discovered that COQ adoption has positive outcomes on the
company's overall performance. Similarly, Pattanayak et al. (2019) asserted that the
prerequisite to improve the company's poor performance is a complete and effective system
for tracking COQ. The work of Lari and Asllani (2013) provided an evidence for the
importance of COQ systems for organizational performance. They explained that COQ
system allows an organization to have a metric through which monitoring and, thus,
controlling its processes and managerial activities become possible. This was confirmed
by Diefenbach et al. (2018) who found that a cost management control system, such as
COQ system, has a significant effect on organizational cost efficiency and overall
organizational performance. In a study by Guinot et al. (2016), North American automobile
manufacturers attributed positive impact on the present worth of a new product launch
Page 6 of 41The TQM Journal
123456789101112131415161718192021222324252627282930313233343536373839404142434445464748495051525354555657585960

The TQM Journal
when COQ was considered as a cash flow element and suggested that automobile
manufacturers, through COQ analysis, can better estimate future quality costs of new
products post-launch. Furthermore, Moschidis et al. (2018) found that quality costing
systems sets the priorities for the necessary corrective actions, helping companies focus on
improvement areas. This finding is consistent with the result of Rema (2014), clarifying
that the importance of quality costing lies on the fact that they can improve internal
performance and productivity, and was viewed as an effective way for a company to impact
its bottom line. It is as discussed by Dimitrantzou et al. (2020), in current business
environment of increased globalization of markets and fierce competition, COQ constitutes
a cost reduction tool and a source of profit that can enhance organizational competitive
advantage. The above-submitted relationships have, therefore, allowed for the articulation
of the following hypothesis:
H1: There is a significant positive relationship between COQ practices and
organizational performance of PFMC.
Also, Psomas et al. (2018) study on COQ measurement in Greek food manufacturing sector
explained the importance of prevention costs. Authors posited that by increasing the costs
of prevention, the cost of internal and external failure will be shrunk. This will enable an
organization to be more efficient and able to satisfy its customers. Thus, it directly and
positively affects organizational performance. According to Bayram and Ünğan (2020),
prevention costs of quality resembles organizational efforts to improve processes before
problems occur, and therefore can enhance organizational learning capabilities by turning
learning opportunities into actions that foster organizational performance. In fact, the work
of Psomas et al. (2018) also suggested that organization that decided to invest in prevention
costs of quality can be more competitive in the market due to reduced accidents and wasted
resources. Moreover, Ayach et al. (2019) believed that investments in prevention and
appraisal activities lower the total quality cost. Besides, Starčević et al. (2015) explained
that the companies that set quality costs provide higher quality services than competitors
that do not measure their quality costs. Their study concluded that this can, eventually, lead
to a significantly higher average rate of financial performance. Teli et al. (2013) illustrated
that it is vital to find and permanently eliminate root causes of production failures through
Page 7 of 41 The TQM Journal
123456789101112131415161718192021222324252627282930313233343536373839404142434445464748495051525354555657585960

The TQM Journal
statistical quality control methods coupled with COQ practices. Proper analysis of cause
and effect can reduce the real cost of poor quality (COPQ). So, prevention activities lead
to a lower COPQ ratio for these new processes and products. Based on this discussion, the
following hypothesis is proposed:
H1.1: There is a significant positive relationship between prevention costs practices
and organizational performance of PFMC.
Regarding the importance of appraisal costs for organizational growth, Shin et al. (2018)
outlined that investing in appraisal costs, such as in-process inspection, equipment testing,
and laboratory testing, may dramatically reduce cost of scrap, repair, and overall waste.
Understandably, this will have direct effects on reducing customer complaints and loss of
goodwill. Likewise, Akenbor (2014) indicated that appraisal costs are strongly attached to
customer satisfaction levels. It has been explained that the increase in quality non-
conformance cost leads to an immediate decreased in customer satisfaction. So, it is
suggested that companies’ investment in quality appraisal activities, such as quality
planning, preventive maintenance, material, equipment, and facilities inspection, is
necessary to reduce internal and external failure costs and to increase customer satisfaction.
In the same vein, a study by Kerfai et al. (2016) on quality costing in Tunisian
manufacturing organizations illustrated that quality appraisal activities such as pre-
production verification, product testing, receiving inspection, and the use of external
auditors all have positive consequences on customer satisfaction, sales growth, and other
aspects of the organizational performance. Further insights were discerned from the work
of Larry and Aslani (2013) who found that preventive quality measures such as pre-
examining materials and equipment have tendency to enhancing operational performance.
According to Sturm et al. (2019), although the elimination of appraisal cost as part of COQ
system in manufacturing organizations does not exist, their impact on processes
performance is significant for organizations that seek to improve their competitiveness.
Moreover, Reema (2014) emphasized the importance of not cutting appraisal costs by
quality managers, as this will ultimately lead to an increase in failure occurrences that could
damage the company's reputation. Based on these arguments, the following hypothesis can
be formulated:
Page 8 of 41The TQM Journal
123456789101112131415161718192021222324252627282930313233343536373839404142434445464748495051525354555657585960

The TQM Journal
H1.2: There is a significant positive relationship between appraisal costs practices
and organizational performance of PFMC.
On the other hand, Psomas et al. (2018) highlighted the importance of properly allocating
resources to improve the balance between the COQ dimensions in favor of the prevention
and appraisal cost. In doing so, the cost of internal and external failure will be reduced,
which will make the foodstuff company more efficient and satisfy its customers.
Additionally, Chopra and Singh (2015) demonstrated how decreasing internal and external
failure costs would lead to better organizational performance. Furthermore, Lari and
Asllani (2013) presented that greater attention is required in the design development
process to prevent reworks and know the importance of internal and external failure costs.
Similarly, the work of Cermakova and Bris (2017) conducted an action research project to
implement COQ system in a Czech manufacturing company. They concluded that the
greatest potential for creating improvements in the overall performance was hidden in the
internal and external failure costs of the COQ system. Furthermore, Kerfai et al. (2016)
also concluded that implementing a COQ system helps the company control costs better
and improve performance by promoting actions that reduce internal and external failures.
Ghanem (2018) indicated that external failure costs are the most critical COQ element
because these costs are hidden cost, and it is difficult to estimate. However, Guinot et al.
(2017) recognized that internal and external failure costs are extremely useful in improving
internal performance of organizations, as they can be used as indicator to reflect adequacy
of quality appraisal and prevention activities. Moreover, Ayach et al. (2019) stated that
after implementing COQ system, reduced customer complaints, rework and scrap,
warranty expenses, failure costs, and increased sales volume were observed. Likewise,
Akenbor (2014) indicated that the quality cost is significant to customer satisfaction by
eliminating internal and external failure costs for customers' satisfaction with health
products. Consequently, the following two hypotheses are formulated:
H1.3: There is a negative relationship between external failure costs and
organizational performance of PFMC.
H1.4: There is a negative relationship between internal failure costs and
organizational performance of PFMC.
Page 9 of 41 The TQM Journal
123456789101112131415161718192021222324252627282930313233343536373839404142434445464748495051525354555657585960

The TQM Journal
Glogovac and Filipovic (2018) demonstrated a strong, statistically significant relationship
between the organization's age and COQ application. Companies operating for more than
ten years indicate a higher level of quality cost management. Also, Prickett and Rapley
(2001) confirmed that the level of quality cost management depends much on the
company's essential demographic characteristics, such as business activity, origin, business
market, environment competitiveness, and age as the characteristics of its management
systems. These contextual factors of effect of age on COQ practices implementation level
drove authors intention in this study to test for the potential moderating impact of age of
organizations on COQ practices in PFMC. Therefore, the following hypothesis is
proposed:
H2: Age of PFMC moderates the relationship between COQ application and
Organizational performance.
Moreover, Chopra and Singh (2015) asserted that much sufficient quality and productivity
improvement tools generally find no place in small and medium-sized enterprises due to a
lack of knowledge and resources. Whereas Starcevic et al. (2015) confirmed the fact that
as large companies have more resources than small and medium-sized companies, it is
assumed that they will primarily quantify quality costs. Additionally, Ayach et al. (2019)
found that the quality cost categories depend on the firm's structure, technology, and size.
They emphasized that the implementation of COQ system depends on a company's
essential features, for instance, business activity, size, and the possession of quality
certifications. As well, Chatzipetrou and Moschidis (2017) approved that the way
companies observe quality costs proved to be highly dependent on their size. While Trehan
et al. (2015) discussed that the increasing use of quality costing increases with the increase
in the organizational size. Due to all this, the following hypothesis is proposed in this study:
H3: Size of PFMC moderates the relationship between COQ application and
organizational performance.
Based on the research hypotheses formulated above, a conceptual framework was formed.
The framework seeks to identify the underlying relationship between the level of COQ
Page 10 of 41The TQM Journal
123456789101112131415161718192021222324252627282930313233343536373839404142434445464748495051525354555657585960

The TQM Journal
practices adoption (prevention, appraisal, internal, and external failure costs) and
organizational performance in the context of the PFMC. In this paper, the authors refer to
organizational performance as indicators related to financial, customer, internal business,
and learning and growth performance. Also, the framework seeks to find out if age and size
of PFMC can moderate the relationship between COQ practices and organizational
performance. This conceptual framework is shown in Figure 1.
[Figure 1: Conceptual research framework]
3. Methodology3.1. Measurement instrument
This research adopted a quantitative research methodology using a survey. The survey was
developed based on a literature review of similar studies. The survey contained four parts.
The first part covered demographic information of respondents and contained 10 items.
The second part estimated to what extent companies use COQ practices and contained 22
items, while the third part provided items that assess organizational performance indicators
with a total of 20 items. Finally, in the fourth part, the respondent was left with a note box
to provide any other remarks or notes that the respondent might find necessary. For the
measurement of COQ constructs, a 1-5 Likert scale was used. The respondents were
required to respond to the statements that most closely represent their observations about
their company's management practices. Similarly, the Likert scale was used for the items
that measured the organization's performance. Each respondent was required to respond to
the statements based on their company's performance over the previous fiscal year. For the
Likert scale, the use of 1 reflected “not at all” practice, whereas 5 reflected “to a very great
extent” practice. To maintain content validity of the survey (Saunders et al., 2016), five
expert academics and two senior practitioners reviewed the survey items. It was deemed
that the survey was clear enough and contained all items required for each section.
3.2. Population, sample size, and respondents
This study was conducted among the PFMC population. According to PFI (2017), the total
number of PFMC in this sector is 283 companies. However, a criterion was used to only
target those companies that are registered and licensed by Palestinian Authorities, has a
Page 11 of 41 The TQM Journal
123456789101112131415161718192021222324252627282930313233343536373839404142434445464748495051525354555657585960

The TQM Journal
quality department or a quality officer with announces quality policy, and a human
resources department or function. After applying this selection criterion, 167 PFMC were
found to match this criterion. The sample size was calculated using the Thompson formula
with a confidence interval of 95% and an error margin of 5% (Thompson, 2012). It was
found that the minimum required sample is 117. The survey was sent to all qualified
companies in the population (i.e., 167) in person and over email after contacting the
companies by email and telephone. One survey was sought to be collected from each of
the sample PFMC after being completed by either the general manager, quality manager,
senior quality engineer, or HR manager with quality responsibilities. Over a period of five
months, the total number of completed surveys retrieved reached 121. After the outlier's
test, two were deleted, leaving 119 valid, complete, and usable forms. This represents a
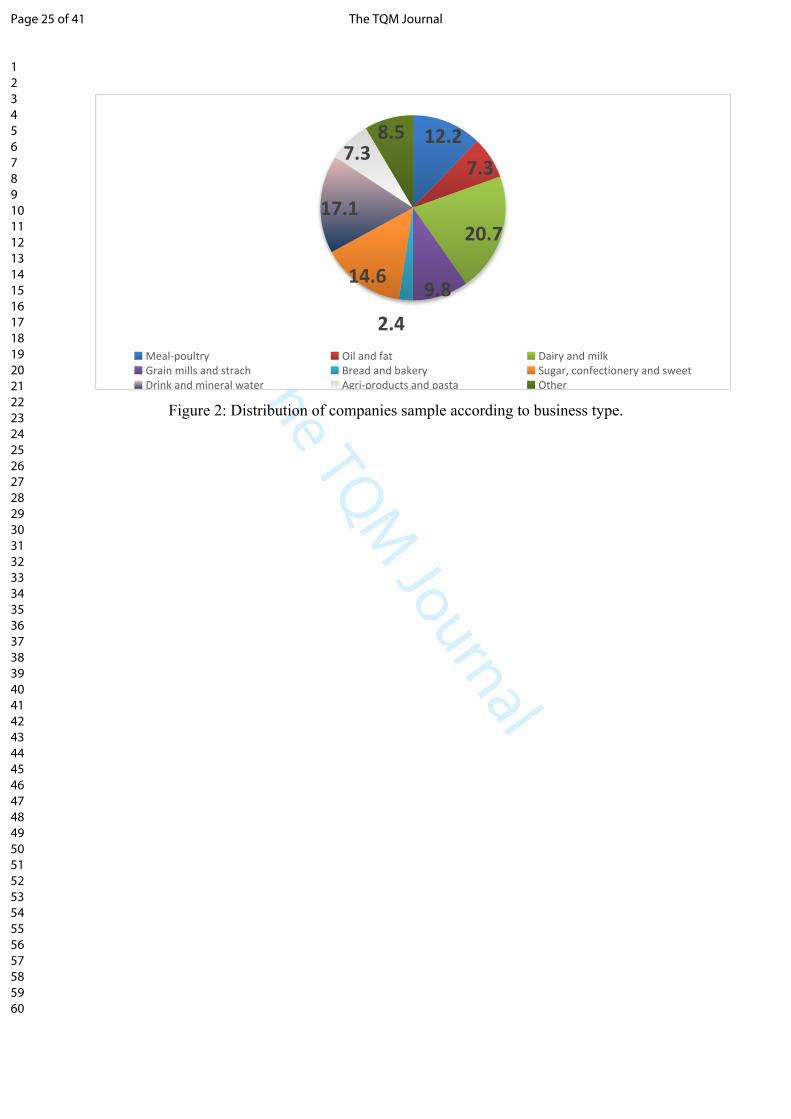
response rate of 72.4%. Figure 2 shows the distribution of companies sample according to
food product type. And Table 1 provides details of participating PFMC in terms of the
demographic of the sample.
[Figure 2: Distribution of companies sample according to business type]
[Table 1. Demographics of the sample]
4. Data analysis and results
Data collected from the survey were analyzed using Partial Least Square Structural
Equation Modelling (PLS-SEM) technique; a multivariate statistical framework used to
model complex relationships between directly and latent variables (Hair et al., 2014). The
study's essential focal point is to anticipate and clarify the primary target constructs or
identify the critical driver constructs (Rigdon, 2012). PLS-SEM will be used as a vital
analysis method for the survey results to study the correlations between this study's
hypotheses (Wong, 2013). PLS-SEM is suggested when a structural model is complex and
for the phenomenon that is abstract and not directly observable (Hair et al., 2017).
4.1 Assessment of measurement model reliability and validity
Page 12 of 41The TQM Journal
123456789101112131415161718192021222324252627282930313233343536373839404142434445464748495051525354555657585960

The TQM Journal
The measurement model's internal consistency is assessed using composite reliability
(CR). The CR varies from 0 to 1, with higher values indicating higher levels of reliability.
It is generally interpreted in the same way as Cronbach's alpha. Specifically, CR values
above 0.60 are acceptable in exploratory research (Sarstedt et al., 2014). Table 2 shows
that all Cronbach's alpha and CR values for the tested research constructs are acceptable.
[Table 2. Cronbach’s Alpha and composite reliability values]
The convergent validity (CV) is a measure that predicts the extent to which the questions
are close and compatible with each other (Hair et al., 2017), and measures using Average
Variance Extracted (AVE) value. The AVE value of (0.5) or higher designates that a latent
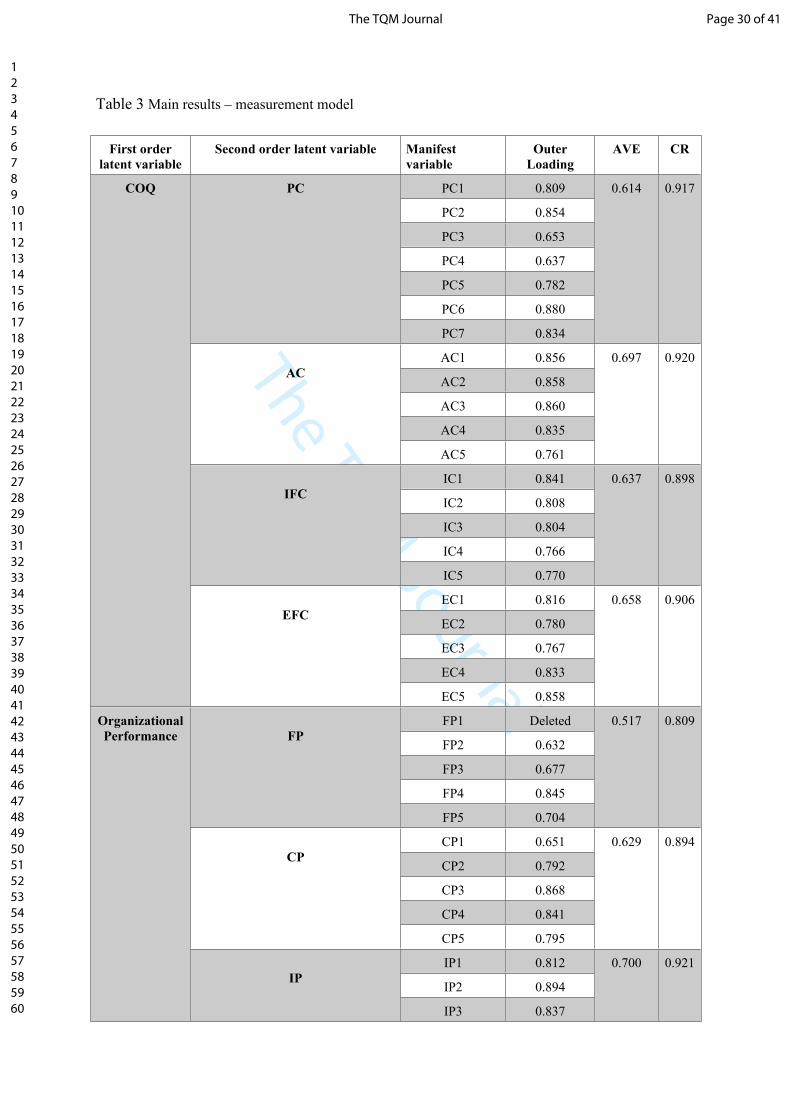
variable can explain half or more than half of its indicators' variance on average. Table 3
shows results of the measurement model convergent validity. All AVE values are above
the value of 0.5 which are considered sufficient (Fornell and Larcker, 1981; Hair et al.,
2014).
[Table 3. Main results – measurement model]
A common rule of thumb is that the standardized outer loadings should be 0.708 or higher
(Henseler et al.,2016). However, values of 0.4 or higher is also acceptable when conducting
an exploratory study like the current study (Henseler et al., 2016). The results generated
using SmartPLS 3 have values greater than 0.4 for all the loadings and hence can be
accepted. As for the discriminant validity, Fornell-larcker (1981) criterion suggested that
each construct's AVE can be compared with the squared inter-construct correlation (as a
measure of shared variance) of that same construct. All other reflectively measured
constructs in the structural model; the shared variance for all model constructs should not
be larger than their AVEs (Hair et al., 2017). The summary of the test results is presented
in Table 4.
[Table 4. Fornell-Larcker’s criterion test summery]
Based on Table 3, appraisal cost’s AVE is found to be (0.697). Hence, its square root
becomes (0.835); this is larger than the correlation values in the column and row of
Page 13 of 41 The TQM Journal
123456789101112131415161718192021222324252627282930313233343536373839404142434445464748495051525354555657585960

The TQM Journal
appraisal costs provided in Table 4. A similar finding is observed for all other variables
shown in Table 4. The results, hence, indicate that discriminant validity is well established.
COQ consists of four components, and several practices measure each element as per the
literature review. Figure 3 shows SmartPLS generated evaluation of the measurement
model.
[Figure 3: Measurement model Evaluation as generated by SmartPLS]
4.2. Assessment of structural Model
Assessing the latent variable's path coefficients is used to validate the proposed hypotheses
and the structural model (Hair et al., 2011). By examining the path coefficient, a scholar
can predict the strength of the connection between two latent variables. The scholar should
test the path coefficients, arithmetical sign, extent, and centrality to inspect the relationship
between two latent variables. As per Hair et al. (2016), the path coefficients ought to
surpass 0.100 to represent a specific effect inside the model and be significant at any rate
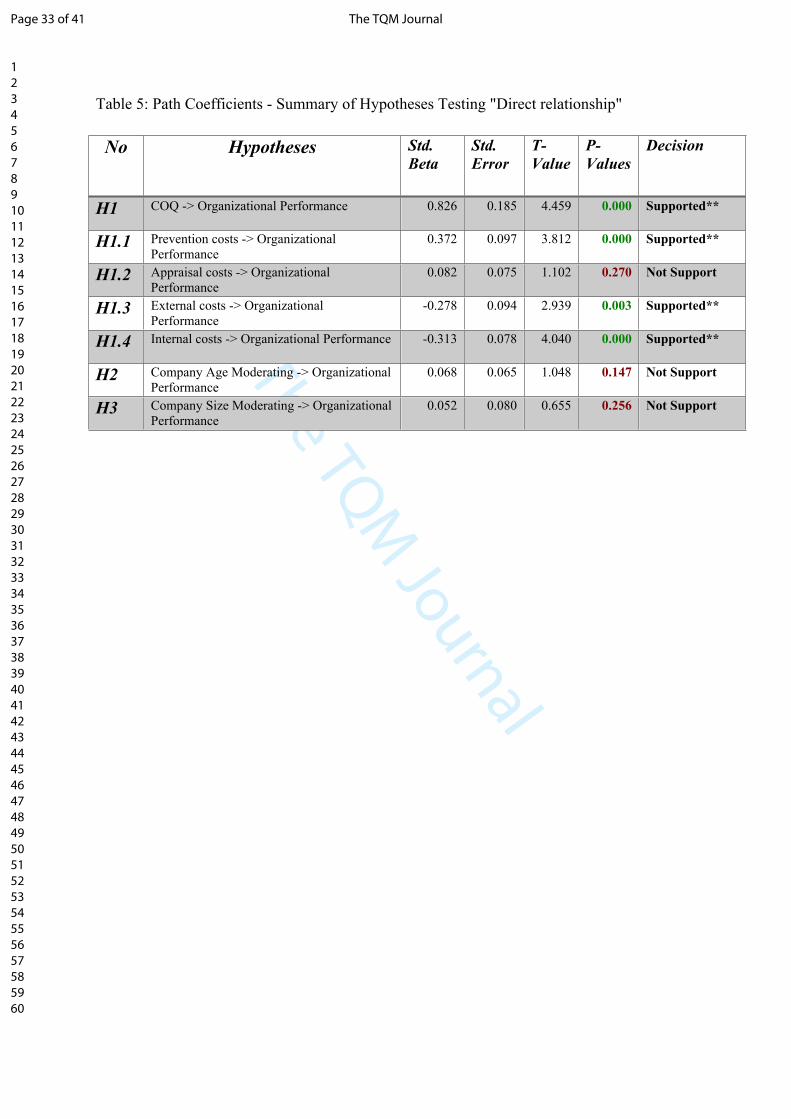
at the 0.05 value. Standard Beta, standard error, T-Value, and P-Value are illustrated in
Table 5, and Figure 4 shows path’s P-Values for the blindfolding model generated by
Smart-PLS.
[Table 5. Path Coefficients - Summary of Hypotheses Testing "Direct relationship”]
The results show that four hypotheses were supported (i.e., H1, H.1.1, H1.3, and H1.4).
However, the other three hypotheses (i.e., H1.2, H2, and H3) were not supported.
[Figure 4: P-values generated by SmartPLS]
Indicators of model fit enable judging how well a hypothesized model structure fits the
empirical data and helps identify model misspecifications (Hair et al., 2016). One of the
earliest proposed indices is a goodness-of-fit index (GOF) as an operational solution. It is
the geometric mean of both average variances extracted (AVE) and the average of R² of
Page 14 of 41The TQM Journal
123456789101112131415161718192021222324252627282930313233343536373839404142434445464748495051525354555657585960

The TQM Journal
the endogenous variables (Hair et al.,2016). The purpose of GOF is to account for the study
model at both levels, namely measurement, and structural model, focusing on the model's
overall performance (Henseler and Sarstedt, 2013). Chin’s (2010) calculation formula of
GOF is as follow:
GOF = = 0.682(𝑅2 × 𝐴𝑉𝐸)
The criteria to verify whether GOF values are no fit, small, medium, or large have been
given by Wetzels (2009). Table 6 below shows these criteria:
[Table 6. The criteria of GOF]
Based on Table 6 and the value of the GOF (0.682), it is evident that the GOF model of
this study is large enough to be considered as having sufficient global PLS model validity.
5. Discussion and conclusions
This main aim of this research was to investigate the underlying relationship between the
level of COQ practices adoption (prevention, appraisal, internal, and external failure costs)
and organizational performance in PFMC. To the best of the authors knowledge, this study
is the first to investigate the effect of COQ practices on organizational performance in food
manufacturing companies in a developing country context, thus adding great value to
literature responding to calls to tackle competitiveness issues in current complex business
environments. The overall hypotheses testing results achieved through the PLS-SEM
technique have proven a positive and significant relationship between COQ and
organizational performance (β = 0.826, t =4.459, p =0.000). This result is in line with
several previous studies. For example, Ghanem (2018) confirms the validity of the causal
relationship between the COQ and improving the organizations' competitive advantages
by enhancing all performance tools. Moreover, Kerfai et al. (2016) found that COQ has the
potential to support managers in promoting procedures that help the company control costs
better, increase profit, and improve performance. This result also coheres with Modhiya
and Desai's (2016) findings, stating that after COQ implementation, customer complaint
reduction can be achieved along with scrap and reword numbers drop. Besides, Pattanayak
et al. (2019) asserted that the prerequisite to improve the company's poor performance is a
Page 15 of 41 The TQM Journal
123456789101112131415161718192021222324252627282930313233343536373839404142434445464748495051525354555657585960
The TQM Journal
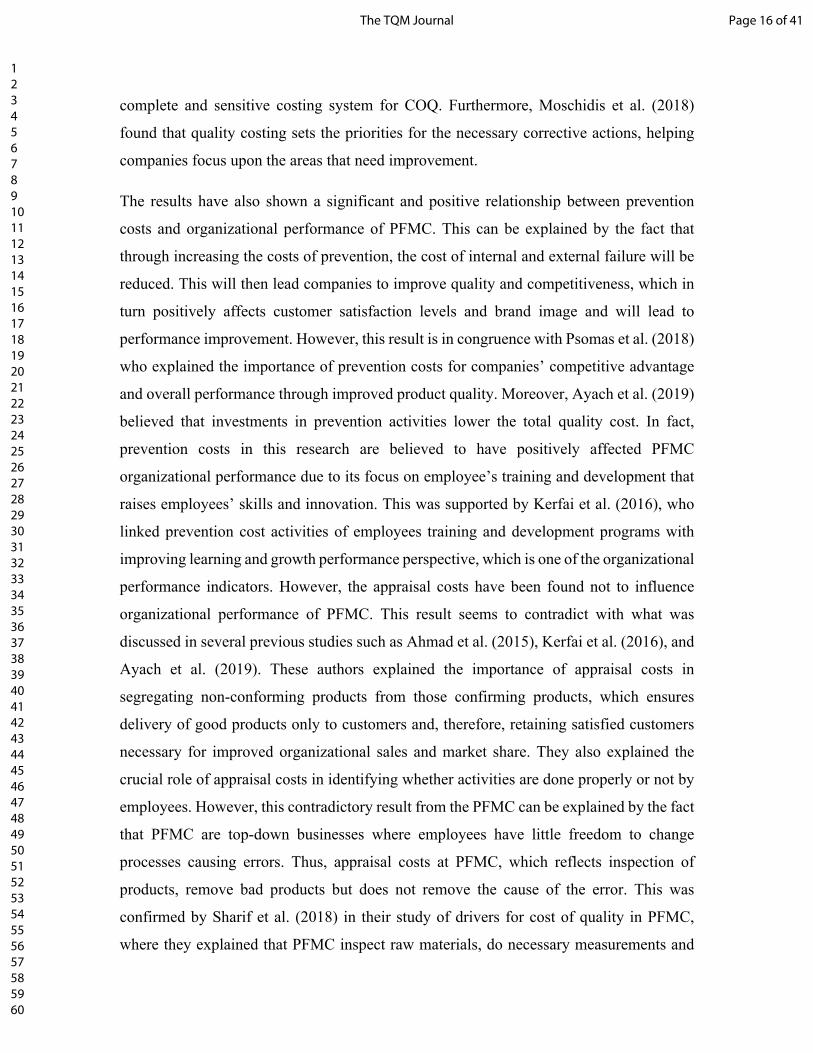
complete and sensitive costing system for COQ. Furthermore, Moschidis et al. (2018)
found that quality costing sets the priorities for the necessary corrective actions, helping
companies focus upon the areas that need improvement.
The results have also shown a significant and positive relationship between prevention
costs and organizational performance of PFMC. This can be explained by the fact that
through increasing the costs of prevention, the cost of internal and external failure will be
reduced. This will then lead companies to improve quality and competitiveness, which in
turn positively affects customer satisfaction levels and brand image and will lead to
performance improvement. However, this result is in congruence with Psomas et al. (2018)
who explained the importance of prevention costs for companies’ competitive advantage
and overall performance through improved product quality. Moreover, Ayach et al. (2019)
believed that investments in prevention activities lower the total quality cost. In fact,
prevention costs in this research are believed to have positively affected PFMC
organizational performance due to its focus on employee’s training and development that
raises employees’ skills and innovation. This was supported by Kerfai et al. (2016), who
linked prevention cost activities of employees training and development programs with
improving learning and growth performance perspective, which is one of the organizational
performance indicators. However, the appraisal costs have been found not to influence
organizational performance of PFMC. This result seems to contradict with what was
discussed in several previous studies such as Ahmad et al. (2015), Kerfai et al. (2016), and
Ayach et al. (2019). These authors explained the importance of appraisal costs in
segregating non-conforming products from those confirming products, which ensures
delivery of good products only to customers and, therefore, retaining satisfied customers
necessary for improved organizational sales and market share. They also explained the
crucial role of appraisal costs in identifying whether activities are done properly or not by
employees. However, this contradictory result from the PFMC can be explained by the fact
that PFMC are top-down businesses where employees have little freedom to change
processes causing errors. Thus, appraisal costs at PFMC, which reflects inspection of
products, remove bad products but does not remove the cause of the error. This was
confirmed by Sharif et al. (2018) in their study of drivers for cost of quality in PFMC,
where they explained that PFMC inspect raw materials, do necessary measurements and
Page 16 of 41The TQM Journal
123456789101112131415161718192021222324252627282930313233343536373839404142434445464748495051525354555657585960
The TQM Journal
testing, and recruit enough inspection staff, but apply mechanistic structure that does not
allow employees to redesign operations for error source removals. Similarly,
Purushothama (2012) asserted that inspection activities cannot improve internal
operational performance of organizations but can only sort out some of the bad products.
The results also illustrated a negative relationship between internal and external failure
costs and organizational performance. This was in line with Chopra and Singh (2015) who
demonstrated that increasing internal and external failure costs is an indicator of a
significant increase in number of resources consumed and profits lost by organizations.
They added that decreasing these costs is a direct measure for improving organizational
performance. Furthermore, Kerfai et al. (2016) concluded that improving organizational
performance is strongly linked with actions that reduce internal and external failures such
as scrap, absenteeism, and customer complaints. This result also coheres with the results
found by Akenbor (2014) who indicated that decreasing internal and external failure costs
is a result of an intelligent enhancement in the adoption of error prevention activities, which
can immensely enhance organizational performance.
In this study, the differences in the level of COQ are observed regarding the companies'
size and age. It was found that size and age do not have any moderating effect between
COQ practices and organizational performance in PFMC (p > 0.05). This was unlike
findings reported in previous research where company size and age are essential for the
COQ management level (Chatzipetrou and Moschidis, 2017; Chopra and Singh, 2015;
Glogovac and Filipovic, 2018). This is because majority of PFMC are family businesses
where general managers are family members who have high levels of attachment and
commitment to organizational success (Abuznaid, 2014). This would imply that any quality
management initiatives, such as the application of COQ practices, are supported and are
pledged to organization success.
The results reported in this study have some prominent insights for managers and
researchers. First, it is deducted that managers should invest more in prevention costs such
as quality planning, customer analysis, and employees’ training and development. This
can, eventually, allow managers to significantly reduce internal and external failure costs
that can boost competitive advantage. Second, it is evident that managers should also invest
Page 17 of 41 The TQM Journal
123456789101112131415161718192021222324252627282930313233343536373839404142434445464748495051525354555657585960

The TQM Journal
more in re-work, scrape, and re-inspection practices as part of the internal failure costs and
invest in practices that can improve customer complaints rates, product liability costs, and
number of defects delivered to customers as part of the external failure costs. These
measures, as shown in results, can significantly enhance organizational performance in
similar business contexts. However, this study theorizes for the first time the COQ practices
with organizational performance in food manufacturing sector in developing countries
context. This linking articulates a structured process of learning about the practices that
have the highest impact on organizational performance.
6. Limitations and future research directions
Although this study provides new insights on the underlying relationship between COQ
practices adoption and organizational performance in developing countries context, it has
some limitations that can pave the way for further future COQ research. The nature of food
manufacturing companies is unique (Djekic et al., 2014) that makes generalizing the results
to other sectors limited. Hence, future research may consider replicating this study in other
manufacturing sectors in developing countries to investigate tested relationships. Also,
future research may consider re-investigation of relationships tested in this study using
longitudinal research design to capture the nature of organizational performance change
over a longer period. Furthermore, this study collected data from PFMC managers and
employees without the inclusion of customer and stakeholders’ perspectives. It would be
essential for future research to replicate this study by triangulating the results using
customer and stakeholders’ inputs on the level of organizational performance
improvements. Finally, there is a need for future studies that can include other moderating
variables, other than size and age, on the relationship between COQ practices and
organizational performance such as financial strength and quality certification availability.
References
Abu-Mahfouz, S. S. (2019). TQM Practices and Organizational Performance in the Manufacturing Sector in Jordan mediating role of HRM Practices and Innovation. Journal of Management and Operation Research, 1 (22), 1-12.
Abuznaid, S.A. (2014). Managing a Family Business in a Complex Environment: The Case of Palestine. International Journal of Business and Social Science, 5 (10), 187-196.
Page 18 of 41The TQM Journal
123456789101112131415161718192021222324252627282930313233343536373839404142434445464748495051525354555657585960
The TQM Journal
Ahmad, S., Pesch, M. J., & Gulati, R. (2015). Cost of quality: Lessons from toy recalls. Journal of International Business Research, 14(2), 1-14.
Alglawe, A., Schiffauerova, A., & Kuzgunkaya, O. (2019). Analysing the cost of quality within a supply chain using system dynamics approach. Total Quality Management & Business Excellence, 30(15-16), 1630-1653.
Altayeb, M. M., & Alhasanat, M. B. (2014). Implementing total quality management (TQM) in the Palestinian construction industry. International Journal of Quality & Reliability Management. 31(8):878-887.
Akenbor, C. O. (2014). An accounting reflection of quality cost and customer satisfaction of health products in Nigeria. Journal of Business and Retail Management Research, 8(2), 42-53.
Ayach, L., Anouar, A., & Bouzziri, M. (2019). Quality cost management in Moroccan industrial companies: Empirical study. Journal of Industrial Engineering and Management, 12(1), 97-114.
Bajaj, S., Garg, R., & Sethi, M. (2018). Total quality management: a critical literature review using Pareto analysis. International Journal of Productivity and Performance Management, 67 (1), 128-154.
Bayram, M. and Ünğan, M.C. (2020). The relationships between OHS prevention costs, OHSMS practices, employee satisfaction, OHS performance and accident costs. Total Quality Management & Business Excellence, 31(11-12), 1325-1344.
Cermakova, C. and Bris, P. (2017). Managing the costs of quality in a Czech manufacturing company. Scientific Papers of the University of Pardubice. Series D, Faculty of Economics and Administration, 25(41), 6-18.
Chatzipetrou, E., & Moschidis, O. (2017). An exploratory analysis of quality costing in Greek F&B enterprises. The TQM Journal, 29(2), 324-341.
Chin W.W. (2010). How to Write Up and Report PLS Analyses. In: Esposito Vinzi V., Chin W., Henseler J., Wang H. (eds) Handbook of Partial Least Squares. Springer Handbooks of Computational Statistics. Springer, Berlin, Heidelberg, 655-690. https://doi.org/10.1007/978-3-540-32827-8_29
Chopra, A., & Singh, B. J. (2015). Unleashing a decisive approach to manage quality costs through behavioural investigation. Business Process Management Journal., 21(6), 1206-1223.
Costa, L.B.M., Filho, M.G., Fredendall, L.D. & Paredes, F.J.G. (2018). Lean, six sigma and lean six sigma in the food industry: A systematic literature review. Trends in Food Science & Technology, 82, 122- 133.
Ćwiklicki, M. (2016). Understanding Management Concepts through Development of their Tool Box: The case of total quality management. Naše gospodarstvo/Our economy, 62(1), 56-62.
Dan.O. (2017). Cost of quality and organizational performance in sugar manufacturing firms in Kenya. University of Nairobi Digital Repository. Available from http://hdl.handle.net/11295/102941 [Accessed 27 December 2020].
Diefenbach, U., Wald, A. and Gleich, R. (2018). Between cost and benefit: investigating effects of cost management control systems on cost efficiency and organisational performance. Journal of Management Control, 29 (1), 63–89.
Dimitrantzou, C., Psomas, E. and Vouzas, F. (2020). Future research avenues of cost of quality: a systematic literature review. The TQM Journal, 32(6), 1599-1622.
Page 19 of 41 The TQM Journal
123456789101112131415161718192021222324252627282930313233343536373839404142434445464748495051525354555657585960

The TQM Journal
Djekic, I., Zaric, V., & Tomic, J. (2014). Quality costs in a fruit processing company: a case study of a Serbian company. Quality Assurance and Safety of Crops & Foods, 6(1), 95-103.
Ebrahimi, M. & Sadeghi, M. (2013). Quality management and performance: An annotated review. International Journal of Production Research, 51(18), 5625-5643.
Elyazid, S. (2016). Performance Measurement: Quality, Cost, and Time Is New System: So Called Strategic Cost Management. Research Journal of Finance and Accounting, 7(17), 1-11.
Farooq, M. A., Kirchain, R., Novoa, H., & Araujo, A. (2017). Cost of quality: Evaluating cost-quality trade-offs for inspection strategies of manufacturing processes. International Journal of Production Economics, 188, 156-166.
Fornell, C., & Larcker, D. F. (1981). Structural equation models with unobservable variables and measurement error: Algebra and statistics. Journal of Marketing Research, 18(3), 382-388.
Ghanem, F. A. (2018) Cost of quality ad a tool to improve the Palestinian industrial organization competitive advantage. International Journal of business quantitative economics and applied management research, 4(11), 35-53.
Ghasghaee, E. K., & Fathollahi, J. (2014). The relationship between cost, quality and financial performance of the company (with a case study of Tehran Stock Exchange). Indian Journal of Fundamental and Applied Life Sciences, 4(S4), 1575-1585.
Glogovac, M., & Filipovic, J. (2018). Quality costs in practice and an analysis of the factors affecting quality cost management. Total Quality Management & Business Excellence, 29(13-14), 1521-1544.
Guinot, J., Sinn, J.W., Badar, M.A. and Ulmer, J.M. (2017). Cost consequence of failure in failure mode and effect analysis. International Journal of Quality & Reliability Management, 34(8), 1318-1342.
Guinot, J., Evans, D. and Badar, M.A. (2016). Cost of quality consideration following product launch in a present worth assessment. International Journal of Quality & Reliability Management, 33(3), 399-413.
Hair Jr, J. F., Hult, G. T. M., Ringle, C., & Sarstedt, M. (2016). A primer on partial least squares structural equation modeling (PLS-SEM). Thousand Oaks, California: Sage publications.
Hair, J. F., Ringle, C. M., & Sarstedt, M. (2011). PLS-SEM: Indeed a silver bullet. Journal of Marketing theory and Practice, 19(2), 139-152.
Hair, J. F., Hult, G. T. M., Ringle, C. M., Sarstedt, M., & Thiele, K. O. (2017). Mirror, mirror on the wall: a comparative evaluation of composite-based structural equation modeling methods. Journal of the Academy of Marketing Science, 45(5), 616-632.
Hair Jr, J. F., Sarstedt, M., Hopkins, L., & Kuppelwieser, V. G. (2014). Partial least squares structural equation modeling (PLS-SEM). European business review, 26(2), 106-121.
Henseler, J., Hubona, G., & Ray, P. A. (2016). Using PLS path modeling in new technology research: updated guidelines. Industrial management & data systems, 116(1), 2-20.
Herzallah, A. M., Gutiérrez-Gutiérrez, L., & Munoz Rosas, J. F. (2014). Total quality management practices, competitive strategies and financial performance: the case
Page 20 of 41The TQM Journal
123456789101112131415161718192021222324252627282930313233343536373839404142434445464748495051525354555657585960

The TQM Journal
of the Palestinian industrial SMEs. Total Quality Management & Business Excellence, 25(5-6), 635-649.
Hung, H.C. and Sung, M.H. (2011). Applying six sigma to manufacturing processes in the food industry to reduce quality cost. Scientific Research and Essays, 6(3), 580–591. doi: 10.5897/SRE10.823.
Iqbal, A., & Asrar-ul-Haq, M. (2018). Establishing relationship between TQM practices and employee performance: The mediating role of change readiness. International Journal of Production Economics, 203, 62-68.
Kerfai, N., Ghadhab, B. B., & Malouche, D. (2016). Performance measurement and quality costing in Tunisian manufacturing companies. The TQM Journal, 28(4), 588-596.
Khozein, A., Mohammadi, J., & Abbasi Zarmehri, M. (2013). Cost of quality and quality optimization in manufacturing. European Online Journal of Natural and Social Sciences, 2(3 (s)), 1070-1081.
Lari, A., & Asllani, A. (2013). Quality cost management support system: an effective tool for organisational performance improvement. Total Quality Management & Business Excellence, 24(3-4), 432-451.
Masri, H.A. & Jaaron, A.A.M. (2017). Assessing green human resources management practices in Palestinian manufacturing context: An empirical study. Journal of Cleaner Production, 143, 474-489.
Mata‐Lima, H., Morgado‐Dias, F., Galuzzi da Silva, M.C., Alcântara, K. & Almeida, J.A. (2016). A Systematic Framework for the Design and Implementation of a Quality Management Practice: The Case of a Consulting Engineering Company. Environmental Quality Management, 25(4), 49-61.
Modhiya, S. & Desai, D. (2016). A review on cost of quality methodology and hidden costs in manufacturing industries. REST Journal on Emerging trends in Modelling & Manufacturing, 2(4), 87-94.
Moschidis, O., Chatzipetrou, E., & Tsiotras, G. (2018). Quality costing and quality management maturity in Greece: An exploratory multi-dimensional data analysis. International Journal of Productivity and Performance Management, 67(1), 171-191.
Omar, M. K. and Murgan, S. (2014). An improved model for the cost of quality. International Journal of Quality & Reliability Management, 31(4), 395-418. https://doi.org/10.1108/IJQRM-05-2012-0066
Omurgonulsen, M. (2009)'A research on the measurement of quality costs in the Turkish food manufacturing industry',Total Quality Management & Business Excellence, 20(5), 547-562.
Palestinian Federation of Industries (PFI) (2017) The Current Status of Industrial Sector in Palestine. Available at: http://www.pfi.ps/Portals/_default/Reports/1.pdf [Accessed 23 September 2020].
Pattanayak, A.K., Prakash, A. &Mohanty, R.P. (2019). Risk analysis of estimates for cost of quality in supply chain: a case study. Production Planning & Control, 30(4), pp.299-314.
Palestinian Investment Promotion Agency (PIPA) (2017). Food and beverage industry. [online]. Available at: http://www.pipa.ps/page.php?id=1ab350y1749840Y1ab350 [Accessed 3 April 2020].
Page 21 of 41 The TQM Journal
123456789101112131415161718192021222324252627282930313233343536373839404142434445464748495051525354555657585960

The TQM Journal
Plewa, M., Kaiser, G., & Hartmann, E. (2016). Is quality still free? Empirical evidence on quality cost in modern manufacturing. International Journal of Quality & Reliability Management. 33(9), 1270-1285.
Prickett, T. W., & Rapley, C. W. (2001). Quality costing: A study of manufacturing organizations. Part 2: Main survey. Total Quality Management, 12(2), 211-222.
Psomas, E., Dimitrantzou, C., Vouzas, F., & Bouranta, N. (2018). Cost of quality measurement in food manufacturing companies: the Greek case. International Journal of Productivity and Performance Management, 67(9),1882-1900
Purushothama, B. (2012). Costing and cost of quality. In: Purushothama, C. (eds.) Training and Development of Technical Staff in the Textile Industry. India: Woodhead Publishing India, 99-114.
Rahmat, S.; Cheong, C.B. & Abd Hamid, M.S. (2016). Challenges of Developing Countries in Complying Quality and Enhancing Standards in Food Industries, Procedia - Social and Behavioral Sciences, 224, 445-451.
Rema, S. (2014). Modeling Cost of Quality in the Construction Industry A closer look at the Procurement Process using System Dynamics, Doctoral dissertation, Concordia University, Canada.
Rigdon, E.E. (2012). Rethinking partial least squares path modeling: In praise of simple methods. Long Range Planning, 45(5-6), 341-358.
Sainis, G. (2018). Characterising the Quality Journey of Total Quality Management in Relation to the Financial Performance of SMEs Under Crisis Conditions: the Case for Greece. Doctoral Dissertation, University of Hertfordshire, England.
Sailaja, A., Basak, P.C. & Viswanadhan, K.G. (2015). Hidden costs of quality: Measurement & Analysis. International Journal of Managing Value and Supply Chains, 6(2), 13-25.
Saleh, R.A., Sweis, R.J. and Mahmoud Saleh, F.I. (2018). Investigating the impact of hard total quality management practices on operational performance in manufacturing organizations: Evidence from Jordan. Benchmarking: An International Journal, 25(7), 2040-2064.
Sarstedt, M., Hair, J. F., Ringle, C. M., Thiele, K. O., & Gudergan, S. P. (2016). Estimation issues with PLS and CBSEM: Where the bias lies!. Journal of Business Research, 69(10), 3998-4010.
Saunders, M., Lewis, P. & Thornhill, A. (2016). Research methods for business students. Harlow, Essex: Pearson Education Limited.
Shafiq, M., Lasrado, F. & Hafeez, K. (2019). The effect of TQM on organisational performance: empirical evidence from the textile sector of a developing country using SEM. Total Quality Management & Business Excellence, 30(1-2), 31-52.
Shin, W.S.; Dahlgaard, J.J.; Dahlgaard-Park, S.M. and Kim, M.G. (2018). A Quality Scorecard for the era of Industry 4.0. Total Quality Management & Business Excellence, 29(9-10), 959-976.
Snieška, V., Daunorienė, A. & Žekevičienė, A. (2013). Hidden costs in the evaluation of quality failure costs. Engineering Economics, 24(3), 176-186.
Starčević, D.P., Mijoč, I. & Mijoč, J. (2015). Quantification of quality costs: Impact on the quality products. Ekonomski pregled: mjesečnik Hrvatskog društva ekonomista Zagreb, 66(3), 231-251.
Page 22 of 41The TQM Journal
123456789101112131415161718192021222324252627282930313233343536373839404142434445464748495051525354555657585960

The TQM Journal
Sturm, S., Kaiser, G., & Hartmann, E. (2019). Long-run dynamics between cost of quality and quality performance dynamics. International Journal of Quality & Reliability Management, 36(8), 1438-1453. doi:10.1108/IJQRM-05-2018- 0118
Teli, S.N., Majali, V.S., Bhushi, U.M. et al. (2013). Cost of Poor Quality Analysis for Automobile Industry: A Case Study. J. Inst. Eng. India Ser. 94, 373–384. https://doi.org/10.1007/s40032-013-0091-z
Thompson, S. K. (2012) Sampling. 3rd edn. New Jersey: Wiley Publishers and Sons.Trehan, R., Sachdeva, A., & Garg, R. K. (2015). A comprehensive review of cost of
quality. VIVECHAN International Journal of Research, 6(1), 70-88.Wetzels, M., Odekerken-Schröder, G., & Van Oppen, C. (2009). Using PLS path modeling
for assessing hierarchical construct models: Guidelines and empirical illustration. MIS quarterly, 33(1), 177-195.
Wong, K. (2013). Partial least squares structural equation modeling (PLS-SEM) techniques using SmartPLS. Marketing Bulletin, 24(1), 1-32
Zaid, A.A., Jaaron, A.A. & Bon, A.T. (2018). The impact of green human resource management and green supply chain management practices on sustainable performance: An empirical study. Journal of Cleaner Production, 204, 965-979.
Page 23 of 41 The TQM Journal
123456789101112131415161718192021222324252627282930313233343536373839404142434445464748495051525354555657585960

The TQM Journal
Figure 1: Conceptual research framework.
Prevention Costs
Appraisal Costs
External Costs
Internal Costs
Financial performance
Customer performance
Internal business
performance
Learning and growth
performance
Cost of quality
Organization performance
AgeSize
H1
H1.1
H1.2
H1.3
H1.4
H2 H3
Page 24 of 41The TQM Journal
123456789101112131415161718192021222324252627282930313233343536373839404142434445464748495051525354555657585960
The TQM Journal
12.27.3
20.7
9.8
2.4
14.6
17.1
7.38.5
Meal-poultry Oil and fat Dairy and milk Grain mills and strach Bread and bakery Sugar, confectionery and sweetDrink and mineral water Agri-products and pasta Other
Figure 2: Distribution of companies sample according to business type.
Page 25 of 41 The TQM Journal
123456789101112131415161718192021222324252627282930313233343536373839404142434445464748495051525354555657585960

The TQM Journal
Figure 3: Measurement model evaluation as generated by SmartPLS.
Page 26 of 41The TQM Journal
123456789101112131415161718192021222324252627282930313233343536373839404142434445464748495051525354555657585960

The TQM Journal
Figure 4: P-values generated by SmartPLS
Page 27 of 41 The TQM Journal
123456789101112131415161718192021222324252627282930313233343536373839404142434445464748495051525354555657585960

The TQM Journal
Table 1. Demographics of the sample
Characteristic Alternative Percentage
Job TitleGeneral managerQuality managerQuality engineerHR manager
26.8%32.9%12.2%28.1%
Respondents' work experiences in companies
0-5 years6-10 years11-15 years16-20 yearsMore than 20 years
18.3%36.6%28.8%13.4%3.7%
Company ownership Family owned businessNon-family owned business
61.9%39%
Company working years 0-5 years11-15 years16-20 years
12.2%45.1%23.2%
Respondent company's size
Micro enterpriseSmall enterpriseMedium enterpriseLarge enterprise
2.4%13.4%54.9%29.3%
Certifications of responding companies
YesNo
65.9%34.1%
Page 28 of 41The TQM Journal
123456789101112131415161718192021222324252627282930313233343536373839404142434445464748495051525354555657585960

The TQM Journal
Table 2: Cronbach’s Alpha and composite reliability values
Construct Cronbach's Alpha Composite Reliability
Composite Reliability
Customer performance (CP)
0.850 0.894 Acceptable
Financial performance (FP)
0.712 0.809 Acceptable
Internal business performance (IP)
0.892 0.921 Acceptable
Learning and growth performance (LGP)
0.918 0.939 Acceptable
Appraisal costs (AC) 0.891 0.920 Acceptable
External failure costs (EFC)
0.870 0.906 Acceptable
Internal failure costs (IFC)
0.858 0.898 Acceptable
Prevention costs (PC) 0.893 0.917 Acceptable
Page 29 of 41 The TQM Journal
123456789101112131415161718192021222324252627282930313233343536373839404142434445464748495051525354555657585960
The TQM Journal
Table 3 Main results – measurement model
First order latent variable
Second order latent variable Manifest variable
Outer Loading
AVE CR
PC1 0.809
PC2 0.854
PC3 0.653
PC4 0.637
PC5 0.782
PC6 0.880
PC
PC7 0.834
0.614 0.917
AC1 0.856
AC2 0.858
AC3 0.860
AC4 0.835
AC
AC5 0.761
0.697 0.920
IC1 0.841
IC2 0.808
IC3 0.804
IC4 0.766
IFC
IC5 0.770
0.637 0.898
EC1 0.816
EC2 0.780
EC3 0.767
EC4 0.833
COQ
EFC
EC5 0.858
0.658 0.906
FP1 Deleted
FP2 0.632
FP3 0.677
FP4 0.845
FP
FP5 0.704
0.517 0.809
CP1 0.651
CP2 0.792
CP3 0.868
CP4 0.841
CP
CP5 0.795
0.629 0.894
IP1 0.812
IP2 0.894
Organizational Performance
IP
IP3 0.837
0.700 0.921
Page 30 of 41The TQM Journal
123456789101112131415161718192021222324252627282930313233343536373839404142434445464748495051525354555657585960

The TQM Journal
IP4 0.795
IP5 0.841
LG1 0.830
LG2 0.901
LG3 0.912
LG4 0.914
LGP
LG5 0.783
0.756 0.939
Page 31 of 41 The TQM Journal
123456789101112131415161718192021222324252627282930313233343536373839404142434445464748495051525354555657585960

The TQM Journal
Table 4: Fornell-Larcker’s criterion test summery. AC PC EFC FP IFC CP IP LGP
AC 0.835
PC 0.459 0.793
EFC -0.405 -0.624 0.811
FP 0.200 0.205 -0.063 0.719
IFC -0.476 -0.586 0.471 -0.157 0.798
CP 0.545 0.654 -0.626 0.344 -0.456 0.783
IP 0.504 0.771 -0.596 0.178 -0.573 0.647 0.837
LGP 0.437 0.508 -0.596 0.206 -0.538 0.562 0.577 0.870
Page 32 of 41The TQM Journal
123456789101112131415161718192021222324252627282930313233343536373839404142434445464748495051525354555657585960
The TQM Journal
Table 5: Path Coefficients - Summary of Hypotheses Testing "Direct relationship"
No Hypotheses Std. Beta
Std. Error
T-Value
P-Values
Decision
H1 COQ -> Organizational Performance 0.826 0.185 4.459 0.000 Supported**
H1.1 Prevention costs -> Organizational Performance
0.372 0.097 3.812 0.000 Supported**
H1.2 Appraisal costs -> Organizational Performance
0.082 0.075 1.102 0.270 Not Support
H1.3 External costs -> Organizational Performance
-0.278 0.094 2.939 0.003 Supported**
H1.4 Internal costs -> Organizational Performance -0.313 0.078 4.040 0.000 Supported**
H2 Company Age Moderating -> Organizational Performance
0.068 0.065 1.048 0.147 Not Support
H3 Company Size Moderating -> Organizational Performance
0.052 0.080 0.655 0.256 Not Support
Page 33 of 41 The TQM Journal
123456789101112131415161718192021222324252627282930313233343536373839404142434445464748495051525354555657585960

The TQM Journal
Table 6: The criteria of GOF
GOF less than 0.1 No fit
GOF between 0.1 to 0.25 Small
GOF between 0.25 to 0.36 Medium
GOF greater than 0.36 Large
Page 34 of 41The TQM Journal
123456789101112131415161718192021222324252627282930313233343536373839404142434445464748495051525354555657585960

The TQM Journal
Appendix 1: Survey Instrument
Section 1: General information
1. Name of your company …………………………………………………
2. Please select the position you currently hold within your company.o General Manager or CEOo Quality managero Quality engineero HR managero Other, please specify………………………………………………….
3. Please indicate the number of years that you have been in your current position. o 0 – 5 years.o 6 – 10 years.o 11 – 15 years.o 16 – 20 years.o More than 20 years.
4. In what Food manufacturing is your company operating?o Meal-poultryo Oils and fatso Dairy and milko Grain mills and starcho Bread and bakeryo Sugar, confectionery and sweeto Drink and mineral water o Agri-products and pasta o Other, please specify ……………………………………….
5. Is your company a family business?o Yeso No
6. Please indicate the number of years your company has been in food industry. (Number of years since your company was established).
o 0-5 years.o 6-10 years.o 11-15 years.o 16-20 years.o More than 20 years
7. How do you classify your company size? o Micro enterprise (fewer than 10 employees). o Small enterprises (10 to 49 employees). o Medium-sized enterprise (50 to 249 employees). o Large enterprise (250 or more employees).
Page 35 of 41 The TQM Journal
123456789101112131415161718192021222324252627282930313233343536373839404142434445464748495051525354555657585960

The TQM Journal
8. In which governate your firm is located?o Bethlehemo Gazao Hebrono Jenino Jerichoo Jerusalemo Nabluso Qalqilyao Ramallah & Al-Beireho Salfito Tubaso Tukaram
9. Does your company currently have any exporting activities?o Yeso No
10. Does your company currently have any certifications (i.e., ISO certification)?o Yes (Please list names of classifications …………………………………………… o No
Section 2. To what extent does your company use the following cost of quality practices?
NO. Statement
Not
at a
ll
To a
slig
ht d
egre
e
To a
mod
erat
ede
gree
To a
gre
at e
xten
t
To a
ver
y gr
eat
exte
nt
Part one: Prevention costs (PC)
1. Your company sets a budget for staff training
2. Your company sets a budget for staff development
Page 36 of 41The TQM Journal
123456789101112131415161718192021222324252627282930313233343536373839404142434445464748495051525354555657585960

The TQM Journal
3. Your company sets a budget for developing and maintaining high-quality program activities
4. Your company sets a budget for conducting market research to determine customer requirements
5. Your company sets a budget to achieve good design, without flaws
6. Your company sets a budget in order to bring production in line with specific quality specifications
7. Your company sets a budget to ensure high-quality products are delivered to customers
Appraisal costs (AC)
8. Your company calculates the costs to test and inspect the purchased raw materials
9. Your company determines costs for devices and equipment used in quality inspection
10. Your company calculates costs for testing by laboratory staff to assess the quality of raw materials purchased
11. Your company calculates costs for energy consumption such as electricity or the cost of tools and equipment used in plant maintenance
12. Your company calculates costs for Supervision of the inspection staff
Internal Failure costs (IFC)
13. Your company determines the net costs of process scrap
Page 37 of 41 The TQM Journal
123456789101112131415161718192021222324252627282930313233343536373839404142434445464748495051525354555657585960

The TQM Journal
14. Your company determines the costs of replacing and repairing defective products before delivering them to customers
15. Your company determines the costs of materials and stationery that cannot be repaired or sold
16. Your company calculates costs for the extra work that employees spend on correcting all quality problems
17. Your company calculates costs for re-inspecting the rechecked work
External Failure costs (EFC)
18. Your company determines costs for failed products that are replaced for customers
19. Your company calculates costs to compensate customers for damages or losses from poor products
20. Your company determines costs in case the company's future sales decline due to poor reputation
21. Your company determines cost of field servicing and handling complaints are evaluated, recorded and reported
22. Your company determines cost of warranty repairs
Section 3: Please show your level of agreement on the following statements. Please place a tick under the suitable choice:
Page 38 of 41The TQM Journal
123456789101112131415161718192021222324252627282930313233343536373839404142434445464748495051525354555657585960

The TQM Journal
NO. Statement
Not
at a
ll
To a
slig
ht d
egre
e
To a
mod
erat
e de
gree
To a
gre
at e
xten
t
To a
ver
y gr
eat
exte
nt
Financial performance perspective
1. Your company determines revenue earned by comparing it with how good the company executes its operations successfully
2. Your company analyzes the organizational success by measuring profitability
3. Your company analyzes the organizational success through sales growth
4. Your company analyzes the organizational success by market share
5. Your company analyzes the organizational success by return on total assets
Customer performance perspective
6. The company's current activities reflect a strong focus on customer's satisfaction
7. The company's current activities reflect a strong focus on customer's value
8. The company's current activities reflect a strong focus on developing innovative products tailored to customer needs
Page 39 of 41 The TQM Journal
123456789101112131415161718192021222324252627282930313233343536373839404142434445464748495051525354555657585960

The TQM Journal
9. The company's current activities reflect a strong focus on the Brand awareness
10. The company's current activities reflect a strong focus on the Market share (such as, growing market share in a certain segment or country)
Internal business performance perspective
11. Your company focuses on innovation with unique products
12. Your company focuses on adding value to operations in order to provide better service
13. Your company focuses on Process improvements (for example, streamlining an internal approval process)
14. Your company focuses on Quality optimization
15. Your company focuses on Capacity utilization using technology to boost efficiency
Learning and growth performance perspective
16. Your company focuses on developing the employees’ skills
17. Your company focuses on employee's satisfaction
18. Your company focuses on improving employees’ loyalty
Page 40 of 41The TQM Journal
123456789101112131415161718192021222324252627282930313233343536373839404142434445464748495051525354555657585960

The TQM Journal
19. Your company focuses on teamwork and knowledge management
20. Your company focuses on databases, data protection systems
Section 4: Please use the text box below to add any further data or comments you would like to share with us.…………………………………………………………………………………………………………………………………………………………………………………………………………………………………………………………………………………….
Page 41 of 41 The TQM Journal
123456789101112131415161718192021222324252627282930313233343536373839404142434445464748495051525354555657585960