Embed Size (px)
Citation preview

THE TRANSIT AFFORDABILITYCRISIS
Can Help Low-Income New Yorkers Move Ahead
April 2016
How Reduced MTA Fares

The Riders Alliance is a membership organization of
subway and bus riders in New York, dedicated to winning
better transit by organizing transit riders into a powerful
political constituency.
www.cssny.org
www.ridersny.org
The Community Service Society of New York (CSS)
is an informed, independent, and unwavering voice for
positive action representing low-income New Yorkers. CSS
addresses the root causes of economic disparity through
research, advocacy, and innovative program models that
strengthen and benefit all New Yorkers.
About the Authors
Harold Stolper, principal author, is the Senior Labor Economist
at the Community Service Society, where he conducts research
and advocacy to raise awareness about the economic hardships
facing low-income New Yorkers. He is also an adjunct professor
at Columbia University’s School of International and Public
Affairs (SIPA), where he teaches quantitative methods for
policy analysis. Harold has a PhD in economics from Columbia
University, and a Master of Public of Administration from SIPA.
Acknowledgments
We would like to gratefully acknowledge the following
individuals for providing valuable input that has helped shape
the substance of this report: Charles Komanoff of the Carbon
Tax Center, Gene Russianoff and Cate Contino Cowit of the
Straphangers Campaign, and Veronica Vanterpool of the
Tri-State Transportation Campaign. We would also like to thank
CSS Board Member Mark E. Lieberman for posing the idea of
reduced fares that led us to embark on this research.
Copyright © 2016 by the Community Service Society of New York. All rights reserved
Images on pg. 24 & 25 by Daniel Schwen, Y.Sawa, Piotr Zarobkiewicz
Design and Photography by Jeff Jones except:
Image on pg. 2 by Angel Franco/The New York Times/Redux
Images on pg. 7 and 15 by Nick Sifuentes/Riders Alliance
Nancy Rankin is Vice President for Policy Research and
Advocacy for CSS, where she leads the work on labor, housing,
youth, and income inequality. She is the founder of the
Unheard Third survey and has written and spoken widely on
issues affecting upward mobility of low-wage workers and the
challenges of meeting work and family responsibilities. Nancy
Rankin is a graduate of Cornell and Princeton.

1www.cssny.org
The Transit Affordability Crisis:How Reduced MTA Fares Can Help Low-Income New Yorkers Move Ahead
Summary
INSIDE THIS REPORT
Low-income New Yorkers rely heavily on public transit.
Low-income New Yorkers struggle to pay for public transit, which limits their ability to get medical care and look for or take jobs further from where they live.
An estimated 800,000 riders would be eligible for a half-price fare for poor New Yorkers, saving those who opt to participate up to $700 per year.
Regional transit subsidies are not reaching the neediest families.
Other cities are already offering discounted fares to low-income residents.
Finding 1:
Finding 2:
Finding 5:
Finding 3:
Finding 4:
Technical Appendix

2 The Transit Affordability Crisis
As a part-time student at New York City College of Technology, 22-year-old Darius Jones had limited financial aid and could not afford the tuition on his own. He was forced to drop out of school only six courses short of his Associate’s degree. After unsuccessfully applying for technology-related jobs, he learned of a free computer training program and enrolled last year.
Mr. Jones started to feel more optimistic about his future but still couldn’t afford a MetroCard to get to and from class. So he walked to class, more than an hour each way from his apartment in West Harlem to 138th Street in the Bronx. For about six weeks in November and December, he made the round-trip trek of more than five miles.
After getting caught in the rain one day and showing up in class soaking wet, Mr. Jones was referred to the Community Service Society (CSS), one of the agencies supported by The New York Times Neediest Cases Fund. CSS used $224 from that fund to give him monthly MetroCards to get to class in January and February.1 Mr. Jones went on to graduate from the program with two certifications he hopes will lead to a full-time job as a computer technician.
The experience of Darius Jones, and
many others like him across the city,
highlights the stark reality that the
price of a monthly MetroCard has
become out of reach to many New
Yorkers struggling to get ahead.
Public transit is intended to provide
the infrastructure that enables
individuals of all incomes to access
the wealth of economic opportunities
available throughout New York
City and secure a better future for
themselves and their families. But as
incomes for all but the highest earners
stagnate and subway and bus fares
continue to climb, the promise of
public transit as the great connector—
between workers and jobs, students
and schools, patients and doctors—
must be renewed with a greater public
commitment to ensuring transit
fares remain affordable for the most
economically disadvantaged families.
For New York’s more than 300,000
working poor, transit expenses often
exceed over 10 percent of their family
budgets, limiting their ability to
access jobs and forcing them to forgo
other necessities. Data from the 2015
Unheard Third, our annual public
opinion survey conducted with Lake
Research to elevate the concerns of
low-income New Yorkers, reveals
that the prohibitively high cost of
subway and bus fares keeps many
New Yorkers—especially low-income
blacks and Latinos—from getting
medical care or taking a job further
from home.
He walked to class, more than an hour each way.

3www.cssny.org
The idea of subsidizing transit for
certain groups is nothing new. The
MTA already offers half-price fares to
seniors and people with disabilities.
And the current fare structure of
bonuses and unlimited rides provides
the deepest discounts to those who
can afford to lay out enough money
in advance to purchase monthly
passes. The city also requires many
employers to offer their employees
a tax deduction for qualified
commuting expenses, including transit
and parking, which provides tax
savings to predominantly middle- and
upper-income families. Despite a well-
established precedent of subsidizing
transit, none of the existing transit
subsidies are well-targeted to low-
income families. Shouldn’t we also
offer discounts to those who need it
most?
Most New Yorkers agree: according
to the 2014 Unheard Third, more
than two out of three New Yorkers
support half-price fares for low-wage
workers. And among the communities
that would be impacted by a reduced
fare program, there is significant
grassroots support for the concept:
the Riders Alliance, which has been
organizing riders in low-income
communities, has identified a reduced
fare program as a priority issue for its
membership.
This report documents the transit
affordability hardship that low-
income families must overcome to
make their daily commutes to work
and higher education. It also describes
how other large cities—including
Seattle, San Francisco, and London—
have eased the burden on low-income
families through fare discount
programs, and introduces a similar
fare discount proposal for low-
income subway and bus riders on the
MTA. A half-fare discount program
targeted to poor New Yorkers would
save those who take advantage of it
as much as $700 a year off the cost
of 12 monthly passes. An estimated
800,000 adults would be eligible
for the reduced fares, if we exclude
seniors and persons with disabilities
already covered by existing half-
fare discounts. Assuming a take-up
rate among regular subway and bus
users comparable to that for benefits
like food stamps, we estimate that
361,000 riders would participate at a
cost of $194 million a year in forgone
MTA revenues. Several possible
sources of additional revenue for
the MTA are suggested to offset lost
revenue in order to avoid the need to
raise fares for other riders to cover
the cost of the discounts.
For New York’s more than 300,000 working poor, transit expenses often exceed over 10 percent of their family budgets, limiting their ability to access jobs and forcing them to forgo other necessities.

4 The Transit Affordability Crisis
Low-income New Yorkers rely heavily on public transit.
1

5www.cssny.org
You get discouraged when you think, I don’t have enough money to get to work.
“
”- Leatrice S.

6 The Transit Affordability Crisis
Poor New Yorkers are the most transit
dependent, with 58 percent relying
on subways and buses to get around
the city, and only 15 percent relying
on private automobiles. The numbers
from the 2015 Unheard Third survey
are echoed in the 2014 American
Community Survey, which also
highlights the fact that low-income
individuals in New York are uniquely
transit-dependent compared to the rest
of the nation: for individuals living
in families below the poverty level,
only 30 percent living in New York
City have access to a vehicle at home,
compared to 72 percent in the rest of
the state and 83 percent in the rest
of the nation.2,3 Because low-income
New Yorkers are the most transit
dependent, they are often the hardest
hit when fares go up because they have
fewer alternatives to public transit.
Low-income New Yorkers overwhelmingly rely on public transit, and most do not have the option of automobile travel as in the rest of the country.
Which of the following do you typically use to commute to work/get around?
58% 56%
43% 44%
15%
21%
36% 36%
Poor (≤100% FPL) Near Poor (100% - 200% FPL)
Moderate Income(200% - 400% FPL)
Higher Income(≥400% FPL)
SUBWAY OR BUS YOUR CAR
Because low-income New Yorkers are the most transit dependent, they are often the hardest hit when fares go up.
Q:

7www.cssny.org
Riders Alliance member Manny A. is a 49-year-old immigrant who moved to Queens at the age of 14. His childhood wasn’t easy. “I raised myself,” he says. As an adult, he’s managed to make a living as a contract worker and manual laborer. In his free time, Manny has volunteered at soup kitchens—but he’s no stranger to poverty himself. Even when employed, he has struggled to afford basic necessities like a MetroCard.
Recently, Manny was laid off from his job. Now, finding ways to ride the subway is even harder. While looking for work, Manny sometimes has to “decide either to buy a MetroCard or spend on food or rent.” To get to work or job interviews, he has to find elaborate ways to get onto the subway or bus, including asking police officers or station agents to let him through—though often they refuse or simply aren’t around.
While there are limited numbers of pay-per-ride MetroCards available through government or nonprofit services, he finds the process challenging, saying, “You have to go through hurdles to get social services”—and when your first priority is a job, it’s hard to both look for work and apply for help as well.
Now, Manny relies on help from riders with unlimited MetroCards—an unfortunate turnaround for someone who, when he was working regularly, would use his MetroCard to swipe less fortunate subway riders into stations. “It’s hard for me,” said Manny, “the pride part. I don’t like asking—no one should have to ask.”
Manny joined the Riders Alliance to fight for reduced fares for low-income New Yorkers. “Lots of people in the neighborhood are getting arrested for hopping the turnstile,” he says. “They need this.” Tired of seeing people arrested or simply unable to ride the subway at all, Manny says he got involved in the campaign for reduced fares for low-income riders “for all people who need this, not just me.”
How do you get to a job interview when you can’t afford a swipe?

8 The Transit Affordability Crisis
Low-income New Yorkers struggle to pay for public transit.
2

9www.cssny.org
I was coming home from my third job interview and I had just used my last fare.
I just didn’t have enough to buy more.
“
”- Christine M.

10 The Transit Affordability Crisis
Twenty-nine percent of low-income,
working-age New Yorkers report that
the biggest problem with New York
City subways is that the fares are too
expensive. While service-related issues
such as delays, crowding, and lack of
service are still common complaints,
affordability is viewed as the biggest
problem among low-income riders.
The current full-price, pay-per-ride fare
on MTA subways and (non-express)
buses is $2.75, with unlimited monthly
passes available for $116.50, and
unlimited 7-day passes priced at $31.
Fare increases are scheduled for 2017
and 2019. Half-price fares ($1.35
per trip) and passes are available
for seniors and individuals with a
qualifying disability, regardless of
income. The New York City Department
of Education also distributes free,
limited-use MetroCards to K-12
students at the beginning of each term.
CURRENT FARE COST
These transit fares place a heavy burden on the budget of low-income New Yorkers, especially for those with limited savings.
29%
21%
19%
12%
7%6%
4%
2%
DIRT
Y ST
ATIO
NS
AND
CARS
DON’
T KN
OW
OTHE
R
OUTD
ATED
EQ
UIPM
ENT
INFR
EQUE
NT O
R LA
CK O
F SE
RVIC
E
TOO
CROW
DED
TOO
MAN
Y DE
LAYS
FARE
S TO
O EX
PENS
IVE
Unless otherwise noted, all charts are based on data from CSS’s 2015 Unheard Third survey, with findings presented for adult respondents under 65. Seniors were excluded because they are already eligible for half-price MTA fares. Income categories are based on annual poverty guidelines from the U.S. Department of Health and Human Services. Families who reported having $100 or less in savings are designated as low-savings.
[Low-income New Yorkers] Which of the following do you think is the biggest problem with subways in New York City?Q:

11www.cssny.org
More than a quarter of poor, working-
age New Yorkers were often unable
to afford subway and bus fares during
the past year. This hardship is even
more pronounced for those who are
living paycheck to paycheck; four out
of ten poor, working-age New Yorkers
with less than $100 in savings said
they had difficulty affording transit
fares.4 While the MTA offers reduced
fares to seniors and individuals with
a qualifying disability (regardless
of income), these fare discounts are
not available to many of the neediest
individuals.
28%
25%
16%
0%
Often unable to afford subway/bus fare
POOR (≤100% FPL)
POOR AND LOW SAVINGS (≤100% FPL, ≤$100)
MODERATE INCOME (200% - 400% FPL)
NEAR POOR (100% - 200% FPL)
POOR AND HIGHER SAVINGS (≥100% FPL, ≥$100)
HIGHER INCOME (≥400% FPL)
Often unable to afford subway/bus fare
40%
22%
Four out of ten poor, working-age New Yorkers with less than $100 in savings said they had difficulty affording transit fares.
In the last year, have you or any member of your household often been unable to afford subway and bus fares?Q:

12 The Transit Affordability Crisis
10%
5%
2% 1%
Share of income to cover monthly pass
POOR (≤100% FPL) MODERATE INCOME (200% - 400% FPL)
NEAR POOR (100% - 200% FPL) HIGHER INCOME (≥400% FPL)
Share of household income needed to cover a 30-day unlimited MetroCard
The annual cost of purchasing 30-
day unlimited MetroCards comes to
almost $1,400, or almost 12 percent
of the annual income for a single
earner at the federal poverty level.
The share of income needed to cover
a year’s worth of 30-day unlimited
MetroCards varies with household
income among Unheard Third survey
respondents under the age of 65,
ranging from more than 10 percent
for families below the poverty level
to less than one percent for families
above 400 percent of the federal
poverty level.5 At more than 10
percent of family income, the cost of
MetroCards to cover regular travel on
the MTA for poor families—especially
those without a savings cushion—is
so burdensome that many of the
most vulnerable families must choose
between spending on basic necessities
or important trips that connect them
to the workforce and social supports.
Many of the most vulnerable families must choose between spending on basic necessities or important trips.

13www.cssny.org
One out of four low-income, working-
age New Yorkers reported that the
cost of subway or bus fares prevented
them from doing important things
such as getting medical care, compared
to only two percent of higher-income
New Yorkers. Similarly, more than
one out of three low-income, working-
age New Yorkers said that transit
fares prevented them from searching
for or taking a job further from
where they live, compared to seven
percent of higher-income individuals.
Among unemployed Unheard Third
respondents, 27 percent reported that
the cost of transit fares prevented them
from looking for taking a job further
away from their home.
The inability of lower-income families
and unemployed individuals to
search for and take jobs further from
their homes means high transit fares
are limiting earnings and upward
mobility for the most economically
disadvantaged families. The link
between accessibility and upward
mobility is also highlighted in a recent
study by economists Raj Chetty and
Nathan Hendren, which finds that
lifetime earnings are higher for below-
median income families when they are
in areas with lower commute times.6
The burden of transit fares limits low-income New Yorkers’ ability to get medical care and look for or take jobs further from where they live.
25%
34%
10%
20%
2%
7%
Unable to do important things like getting medical care
Unable to look for or take a job
LOW INCOME (≤200% FPL)
LOW INCOME (≤200% FPL)
MODERATE INCOME (200% - 400% FPL)
MODERATE INCOME (200% - 400% FPL)
HIGHER INCOME (≥400% FPL)
HIGHER INCOME (≥400% FPL)
How frequently has the cost of subway or bus fares prevented you from doing important things like getting medical care?
Do you agree or disagree with the following statement: I have not been able to look for or take a job further away from where I live because of the cost of subway or bus fares.
Q:
Q:

14 The Transit Affordability Crisis
Among low-income, working-age
individuals, Latinos are more than
five times as likely as whites to report
that transit fares prevented them from
carrying out important responsibilities
such as getting medical care, and
almost twice as likely to report being
unable to look for or take a job in a
more distant area. Thus the cost of
transit is compounding the difficulties
that blacks and Latinos already face in
the New York City job market, with
black and Latino unemployment rates
of 8.3 and 7.1 percent, respectively,
compared to only 3.2 percent among
whites.7 This problem is particularly
pronounced in areas of the Bronx and
Queens with large concentrations of
low-income Latinos, where transit fare
burdens can reinforce the economic
and geographic isolation of some of
the most economically disadvantaged
families.
Among low-income residents, Latinos and blacks are much more likely to report that the cost of transit limits their ability to carry out important responsibilities such as looking for and taking a job.
6%
26%
35%
Unable to do important things like getting medical care
WHITE BLACK LATIN0
[Low-income New Yorkers] How frequently has the cost of subway or bus fares prevented you from doing important things like getting medical care?
Q:
24%
31%
43%
Unable to look for or take a job further away from home
[Low-income New Yorkers] Do you agree or disagree with the following statement: I have not been able to look for or take a job further away from where I live because of the cost of subway or bus fares.
Q:
% responding “very often” or “sometimes”
WHITE BLACK LATIN0
% responding “very often” or “sometimes”
The cost of transit is compounding the difficulties that blacks and Latinos already face.
15www.cssny.org
Leslie W. is a 44-year-old substitute teacher and Riders Alliance member from Central Harlem. She joined the fight for reduced fares for low-income riders because she wants to see working people succeed. To her, the rising cost of transit “feels like an attack” on the poor, who have to balance a family, rent, and living their lives.
Leslie describes herself as a “working class poor person.” On a $17,000 a year salary, she can barely make ends meet to support her 14-year-old son. The rising cost of a MetroCard, which is a “big chunk” of her salary, forces Leslie to make tough decisions. For instance, there are times when she saves money on transit for the two of them by having her son slide under the turnstile. “I’m not proud of this,” she admits.
She’s also had to choose between a MetroCard and taking a job: “When I don’t have the fare, I don’t go to work.” That means Leslie loses out on the $138 she gets when she teaches a class. Even though she lives with her mother to help make ends meet, she sometimes has to ask her for help paying the subway fare, which she finds embarrassing. Other times she takes the bus because she can rely on the “kindness of drivers” to let her get on without a fare. To make matters worse, Leslie is trying to advance her career, but often has to forgo her Spanish classes because she can’t afford both the cost of the class and the MetroCard—she just doesn’t have the money.
Leslie wishes she didn’t have to “calculate everything” before leaving the apartment; “It really affects my quality of life,” she says. She wants to see working people have assistance with their MetroCards, because without assistance, she knows that “the hidden message is that the working poor should not be living in New York City.”
Choosing between a MetroCard and taking a job.

16 The Transit Affordability Crisis
Regional transit subsidies are not reaching the neediest families.
3

17www.cssny.org
It’s hard to afford two MetroCards for me and my child. I have to hop the turnstile or
ask a person to swipe me through.
“
”- Kathleen A.

18 The Transit Affordability Crisis
Low-income, low-savings families are
the least likely to purchase 30-day
passes and the most likely to purchase
undiscounted single fares and borrow
swipes on somebody else’s MetroCard.
Because 30-day MetroCards generally
offer the lowest fare per trip compared
to the full single ride fare, the highest
average fares are typically borne by
riders in low-income, low-savings
families; it is these families that have
the hardest time coming up with the
upfront cash to pay for 30 days of
MTA travel in advance, or choose not
to because they are less willing to risk
the costs of replacing a lost or damaged
card, or changes in their job situation.
Among working-age individuals who
typically commute or travel by subway
or bus, low-income families with less
than $100 in savings are less than half
as likely to purchase a 30-day unlimited
MetroCard than moderate- and
higher-income families. On the other
hand, these low-income, low-savings
transit users are also twice as likely to
purchase full-price single ride fares.
They also report resorting to borrowing
a swipe almost five percent of the time,
compared to less than one percent for
moderate- and higher-income riders.
30-day unlimited
7-day unlimited
Fixed amount card
Single Fare
Borrow a Swipe
What kind of MetroCard do you buy most often?Q:
18%33%
38%
25%26%
11%
17%16%
27%
20%15%
10%
5%0%1%
LOW INCOME AND LOW SAVINGS (≤200% FPL, ≤$100)
LOW INCOME AND HIGHER SAVINGS (≤200% FPL, ≥$100)
MODERATE AND HIGHER INCOME (≥200%)
Among regular subway users, low-income New Yorkers—especially those with low savings—have difficulty paying up front for discounted monthly passes and are more likely to rely on full-price pay-per-ride fares and borrowed swipes.

19www.cssny.org
The availability of pre-tax commuter benefits allows most workers to deduct commuting expenses (such as transit fare) from their taxable income, but the benefit does not reach
many of the neediest individuals who do not earn enough to benefit from the tax deduction.
Starting in January 2016, a new city
law requires New York City companies
with 20 or more full-time employees
to offer pre-tax commuter benefits
to their workforce. As of January
1, 2016, the monthly allowance for
tax-deductible commuting expenses
includes $255 for transit and another
$255 for qualified parking. While the
tax deduction for monthly MetroCard
passes can save higher-income New
York City families over $600 per
year, the deduction is worth less to
lower-income families who face lower
tax rates. In fact, some families with
lower earnings who are eligible for
the Earned Income Tax Credit (EITC)
would actually be worse off if they
were to enroll in commuter benefits.8,9
The pre-tax commuter parking
benefit also yields higher tax savings
to relatively more affluent suburban
commuters who claim both the transit
and parking allowance (e.g., those who
drive to a commuter rail station). Most
of the neediest commuters, however,
do not own cars and benefit from the
parking deduction; they are also more
likely to live in New York City and
rely on the MTA, allowing them to
claim less than half of the $255 transit
allowance for monthly MetroCard
expenses.
The pre-tax commuter benefits
program offers considerable savings
to many middle- and upper-income
commuters. The cost to the state
of New York of a tax subsidy such
as this is the forgone state and city
income tax revenues. Between the
commuter benefit tax subsidy, half-
price MetroCards for the disabled and
elderly, and discounted monthly passes
that are not affordable to low-income
families, substantial public resources
are being used to subsidize transit fares
without reaching the majority of low-
income families.

20 The Transit Affordability Crisis
Other cities are already offering discounted fares to low-income
residents.
4

21www.cssny.org
$2.75 adds up very quickly. I’ve had to put off paying my phone bill to afford a MetroCard.
“
”- Abraham T.

22 The Transit Affordability Crisis
CITY/PROGRAM ELIGIBILITY DISCOUNT
San Francisco Low Income
Lifeline Pass and Free Muni
London Jobcentre Plus Travel Discount
Below 200% of the Federal Poverty Line.
(King County Metro, Sound Transit, Kitsap Transit)
(San Francisco Municipal Transportation Agency)
(Transport for London)
Lifeline: Below 200% of the Federal Poverty Line.
Free Muni: Below area median income for people with disabilities, seniors, and youth.
Unemployed for 3–12 months.
Roughly half-price discounts on the peak fare (discounts differ depending on zones) for travel by bus, light rail, commuter rail, streetcar and water taxi.
Lifeline: Half-price monthly pass for Muni bus and streetcar.
Free Muni: Free for Muni bus and streetcar.
Half-price pay-as-you go fares and child-rate passes on all Transport for London modes (bus, subway, tram, light and heavy rail, water taxi).
Seattle ORCA LIFT
Other cities have instituted a variety of fare discount programs to ease the burden that public transit fares place on low-income residents.

23www.cssny.org
ADMINISTRATION FUNDING AND COST IMPACT
King County Metro partners with local public health departments and nonprofits for outreach and income verification. Once eligibility has been verified, individuals receive a reduced fare card that they can load money onto for discounted pay-per-ride travel or purchase discounted unlimited passes.
Eligibility verification and administration through the city’s Human Services Agency, which issues ID cards and stickers.
Application and eligibility review through the government agency Jobcentre Plus. Once registered, riders can purchase discounted Oyster Cards for travel throughout the system.
Accompanied by a 25¢ increase from general ridership and 50¢ for paratransit.
There was a projected annual revenue loss of up to $4.75m and annual administrative costs of $3–4m.
Lifeline: paid for by the transit authority.
Free Muni: originally funded by a $3m donation from Google.
£25 million a year (roughly $38 million).
Eight months into the program, more than 20,000 individuals had registered for low-income passes, accounting for over 370,000 boardings; this implies a take-up rate of approximately 20% of eligible individuals who regularly ride King County Metro Transit.
Roughly 19,500 Lifeline passes are sold every month, covering approximately 80% of eligible SF residents who regularly use public transit.
Limited use of program by eligible riders, possibly due to lack of advertising and information.12
San Francisco introduced its low-income (Lifeline) pass program in 2005, with a range of discounts for low-income and unemployed riders. Other cities, such as Charleston, Madison, Seattle, and London, have followed suit, and support for discounted fares for low-income riders is also growing in Boston and Denver.10 Most large transit systems also offer discounted fares for youth, seniors, and riders with disabilities. The table below summarizes some of the key features of selected income- or unemployment-based discount programs that are currently in place in three of the larger cities.11

24 The Transit Affordability Crisis
An estimated 800,000 riders would be eligible for a half-price fare for poor
New Yorkers, saving those who opt to participate up to $700 per year.
5

25www.cssny.org
I don’t have money for the train. But if you jump the turnstile or ask somebody to
swipe you, they take you to jail. I don’t want to go that route.
“
”- Victor H.
26 The Transit Affordability Crisis
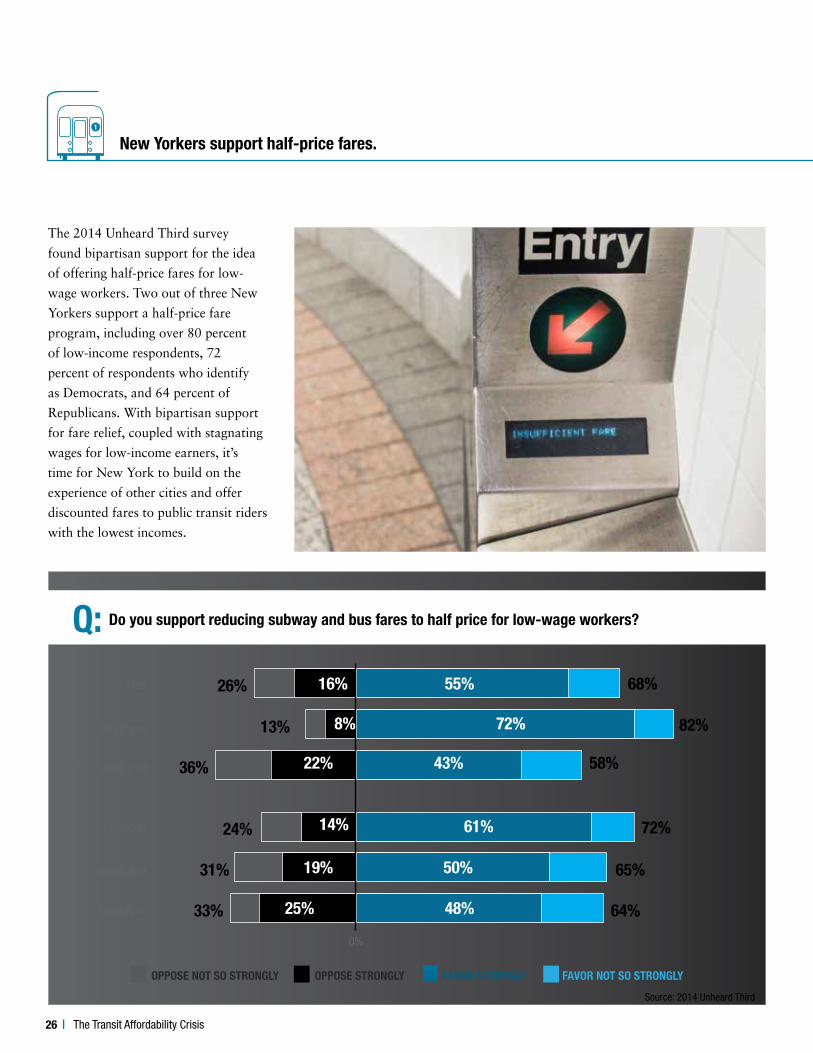
New Yorkers support half-price fares.
The 2014 Unheard Third survey
found bipartisan support for the idea
of offering half-price fares for low-
wage workers. Two out of three New
Yorkers support a half-price fare
program, including over 80 percent
of low-income respondents, 72
percent of respondents who identify
as Democrats, and 64 percent of
Republicans. With bipartisan support
for fare relief, coupled with stagnating
wages for low-income earners, it’s
time for New York to build on the
experience of other cities and offer
discounted fares to public transit riders
with the lowest incomes.
Total
Democrat
Mod-high income
Republican
Low income
Independent
0%
Do you support reducing subway and bus fares to half price for low-wage workers?Q:
FAVOR STRONGLY FAVOR NOT SO STRONGLYOPPOSE NOT SO STRONGLY OPPOSE STRONGLY
26%
36%
33%
31%
82%
24%
68%
58%
72%
65%
64%
13%
50%
48%
16%
22%
19%
25%
14%
55%
72%
43%
61%
8%
Source: 2014 Unheard Third

27www.cssny.org
What should the income eligibility
criteria be for reduced fares on the
MTA? Where the income limit is
set largely determines how many
individuals the fare discount will
reach and how much it will cost in
foregone fare revenue. In making
the determination we considered
four factors: empirical data on which
income groups reported significant
hardships paying for fares now; the
total projected cost and judgments
about what would be politically
feasible; trade-offs between helping a
broader group with smaller discounts
versus targeting more meaningful
discounts to those most in need; and
the ease of administering the program
and communicating who qualifies by
linking eligibility to another well-
known program, such as food stamps.
Based on the Unheard Third findings,
a case could be made for setting the
eligibility threshold at 200 percent of
the federal poverty level, similar to the
Seattle area discount fare program.
A quarter of New York City’s near-
poor (in households between poverty
and twice the poverty level) reported
frequently being unable to afford
bus and subway fares compared to
28 percent of those living below
poverty. On the other hand, a program
initially targeted to the poor would be
significantly less expensive.
The technical appendix includes
estimates for the projected net cost of
alternative eligibility thresholds set at
100 percent of poverty, 130 percent of
poverty, and 200 percent of poverty.
But for purposes here, we focus on
the simple case of half-price fares on
the subway and all non-express MTA
buses for adults in families earning
below the federal poverty level. Since
the MTA already offers half-fare
discounts for seniors and individuals
with disabilities as well as student
passes, the analysis focuses on city
residents not already eligible for those
discounts. In the following pages, we
describe the details of the proposed
policy and initial estimates of the
revenue implications.
Source: 2014 Unheard Third

28 The Transit Affordability Crisis
A PROPOSAL FOR HALF-PRICE FARES FOR POOR NEW YORKERSDiscount
Administration and Implementation
Eligibility
Single rides at $1.35 (no 11 percent bonus) and unlimited MetroCards offered at
half price, for travel on the subway and all MTA buses (New York City Transit and
the MTA Bus Company), excluding express buses.
All city residents who are between the ages of 18 and 64 in families with incomes
below the federal poverty level (FPL). As with many other public benefits
administered by the New York City Human Resources Administration (HRA), it is
assumed that you would not have to be a citizen or legal permanent resident to be
eligible for discounted fares. Estimates from the 2014 American Community Survey
place the number of non-disabled, non-elderly adults that would be newly eligible
for discounted fares at just under 808,000. (For comparison, an income threshold
of 130 percent of FPL, as under the HRA-administered Supplemental Nutrition
Assistance Program, would cover 1.08 million newly eligible individuals. Raising
the threshold to 200 percent of FPL would cover almost 1.7 million.)
While MTA and city and state officials are best positioned to determine the most
cost-effective way to implement the discount program, one way to minimize
administrative costs would be to rely on existing public sector infrastructure (at
HRA, for example) to certify applicant income and verify eligibility. Once eligibility
has been verified, reduced-fare MetroCards could be sold directly to participants by
the MTA. As an alternative, reduced-fare MetroCards could be purchased from the
MTA by the city or state and then re-sold to program participants.
How many people could benefit from half-price fares in NYC?
807,933
100% of Poverty LevelDepending on the
eligibility criteria, over
one-and-half million
low-income New
Yorkers could access a
discounted fare program.

29www.cssny.org
Revenue Implications
Regardless of the specifics of program implementation, the costs of the program will
largely be determined by the loss in revenue from MetroCard sales on MTA trips that
are currently taken at full fare but would be discounted under the proposed program.
In any implementation scenario, we would propose that state and city funding sources
be used to cover the costs of the discount program, so that the program does not drive
up fares for remaining riders. A portion of these costs would be offset by the fact that
lower fares would induce eligible riders to take additional trips that generate additional
revenue.
Based on recent travel survey data of New York City residents, and conservative
assumptions about fare discount program take-up rates, the cost of subsidizing
MetroCards in the proposed program would be roughly $115 million during the first
year of the program, and $194 million during year two (at full take-up). These estimates
should be viewed as a very preliminary projection of forgone MTA revenues (not
including any additional administrative costs to implement the program), since they are
highly sensitive to the details of how a fare discount program is implemented and how
individuals will respond over time (see Technical Appendix for a detailed explanation
of these calculations).13 Our baseline scenario assumes a take-up rate among regular
subway and bus users comparable to that for benefits like food stamps.
A potential funding offset exists in the form of roughly $48 million that HRA is already
spending annually to fund MetroCards for low-income individuals who participate in
job training or educational programs, and for qualified trips for medical appointments
covered by Medicaid. Because most of these individuals would be newly eligible for
discounted fares, fare discount costs could be partially offset by HRA cost savings
resulting from fewer MetroCard purchases for free distribution. Program costs may
also be partially offset by decreases in fare evasion, as some riders may no longer risk
turnstile-hopping or asking strangers for MetroCard swipes when faced with lower
fares.
1,081,437 1,674,417
130% of Poverty Level 200% of Poverty Level
Population Elilgible for Half-Price Fare

30 The Transit Affordability Crisis
FUNDING OPTIONS FOR COVERING THE COST OF DISCOUNTED FARES
Given the ongoing stalemate about how
to fund the capital needs of the MTA,
it is critical to avoid placing further
demands on an operating budget that
is already under heavy strain from
interest payments on outstanding
debt for capital improvements.14 It is
thus our view that the cost of the fare
discount program should be covered
by funding sources that are external
to the MTA. To the extent possible,
this funding should be generated by
progressive taxes or fees, so the impact
of any fare discount would not be offset
by an increased tax burden on the same
poor individuals receiving the discount.
These taxes and fees can also be used
to encourage behavior that reduces
congestion and emissions that worsen
climate change and air quality.
Once most eligible riders have had
time to take up the fare discount,
and administrative costs are added
to the roughly $194 million to cover
subsidized MetroCards, the cost of
the proposed fare discount program
is likely to exceed $200 million on
an annual basis. These costs could
be covered by allocating additional
funding from New York City’s growing
general tax revenues or from new
revenue sources that have been under
discussion as part of other policy
proposals:
• The millionaire’s tax: extending the
current “millionaire’s” tax could
generate billions of dollars to fund
numerous public programs such as
a fare discount. If the millionaire’s
tax is not extended beyond 2017,
and the current top rates revert to
2008 law, NYS will lose more than
$3.7 billion in tax revenues now
paid by the top 1 percent.19
• Fairer tolling: by implementing a
fairer citywide tolling system such
as the one called for in the Move
NY Fair Plan—reducing tolls
where they are too high and raising
them in areas with high traffic and
good transit access—substantial
revenue can be generated to fund
road and bridge improvements,
maintain and improve the regional
transit network, and cover the cost
of reduced transit fares for the
neediest riders, among other uses.
• Allocating funds from the city
budget: City Fund revenues
reached a record $58.1 billion in
fiscal year 2015, more than $3.3
billion above the city’s forecast at
the beginning of the year.15 A $200
million annual commitment from
the city could be covered by less
than 0.4 percent of the City Fund.
Moreover, state law explicitly
allows for reduced fares for a class
of users upon the written request
of the mayor and an agreement for
the city to make up the lost revenue
and associated administrative
costs.16
• Increasing the statewide gasoline
tax to fund a fare discount
program and other transportation
needs outside of New York City:
a statewide increase of 5 cents
in the sales tax on motor fuel
could generate as much as $310
million annually to fund the
fare discount program as well
as capital investments in bridges
and roads throughout the state.17
Raising the gas tax also has a
positive environmental impact
by discouraging driving and
encouraging more fuel efficient
vehicles, at a time when retail
motor gasoline prices in New York
State have fallen to their lowest
levels since 2004.18

31www.cssny.org
• Other new revenue streams:
a number of ideas have been
proposed as ways to generate
additional revenue to fund various
transportation related policy
proposals. Some of these might also
be used to help defray the costs of
a reduced fare program. Examples
include a range of fees and taxes on
vehicles such as increasing vehicle
registration fees, and harmonizing
surcharges and taxes on taxis,
black cars, and app-dispatch
services like Uber and Lyft.
Another group of tax proposals
focuses on the housing market,
such as expanding the tax on home
sales of $1 million or more, or a
tax on vacant luxury apartments.
SUMMARY
Despite a growing regional economy
that is adding more and more jobs
every month, incomes have been
stagnating for the bottom 98 percent
of the workforce, and another round
of fare hikes is scheduled by the
MTA in 2017. The financial burden
that MetroCard expenses put on the
already strained budgets of poor New
Yorkers is reaching critical levels,
to the point where public transit is
increasingly out of reach for many of
the most economically disadvantaged
New Yorkers.
Without affordable public transit
to connect poor New Yorkers to
gainful employment opportunities, the
prospects for achieving economic self-
sufficiency are lessened, and reliance
on costly public benefits becomes more
entrenched. Twenty-seven percent of
unemployed New Yorkers reported
that the cost of transit fares prevented
them looking for or taking a job
further away from their home. For
those receiving unemployment benefits
this makes their transition off of public
benefits that much more difficult.
The idea that local and regional
governments are well positioned to
help the poorest individuals commute
to work on public transit is not a
new one, as other U.S. cities and
London already offer discounted
transit fares for those with low
incomes. Moreover, the state and city
governments are already subsidizing
transit for relatively more affluent
commuters through pre-tax commuter
benefits. And the MTA offers a
fare structure that gives the deepest
discounts to those who can afford
to lay out more money in advance
to purchase monthly passes. If the
state and city can devote significant
resources to curb commuting costs
for more affluent families, it can also
devote commensurate resources to
help the poorest individuals commute
to work, and access medical care
and educational opportunities. The
turnstile should be the entry point—
not the barrier—to upward mobility.

32 The Transit Affordability Crisis
Technical Appendix: Fare Discount Cost Estimates
Step 1: Estimating the Number of Fare Discount Program Participants
Income-eligible pool: The eligible pool
of individuals includes all non-elderly,
non-disabled adults residing in New
York City between the ages of 18
and 64 and residing in families who
are below 100 percent of the federal
poverty level (or 130 percent, in the
alternative scenario). The size of this
population is estimated from the 2014
American Community Survey (ACS).
Take-up: Within the group of income-
eligible individuals, we assume that
take-up of the fare discount program
will be concentrated among regular
transit users, as more sporadic users
will not go through the trouble of
applying for discounted fare cards. In
the 2014 ACS, 58 percent of employed
individuals in the eligible population
report commuting by bus or subway.
In the absence of further data, it is
assumed that this transit dependence
rate also applies to individuals who are
not employed.
Fare discount take-up among regular
transit riders will depend heavily on
the design and implementation of the
program, especially outreach efforts.
For the sake of simplicity, here it is
assumed that take-up among regular
transit riders will grow at a constant
monthly rate before peaking at 77
percent at the end of the first 12
months; 77 percent is the average
take-up rate of Supplemental Nutrition
Assistance Program (SNAP) benefits
since 2010, according to figures
reported by the New York City
Human Resources Administration
(HRA). 20
Step 2: Estimating Revenue Impacts
The methodology utilizes the 2010–11
Regional Household Travel Survey
(RHTS) sponsored by the New York
Metropolitan Transportation Council
(NYMTC) and the North Jersey
Transportation Planning Authority.
RHTS is, to the best of our knowledge,
the only publicly available data with
sufficiently detailed information on
MTA trip behavior for low-income
individuals. The RHTS provides travel
diaries for almost 19,000 households,
including detailed trip information
on 1,696 NYC residents in families
earning less than $30,000.21
First, the number of linked NYCT
trips per person (free transfers and
express bus trips are excluded) among
income-eligible individuals in the
RHTS is calculated for two fare types:
cash trips (assumed to be made at the
full fare of $2.75), and pay-per-ride
(PPR) MetroCards (for simplicity,
assumed to be made with the 11
percent bonus provided on MetroCard
purchases of at least $5.50). Next, the
share of individuals with unlimited
MetroCards is estimated as the share
of individuals who used an unlimited
pass for all NYCT trips in the same
day; this is done to exclude individuals
who “borrowed a swipe” on
somebody else’s unlimited pass. Only
the most intensive NYCT riders (based
on daily trip total) are used for these
calculations, in order to ensure that
trip-taking behavior is representative
of the individuals who are likely to
take up the fare discount program.
For example, take-up among the 58
percent of eligible individuals that are
regular transit riders is assumed to
be 77 percent during year two of the
program, so trips per day are based
only on the top 45 percent of transit
riders (.77 x .58) in terms of daily
NYCT trips.
For each of these three revenue
streams (full fare cash trips, bonus fare
PPR MetroCard trips, and unlimited
passes), the revenue loss on existing
trips is estimated for each fare discount
scenario. For full-fare and bonus fare
trips, this is done by multiplying the
amount of the discount ($1.40) times
the take-up rate times the eligible
population times the number of trips
per day for each fare type times 365

33www.cssny.org
days. For unlimited passes, the lost
revenue is estimated by computing the
weighted average cost of an unlimited
pass in the RHTS for one year
(averaged over 7- and 30-day passes)
times the eligible population times the
share with unlimited passes multiplied
by one-half.
For the first two PPR revenue
streams, additional revenue from
new trips induced by lower fares is
also estimated. The key assumption
governing the number of new trips
(and revenue) induced by the proposed
fare discount program is the elasticity
of transit demand with respect to
the fare.22 This elasticity can vary
substantially across time, space, types
of individuals, and short-run versus
long-run estimates. Here we rely on
low- and high-elasticity scenarios of
-0.19 and -0.35, respectively, based on
a recent study of fare policy changes
in the Transport for London (TfL)
system.23 Induced travel is estimated
separately for cash trips and pay-
per-ride MetroCard trips, with each
new or additional trip assumed to
cost the discounted pay-per ride
fare (of $1.35) with no additional
MetroCard bonus (see box below).
The introduction of discounted pay-
per-ride MetroCards and unlimited
MetroCards will also impact
families’ decisions about which types
of MetroCards to purchase. It is
not immediately obvious, however,
whether this will lead to more or
less travel on unlimited MetroCards,
since the pay-per-ride fare is also
discounted. Given this uncertainty,
the estimates do not adjust for
any response to the fare discount
program in the share of travel made
with unlimited passes.
About The Unheard ThirdThe Unheard Third 2015 is based
on a scientific survey of 1,705 New
York City adults conducted for CSS
by Lake Research. Respondents
were reached by telephone using
land lines and cell phones. The
survey was fielded July 19 through
August 17, 2015. The margin of
error is +/- 3 percentage points for
the low-income sample of 1,052
respondents with incomes below
twice the federal poverty level.
For each pay-per-ride trip type, the number of additional trips used to compute the revenue change from induced travel is estimated by solving for the number of new number of trips based on the midpoints arc elasticity formula:
change in trips = elasticity of demand × change in fare
change in trips
change in fare
new trips � old trips
new fare � old fare
.5 (new trips + old trips)
.5 (new fare + old fare)
where =
=
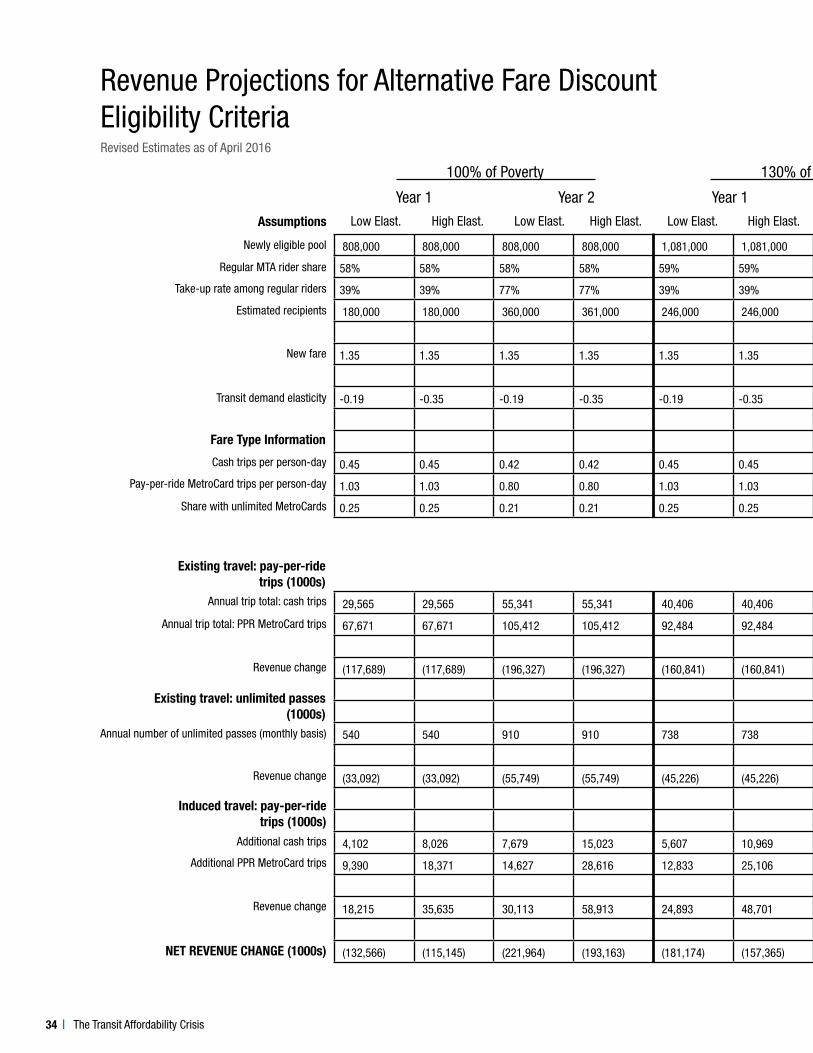
34 The Transit Affordability Crisis
Revenue Projections for Alternative Fare Discount Eligibility Criteria
100% of Poverty
Year 1
Low Elast. Low Elast.Low Elast.High Elast. High Elast.High Elast.
Newly eligible pool
Regular MTA rider share
Take-up rate among regular riders
Estimated recipients
New fare
Transit demand elasticity
Cash trips per person-day
Pay-per-ride MetroCard trips per person-day
Share with unlimited MetroCards
Annual trip total: cash trips
Annual trip total: PPR MetroCard trips
Revenue change
Revenue change
Annual number of unlimited passes (monthly basis)
Additional cash trips
Additional PPR MetroCard trips
Revenue change
NET REVENUE CHANGE (1000s)
Assumptions
Fare Type Information
Existing travel: pay-per-ride trips (1000s)
Existing travel: unlimited passes (1000s)
Induced travel: pay-per-ride trips (1000s)
Year 1Year 2
130% of Poverty
808,000 808,000 808,000 808,000 1,081,000 1,081,000 1,081,000 1,081,000 1,674,000 1,674,000 1,674,000 1,674,000
58% 58% 58% 58% 59% 59% 59% 59% 59% 59% 59% 59%
39% 39% 77% 77% 39% 39% 77% 77% 39% 39% 77% 77%
180,000 180,000 360,000 361,000 246,000 246,000 491,000 491,000 380,000 380,000 760,000 760,000
1.35 1.35 1.35 1.35 1.35 1.35 1.35 1.35 1.35 1.35 1.35 1.35
-0.19 -0.35 -0.19 -0.35 -0.19 -0.35 -0.19 -0.35 -0.19 -0.35 -0.19 -0.35
0.45 0.45 0.42 0.42 0.45 0.45 0.42 0.42 0.45 0.45 0.42 0.42
1.03 1.03 0.80 0.80 1.03 1.03 0.80 0.80 1.03 1.03 0.80 0.80
0.25 0.25 0.21 0.21 0.25 0.25 0.21 0.21 0.25 0.25 0.21 0.21
29,565 29,565 55,341 55,341 40,406 40,406 75,270 75,270 62,415 62,415 116,508 116,508
67,671 67,671 105,412 105,412 92,484 92,484 143,372 143,372 142,861 142,861 221,920 221,920
(117,689) (117,689) (196,327) (196,327) (160,841) (160,841) (267,027) (267,027) (248,454) (248,454) (413,321) (413,321)
540 540 910 910 738 738 1,237 1,237 1,140 1,140 1,915 1,915
(33,092) (33,092) (55,749) (55,749) (45,226) (45,226) (75,825) (75,825) (69,861) (69,861) (117,367) (117,367)
4,102 8,026 7,679 15,023 5,607 10,969 10,444 20,433 8,661 16,944 16,166 31,628
9,390 18,371 14,627 28,616 12,833 25,106 19,894 38,921 19,823 38,782 30,793 60,244
18,215 35,635 30,113 58,913 24,893 48,701 40,957 80,128 38,453 75,230 63,396 124,028
(132,566) (115,145) (221,964) (193,163) (181,174) (157,365) (301,895) (262,724) (279,862) (243,085) (467,292) (406,660)
Revised Estimates as of April 2016

35www.cssny.org
Low Elast.Low Elast. Low Elast.High Elast.High Elast. High Elast. Data Sources
2014 ACS
2014 ACS (employed indiv.)
Jain (2011) (London)
2010-11 RHTS
2010-11 RHTS
2010-11 RHTS
Year 1Year 2 Year 2
130% of Poverty 200% of Poverty
808,000 808,000 808,000 808,000 1,081,000 1,081,000 1,081,000 1,081,000 1,674,000 1,674,000 1,674,000 1,674,000
58% 58% 58% 58% 59% 59% 59% 59% 59% 59% 59% 59%
39% 39% 77% 77% 39% 39% 77% 77% 39% 39% 77% 77%
180,000 180,000 360,000 361,000 246,000 246,000 491,000 491,000 380,000 380,000 760,000 760,000
1.35 1.35 1.35 1.35 1.35 1.35 1.35 1.35 1.35 1.35 1.35 1.35
-0.19 -0.35 -0.19 -0.35 -0.19 -0.35 -0.19 -0.35 -0.19 -0.35 -0.19 -0.35
0.45 0.45 0.42 0.42 0.45 0.45 0.42 0.42 0.45 0.45 0.42 0.42
1.03 1.03 0.80 0.80 1.03 1.03 0.80 0.80 1.03 1.03 0.80 0.80
0.25 0.25 0.21 0.21 0.25 0.25 0.21 0.21 0.25 0.25 0.21 0.21
29,565 29,565 55,341 55,341 40,406 40,406 75,270 75,270 62,415 62,415 116,508 116,508
67,671 67,671 105,412 105,412 92,484 92,484 143,372 143,372 142,861 142,861 221,920 221,920
(117,689) (117,689) (196,327) (196,327) (160,841) (160,841) (267,027) (267,027) (248,454) (248,454) (413,321) (413,321)
540 540 910 910 738 738 1,237 1,237 1,140 1,140 1,915 1,915
(33,092) (33,092) (55,749) (55,749) (45,226) (45,226) (75,825) (75,825) (69,861) (69,861) (117,367) (117,367)
4,102 8,026 7,679 15,023 5,607 10,969 10,444 20,433 8,661 16,944 16,166 31,628
9,390 18,371 14,627 28,616 12,833 25,106 19,894 38,921 19,823 38,782 30,793 60,244
18,215 35,635 30,113 58,913 24,893 48,701 40,957 80,128 38,453 75,230 63,396 124,028
(132,566) (115,145) (221,964) (193,163) (181,174) (157,365) (301,895) (262,724) (279,862) (243,085) (467,292) (406,660)

36 The Transit Affordability Crisis
NOTES
1. The experience of Mr. Jones was documented in a New York Times article, “Walking Past Obstacles to Create a Steady Career Solving Computer Issue” that ran on December 13, 2015. 2. Data from the American Community Survey was accessed through the Integrated Public Use Microdata Series (IPUMS-USA, University of Minnesota, www.ipums.org).
3. Vehicle access is based on responses to the question of how many vehicles are kept at home for use by household members from the 2014 American Community Survey.
4. More than 45 percent of Unheard Third respondents who are below the poverty line also report having less than $100 in savings.
5. Unheard Third respondents report which predetermined income range they fall into in order to determine their poverty status. Income share calculations impute household income as the midpoint of each income bracket, or 1.5 times the lower bound of the highest bracket.
6. Chetty, R., & Hendren, N. (2015). The Impacts of Neighborhoods on Intergenerational Mobility: Childhood Exposure Effects and County-Level Estimates. Working Paper, May 2015, http://www.equality-of-opportunity.org/images/nbhds_paper.pdf (accessed May 5, 2015).
7. These unemployment figures are based on New York City residents aged 16 and up in the 2015 Current Population Survey.
8. For New York City residents, low- and moderate-income workers receive an Earned Income Tax Credit from the federal, state, and city governments that is based on their taxable earnings. This credit is refundable—if the tax credit exceeds income tax liability, the IRS and NYS Department of Taxation and Finance will issue refunds to tax filers in the amount of the difference. By electing to reduce their taxable income by signing up for pre-tax commuter benefits, many of the lowest income families with children would actually lose more in refundable EITC credits than they would gain in income tax savings, leaving them worse off. While exact EITC subsidy rates depend on tax filing status, earned income, and number of children, consider the example of a family with three or more children who face the largest EITC subsidy: enrolling in pre-tax commuter benefits would cost them more in forgone tax credits than it would save in income tax liability as long as their 2015 income is less than $14,800.
9. The online tax savings calculators from private commuter benefits providers (e.g. WageWorks) do not account for other
features of the tax structure such as the EITC, potentially leading some of the neediest individuals to the incorrect conclusion that commuter benefits will save them money when it will in fact reduce their tax refund.
10. See Nicole Dungca, “Support grows for MBTA discounts for low-income riders,” The Boston Globe, Nov. 28, 2015, and Marielle Mondon, “Denver Activists Push for Income-Based Bus Fares,” Next City, Nov. 23, 2015.
11. Unless otherwise noted, cost projections and program take-up are based on the author’s calculations using information conveyed in correspondence with the relevant local transit authority.
12. See the Mirror Online’s “The Jobseekers’ Bonus You’ve Never Heard of: Just 4,800 discount cards handed out in city of 9 million,” from August 13, 2015 (http://www.mirror.co.uk/news/uk-news/jobseekers-bonus-youve-never-heard-6239986).
13. The Technical Appendix includes a detailed explanation of the revenue estimates for three scenarios: eligibility up to 100% of FPL, up to 130%, and 200%. Alternative assumptions regarding take-up among eligible riders and their responsiveness to discounted fares are also explored in the Technical Appendix.
14. An agreement on capital contributions from the city and state was reached between the governor, mayor, and MTA chairman was announced in October 2015, though the details of how these funds will be raised are still to be determined.
15. Office of the State Comptroller, “Review of the Financial Plan of the City of New York,” December 2015.
16. See Public Authorities Law 1205: Rates of Fare and Levels of Service.
17. This estimate is based on the number of taxable gallons reported by the New York State Department of Taxation and Finance for fiscal year 2015, coupled with the finding that a 5 cent increase in the gas tax leads to a reduction in gasoline consumption of 1.3% on average, nationwide (from Li, Shanjun, Joshua Linn, and Erich Muehlegger, 2014, “Gasoline Taxes and Consumer Behavior,” American Economic Journal: Economic Policy, 6(4): 302-42).
18. This figure is based on information provided by the US Energy Information Administration’s “Short-term Energy Outlook” from February 9, 2016.
37www.cssny.org
Community Service Society of New York
David R. JonesPresident and Chief Executive Officer
Steven L. KrauseExecutive Vice President and Chief Operating Officer
BOARD OF TRUSTEES, 2015–2016
Joseph R. Harbert, Ph.D. Chairperson
Deborah M. Sale Vice Chairperson
Ralph da Costa Nunez Treasurer
Steven BrownSecretary
Terry AgrissJudy ChambersSylvia E. DiPietro, Esq.Florence H. FrucherEric Gioia, Esq.Hon. Betsy GotbaumNicholas A. Gravante, Jr., Esq.Joseph J. HaslipMichael Horodniceanu, Ph.D.Magda Jimenez Train, Esq.Micah C. LasherHon. Kelly O’Neill Levy, Esq.Mark E. LiebermanLeisle LinRosalie MargolisRiche T. McKnight, Esq.Joyce L. MillerGeoffrey NewmanCarol L. O’NealeRegan Kelley OrillacDavid PollakMargarita Rosa, Esq.Hon. Carol Sherman, Esq.Marla Eisland Sprie, Esq.Ken SunshineBarbara Nevins TaylorPhyllis TaylorJeffery J. WeaverJerry WebmanAbby Wenzel, Esq.Mark A. Willis
HONORARY LIFE TRUSTEES
Stephen R. Aiello, Ph.D.David N. DinkinsMarian S. HeiskellDouglas Williams
19. Fiscal Policy Institute, “A Shared Opportunity Agenda,” February 2016. http://fiscalpolicy.org/wp-content/uploads/2016/02/NYS-Economic-and-Fiscal-Outlook-FY-2017.pdf
20. http://www1.nyc.gov/assets/hra/downloads/pdf/facts/snap/2002.2013NYCSNAPParticipation.pdf
21. THE RHTS assigns families to $15,000 income brackets (e.g. less than $15,000, etc.). To approximate the set of families who fall below the federal poverty level, we include the 1,891 families who meet one of the following criteria: earning less than $15,000, earning between $15,000 and $30,000 with at least 2 family members, or earning between $30,000 and $45,000 with at least 4 family members.
22. This elasticity measures how user demand for subway and bus trips responds to a reduction in the price. For example, a transit demand elasticity of -0.4 implies that a 10 percent drop in average fares leads to a 4 percent increase in the number of trips.
23. See Jain, Nihit, “Assessing the Impact of Recent Fare Policy Changes on Public Transport Demand in London,” MIT Master’s Thesis, 2011. This study finds the elasticity with respect to system-wide fare changes to be -0.35 on TfL buses, and -0.19 on
the Underground subway system.

#TRANSIT4ALL
LOW-INCOME NEW YORKERS DESERVE A BREAK
633 Third Ave, 10th FLNew York, NY 10017 PH 212.254.8900www.cssny.org
www.cssny.org/transit4all