Embed Size (px)
Citation preview
Federal Reserve Bank of New YorkStaff Reports
The Tri-Party Repo Market before the 2010 Reforms
Adam CopelandAntoine MartinMichael Walker
Staff Report no. 477November 2010
This paper presents preliminary findings and is being distributed to economistsand other interested readers solely to stimulate discussion and elicit comments.The views expressed in this paper are those of the authors and are not necessarilyreflective of views at the Federal Reserve Bank of New York or the FederalReserve System. Any errors or omissions are the responsibility of the authors.

The Tri-Party Repo Market before the 2010 ReformsAdam Copeland, Antoine Martin, and Michael WalkerFederal Reserve Bank of New York Staff Reports, no. 477November 2010JEL classification: E44, E58, G24
Abstract
This paper provides a descriptive and quantitative account of the tri-party repo marketbefore the reforms proposed in 2010 by the Task Force on Tri-Party Repo Infrastructure(Task Force 2010). We provide an extensive description of the mechanics of this market.We also use data from July 2008 to early 2010 to document quantitative features ofhe market. We find that both the level of haircuts and the amount of funding weresurprisingly stable in this market. The stability of the margins is in contrast to evidencefrom other repo markets. Perhaps surprisingly, the data reveal relatively few signs ofstress in the market for dealers other than Lehman Brothers, on which we provide someevidence. This suggests that runs in the tri-party repo market may occur precipitously,like traditional bank runs, rather than manifest themselves as large increases in margins.
Key words: tri-party repo, wholesale funding, short-term funding
Copeland, Martin, Walker: Federal Reserve Bank of New York (e-mail: [email protected],[email protected], [email protected]). The authors thank Viral Acharya,Brian Begalle, Michele Braun, Lucinda Brickler, Dan Dehlinger, Darrell Duffie, Michael Fleming,Ken Garbade, Gary Gorton, Jamie McAndrews, Susan McLaughlin, Steve Pesek, Andy Sturm,and members of the Task Force for helpful comments on an earlier draft. The views expressed inthis paper are those of the authors and do not necessarily reflect the position of the Federal ReserveBank of New York or the Federal Reserve System.
1 Introduction
This paper aims to shed some light on the US tri-party repo market, an important funding
market that played a role in some of the key events associated with the recent financial crisis.
The Task Force on Tri-Party Repo Infrastructure (Task Force 2010) notes that “At several
points during the financial crisis of 2007-2009, the tri-party repo market took on particular
importance in relation to the failures and near-failures of Countrywide Securities, Bear Stearns,
and Lehman Brothers. The potential for the tri-party repo market to cease functioning, with
impacts to securities firms, money market mutual funds, major banks involved in payment and
settlements globally, and even to the liquidity of the U.S. Treasury and Agency securities, has
been cited by policy makers as a key concern behind aggressive interventions to contain the
financial crisis.”
We provide a descriptive and quantitative account of the tri-party repo market before the
reforms proposed in 2010 by the Task Force.1 In particular, we describe in some detail the
mechanics of this market and some of its vulnerabilities. We also use data collected by the
Federal Reserve Bank of New York (FRBNY) to document quantitative features of this market.
Our data covers the period from July 2008 to the beginning of 2010.
The tri-party repo market is a large funding market in which dealers fund their portfolios
of securities through repurchase agreements (repos). The largest cash providers in this market
are money market mutual funds and securities lenders that seek a short-term investment for
their available cash. Two tri-party clearing banks, JPMorgan Chase and the Bank of New York
Mellon, provide intermediation services to the dealers and the cash investors. The vulnerabil-
ities of the tri-party repo market are magnified by its size, the fact that the share of less liquid
collateral was growing before the crisis, and the fact that the majority of funding was short-
term, usually overnight. The size of the market reached $2.8 trillion and the size of the largest
portfolios financed by dealers exceeded $400 billion at the peak of the market. The share of
1While this paper focuses on the US tri-party repo market, some information on repo markets in other countriescan be found in CPSS (2010).
1
less liquid collateral approached 30 percent of the collateral funded in the market at the peak
and has decreased to less than 20 percent in 2010.
We find that both the level of haircuts and the amount of funding were surprisingly stable
in this market during the period for which we have data, from July 2008 to early 2010. The
stability of the margins is in contrast to evidence from other repo markets. Of course, this
apparent stability did not prevent the tri-party repo market from contributing to the problems
experienced by Lehman Brothers, on which we provide some evidence. The available evidence
suggests that runs in the tri-party repo market may occur precipitously, more like traditional
bank runs, rather than manifest themselves in the form of large increases in margins.
Haircuts in the tri-party repo market barely moved during the crisis. This is in stark contrast
with the study of Gorton and Metrick (2009) of an interdealer market for less liquid collateral
and the experience of some other repo markets. The stability of haircuts in tri-party repo seems
to be due, in part, to the behavior of some large cash investors who look at the counterparty to
a repo first and to the collateral second. For these investors, withdrawing funding from a trou-
bled counterparty altogether seems preferable to increasing margins. The stability of haircuts
suggest that while the “margin spirals” described in Geanakoplos (2003) or Brunnermeier and
Pedersen (2009) seem to characterize the experience of some repo markets, the tri-party repo
market is very different.
The data shows quite stable relationships between cash investors and the dealers they per-
ceive to be creditworthy. While the amount of funds provided by some large cash investors
does fluctuate somewhat, dealers can generally count on the same set of counterparties pro-
viding a minimum amount of funding. In particular, we find few examples of interruptions in
the relationship between a cash investor and a dealer. The total amount of collateral funded in
the tri-party repo market decreased between July 2008 and early 2010, but anecdotal evidence
suggests this could be due, in large part, to dealers’s desire to reduce their leverage. While
the market may have been stressed, it appears that most dealers were able to maintain stable
funding in the tri-party repo market from July 2008 to early 2010. It is a challenge to reconcile
2
the apparent stability of the tri-party repo market with the dramatic events related to the fail-
ure of Lehman Brothers, to which the tri-party repo market seems to have contributed, as we
document in section 5.1.
Another puzzle is the difference in the behavior of haircuts between the tri-party repo
market and other repo markets. While we lack the data to provide a definitive answer, several
features of the market appear to be relevant: 1) Cash investors and dealers appear to establish
long-term relationships. If investors attach value to their relationships with dealers, they may
be willing to continue to provide tri-party repo lending to a dealer without raising margins, even
in stressed circumstances. 2) Some cash investors appear to be reluctant or unprepared to take
possession of the collateral and prefer to withdraw funding if they think a dealer is not credit
worthy. The level of haircuts and the type of collateral may be unimportant for such investors
and they may not manage either carefully. 3) Tri-party repos have very short terms, usually
overnight. This allows investors to pull their funding at a moment’s notice if a dealer becomes
too weak. Additional data on different repo markets would help ascertain the importance of
each of these features. Lack of data also prevents us from considering the differences between
secured and unsecured funding. Anecdotal evidence suggests that unsecured funding behaves
differently from both bilateral and tri-party repos. In particular, it appears that tri-party repo
funding is typically more stable than unsecured funding, despite the unwillingness of some
cash investors to take possession of the collateral.
The features described in the last paragraph also help explain why “runs” in the tri-party
repo market are likely to happen precipitously, rather than through a gradual process. In that
respect, tri-party repo runs resemble traditional bank runs. The fragility of the tri-party repo
market is also exacerbated by some institutional features, such as the morning “unwind” of
repos, as we describe in section 4. Hence, the apparent stability of the tri-party repo market
during the crisis should not obscure the fact that runs, when they occur, can have devastating
and systemic consequences, as was the case with the failure of Lehman. This risk underscores
the need for reform in this market.
3
Another potentially important factor in the apparent stability of the tri-party repo market
was the presence of the Primary Dealer Credit Facility (PDCF) during the period for which
we have data (see Adrian, Burke, and McAndrews 2009). Many market participants have
mentioned that the PDCF played an important role in the stability of the market.
The remainder of the paper is organized as follows: Section 2 describes the mechanics of
the tri-party repo market in more detail and section 3 provides a quantitative assessment of the
(relatively) stable period from July 2009 to early 2010. Section 4 discusses the fragility of the
tri-party repo market and section 5 looks at the data during the height of the crisis, between
July 2008 and July 2009. Section 6 concludes.
2 The tri-party repo market in the US
In the US, a tri-party repo is a form of repo for which a third party, called the clearing bank,
provides intermediation services to the cash investor and the collateral provider.2 Tri-party
repos are popular in part because of the efficiency gains associated with the intermediation
role of the clearing bank. Indeed, the efficiency of the tri-party repo market, and the fact that
so many institutions use it, are among the reasons the Federal Reserve uses this instrument to
implement monetary policy.
While this paper focuses specifically on the tri-party repo market, there are other repo
markets. Dealers also use bilateral repos, known as DvP (delivery versus payment) repos,
to obtain funding. However, because DvP repos are not as convenient as tri-party, they are
believed to represent a small share of dealer funding. Repos are also used to redistribute cash
between dealers. For example, broker dealers can exchange cash and general collateral with
each other in the GCF repor market (Fleming and Garbade 2003).3 There is also an interdealer
2Appendix C defines and provides a brief overview of repos.3General collateral is collateral for which supply is abundant relative to demand. An investor accepting general
collateral may care about the class of collateral she receives, but not about the specific issue. This is in contrastto “special” collateral, for which supply is short relative to demand. An investor seeking special collateral caresabout the specific issue she receives.
4
market for less liquid collateral, which is studied in Gorton and Metrick (2009). Prime brokers
also use repos to provide cash to hedge funds, or other clients, against securities using bilateral
repos. In the remainder of this section, we describe the cash investors, the collateral providers,
and the clearing banks in the US tri-party repo market, as well as the mechanics of this market.
2.1 Collateral providers
The collateral providers supplying the majority of collateral in the tri-party repo market are
“primary dealers”. Primary dealers are banks or securities broker-dealers that can trade directly
with the Federal Reserve.4 Some large hedge funds and other institutions with large portfolios
of securities also participate in the tri-party repo market, but they represent a small share of
the total volume. From July 2008 to January 2010, there were at least 40 collateral providers
in the tri-party repo market.5 This side of the market is concentrated, with the top 5 collateral
providers accounting for 57% of borrowing and the top 10 accounting for 88%. We use the
terms “collateral providers” and “dealers” interchangeably in this paper.
Dealers hold securities for several reasons. Some securities constitute inventories as part of
the dealer’s market-making business, others are part of the proprietary holdings of the dealer
as a form of investment. Collateral providers also obtain securities through intermediation. For
example, prime brokers receive collateral through their prime brokerage services. As part of
that business, they provide cash to their clients, such as hedge funds, usually through a bilateral
repo transaction in which the client is the collateral provider. In some cases, broker dealers can
rehypothecate the collateral to a cash investor through tri-party repo. In this way, the broker
dealer acts as an intermediary, transferring cash from an investor to a hedge fund and collateral
from a hedge fund to an investor. The broker dealer earns profits on the difference between
interest rates on the bilateral repo with the hedge fund and on the tri-party repo with the cash
investor. In addition, if the haircut in tri-party is lower than the haircut the broker dealer obtains
4For more information on primary dealers, see http://www.newyorkfed.org/markets/primarydealers.html.5Our data contains 26 dealers during the “stable” period, listed in appendix A, but does not include some
dealers with very little activity in the tri-party repo market.
5
from its client, then the broker dealer is able to generate cash, which can be used to earn an
additional return.
To economize on their use of capital, dealers prefer to borrow cash to purchase the secu-
rities they hold (Tuckman 2010). In turn, the securities can serve as collateral to obtain cash.
This is one way in which securities dealers can obtain leverage. Consider the stylized example
of a dealer with $1 billion in capital. This dealer can use its capital to buy $1 billion in securi-
ties and repo these securities to obtain cash. If the haircut on the repo is 5%, the dealer can get
$950 million in cash. With this cash, the dealer can buy new securities and repo them out to
get more cash. Assuming the same haircut, the dealer can get an additional $902.5 million in
cash in that way. Continuing this process, the dealer can obtain a portfolio of securities worth
$20 billion with its $1 billion in capital.6
As an alternative to obtaining financing in the tri-party repo market, dealers can engage in
DvP repos. However, DvP repos are not as flexible as tri-party repos and some investors may
find it too costly or cumbersome to engage in such repos. Dealers can also obtain unsecured
funding by issuing commercial paper (CP) or medium term notes (MTN). In the past few years,
dealers have progressively moved away from unsecured financing toward secured financing,
notably tri-party repos. One reason was the belief at the time that secured financing was
generally more stable and less affected by market sentiment (Friedman 2010). For that reason,
the relative fragility of the tri-party repo market was a surprise to many market participants.
2.2 Cash investors
The set of cash investors in the tri-party repo market is more numerous and diverse than the
set of collateral providers. There are over 4,000 individual firms active as cash investors.
Money market mutual funds form one large group of investors, representing between a quarter
and a third of the cash invested in that market. Another large group, representing about 25
6The formula to find the value of the portfolio of securities is: 1+0.95+0.952 +...= ∑∞i=0 0.95i = 1
1−0.95 = 20.
This example provides an upper bound, as it assumes that the dealer is fully levered, which is not generally thecase.
6
percent, is securities lenders. Securities lenders use the tri-party repo market to re-invest the
cash collateral they receive when they loan securities.7
The cash investor side of the tri-party repo market is less concentrated than the collateral-
provider side but is concentrated nonetheless. The largest 10 investors account for about 60%
of the lending. Unlike the collateral-provider side, however, there is a long tail of smaller
investors composed of municipalities and individual businesses. Investors typically lend to a
number of different collateral providers as a way to diversify their risk.
Cash investors seek to earn interest on their available cash. Some lenders are interested
in investing for very short durations because they may need the cash on short notice. For
example, money market mutual funds may need cash to accommodate redemption requests
from their investors. Short-term repos can also be used as a risk management tool by cash
investors. Indeed, if an investor becomes concerned about the health of a collateral provider, it
can choose to redirect its funding on short notice to a healthier collateral provider.
Some cash investors can use DvP repos as an alternative to tri-party. However, DvP re-
quires the investor to take possession of the collateral and perform other back-office functions
that the clearing banks perform in tri-party.8 Cash investors can also invest in unsecured in-
struments such as CP or certificates of deposits (CD).
7In the US, a security cannot be sold short by an institution that does not borrow the secu-rity to make delivery, an activity also known as “naked” short selling (SEC regulation SHO, seehttp://www.sec.gov/divisions/marketreg/mrfaqregsho1204.htm). The ban on naked short selling creates an im-portant role for securities lending, which allows an institution that wants to sell a securities short to borrow it.Custodial banks often provide the service of lending the securities of their clients. In the US, most securitieslending is done against cash collateral. Hence, securities lenders usually have large pools of cash that they seekto re-invest, on behalf of their clients. While investment strategies for these pools of cash may differ, they oftenresemble the investment strategies of money market mutual funds. This is in part due to the fact that securitieslenders must return the cash collateral to a borrower of a security as soon as the borrower returns the security.Since the return of the security is at the discretion of the borrower, the securities lender is exposed to “redemptionrequests” that are somewhat similar to pressures faced by money market mutual funds.
8In both tri-party and DvP repos, risk management is the responsibility of the investor.
7
2.3 Clearing banks
There are two tri-party repo clearing banks in the U.S. market: JPMorgan Chase (JPMC)
and the Bank of New York Mellon (BNYM). The clearing banks play an important role as
intermediaries between the collateral provider and the cash investor. They take custody of
securities used as collateral in a tri-party repo transaction, they value the securities and make
sure that the specified margin is applied, they settle the transaction on their books, and they
offer services to help dealers optimize the use of their collateral. Note that the tri-party repo
clearing banks do not match dealers with cash investors nor do they play the role of brokers in
that market.
By taking custody of the collateral, the clearing banks provide a guarantee to the cash
investor that the collateral is segregated and identifiable in case of default of the collateral
provider. This reduces the legal risk faced by the cash investors.
The clearing bank assigns a value to the securities that are traded, which determines the
number of securities that need to be pledged as collateral for a given dollar amount. To value
securities, the clearing banks rely on price information provided to them by outside vendors.
For securities that are actively traded, such as Treasuries, the price used for tri-party is typically
that security’s market price, evaluated at the close of the previous day’s market. If a market
price is not available, vendors can provide prices derived from models. Each clearing bank
sets policies that determine what price applies in special circumstance, such as if vendor prices
conflict or are absent, or the length of time before a modeled price is considered stale, for
example.
The number of securities that needs to be pledged also depends on the applicable haircut.
As we explain in more detail in section 2.4, haircuts are not negotiated at the trade level but
are instead written into the appendix of the tri-party repo custodial agreement between the
cash investor, the collateral provider, and the clearing bank. While it is possible to change the
appendix containing the haircuts, the change may not apply until the next day. Such changes
are only made occasionally.
8
The cash investors and the collateral providers hold balances and securities accounts on
the books of a clearing bank.9 Typically, dealers hold an account with only one clearing
bank, usually the custodian they have selected for their Fed-eligible securities.10 In contrast,
cash investors typically hold accounts with both clearing banks. This allows the investors to
diversify their exposures across many dealers, irrespective of the clearing bank an individual
dealer relies upon to settle its tri-party repos. To settle the initial leg of a repo, the clearing
bank moves securities from the collateral provider’s securities account to the cash investor’s
securities account and moves cash in the opposite direction in the cash accounts, on its books.
These flows are reversed to settle the return leg of the repo. Settling on the books of the clearing
bank is particularly convenient for repos with multiple issues of collateral as, otherwise, the
different pieces may have to be sent separately over the Fedwirer Securities Service, or DTC
for non-Fed eligible securities.
As we explain in section 2.4, tri-party repos are arranged in the morning, before the collat-
eral providers know exactly the composition of the portfolio they will need to finance. A trade
specifies what collateral is acceptable but the exact collateral allocation is made at the end of
the day, when the dealer’s portfolio is known. The clearing banks make proprietary algorithms
available to dealers to help them allocate collateral to specific repo trades in the least costly
way, based on the applicable haircuts.
The clearing banks act as an agent to the collateral providers and the cash investors in all
the roles noted above. In the U.S. tri-party repo market, the clearing banks also play the role
of principal because they finance the collateral provider’s securities during the day. This role
creates operational efficiencies but is also a source of weakness in the market. As described
in more detail in section 2.4, each morning the clearing banks “unwind” the prior day’s repos,
sending cash back to the investors and securities back to the collateral providers. This gives
9The term ‘cash account’ is also used to describe the balances account.10Dealers cannot participate directly in Fedwire and use custodial banks as agents to settle sales or purchases
of securities as well as to hold the securities in safekeeping. Fed-eligible securities are securities that can besettled on the Fedwirer Securities Service, while Non-Fed eligible, also called DTC-eligible, can be settled bythe Depository Trust Company (DTC).
9
collateral providers access to their securities during the business day, which they need to con-
duct their market-making activities or to meet their settlement obligations, while creating an
exposure to the clearing bank secured by the portfolio of securities.
2.4 Timing of events
In this section, we describe the timing of events related to a tri-party repo. This description
focuses on market practice prior to the proposed reforms announced on May 17, 2010 and
highlights the weaknesses associated with this timing.11 We also explain how some of the
proposed reforms may reduce the weaknesses.
2.4.1 Morning: Trade agreement
A cash investor and a collateral provider typically agree on a tri-party repo before 10 AM.
Anecdotal evidence suggests that 90 to 95 percent of a dealer’s tri-party repos are arranged
before that time. Some smaller dealers report arranging all their tri-party repo funding between
8 and 8:30 AM. The agreement specifies the amount of cash the investor will provide, the
interest rate, and the term of the repo. The acceptable collateral for an agreement also comes
out of the appendix to the tri-party custodial agreement. The majority of tri-party repos are
believed to be overnight or “open” repos. Open repos roll over by default, unless one of
the parties explicitly chooses to cancel the transaction. Some repos have terms such as one
week, two weeks, a month, or even longer. The lack of knowledge related to the fraction of
overnight, open, and term repos is related to the fact that the clearing banks themselves did
not need to know the term of the tri-party repos they were settling, for reasons we describe
below. The haircut that applies to a particular collateral class is not negotiated at the trade
11The report of the Task Force on Tri-Party Repo Infrastructure is available athttp://www.newyorkfed.org/prc/report 100517.pdf. The Federal Reserve Bank of New York released awhite paper commenting on the report and describing the weaknesses in that market. The white paper is availableat http://www.newyorkfed.org/banking/nyfrb triparty whitepaper.pdf
10
level but, instead, is specified in the appendix of the custodial agreement between the three
parties. Hence, changing haircuts requires amending the agreement.
A trade agreed upon in the morning does not settle until the afternoon, around 5 PM. Prior
to the reforms, the clearing banks were not systematically notified of the agreement between
the collateral provider and the cash investor at the time it occurred in the morning. Instead, the
clearing banks would receive this information later in the day, before the time the repo would
settle. Even then, the term of the repo may not have always been specified.
There was also some uncertainty regarding the time at which the trade was legally binding.
Some market participants appeared to believe that the trade was binding at the time of the
agreement, in the morning, while others appeared to believe that the trade was binding only
at the time of the settlement, in the afternoon. The proposed reforms clarify that the trade is
legally binding at the time it is agreed upon and require confirmation of all trades to all parties,
including the clearing bank, shorty thereafter.
2.4.2 Afternoon: Collateral allocation
In the afternoon, after the close of Fedwirer Securities Service and the Depository Trust &
Clearing Corporation (DTCC), the collateral provider knows the composition of its portfolio,
since securities can no longer be traded. With this information, and with the information
provided by the cash investors regarding the amount of financing they will provide and the
securities they will accept as collateral, the dealers can allocate acceptable collateral to each
trade using clearing-bank provided optimization tools. These tools can determine the most
effective allocation of the available securities, taking into account the investors’ acceptable
collateral and the haircut specified in the custodial agreement.
The need to know the haircuts for the collateral allocation is the reason they are speci-
fied in the appendix of the custodial agreement. Negotiating haircuts at the trade level would
make the allocation of collateral much more complicated. Table 1 represents three stylized
and hypothetical collateral schedules between a cash investor and a collateral provider. The
11
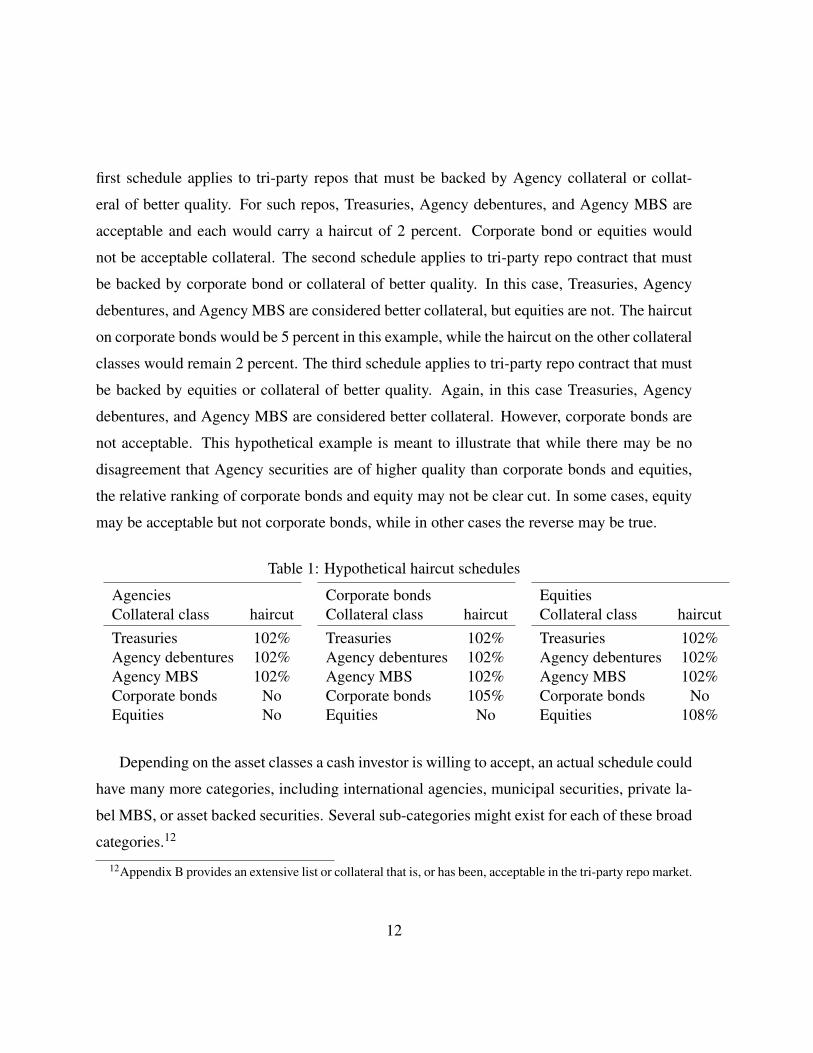
first schedule applies to tri-party repos that must be backed by Agency collateral or collat-
eral of better quality. For such repos, Treasuries, Agency debentures, and Agency MBS are
acceptable and each would carry a haircut of 2 percent. Corporate bond or equities would
not be acceptable collateral. The second schedule applies to tri-party repo contract that must
be backed by corporate bond or collateral of better quality. In this case, Treasuries, Agency
debentures, and Agency MBS are considered better collateral, but equities are not. The haircut
on corporate bonds would be 5 percent in this example, while the haircut on the other collateral
classes would remain 2 percent. The third schedule applies to tri-party repo contract that must
be backed by equities or collateral of better quality. Again, in this case Treasuries, Agency
debentures, and Agency MBS are considered better collateral. However, corporate bonds are
not acceptable. This hypothetical example is meant to illustrate that while there may be no
disagreement that Agency securities are of higher quality than corporate bonds and equities,
the relative ranking of corporate bonds and equity may not be clear cut. In some cases, equity
may be acceptable but not corporate bonds, while in other cases the reverse may be true.
Table 1: Hypothetical haircut schedules
AgenciesCollateral class haircutTreasuries 102%Agency debentures 102%Agency MBS 102%Corporate bonds NoEquities No
Corporate bondsCollateral class haircutTreasuries 102%Agency debentures 102%Agency MBS 102%Corporate bonds 105%Equities No
EquitiesCollateral class haircutTreasuries 102%Agency debentures 102%Agency MBS 102%Corporate bonds NoEquities 108%
Depending on the asset classes a cash investor is willing to accept, an actual schedule could
have many more categories, including international agencies, municipal securities, private la-
bel MBS, or asset backed securities. Several sub-categories might exist for each of these broad
categories.12
12Appendix B provides an extensive list or collateral that is, or has been, acceptable in the tri-party repo market.
12
The settlement of the initial leg of the repo trade occurs on the books of the clearing banks
in the afternoon. Balances are transferred from the investor’s balances account to the collateral
provider’s balances account, while securities are transferred from the collateral provider’s se-
curities account to the cash investor’s securities account. This allows the collateral allocation
for tri-party repo trades to occur after the close of the Fedwirer Securities wire, which occurs
at 3:30 PM, and the close of DTC, which occurs at 4:30 PM. In contrast, settlement of DvP
repos must occur before the close of the securities wire or DTC.
2.4.3 Next morning: The “unwind”
Between 8 and 8:30 AM the next morning, the clearing banks “unwind” the tri-party repo
trades. The unwind consists of sending the balances back to the investor’s balances account
and the securities back to the collateral provider’s securities account on the balance sheet of
the clearing bank. At the same time, the clearing banks extend intraday credit to the dealer
since the securities are no longer financed by the tri-party investors.
All repos are unwound, including terms repos and open repos that are rolled over, because
the unwind is mainly done for operational ease. In addition, because of the lack of three-way
trade confirmation noted above, the clearing banks may not have known the term of the repo
transactions they were facilitating. For non-maturing trades, an alternative way to think of
the unwind is that clearing banks extend intraday credit to dealers and dealers substitute the
cash for the securities as collateral to the repo. Term trades are “rewound” every evening,
at the same time as the initial leg of new repos are settled. Reallocating collateral for term-
trades may be desirable even if the clearing bank did not extend intraday credit to the dealers.
Tri-party repo is considered “general collateral” financing, meaning that an investor may care
about the class of collateral it receives, but not about the specific issue. Hence, the optimal
collateralization of a trade could vary from day to day, or even intraday, as the dealer’s portfolio
of securities changes.
The unwind is important because collateral providers need access to their securities during
13
the day for their business activities. Unwinding the repos makes collateral substitutions easier.
Indeed, it is operationally complicated to substitute collateral in the cash investor’s account at
the clearing bank, especially for securities that are traded often, such as Treasuries. It is more
convenient to substitute collateral on the dealer’s account at the clearing bank. The clearing
bank has access to the whole pool of securities for each dealer, rather than the subset that
each investor takes as collateral. In addition, the dealer may keep in custody at the clearing
bank securities that are not financed through tri-party repos. The clearing banks employ a
risk management concept called Net Free Equity (NFE) to ensure that the value assigned to
the dealer’s securities on their book exceeds the value of the intraday loan. Using NFE, the
clearing banks can allow collateral providers to buy and sell securities in an operationally
efficient manner.
It is important to highlight that the unwind is at the discretion of the clearing bank. This
was not well understood by some market participants before the crisis. Some cash investors
believed that the unwind would always occur, even during times of stress. Instead, the clearing
bank has the contractual right to refuse to unwind the repos of a collateral provider. For
example, if a clearing bank felt that a dealer might have to declare bankruptcy during the day,
it could choose to protect itself by not unwinding. Practically speaking, refusing to unwind
the repos of a dealer would almost certainly force that dealer into default. Without access
to its securities, the dealer would be unable to perform its business. If the unwind did not
occur, the investors would find themselves holding securities that they may have to liquidate.
In particular, some money market mutual funds are allowed to take as collateral securities that
they cannot hold on their balance sheet. These securities would have to be liquidated quickly.
Moreover, some money fund shareholders may be concerned with the risk facing their fund in
such a situation and could seek to redeem their shares, triggering a run on the fund.
Many cash investors leave the balances they have received after the unwind in their account
at the clearing bank during the day. This could be because they have no use for the balances.
In some cases, dealers have an arrangement with cash investors to leave the balances in their
14
account at the clearing banks. The clearing banks charge dealers for daylight overdrafts, so
the dealers have an incentive to offer favorable terms to a cash investor who leaves its balances
at the clearing banks during the day. The clearing banks also benefit as it reduces their need
for intraday reserves, which they otherwise may have to obtain from the Federal Reserve at
a small cost.13 A consequence of the unwind is to shift the exposure of cash investors from
many smaller secured exposures to various collateral providers to a large unsecured exposure
to one or two clearing banks. Some cash investors have mentioned preferring not to have such
an exposure to a clearing bank intraday.
Once the balances have been sent back to the cash investors, the collateral providers no
longer have funding for their securities. One of the services provided by the clearing banks
is intraday funding for the collateral providers’ securities. The unwind, and the provision of
intraday credit by the clearing banks, introduce fragility into the tri-party repo market in a
number of ways. First, the unwind makes it easier for cash investors to pull their funds from
the tri-party repo market, potentially exacerbating the risk of runs. Second, the exposure to
a dealer default shifts from the investors overnight to the clearing banks intraday, potentially
creating perverse incentives to be the first to pull away from a troubled dealer. Third, the
extension of intraday credit by the clearing banks is a source of fragility both to themselves
and to the collateral providers that rely on them for their funding. We discuss these sources of
fragility in more detail in section 4.
One of the major operational improvements from the reforms is the aim to achieve the
“practical elimination” of the extension of intraday credit by the clearing banks. The long run
objective is the elimination of the routine daily unwind of all repo trades. This could be made
possible by technology that permits the substitution of securities collateral in real time in the
cash investors’ accounts. A related improvement is the transition to one daily settlement time
for both legs of repos, rather than one settlement time in the evening for initial leg and one
settlement time in the morning for the closing leg. More immediately, a reduction in intraday
13The clearings bank would breach their daylight overdraft caps should a sufficiently large share of the tri-partyinvestors’ cash be withdrawn.
15
credit extended can be achieved by no longer unwinding term and rolling open repos.
When repos are unwound early in the morning between 8 and 8:30 AM, the clearing banks
have little or no information regarding a collateral provider’s ability to obtain funding in the
afternoon. This makes the decision to unwind and extend intraday credit to the dealer more
risky. If, instead, the closing leg of maturing repos is settled at the same time as the opening
leg of new repos, the clearing banks would know if a dealer has enough funding before they
make the decision to settle maturing repos.
3 The tri-party repo market during a (relatively) stable pe-riod: July 2009 - January 2010
In this section, we first describe our data. We then present statistics that describe the tri-party
repo market over a relatively stable period, from July 1, 2009, to January 27, 2010. By starting
the sample in July 2009, we hope to be sufficiently far removed from the height of the crisis
in the fall of 2008. We do not extend the sample too far into 2010 as the market is likely
to change under the influence of the reforms proposed by the Task Force on Tri-Party Repo
Infrastructure. In section 5 we examine the market from July 1, 2008 to June 30, 2009, with
the goal of understanding dealer and investor behavior at the height of the financial crisis.14
3.1 The data
The Federal Reserve Bank of New York collects data on the tri-party repo market. The data
to which we have access are the quantity and type of collateral posted in this market and
the haircuts associated with various types of collateral. These data are not the universe of
dealers and investors, but rather all the major players, whom account for the vast majority of
tri-party repo activity. For each dealer, we observe the daily total value of cash borrowed and
14Some of the most dramatic events in the tri-party repo market occurred between September 2007 and July2008, in particular before March 17, 2008, when the PDCF was introduced. Unfortunately, we do not have datacovering that period.
16
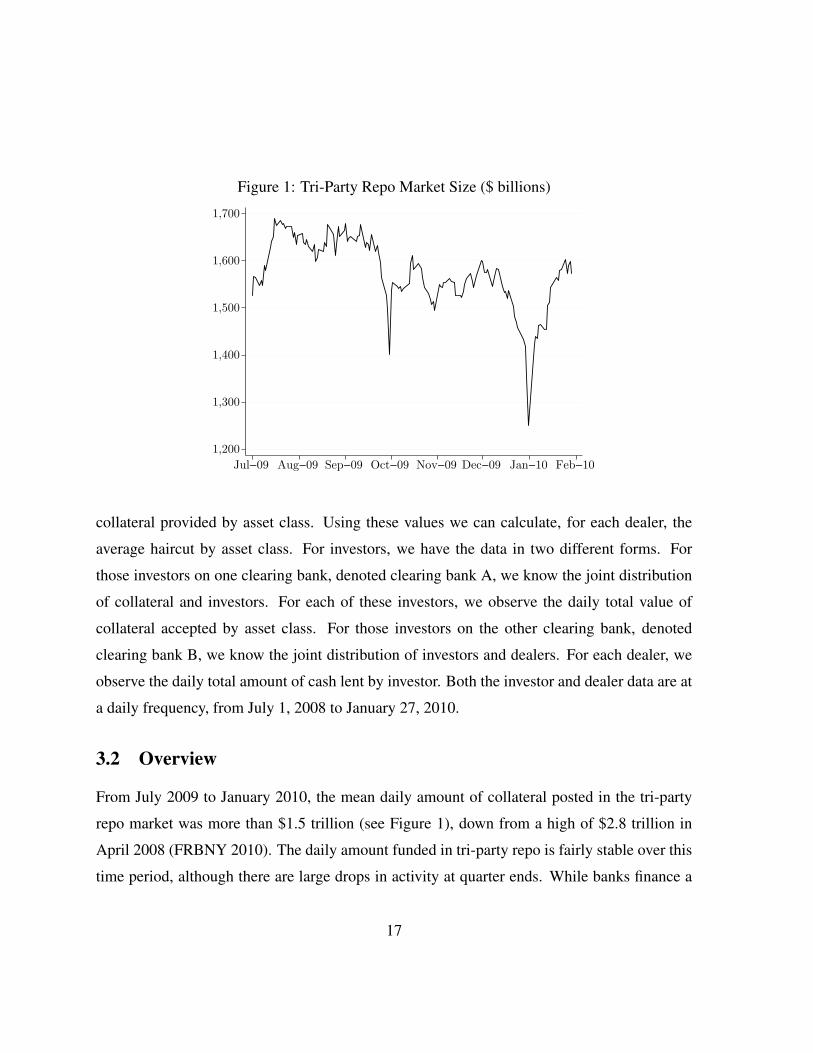
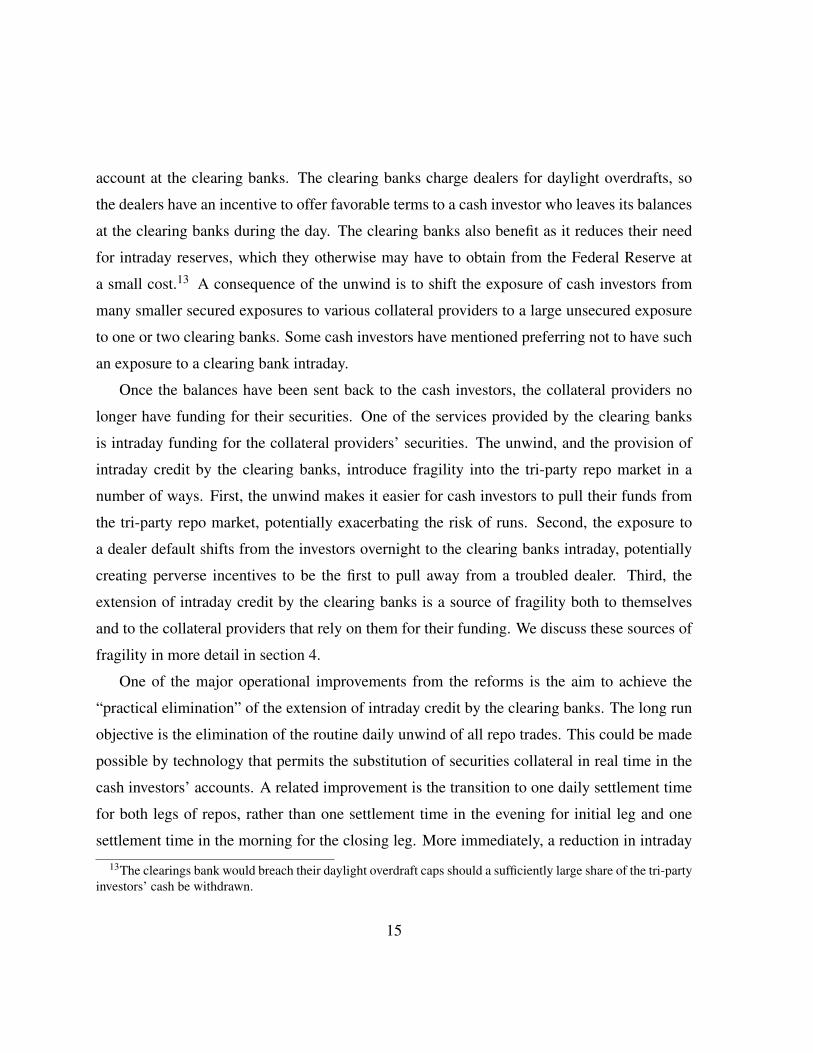
Figure 1: Tri-Party Repo Market Size ($ billions)
1,200
1,300
1,400
1,500
1,600
1,700
Jul−09 Aug−09 Sep−09 Oct−09 Nov−09 Dec−09 Jan−10 Feb−10
collateral provided by asset class. Using these values we can calculate, for each dealer, the
average haircut by asset class. For investors, we have the data in two different forms. For
those investors on one clearing bank, denoted clearing bank A, we know the joint distribution
of collateral and investors. For each of these investors, we observe the daily total value of
collateral accepted by asset class. For those investors on the other clearing bank, denoted
clearing bank B, we know the joint distribution of investors and dealers. For each dealer, we
observe the daily total amount of cash lent by investor. Both the investor and dealer data are at
a daily frequency, from July 1, 2008 to January 27, 2010.
3.2 Overview
From July 2009 to January 2010, the mean daily amount of collateral posted in the tri-party
repo market was more than $1.5 trillion (see Figure 1), down from a high of $2.8 trillion in
April 2008 (FRBNY 2010). The daily amount funded in tri-party repo is fairly stable over this
time period, although there are large drops in activity at quarter ends. While banks finance a
17
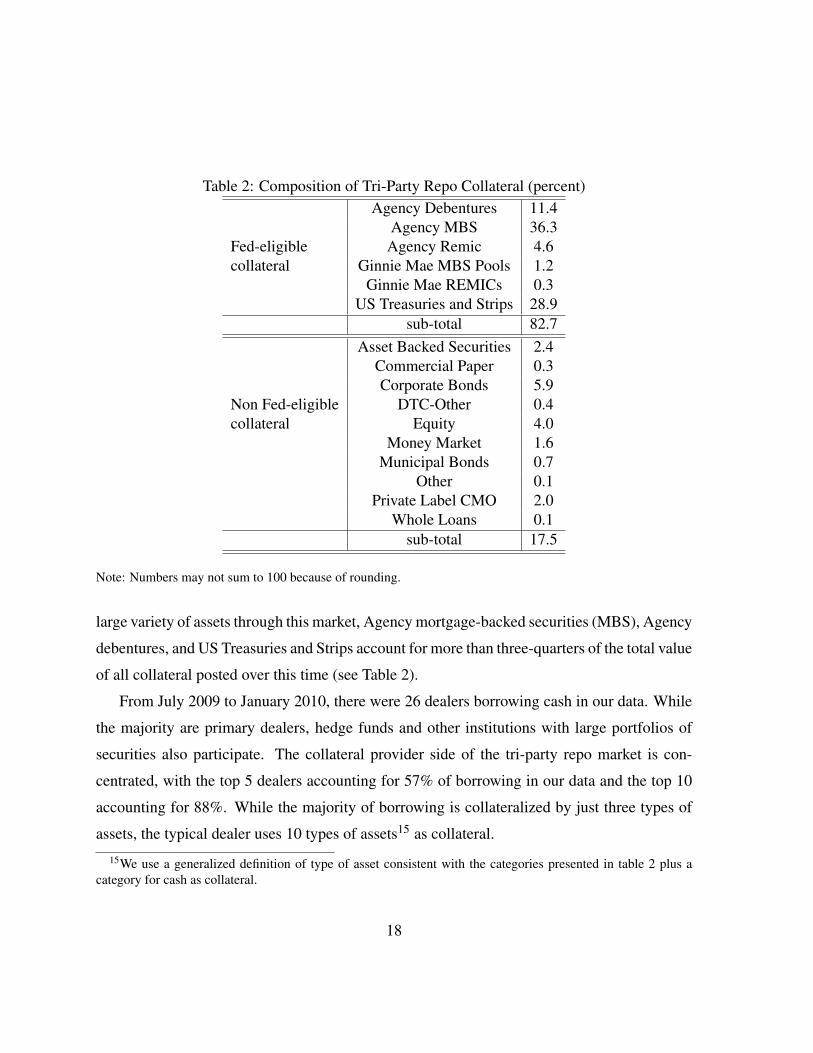
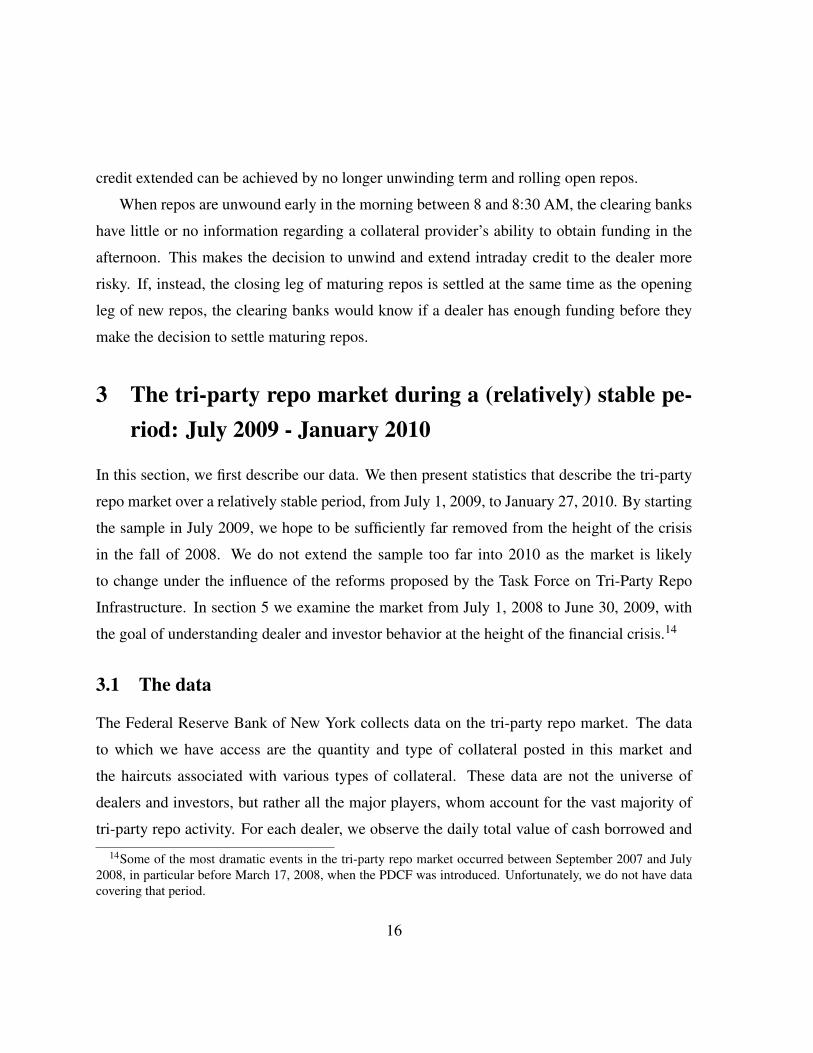
Table 2: Composition of Tri-Party Repo Collateral (percent)Agency Debentures 11.4
Agency MBS 36.3Fed-eligible Agency Remic 4.6collateral Ginnie Mae MBS Pools 1.2
Ginnie Mae REMICs 0.3US Treasuries and Strips 28.9
sub-total 82.7Asset Backed Securities 2.4
Commercial Paper 0.3Corporate Bonds 5.9
Non Fed-eligible DTC-Other 0.4collateral Equity 4.0
Money Market 1.6Municipal Bonds 0.7
Other 0.1Private Label CMO 2.0
Whole Loans 0.1sub-total 17.5
Note: Numbers may not sum to 100 because of rounding.
large variety of assets through this market, Agency mortgage-backed securities (MBS), Agency
debentures, and US Treasuries and Strips account for more than three-quarters of the total value
of all collateral posted over this time (see Table 2).
From July 2009 to January 2010, there were 26 dealers borrowing cash in our data. While
the majority are primary dealers, hedge funds and other institutions with large portfolios of
securities also participate. The collateral provider side of the tri-party repo market is con-
centrated, with the top 5 dealers accounting for 57% of borrowing in our data and the top 10
accounting for 88%. While the majority of borrowing is collateralized by just three types of
assets, the typical dealer uses 10 types of assets15 as collateral.
15We use a generalized definition of type of asset consistent with the categories presented in table 2 plus acategory for cash as collateral.
18
Collateral providers tend to borrow from a number of investors. Using the investor data
from clearing bank B, we find that the top 5 dealers have an average of 40 investors each. Yet
dealers still rely significantly on specific investors; for the top 5 dealers, the largest investor’s
share of a dealer’s overall borrowing is 19%. Not surprisingly, dealers which borrow smaller
amounts have fewer investors. The median number of investors for the five dealers who borrow
the smallest amounts is 1.16
On the investor side of the tri-party repo market, our data includes observations from 241
investors between July 2009 and January 2010. Like the dealer side, there is concentration
in the investor side of the tri-party repo market. The largest 10 investors account for 59% of
the lending in our data. In contrast to the dealer side, there is a long tail of small investors.
Investors lend to a number of dealers. Using the investor data from clearing bank B, we find
that the largest number of dealers to which an investor loaned cash on a single day was 8.
Small investors, which make up the majority of the investors in our data but account for only
a small fraction of the cash lent, generally lend to a single dealer. The value-weighted median
number of dealers to which an investor will lend cash on a single day is 5. These statistics on
the number of dealers to which an investor will lend are understated, however, since they are
based on data from one clearing bank and the larger cash investors are active on both clearing
banks.
3.3 Variables in a tri-party transaction
A tri-party repo trade consists of five key variables: the interest rate, the haircut, the size of the
transaction, the type of collateral and the maturity date. The schedules of haircuts applicable
to a repo are determined beforehand when two parties and the clearing bank sign a custodial
agreement. Thus, at the time of the trade, dealers and investors only need to agree on the
16The composition of dealers for each clearing bank differ slightly. While each clearing bank had the samenumber of dealers from July 1, 2009 to January 27, 2010, the average dealer on one clearing bank provided abouttwice as much collateral in tri-party repo than the average dealer on the other clearing bank. These differences indealer composition should be kept in mind when considering statistics based on activity on one clearing bank.
19
other four variables. We have a wealth of information on haircuts and transaction volumes
by collateral type. Unfortunately, we only have aggregate interest rate data on repos and no
information on the term of transactions. Industry contacts report, however, that the largest
tenor of triparty repo agreements are overnight.17 We begin by presenting stylized facts on
interest rates and then examine the behavior of haircuts.
3.3.1 Interest Rates
Our interest rate data comes from Bloomberg and provides an overview of the interest rates
paid on tri-party repo and DvP repos. Further, our interest rate data is limited to repos where
Treasuries, Agency Debentures and Agency MBS securities were used as collateral.
The data show that Treasury, Agency Debentures and Agency MBS repo rates declined
over our sample period as the Federal Reserve lowered the federal funds rate. Figure 2 plots
the average interest rate for overnight Treasury repos, and shows its dramatic decline from over
2 percent in 2008 to below 25 basis points in 2009. The interest rates for overnight Agency
Debentures and Agency MBS repos closely followed those for Treasury repos. Figure 3 plots
the spread between Agency Debentures and Agency MBS repos and Treasury repos, all of
which have an overnight maturity. As the figure illustrates, except for the period after the
Lehman Brothers bankruptcy, interest rates for these different repos rarely diverged.18
The movement of interest rates in the Bloomberg data is consistent with what we observe
in separate data provided to us by a large investor in tri-party repo. That proprietary data shows
a fall in rates for Treasury, Agency Debentures and Agency MBS tri-party repos that closely
mimics the Bloomberg data. Further, there is a lot of volatility in interest rates for a short
period of time after the bankruptcy of Lehman Brothers. Keeping these general stylized facts
in mind, we now examine haircuts in the tri-party repo market.
17For example, FitchRatings Fund & Asset Manager Rating Group reports in their Money Market Funds U.S.A.Special Report (Oct. 4, 2010) that 81.8% of repo allocations by Fitch-Rated taxable money market funds as ofAugust 31, 2010 were overnight.
18The Lehman Brothers holding company (LBHI) declared bankruptcy on September 15, 2008. For moredetails see section 5.1.
20
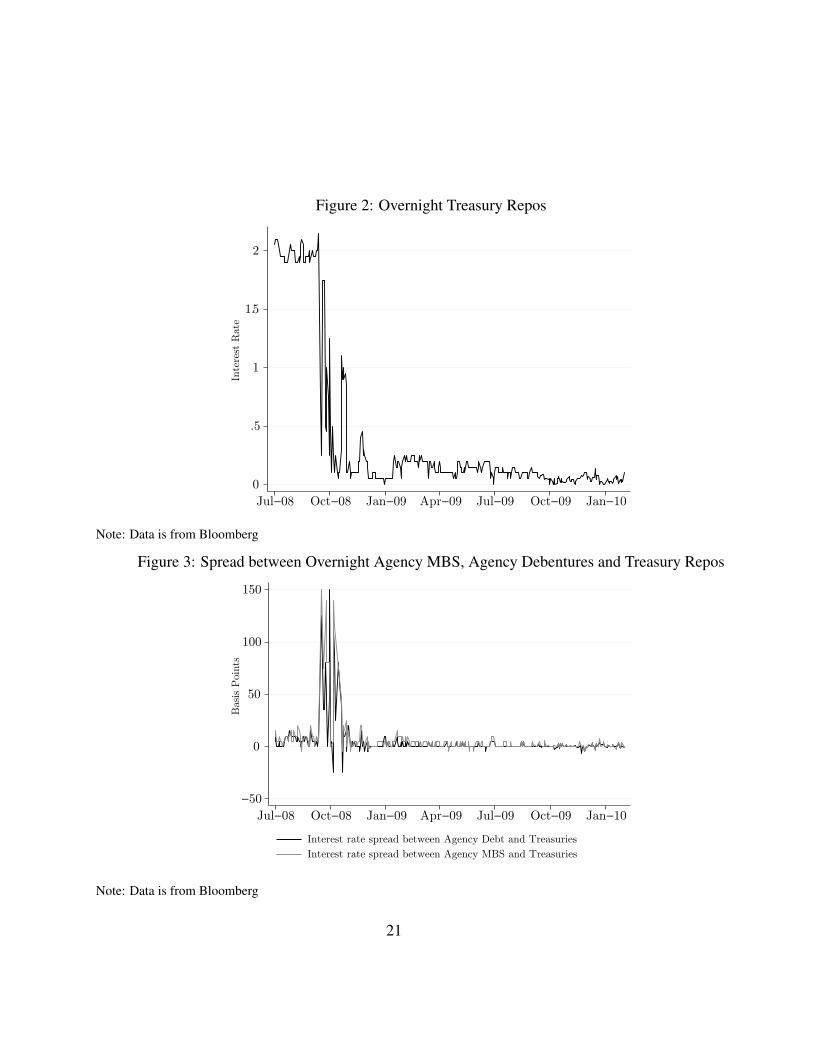
Figure 2: Overnight Treasury Repos
0
.5
1
1.5
2
Inte
rest
Rate
Jul−08 Oct−08 Jan−09 Apr−09 Jul−09 Oct−09 Jan−10
Note: Data is from Bloomberg
Figure 3: Spread between Overnight Agency MBS, Agency Debentures and Treasury Repos
−50
0
50
100
150
Basi
s P
oin
ts
Jul−08 Oct−08 Jan−09 Apr−09 Jul−09 Oct−09 Jan−10
Interest rate spread between Agency Debt and Treasuries
Interest rate spread between Agency MBS and Treasuries
Note: Data is from Bloomberg
21
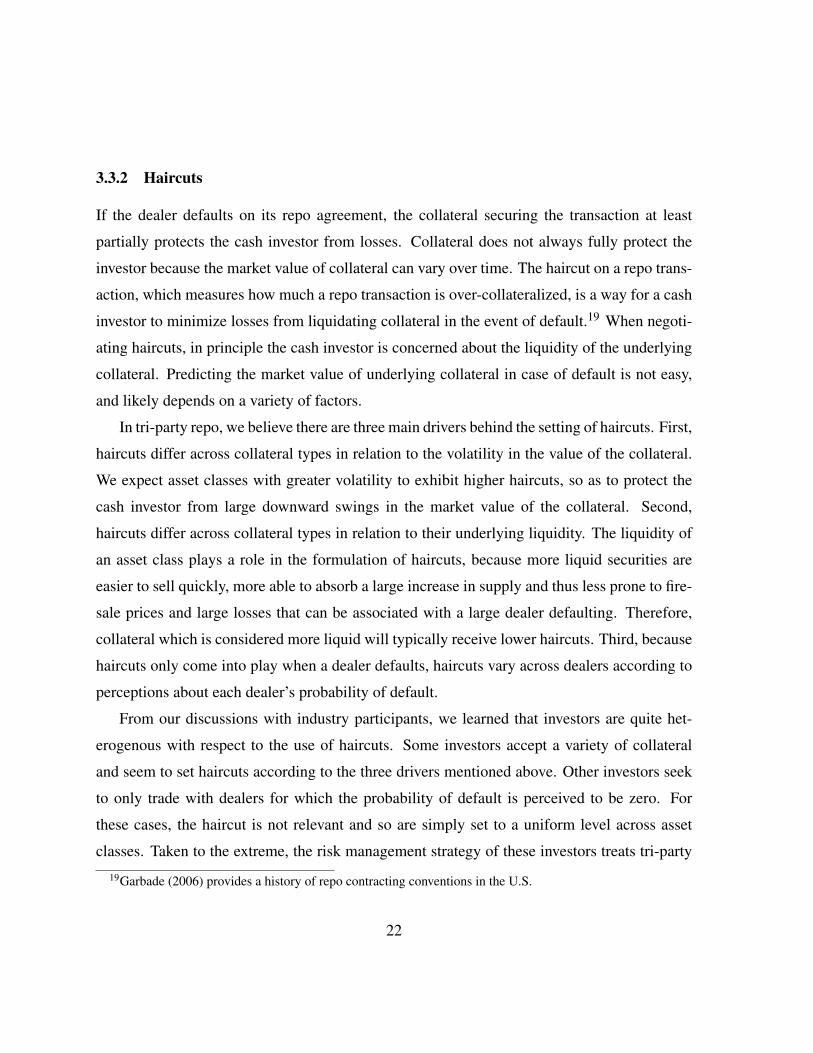
3.3.2 Haircuts
If the dealer defaults on its repo agreement, the collateral securing the transaction at least
partially protects the cash investor from losses. Collateral does not always fully protect the
investor because the market value of collateral can vary over time. The haircut on a repo trans-
action, which measures how much a repo transaction is over-collateralized, is a way for a cash
investor to minimize losses from liquidating collateral in the event of default.19 When negoti-
ating haircuts, in principle the cash investor is concerned about the liquidity of the underlying
collateral. Predicting the market value of underlying collateral in case of default is not easy,
and likely depends on a variety of factors.
In tri-party repo, we believe there are three main drivers behind the setting of haircuts. First,
haircuts differ across collateral types in relation to the volatility in the value of the collateral.
We expect asset classes with greater volatility to exhibit higher haircuts, so as to protect the
cash investor from large downward swings in the market value of the collateral. Second,
haircuts differ across collateral types in relation to their underlying liquidity. The liquidity of
an asset class plays a role in the formulation of haircuts, because more liquid securities are
easier to sell quickly, more able to absorb a large increase in supply and thus less prone to fire-
sale prices and large losses that can be associated with a large dealer defaulting. Therefore,
collateral which is considered more liquid will typically receive lower haircuts. Third, because
haircuts only come into play when a dealer defaults, haircuts vary across dealers according to
perceptions about each dealer’s probability of default.
From our discussions with industry participants, we learned that investors are quite het-
erogenous with respect to the use of haircuts. Some investors accept a variety of collateral
and seem to set haircuts according to the three drivers mentioned above. Other investors seek
to only trade with dealers for which the probability of default is perceived to be zero. For
these cases, the haircut is not relevant and so are simply set to a uniform level across asset
classes. Taken to the extreme, the risk management strategy of these investors treats tri-party
19Garbade (2006) provides a history of repo contracting conventions in the U.S.
22
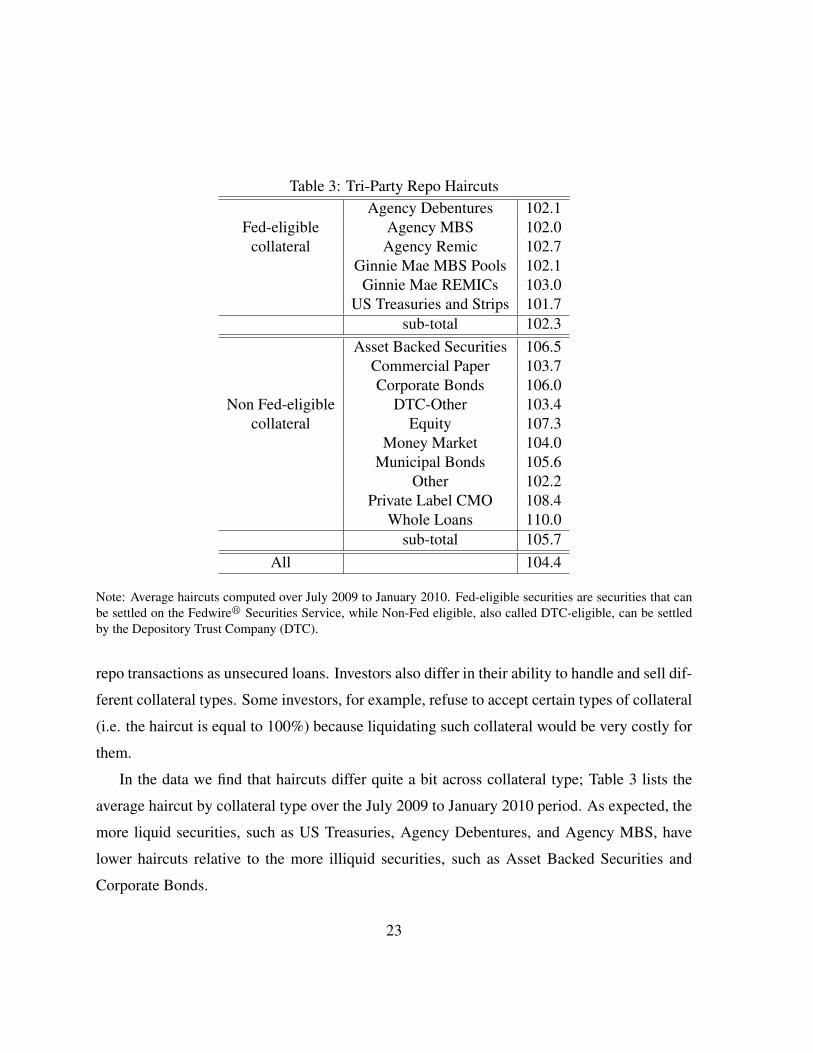
Table 3: Tri-Party Repo HaircutsAgency Debentures 102.1
Fed-eligible Agency MBS 102.0collateral Agency Remic 102.7
Ginnie Mae MBS Pools 102.1Ginnie Mae REMICs 103.0
US Treasuries and Strips 101.7sub-total 102.3
Asset Backed Securities 106.5Commercial Paper 103.7Corporate Bonds 106.0
Non Fed-eligible DTC-Other 103.4collateral Equity 107.3
Money Market 104.0Municipal Bonds 105.6
Other 102.2Private Label CMO 108.4
Whole Loans 110.0sub-total 105.7
All 104.4
Note: Average haircuts computed over July 2009 to January 2010. Fed-eligible securities are securities that canbe settled on the Fedwirer Securities Service, while Non-Fed eligible, also called DTC-eligible, can be settledby the Depository Trust Company (DTC).
repo transactions as unsecured loans. Investors also differ in their ability to handle and sell dif-
ferent collateral types. Some investors, for example, refuse to accept certain types of collateral
(i.e. the haircut is equal to 100%) because liquidating such collateral would be very costly for
them.
In the data we find that haircuts differ quite a bit across collateral type; Table 3 lists the
average haircut by collateral type over the July 2009 to January 2010 period. As expected, the
more liquid securities, such as US Treasuries, Agency Debentures, and Agency MBS, have
lower haircuts relative to the more illiquid securities, such as Asset Backed Securities and
Corporate Bonds.
23
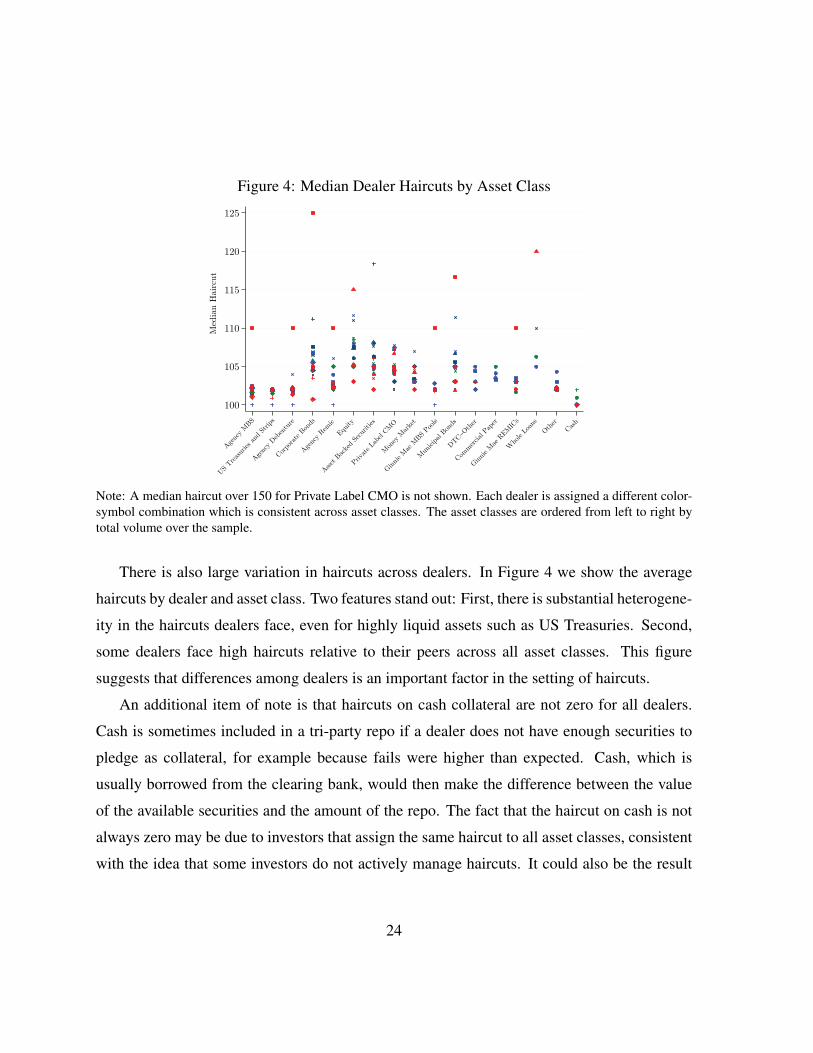
Figure 4: Median Dealer Haircuts by Asset Class
100
105
110
115
120
125M
edia
n H
air
cut
Age
ncy MBS
US Treasur
ies an
d St
rips
Age
ncy Deb
entu
re
Corpo
rate B
onds
Age
ncy Rem
ic
Equ
ity
Asset B
acke
d Se
curities
Priva
te L
abel C
MO
Mon
ey M
arke
t
Ginnie Mae
MBS Poo
ls
Mun
icipal B
onds
DTC−Oth
er
Com
mercial P
aper
Ginnie Mae
REMIC
s
Who
le L
oans
Oth
er
Cash
Note: A median haircut over 150 for Private Label CMO is not shown. Each dealer is assigned a different color-symbol combination which is consistent across asset classes. The asset classes are ordered from left to right bytotal volume over the sample.
There is also large variation in haircuts across dealers. In Figure 4 we show the average
haircuts by dealer and asset class. Two features stand out: First, there is substantial heterogene-
ity in the haircuts dealers face, even for highly liquid assets such as US Treasuries. Second,
some dealers face high haircuts relative to their peers across all asset classes. This figure
suggests that differences among dealers is an important factor in the setting of haircuts.
An additional item of note is that haircuts on cash collateral are not zero for all dealers.
Cash is sometimes included in a tri-party repo if a dealer does not have enough securities to
pledge as collateral, for example because fails were higher than expected. Cash, which is
usually borrowed from the clearing bank, would then make the difference between the value
of the available securities and the amount of the repo. The fact that the haircut on cash is not
always zero may be due to investors that assign the same haircut to all asset classes, consistent
with the idea that some investors do not actively manage haircuts. It could also be the result
24
of cash not being a perfect security.20 Consequently, investors could charge a non-zero haircut
in hopes of discouraging the use of cash collateral. In practice, cash collateral is rarely used in
tri-party repo (see figure 32).
Table 3 and Figure 4 demonstrate that haircuts substantially vary both across collateral
types and dealers. We explore to what degree differences in assets or dealers are driving
the level of haircuts by regressing haircuts on dummies for asset classes and for dealers and
comparing the estimated coefficients. In Table 4 we report the estimated coefficients, where
dealers and assets have both been ranked from the largest to smallest coefficient.
The range of the estimated coefficients on both the dealer and asset dummies are of similar
magnitude. This result suggests that a dealer’s reputation (i.e. its probability of default) has
roughly equal importance as the collateral when determining haircuts in tri-party repo. Given
the existence of collateral, the importance of counterparty risk may seem surprising. The
importance of the counterparty, however, has been highlighted by market participants. For
example, “Craig Delany, a managing director at JPMorgan’s Investment Bank, however, stated
that, in triparty repos, typically investors look to the counterparty (i.e., broker dealer) first and
the collateral second when setting haircuts. In other words, a haircut may not be sufficient for
an investor if it has serious concerns about the viability of its counterparty” (Valukas 2010).
Besides differences in perceived possibilities of default, one possible driver of differences
in haircuts across dealers could be a dealer’s size. Because dealers differ in terms of their
presence in tri-party repo, we also explore if larger dealers negotiate smaller or larger haircuts.
A priori, it is not clear whether dealers with a larger market share would have larger or smaller
haircuts. Haircuts should be increasing in the amount of collateral an investor expects a dealer
to bring to the market, all else equal. After all, if a dealer is financing a large amount of repos
with a specific asset, then if this dealer defaults there will be a huge supply of that asset on
the market. All of this dealer’s investors, then, will face difficulties liquidating that asset at
20Perfecting a security means that a party has taken all the legal steps necessary to establish a lien againstthe security. This is straightforward to do with non-cash collateral, and more difficult to accomplish with cashcollateral.
25
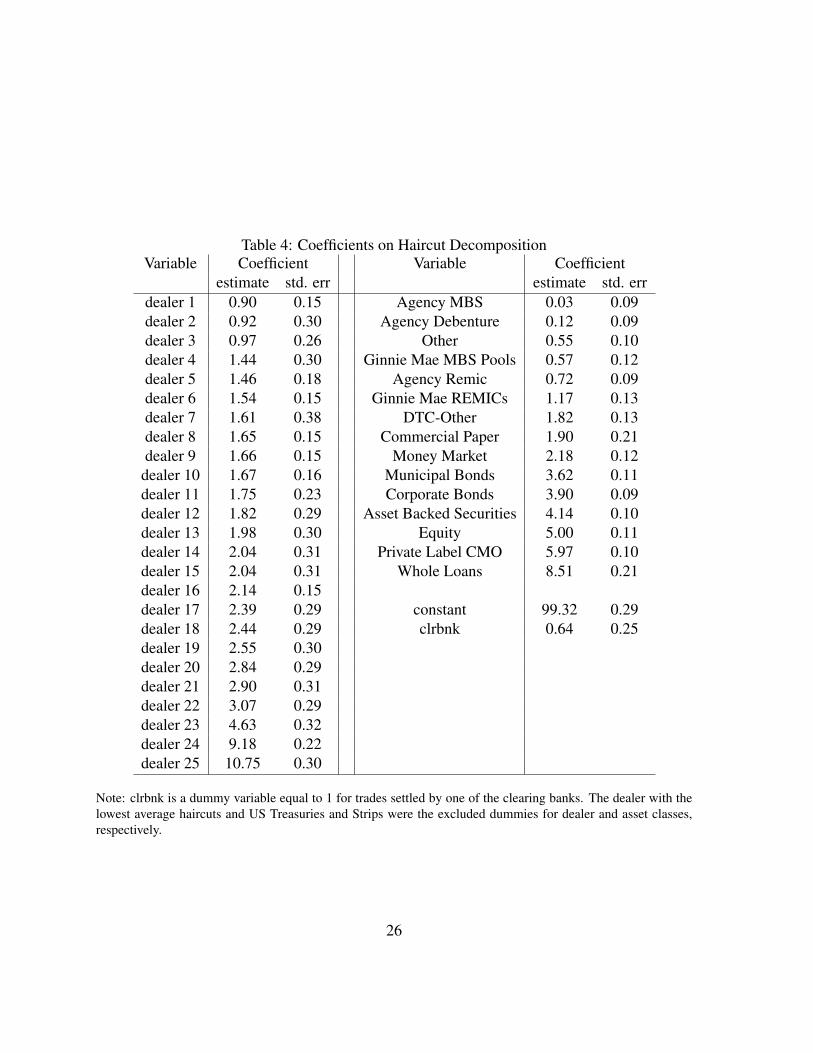
Table 4: Coefficients on Haircut DecompositionVariable Coefficient Variable Coefficient
estimate std. err estimate std. errdealer 1 0.90 0.15 Agency MBS 0.03 0.09dealer 2 0.92 0.30 Agency Debenture 0.12 0.09dealer 3 0.97 0.26 Other 0.55 0.10dealer 4 1.44 0.30 Ginnie Mae MBS Pools 0.57 0.12dealer 5 1.46 0.18 Agency Remic 0.72 0.09dealer 6 1.54 0.15 Ginnie Mae REMICs 1.17 0.13dealer 7 1.61 0.38 DTC-Other 1.82 0.13dealer 8 1.65 0.15 Commercial Paper 1.90 0.21dealer 9 1.66 0.15 Money Market 2.18 0.12dealer 10 1.67 0.16 Municipal Bonds 3.62 0.11dealer 11 1.75 0.23 Corporate Bonds 3.90 0.09dealer 12 1.82 0.29 Asset Backed Securities 4.14 0.10dealer 13 1.98 0.30 Equity 5.00 0.11dealer 14 2.04 0.31 Private Label CMO 5.97 0.10dealer 15 2.04 0.31 Whole Loans 8.51 0.21dealer 16 2.14 0.15dealer 17 2.39 0.29 constant 99.32 0.29dealer 18 2.44 0.29 clrbnk 0.64 0.25dealer 19 2.55 0.30dealer 20 2.84 0.29dealer 21 2.90 0.31dealer 22 3.07 0.29dealer 23 4.63 0.32dealer 24 9.18 0.22dealer 25 10.75 0.30
Note: clrbnk is a dummy variable equal to 1 for trades settled by one of the clearing banks. The dealer with thelowest average haircuts and US Treasuries and Strips were the excluded dummies for dealer and asset classes,respectively.
26
non-fire sale prices. On the other hand, dealers who are considered safer may negotiate lower
haircuts and then use tri-party repo to a larger extent relative to their risky peers. In this case,
dealers with a larger market share would be associated with lower haircuts.
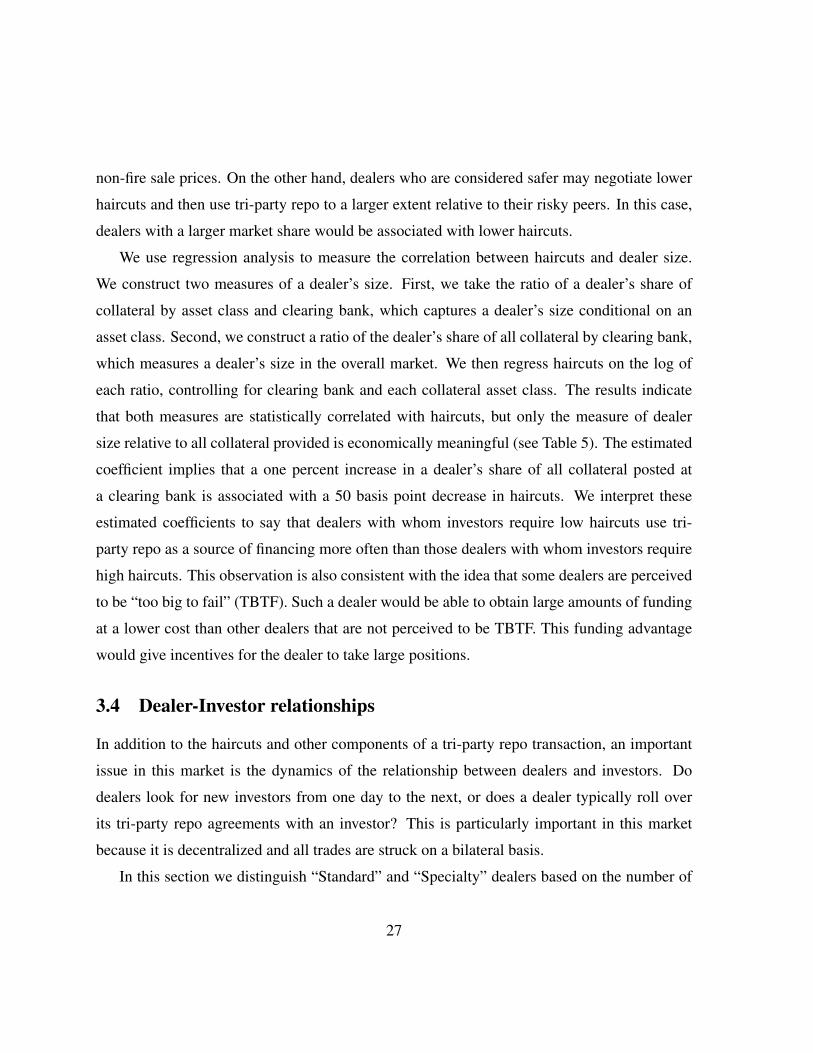
We use regression analysis to measure the correlation between haircuts and dealer size.
We construct two measures of a dealer’s size. First, we take the ratio of a dealer’s share of
collateral by asset class and clearing bank, which captures a dealer’s size conditional on an
asset class. Second, we construct a ratio of the dealer’s share of all collateral by clearing bank,
which measures a dealer’s size in the overall market. We then regress haircuts on the log of
each ratio, controlling for clearing bank and each collateral asset class. The results indicate
that both measures are statistically correlated with haircuts, but only the measure of dealer
size relative to all collateral provided is economically meaningful (see Table 5). The estimated
coefficient implies that a one percent increase in a dealer’s share of all collateral posted at
a clearing bank is associated with a 50 basis point decrease in haircuts. We interpret these
estimated coefficients to say that dealers with whom investors require low haircuts use tri-
party repo as a source of financing more often than those dealers with whom investors require
high haircuts. This observation is also consistent with the idea that some dealers are perceived
to be “too big to fail” (TBTF). Such a dealer would be able to obtain large amounts of funding
at a lower cost than other dealers that are not perceived to be TBTF. This funding advantage
would give incentives for the dealer to take large positions.
3.4 Dealer-Investor relationships
In addition to the haircuts and other components of a tri-party repo transaction, an important
issue in this market is the dynamics of the relationship between dealers and investors. Do
dealers look for new investors from one day to the next, or does a dealer typically roll over
its tri-party repo agreements with an investor? This is particularly important in this market
because it is decentralized and all trades are struck on a bilateral basis.
In this section we distinguish “Standard” and “Specialty” dealers based on the number of
27
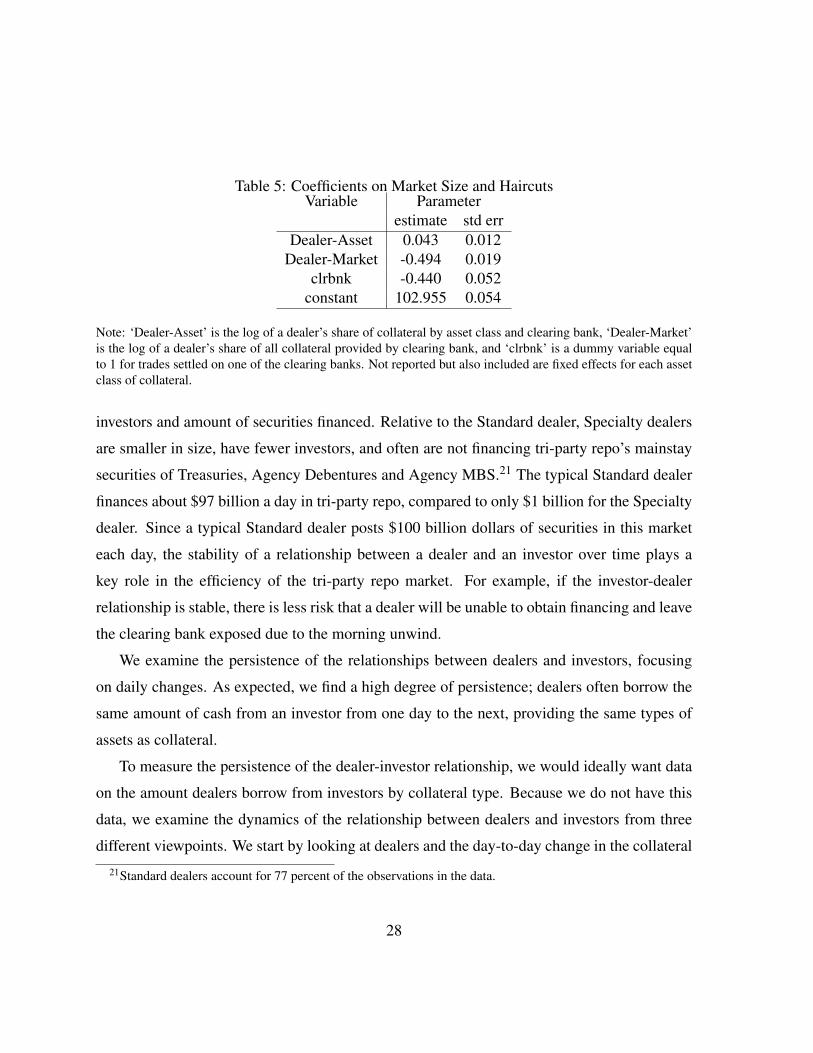
Table 5: Coefficients on Market Size and HaircutsVariable Parameter
estimate std errDealer-Asset 0.043 0.012
Dealer-Market -0.494 0.019clrbnk -0.440 0.052
constant 102.955 0.054
Note: ‘Dealer-Asset’ is the log of a dealer’s share of collateral by asset class and clearing bank, ‘Dealer-Market’is the log of a dealer’s share of all collateral provided by clearing bank, and ‘clrbnk’ is a dummy variable equalto 1 for trades settled on one of the clearing banks. Not reported but also included are fixed effects for each assetclass of collateral.
investors and amount of securities financed. Relative to the Standard dealer, Specialty dealers
are smaller in size, have fewer investors, and often are not financing tri-party repo’s mainstay
securities of Treasuries, Agency Debentures and Agency MBS.21 The typical Standard dealer
finances about $97 billion a day in tri-party repo, compared to only $1 billion for the Specialty
dealer. Since a typical Standard dealer posts $100 billion dollars of securities in this market
each day, the stability of a relationship between a dealer and an investor over time plays a
key role in the efficiency of the tri-party repo market. For example, if the investor-dealer
relationship is stable, there is less risk that a dealer will be unable to obtain financing and leave
the clearing bank exposed due to the morning unwind.
We examine the persistence of the relationships between dealers and investors, focusing
on daily changes. As expected, we find a high degree of persistence; dealers often borrow the
same amount of cash from an investor from one day to the next, providing the same types of
assets as collateral.
To measure the persistence of the dealer-investor relationship, we would ideally want data
on the amount dealers borrow from investors by collateral type. Because we do not have this
data, we examine the dynamics of the relationship between dealers and investors from three
different viewpoints. We start by looking at dealers and the day-to-day change in the collateral
21Standard dealers account for 77 percent of the observations in the data.
28
they post. We then look at investors and the day-to-day change in the collateral they accept.
Finally, we look at the investor data from clearing bank B, where we observe the total amount
of cash a dealer borrows from a specific investor.
As seen in Figure 1, the aggregate amount of collateral dealers post in the tri-party repo
market is fairly consistent from day to day. This suggests the market is relatively stable, in
that dealers are able to finance a similar amount of securities from one day to the next. To
better understand the changes in collateral posted, we decompose this daily change into an
extensive and intensive margin. Changes in the extensive margin reflect the dealer no longer
financing an asset class from the previous day or beginning to finance an asset class that was
not financed the previous day. Changes on the intensive margin correspond to changes in the
value of collateral posted for an asset class, conditional on the dealer posting collateral in the
same asset class on the previous business day.22 We take the absolute value of these changes
and sum across dealers to analyze which margin drives the changes in collateral posted. In
the top panel of Figure 5 we plot the absolute value of the daily change in collateral, summed
across dealers. Then in the bottom two panels of Figure 5, we plot the decomposition of these
changes into the intensive and extensive margins. These figures clearly show that the intensive
margin drives the daily change in collateral posted. Hence, dealers typically finance the same
asset classes in tri-party but change the exact daily amount of each asset class.
A problem with measuring the extensive and intensive margins is that our data mixes
overnight and term lending. Because of term loans, investors may require more than one
day to terminate lending to a dealer. For these cases, only the last day of lending would be
attributed to the extensive margin. To address this issue, we look more closely at changes on
the intensive margin. Specifically, large changes on the intensive margin would signal that
investors and dealers are not rolling over their trades from one day to the next, but continually
juggling their financing.
22A dealer could be financing the same portfolio of securities every day, but changes in the market prices ofthis portfolio could result in differing valuations of the portfolio each day that we would observe as changes onthe intensive margin.
29
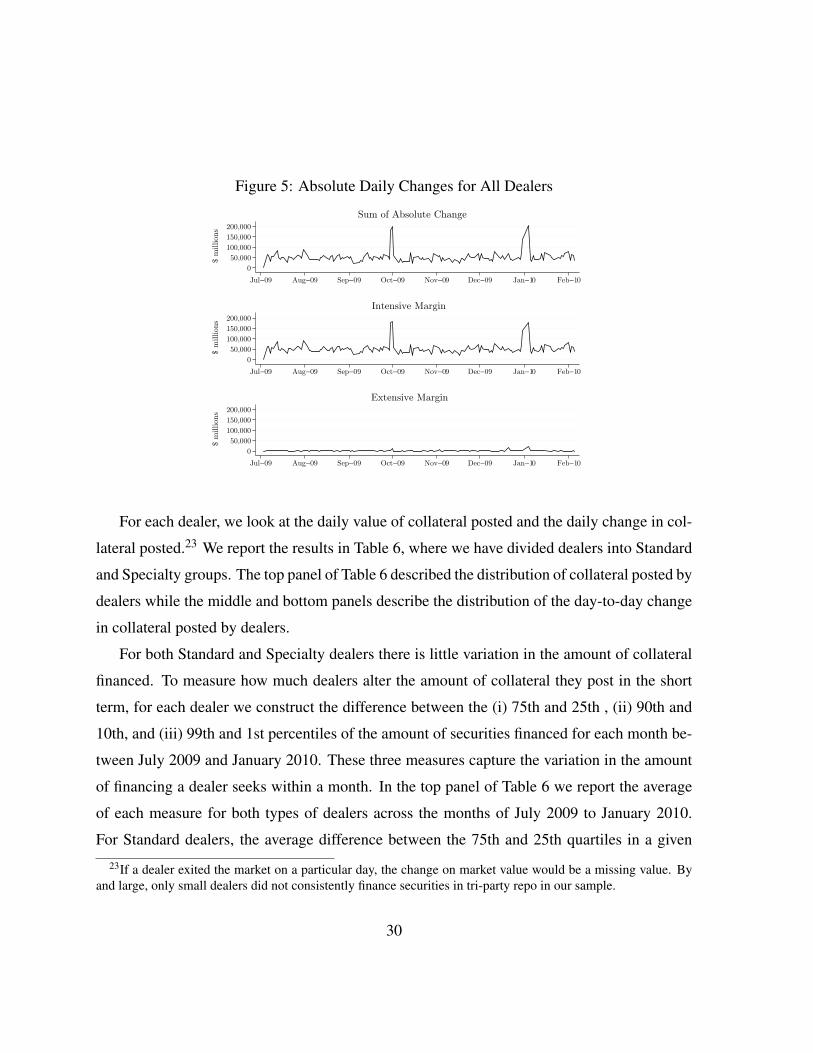
Figure 5: Absolute Daily Changes for All Dealers
0
50,000
100,000
150,000
200,000
$ m
illions
Jul−09 Aug−09 Sep−09 Oct−09 Nov−09 Dec−09 Jan−10 Feb−10
Sum of Absolute Change
0
50,000
100,000
150,000
200,000
$ m
illions
Jul−09 Aug−09 Sep−09 Oct−09 Nov−09 Dec−09 Jan−10 Feb−10
Intensive Margin
0
50,000
100,000
150,000
200,000
$ m
illions
Jul−09 Aug−09 Sep−09 Oct−09 Nov−09 Dec−09 Jan−10 Feb−10
Extensive Margin
For each dealer, we look at the daily value of collateral posted and the daily change in col-
lateral posted.23 We report the results in Table 6, where we have divided dealers into Standard
and Specialty groups. The top panel of Table 6 described the distribution of collateral posted by
dealers while the middle and bottom panels describe the distribution of the day-to-day change
in collateral posted by dealers.
For both Standard and Specialty dealers there is little variation in the amount of collateral
financed. To measure how much dealers alter the amount of collateral they post in the short
term, for each dealer we construct the difference between the (i) 75th and 25th , (ii) 90th and
10th, and (iii) 99th and 1st percentiles of the amount of securities financed for each month be-
tween July 2009 and January 2010. These three measures capture the variation in the amount
of financing a dealer seeks within a month. In the top panel of Table 6 we report the average
of each measure for both types of dealers across the months of July 2009 to January 2010.
For Standard dealers, the average difference between the 75th and 25th quartiles in a given
23If a dealer exited the market on a particular day, the change on market value would be a missing value. Byand large, only small dealers did not consistently finance securities in tri-party repo in our sample.
30
month is $5.6 billion, a fairly small difference given that the typical Standard dealer finances
almost $100 billion. Looking at the tails of the distribution reinforces the claim that dealers
borrow consistent sums in the short term. Indeed, for the (90th,10th) and (99th,1th) percentile
measures, the average difference is $10 and $15 billion, respectively. Similar results hold for
Specialty dealers, suggesting that within a given month, dealers only rarely decide to substan-
tially change how much they finance in tri-party repo. One exception to this occurs at the
end of quarters, as seen in Figure 1. These declines in tri-party volume are likely driven by
window-dressing prior to quarterly reporting dates by dealers.
Reinforcing this point, the daily change in total securities that Standard dealers finance
ticked up about $6 million a day, or 0.02 percent (see the middle and bottom panels of Table 6).
Looking at day-to-day changes, we see a fairly steady amount of securities being financed.
Indeed, the difference between the 75th and 25th quartile on the distribution of the daily change
in collateral posted is $4 billion, a paltry 5 percent of the median value of a typical dealer’s
securities. Turning to the tails of the distribution, the difference between the 99th and 1st
percentiles is $15 billion. Once again, given the almost $100 billion of collateral posted on the
tri-party repo market by the average dealer, there is relatively little day-to-day variation in the
amount a dealer finances.
Finally, we also compute the daily change in the amount a dealer finances for each asset
class. This might be important, because in reaction to negative news, an investor may ask
for higher quality collateral. Hence, a dealer still might borrow the same amount of cash from
day-to-day, but be required to post higher quality collateral. For the most part, even at this level
of detail, there is little day-to-day change in the amount financed. The median daily change
is $0, and the difference between the 75th and 25th quartiles on the distribution of the daily
change in securities financed is $180 million, about 7 percent of the average value invested
at the dealer-asset class level. Unlike at the dealer level, however, we do see more dramatic
changes in the tail of the distribution. The difference between the 99th and 1st percentiles is
$1.1 billion, or 43 percent of the average amount financed at the dealer-asset class level.
31
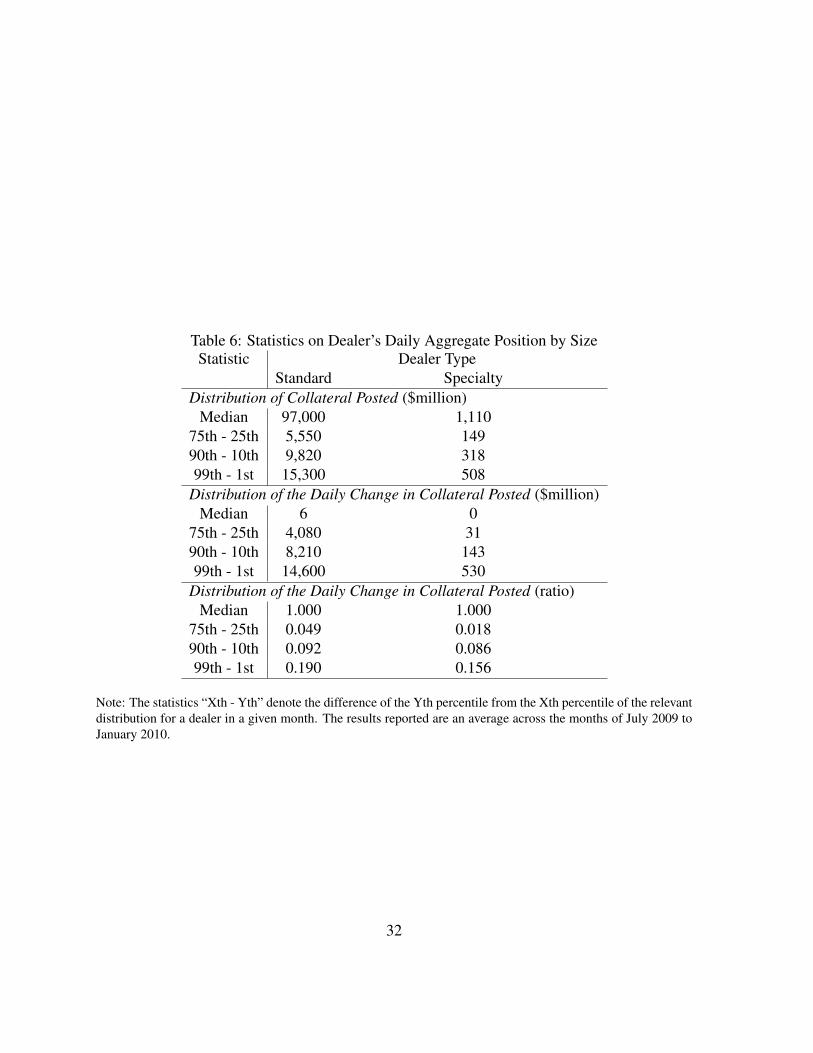
Table 6: Statistics on Dealer’s Daily Aggregate Position by SizeStatistic Dealer Type
Standard SpecialtyDistribution of Collateral Posted ($million)
Median 97,000 1,11075th - 25th 5,550 14990th - 10th 9,820 31899th - 1st 15,300 508
Distribution of the Daily Change in Collateral Posted ($million)Median 6 0
75th - 25th 4,080 3190th - 10th 8,210 14399th - 1st 14,600 530
Distribution of the Daily Change in Collateral Posted (ratio)Median 1.000 1.000
75th - 25th 0.049 0.01890th - 10th 0.092 0.08699th - 1st 0.190 0.156
Note: The statistics “Xth - Yth” denote the difference of the Yth percentile from the Xth percentile of the relevantdistribution for a dealer in a given month. The results reported are an average across the months of July 2009 toJanuary 2010.
32
The above analysis confirms that dealers typically borrow the roughly same amount from
day-to-day, and do so using essentially the same portfolio of general collateral. Hence there is
substantial stability on the dealer-side of the market from day-to-day, implying a predictable
amount of securities are supplied to the tri-party repo market. Nevertheless, these statistics do
not directly address the investor’s side of the market. Do investors typically lend to the same
set of dealers? To answer this question, we first examine whether investors invest the same
amount of cash from day-to-day, using all our investor data. Next, using a subset of the data
from one clearing bank, we examine whether investors loan the same amount to a dealer from
day-to-day.
Given the heterogeneity on the investor side, we group investors into quartiles based on the
daily amount invested. We look first at investors grouped by amount invested. For the group
of smallest investors, the typical total cash amount loaned is $13 million a day (see Table 7).
In contrast, for the largest investor group, the typical investor loans $19 billion a day. Like
dealers, investors do not often significantly change the amount they invest in the tri-party repo
market from day-to-day. For all groups of investors, the median change in amount invested
is $0, and the difference between the 75th and 25th quartiles on the distribution of the daily
change in amount invested is a small amount for each investor group. Unlike dealers, however,
we do see large changes in the amount loaned from day-to-day in the tail of the distribution.
With the exception of the smallest investors, the difference between 90th and 10th percentiles
as well as the 99th and 1st percentiles is fairly large both in level and percentage terms (see the
middle and bottom panels of Table 7). Hence, investors do make large changes to the amount
of cash they lend in tri-party repo, albeit rarely.
Interestingly, the smallest group of investors acts quite differently from larger investors,
and provide extraordinarily stable funding. One explanation for this difference could be the
predictability of payment flows for smaller investors relative to larger investors. If payment
flows are more predictable for smaller investors, it could be easier for them to select the amount
they would like to continually roll over in tri-party or to use term contracts versus overnight
33

Table 7: Statistics on Investor’s Daily Aggregate Position by SizeStatistic Firm Size (from low to high)
Quartile 1 Quartile 2 Quartile 3 Quartile 4Distribution of Daily Amount Invested ($million)
Median 13.3 200 1,180 19,00075th - 25th 0.051 34 175 1,63090th - 10th 0.120 73 331 3,08099th - 1st 0.268 100 530 4,380
Distribution of the Change in Daily Amount Invested ($million)Median 0 0 0 0
75th - 25th 0 11 54 98090th - 10th 0 50 200 2,23099th - 1st 0 125 478 4,430
Distribution of the Change in Daily Amount Invested (ratio)Median 1.000 1.000 1.000 1.000
75th - 25th 0.000 0.060 0.042 0.05290th - 10th 0.000 0.257 0.161 0.11999th - 1st 0.066 0.610 0.451 0.229
Note: The statistics “Xth - Yth” denote the difference of the Yth percentile from the Xth percentile of the relevantdistribution for an investor in a given month. The results reported are an average across the months of July 2009to January 2010.
34
deals.
Looking further into the stability of the investor-dealer relationship, we examine the in-
vestor data from clearing bank B, which links investors and dealers. We compute the same
type of statistics described previously, and report them conditioning on the size of the investor-
dealer relationship. The smallest investor-dealer trades average $40 million, while the largest
average $3 billion (see the top panel of Table 8). Our measures of stability in funding mimic
those computed for investors overall. The typical investor-dealer relationship is stable the ma-
jority of the time. While not commonplace, there are large daily changes in the amount loaned.
Looking at the distribution of the change in the daily amount invested, the difference between
the 90th and 10th percentiles is about 15 percent of the median amount invested (see the middle
and bottom panels of Table 8).
An exception to the stability of funding at an investor-dealer level around September 15,
2008, when Lehman Brothers declared bankruptcy. During that time, the number of investors
Lehman receives cash from declines precipitously. We take a closer look at the tri-party repo
market during the height of the financial crisis in section 5.
Overall the data suggest dealers and investors form long-term relationships where repos do
not change much on a daily basis. In times of stability, dealers are usually posting the same
amount of collateral and investors are lending the same amount of cash. Further, the day-to-
day change in collateral posted and cash lent is remarkably small in most cases. There are,
however, unusual instances where there are large changes in the amount of cash lent (and so
collateral posted). While some of these instances of large changes in tri-party volume may
be routine (e.g. end of quarter effects by dealers), other instances may be related to concerns
about counterparty or credit risk.
4 Fragility in the tri-party repo market
The FRBNY white paper notes three weaknesses of the tri-party repo market: 1) the market’s
reliance on intraday clearing bank credit, 2) the pro-cyclicality of risk management practices,
35
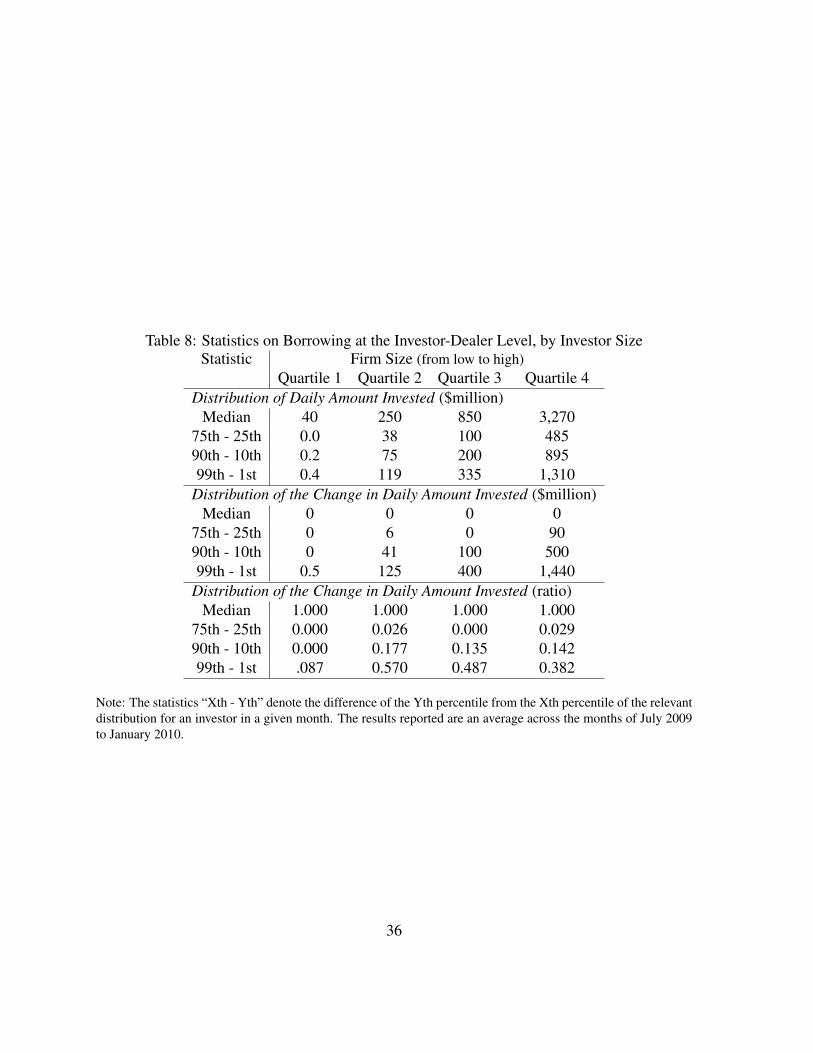
Table 8: Statistics on Borrowing at the Investor-Dealer Level, by Investor SizeStatistic Firm Size (from low to high)
Quartile 1 Quartile 2 Quartile 3 Quartile 4Distribution of Daily Amount Invested ($million)
Median 40 250 850 3,27075th - 25th 0.0 38 100 48590th - 10th 0.2 75 200 89599th - 1st 0.4 119 335 1,310
Distribution of the Change in Daily Amount Invested ($million)Median 0 0 0 0
75th - 25th 0 6 0 9090th - 10th 0 41 100 50099th - 1st 0.5 125 400 1,440
Distribution of the Change in Daily Amount Invested (ratio)Median 1.000 1.000 1.000 1.000
75th - 25th 0.000 0.026 0.000 0.02990th - 10th 0.000 0.177 0.135 0.14299th - 1st .087 0.570 0.487 0.382
Note: The statistics “Xth - Yth” denote the difference of the Yth percentile from the Xth percentile of the relevantdistribution for an investor in a given month. The results reported are an average across the months of July 2009to January 2010.
36
3) the lack of effective and transparent plans to support orderly liquidation of a defaulted
dealer’s collateral. During the crisis, a concern was that investor’s confidence in the market
may erode to the point that they would no longer want to finance any dealer through tri-party
repo. In this section, we focus more specicifally on the fragility introduced by the reliance on
intraday credit from the clearing bank.
4.1 The risk of investor runs
The similarities between financing securities with repo contracts and banking have been pointed
out in several papers (see Duffie 2010, Gorton and Metrick 2009, Martin, Skeie, and von
Thadden 2010). These papers suggest that repos could be subject to the risk of runs, similar
to those that threaten banks. Some papers, such as Gorton and Metrick (2009) emphasize the
risk of “haircut spirals” similar to the phenomenon described in Geanakoplos (2003) or Brun-
nermeier and Pedersen (2009). In contrast, Duffie (2010) and Martin, Skeie, and von Thadden
(2010) describe runs that are similar to standard bank runs. In this section, and in section 5,
we provide evidence that runs in the tri-party repo market resemble standard bank runs, and
are thus different from runs in other repo markets. Several features of the tri-party repo market
before the reforms made it particularly susceptible to runs; some are related to the nature and
behavior of the cash investors while others are related to the mechanics of the tri-party repo
market.
As noted previously, some tri-party repo investors focus on the quality of their counterparty
first, rather than the collateral. These investors would prefer to withdraw their funding to a
troubled dealer even against high quality securities. This is what happened to Bear Stearns
as “repo market lenders declined to roll over or renew repo loans, even when the loans were
supported by high-quality collateral such as agency securities” (Friedman 2010). It may seem
surprising that investors would refuse to finance high-quality securities since the risk of loss
appears to be very small and, in any case, the investor could increase margins to protect itself.
There is, however, some uncertainty associated with the process of taking possession of the
37
collateral and liquidating it. A security that is virtually free of credit risk, such as an agency
security, may still be subject to liquidity, market, or interest rate risk. Even if this risk is
very small, an investor would likely prefer to invest in a safe rather than a troubled collateral
provider (see also Duffie 2010). Some investors lacked expertise of access to liquidity that
would have facilitated an orderly liquidation of collateral. For such investors, the risks were
not negligible.
In addition, major categories of tri-party repo investors, such as money market mutual
funds and commingled securities lending cash reinvestment pools, have to worry that they
may face withdrawal pressures from their own investors. As a result, they are very intolerant
of liquidity and credit risk. Upon learning that a money fund in which they have invested is
financing a dealer perceived to be having creditworthiness issues or was financing a dealer now
in default, these investors may preemptively withdraw their funds, regardless of the risk that
liquidating the collateral actually represents. This “headline” risk, the risk that a money fund
may find itself in the headline of a news story, is another reason why money funds may prefer
not to finance a dealer, even against high quality collateral.
While investors could ask for higher haircuts to protect themselves, we show in section 5
that haircuts in the tri-party repo market barely increased during the crisis. This suggests that
the tri-party repo market did not experience the type of margin spirals described theoretically
in Geanakoplos (2003) or Brunnermeier and Pedersen (2009). Instead, a run in the tri-party
repo market appears more likely to look like a run on a bank.
4.1.1 The role of the morning unwind
Because of the unwind of all repos in the morning, assuming it occurs, cash investors who
choose not to roll over their loans are protected from the consequence of their decisions. In
other words, they are protected from the risk that the collateral provider is unable to roll over its
financing. Assume a cash investor does not roll over its repo to the collateral provider. In such
a case, the collateral provider must either find a new investor, liquidate some of its securities,
38
or default. If there were no unwind, then a cash investor that tried to withdraw its funding
would only be able to do so if the dealer does not default. If the dealer did default, the cash
investor would be unable to withdraw cash and would have to take possession of the collateral
backing its repo. Since the decision to withdraw funding can be a contributing cause to the
collateral provider’s default, cash investors would be exposed to the risk they create when they
try to withdraw funding. This may make cash investors more reluctant to invest in repos but,
once they have made an investment, it could limit the risk that investors withdraw their funds
precipitously.
Since there is a morning unwind, in contrast, the clearing bank assumes all the risk that
the dealer cannot fund itself the next evening. Hence, once the unwind has occurred, cash
investors with overnight or open repos face no risk if they choose to withdraw their funding.
As such, they are in a situation that is similar to that of bank depositors, in many respects. The
unwind is also likely to reduce the investors’ incentives to monitor the dealer’s quality, since
the benefits of monitoring are shared with the clearing banks.
A simple model can illustrate the role of the unwind in exacerbating the fragility of the
market.24 Consider a hypothetical dealer that currently has three investors. Each investor
provided financing for one period (last night) and must decide whether to re-invest with the
dealer (tonight). Assume that the dealer survives if at least two investors re-invest. Otherwise
the dealer defaults. The investors are identical. In making their decision to re-invest, the
investors consider the following payoffs: An investor gets a payoff S, for ‘success’, if she
invests and the dealer survives; O, for ‘out’, if she does not invest and is able to get her cash
back; and F , for ‘fail’, if she invests but the dealer is forced to default or if she chooses not to
invest but is unable to get her cash out. Whether an investor who does not wants to re-invest
is able to obtain its cash depends on the “microstructure” of the market, which is explored in
details below. Assume S > O > F , which reflects the fact that, on the one hand, investors prefer
to invest in a surviving dealers rather than keep their cash uninvited (S > O), and, on the other
24Martin, Skeie, and von Thadden (2010) provide a more general model.
39
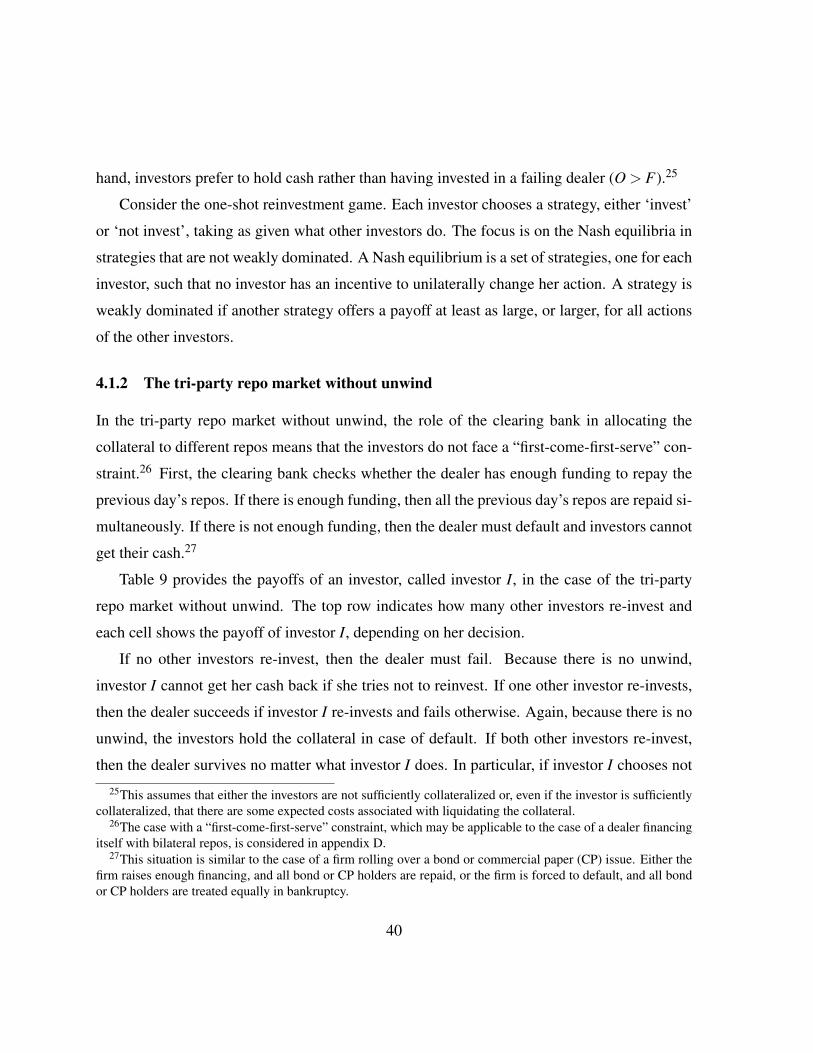
hand, investors prefer to hold cash rather than having invested in a failing dealer (O > F).25
Consider the one-shot reinvestment game. Each investor chooses a strategy, either ‘invest’
or ‘not invest’, taking as given what other investors do. The focus is on the Nash equilibria in
strategies that are not weakly dominated. A Nash equilibrium is a set of strategies, one for each
investor, such that no investor has an incentive to unilaterally change her action. A strategy is
weakly dominated if another strategy offers a payoff at least as large, or larger, for all actions
of the other investors.
4.1.2 The tri-party repo market without unwind
In the tri-party repo market without unwind, the role of the clearing bank in allocating the
collateral to different repos means that the investors do not face a “first-come-first-serve” con-
straint.26 First, the clearing bank checks whether the dealer has enough funding to repay the
previous day’s repos. If there is enough funding, then all the previous day’s repos are repaid si-
multaneously. If there is not enough funding, then the dealer must default and investors cannot
get their cash.27
Table 9 provides the payoffs of an investor, called investor I, in the case of the tri-party
repo market without unwind. The top row indicates how many other investors re-invest and
each cell shows the payoff of investor I, depending on her decision.
If no other investors re-invest, then the dealer must fail. Because there is no unwind,
investor I cannot get her cash back if she tries not to reinvest. If one other investor re-invests,
then the dealer succeeds if investor I re-invests and fails otherwise. Again, because there is no
unwind, the investors hold the collateral in case of default. If both other investors re-invest,
then the dealer survives no matter what investor I does. In particular, if investor I chooses not
25This assumes that either the investors are not sufficiently collateralized or, even if the investor is sufficientlycollateralized, that there are some expected costs associated with liquidating the collateral.
26The case with a “first-come-first-serve” constraint, which may be applicable to the case of a dealer financingitself with bilateral repos, is considered in appendix D.
27This situation is similar to the case of a firm rolling over a bond or commercial paper (CP) issue. Either thefirm raises enough financing, and all bond or CP holders are repaid, or the firm is forced to default, and all bondor CP holders are treated equally in bankruptcy.
40
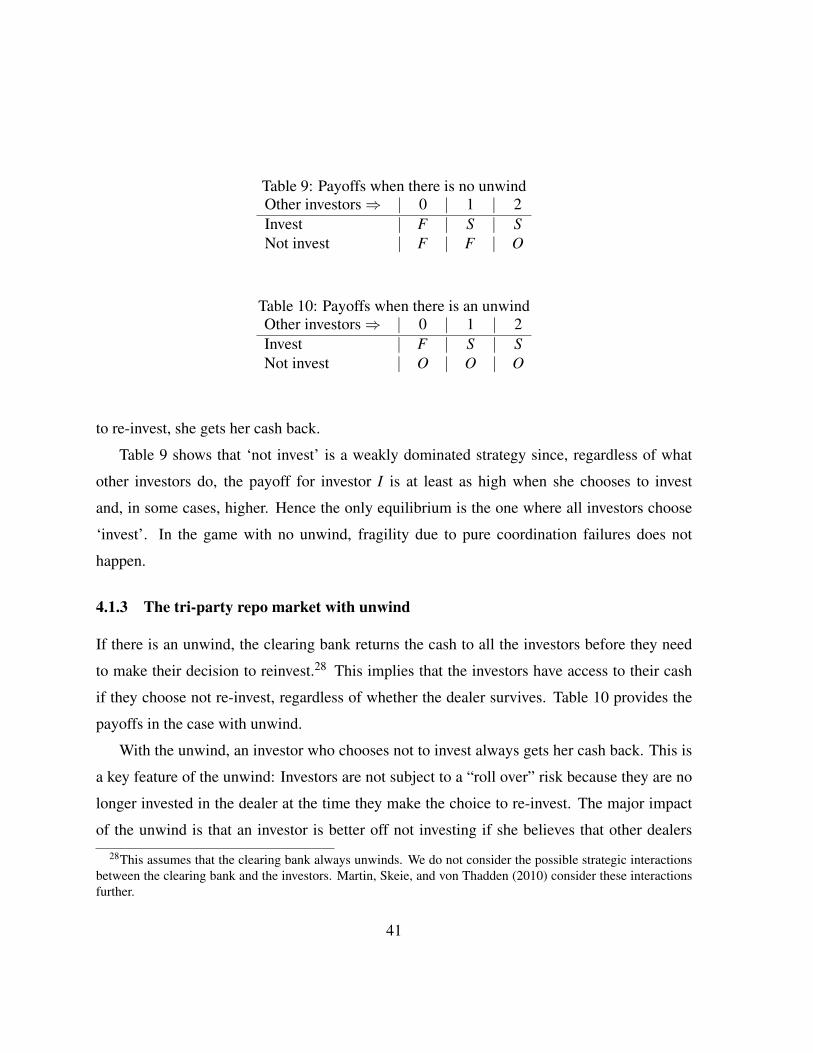
Table 9: Payoffs when there is no unwindOther investors ⇒ | 0 | 1 | 2Invest | F | S | SNot invest | F | F | O
Table 10: Payoffs when there is an unwindOther investors ⇒ | 0 | 1 | 2Invest | F | S | SNot invest | O | O | O
to re-invest, she gets her cash back.
Table 9 shows that ‘not invest’ is a weakly dominated strategy since, regardless of what
other investors do, the payoff for investor I is at least as high when she chooses to invest
and, in some cases, higher. Hence the only equilibrium is the one where all investors choose
‘invest’. In the game with no unwind, fragility due to pure coordination failures does not
happen.
4.1.3 The tri-party repo market with unwind
If there is an unwind, the clearing bank returns the cash to all the investors before they need
to make their decision to reinvest.28 This implies that the investors have access to their cash
if they choose not re-invest, regardless of whether the dealer survives. Table 10 provides the
payoffs in the case with unwind.
With the unwind, an investor who chooses not to invest always gets her cash back. This is
a key feature of the unwind: Investors are not subject to a “roll over” risk because they are no
longer invested in the dealer at the time they make the choice to re-invest. The major impact
of the unwind is that an investor is better off not investing if she believes that other dealers
28This assumes that the clearing bank always unwinds. We do not consider the possible strategic interactionsbetween the clearing bank and the investors. Martin, Skeie, and von Thadden (2010) consider these interactionsfurther.
41
will not invest, since O > F . Hence, pure coordination failures are possible because it is an
equilibrium for all investors not to invest. Of course, it is also an equilibrium for all investors
to choose ‘invest’. The main message of this simple example is that the unwind introduces a
source of fragility in the market.
The proposed reforms aim for the “practical elimination” of intraday credit provided by
the clearing banks and, thus, of the unwind. The elimination of the unwind should improve
the stability of the tri-party repo market by making investors bear some of the consequences
of their decisions to withdraw funding. However, while this reform may reduce the risk of run,
it will not eliminate it. Indeed, an investor that chooses to withdraw its funding because of
concerns about a dealer may still be able to withdraw funding before the dealer defaults. This
investor would be in a better position than investors that wait. In other words, the elimination
of the unwind may eliminate the pure coordination runs as modeled by Diamond and Dybvig
(1983) or Martin, Skeie, and von Thadden (2010). However, information based runs, of the
type modeled by Chari and Jagannathan (1988) or Morris and Shin (2009) could still arise.
4.2 The hand-off of risk between investors an clearing banks
In addition to the risks noted in the previous section, the unwind can potentially create a per-
verse dynamic between investors and a clearing bank, which could result in a pull-back of
funding to a collateral provider that is similar to a run. In the previous section, we assumed
that the clearing bank would always unwind. However, a clearing bank may choose not to
unwind the repos of a dealer if it fears that the dealer cannot obtain funding.
Every morning, the unwind transfers the risk of default of a dealer from the cash investors
to the clearing bank. In the afternoon, the risk is transferred from the clearing bank to (a
potentially new set of) cash investors, provided the dealer was able to obtain funding. This
hand-off works well when all parties assume that the dealer will obtain financing, but could be
problematic otherwise.
Assume that cash investors become concerned that the clearing banks may refuse to unwind
42
the repos of a dealer. The clearing bank may take this action because it does not want to be
exposed to the dealer’s failure if it occurs during the day. The investors realize that the dealer
would almost certainly have to default if the clearing bank does not unwind its repos. Hence,
the investors will be reluctant to provide repo financing to the dealer. Of course, the dealer
would be forced to default if it is unable to obtain repo financing from the cash investors. So
a clearing bank would not want to unwind the repos of a dealer that is not likely to obtain
financing.
This dynamic is self-fulfilling in the sense that the reluctance of the clearing bank to unwind
the repos of a given dealer creates the condition for investors not to want to provide repo
funding to that dealer, which justifies the clearing bank’s concerns. Similarly, the reluctance
of cash investors to extend financing to a dealer creates the condition for the clearing bank to
prefer not to unwind the dealer’s repos, which justifies the investors’ concerns.
The proposed reforms would address this risk with the elimination of the morning unwind.
For example, if the closing leg of maturing repos is settled at the same time as the opening
leg of new repos, then the hand-off of risk between investors and clearing banks is avoided.
Hence, the type of “run” described in this section cannot occur. In particular, the introduction
of collateral substitution mechanisms would allow collateral providers to have access to their
securities while cash investors maintain a secured exposure to the collateral provider for the
entire day.
4.3 The intraday exposure of the clearing banks
Another source of risk in tri-party repo is related to the intraday exposure of the clearing
banks. Prior to the reforms, the two clearing banks would unwind all repos every morning,
which implies a combined exposure of $2.8 trillion at the peak of the market. While the size of
the market has decreased, it is still above $1.5 trillion. The exposures to individual collateral
providers were also very large: the largest individual portfolio was over $400 billion at the
height of the market and some large dealers still finance more than $200 billion in the tri-party
43
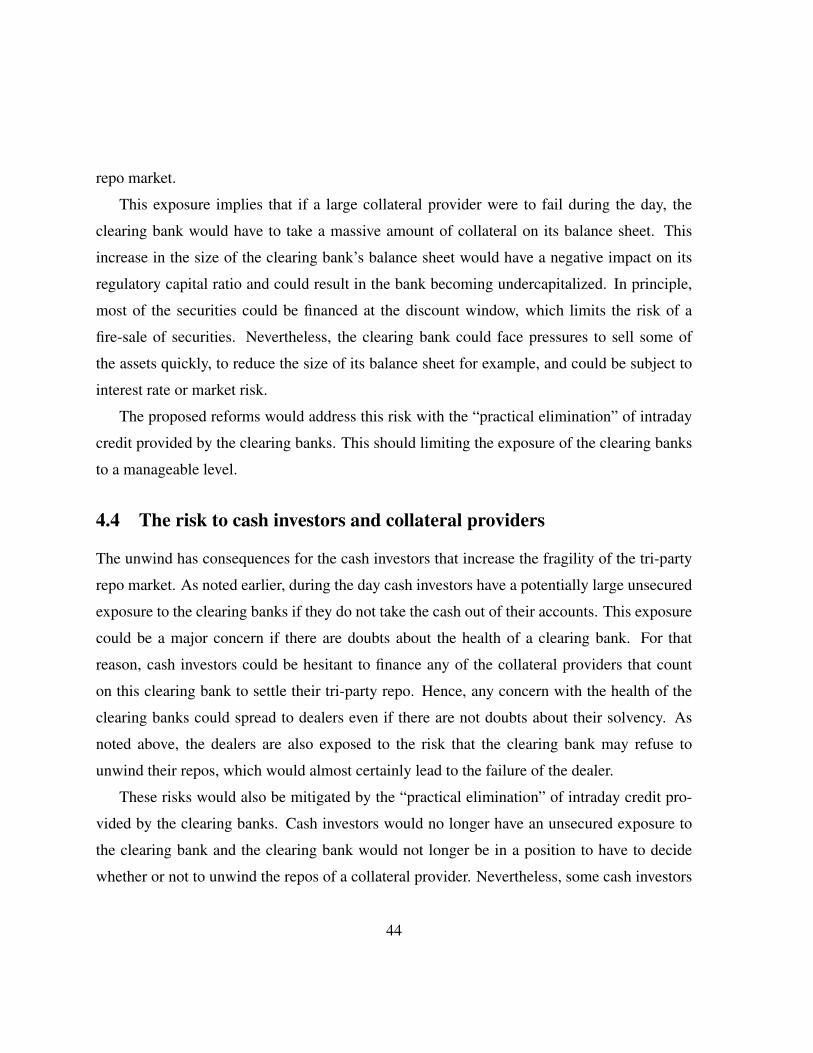
repo market.
This exposure implies that if a large collateral provider were to fail during the day, the
clearing bank would have to take a massive amount of collateral on its balance sheet. This
increase in the size of the clearing bank’s balance sheet would have a negative impact on its
regulatory capital ratio and could result in the bank becoming undercapitalized. In principle,
most of the securities could be financed at the discount window, which limits the risk of a
fire-sale of securities. Nevertheless, the clearing bank could face pressures to sell some of
the assets quickly, to reduce the size of its balance sheet for example, and could be subject to
interest rate or market risk.
The proposed reforms would address this risk with the “practical elimination” of intraday
credit provided by the clearing banks. This should limiting the exposure of the clearing banks
to a manageable level.
4.4 The risk to cash investors and collateral providers
The unwind has consequences for the cash investors that increase the fragility of the tri-party
repo market. As noted earlier, during the day cash investors have a potentially large unsecured
exposure to the clearing banks if they do not take the cash out of their accounts. This exposure
could be a major concern if there are doubts about the health of a clearing bank. For that
reason, cash investors could be hesitant to finance any of the collateral providers that count
on this clearing bank to settle their tri-party repo. Hence, any concern with the health of the
clearing banks could spread to dealers even if there are not doubts about their solvency. As
noted above, the dealers are also exposed to the risk that the clearing bank may refuse to
unwind their repos, which would almost certainly lead to the failure of the dealer.
These risks would also be mitigated by the “practical elimination” of intraday credit pro-
vided by the clearing banks. Cash investors would no longer have an unsecured exposure to
the clearing bank and the clearing bank would not longer be in a position to have to decide
whether or not to unwind the repos of a collateral provider. Nevertheless, some cash investors
44
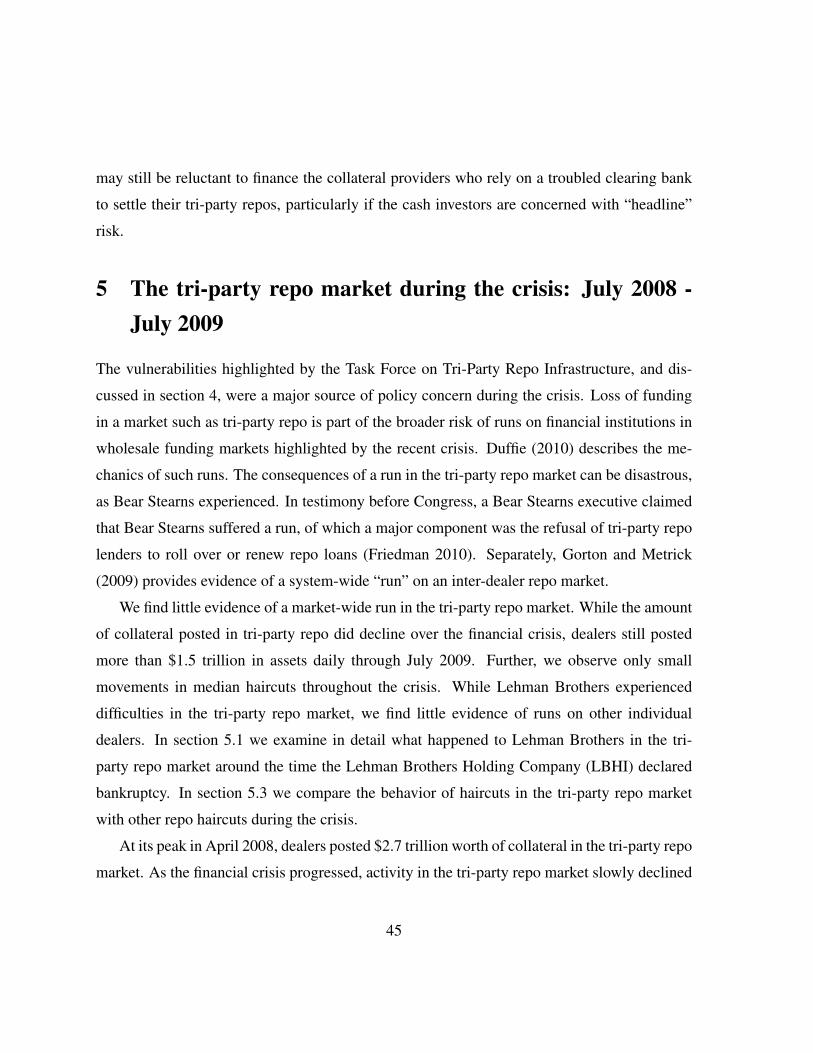
may still be reluctant to finance the collateral providers who rely on a troubled clearing bank
to settle their tri-party repos, particularly if the cash investors are concerned with “headline”
risk.
5 The tri-party repo market during the crisis: July 2008 -July 2009
The vulnerabilities highlighted by the Task Force on Tri-Party Repo Infrastructure, and dis-
cussed in section 4, were a major source of policy concern during the crisis. Loss of funding
in a market such as tri-party repo is part of the broader risk of runs on financial institutions in
wholesale funding markets highlighted by the recent crisis. Duffie (2010) describes the me-
chanics of such runs. The consequences of a run in the tri-party repo market can be disastrous,
as Bear Stearns experienced. In testimony before Congress, a Bear Stearns executive claimed
that Bear Stearns suffered a run, of which a major component was the refusal of tri-party repo
lenders to roll over or renew repo loans (Friedman 2010). Separately, Gorton and Metrick
(2009) provides evidence of a system-wide “run” on an inter-dealer repo market.
We find little evidence of a market-wide run in the tri-party repo market. While the amount
of collateral posted in tri-party repo did decline over the financial crisis, dealers still posted
more than $1.5 trillion in assets daily through July 2009. Further, we observe only small
movements in median haircuts throughout the crisis. While Lehman Brothers experienced
difficulties in the tri-party repo market, we find little evidence of runs on other individual
dealers. In section 5.1 we examine in detail what happened to Lehman Brothers in the tri-
party repo market around the time the Lehman Brothers Holding Company (LBHI) declared
bankruptcy. In section 5.3 we compare the behavior of haircuts in the tri-party repo market
with other repo haircuts during the crisis.
At its peak in April 2008, dealers posted $2.7 trillion worth of collateral in the tri-party repo
market. As the financial crisis progressed, activity in the tri-party repo market slowly declined
45
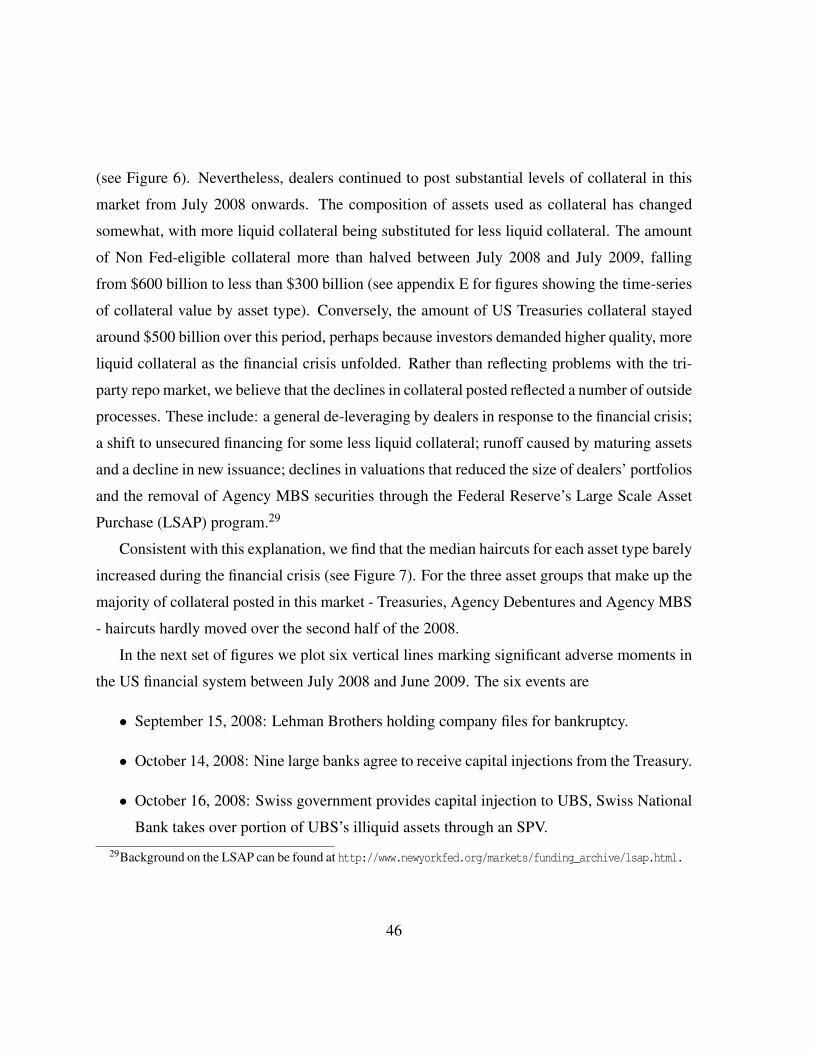
(see Figure 6). Nevertheless, dealers continued to post substantial levels of collateral in this
market from July 2008 onwards. The composition of assets used as collateral has changed
somewhat, with more liquid collateral being substituted for less liquid collateral. The amount
of Non Fed-eligible collateral more than halved between July 2008 and July 2009, falling
from $600 billion to less than $300 billion (see appendix E for figures showing the time-series
of collateral value by asset type). Conversely, the amount of US Treasuries collateral stayed
around $500 billion over this period, perhaps because investors demanded higher quality, more
liquid collateral as the financial crisis unfolded. Rather than reflecting problems with the tri-
party repo market, we believe that the declines in collateral posted reflected a number of outside
processes. These include: a general de-leveraging by dealers in response to the financial crisis;
a shift to unsecured financing for some less liquid collateral; runoff caused by maturing assets
and a decline in new issuance; declines in valuations that reduced the size of dealers’ portfolios
and the removal of Agency MBS securities through the Federal Reserve’s Large Scale Asset
Purchase (LSAP) program.29
Consistent with this explanation, we find that the median haircuts for each asset type barely
increased during the financial crisis (see Figure 7). For the three asset groups that make up the
majority of collateral posted in this market - Treasuries, Agency Debentures and Agency MBS
- haircuts hardly moved over the second half of the 2008.
In the next set of figures we plot six vertical lines marking significant adverse moments in
the US financial system between July 2008 and June 2009. The six events are
• September 15, 2008: Lehman Brothers holding company files for bankruptcy.
• October 14, 2008: Nine large banks agree to receive capital injections from the Treasury.
• October 16, 2008: Swiss government provides capital injection to UBS, Swiss National
Bank takes over portion of UBS’s illiquid assets through an SPV.
29Background on the LSAP can be found at http://www.newyorkfed.org/markets/funding_archive/lsap.html.
46
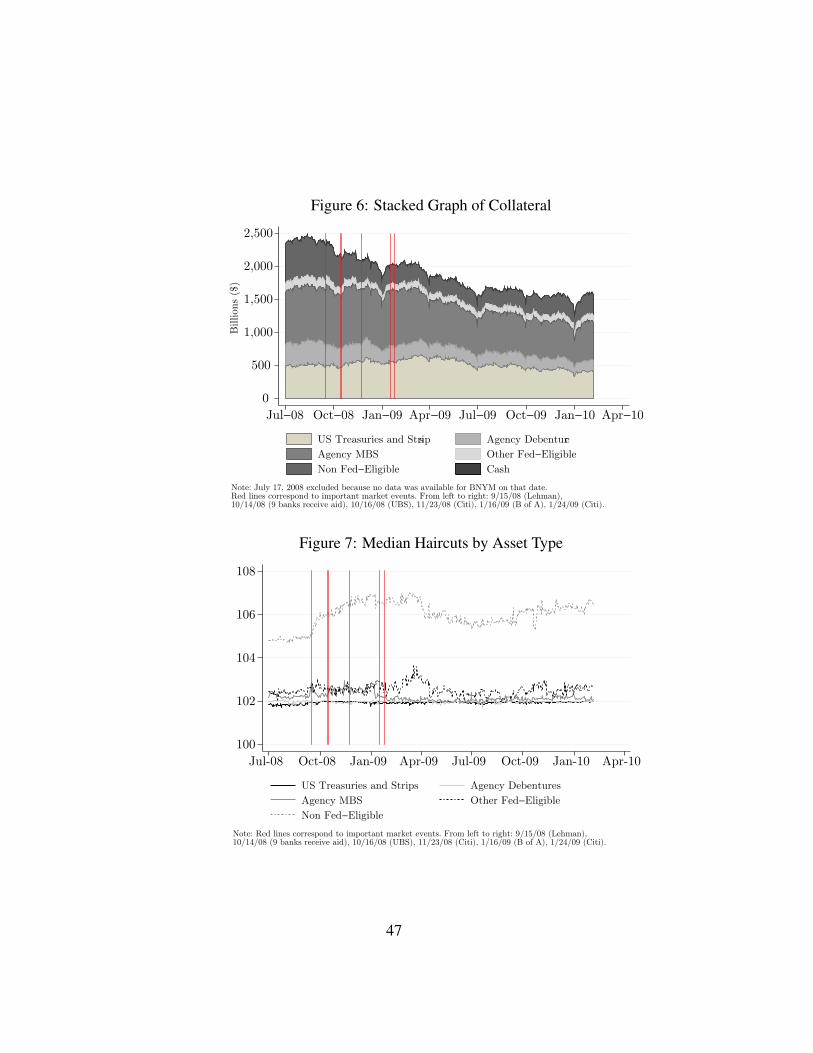
Figure 6: Stacked Graph of Collateral
0
500
1,000
1,500
2,000
2,500B
illions
($)
Jul−08 Oct−08 Jan−09 Apr−09 Jul−09 Oct−09 Jan−10 Apr−10
US Treasuries and Strips Agency Debenture
Agency MBS Other Fed−Eligible
Non Fed−Eligible Cash
Note: July 17, 2008 excluded because no data was available for BNYM on that date.Red lines correspond to important market events. From left to right: 9/15/08 (Lehman),10/14/08 (9 banks receive aid), 10/16/08 (UBS), 11/23/08 (Citi), 1/16/09 (B of A), 1/24/09 (Citi).
Figure 7: Median Haircuts by Asset Type
100
102
104
106
108
Jul-08 Oct-08 Jan-09 Apr-09 Jul-09 Oct-09 Jan-10 Apr-10
US Treasuries and Strips Agency Debentures
Agency MBS Other Fed−Eligible
Non Fed−Eligible
Note: Red lines correspond to important market events. From left to right: 9/15/08 (Lehman),10/14/08 (9 banks receive aid), 10/16/08 (UBS), 11/23/08 (Citi), 1/16/09 (B of A), 1/24/09 (Citi).
47
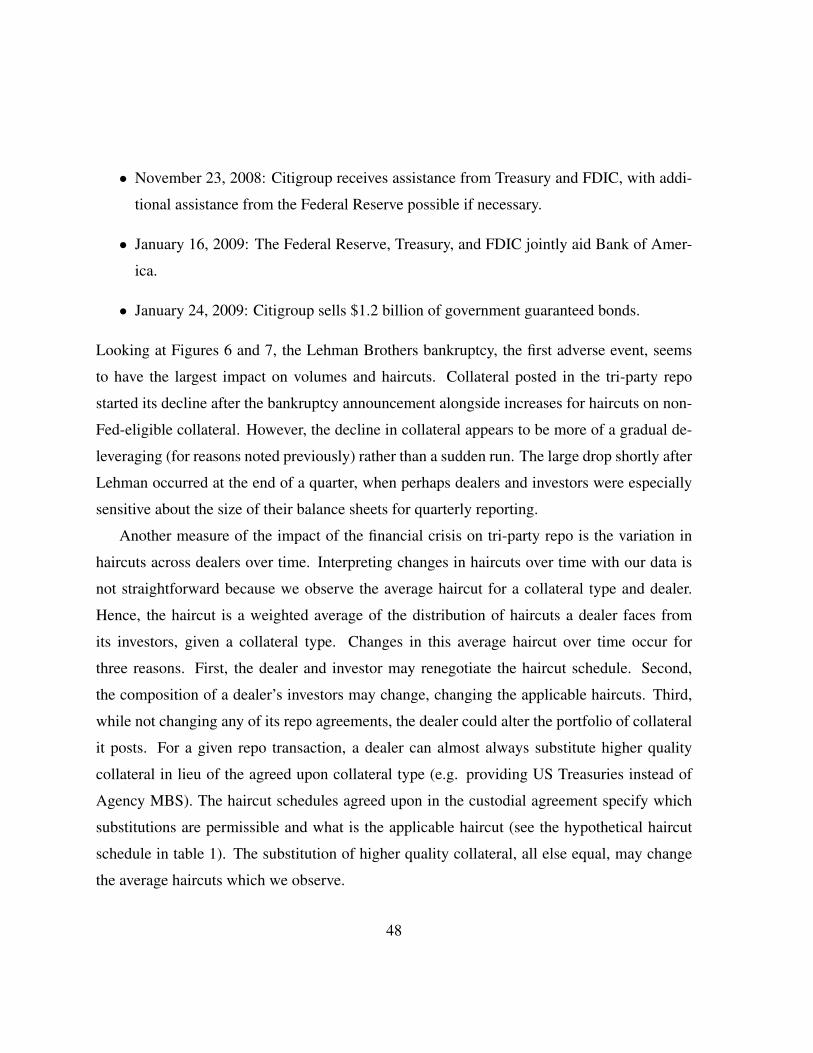
• November 23, 2008: Citigroup receives assistance from Treasury and FDIC, with addi-
tional assistance from the Federal Reserve possible if necessary.
• January 16, 2009: The Federal Reserve, Treasury, and FDIC jointly aid Bank of Amer-
ica.
• January 24, 2009: Citigroup sells $1.2 billion of government guaranteed bonds.
Looking at Figures 6 and 7, the Lehman Brothers bankruptcy, the first adverse event, seems
to have the largest impact on volumes and haircuts. Collateral posted in the tri-party repo
started its decline after the bankruptcy announcement alongside increases for haircuts on non-
Fed-eligible collateral. However, the decline in collateral appears to be more of a gradual de-
leveraging (for reasons noted previously) rather than a sudden run. The large drop shortly after
Lehman occurred at the end of a quarter, when perhaps dealers and investors were especially
sensitive about the size of their balance sheets for quarterly reporting.
Another measure of the impact of the financial crisis on tri-party repo is the variation in
haircuts across dealers over time. Interpreting changes in haircuts over time with our data is
not straightforward because we observe the average haircut for a collateral type and dealer.
Hence, the haircut is a weighted average of the distribution of haircuts a dealer faces from
its investors, given a collateral type. Changes in this average haircut over time occur for
three reasons. First, the dealer and investor may renegotiate the haircut schedule. Second,
the composition of a dealer’s investors may change, changing the applicable haircuts. Third,
while not changing any of its repo agreements, the dealer could alter the portfolio of collateral
it posts. For a given repo transaction, a dealer can almost always substitute higher quality
collateral in lieu of the agreed upon collateral type (e.g. providing US Treasuries instead of
Agency MBS). The haircut schedules agreed upon in the custodial agreement specify which
substitutions are permissible and what is the applicable haircut (see the hypothetical haircut
schedule in table 1). The substitution of higher quality collateral, all else equal, may change
the average haircuts which we observe.
48
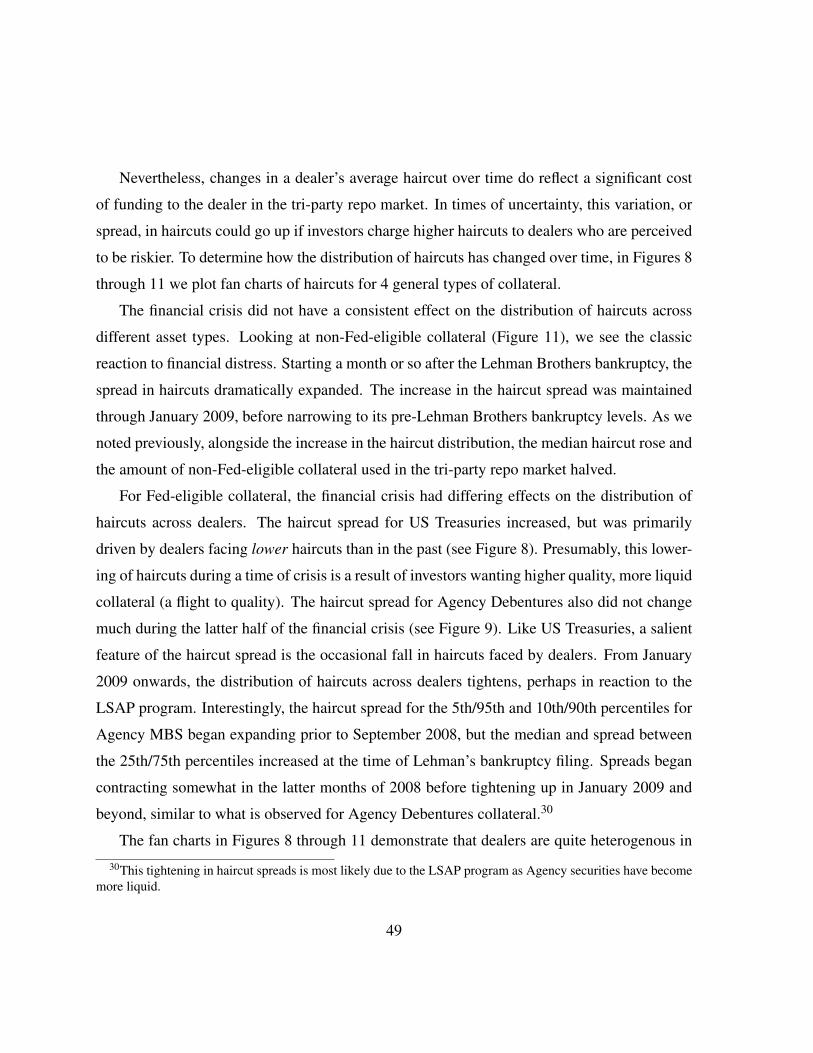
Nevertheless, changes in a dealer’s average haircut over time do reflect a significant cost
of funding to the dealer in the tri-party repo market. In times of uncertainty, this variation, or
spread, in haircuts could go up if investors charge higher haircuts to dealers who are perceived
to be riskier. To determine how the distribution of haircuts has changed over time, in Figures 8
through 11 we plot fan charts of haircuts for 4 general types of collateral.
The financial crisis did not have a consistent effect on the distribution of haircuts across
different asset types. Looking at non-Fed-eligible collateral (Figure 11), we see the classic
reaction to financial distress. Starting a month or so after the Lehman Brothers bankruptcy, the
spread in haircuts dramatically expanded. The increase in the haircut spread was maintained
through January 2009, before narrowing to its pre-Lehman Brothers bankruptcy levels. As we
noted previously, alongside the increase in the haircut distribution, the median haircut rose and
the amount of non-Fed-eligible collateral used in the tri-party repo market halved.
For Fed-eligible collateral, the financial crisis had differing effects on the distribution of
haircuts across dealers. The haircut spread for US Treasuries increased, but was primarily
driven by dealers facing lower haircuts than in the past (see Figure 8). Presumably, this lower-
ing of haircuts during a time of crisis is a result of investors wanting higher quality, more liquid
collateral (a flight to quality). The haircut spread for Agency Debentures also did not change
much during the latter half of the financial crisis (see Figure 9). Like US Treasuries, a salient
feature of the haircut spread is the occasional fall in haircuts faced by dealers. From January
2009 onwards, the distribution of haircuts across dealers tightens, perhaps in reaction to the
LSAP program. Interestingly, the haircut spread for the 5th/95th and 10th/90th percentiles for
Agency MBS began expanding prior to September 2008, but the median and spread between
the 25th/75th percentiles increased at the time of Lehman’s bankruptcy filing. Spreads began
contracting somewhat in the latter months of 2008 before tightening up in January 2009 and
beyond, similar to what is observed for Agency Debentures collateral.30
The fan charts in Figures 8 through 11 demonstrate that dealers are quite heterogenous in
30This tightening in haircut spreads is most likely due to the LSAP program as Agency securities have becomemore liquid.
49
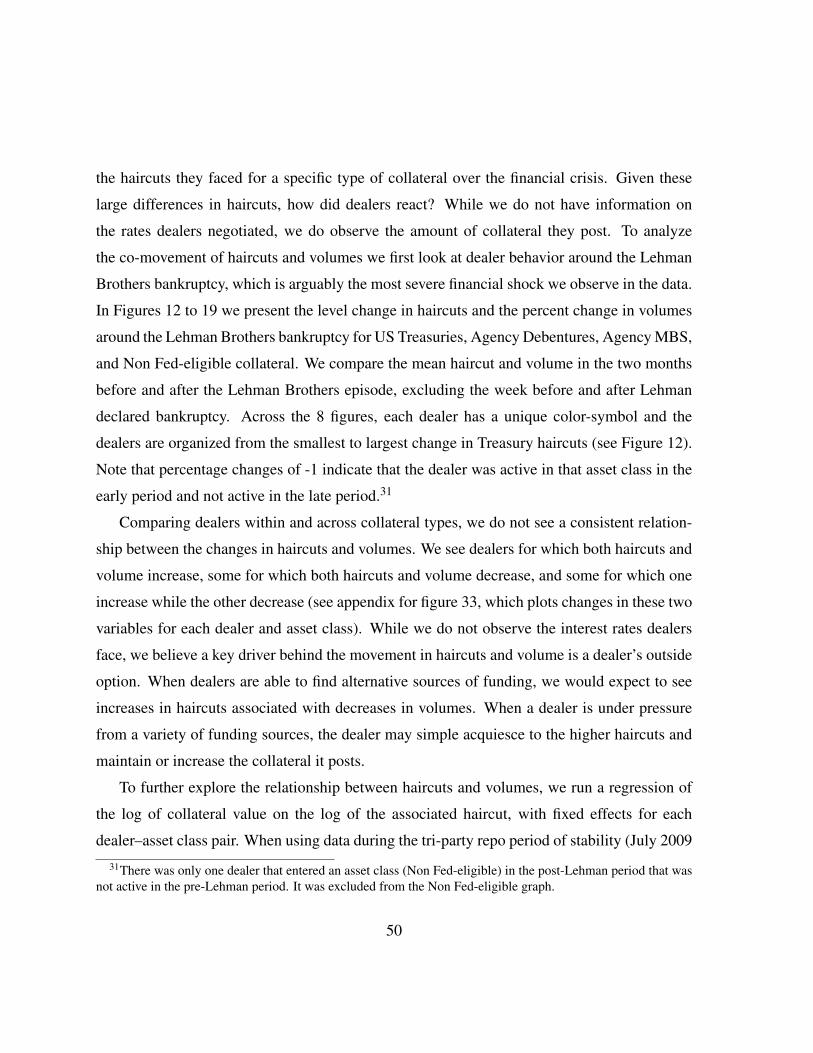
the haircuts they faced for a specific type of collateral over the financial crisis. Given these
large differences in haircuts, how did dealers react? While we do not have information on
the rates dealers negotiated, we do observe the amount of collateral they post. To analyze
the co-movement of haircuts and volumes we first look at dealer behavior around the Lehman
Brothers bankruptcy, which is arguably the most severe financial shock we observe in the data.
In Figures 12 to 19 we present the level change in haircuts and the percent change in volumes
around the Lehman Brothers bankruptcy for US Treasuries, Agency Debentures, Agency MBS,
and Non Fed-eligible collateral. We compare the mean haircut and volume in the two months
before and after the Lehman Brothers episode, excluding the week before and after Lehman
declared bankruptcy. Across the 8 figures, each dealer has a unique color-symbol and the
dealers are organized from the smallest to largest change in Treasury haircuts (see Figure 12).
Note that percentage changes of -1 indicate that the dealer was active in that asset class in the
early period and not active in the late period.31
Comparing dealers within and across collateral types, we do not see a consistent relation-
ship between the changes in haircuts and volumes. We see dealers for which both haircuts and
volume increase, some for which both haircuts and volume decrease, and some for which one
increase while the other decrease (see appendix for figure 33, which plots changes in these two
variables for each dealer and asset class). While we do not observe the interest rates dealers
face, we believe a key driver behind the movement in haircuts and volume is a dealer’s outside
option. When dealers are able to find alternative sources of funding, we would expect to see
increases in haircuts associated with decreases in volumes. When a dealer is under pressure
from a variety of funding sources, the dealer may simple acquiesce to the higher haircuts and
maintain or increase the collateral it posts.
To further explore the relationship between haircuts and volumes, we run a regression of
the log of collateral value on the log of the associated haircut, with fixed effects for each
dealer–asset class pair. When using data during the tri-party repo period of stability (July 2009
31There was only one dealer that entered an asset class (Non Fed-eligible) in the post-Lehman period that wasnot active in the pre-Lehman period. It was excluded from the Non Fed-eligible graph.
50
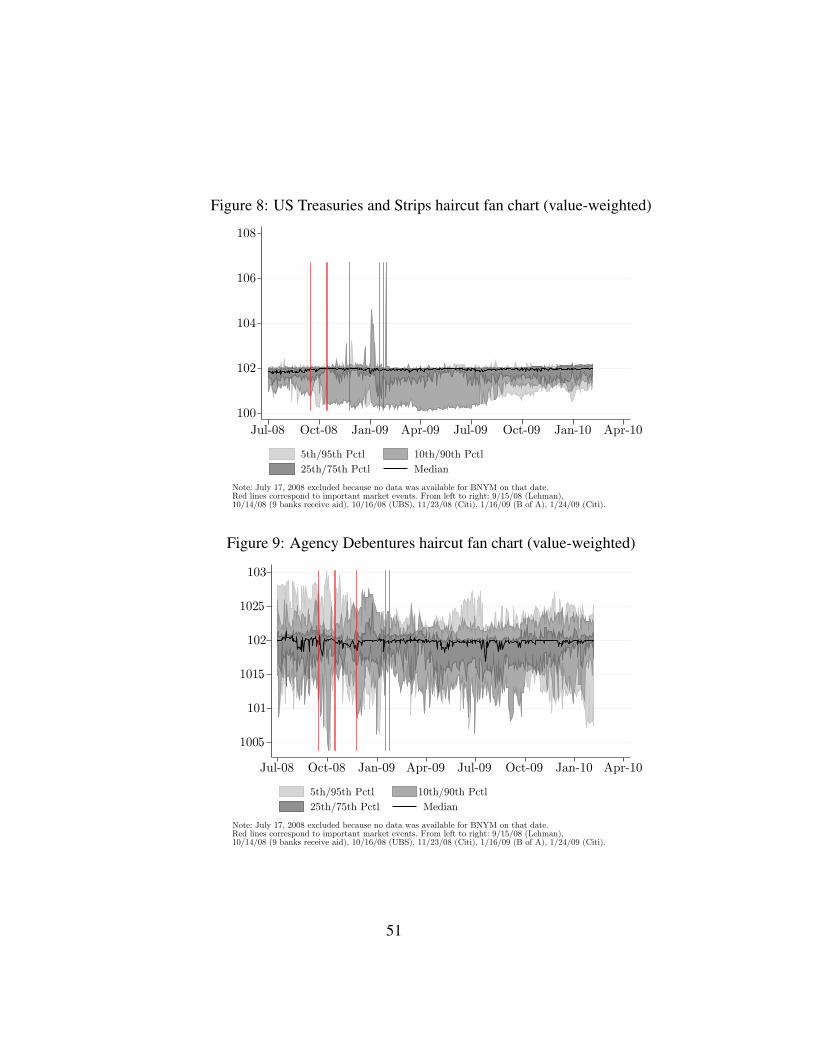
Figure 8: US Treasuries and Strips haircut fan chart (value-weighted)
100
102
104
106
108
Jul-08 Oct-08 Jan-09 Apr-09 Jul-09 Oct-09 Jan-10 Apr-10
5th/95th Pctl 10th/90th Pctl
25th/75th Pctl Median
Note: July 17, 2008 excluded because no data was available for BNYM on that date.Red lines correspond to important market events. From left to right: 9/15/08 (Lehman),10/14/08 (9 banks receive aid), 10/16/08 (UBS), 11/23/08 (Citi), 1/16/09 (B of A), 1/24/09 (Citi).
Figure 9: Agency Debentures haircut fan chart (value-weighted)
100.5
101
101.5
102
102.5
103
Jul-08 Oct-08 Jan-09 Apr-09 Jul-09 Oct-09 Jan-10 Apr-10
5th/95th Pctl 10th/90th Pctl
25th/75th Pctl Median
Note: July 17, 2008 excluded because no data was available for BNYM on that date.Red lines correspond to important market events. From left to right: 9/15/08 (Lehman),10/14/08 (9 banks receive aid), 10/16/08 (UBS), 11/23/08 (Citi), 1/16/09 (B of A), 1/24/09 (Citi).
51
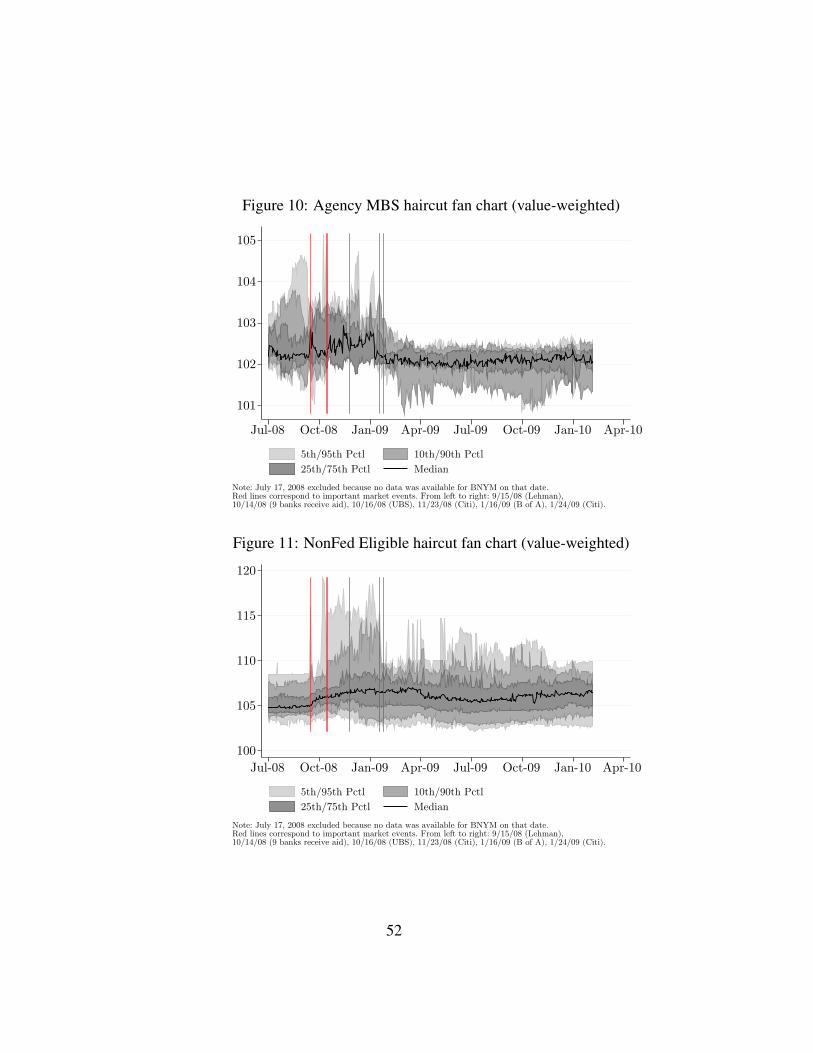
Figure 10: Agency MBS haircut fan chart (value-weighted)
101
102
103
104
105
Jul-08 Oct-08 Jan-09 Apr-09 Jul-09 Oct-09 Jan-10 Apr-10
5th/95th Pctl 10th/90th Pctl
25th/75th Pctl Median
Note: July 17, 2008 excluded because no data was available for BNYM on that date.Red lines correspond to important market events. From left to right: 9/15/08 (Lehman),10/14/08 (9 banks receive aid), 10/16/08 (UBS), 11/23/08 (Citi), 1/16/09 (B of A), 1/24/09 (Citi).
Figure 11: NonFed Eligible haircut fan chart (value-weighted)
100
105
110
115
120
Jul-08 Oct-08 Jan-09 Apr-09 Jul-09 Oct-09 Jan-10 Apr-10
5th/95th Pctl 10th/90th Pctl
25th/75th Pctl Median
Note: July 17, 2008 excluded because no data was available for BNYM on that date.Red lines correspond to important market events. From left to right: 9/15/08 (Lehman),10/14/08 (9 banks receive aid), 10/16/08 (UBS), 11/23/08 (Citi), 1/16/09 (B of A), 1/24/09 (Citi).
52
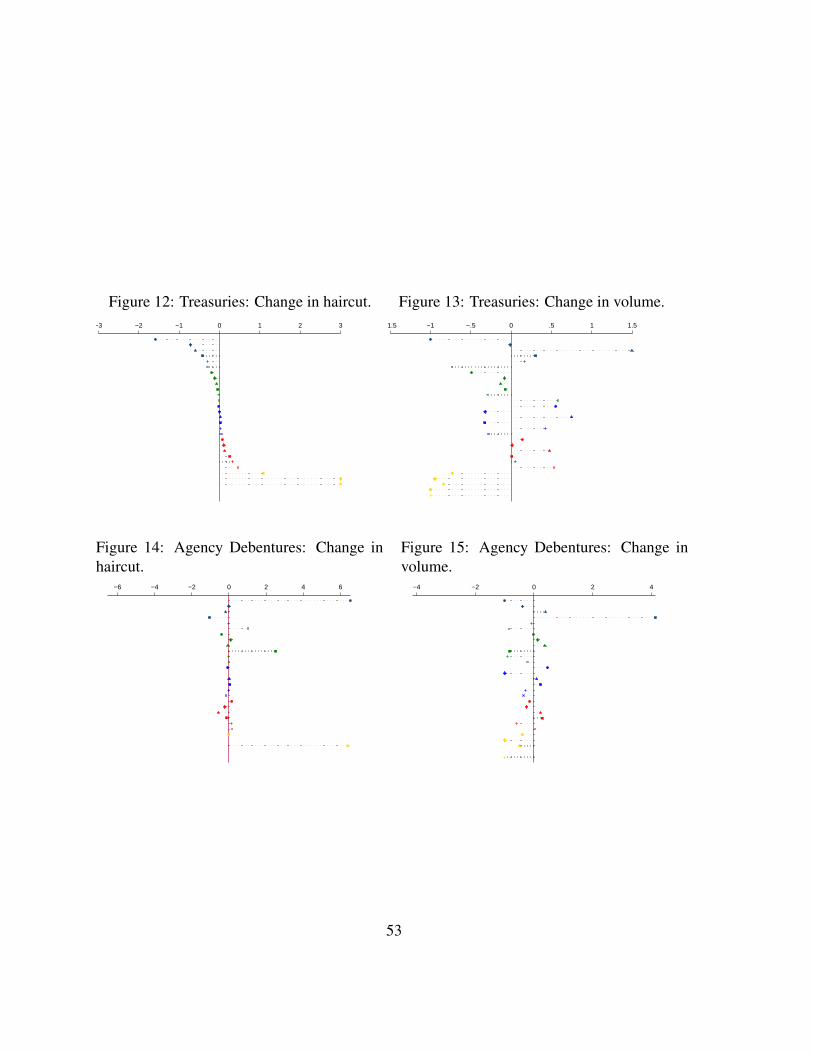
Figure 12: Treasuries: Change in haircut.−3 −2 −1 0 1 2 3
Figure 13: Treasuries: Change in volume.−1.5 −1 −.5 0 .5 1 1.5
Figure 14: Agency Debentures: Change inhaircut.
−6 −4 −2 0 2 4 6
Figure 15: Agency Debentures: Change involume.
−4 −2 0 2 4
53
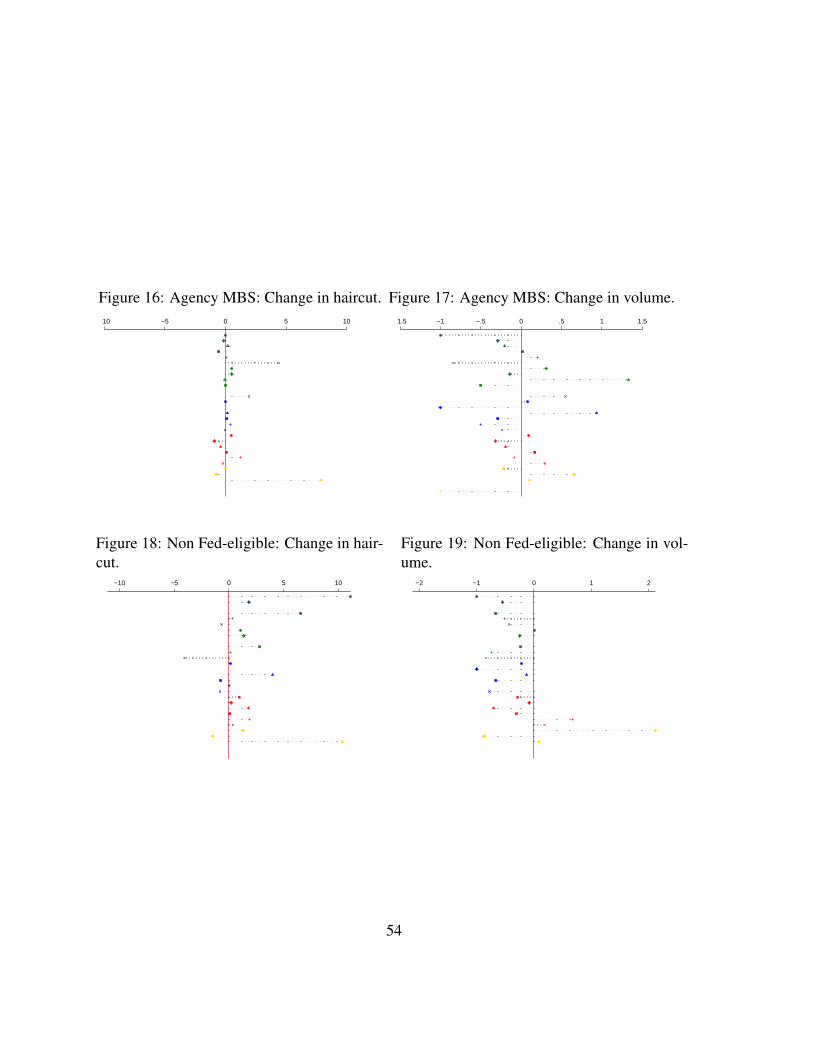
Figure 16: Agency MBS: Change in haircut.−10 −5 0 5 10
Figure 17: Agency MBS: Change in volume.−1.5 −1 −.5 0 .5 1 1.5
Figure 18: Non Fed-eligible: Change in hair-cut.
−10 −5 0 5 10
Figure 19: Non Fed-eligible: Change in vol-ume.
−2 −1 0 1 2
54
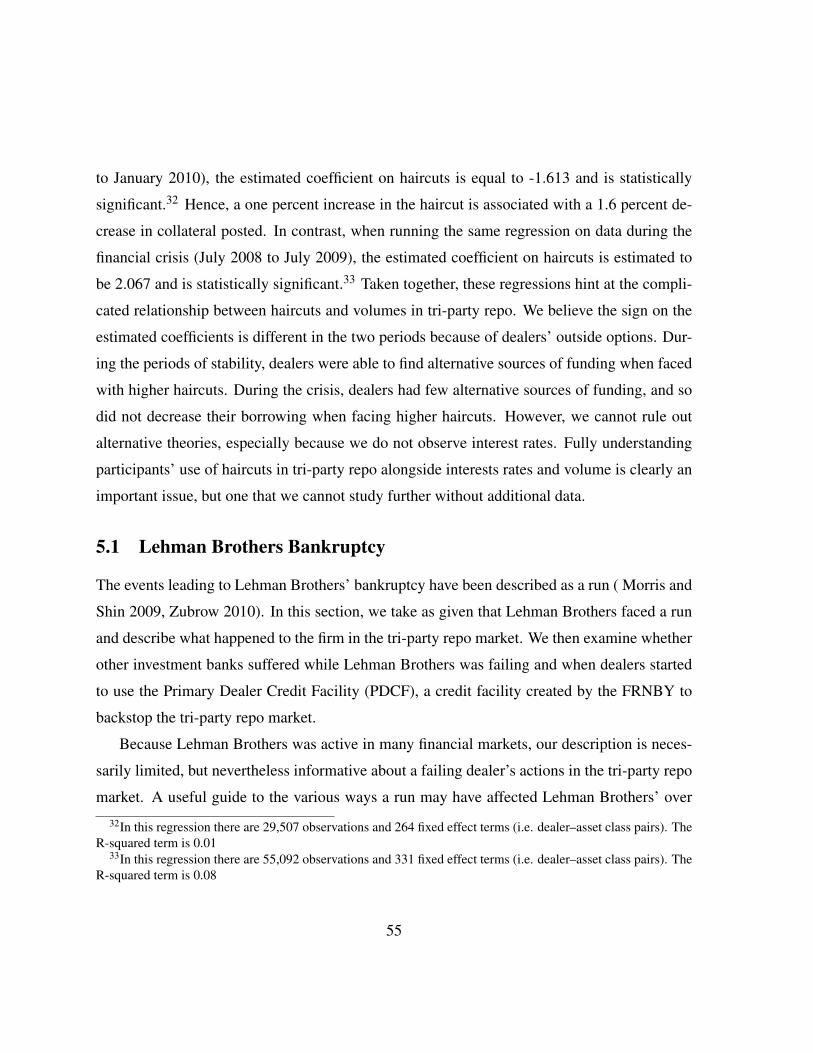
to January 2010), the estimated coefficient on haircuts is equal to -1.613 and is statistically
significant.32 Hence, a one percent increase in the haircut is associated with a 1.6 percent de-
crease in collateral posted. In contrast, when running the same regression on data during the
financial crisis (July 2008 to July 2009), the estimated coefficient on haircuts is estimated to
be 2.067 and is statistically significant.33 Taken together, these regressions hint at the compli-
cated relationship between haircuts and volumes in tri-party repo. We believe the sign on the
estimated coefficients is different in the two periods because of dealers’ outside options. Dur-
ing the periods of stability, dealers were able to find alternative sources of funding when faced
with higher haircuts. During the crisis, dealers had few alternative sources of funding, and so
did not decrease their borrowing when facing higher haircuts. However, we cannot rule out
alternative theories, especially because we do not observe interest rates. Fully understanding
participants’ use of haircuts in tri-party repo alongside interests rates and volume is clearly an
important issue, but one that we cannot study further without additional data.
5.1 Lehman Brothers Bankruptcy
The events leading to Lehman Brothers’ bankruptcy have been described as a run ( Morris and
Shin 2009, Zubrow 2010). In this section, we take as given that Lehman Brothers faced a run
and describe what happened to the firm in the tri-party repo market. We then examine whether
other investment banks suffered while Lehman Brothers was failing and when dealers started
to use the Primary Dealer Credit Facility (PDCF), a credit facility created by the FRNBY to
backstop the tri-party repo market.
Because Lehman Brothers was active in many financial markets, our description is neces-
sarily limited, but nevertheless informative about a failing dealer’s actions in the tri-party repo
market. A useful guide to the various ways a run may have affected Lehman Brothers’ over
32In this regression there are 29,507 observations and 264 fixed effect terms (i.e. dealer–asset class pairs). TheR-squared term is 0.01
33In this regression there are 55,092 observations and 331 fixed effect terms (i.e. dealer–asset class pairs). TheR-squared term is 0.08
55
this time is given by Duffie (2010), which describes the mechanics of a dealer-bank failure.
It should be noted that Lehman Brothers’s holding company (LBHI) filed for bankruptcy on
September 15, 2008, not the broker-dealer (LBI), the entity most active in the US tri-party repo
market. LBHI filed a motion on September 17 to sell LBI to Barclays, and LBI was placed into
SIPA proceedings on September 19, 2008. The case was transferred to the U.S. Bankruptcy
Court on the same day and the sale was approved on September 20 (Crapo 2008).
In the week prior to the bankruptcy filing of the holding company, the value of Lehman’s
tri-party book and the number of investors declined dramatically. Lehman’s total tri-party
book fell from $150 billion funded by over 60 investors on September 8, 2008, to $95 billion
funded by around 40 investors on September 12, the Friday before LBHI filed for bankruptcy
(Figures 20 and 21). Nevertheless, Lehman closed Friday, September 12 meeting its secured
financing requirements with no assistance from the PDCF. After the Holding company filed
for bankruptcy on September 15, and given the significant amount of confusion and stress that
ensued, Lehman had to rely on the PDCF to finance part of its tri-party repo book. Valukas
(2010) reports that Lehman borrowed approximately $28 billion at the PDCF on that day.
Fewer than 20 investors engaged in tri-party repos with Lehman on Monday, September 15.
These figures may even overstate investors’ willingness to lend to Lehman Brothers. Since our
data does not include the term of tri-party transactions, it is possible some of the investors that
remained with Lehman were stuck in term trades and unable to pull back their funds without
breaking legal contracts. Valukas (2010) reports $21 billion in “mainly term repos” for that
day.
The Valukas Report cites sources describing much of the decline in collateral posted in
tri-party repo as part of a self-imposed trend, although there were additional declines that may
have been unplanned (Valukas 2010). We can think of five reasons behind the decrease in
collateral posted by Lehman Brothers in the tri-party repo market. First, investors in this mar-
ket may have pulled back funding to protect themselves against the increased risk of Lehman
Brothers defaulting. The Valukas Report notes that Fidelity, a large tri-party repo investor,
56
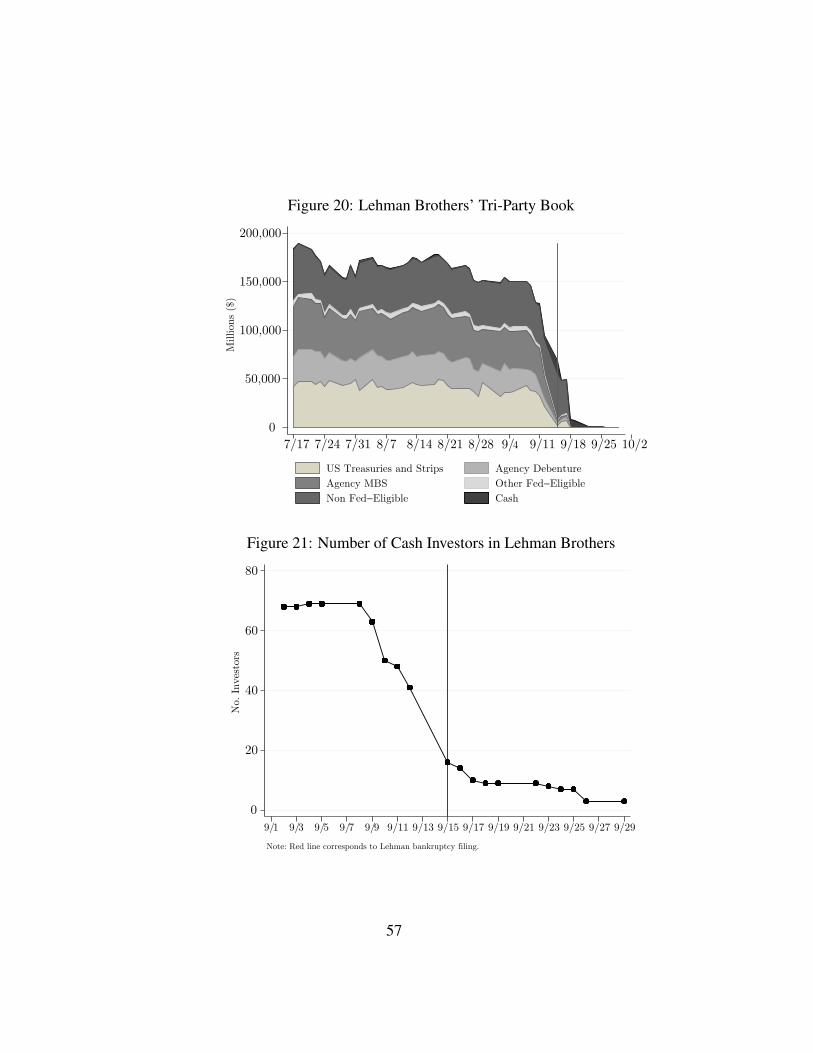
Figure 20: Lehman Brothers’ Tri-Party Book
0
50,000
100,000
150,000
200,000M
illions
($)
7/17 7/24 7/31 8/7 8/14 8/21 8/28 9/4 9/11 9/18 9/25 10/2
US Treasuries and Strips Agency Debenture
Agency MBS Other Fed−Eligible
Non Fed−Eligible Cash
Figure 21: Number of Cash Investors in Lehman Brothers
0
20
40
60
80
No. In
ves
tors
9/1 9/3 9/5 9/7 9/9 9/11 9/13 9/15 9/17 9/19 9/21 9/23 9/25 9/27 9/29
Note: Red line corresponds to Lehman bankruptcy filing.
57
“requested back” its overnight tri-party repo deals on September 12 (Valukas 2010). Hence,
Lehman Brothers may have been forced to finance its securities in other markets (e.g. GCF
repor market described in section 2) or not at all. Second, Lehman Brothers was forced to post
additional collateral with counterparties over this time, which may have reduced its tri-party
repo portfolio. Third, in reaction to rumors of Lehman Brothers’ upcoming demise, hedge
funds and other Lehman Brothers clients were moving their business to other broker-dealers,
and thus withdrawing their collateral from Lehman Brothers. As described in Duffie (2010),
losing these clients has a large impact on a dealer’s balance sheet. In particular, Lehman Broth-
ers would have a smaller portfolio of securities to post as collateral in tri-party repo. Fourth,
the wind down or deleveraging of the short dated (primarily overnight) matched books in Trea-
suries, Agencies, and Agency MBS likely played a part in the decline of tri-party funding over
the course of the last few days before the actual bankruptcy. A similar delevaraging in other
asset classes may have also played a role, albeit to a lesser extent. Fifth, and finally, in facing
a run by investors, Lehman Brothers may have been selling collateral to raise money. Note,
however, that since haircuts in tri-party are very small, the additional amount of money an
institution can raise by selling an asset is small. For example, if the haircut on Treasuries
is 2%, selling Treasuries only raises 2 additional cents for every dollar sold versus financing
Treasuries in tri-party.
Alongside the decrease in collateral posted by Lehman Brothers, there was a shift in the
composition of the portfolio of securities Lehman Brothers financed from high to low-quality
collateral. From July 1, 2008 to September 1, 2008, 70% of Lehman’s tri-party book was
financing Treasury, Agency Debentures and Agency MBS collateral. In the week prior to
filing for bankruptcy, these collateral types made up 63% of Lehman’s book and only 11% for
the week of September 15.34 Coincidentally, the share of non Fed-eligible collateral increased
dramatically, rising to 87% from about a quarter of Lehman’s tri-party collateral. Several of the
34One reason for this dramatic decline may have been that some of these collateral types were funded outsideof the tri-party repo market. For example, Lehman likely shifted some of its funding to repos settled by the FICC,which are blind brokered. GCF repos are included in tri-party but DvP repos settled by the FICC are not.
58
factors explaining the decrease in Lehman’s overall portfolio may have affected Fed-eligible
securities more than the less liquid asset classes. As a result, the share of Fed-eligible collateral
could decrease.
With Lehman Brothers facing a run by investors, we expect this firm to face higher hair-
cuts in the tri-party repo market. Haircuts, after all, protect investors from losses in the case
of a dealer default. Surprisingly, alongside the dramatic decrease in collateral posted, Lehman
Brothers did not face higher haircuts until just before it declared bankruptcy. Figure 23 il-
lustrates that the median haircut Lehman Brothers faced in the two weeks before declaring
bankruptcy was essentially flat until Thursday, September 11, two business days before declar-
ing bankruptcy. This unresponsiveness of haircuts could reflect cash investors strategy of con-
sidering counterparty risk first and collateral risk second. Hence, rather than raise haircuts,
cash investors may have simply refused to lend to Lehman Brothers. The rise in median
haircuts on September 11 and 12 reflects higher haircuts across all collateral classes, but the
average haircut increased the most for Agency MBS and non Fed-eligible collateral (see fig-
ure 24).
To gain a better understanding of the evolution of Lehman Brothers’ relationship with tri-
party repo cash investors while Lehman Brothers was facing a run, we examined data provided
by a large cash investor. We look at haircuts, interest rates, and cash loaned to Lehman Brothers
from September 1, 2008 to September 12, 2008, the last day this cash investor lent to Lehman
Brothers. Over this period, the cash investor accepted Corporate Repo, Money Market Repo,
Agency Debentures and Treasury Repo collateral from Lehman Brothers. Interestingly, the
haircuts for each of these collateral types did not change: Agency debentures and Treasuries
were charged a 2% haircut, while corporate and money market repo were charged a 5% haircut.
Figure 22 displays the rates and volumes paid by Lehman Brothers by collateral type for this
period. Surprisingly, there is very little movement on either dimension. Total volume invested
fell by $700 million, driven by an absence of a deal to finance the relatively high-quality
Agency debentures on September 12. The average interest rate did slightly increase from
59
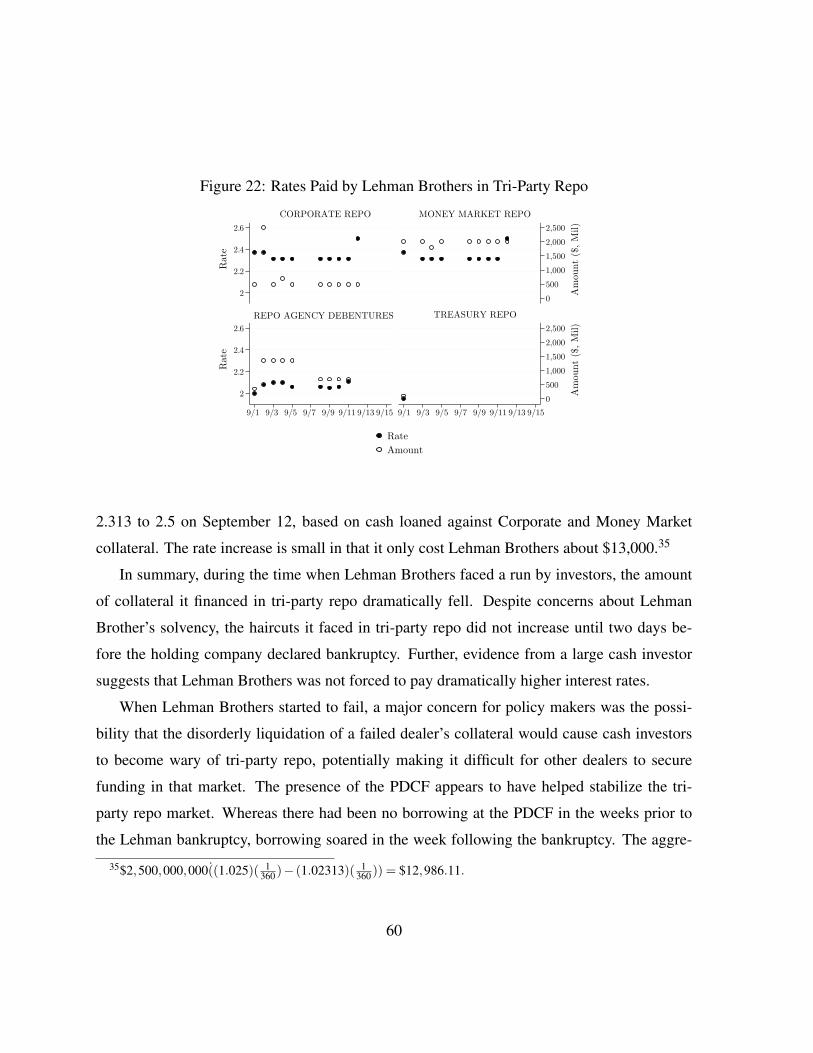
Figure 22: Rates Paid by Lehman Brothers in Tri-Party Repo
0
500
1,000
1,500
2,000
2,500
Am
ount
($, M
il)
0
500
1,000
1,500
2,000
2,500
Am
ount
($, M
il)
2
2.2
2.4
2.6R
ate
2
2.2
2.4
2.6
Rate
9/1 9/3 9/5 9/7 9/9 9/11 9/13 9/15 9/1 9/3 9/5 9/7 9/9 9/11 9/13 9/15
CORPORATE REPO MONEY MARKET REPO
REPO AGENCY DEBENTURES TREASURY REPO
Rate
Amount
2.313 to 2.5 on September 12, based on cash loaned against Corporate and Money Market
collateral. The rate increase is small in that it only cost Lehman Brothers about $13,000.35
In summary, during the time when Lehman Brothers faced a run by investors, the amount
of collateral it financed in tri-party repo dramatically fell. Despite concerns about Lehman
Brother’s solvency, the haircuts it faced in tri-party repo did not increase until two days be-
fore the holding company declared bankruptcy. Further, evidence from a large cash investor
suggests that Lehman Brothers was not forced to pay dramatically higher interest rates.
When Lehman Brothers started to fail, a major concern for policy makers was the possi-
bility that the disorderly liquidation of a failed dealer’s collateral would cause cash investors
to become wary of tri-party repo, potentially making it difficult for other dealers to secure
funding in that market. The presence of the PDCF appears to have helped stabilize the tri-
party repo market. Whereas there had been no borrowing at the PDCF in the weeks prior to
the Lehman bankruptcy, borrowing soared in the week following the bankruptcy. The aggre-
35$2,500,000,000(̇(1.025)( 1360 )− (1.02313)( 1
360 )) = $12,986.11.
60

gate market value of collateral provided in tri-party, including the PDFC, dipped slightly but
recovered quickly, falling from an average of $2.38 trillion the three days prior to Lehman to
$2.31 on September 16, then returning to an average of $2.36 trillion from September 17 to 19.
The decline in Lehman’s tri-party book accounted for 44% of the decline in the tri-party repo
market on September 15, and the $97.8 billion decline from September 9 to September 16 was
larger than the decline in the entire tri-party repo market over the same period ($74.8 billion).
While haircuts for Lehman increased, median haircuts for other investment and commercial
banks remained roughly constant in the weeks before and after Lehman’s bankruptcy. Figure
23 displays the median effective haircut facing Lehman, commercial banks and investment
banks.36 It does seem clear that the Lehman bankruptcy did not trigger a run on the tri-party
repo market as a whole, as volumes and haircuts for dealers other than Lehman did not change
substantially.37 Nevertheless, other dealers experienced stress during the following days. It
also appears likely that stress in this market would have been considerably worse, absent the
exceptional policy responses that took place, including the presence of the PDCF.
5.2 The role of the PDCF
A number of cash investors and dealers have reported anecdotally that the PDCF was an im-
portant contributing factor to stabilizing the tri-party repo market. This could help explain the
evidence provided in section 5 and suggests that the PDCF achieved its goal. Whatever role
it played in stabilizing the market, the presence of the PDCF was not sufficient to prevent the
dramatic reduction in Lehman’s tri-party repo funding, discussed in section 5.1. Nevertheless,
the PDCF may have prevented Lehman’s trouble from spreading to other participants. In this
section we discuss the role that the PDCF may have played in the tri-party repo market.
It is interesting to note that there was no lending at the PDCF in the weeks leading up to
36Dealers classified as commercial banks were those with a connection to a commercial bank, which wouldhave customer deposits that could potentially be used for funding, as well as access to the Discount Window.Investment banks were those without a corresponding commercial bank prior to August 2007.
37The increase in haircuts for Lehman is due, in part, to its reliance on the PDCF in the week following thebankruptcy of the holding company.
61
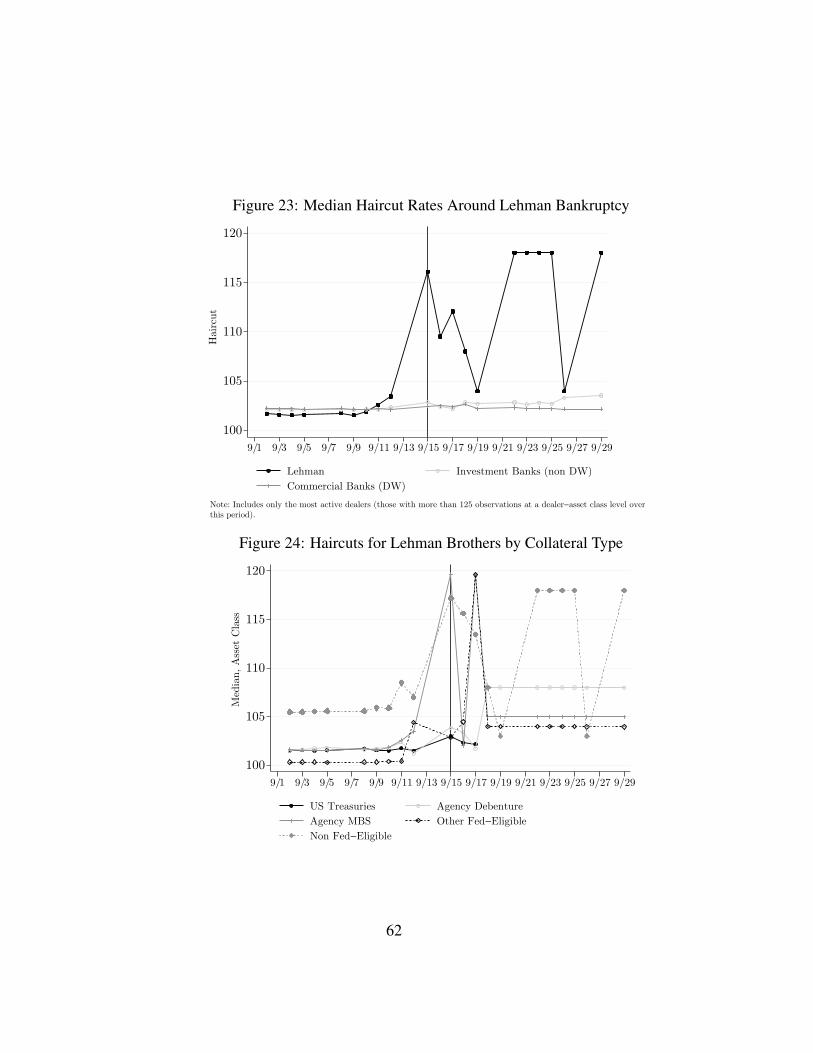
Figure 23: Median Haircut Rates Around Lehman Bankruptcy
100
105
110
115
120
Hair
cut
9/1 9/3 9/5 9/7 9/9 9/11 9/13 9/15 9/17 9/19 9/21 9/23 9/25 9/27 9/29
Lehman Investment Banks (non DW)
Commercial Banks (DW)
Note: Includes only the most active dealers (those with more than 125 observations at a dealer−asset class level over
this period).
Figure 24: Haircuts for Lehman Brothers by Collateral Type
100
105
110
115
120
Med
ian, A
sset
Cla
ss
9/1 9/3 9/5 9/7 9/9 9/11 9/13 9/15 9/17 9/19 9/21 9/23 9/25 9/27 9/29
US Treasuries Agency Debenture
Agency MBS Other Fed−Eligible
Non Fed−Eligible
62
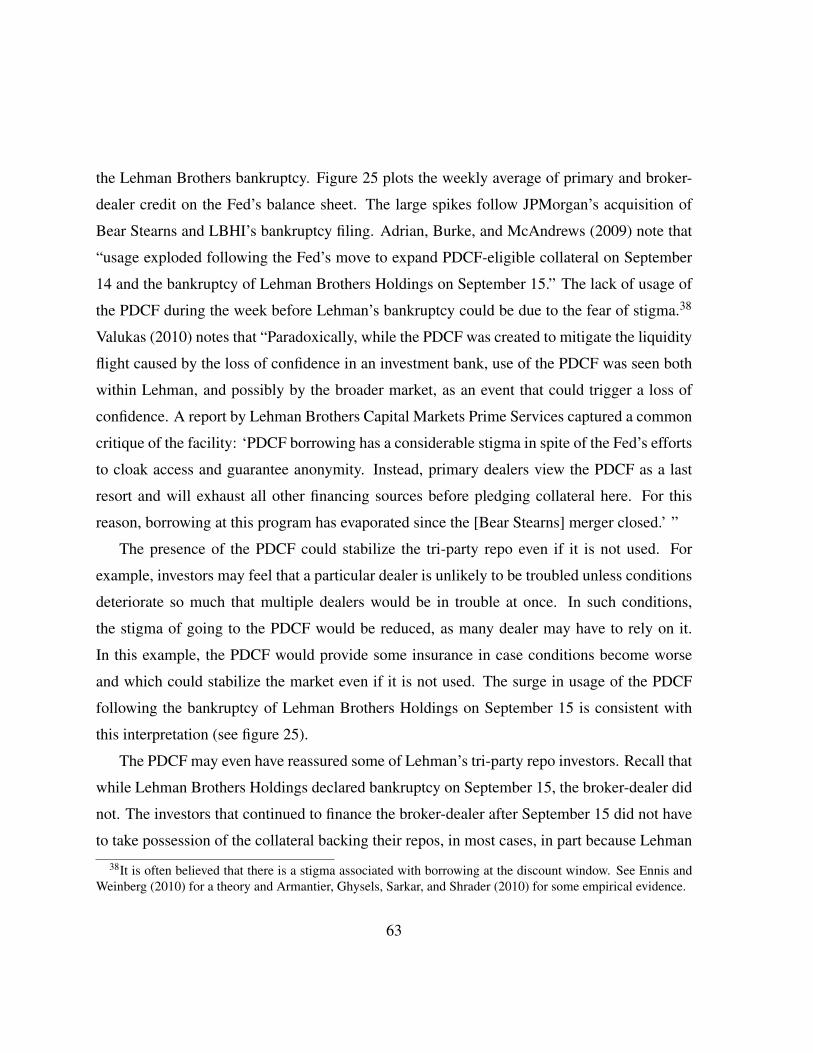
the Lehman Brothers bankruptcy. Figure 25 plots the weekly average of primary and broker-
dealer credit on the Fed’s balance sheet. The large spikes follow JPMorgan’s acquisition of
Bear Stearns and LBHI’s bankruptcy filing. Adrian, Burke, and McAndrews (2009) note that
“usage exploded following the Fed’s move to expand PDCF-eligible collateral on September
14 and the bankruptcy of Lehman Brothers Holdings on September 15.” The lack of usage of
the PDCF during the week before Lehman’s bankruptcy could be due to the fear of stigma.38
Valukas (2010) notes that “Paradoxically, while the PDCF was created to mitigate the liquidity
flight caused by the loss of confidence in an investment bank, use of the PDCF was seen both
within Lehman, and possibly by the broader market, as an event that could trigger a loss of
confidence. A report by Lehman Brothers Capital Markets Prime Services captured a common
critique of the facility: ‘PDCF borrowing has a considerable stigma in spite of the Fed’s efforts
to cloak access and guarantee anonymity. Instead, primary dealers view the PDCF as a last
resort and will exhaust all other financing sources before pledging collateral here. For this
reason, borrowing at this program has evaporated since the [Bear Stearns] merger closed.’ ”
The presence of the PDCF could stabilize the tri-party repo even if it is not used. For
example, investors may feel that a particular dealer is unlikely to be troubled unless conditions
deteriorate so much that multiple dealers would be in trouble at once. In such conditions,
the stigma of going to the PDCF would be reduced, as many dealer may have to rely on it.
In this example, the PDCF would provide some insurance in case conditions become worse
and which could stabilize the market even if it is not used. The surge in usage of the PDCF
following the bankruptcy of Lehman Brothers Holdings on September 15 is consistent with
this interpretation (see figure 25).
The PDCF may even have reassured some of Lehman’s tri-party repo investors. Recall that
while Lehman Brothers Holdings declared bankruptcy on September 15, the broker-dealer did
not. The investors that continued to finance the broker-dealer after September 15 did not have
to take possession of the collateral backing their repos, in most cases, in part because Lehman
38It is often believed that there is a stigma associated with borrowing at the discount window. See Ennis andWeinberg (2010) for a theory and Armantier, Ghysels, Sarkar, and Shrader (2010) for some empirical evidence.
63
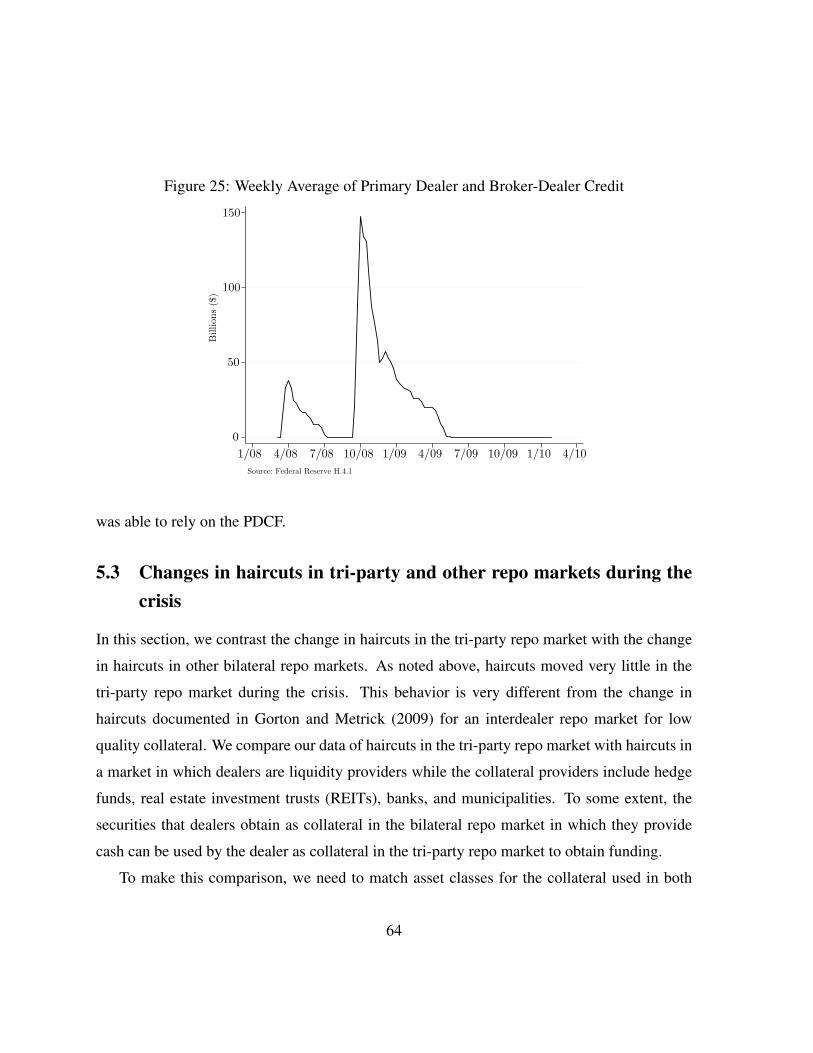
Figure 25: Weekly Average of Primary Dealer and Broker-Dealer Credit
0
50
100
150B
illions
($)
1/08 4/08 7/08 10/08 1/09 4/09 7/09 10/09 1/10 4/10
Source: Federal Reserve H.4.1
was able to rely on the PDCF.
5.3 Changes in haircuts in tri-party and other repo markets during thecrisis
In this section, we contrast the change in haircuts in the tri-party repo market with the change
in haircuts in other bilateral repo markets. As noted above, haircuts moved very little in the
tri-party repo market during the crisis. This behavior is very different from the change in
haircuts documented in Gorton and Metrick (2009) for an interdealer repo market for low
quality collateral. We compare our data of haircuts in the tri-party repo market with haircuts in
a market in which dealers are liquidity providers while the collateral providers include hedge
funds, real estate investment trusts (REITs), banks, and municipalities. To some extent, the
securities that dealers obtain as collateral in the bilateral repo market in which they provide
cash can be used by the dealer as collateral in the tri-party repo market to obtain funding.
To make this comparison, we need to match asset classes for the collateral used in both
64
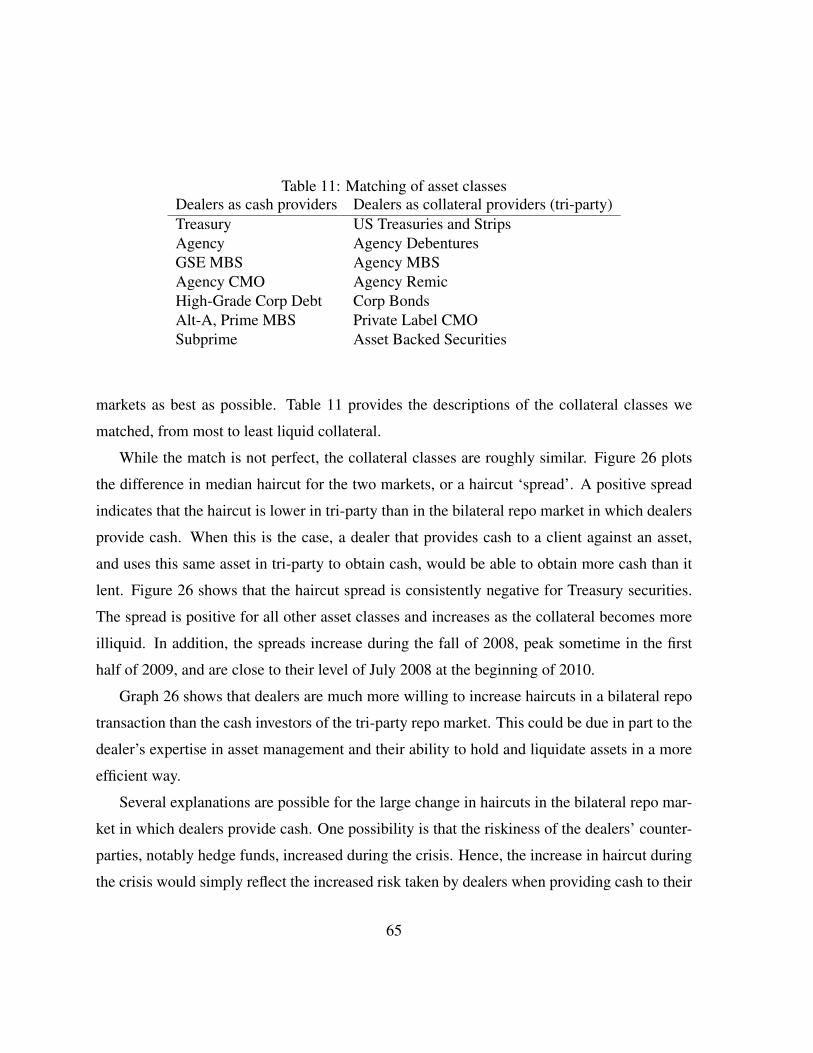
Table 11: Matching of asset classesDealers as cash providers Dealers as collateral providers (tri-party)Treasury US Treasuries and StripsAgency Agency DebenturesGSE MBS Agency MBSAgency CMO Agency RemicHigh-Grade Corp Debt Corp BondsAlt-A, Prime MBS Private Label CMOSubprime Asset Backed Securities
markets as best as possible. Table 11 provides the descriptions of the collateral classes we
matched, from most to least liquid collateral.
While the match is not perfect, the collateral classes are roughly similar. Figure 26 plots
the difference in median haircut for the two markets, or a haircut ‘spread’. A positive spread
indicates that the haircut is lower in tri-party than in the bilateral repo market in which dealers
provide cash. When this is the case, a dealer that provides cash to a client against an asset,
and uses this same asset in tri-party to obtain cash, would be able to obtain more cash than it
lent. Figure 26 shows that the haircut spread is consistently negative for Treasury securities.
The spread is positive for all other asset classes and increases as the collateral becomes more
illiquid. In addition, the spreads increase during the fall of 2008, peak sometime in the first
half of 2009, and are close to their level of July 2008 at the beginning of 2010.
Graph 26 shows that dealers are much more willing to increase haircuts in a bilateral repo
transaction than the cash investors of the tri-party repo market. This could be due in part to the
dealer’s expertise in asset management and their ability to hold and liquidate assets in a more
efficient way.
Several explanations are possible for the large change in haircuts in the bilateral repo mar-
ket in which dealers provide cash. One possibility is that the riskiness of the dealers’ counter-
parties, notably hedge funds, increased during the crisis. Hence, the increase in haircut during
the crisis would simply reflect the increased risk taken by dealers when providing cash to their
65
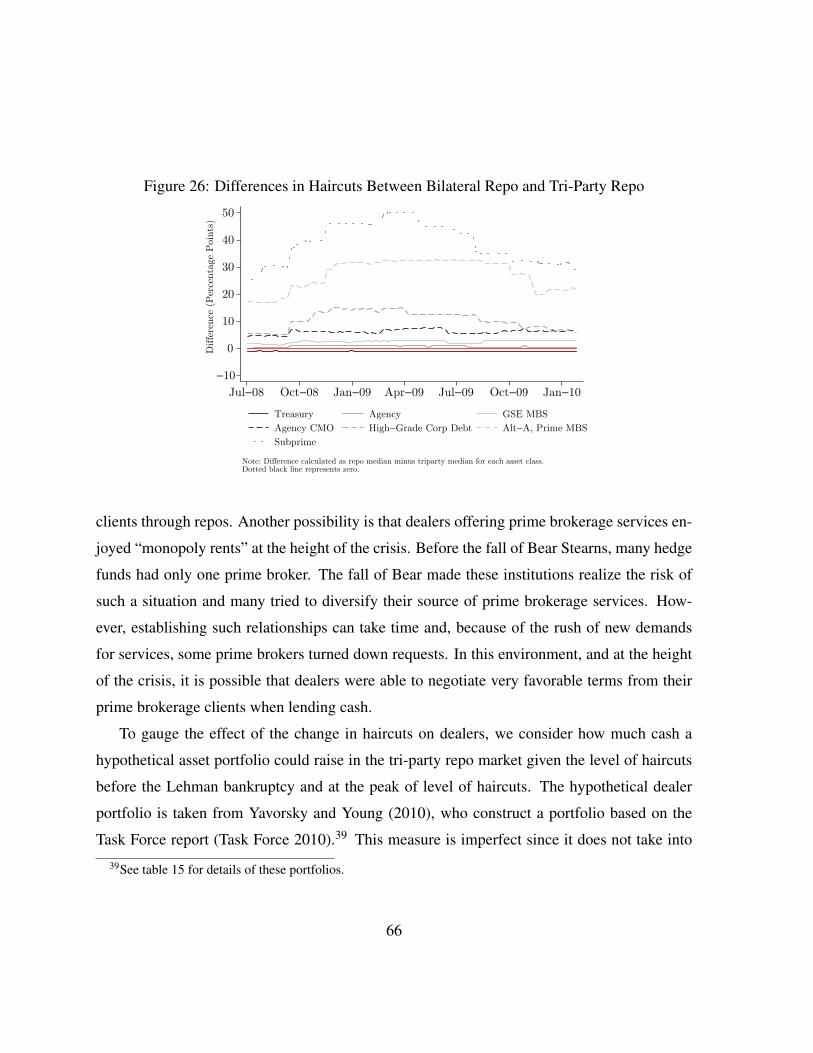
Figure 26: Differences in Haircuts Between Bilateral Repo and Tri-Party Repo
−10
0
10
20
30
40
50D
iffe
rence
(P
erce
nta
ge
Poin
ts)
Jul−08 Oct−08 Jan−09 Apr−09 Jul−09 Oct−09 Jan−10
Treasury Agency GSE MBS
Agency CMO High−Grade Corp Debt Alt−A, Prime MBS
Subprime
Note: Difference calculated as repo median minus triparty median for each asset class.Dotted black line represents zero.
clients through repos. Another possibility is that dealers offering prime brokerage services en-
joyed “monopoly rents” at the height of the crisis. Before the fall of Bear Stearns, many hedge
funds had only one prime broker. The fall of Bear made these institutions realize the risk of
such a situation and many tried to diversify their source of prime brokerage services. How-
ever, establishing such relationships can take time and, because of the rush of new demands
for services, some prime brokers turned down requests. In this environment, and at the height
of the crisis, it is possible that dealers were able to negotiate very favorable terms from their
prime brokerage clients when lending cash.
To gauge the effect of the change in haircuts on dealers, we consider how much cash a
hypothetical asset portfolio could raise in the tri-party repo market given the level of haircuts
before the Lehman bankruptcy and at the peak of level of haircuts. The hypothetical dealer
portfolio is taken from Yavorsky and Young (2010), who construct a portfolio based on the
Task Force report (Task Force 2010).39 This measure is imperfect since it does not take into
39See table 15 for details of these portfolios.
66
account the changes in the size and composition of portfolios observed during the crisis. In
addition, this measure would miss the effect of investors refusing to further lend to a counter-
party (in effect setting the haircuts to infinity). Nevertheless, it gives us a rough measure of the
liquidity impact of increased haircuts during the crisis.
The portfolio from Yavorsky and Young (2010) includes $257 billion in assets, almost
80 percent of which are Fed-eligible assets. Using the average haircuts observed in July and
August of 2008, this portfolio would have raised $250.2 billion in cash in tri-party repo. Us-
ing the average haircuts in September through December of 2008, after the Lehman Brothers
bankruptcy, this portfolio would have raised $249.1 billion in cash, about $1.1 billion less. This
funding shortfall represents less than half a percent of the value of the hypothetical portfolio.
While the haircuts in the tri-party repo market did not change very much, the haircuts that
dealers were getting from their clients increased considerably during the crisis. Consider a
dealer that lends cash to a hedge fund against a security in a bilateral repo and then uses the
security to borrow cash in the tri-party repo market. The amount of liquidity that such a dealer
would be able to generate from this transaction increased during the crisis. To get a quantitative
sense of this effect, we again use the hypothetical portfolio from Yavorsky and Young (2010).
For the purpose of this exercise, we assume that the entire portfolio is composed of collateral
from bilateral repos through which the dealer lends cash to clients. In addition, we assume that
the entire portfolio is then financed in the tri-party repo market. Using haircuts from a survey
of hedge funds, for the asset classes we were able to match, our hypothetical dealer raised an
additional 1.8% on its portfolio relative to the amount it could have raised prior to the crisis.
6 Conclusions
This paper provides a description of the mechanics of the tri-party repo market and a quanti-
tative account of the activity of that market. Our goal is to document some of the important
institutional features of the market and shed some light on the behavior of market participant
during the crisis.
67
An important finding from our study is that the tri-party repo market behaved very dif-
ferently from other repo markets. For example, Gorton and Metrick (2009) document large
increases in haircuts in an interdealer repo market. We also provide evidence of large in-
creases in haircuts for a repo market in which dealers provide cash to their clients. In contrast,
haircuts barely moved in the tri-party repo market. This difference in behavior is likely due in
part to the nature of the cash investors. Dealers specialize in managing assets and are, thus,
more willing to take the risk of having to liquidate securities if a repo counterparty to which
they have provided cash fails. Raising haircuts allows dealers to manage this risk. In addition,
some dealers that provide prime brokerage services may have been in favorable negotiating po-
sitions during the crisis as the demand for these services was particularly strong. In contrast,
tri-party repo investors are very reluctant to take possession of collateral and appear to prefer
to stop lending to a troubled counterparty, rather than raise haircuts.40 This behavior, together
with the unwind of repos in tri-party, explain why runs in this market look like traditional bank
runs, rather than haircut spirals.
Our data also indicates that the relationship between dealers and investors is very stable.
Most dealers can rely on a steady stream of funding from a given set of cash investors. While
fluctuations in funding do occur, their size is generally small relative to the size of the portfolios
being financed. The stability of these relationship could suggest that investors and dealers try
to maintain good reputations. This could play a role in explaining why investors appear to be
willing to fund dealers even in situations of market stress.
This observation is related to our last finding: While the tri-party repo market may have
been stressed, it appears to have weathered the crisis fairly well. With the notable exception of
Lehman, which saw large decrease in the number of its investors and in the quantity of assets
financed in the tri-party repo market, most dealers seem to have had reliable access to tri-party
repo funding throughout the crisis. Perhaps the biggest reason for the apparent stability of the
market is the exceptional policy actions that were taken throughout the crisis, including the
40Nevertheless, anecdotal evidence suggest that investors in the tri-party repo market behave differently thanunsecured investors. Tri-party repo funding is typically more stable than unsecured funding.
68
creation of the PDCF. In addition, because tri-party repo funding is very short-term, investors
may have been willing to continue to extend funding to dealers in times of stress until the
troubles of the dealer become acute. This allows investors to preserve long-term relationships
while still being able to pull their funding at the last minute should a dealer become too weak.
This observation is also consistent with the idea that runs in this market resemble traditional
bank runs.
69
References
ADRIAN, T., C. R. BURKE, AND J. J. MCANDREWS (2009): “The Federal Reserve’s Primary
Dealer Credit Facility,” Federal Reserve Bank of New York Current Issues in Economics and
Finance, 15(4).
ARMANTIER, O., E. GHYSELS, A. SARKAR, AND J. SHRADER (2010): “Stigma in Finan-
cial Markets: Evidence from liquidity auctions and discount window borrowing during the
crisis,” Federal Reserve Bank of New York, manuscript.
BRUNNERMEIER, M. K., AND L. H. PEDERSEN (2009): “Market Liquidity and Funding
Liquidity,” Review of Financial Studies, 22, 2201–2238.
CHARI, V. V., AND R. JAGANNATHAN (1988): “Banking panics, information, and rational
expectations equilibrium,” Journal of Finance, 43, 749760.
CPSS (2010): “Strengthening Repo Clearing and Settlement Arrangements,” Bank for Inter-
national Settlements.
CRAPO, D. (2008): “Lehman Brothers Dismantles in Bankruptcy,” Pratt’s Journal of
Bankruptcy Law, November/December, 702–9.
DIAMOND, D., AND P. DYBVIG (1983): “Bank runs, deposit insurance, and liquidity,” Journal
of Political Economy, 91, 401419.
DUFFIE, D. (2010): How Big Banks Fail And What to do About It. Princeton University Press.
ENNIS, H., AND J. WEINBERG (2010): “Over-the-Counter Loans, Adverse Selection and
Stigma in the Interbank Market,” Federal Reserve Bank of Richmond, manuscript.
FLEMING, M., AND K. GARBADE (2003): “The Repurchase Agreement Refined: GCF
Reposr,” Federal Reserve Bank of New York Current Issues in Economics and Finance,
9(6).
70
FRBNY (2010): “Tri-Party Repo Infrastructure Reform,” White Paper, Federal Reserve Bank
of New York.
FRIEDMAN, P. (2010): “Testimony of Paul Friedman Before the Financial Crisis Inquiry Com-
mission,” http://fcic.gov/hearings/pdfs/2010-0505-Friedman.pdf.
GARBADE, K. D. (2006): “The Evolution of Repo Contracting Conventions in the 1980s,”
Federal Reserve Bank of New York Economic Policy Review, 12(1), 27–42.
GEANAKOPLOS, J. (2003): “Liquidity, Default, and Crashes, Endogenous Contracts in Gen-
eral Equilibrium,” in Advances in Economics and Econometrics: Theory and Applications,
Eighth World Conference, ed. by L. P. H. M. Dewatripont, and S. J. Turnovsky, vol. 2, pp.
170 – 205. Cambridge University Press, Cambridge, MA.
GORTON, G., AND A. METRICK (2009): “Securitized Banking and the Run on Repo,” Yale
ICF Working Paper No. 09-14.
MARTIN, A., D. SKEIE, AND E.-L. VON THADDEN (2010): “Repo runs,” Federal Reserve
Bank of New York Staff Report No.444.
MORRIS, S., AND H. S. SHIN (2009): “Illiquidity Component of Credit Risk,” Princeton
University manuscript.
TASK FORCE (2010): “Task Force on Tri-Party Repo Infrastructure,” Report, Payments Risk
Committee.
TUCKMAN, B. (2010): “Systemic Risk and the Tri-Party Repo Clearing Banks,” CFS Policy
Paper.
VALUKAS, A. (2010): “Report of Anton R. Valukas, Examiner,” Report, In re Lehman Broth-
ers Holdings Inc., et al, Debtors.
71
YAVORSKY, A., AND R. YOUNG (2010): “Tri-Party Repo Market Remains a Systemic Risk
Pending Implementation of Industry Reforms,” Special Comment, Moody’s Investor Ser-
vices.
ZUBROW, B. (2010): “Written Statement of Barry Zubrow Before the Financial Crisis Inquiry
Commission,” http://www.fcic.gov/hearings/pdfs/2010-0901-Zubrow.pdf.
72
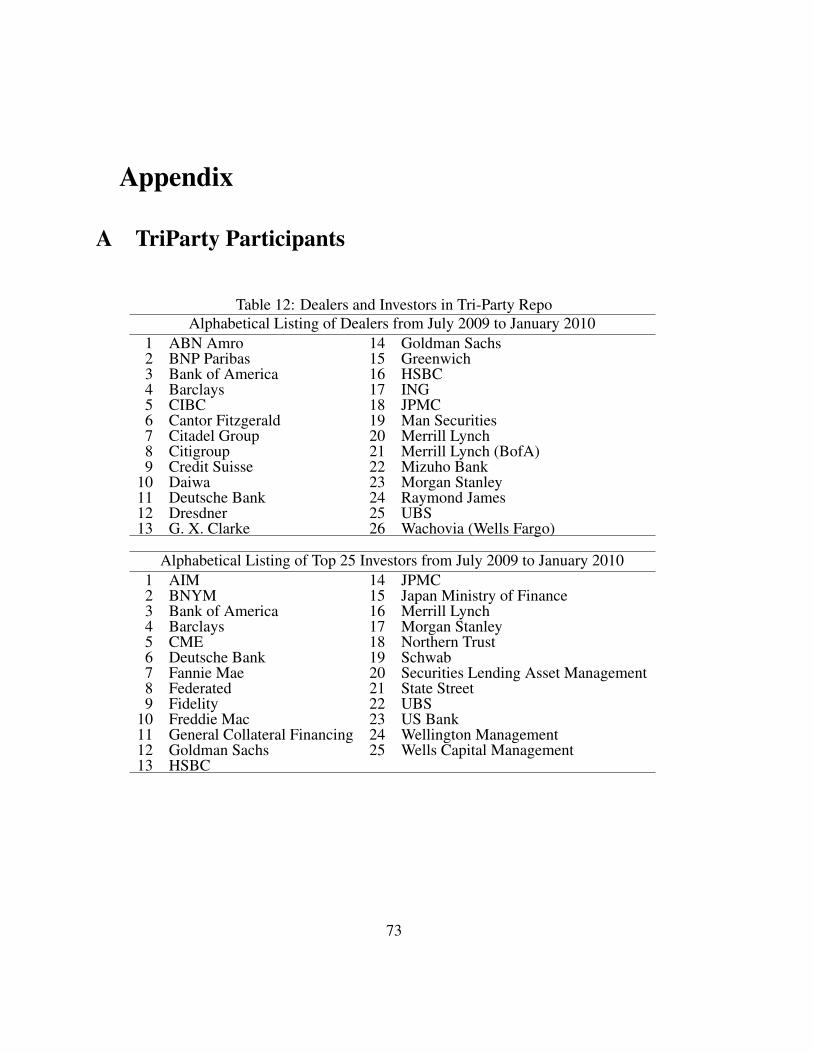
Appendix
A TriParty Participants
Table 12: Dealers and Investors in Tri-Party RepoAlphabetical Listing of Dealers from July 2009 to January 2010
1 ABN Amro 14 Goldman Sachs2 BNP Paribas 15 Greenwich3 Bank of America 16 HSBC4 Barclays 17 ING5 CIBC 18 JPMC6 Cantor Fitzgerald 19 Man Securities7 Citadel Group 20 Merrill Lynch8 Citigroup 21 Merrill Lynch (BofA)9 Credit Suisse 22 Mizuho Bank
10 Daiwa 23 Morgan Stanley11 Deutsche Bank 24 Raymond James12 Dresdner 25 UBS13 G. X. Clarke 26 Wachovia (Wells Fargo)
Alphabetical Listing of Top 25 Investors from July 2009 to January 20101 AIM 14 JPMC2 BNYM 15 Japan Ministry of Finance3 Bank of America 16 Merrill Lynch4 Barclays 17 Morgan Stanley5 CME 18 Northern Trust6 Deutsche Bank 19 Schwab7 Fannie Mae 20 Securities Lending Asset Management8 Federated 21 State Street9 Fidelity 22 UBS
10 Freddie Mac 23 US Bank11 General Collateral Financing 24 Wellington Management12 Goldman Sachs 25 Wells Capital Management13 HSBC
73
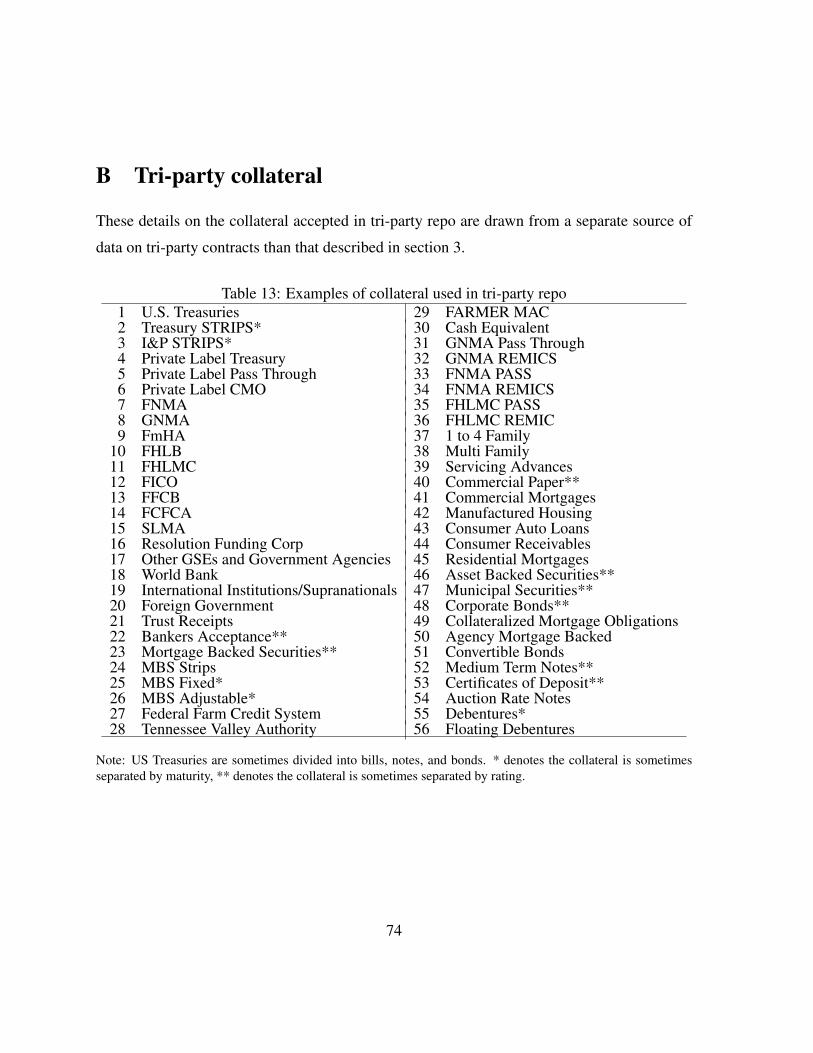
B Tri-party collateral
These details on the collateral accepted in tri-party repo are drawn from a separate source of
data on tri-party contracts than that described in section 3.
Table 13: Examples of collateral used in tri-party repo1 U.S. Treasuries 29 FARMER MAC2 Treasury STRIPS* 30 Cash Equivalent3 I&P STRIPS* 31 GNMA Pass Through4 Private Label Treasury 32 GNMA REMICS5 Private Label Pass Through 33 FNMA PASS6 Private Label CMO 34 FNMA REMICS7 FNMA 35 FHLMC PASS8 GNMA 36 FHLMC REMIC9 FmHA 37 1 to 4 Family
10 FHLB 38 Multi Family11 FHLMC 39 Servicing Advances12 FICO 40 Commercial Paper**13 FFCB 41 Commercial Mortgages14 FCFCA 42 Manufactured Housing15 SLMA 43 Consumer Auto Loans16 Resolution Funding Corp 44 Consumer Receivables17 Other GSEs and Government Agencies 45 Residential Mortgages18 World Bank 46 Asset Backed Securities**19 International Institutions/Supranationals 47 Municipal Securities**20 Foreign Government 48 Corporate Bonds**21 Trust Receipts 49 Collateralized Mortgage Obligations22 Bankers Acceptance** 50 Agency Mortgage Backed23 Mortgage Backed Securities** 51 Convertible Bonds24 MBS Strips 52 Medium Term Notes**25 MBS Fixed* 53 Certificates of Deposit**26 MBS Adjustable* 54 Auction Rate Notes27 Federal Farm Credit System 55 Debentures*28 Tennessee Valley Authority 56 Floating Debentures
Note: US Treasuries are sometimes divided into bills, notes, and bonds. * denotes the collateral is sometimesseparated by maturity, ** denotes the collateral is sometimes separated by rating.
74
C A brief overview of repo contracts
In this section, we define what is a repo, or repurchase agreement. We describe the key vari-
ables of a repo and highlight differences between repos and collateralized loans.
A repurchase agreement, or repo, is a sale of securities coupled with an agreement to
repurchase the securities at a specified price at a later date (Garbade 2006). One party, which
we call the cash investor, has cash available that it wants to invest. The other party, which we
call the collateral provider, would like to borrow cash and has assets that can be pledged as
collateral. The difference between the price at which the securities are sold, and the price at
which they are repurchased, can be thought of as the interest rate on a loan. In that respect, a
repo is similar to a collateralized loan.
However, a repo is treated differently from a collateralized loan in a bankruptcy. Indeed,
a collateralized loan is subject to the automatic stay of bankruptcy, which limits the ability of
the lender to sell the collateral quickly. Repos are securities contract and, as such, benefit from
a special treatment in case of a bankruptcy. In the tri-party repo market, the main collateral
providers are broker-dealers, which are members of the securities investor protection corpo-
ration (SIPC). SIPC was created to help investors with assets in the hands of bankrupt and
otherwise financially troubled brokerage firms recover their cash, stock and other securities.
SIPC plays some of the roles that the FDIC plays for banks, but has a narrower focus and,
in particular, provides only limited insurance to investors in SIPC members for some sorts of
losses. In the event of the bankruptcy of a SIPC member, SIPC can ask the court for a stay
that would extend to close-outs of repos. In other words, SIPC can ask for repos to be subject
to the stay of bankruptcy. SIPC routinely asks for a broad stay, but has issued several letters
in which it has committed to include in the requested order limited carve-outs for various se-
curities transactions, including repos. Hence, in practice, repos would likely not be subject to
the stay of bankruptcy. This special protection afforded to repos protects the cash investor who
can quickly recover at least part of the amount of cash it is owed by selling the collateral.
A repo is also different from a straight sale and repurchase in that it allows collateral sub-
75
stitution. This can be valuable to the collateral provider. For example, consider an institution
holding two different securities that could be sold or pledged as collateral in a repo transaction.
The institution may also expect that it will need one of the securities for some other purpose
in the near future, but it does not know which. If this institution engages in a repo with a
counterparty that is willing to accept both securities as collateral, then it can have access to the
security it needs by substituting collateral, if necessary. In contrast, if the institution engaged
in a sale, with the idea or buying back the security later, it is taking the risk of having to buy
the security back sooner than expected, which can be cumbersome and costly.
The value of the securities provided as collateral in a repo is typically different from the
amount of cash that the collateral provider receives. The difference between the two amounts
is called a “haircut” or margin. In principle either the cash or the collateral provider may
have to post margin. For example, a dealer that tries to obtain a very specific security may
have to provide cash in excess of the value of the security. In the tri-party repo market the
collateral is typically not specific and the collateral provider must pledge securities with a
value greater than the cash it receives. In either case, the haircut protects one party to the
trade from potential changes in the market value of the collateral in case of default of the other
party. In the examples above, when the cash investor posts the margin, the collateral provider
is protected against the risk that the value of the security is has provided as collateral increases,
making it more costly to acquire the security if the cash investor defaults. When the collateral
provider posts the margin, the cash investor is protected against the risk that the value of the
security it holds as collateral decreases.
D Financing with a “first-come-first-serve” constraint: bi-lateral repos
For comparison, it is interesting to consider the case of a bilateral repo market. Because the
repos are bilateral, there is a “first-come-first-serve” constraint for the investors. Assume that
76
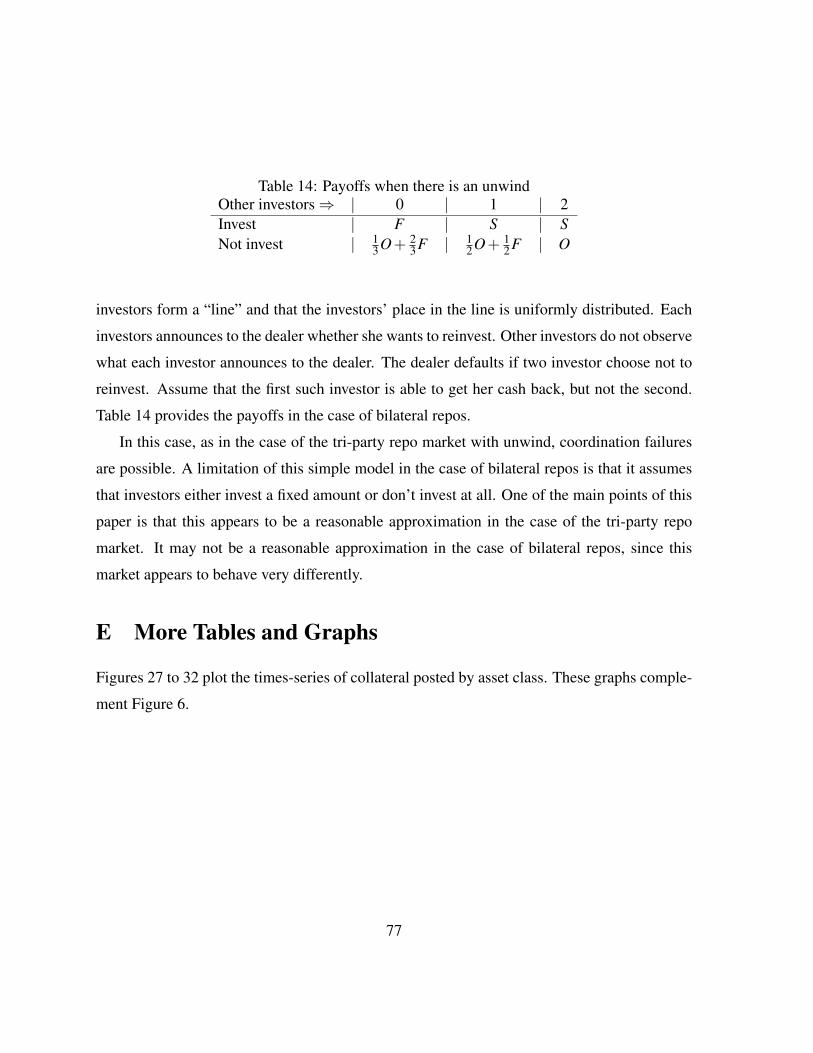
Table 14: Payoffs when there is an unwindOther investors ⇒ | 0 | 1 | 2Invest | F | S | SNot invest | 1
3O+ 23F | 1
2O+ 12F | O
investors form a “line” and that the investors’ place in the line is uniformly distributed. Each
investors announces to the dealer whether she wants to reinvest. Other investors do not observe
what each investor announces to the dealer. The dealer defaults if two investor choose not to
reinvest. Assume that the first such investor is able to get her cash back, but not the second.
Table 14 provides the payoffs in the case of bilateral repos.
In this case, as in the case of the tri-party repo market with unwind, coordination failures
are possible. A limitation of this simple model in the case of bilateral repos is that it assumes
that investors either invest a fixed amount or don’t invest at all. One of the main points of this
paper is that this appears to be a reasonable approximation in the case of the tri-party repo
market. It may not be a reasonable approximation in the case of bilateral repos, since this
market appears to behave very differently.
E More Tables and Graphs
Figures 27 to 32 plot the times-series of collateral posted by asset class. These graphs comple-
ment Figure 6.
77
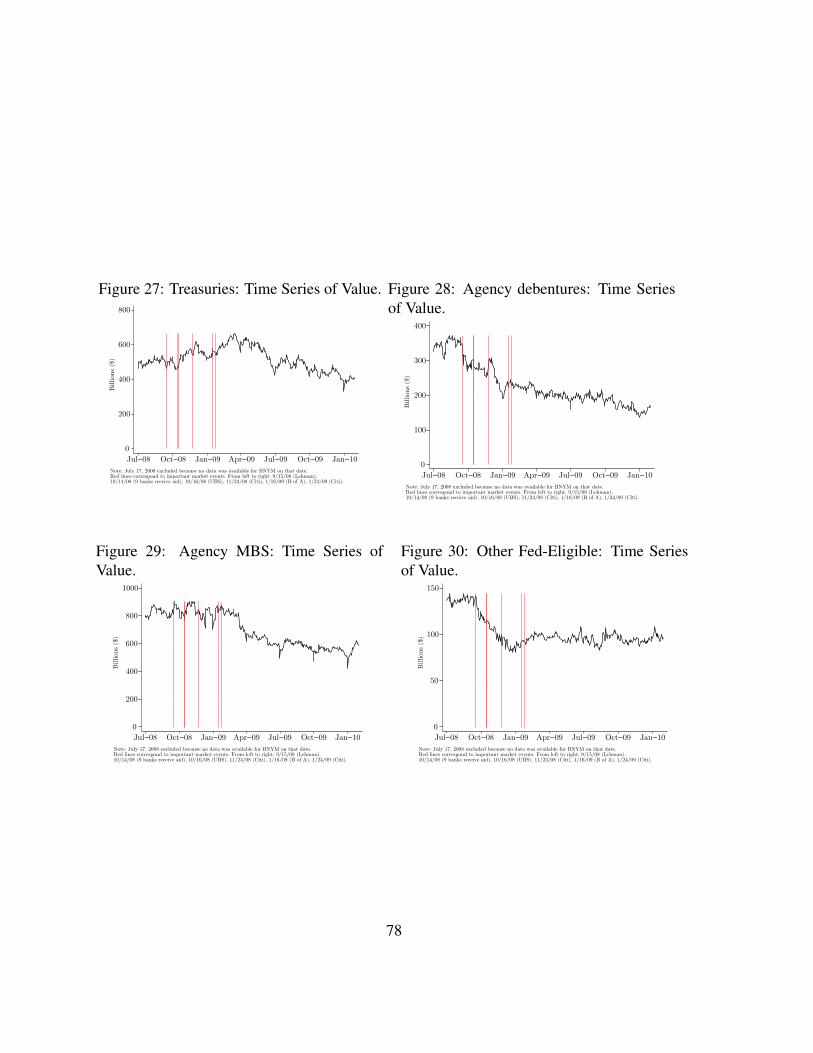
Figure 27: Treasuries: Time Series of Value.
0
200
400
600
800
Billions
($)
Jul−08 Oct−08 Jan−09 Apr−09 Jul−09 Oct−09 Jan−10
Note: July 17, 2008 excluded because no data was available for BNYM on that date.Red lines correspond to important market events. From left to right: 9/15/08 (Lehman),10/14/08 (9 banks receive aid), 10/16/08 (UBS), 11/23/08 (Citi), 1/16/09 (B of A), 1/24/09 (Citi).
Figure 28: Agency debentures: Time Seriesof Value.
0
100
200
300
400
Billions
($)
Jul−08 Oct−08 Jan−09 Apr−09 Jul−09 Oct−09 Jan−10
Note: July 17, 2008 excluded because no data was available for BNYM on that date.Red lines correspond to important market events. From left to right: 9/15/08 (Lehman),10/14/08 (9 banks receive aid), 10/16/08 (UBS), 11/23/08 (Citi), 1/16/09 (B of A), 1/24/09 (Citi).
Figure 29: Agency MBS: Time Series ofValue.
0
200
400
600
800
1000
Billions
($)
Jul−08 Oct−08 Jan−09 Apr−09 Jul−09 Oct−09 Jan−10
Note: July 17, 2008 excluded because no data was available for BNYM on that date.Red lines correspond to important market events. From left to right: 9/15/08 (Lehman),10/14/08 (9 banks receive aid), 10/16/08 (UBS), 11/23/08 (Citi), 1/16/09 (B of A), 1/24/09 (Citi).
Figure 30: Other Fed-Eligible: Time Seriesof Value.
0
50
100
150
Billions
($)
Jul−08 Oct−08 Jan−09 Apr−09 Jul−09 Oct−09 Jan−10
Note: July 17, 2008 excluded because no data was available for BNYM on that date.Red lines correspond to important market events. From left to right: 9/15/08 (Lehman),10/14/08 (9 banks receive aid), 10/16/08 (UBS), 11/23/08 (Citi), 1/16/09 (B of A), 1/24/09 (Citi).
78
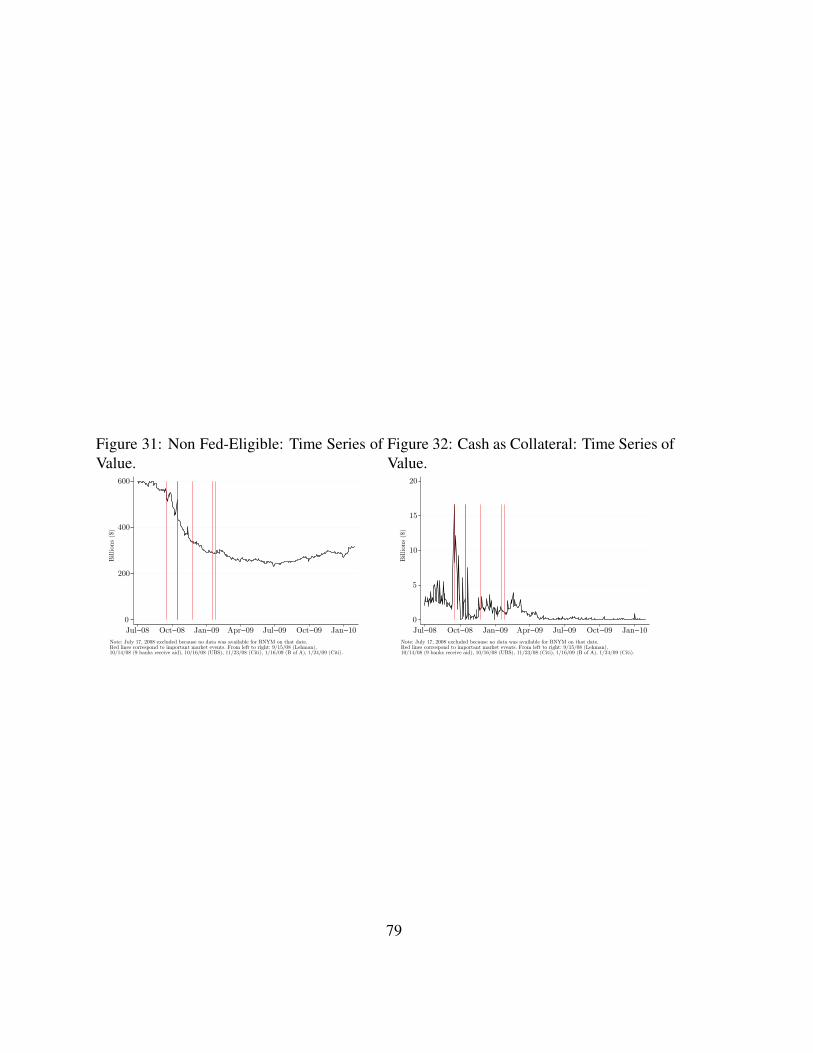
Figure 31: Non Fed-Eligible: Time Series ofValue.
0
200
400
600
Billions
($)
Jul−08 Oct−08 Jan−09 Apr−09 Jul−09 Oct−09 Jan−10
Note: July 17, 2008 excluded because no data was available for BNYM on that date.Red lines correspond to important market events. From left to right: 9/15/08 (Lehman),10/14/08 (9 banks receive aid), 10/16/08 (UBS), 11/23/08 (Citi), 1/16/09 (B of A), 1/24/09 (Citi).
Figure 32: Cash as Collateral: Time Series ofValue.
0
5
10
15
20
Billions
($)
Jul−08 Oct−08 Jan−09 Apr−09 Jul−09 Oct−09 Jan−10
Note: July 17, 2008 excluded because no data was available for BNYM on that date.Red lines correspond to important market events. From left to right: 9/15/08 (Lehman),10/14/08 (9 banks receive aid), 10/16/08 (UBS), 11/23/08 (Citi), 1/16/09 (B of A), 1/24/09 (Citi).
79
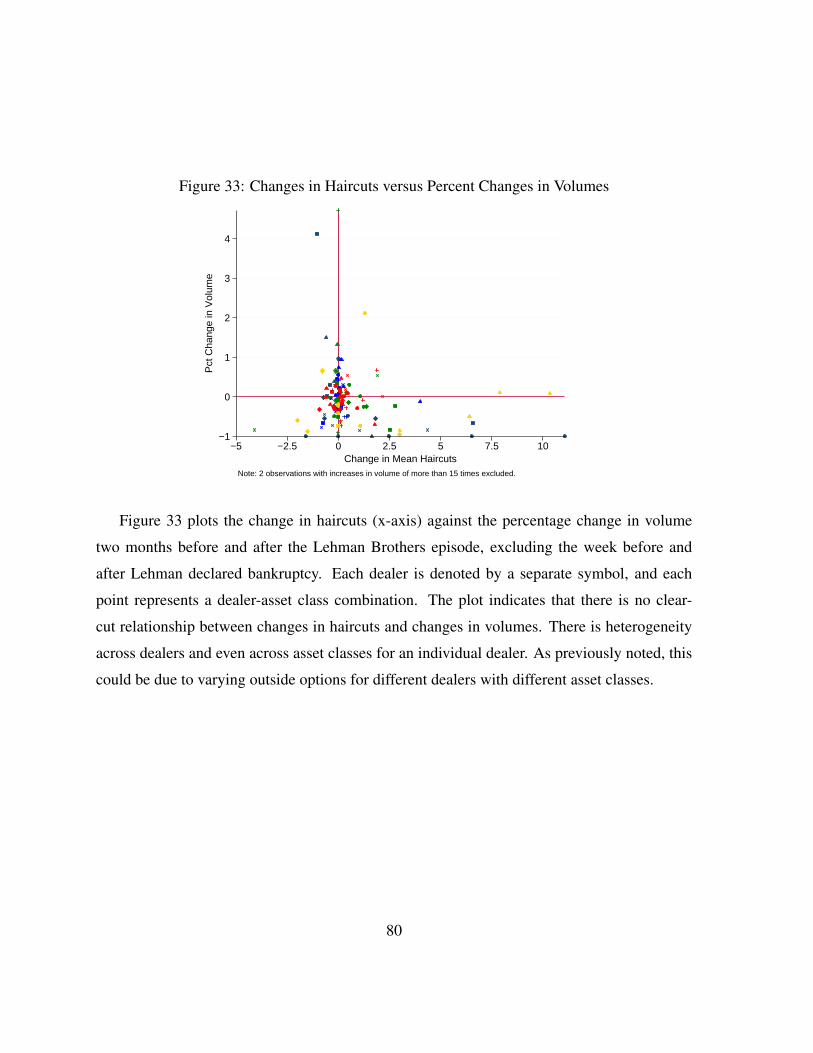
Figure 33: Changes in Haircuts versus Percent Changes in Volumes
−1
0
1
2
3
4
Pct
Cha
nge
in V
olum
e
−5 −2.5 0 2.5 5 7.5 10Change in Mean Haircuts
Note: 2 observations with increases in volume of more than 15 times excluded.
Figure 33 plots the change in haircuts (x-axis) against the percentage change in volume
two months before and after the Lehman Brothers episode, excluding the week before and
after Lehman declared bankruptcy. Each dealer is denoted by a separate symbol, and each
point represents a dealer-asset class combination. The plot indicates that there is no clear-
cut relationship between changes in haircuts and changes in volumes. There is heterogeneity
across dealers and even across asset classes for an individual dealer. As previously noted, this
could be due to varying outside options for different dealers with different asset classes.
80
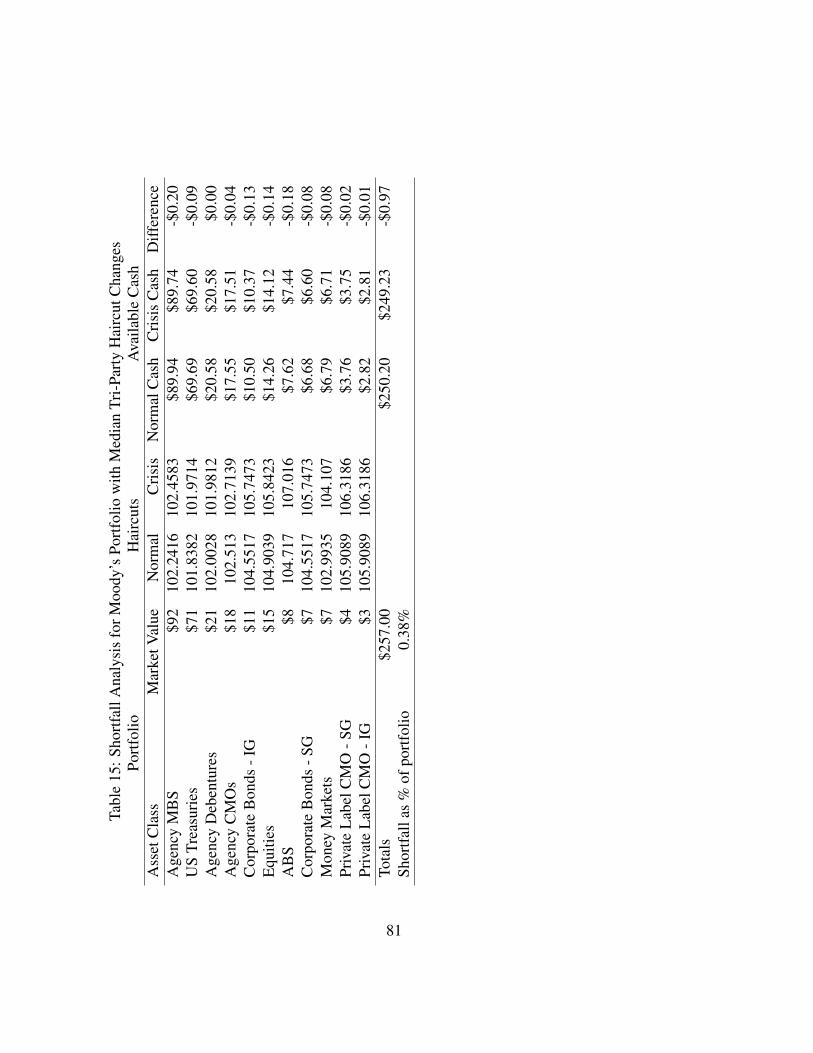
Tabl
e15
:Sho
rtfa
llA
naly
sis
forM
oody
’sPo
rtfo
liow
ithM
edia
nTr
i-Pa
rty
Hai
rcut
Cha
nges
Port
folio
Hai
rcut
sA
vaila
ble
Cas
hA
sset
Cla
ssM
arke
tVal
ueN
orm
alC
risi
sN
orm
alC
ash
Cri
sis
Cas
hD
iffer
ence
Age
ncy
MB
S$9
210
2.24
1610
2.45
83$8
9.94
$89.
74-$
0.20
US
Trea
suri
es$7
110
1.83
8210
1.97
14$6
9.69
$69.
60-$
0.09
Age
ncy
Deb
entu
res
$21
102.
0028
101.
9812
$20.
58$2
0.58
$0.0
0A
genc
yC
MO
s$1
810
2.51
310
2.71
39$1
7.55
$17.
51-$
0.04
Cor
pora
teB
onds
-IG
$11
104.
5517
105.
7473
$10.
50$1
0.37
-$0.
13E
quiti
es$1
510
4.90
3910
5.84
23$1
4.26
$14.
12-$
0.14
AB
S$8
104.
717
107.
016
$7.6
2$7
.44
-$0.
18C
orpo
rate
Bon
ds-S
G$7
104.
5517
105.
7473
$6.6
8$6
.60
-$0.
08M
oney
Mar
kets
$710
2.99
3510
4.10
7$6
.79
$6.7
1-$
0.08
Priv
ate
Lab
elC
MO
-SG
$410
5.90
8910
6.31
86$3
.76
$3.7
5-$
0.02
Priv
ate
Lab
elC
MO
-IG
$310
5.90
8910
6.31
86$2
.82
$2.8
1-$
0.01
Tota
ls$2
57.0
0$2
50.2
0$2
49.2
3-$
0.97
Shor
tfall
as%
ofpo
rtfo
lio0.
38%
81