Embed Size (px)
Citation preview

The True-Luxury Global Consumer Insight
4th Edition
Milan, February 16th, 2017
EXTRACT
CONFIDENTIAL
BCG Altagamma True-Lux Global Cons Insight 2017 VExtract.pptx 1
Draft—for discussion only
Co
pyrig
ht ©
20
16
by T
he
Bo
sto
n C
on
su
ltin
g G
rou
p,
Inc.
All
rig
hts
re
se
rve
d.
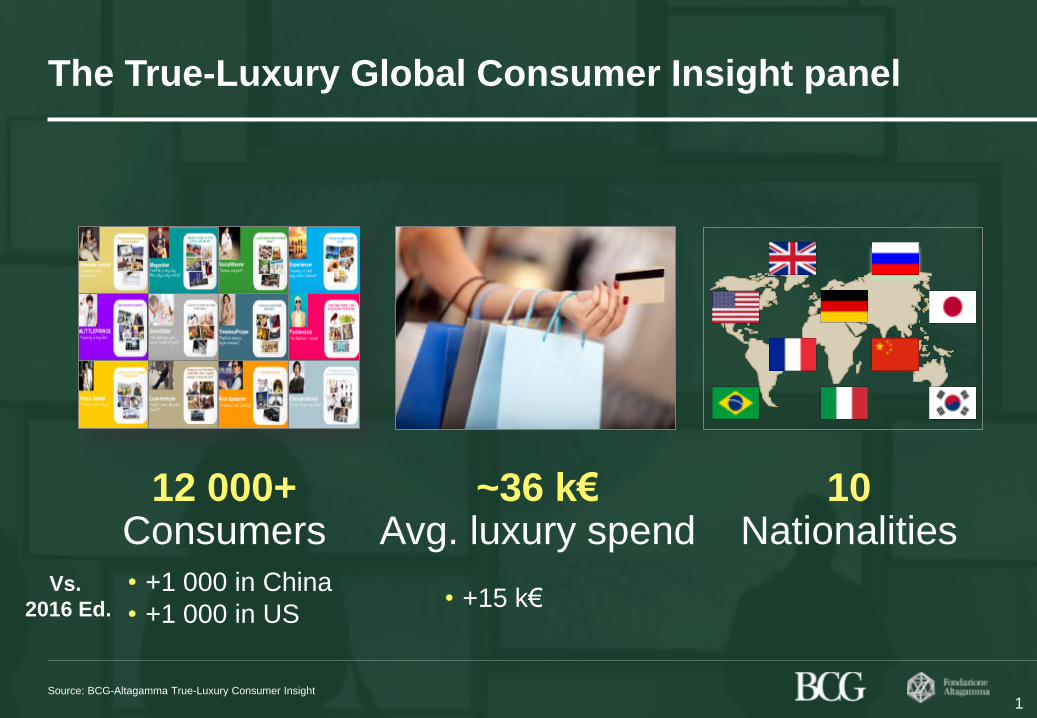
The True-Luxury Global Consumer Insight panel
Source: BCG-Altagamma True-Luxury Consumer Insight
10 Nationalities
~36 k€ Avg. luxury spend
12 000+ Consumers
Vs.
2016 Ed.
1
• +1 000 in China
• +1 000 in US • +15 k€
BCG Altagamma True-Lux Global Cons Insight 2017 VExtract.pptx 2
Draft—for discussion only
Co
pyrig
ht ©
20
16
by T
he
Bo
sto
n C
on
su
ltin
g G
rou
p,
Inc.
All
rig
hts
re
se
rve
d.
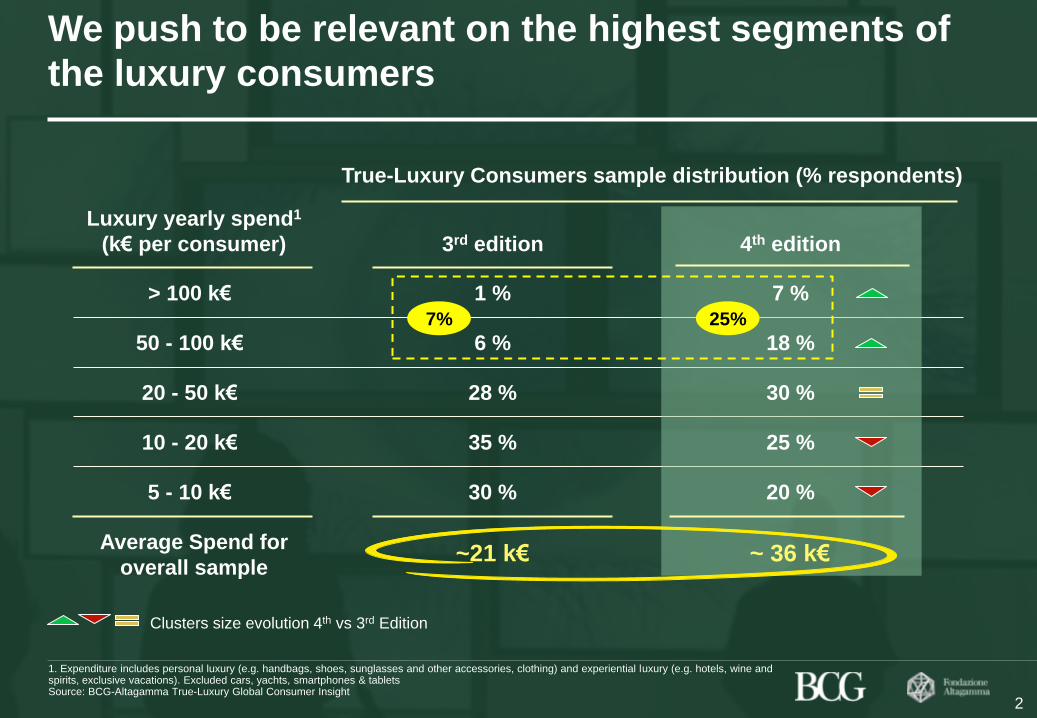
We push to be relevant on the highest segments of
the luxury consumers
Luxury yearly spend1
(k€ per consumer)
> 100 k€
50 - 100 k€
20 - 50 k€
10 - 20 k€
5 - 10 k€
Average Spend for
overall sample
3rd edition
1 %
6 %
28 %
35 %
30 %
~21 k€
1. Expenditure includes personal luxury (e.g. handbags, shoes, sunglasses and other accessories, clothing) and experiential luxury (e.g. hotels, wine and spirits, exclusive vacations). Excluded cars, yachts, smartphones & tablets Source: BCG-Altagamma True-Luxury Global Consumer Insight
True-Luxury Consumers sample distribution (% respondents)
Clusters size evolution 4th vs 3rd Edition
7 %
18 %
30 %
25 %
20 %
~ 36 k€
4th edition
7% 25%
2
BCG Altagamma True-Lux Global Cons Insight 2017 VExtract.pptx 3
Draft—for discussion only
Co
pyrig
ht ©
20
16
by T
he
Bo
sto
n C
on
su
ltin
g G
rou
p,
Inc.
All
rig
hts
re
se
rve
d.
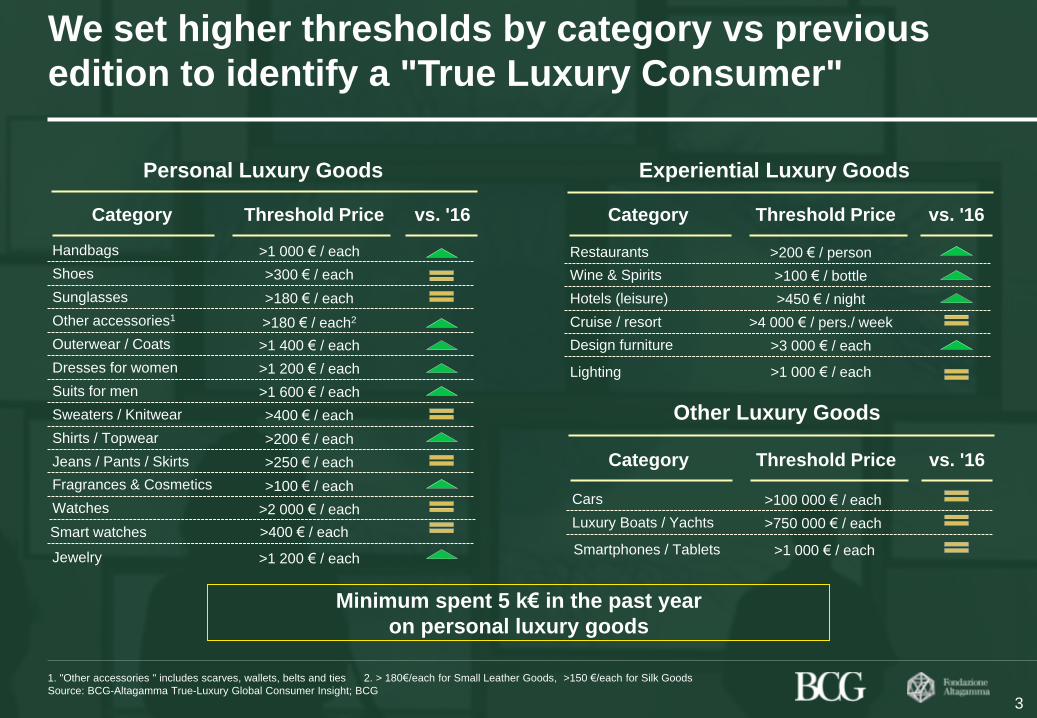
We set higher thresholds by category vs previous
edition to identify a "True Luxury Consumer"
>400 € / each Smart watches
Threshold Price
>1 000 € / each
>300 € / each
>180 € / each
>180 € / each2
>1 400 € / each
>1 200 € / each
>1 600 € / each
>400 € / each
>200 € / each
>250 € / each
>100 € / each
>2 000 € / each >100 000 € / each
>750 000 € / each
>450 € / night
>4 000 € / pers./ week
>3 000 € / each
>100 € / bottle
>1 200 € / each
>200 € / person
Category
Handbags
Shoes
Sunglasses
Other accessories1
Outerwear / Coats
Dresses for women
Suits for men
Sweaters / Knitwear
Shirts / Topwear
Jeans / Pants / Skirts
Fragrances & Cosmetics
Watches Cars
Luxury Boats / Yachts
Hotels (leisure)
Cruise / resort
Design furniture
Wine & Spirits
Jewelry
Restaurants
>1 000 € / each Lighting
>1 000 € / each Smartphones / Tablets
1. "Other accessories " includes scarves, wallets, belts and ties 2. > 180€/each for Small Leather Goods, >150 €/each for Silk Goods
Source: BCG-Altagamma True-Luxury Global Consumer Insight; BCG
Minimum spent 5 k€ in the past year
on personal luxury goods
Threshold Price Category vs. '16 vs. '16
Personal Luxury Goods Experiential Luxury Goods
3
Other Luxury Goods
Threshold Price Category vs. '16
BCG Altagamma True-Lux Global Cons Insight 2017 VExtract.pptx 4
Draft—for discussion only
Co
pyrig
ht ©
20
16
by T
he
Bo
sto
n C
on
su
ltin
g G
rou
p,
Inc.
All
rig
hts
re
se
rve
d.
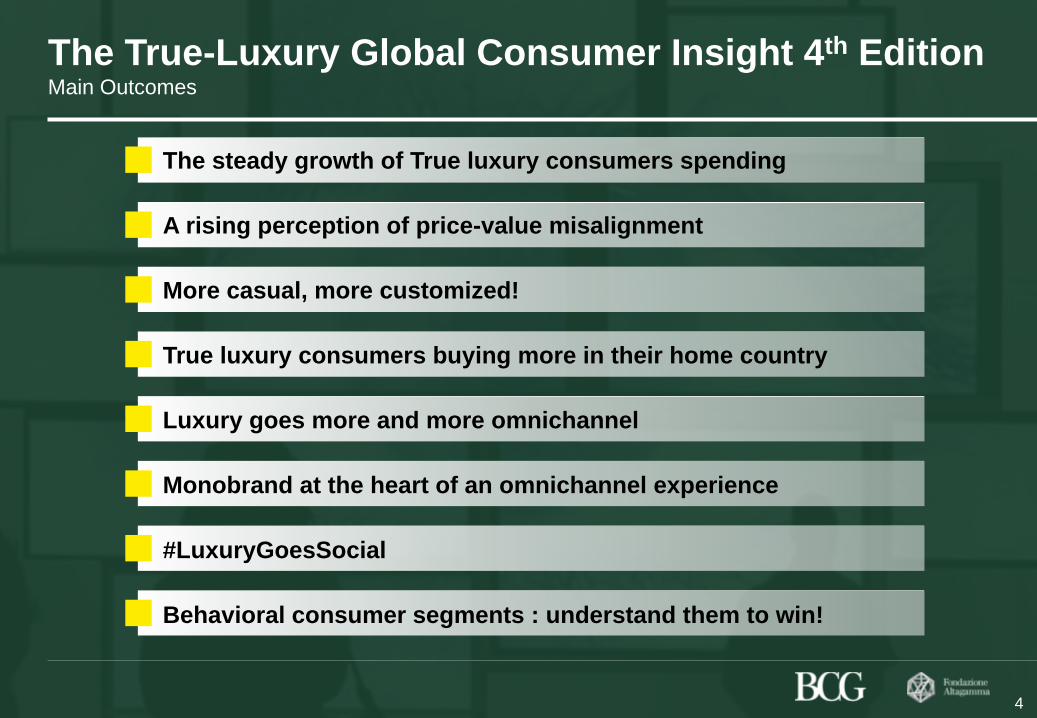
The True-Luxury Global Consumer Insight 4th Edition Main Outcomes
The steady growth of True luxury consumers spending
A rising perception of price-value misalignment
More casual, more customized!
True luxury consumers buying more in their home country
Luxury goes more and more omnichannel
Monobrand at the heart of an omnichannel experience
#LuxuryGoesSocial
Behavioral consumer segments : understand them to win!
4
primocapitolo.pptx 5
Draft—for discussion only
Co
pyrig
ht ©
20
16
by T
he
Bo
sto
n C
on
su
ltin
g G
rou
p,
Inc.
All
rig
hts
re
se
rve
d.
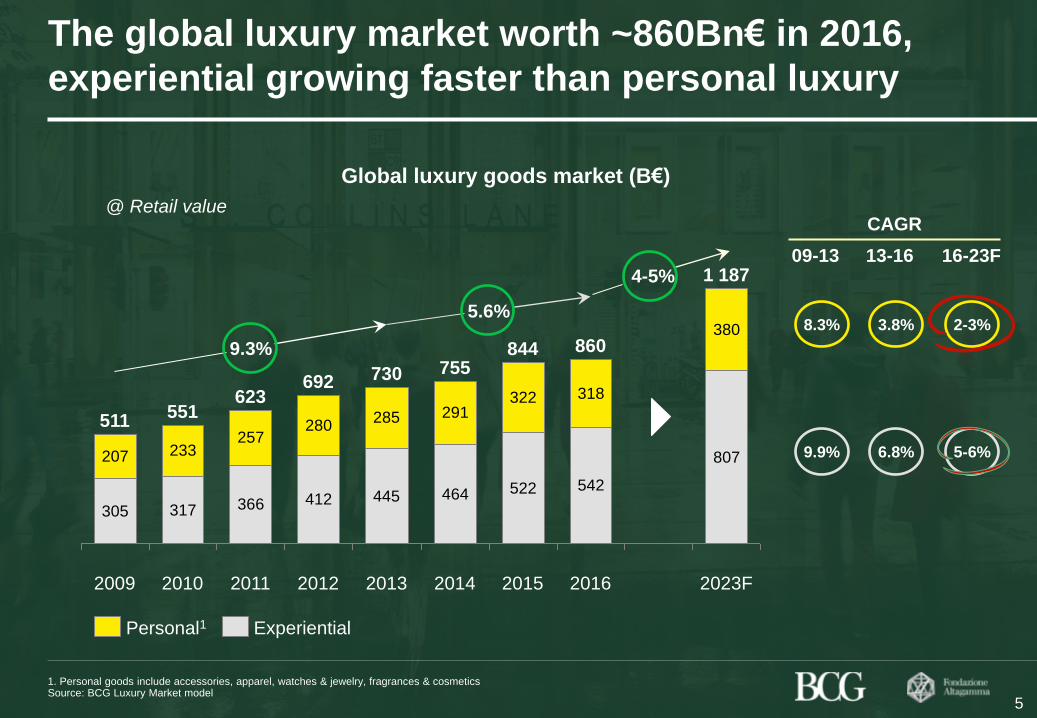
The global luxury market worth ~860Bn€ in 2016,
experiential growing faster than personal luxury
1. Personal goods include accessories, apparel, watches & jewelry, fragrances & cosmetics Source: BCG Luxury Market model
Global luxury goods market (B€)
305 317 366 412 445 464 522 542
807207 233257
280285 291
322 318
380
2010
551 511
2009
1 187
2023F
623
2011
860
2016
9.3%
5.6%
844
2015
755
2014
730
2013
692
2012
@ Retail value
09-13
5
Personal1 Experiential
13-16 16-23F
CAGR
8.3%
9.9%
3.8% 2-3%
6.8% 5-6%
4-5%

primocapitolo.pptx 6
Draft—for discussion only
Co
pyrig
ht ©
20
16
by T
he
Bo
sto
n C
on
su
ltin
g G
rou
p,
Inc.
All
rig
hts
re
se
rve
d.
A further polarizing pyramid ahead: True-Luxury
Consumers up from ~29% to ~32% of global market
4.5
1.3
11
6
2.0
14
17 22
2016
# (M) Bn(€)1 Bn(€)1
2023
93
30
107
250
141
53
147
381
21 28 61 92
375 549 715
+131
+196
~415 ~860 ~1185
+325
Total Luxury
Consumers
# (M)
~490
440
1. Including Experiential and Personal luxury, excluding cars and Yachts Note: rounded numbers Source: BCG Luxury Market model
6
CLUSTER
2 k€
5 k€
20 k€
10 k€
50 k€ 0.4 0.5 20 40
Absolute
Top Absolute
Entry Absolute
Top Aspirational
Other Aspirational
Beyond money
Total True-Luxury
primocapitolo.pptx 7
Draft—for discussion only
Co
pyrig
ht ©
20
16
by T
he
Bo
sto
n C
on
su
ltin
g G
rou
p,
Inc.
All
rig
hts
re
se
rve
d.
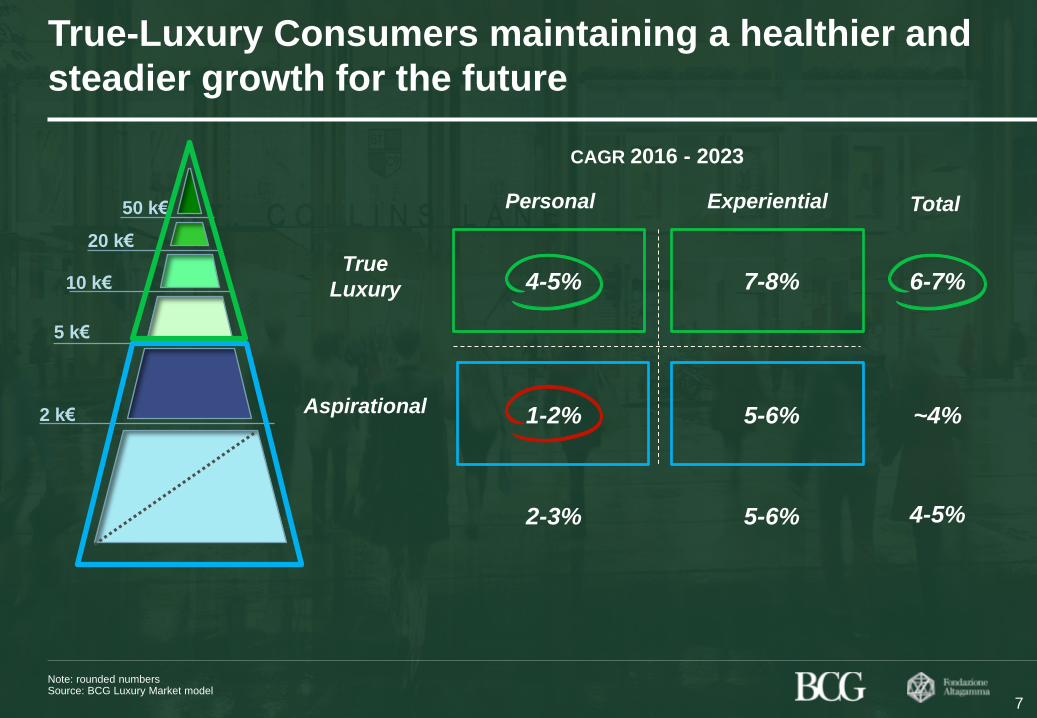
True-Luxury Consumers maintaining a healthier and
steadier growth for the future
Note: rounded numbers Source: BCG Luxury Market model
7
2 k€
5 k€
20 k€
10 k€
50 k€ Personal Experiential
True
Luxury
CAGR 2016 - 2023
2-3% 5-6%
6-7%
~4%
7-8%
5-6%
4-5%
1-2% Aspirational
4-5%
Total
primocapitolo.pptx 8
Draft—for discussion only
Co
pyrig
ht ©
20
16
by T
he
Bo
sto
n C
on
su
ltin
g G
rou
p,
Inc.
All
rig
hts
re
se
rve
d.
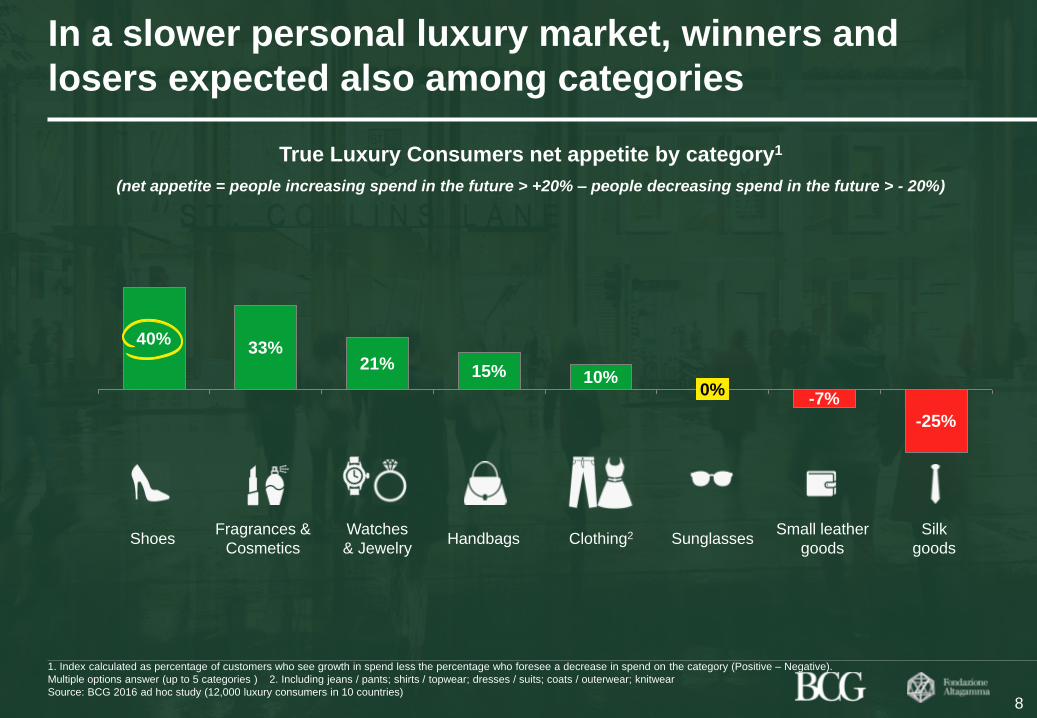
In a slower personal luxury market, winners and
losers expected also among categories
21% 33%
40%
10% 15%
-7% 0%
-25%
True Luxury Consumers net appetite by category1
(net appetite = people increasing spend in the future > +20% – people decreasing spend in the future > - 20%)
Shoes Fragrances &
Cosmetics
Watches
& Jewelry Handbags Sunglasses Small leather
goods
Silk
goods Clothing2
1. Index calculated as percentage of customers who see growth in spend less the percentage who foresee a decrease in spend on the category (Positive – Negative).
Multiple options answer (up to 5 categories ) 2. Including jeans / pants; shirts / topwear; dresses / suits; coats / outerwear; knitwear
Source: BCG 2016 ad hoc study (12,000 luxury consumers in 10 countries)
8
primocapitolo.pptx 9
Draft—for discussion only
Co
pyrig
ht ©
20
16
by T
he
Bo
sto
n C
on
su
ltin
g G
rou
p,
Inc.
All
rig
hts
re
se
rve
d.
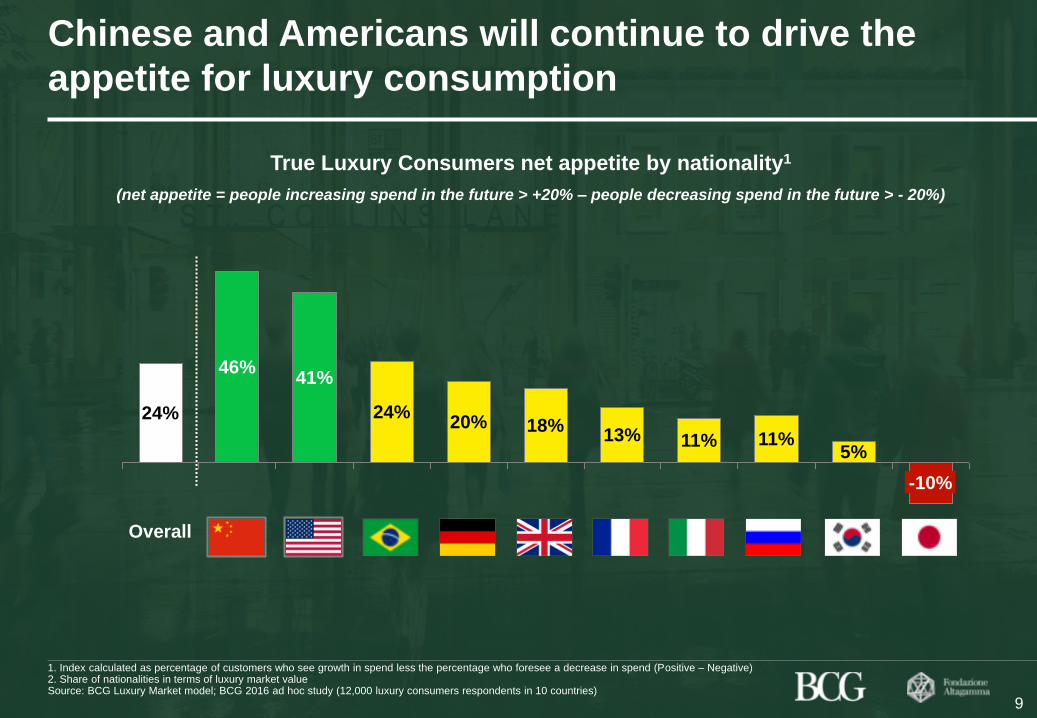
Chinese and Americans will continue to drive the
appetite for luxury consumption
11% 18%
13%
-10%
5% 11%
20% 24%
41% 46%
Overall
24%
True Luxury Consumers net appetite by nationality1
(net appetite = people increasing spend in the future > +20% – people decreasing spend in the future > - 20%)
1. Index calculated as percentage of customers who see growth in spend less the percentage who foresee a decrease in spend (Positive – Negative) 2. Share of nationalities in terms of luxury market value Source: BCG Luxury Market model; BCG 2016 ad hoc study (12,000 luxury consumers respondents in 10 countries)
9
BCG Altagamma True-Luxury Global Consumer Insight 2017 Edition_Draft PPT_v44(Storyline).pptx 10
Draft—for discussion only
Co
pyrig
ht ©
20
16
by T
he
Bo
sto
n C
on
su
ltin
g G
rou
p,
Inc.
All
rig
hts
re
se
rve
d.
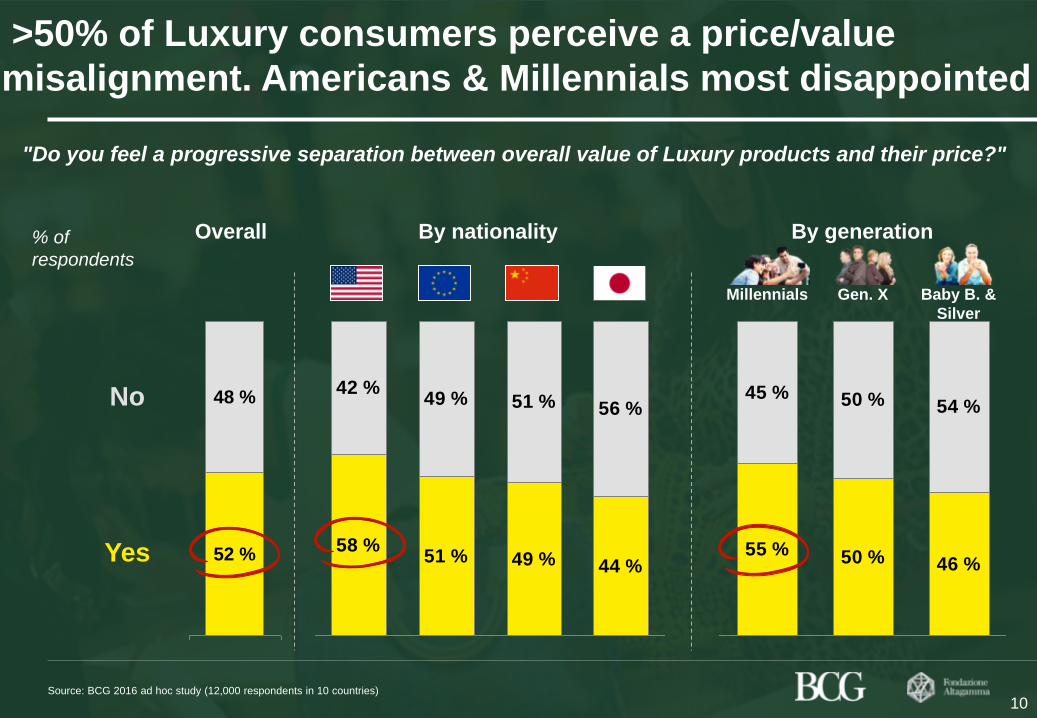
>50% of Luxury consumers perceive a price/value
misalignment. Americans & Millennials most disappointed
% of
respondents
Overall
Source: BCG 2016 ad hoc study (12,000 respondents in 10 countries)
"Do you feel a progressive separation between overall value of Luxury products and their price?"
By nationality By generation
52 %
48 %
58 %51 % 49 % 44 %
42 %49 % 51 % 56 %
55 % 50 % 46 %
45 % 50 % 54 %
Gen. X
10
Baby B. &
Silver
Millennials
No
Yes
BCG Altagamma True-Luxury Global Consumer Insight 2017 Edition_Draft PPT_v44(Storyline).pptx 11
Draft—for discussion only
Co
pyrig
ht ©
20
16
by T
he
Bo
sto
n C
on
su
ltin
g G
rou
p,
Inc.
All
rig
hts
re
se
rve
d.
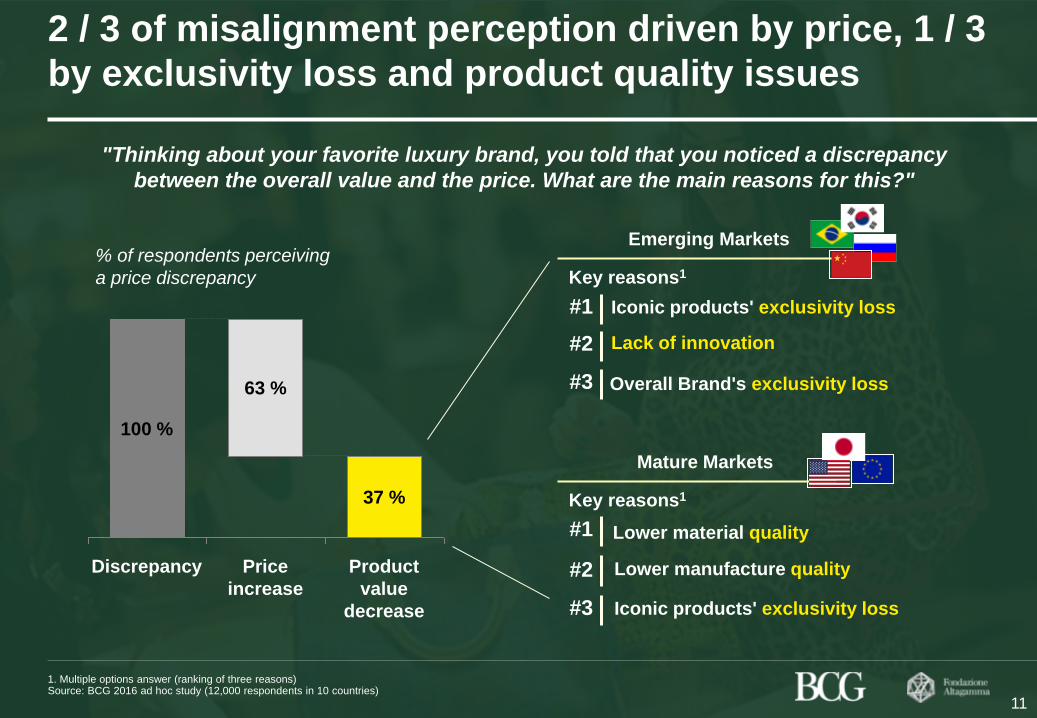
2 / 3 of misalignment perception driven by price, 1 / 3
by exclusivity loss and product quality issues
Discrepancy
100 %
Product
value
decrease
63 %
37 %
Price
increase
1. Multiple options answer (ranking of three reasons) Source: BCG 2016 ad hoc study (12,000 respondents in 10 countries)
"Thinking about your favorite luxury brand, you told that you noticed a discrepancy
between the overall value and the price. What are the main reasons for this?"
11
Emerging Markets
Mature Markets
#1
#2
#3
Lower manufacture quality
Lower material quality
Iconic products' exclusivity loss
% of respondents perceiving
a price discrepancy
Key reasons1
#1
#2
#3
Lack of innovation
Iconic products' exclusivity loss
Overall Brand's exclusivity loss
Key reasons1
BCG Altagamma True-Luxury Global Consumer Insight 2017 Edition_Draft PPT_v44(Storyline).pptx 12
Draft—for discussion only
Co
pyrig
ht ©
20
16
by T
he
Bo
sto
n C
on
su
ltin
g G
rou
p,
Inc.
All
rig
hts
re
se
rve
d.
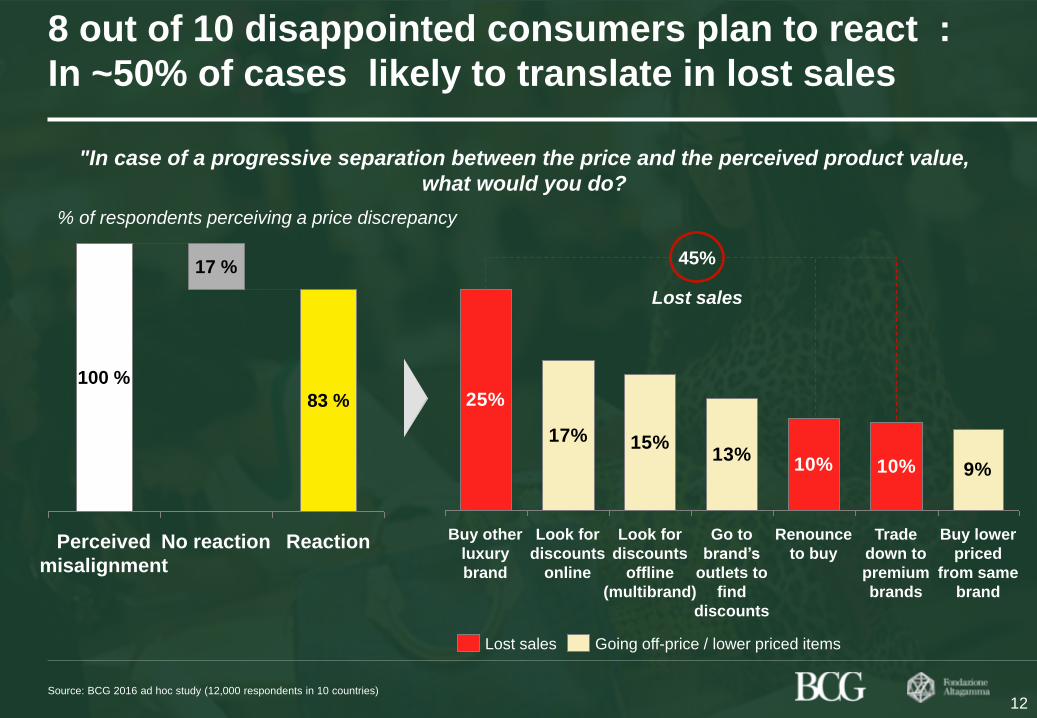
8 out of 10 disappointed consumers plan to react :
In ~50% of cases likely to translate in lost sales
Reaction
83 %
No reaction
17 %
Perceived
misalignment
100 %
"In case of a progressive separation between the price and the perceived product value,
what would you do?
12
17% 15%13%
9%
25%
10% 10%
Buy lower
priced
from same
brand
Trade
down to
premium
brands
Renounce
to buy
Go to
brand’s
outlets to
find
discounts
Look for
discounts
offline
(multibrand)
Look for
discounts
online
Buy other
luxury
brand
Going off-price / lower priced items Lost sales
Source: BCG 2016 ad hoc study (12,000 respondents in 10 countries)
% of respondents perceiving a price discrepancy
45%
Lost sales
BCG Altagamma True-Lux Global Cons Insight 2017 VExtract.pptx 13
Draft—for discussion only
Co
pyrig
ht ©
20
16
by T
he
Bo
sto
n C
on
su
ltin
g G
rou
p,
Inc.
All
rig
hts
re
se
rve
d.
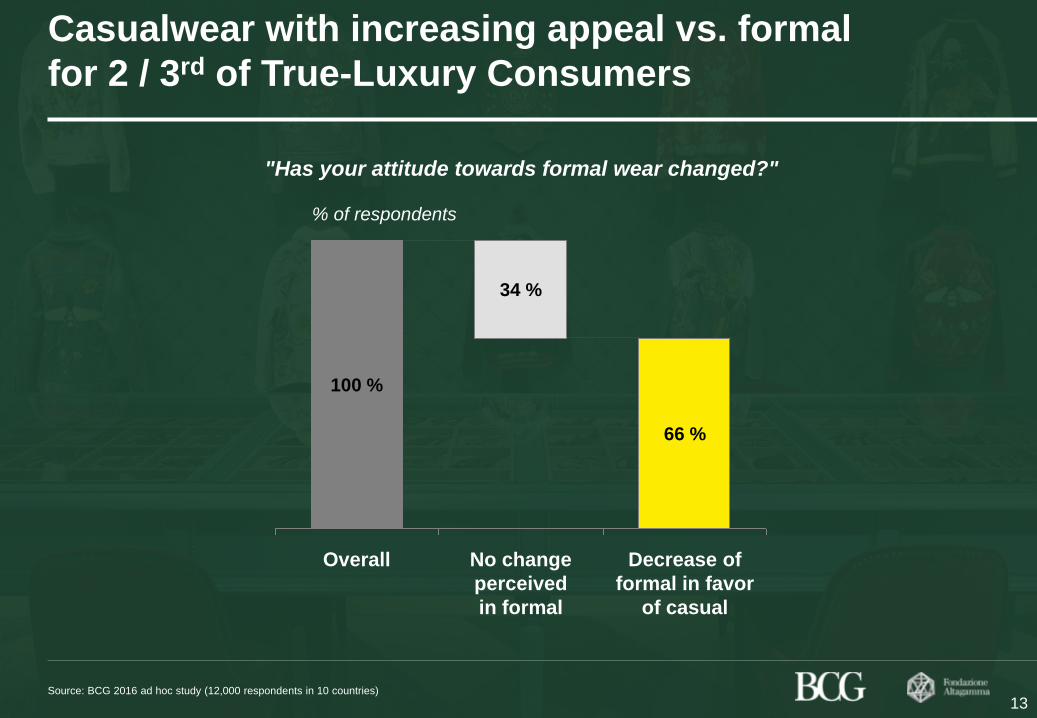
Casualwear with increasing appeal vs. formal
for 2 / 3rd of True-Luxury Consumers
Decrease of
formal in favor
of casual
66 %
No change
perceived
in formal
34 %
Overall
100 %
Source: BCG 2016 ad hoc study (12,000 respondents in 10 countries)
"Has your attitude towards formal wear changed?"
13
% of respondents

BCG Altagamma True-Lux Global Cons Insight 2017 VExtract.pptx 14
Draft—for discussion only
Co
pyrig
ht ©
20
16
by T
he
Bo
sto
n C
on
su
ltin
g G
rou
p,
Inc.
All
rig
hts
re
se
rve
d.
Casualwear fuelled by wardrobe saturation for the
eldest, higher appeal and acceptance for the youngest
Note: multiple options answer (up to three reasons) Source: BCG 2016 ad hoc study (12,000 respondents in 10 countries)
55%
37%
Formal wear now
too expensive
Follow casualization
at the office
More comfort
with casual
Casual suitable
to more occasions
Enough formal wear
for formal occasions
48%
51%
29%
"What are the key reasons driving the lower appeal for formal wear in your mind?"
14
% of respondents
with lower appeal
for formal wear
Overall By generation
33%
50%
40%
55%
52%
48%
36%
28%
50%
54%
40%
28%
19%
49%
61%
Baby B. & Silver Gen. X Millennials
BCG Altagamma True-Lux Global Cons Insight 2017 VExtract.pptx 15
Draft—for discussion only
Co
pyrig
ht ©
20
16
by T
he
Bo
sto
n C
on
su
ltin
g G
rou
p,
Inc.
All
rig
hts
re
se
rve
d.
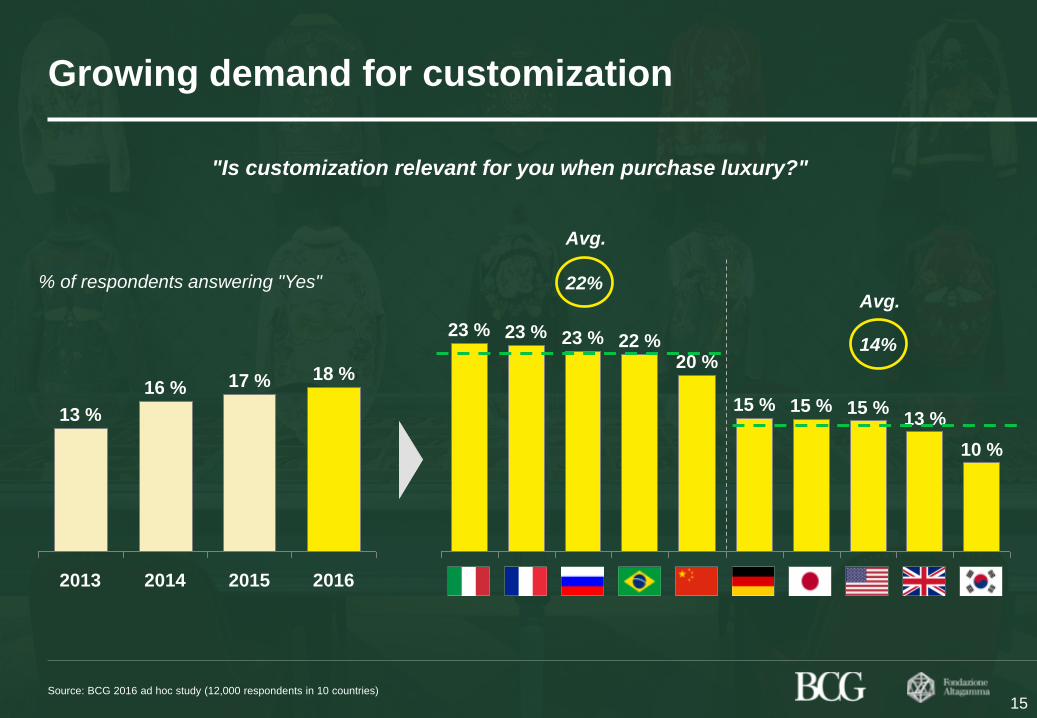
Growing demand for customization
Source: BCG 2016 ad hoc study (12,000 respondents in 10 countries)
"Is customization relevant for you when purchase luxury?"
18 %
2016
17 % 16 %
2015 2014
13 %
2013
10 %
13 % 15 %
23 % 23 % 22 %
20 %
15 % 15 %
23 %
22%
15
% of respondents answering "Yes"
Avg.
14%
Avg.
BCG Altagamma True-Lux Global Cons Insight 2017 VExtract.pptx 16
Draft—for discussion only
Co
pyrig
ht ©
20
16
by T
he
Bo
sto
n C
on
su
ltin
g G
rou
p,
Inc.
All
rig
hts
re
se
rve
d.
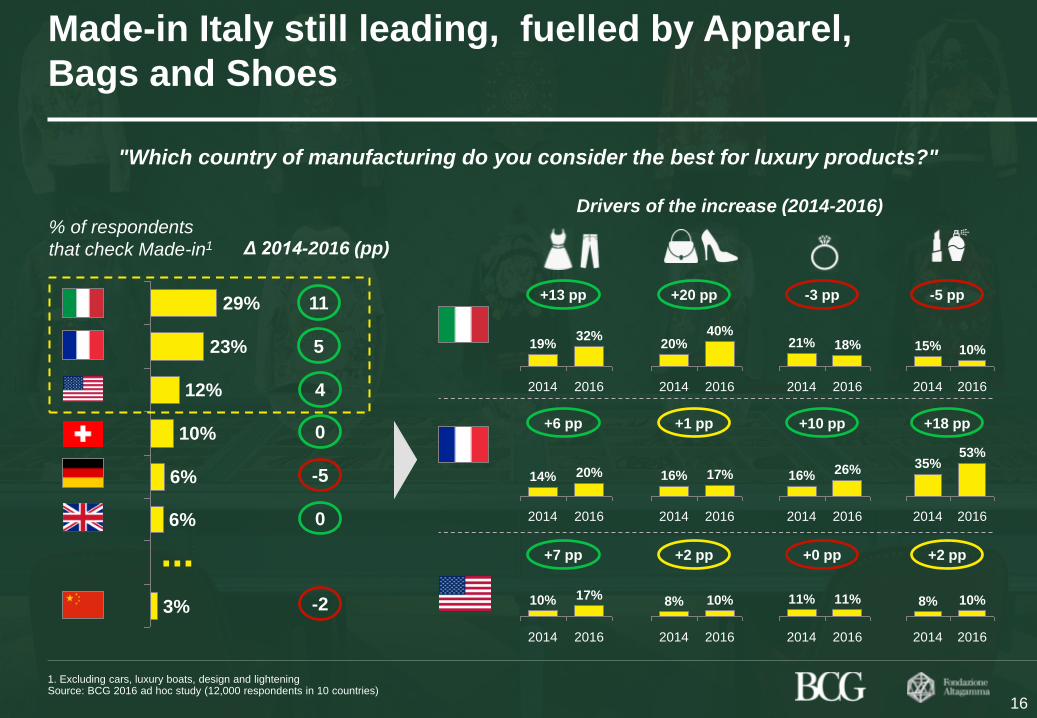
Made-in Italy still leading, fuelled by Apparel,
Bags and Shoes
% of respondents
that check Made-in1
3%
6%
6%
10%
12%
23%
29%
"Which country of manufacturing do you consider the best for luxury products?"
...
11
4
5
0
-5
-2
0
Δ 2014-2016 (pp)
Drivers of the increase (2014-2016)
2014 2016
21% 18%
2014 2016
15% 10%
-3 pp -5 pp
2014 2016
20% 40%
+20 pp
2014 2016
19% 32%
+13 pp
2014 2016
16% 26%
2014 2016
35% 53%
+10 pp +18 pp
2014 2016
16% 17%
+1 pp
2014 2016
14% 20%
+6 pp
2014 2016
11% 11%
2014 2016
8% 10%
+0 pp +2 pp
2014 2016
8% 10%
+2 pp
2014 2016
10% 17%
+7 pp
1. Excluding cars, luxury boats, design and lightening Source: BCG 2016 ad hoc study (12,000 respondents in 10 countries)
16
BCG Altagamma True-Lux Global Cons Insight 2017 VExtract.pptx 17
Draft—for discussion only
Co
pyrig
ht ©
20
16
by T
he
Bo
sto
n C
on
su
ltin
g G
rou
p,
Inc.
All
rig
hts
re
se
rve
d.
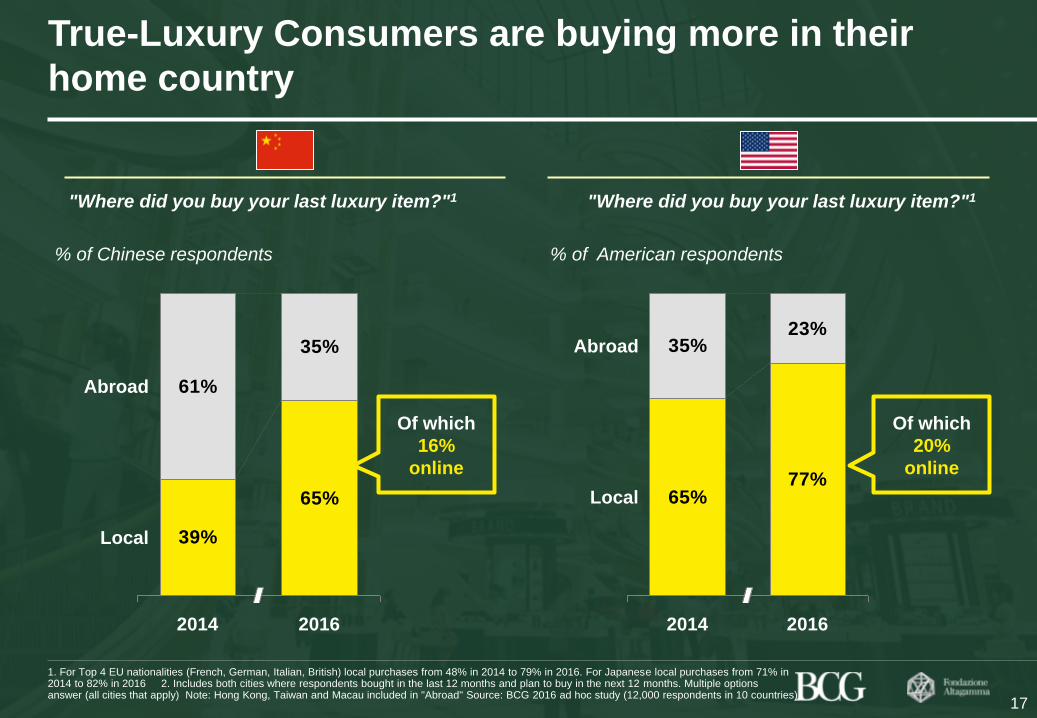
True-Luxury Consumers are buying more in their
home country
17
39%
65%
61%
35%
Local
Abroad
2016 2014
"Where did you buy your last luxury item?"1
% of Chinese respondents
65%77%
35%23%
Local
Abroad
2016 2014
"Where did you buy your last luxury item?"1
% of American respondents
1. For Top 4 EU nationalities (French, German, Italian, British) local purchases from 48% in 2014 to 79% in 2016. For Japanese local purchases from 71% in 2014 to 82% in 2016 2. Includes both cities where respondents bought in the last 12 months and plan to buy in the next 12 months. Multiple options answer (all cities that apply) Note: Hong Kong, Taiwan and Macau included in "Abroad" Source: BCG 2016 ad hoc study (12,000 respondents in 10 countries)
Of which
16%
online
Of which
20%
online
BCG Altagamma True-Lux Global Cons Insight 2017 VExtract.pptx 18
Draft—for discussion only
Co
pyrig
ht ©
20
16
by T
he
Bo
sto
n C
on
su
ltin
g G
rou
p,
Inc.
All
rig
hts
re
se
rve
d.
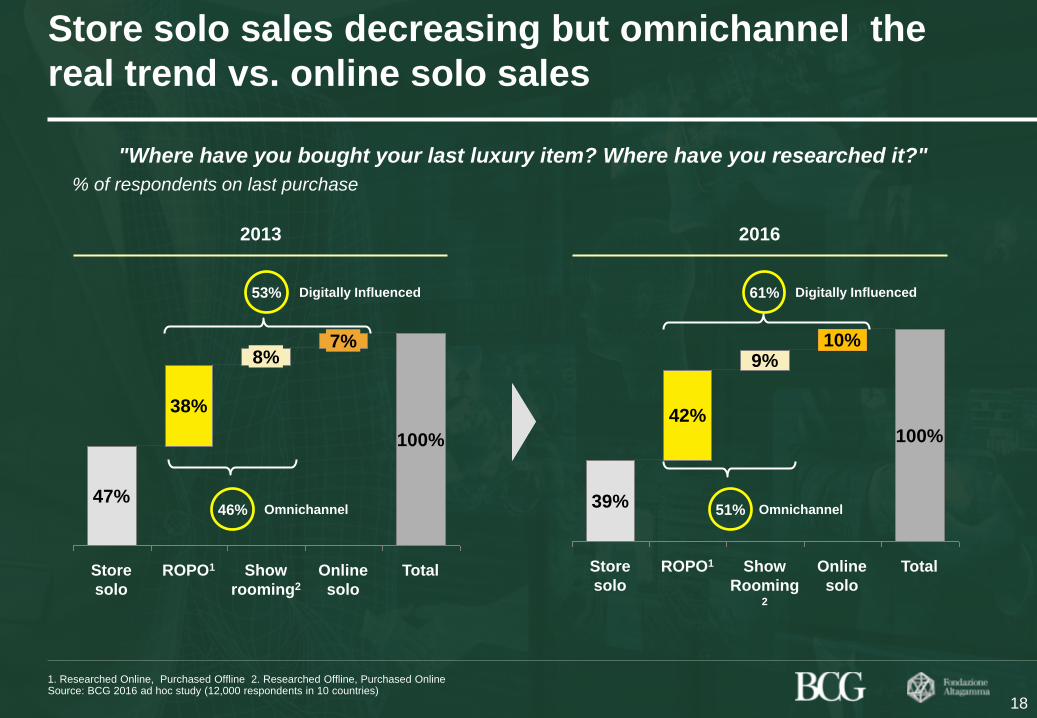
Online
solo
100%
Total
7%
Show
rooming2
38%
8%
Store
solo
ROPO1
47%
Store solo sales decreasing but omnichannel the
real trend vs. online solo sales
100
% of respondents on last purchase
100
"Where have you bought your last luxury item? Where have you researched it?"
1. Researched Online, Purchased Offline 2. Researched Offline, Purchased Online Source: BCG 2016 ad hoc study (12,000 respondents in 10 countries)
18
53%
46%
2013
10%
Show
Rooming 2
100%
Online
solo
Total
9%
ROPO1 Store
solo
39%
42%
61%
51%
2016
Omnichannel
Digitally Influenced
Omnichannel
Digitally Influenced
BCG Altagamma True-Lux Global Cons Insight 2017 VExtract.pptx 19
Draft—for discussion only
Co
pyrig
ht ©
20
16
by T
he
Bo
sto
n C
on
su
ltin
g G
rou
p,
Inc.
All
rig
hts
re
se
rve
d.
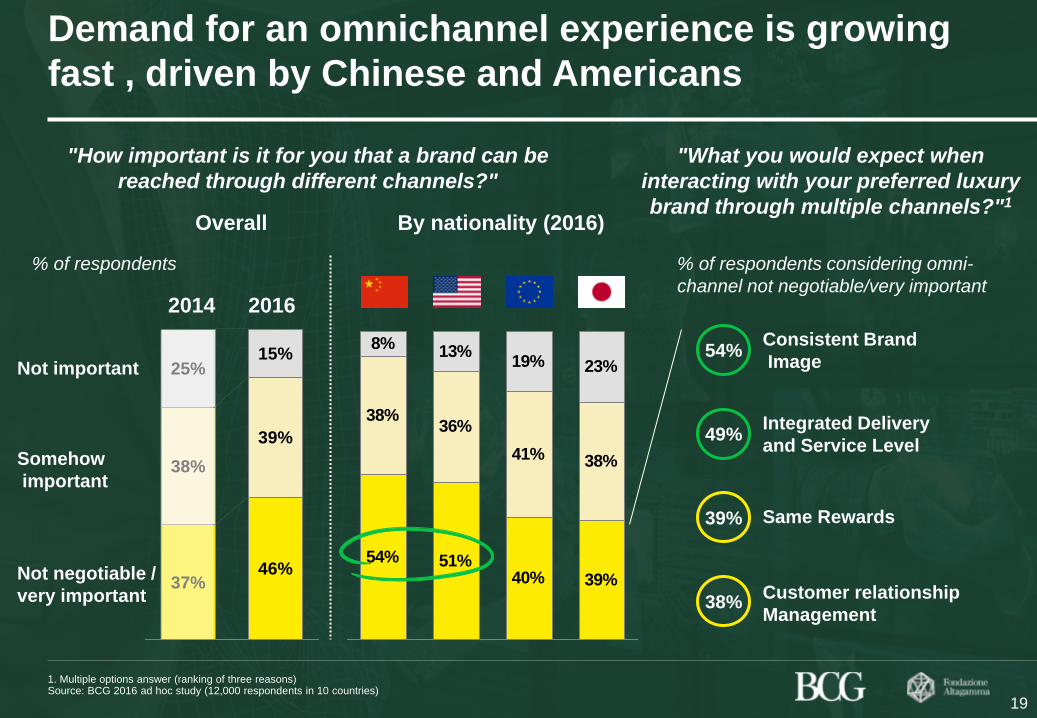
Demand for an omnichannel experience is growing
fast , driven by Chinese and Americans
% of respondents
Overall
1. Multiple options answer (ranking of three reasons) Source: BCG 2016 ad hoc study (12,000 respondents in 10 countries)
"How important is it for you that a brand can be
reached through different channels?"
By nationality (2016)
46%
39%
15%
37%
38%
25% Not important
Somehow
important
Not negotiable /
very important
2014 2016
54% 51%40% 39%
38%36%
41% 38%
8% 13%19% 23%
19
% of respondents considering omni-
channel not negotiable/very important
"What you would expect when
interacting with your preferred luxury
brand through multiple channels?"1
Consistent Brand
Image 54%
Same Rewards 39%
Integrated Delivery
and Service Level 49%
Customer relationship
Management 38%
BCG Altagamma True-Lux Global Cons Insight 2017 VExtract.pptx 20
Draft—for discussion only
Co
pyrig
ht ©
20
16
by T
he
Bo
sto
n C
on
su
ltin
g G
rou
p,
Inc.
All
rig
hts
re
se
rve
d.
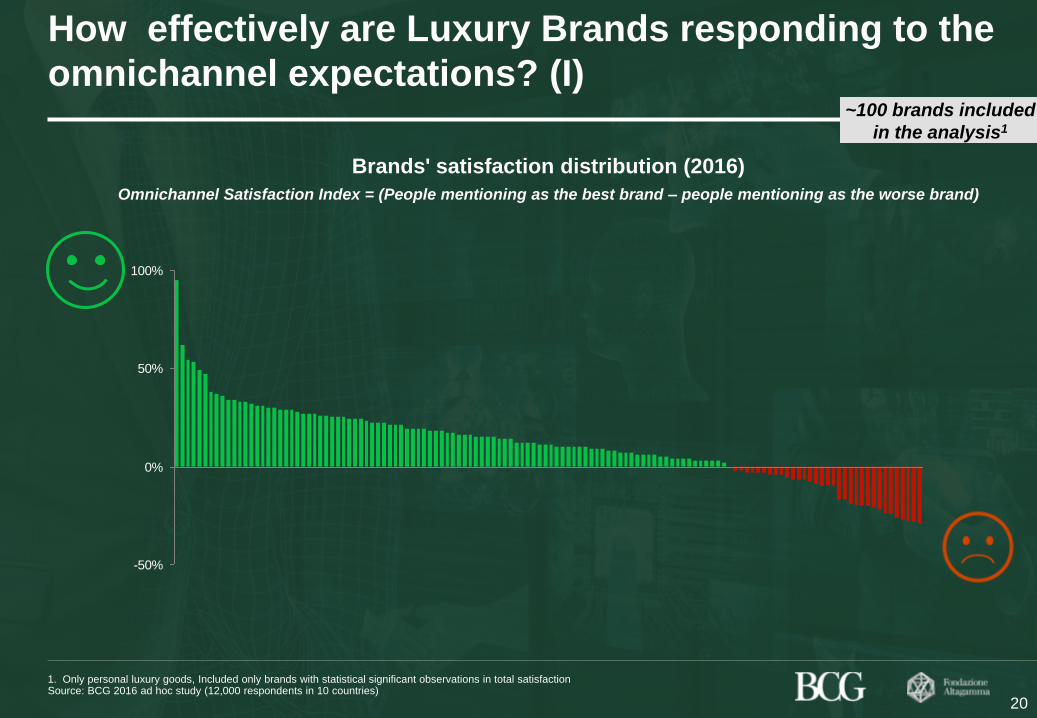
-50%
0%
50%
100%
How effectively are Luxury Brands responding to the
omnichannel expectations? (I)
20
1. Only personal luxury goods, Included only brands with statistical significant observations in total satisfaction Source: BCG 2016 ad hoc study (12,000 respondents in 10 countries)
Brands' satisfaction distribution (2016)
Omnichannel Satisfaction Index = (People mentioning as the best brand – people mentioning as the worse brand)
~100 brands included
in the analysis1
BCG Altagamma True-Lux Global Cons Insight 2017 VExtract.pptx 21
Draft—for discussion only
Co
pyrig
ht ©
20
16
by T
he
Bo
sto
n C
on
su
ltin
g G
rou
p,
Inc.
All
rig
hts
re
se
rve
d.
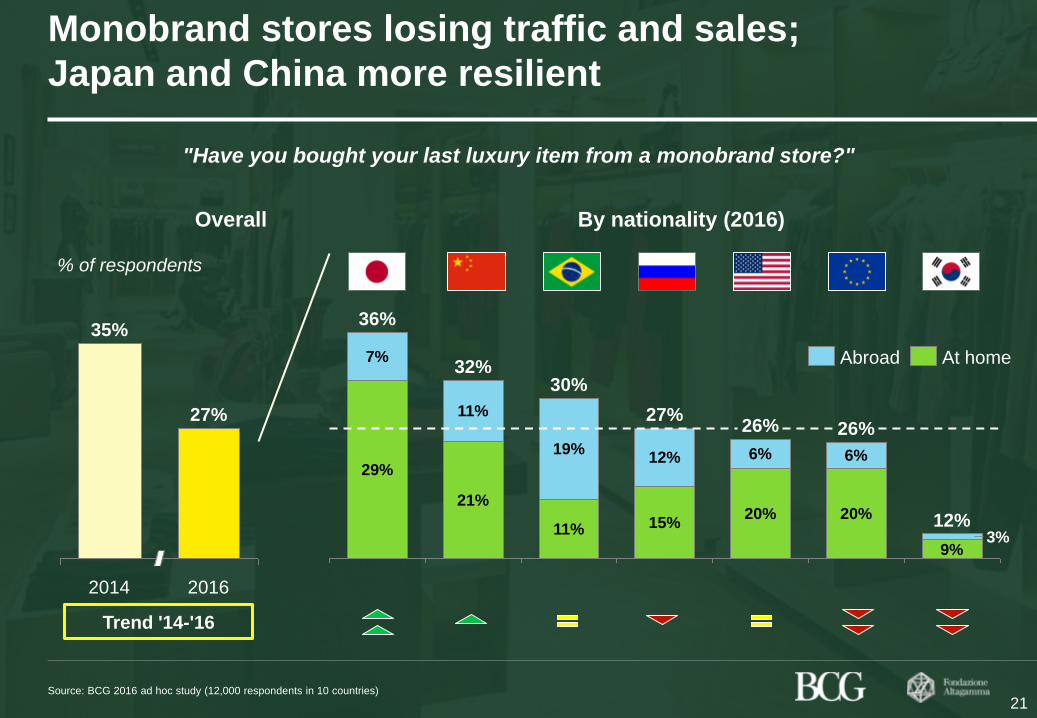
Monobrand stores losing traffic and sales;
Japan and China more resilient
% of respondents
Overall
"Have you bought your last luxury item from a monobrand store?"
By nationality (2016)
Source: BCG 2016 ad hoc study (12,000 respondents in 10 countries)
2014
35%
2016
27%
6%
32%
26%
12%
26%
9%
11%
6%
21%
12% 15% 20% 20%
30%
3%
29%
7%
19%
27%
36%
11%
21
At home Abroad
Trend '14-'16

BCG Altagamma True-Lux Global Cons Insight 2017 VExtract.pptx 22
Draft—for discussion only
Co
pyrig
ht ©
20
16
by T
he
Bo
sto
n C
on
su
ltin
g G
rou
p,
Inc.
All
rig
hts
re
se
rve
d.
But monobrand still at the heart of an omnichannel
True-Luxury consumer experience around the Brand
Source: BCG 2016 ad hoc study (12,000 respondents in 10 countries)
% of respondents
on last purchase
49%
15%
7%
27%Monobrand
Solo
Researched in
Monobrand
Purchased Online
Researched in
Monobrand
Purchased in other
physical channel
Monobrand
Influence
Reasons to buy in Monobrand
Try & touch the product
Product customization
Offer range of the brand
Experienced / trustable
sales staff
Presence of signature /
exclusive items
Monobrand influence
#1
#3
#2
#4
#5
22
22%
Monobrand influencing 22% of purchases
done in other channels
BCG Altagamma True-Lux Global Cons Insight 2017 VExtract.pptx 23
Draft—for discussion only
Co
pyrig
ht ©
20
16
by T
he
Bo
sto
n C
on
su
ltin
g G
rou
p,
Inc.
All
rig
hts
re
se
rve
d.
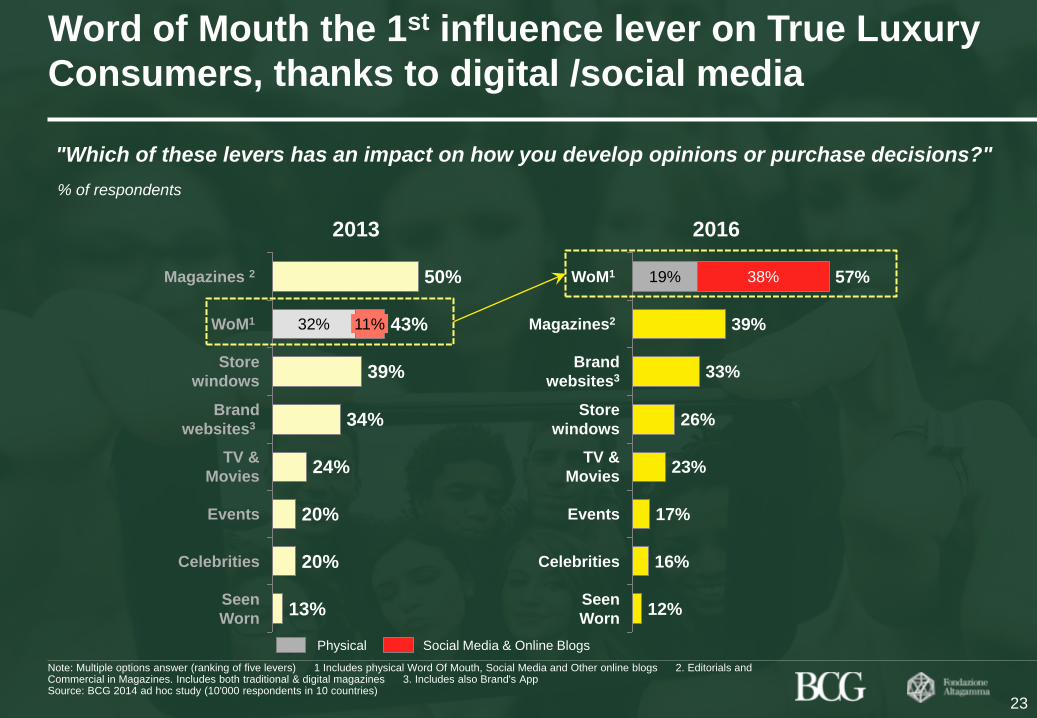
Word of Mouth the 1st influence lever on True Luxury
Consumers, thanks to digital /social media
% of respondents
Seen
Worn 12%
Celebrities 16%
Events 17%
TV &
Movies 23%
Store
windows 26%
Brand
websites3 33%
Magazines2 39%
WoM1 57% 19% 38%
13% Seen
Worn
Celebrities 20%
Events 20%
TV &
Movies 24%
Brand
websites3 34%
Store
windows 39%
WoM1 43% 32% 11%
Magazines 2 50%
Note: Multiple options answer (ranking of five levers) 1 Includes physical Word Of Mouth, Social Media and Other online blogs 2. Editorials and Commercial in Magazines. Includes both traditional & digital magazines 3. Includes also Brand's App Source: BCG 2014 ad hoc study (10'000 respondents in 10 countries)
23
"Which of these levers has an impact on how you develop opinions or purchase decisions?"
2013 2016
Physical Social Media & Online Blogs
BCG Altagamma True-Lux Global Cons Insight 2017 VExtract.pptx 24
Draft—for discussion only
Co
pyrig
ht ©
20
16
by T
he
Bo
sto
n C
on
su
ltin
g G
rou
p,
Inc.
All
rig
hts
re
se
rve
d.
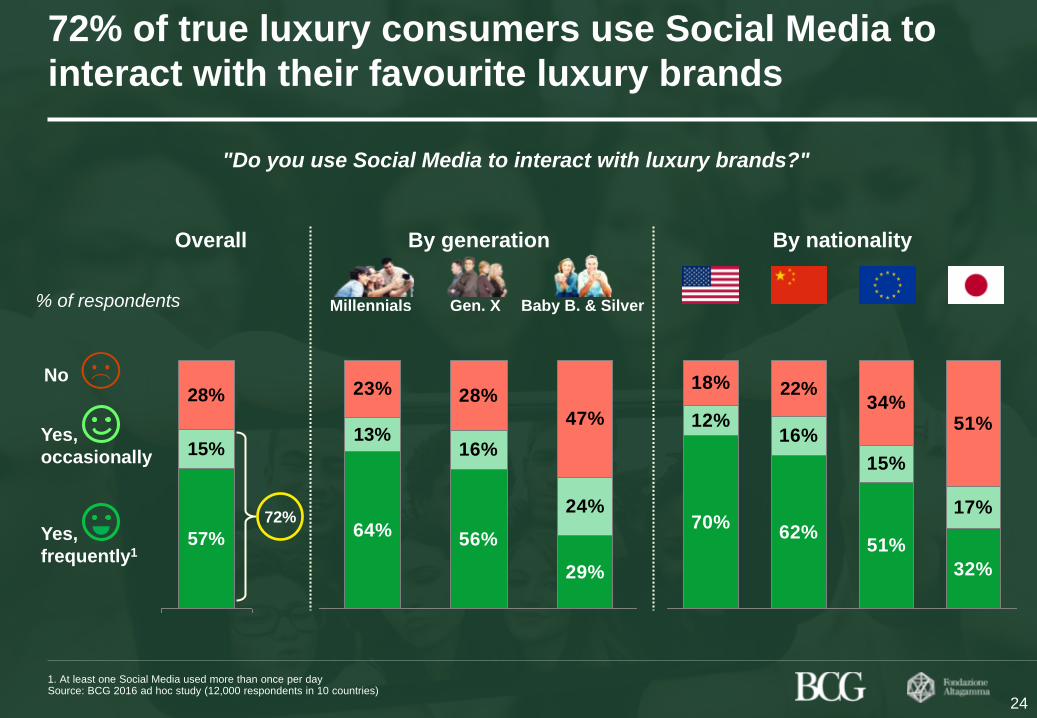
72% of true luxury consumers use Social Media to
interact with their favourite luxury brands
1. At least one Social Media used more than once per day Source: BCG 2016 ad hoc study (12,000 respondents in 10 countries)
"Do you use Social Media to interact with luxury brands?"
% of respondents
Overall
Baby B. & Silver Gen. X
By generation
Millennials
By nationality
57%
15%
28%
64%56%
29%
16%
24%
23% 28%
47%13%
70%62%
51%
32%
12%16%
15%
17%
18%34%
51%
22%
24
No
Yes,
occasionally
Yes,
frequently1
72%
primocapitolo.pptx 25
Draft—for discussion only
Co
pyrig
ht ©
20
16
by T
he
Bo
sto
n C
on
su
ltin
g G
rou
p,
Inc.
All
rig
hts
re
se
rve
d.
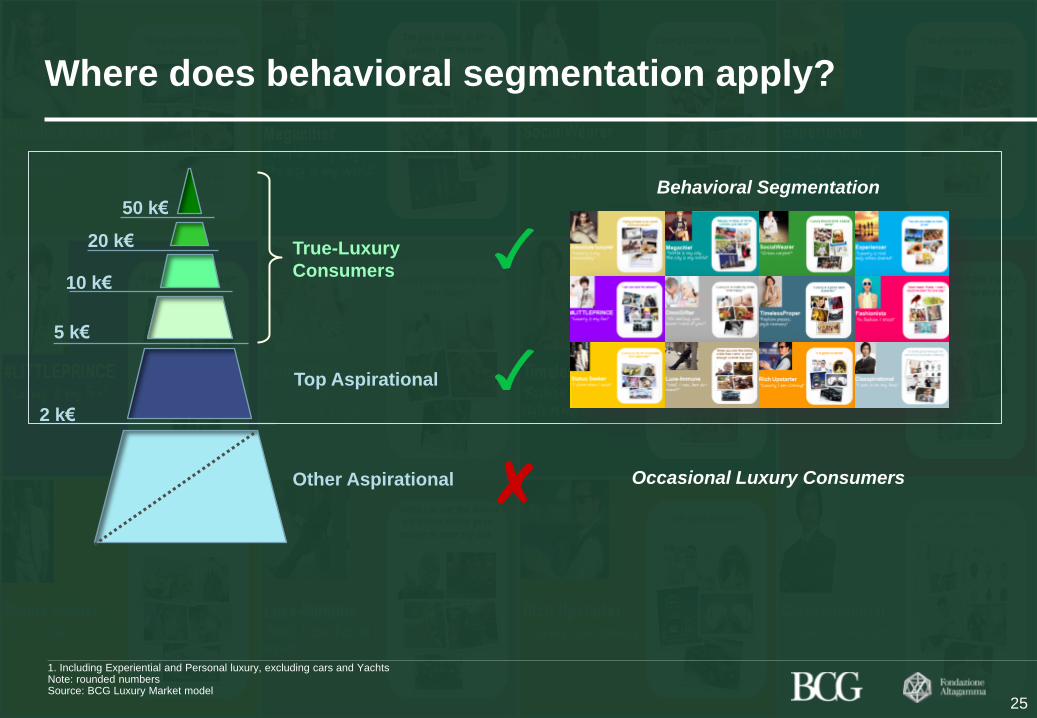
Where does behavioral segmentation apply?
2 k€
5 k€
20 k€
10 k€
1. Including Experiential and Personal luxury, excluding cars and Yachts Note: rounded numbers Source: BCG Luxury Market model
25
50 k€
Top Aspirational
Other Aspirational
True-Luxury
Consumers
Occasional Luxury Consumers
Behavioral Segmentation
primocapitolo.pptx 26
Draft—for discussion only
Co
pyrig
ht ©
20
16
by T
he
Bo
sto
n C
on
su
ltin
g G
rou
p,
Inc.
All
rig
hts
re
se
rve
d.
145
613
16
22
-4 312
-3 -1 -1 -1
255
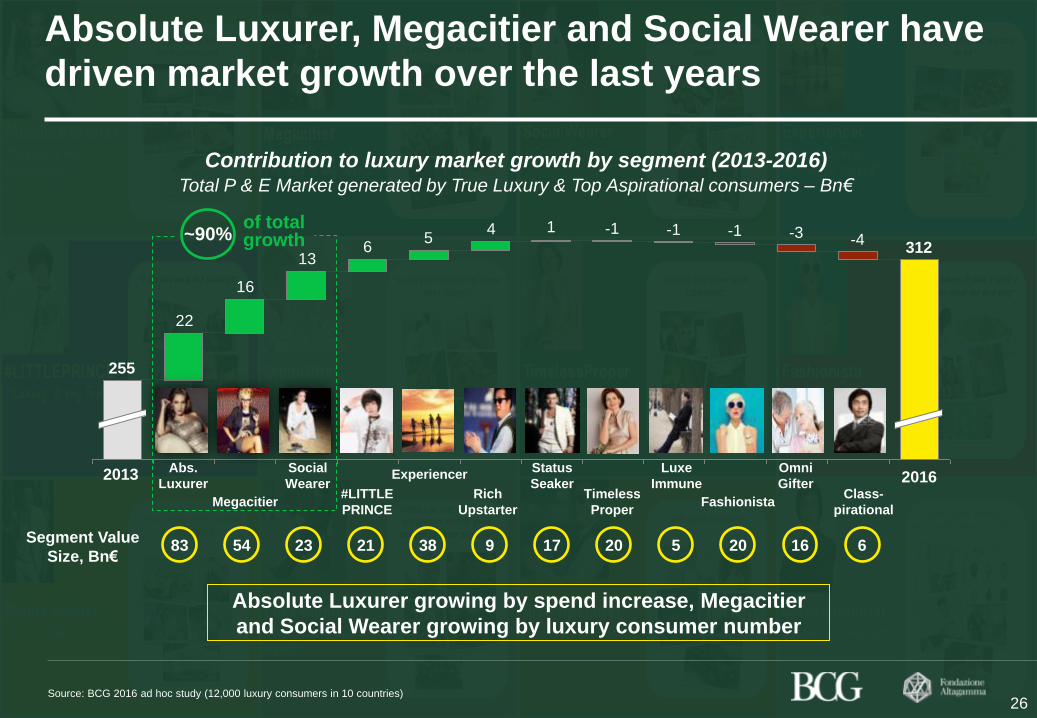
Absolute Luxurer, Megacitier and Social Wearer have
driven market growth over the last years
Contribution to luxury market growth by segment (2013-2016)
Abs.
Luxurer
Megacitier
Social
Wearer #LITTLE
PRINCE
Experiencer
Rich
Upstarter
Status
Seaker Timeless
Proper
Luxe
Immune
Fashionista
Omni
Gifter Class-
pirational
26
of total growth
Total P & E Market generated by True Luxury & Top Aspirational consumers – Bn€
Source: BCG 2016 ad hoc study (12,000 luxury consumers in 10 countries)
Absolute Luxurer growing by spend increase, Megacitier
and Social Wearer growing by luxury consumer number
83 54 23 21 38 9 17 20 5 20 16 6 Segment Value
Size, Bn€
2013 2016
~90%
primocapitolo.pptx 27
Draft—for discussion only
Co
pyrig
ht ©
20
16
by T
he
Bo
sto
n C
on
su
ltin
g G
rou
p,
Inc.
All
rig
hts
re
se
rve
d.
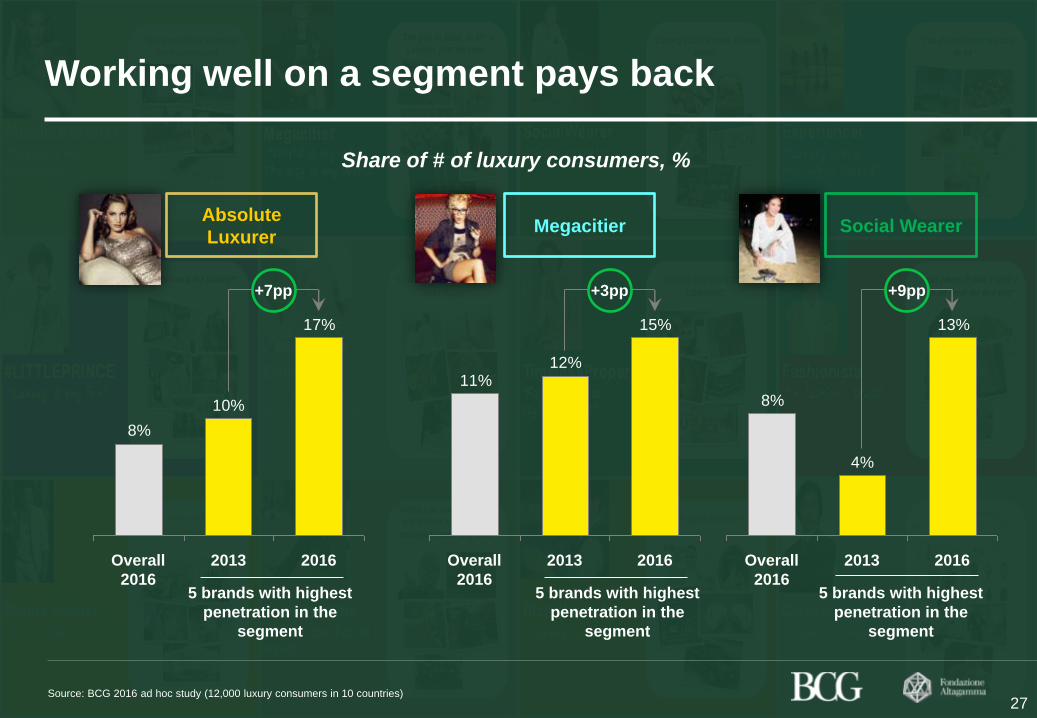
Working well on a segment pays back
17%
10%
8%
+7pp
2016 2013 Overall
2016
15%
12%11%
+3pp
2016 2013 Overall
2016
13%
4%
8%
+9pp
2016 2013 Overall
2016
Absolute
Luxurer Megacitier Social Wearer
Share of # of luxury consumers, %
Source: BCG 2016 ad hoc study (12,000 luxury consumers in 10 countries)
5 brands with highest
penetration in the
segment
5 brands with highest
penetration in the
segment
5 brands with highest
penetration in the
segment
27
BCG Altagamma True-Lux Global Cons Insight 2017 VExtract.pptx 28
Draft—for discussion only
Co
pyrig
ht ©
20
16
by T
he
Bo
sto
n C
on
su
ltin
g G
rou
p,
Inc.
All
rig
hts
re
se
rve
d.
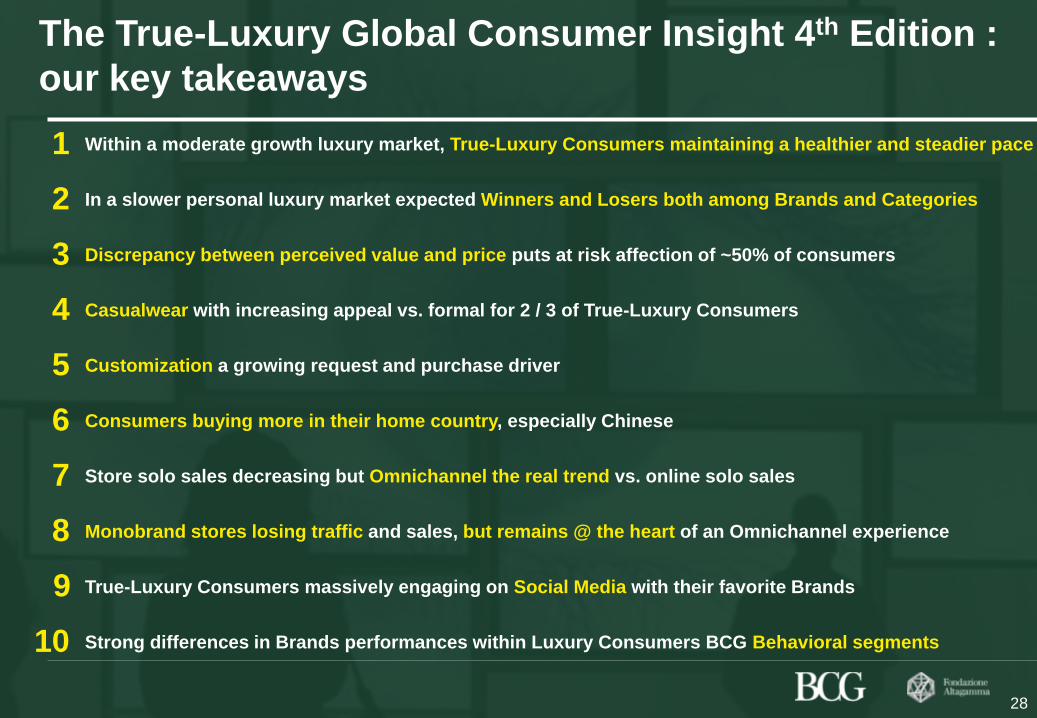
The True-Luxury Global Consumer Insight 4th Edition :
our key takeaways
Within a moderate growth luxury market, True-Luxury Consumers maintaining a healthier and steadier pace
In a slower personal luxury market expected Winners and Losers both among Brands and Categories
Discrepancy between perceived value and price puts at risk affection of ~50% of consumers
Casualwear with increasing appeal vs. formal for 2 / 3 of True-Luxury Consumers
Customization a growing request and purchase driver
Consumers buying more in their home country, especially Chinese
Store solo sales decreasing but Omnichannel the real trend vs. online solo sales
Monobrand stores losing traffic and sales, but remains @ the heart of an Omnichannel experience
True-Luxury Consumers massively engaging on Social Media with their favorite Brands
Strong differences in Brands performances within Luxury Consumers BCG Behavioral segments
1
2
3
6
8
9
28
4
5
7
10
BCG Altagamma True-Lux Global Cons Insight 2017 VExtract.pptx 29
Draft—for discussion only
Co
pyrig
ht ©
20
16
by T
he
Bo
sto
n C
on
su
ltin
g G
rou
p,
Inc.
All
rig
hts
re
se
rve
d.
BCG Authors
Nicola
Pianon
Senior Partner
and Managing
Director
- Milan
Leading Fashion & Luxury Division
in Italy
26 years @ BCG
Expertise areas
• Business planning, strategy
definition and implementation in
Fashion and Luxury
• Retailing and retail development
• Go to market strategy definition for
luxury brands in Europe, US & Asia
• Deep expertise in Digital strategy
Contacts
Tel. +39 02 65599 204
Mobile +39 335 237556
Federico
Bonelli
Principal
- Milan
Fashion & Luxury Division Core
Member
8 years of Strategy Consulting in F&L
Expertise areas
• Focus on luxury and premium
industry in all categories
• Assisted 40+ luxury groups
• Led large transformations, focusing
on distribution, retail, merch., ...
• Interim General Manager of Recarlo
in 2012
Contacts
Tel. +39 02 65599 608
Mobile +39 335 8495649
29
Olivier
Abtan
Partner and
Managing
Director
- Paris
Global Lead of Fashion & Luxury
Division
17 years @ BCG
Expertise areas
• 20+ fashion & Luxury (vendor) due
diligences in the last 3 years alone
• Deep expertise in digital strategies
• Retail transformation and concept
definition across Europe and Africa
• Deep expertise in Merchandising,
Category Management and Product
Development
Contacts
Tel. +33 1 4017 4381
Mobile +33 6 03 61 61 00
Thank you
bcg.com | bcgperspectives.com