Embed Size (px)
Citation preview

The tsunami caused by the 30 October
2020 Samos (Greece), East Aegean Sea,
Mw6.9 earthquake: impact assessment
from post-event field survey and video
records (v2, 16 Nov. 2020)
Ιoanna Triantafyllou1, Marilia Gogou1, Spyridon Mavroulis1,
Katerina-Navsika Katsetsiadou1 , Efthymios Lekkas1 and Gerassimos
A. Papadopoulos2
1 Department of Geology & Geoenvironment, National & Kapodistrian
University of Athens, 15784 Athens, Greece; [email protected] (I.T.);
[email protected] (M.G.); [email protected] (S.M.);
[email protected] (K.-N.K.); [email protected] (E.L.)
2 International Society for the Prevention & Mitigation of Natural Hazards,
10681 Athens, Greece; [email protected]
Abstract: In this report we present results regarding the impact and the hydrodynamic features of
the tsunami that hit Samos and other Eastern Aegean Sea Greek islands soon after the 30 October
2020 earthquake (Mw=6.9). The analysis combines post-event field survey observations, video
records examination and an evaluation of interviews with local authority officers and eyewitnesses.
The event was a near-field tsunami arriving within 4’-13’ at the north coast of Samos and at the
eastern side of Ikaria island. From seven far-field tide records we calculated tsunami magnitude
Mt=Mw=6.8. In Vathy town (NE Samos) two strong inundations have been clearly recognized with
arrival time difference of 20’, the second being more powerful as compared to the first. Maximum
run-up was measured at h~2.0 m asl in run-in distance d=97 m. In Karlovasi (NW Samos) a strong
inundation (h~1.70 m at d~80 m) was reported immediately after an initial sea water retreat in ~10’
after the earthquake. In Vathy the water flow velocity inland ranged from 1 m/s to 1.9 m/s while
remarkable material damage was caused in various shops and offices. Damage was also noted in
cars and small vessels which drifted away by the wave. Less damage was caused in Karlovasi. No
casualties were reported. In the south coast of Samos the wave didn’t exceed h~0.6 m. In south Chios
island h~1 m was estimated, a few boats crushed on the water break stones. In Evdilos and Ayios
Kirikos ports, Ikaria island, h~1.0 m was estimated but no damage caused. Inundation of h<1.0 m
has been documented from other islands, e.g. Andros and Patmos. After the seismic tsunamis of
Samos (2020), Lesvos (2017) and Kos (2017) the tsunami hazard and risk assessment in the Eastern
Aegean Sea should be reconsidered. Preliminary field observations indicating co-seismic 10-25 cm
uplift of Samos may imply lower impact than that would have happened if no uplift had occurred.
1. Introduction
On 30 October 2020, 11:51:27 UTC, a large shallow earthquake of moment magnitude Mw=6.9
(Νational Observatory of Athens, NOA) or Mw=7.0 (USGS, GFZ) ruptured the Eastern Aegean Sea
area to the north of the island of Samos, Greece (Figure 1). Consistent focal mechanisms produced by
several seismological institutes show E-W normal faulting (Figure 1) with fault plane very likely
dipping towards north. In Samos the most important earthquake impact included two fatalities, 19
minor injuries and damage in hundreds of houses, churches and port infrastructures. In the area of
Izmir (W. Turkey), however, at least 114 people are known to have died due to the collapse of
buildings and more than 1030 were injured. Powerful tsunami inundation was reported from Samos

2 of 20
and other Greek islands as well as from several coastal sites of western Turkey. In Greece, the General
Secretary for Civil Protection disseminated to residents of the eastern Aegean Sea Greek islands a
tsunami warning SMS via the European emergency phone number 112. The message was sent at
14:15 local time (12:15 UTC). Remarkable material damage was caused by the tsunami but no fatalities
were reported. Other important earthquake associated phenomena, such as co-seismic coastal uplift
and several types of ground failures, were also observed in Samos.
Although Samos has long seismic history no tsunami associated with the earthquake activity was
reported so far. The only exception is the very strong tsunami generated by the distant large
earthquake (Mw=7.7, ISC-GEM) of 9 July 1956 in the South Aegean Sea. That tsunami was reportedly
observed in coastal spots of south Samos but also in Vathy, the main town at the NE of the island
(e.g. Galanopoulos, 1957).
In this report we study the impact as well as the hydrodynamic features of the 30 October 2020
tsunami in several observation points along the coasts of Samos and of other Greek islands. In
addition, we calculate the tsunami magnitude from far-field tide-gauges records.
Figure 1. Coastal sites where tsunami inundation has been documented. Key: A and E are Ayios Kirikos and
Evdilos ports, Ikaria; Ka, V and P are Karlovasi, Vathy and Pythagorio, Samos; K=Komi village, Chios;
N=Nimporios port, Andros; S=Skala port, Patmos; beachball shows the NOA fault-plane solution of the 30
October 2020 mainshock; solid circle shows the epicenter of the Mw=7.7 (ISC) 9 July 1956 tsunamigenic
earthquake.
2. Materials and Methods
The Samos 2020 tsunami caused considerable material damage along the coastal zones of Vathy
and Karlovasi towns both situated at the north side of Samos facing the earthquake source. For the
tsunami study we performed post-event field survey in several coastal sites of Samos from the 31st

3 of 20
October up to the 2nd November 2020. In addition, we interviewed with port authority officers and
eyewitnesses and examined several videos recorded by security cameras and mobile phones in Samos
and other islands. Near-field tide-gauge records for the Samos 2020 tsunami wave are not available.
The closest records come from one tide-gauge station in Bodrum, SW Turkey, as well as from another
two stations in Kos island, Greece, situated at epicentral distances of 112-120 km (Table 1). From far-
field tide-gauge records, however, we were able to calculate the tsunami magnitude in Mt/Mw scale.
Apart from the seven sites where tide-gauge records are available, we documented tsunami
inundations in 15 coastal sites of Samos as well as in 5 sites in other islands. From the observations
collected we evaluated the wave impact and calculated several hydrodynamic features of the tsunami
wave including the number and times of wave arrivals, times of wave retreat, wave run-up, wave
run-in and water flow velocity inland. It has not been possible, however, to calculate all parameters
for all the observation sites due to restrictions in the data availability. In our analysis we use the next
notation: D for distance of an observation site from the shoreline, d for tsunami wave run-in (distance
of penetration inland), h for wave run-up above sea level (asl) unless otherwise indicated. All times
reported are in UTC unless otherwise indicated.
Table 1. Data set used to calculate tsunami magnitude, Mt, for the Mw=7.0 earthquake of 30 October
2020 from tsunami height, H, recorded at 6 tide stations situated at epicentral distances Δ. H is taken
as the half of the maximum crest-to-trough height. Stations are operated by the next agencies: 1 by
Turkish General Command Mapping (TGCM); 2, 3, 4 jointly by the Space, Security and Migration
Directorate-Joint Research Center at Ispra (JRC, EC) and the National Observatory of Athens (NOA,
Greece); 5 by the Hellenic Navy Hydrographic Service (HNHS, Greece); 6, 7 by NOA. Tide records
were retrieved from the JRC World Sea Levels platform (https:// webcritech.jrc.ec.europa.eu/) and the
Sea Level Station Monitoring Facility of IOC (http://www.ioc- sealevelmonitoring.org).
no. Tide station Latο Ν Lonο Ε Δ (km) H (m)
1 BODRUM, IDSL-17
37.03217 27.423453 112
0.03
2 KOS, IDSL-25
36.898362 27.287792 118
0.095
3 KOS-MARINA, IDSL-33
36.891013 27.303632 120
0.09
4 PLOMARI, IDSL-41
38.97188 26.37055 122
0.05
5 SYROS, HNHS
37.438 24.9411 174
0.05
6 KASOS, NOA-03
35.4186 26.92184 274
0.06
7 HERAKLION, NOA-10 35.3484 25.15254
286 0.08
From the urban planning point of view the coastal zone in Vathy bay consists of three parallel
lanes, which from the shoreline towards inland are: a pedestrian lane, the two-way main road and a

4 of 20
second pedestrian lane (Figure 2). The total width of this zone ranges from 40 to 45 m. The inland
pedestrian lane is dominated by buildings with various shops, offices, cafeterias, restaurants and
other commercial stores. Small streets perpendicular to the main road drive further inland. Similar
urban planning characterizes the Karlovasi coastal zone. The height of the seaward pedestrian zone
was measured at 60 cm and 110 cm asl in the eastern Vathy bay and in Karlovasi near the Port
Authority building, respectively. In western Vathy bay, near the site Malagari where remarkable
tsunami impact was observed, no shops and pedestrian zone exist. The area is characterized by the
presence of the new commercial port and a marina.
For the tsunami magnitude calculation seven far-field tide-gauge records have been utilized.
Details of the tide-gauge stations and sources used to retrieve records are summarized in Table 1.
3. Tsunami observation results
In the next subsections we provide the results of the observations collected, the estimated tsunami
hydrodynamic parameters as well as the tsunami impact in each one of the 20 inundation sites in
Samos and the surrounding islands. For each site the description starts with the site code number,
the site name and the distance D of the site from the seashore, when relevant. Minor tsunami
inundation was also reported from other islands, including Fourni and Mykonos, but no specific
information has been collected.
3.1. Samos Isl.
3.1.1. Vathy town, east coast (Figure 2).
Figure 2. Three characteristic tsunami inundations measured along the eastern coast of Vathy bay. Run-
up, h (asl), measured at A, B, C sections are 1.95 m, 2.0 m and ~1.5 m at run-in distances 101 m, 97 m and
87 m, respectively. Numbers 1-6 correspond to observation spots examined in text.
A
B
C
1
4
2
3
5
6

5 of 20
1. Hertz office (D~43 m). Two video records from security cameras were provided by the
office owner. The time in both cameras was not correct since they advanced time by
about 4 min and 45 s with respect to the library security camera (Site 4). The corrected
time is hereafter used. The video from the external security camera starts at 12:24:13.
The coastal road and part of the pedestrian zone are seen already wet due to the first
wave arrival. From the wet zone shown in the record and the field inspection of the
area we estimated d~39 m and h~0.75 m. The record shows a second strong tsunami
inundation starting at 12:24:15 and inundating the entire width of D=43 m. In the
inundated zone the video shows people running to evacuate, cars floating and fishes
swimming towards the sea (Figure 3). From the video and the field inspection we
estimated h=1.2 m. The velocity of the water flow inland was found equal to 1.95 m/s
(7 km/h).
The video from the interior security camera starts at 12:24:21. Outside of the entrance door
the water level is already at h~0.6-0.7 m from the ground level. The sea wave breaks the door
glass at 12:25:51, the door opens violently and the water flows into the office causing material
damage. One internal plaster board breaks and collapse. In walls we found watermarks at h~0.4
m from the office ground level. This was verified by the office owner. Then we get h~1.6 m asl.
Figure 3. Vathy, Site 1. Inundation starts at 12:24 (corrected time), people run to evacuate (left). At ~12:26
(corrected time) general flooding is noticed, cars float (right) (photos credit, Hertz office).
2. Zen fish restaurant (D~42 m). The second wave hit violently the restaurant causing
remarkable material damage (Figure 4). From watermarks on walls at d=50 m in the
small street perpendicular to the main coastal road we measured h=1.09 m from the
ground level (Figure 4). Then the run-up has been h=1.69 m asl.

6 of 20
Figure 4. Vathy, Site 2. Damage caused by the tsunami attack in the fish restaurant (left.) Watermark of
h~1.09 m was measured at run-in distance of ~50 m (right) (photos credit, I. Triantafyllou).
3. Piraeus Bank (D~42 m). The water flow inundated the entire coastal zone and through
a network of small streets, either perpendicular or parallel to the main coastal road
(Figure 5), inundated at run-in distance up to d=98 m. From watermarks on walls
(Figure 6), we measured run-up of h=1.6 m at d=70 m and maximum h=1.95 m at
d=98 m. The area was extensively littered while sand and pebbles were left behind.
Figure 5. Vathy, inland from Site 3, eyewitnesses (left) reported that the water reached up to the yard of
the “Garden Restaurant” (yellow bar, right; see also Figure 6) at Xrisostomou Smirnis Street and caused
material damage (photos credit, M. Gogou).
Figure 6. In Xrisostomou Smirnis Street, close to “Garden Restaurant” (Figure 5) we measured h=0.3 m
and h=0.24 m from ground level at d=94-96. The value of h minimized at d=98, where we estimated
maximum h=1.95 m asl (photos credit, I. Triantafyllou).
4. Library (D~43 m). A valuable video record has been obtained from an external
security camera. The video timer was absolutely accurate as one may conclude from
the time it recorded the earth shaking, i.e. 11:51:34. This has been useful to correct
the video timer at Site 1. The first tsunami arrival was recorded at 12:04:15. People
are seen running to escape (Figure 7). The inundation covered the entire zone of 43
m and flowed further in a nearby small street. The second and strongest wave arrived
at 12:24:10. From the video record and the field inspection in front of the building we
estimated h~0.8 m and h~1.2 m due to the first and second tsunami wave,
respectively. The second wave penetrated further inland through the nearby small
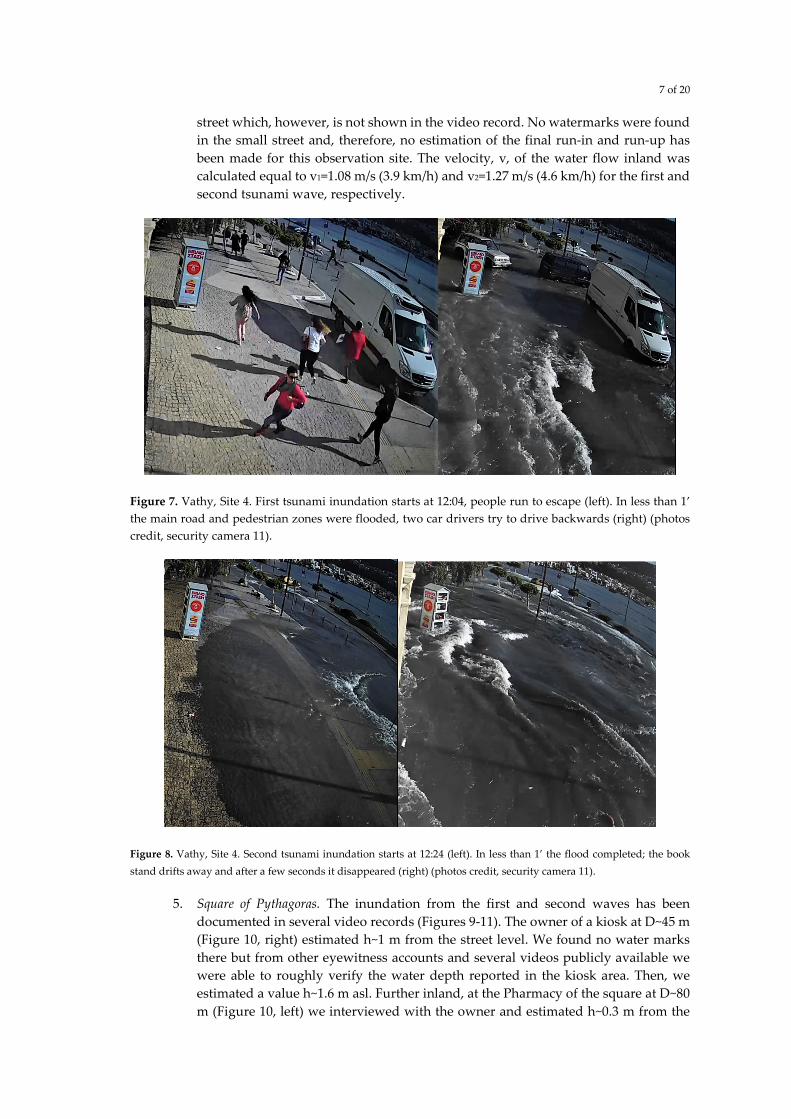
7 of 20
street which, however, is not shown in the video record. No watermarks were found
in the small street and, therefore, no estimation of the final run-in and run-up has
been made for this observation site. The velocity, v, of the water flow inland was
calculated equal to v1=1.08 m/s (3.9 km/h) and v2=1.27 m/s (4.6 km/h) for the first and
second tsunami wave, respectively.
Figure 7. Vathy, Site 4. First tsunami inundation starts at 12:04, people run to escape (left). In less than 1’
the main road and pedestrian zones were flooded, two car drivers try to drive backwards (right) (photos
credit, security camera 11).
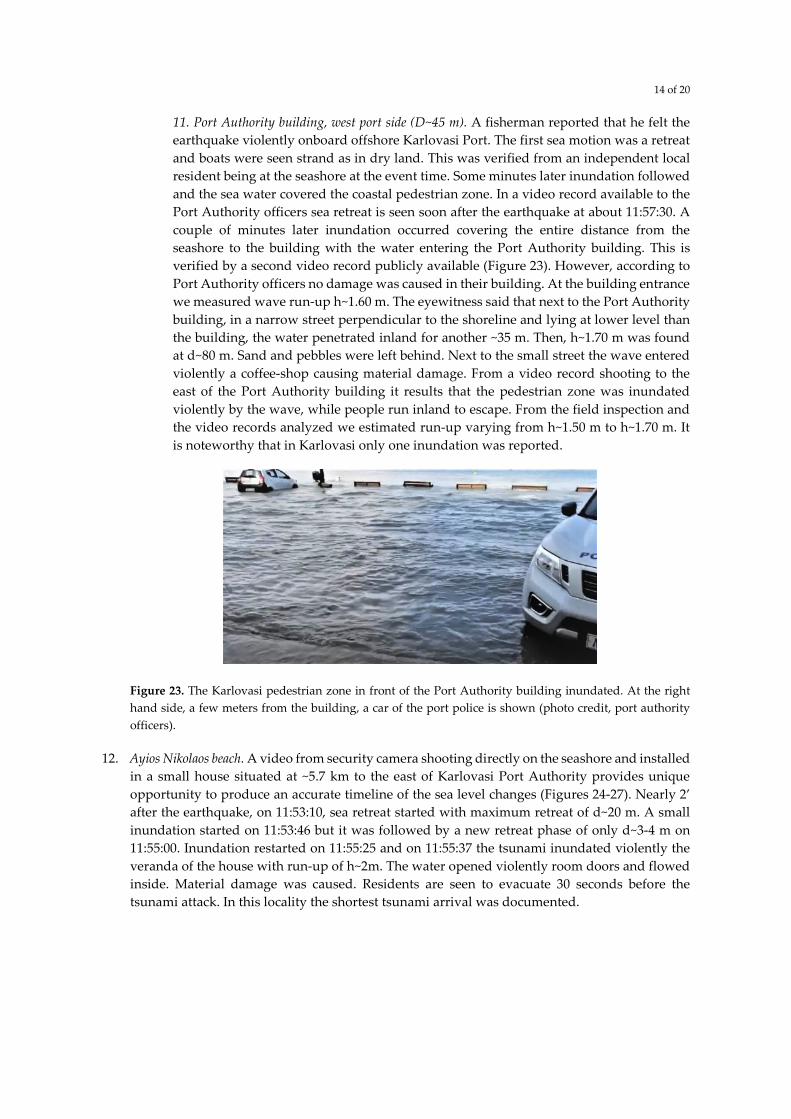
Figure 8. Vathy, Site 4. Second tsunami inundation starts at 12:24 (left). In less than 1’ the flood completed; the book
stand drifts away and after a few seconds it disappeared (right) (photos credit, security camera 11).
5. Square of Pythagoras. The inundation from the first and second waves has been
documented in several video records (Figures 9-11). The owner of a kiosk at D~45 m
(Figure 10, right) estimated h~1 m from the street level. We found no water marks
there but from other eyewitness accounts and several videos publicly available we
were able to roughly verify the water depth reported in the kiosk area. Then, we
estimated a value h~1.6 m asl. Further inland, at the Pharmacy of the square at D~80
m (Figure 10, left) we interviewed with the owner and estimated h~0.3 m from the

8 of 20
ground level. The wave inundated for another ~17 m inland. After talking with
eyewitnesses and from a video record (Figure 11, right) we concluded that the
maximum run-up has been h~2.0 m asl at d=97 m. From a video record of BBC (Figure
9) we calculated water flow velocity inland of ~1m/s (3.6 km/h).
Figure 9. Vathy, Site 5. The first tsunami inundation starts, people cross the main road to evacuate inland
(left). In ~40 s the seaward pedestrian zone and the main road were flooded (right) (photos credit, BBC).
Figure 10. Vathy, Site 5. After the first tsunami inundation the entire square is still wet. The second tsunami
arrival already started, people watch towards the sea side. At the right hand side the Pharmacy mentioned
in text is shown (left). The second wave inundated the main road and flows inland in the square (right). In
the background at the right hand side the kiosk mentioned in text is shown (photos credit, Samos.24).
Figure 11. Vathy, Site 5. Strong water flow inland in the square during the second inundation (left). The
entire square has been covered by water, at distance d=97 m the water depth is only of a few cm (right) but
h~2m asl has been estimated. Most people evacuated but a few look like enjoying the inundation! (photos
credit, Samos.24).
6. Zarbanis shop gallery (D~50 m). A video record shows the second wave inundating a
commercial gallery, perpendicular to the main road, up to d~65 m from the shoreline.
Pedestrians and motorcyclists run to escape. From the video and the field inspection
we estimated h=1.2 m. The water flow velocity inland was found equal to ~1 m/s (3.6
km/h).

9 of 20
Figure 12. Vathy, Site 6, D~60 m from shoreline. People realize that inundation starts and run inland to
evacuate (left). In about one minute later the gallery was inundated (right) (photos credit, Samostoday.gr).
7. Gagou beach, northeast Vathy, outside the bay. In this small beach a local man, who uses
to swim, experienced both the earthquake and tsunami. On the earthquake time the
eyewitness (Figure 13, shown taking sunbath near the wall before we talk to him)
was taking sunbath when the earth shook. Then, ~10’ after the earthquake the first
tsunami wave arrived. It was a relatively small wave and penetrated inland for d=4-
5 m. After ~15’ the second tsunami wave arrived. It was stronger and penetrated
inland up to d=7-8 m. The eyewitness reported that the line of seaweed left in the
beach was a watermark of the maximum tsunami run-in (Figure 13). The estimated
run-up didn’t exceed h~0.4 m. The eyewitness said that the sea oscillated for another
2-3 times with period of about 10-15’.
Figure 13. Vathy, Site 7. Tsunami watermark found in Gagou beach (photo credit, I. Triantafyllou).

10 of 20
Figure 14. Vathy bay, east coast. After the tsunami attack in the east Vathy coast (photos credit,
https://www. facebook.com/manolis.pyrgiotis/videos/10221821513181839/).
3.1.2 Vathy town, west coast. The main observations in this area were performed in Malagari
beach (Figure 15).
8. Malagari beach, west Vathy bay (D=15 m). The owner of a local cantina experienced the
tsunami and reported water run-up h~1.2 m and material damage. In a fence wall at
D~3 m further inland we measured h~1.35 m (Figure 15). The eyewitness said that
from the three small fishing boats he had onshore nearby the cantina only one
remained standing. One boat drifted away by the wave and lost in the sea, while
another one drifted away for ~20 m (Figures 16, 17). Ground erosion was locally
caused during the wave retreat (Figure 16). The coast and the nearby pier were found
covered by sea sand and salt. In the same area, an iron container of 13m x 2m x 2m
in dimension was drifted away for about 6-7 m and rotated ~300 counterclockwise
(Figures 15-17). According to Port Authority officers the container was full of marine
anti-pollution equipment. We roughly estimated the container weight at ~10 tn.
Figure 15. Vathy, Site 8. Tsunami run-up of h~1.35 m was measured at d=18 m (yellow arrow). A boat was
drifted away by ~20 m (blue arrow, see also Figure 16). Another boat was lost in the sea (brown arrow). An
iron container (red arrow) was drifted away by ~6-7 m and rotated counterclockwise ~300 (see Figures 16
and 17).

11 of 20
Figure 16. Vathy, Site 8. A boat was moved by the tsunami by ~20 m (blue arrow). The ground near the moved
boat was eroded during the tsunami withdrawal (photo credits, I. Triantafyllou).
Figure 17. Vathy, Site 8. The tsunami drifted away an iron container by ~6-7 m (blue arrow, left) from its initial
position on the pier (right) (photos credit I. Triantafyllou). Sea also Figures 15 and 16. In the background the
Vathy town at the east bay coast is seen.
3.1.3. Karlovasi town, NW Samos (Figure 18).
In Karlovasi town the tsunami and its impact have been documented by field observations,
video records and eyewitness accounts. The documentation is presented from the east of the
port to the west of it.

12 of 20
Figure 18. Main area of field observations in the Karlovasi vessels shelter (marina) situated to the east of
the port.
9. Restaurant, east of marina (D~5 m). Two videos taken with mobile phone showed sea
retreat for several meters (Figure 19). This is consistent with the accounts of
eyewitnesses (see Site 11).
Figure 19. Karlovasi, Site 9. Sea retreat a few minutes before inundation (photos from mobile phone videos
by anonymous eyewitness).
10. Marina area. In the localities A, B and C (Figures 18, 20, 21) watermarks were found.
In B the wave penetrated inland from the beach, overtopped the narrow pedestrian
zone and reached the main road at D~84 m. In locality C we measured D~65 m. Light
wooden structures were removed from their initial positions (localities D and E) and
a small boat moved ashore on a pier at h~0.7 m (locality F). Between localities C and
D the goal posts and the perimeter fences of a small football terrain were displaced
and deformed respectively by the tsunami inundation and retreat.

13 of 20
Figure 20. Tsunami watermarks in positions A (left) and B (right) shown in Figure 18 (photo credit M. Gogou).
Figure 21. Tsunami watermarks in positions C (left) and D (right) shown in Figure 18. In position D a
wooden structure of the cultural association of Karlovasi was drifted away from its initial position for ~10
m (photos credit, M. Gogou).
Figure 22. In locality E (Figure 18) a wooden structure of the cultural association of Karlovasi was drifted
away from its initial position for ~10 m (left), while in locality F the wave overtopped the pier (h=0.7 m)
and moved ashore a small boat (right) (photos credit, M. Gogou).
14 of 20
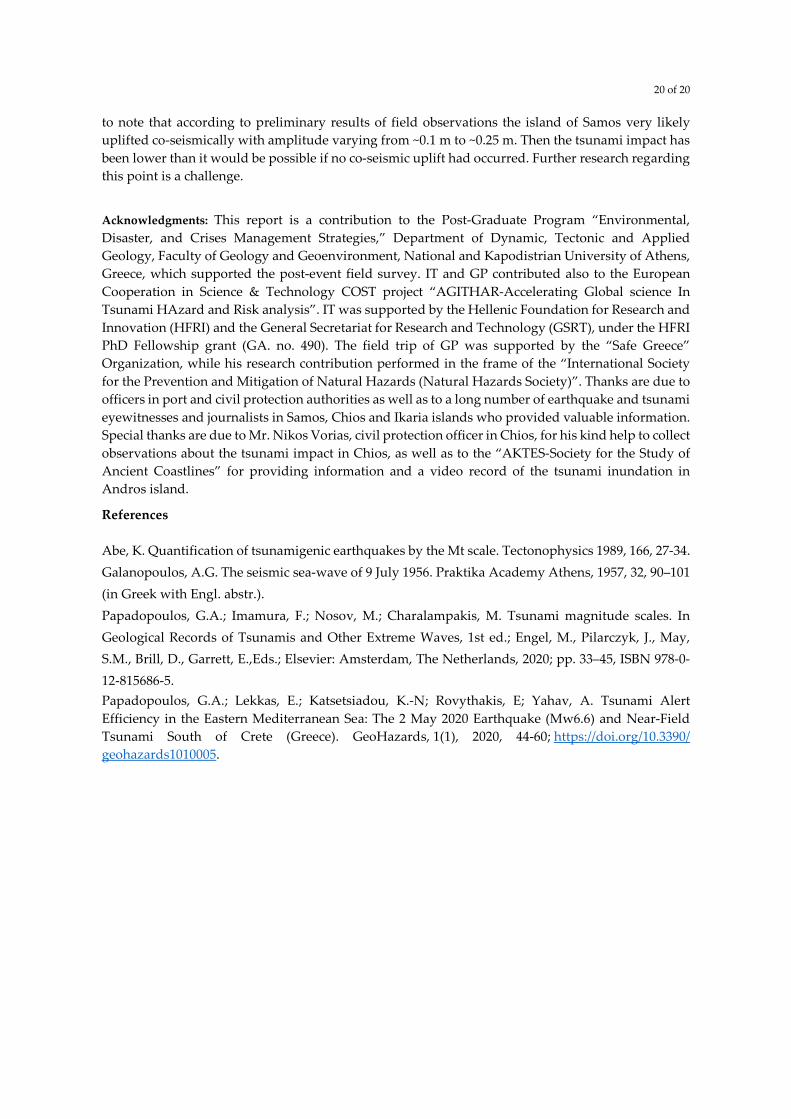
11. Port Authority building, west port side (D~45 m). A fisherman reported that he felt the
earthquake violently onboard offshore Karlovasi Port. The first sea motion was a retreat
and boats were seen strand as in dry land. This was verified from an independent local
resident being at the seashore at the event time. Some minutes later inundation followed
and the sea water covered the coastal pedestrian zone. In a video record available to the
Port Authority officers sea retreat is seen soon after the earthquake at about 11:57:30. A
couple of minutes later inundation occurred covering the entire distance from the
seashore to the building with the water entering the Port Authority building. This is
verified by a second video record publicly available (Figure 23). However, according to
Port Authority officers no damage was caused in their building. At the building entrance
we measured wave run-up h~1.60 m. The eyewitness said that next to the Port Authority
building, in a narrow street perpendicular to the shoreline and lying at lower level than
the building, the water penetrated inland for another ~35 m. Then, h~1.70 m was found
at d~80 m. Sand and pebbles were left behind. Next to the small street the wave entered
violently a coffee-shop causing material damage. From a video record shooting to the
east of the Port Authority building it results that the pedestrian zone was inundated
violently by the wave, while people run inland to escape. From the field inspection and
the video records analyzed we estimated run-up varying from h~1.50 m to h~1.70 m. It
is noteworthy that in Karlovasi only one inundation was reported.
Figure 23. The Karlovasi pedestrian zone in front of the Port Authority building inundated. At the right
hand side, a few meters from the building, a car of the port police is shown (photo credit, port authority
officers).
12. Ayios Nikolaos beach. A video from security camera shooting directly on the seashore and installed
in a small house situated at ~5.7 km to the east of Karlovasi Port Authority provides unique
opportunity to produce an accurate timeline of the sea level changes (Figures 24-27). Nearly 2’
after the earthquake, on 11:53:10, sea retreat started with maximum retreat of d~20 m. A small
inundation started on 11:53:46 but it was followed by a new retreat phase of only d~3-4 m on
11:55:00. Inundation restarted on 11:55:25 and on 11:55:37 the tsunami inundated violently the
veranda of the house with run-up of h~2m. The water opened violently room doors and flowed
inside. Material damage was caused. Residents are seen to evacuate 30 seconds before the
tsunami attack. In this locality the shortest tsunami arrival was documented.

15 of 20
Figure 24. Ayios Nikolaos beach, Site 12. On 11:53:33 the maximum sea retreat of ~20 m occurs, while on
11:54:29 a small inundation happens.
Figure 25. Ayios Nikolaos beach, Site 12. On 11:55:18 inundation restarts, the room residents leave. On
11:55:35 the tsunami strike starts.
Figure 26. Ayios Nikolaos beach, Site 12. On 11:55:42 inundation at h~2 m asl happens.
Figure 27. Ayios Nikolaos beach, Site 12. On 11:55:58 the wave retreat and on 14:31 the sea is completely
calm.

16 of 20
3.1.4. South coast of Samos
13. Psili Ammos bay. To the east of Pythagorio (Site 14), in the sandy beach of the bay we observed a
wet zone of width d~5-6 m from the shoreline as well as a watermark of seaweed at the same
distance (Figure 28). A local resident eyewitness of the event verified that the wet zone and the
watermark were due to the tsunami inundation. He said also that the first wave arrived ~25-30
min after the earthquake. Possibly this was the second wave observed in Vathy. After water retreat
for ~20-25 m the sea inundated slightly and oscillated 3-4 times with period of ~10-15’. We roughly
estimated h<0.5 m.
14. Port of Pythagorion town. Eyewitnesses said that the sea level oscillated 3-4 times with period ~10’
but no inundation was observed. We found the mean height of the piers varies from ~0.5 m to ~0.6
m asl. The eyewitnesses were unable to specify the time and the mode of the first sea motion.
15. Heraion beach. To the west of Pythagorio (Site 14), a local resident motivated by the tsunami
warning message, run in the beach to watch the tsunami and took the picture shown in Figure 28,
right. The picture shows a wet zone of 3-4 m in width, which indicates small tsunami inundation.
Figure 28. Tsunami watermarks in Psili Ammos beach, SE Samos (left, photo credit, G. A. Papadopoulos)
and in Heraion beach SW Samos (right, photo credit anonymous eyewitness).
16. Kampos beach. A local resident, civil engineer, reported that after the earthquake a drop of the
sea level by ~0.3 m was observed. Then, the sea level rose ~0.2-0.3 m above its initial position.
3.2. Ikaria Isl.
17. Evdilos Port. According to our telecommunication with Port Authority officers, sea retreat of
d~5-10 m happened immediately after they had communicated with Port Authorities in Samos
and learning that the first wave had already arrived in Vathy. This implies that in Evdilos the
sea retreat occurred ~15 min after the earthquake. Then inundation happened in the port and
the water covered one pier with its surface lying at ~1m asl (Figure 29). This is verified by a
video taken with mobile phone. The sea oscillation in the port repeated 2-3 times for about 1
hour. From another video, which has been taken from a security camera but at considerable
distance and at high level inland, we tentatively concluded that the sea retreat happened at
~12:02 and the first strong wave arrival occurred at ~12:05. These remarks are consistent with
the officer’s accounts. A second strong arrival is seen at ~12:28. The waves didn’t inundate
inland and no damage was reported.

17 of 20
Figure 29. Evdilos port, Ikaria island: during (left) and after (right) tsunami inundation (photos credit,
https://www.facebook.com/petrakisikaria/videos/10218569660734726/).
18. Ayios Kirykos Port. According to our telecommunication with Port Authority officers, sea retreat
for a few meters was observed about 15’ after the earthquake. Then sea level rise occurred and
the water reached the surface of the pier at h~0.7 asl. The sea oscillation in the port repeated 2-3
times for about 1 hour, as it did in Evdilos port. The waves didn’t inundate inland. No damage
was caused. In a video taken from a security camera installed at considerable distance from the
port we observed vessels to leave the port and sail to open sea. This happened at 12:10. One
minute later inundation occurred in the marina, which is situated closer to the camera.
Therefore, we concluded that the first tsunami arrival in the port was noted at ~12:10. The same
video shows a second sea level rise occurring in marina at 12:43. Both inundations reached the
marina’s pier level at h~1 m. The second inundation was likely stronger than the first one. After
the first inundation the sea was in continual oscillation until ~14:00.
3.3. Chios Isl.
19. Komi village. A local news agency site uploaded a photo showing several small vessels crushed
on the stone blocks of the breakwater (Figure 30). The vessels were moved by the tsunami from
the nearby small marina of the village. Αccording to an eyewitness about 1 hour after the
earthquake sea retreat by about 15 m was observed and ~3’ later tsunami inundation of h~1.1 m
occurred in the nearby pier. In the beach the run-in was estimated at 15-20 m. The sea oscillation
continued for about 3 hours.
Figure 30. Boats crushed on water break stones in Komi village, south Chios island (right) (photo credit,
astraparis.gr).

18 of 20
3.4. Patmos Isl.
20. Scala port. From a video taken with mobile phone it comes out that part of the pier was inundated
by the tsunami (Figure 31); we roughly estimated h~0.5 m.
Figure 31. Scala port, Patmos Isl. The pier inundated (left) and after the sea retreat (right) (photos credit,
Patmostimes.gr).
3.5. Andros Isl.
21. Nimporio bay. According to information provided by “AKTES-Society for the Study of Ancient
Coastlines” the tsunami was observed at the eastern coast of the island ~1 hour after the
earthquake. A video record by “AKTES” shows that the pier at height of h~0.6 m was slightly
inundated (Figure 32).
Figure 32. Nimporio bay, Andros island. Slight inundation of h~0.6 m was observed (photo credit, AKTES-
Society for the Study of Ancient Coastlines).
3.5. Tsunami magnitude
Although several efforts have been made for the establishment of tsunami magnitude scales, no
standard method has been introduced so far (see review in Papadopoulos et al., 2020a). One of the
most promising approaches is the one proposed by Abe (1989), which is based on Pacific Ocean data
and uses formula (1) to calculate tsunami magnitude, Mt, where H (in m) is the maximum wave
heights at nearshore tide-gauge records at epicentral distances, Δ (in km):

19 of 20
Mt = log10 H+ log Δ+ 5.80 (1)
The constant in (1) has been obtained under the requirement Mt=Mw on the average for the
calibration data set used in [6]. Mt represents not only the overall physical size of a tsunami but also
the seismic moment of the tsunamigenic earthquake. In the Mediterranean Sea basin the applicability
of formula (1) was for the first time tested with success (Papadopoulos et al., 2020a,b) after the
earthquakes of 25 October 2018 (Mw=6.8) and 2 May 2020 (Mw=6.6) that ruptured along the Hellenic
arc. We applied the method for the Samos 2020 tsunami by utilizing seven tide records available
(Table 1). It was found Mt=6.8, which is close to Mw=6.9 or Mw=7.0 calculated independently from
seismic records.
4. Conclusions
The tsunami caused by the large (Mw=6.9) earthquake of 30 October 2020 in the Eastern Aegean
Sea has been a very near-field event for Samos and other coasts close to the source. However, no tide-
gauge records are available in the near-field domain. From seven far-field tide records we were able
to calculate tsunami magnitude Mt=6.8, equivalent to seismic moment magnitude, which is a good
approximation of the earthquake magnitude calculated independently from seismic records.
The post-event field survey performed during the three days following the event, combined with
the analysis of several video records and the evaluation of accounts collected from local authorities
and eyewitnesses, we reached at useful results for understanding the tsunami impact on the coastal
communities as well as the wave hydrodynamic features in several coastal sites of the Greek islands
in the East and South Aegean Sea.
At all evidence the first tsunami arrival was noted in Karlovasi town, NW Samos, where the
wave reportedly arrived in a few minutes before its arrival in the Vathy bay, NE Samos, i.e. ~10’ after
the earthquake origin time. No doubt that in Vathy two strong waves inundated the coastal zone at
12:04 and 12:24 UTC, the second being more powerful as compared to the first one. However, no
more than one inundation was reported from Karlovasi. On the other hand, in Karlovasi the first sea
motion was a retreat causing vessels to strand as in dry land.
In Vathy coastal zone the wave run-up in general exceeded 1.5 m. The maximum run-up of h~2.0
m asl was measured in the main square of Vathy bay at run-in distance of d~98 m. From several video
records we estimated that in various observation sites the maximum water flow velocity inland
ranged from 1.0 m/s to 1.95 m/s. In Karlovasi maximum h~1.70 m was found at d~85 m. In both Vathy
and Karlovasi the tsunami was powerful enough and caused material damage along the coastal
zones. No human victims were reported. It is of interest to further examine at what extent the tsunami
warning message sent to local population at time between the first and the second wave facilitated
or not evacuation. More extensive has been the tsunami impact in Vathy where the various stores,
offices, restaurants and other tourist and commercial shops situated along the coastal zone suffered
remarkable damage. Damage was also caused to several cars and small vessels that drifted away by
the tsunami. In several observation sites sea sand and pebbles were left behind while extensive
littering occurred. In at least one coastal spot the tsunami withdrawal caused local ground erosion.
In both Evdilos and Ayios Kirykos ports, NE and SE Ikaria island, respectively, sea retreat of ~5-
10 m was first reported about 10-15’ after the earthquake. Possibly two inundation phases happened
in the ports with the water covering the piers at ~1 m asl. The waves didn’t inundate inland and no
damage was caused. Inundation of ~1 m or less was reported from other islands, including Patmos
and Andros as well as south Chios where a few small vessels crushed on the rocks of the water break.
Low tsunami hazard has been considered so far for the area of the Eastern Aegean Sea. However,
the Samos 2020 tsunami is the third in series that occurred in the area after the tsunamis caused by
the strong earthquakes occurring on 12 June and 20 July 2017 with magnitudes Mw=6.3 and M=6.6.
These tsunami waves, although have been only local, call for a re-evaluation of the tsunami hazard
level and the preparedness for tsunami risk mitigation in the area. Last but not least, it is of interest
20 of 20
to note that according to preliminary results of field observations the island of Samos very likely
uplifted co-seismically with amplitude varying from ~0.1 m to ~0.25 m. Then the tsunami impact has
been lower than it would be possible if no co-seismic uplift had occurred. Further research regarding
this point is a challenge.
Acknowledgments: This report is a contribution to the Post-Graduate Program “Environmental,
Disaster, and Crises Management Strategies,” Department of Dynamic, Tectonic and Applied
Geology, Faculty of Geology and Geoenvironment, National and Kapodistrian University of Athens,
Greece, which supported the post-event field survey. IT and GP contributed also to the European
Cooperation in Science & Technology COST project “AGITHAR-Accelerating Global science In
Tsunami HAzard and Risk analysis”. IT was supported by the Hellenic Foundation for Research and
Innovation (HFRI) and the General Secretariat for Research and Technology (GSRT), under the HFRI
PhD Fellowship grant (GA. no. 490). The field trip of GP was supported by the “Safe Greece”
Organization, while his research contribution performed in the frame of the “International Society
for the Prevention and Mitigation of Natural Hazards (Natural Hazards Society)”. Thanks are due to
officers in port and civil protection authorities as well as to a long number of earthquake and tsunami
eyewitnesses and journalists in Samos, Chios and Ikaria islands who provided valuable information.
Special thanks are due to Mr. Nikos Vorias, civil protection officer in Chios, for his kind help to collect
observations about the tsunami impact in Chios, as well as to the “AKTES-Society for the Study of
Ancient Coastlines” for providing information and a video record of the tsunami inundation in
Andros island.
References
Abe, K. Quantification of tsunamigenic earthquakes by the Mt scale. Tectonophysics 1989, 166, 27-34.
Galanopoulos, A.G. The seismic sea-wave of 9 July 1956. Praktika Academy Athens, 1957, 32, 90–101
(in Greek with Engl. abstr.).
Papadopoulos, G.A.; Imamura, F.; Nosov, M.; Charalampakis, M. Tsunami magnitude scales. In
Geological Records of Tsunamis and Other Extreme Waves, 1st ed.; Engel, M., Pilarczyk, J., May,
S.M., Brill, D., Garrett, E.,Eds.; Elsevier: Amsterdam, The Netherlands, 2020; pp. 33–45, ISBN 978-0-
12-815686-5.
Papadopoulos, G.A.; Lekkas, E.; Katsetsiadou, K.-N; Rovythakis, E; Yahav, A. Tsunami Alert
Efficiency in the Eastern Mediterranean Sea: The 2 May 2020 Earthquake (Mw6.6) and Near-Field
Tsunami South of Crete (Greece). GeoHazards, 1(1), 2020, 44-60; https://doi.org/10.3390/
geohazards1010005.