Embed Size (px)
Citation preview

Supplement to the Main Report
Prepared through a grant from the Bill & Melinda Gates Foundation
New Research, Recommendations, and a Partnership Framework for States and School Districts
TheTurnaround
Challenge
Mass Insight Education & Research Institute (project organizer)
Mass Insight Education & Research Institute, founded in 1997, is an independent non-profit that organizes public schools, higher education, business, and state government to significantlyimprove student achievement, with a focus on closing achievement gaps.
Mass Insight’s education reform strategies are defined by two convictions: that change at scaledepends on the practical integration of research, policy, and practice; and that only dramatic and comprehensive change in high-poverty schools will produce significant achievement gains.The strategies that Boston-based Mass Insight implemented to help make Massachusetts a reformmodel now inform the organization’s national work on two high-impact goals: using AdvancedPlacement® as a lever to attain excellence in math and science achievement and to transformschool culture, and the successful turnaround of consistently under-performing public schools.
18 Tremont Street, Suite 930, Boston, MA 02108617-778-1500 Fax: 617-778-1505
For more information about Mass Insight and for additional resources and tools relating to the turnaround of under-performing schools, please find us on the web at www.massinsight.org.
Bill & Melinda Gates Foundation (lead funder)
Guided by the belief that every life has equal value, the Bill & Melinda Gates Foundation works to reduce inequities and improve lives around the world. In developing countries, it focuses on improving health, reducing extreme poverty, and increasing access to technology in publiclibraries. In the United States, the foundation seeks to ensure that all people have access to a greateducation and to technology in public libraries. In its local region, it focuses on improving the lives of low-income families. Based in Seattle, the foundation is led by CEO Patty Stonesiferand Co-chairs William H. Gates Sr., Bill Gates, and Melinda French Gates.
www.gatesfoundation.org
Copyright © 2007 by the Mass Insight Education & Research Institute, a 501c3 non-profit organization. All rights reserved. Permission granted to copy this report for non-commercial use.

i
Why America’s best opportunity to dramatically improve student achievement lies in our worst-performing schools
TheTurnaround
Challenge
Prepared through a grant from the Bill & Melinda Gates Foundation
New Research, Recommendations, and a Partnership Framework for States and School Districts
By Andrew Calkins, William Guenther, Grace Belfiore, and Dave Lash
Supplement to the Main Report
©2007 MASS INSIGHTii
The authors and Mass Insight Education & ResearchInstitute would like to express our deep appreciation to the researchers, policymakers, reform experts, superin-tendents, principals, and teachers who contributed to thedevelopment of The Turnaround Challenge. The conclu-sions reached in this report are our own, but they reflectextensive input from a broad range of project participants.Thanks also go to our partners at the Bill & Melinda GatesFoundation, whose support made the project possible. Weowe a deep debt of gratitude, as well, to our core advisorson the project, particularly Irving Hamer of theMillennium Group (www.the-m-group.com), who asDeputy Superintendent was the architect of Miami-Dade’sImprovement Zone; and Bryan Hassel, noted researcherand writer on No Child Left Behind and school reform(www.publicimpact.com). NewSchools Venture Fundprovided funding for a separate research project thatproved extremely valuable to our work on this report.Finally, this project drew inspiration and evidence from awide body of research focused on under- and over-per-forming schools, change management, and the impacts ofpoverty on learning. Special thanks go to KarinChenoweth, author of It’s Being Done (Harvard EducationPress, 2007); David Berliner (“Our Impoverished View ofEducation Reform,” Teachers College Record, 2006); andAbigail and Stephan Thernstrom (No Excuses: Closing theRacial Gap in Learning, Simon & Schuster, 2003), all ofwhose work gave us confidence that The TurnaroundChallenge can in fact be met.
AuthorsAndrew Calkins is Senior Vice President of MassInsight Education & Research Institute. He was former-ly the Executive Director of the non-profit organizationRecruiting New Teachers, Inc., and a senior editor and project manager at Scholastic Inc.
William Guenther is Founder and President of Mass Insight Education & Research Institute. He is also the founder of Mass Insight Corporation, a Boston-based research and consulting firm that seeks to keep Massachusetts and its businesses and institutions globally competitive.
Grace Belfiore is Senior Editor at Mass InsightEducation & Research Institute. The holder of a doctorate in education history from Oxford University,she has worked as a researcher and editor in standards-based education in both the U.S. and U.K., and was formerly the director of Pergamon Open Learning, aself-paced learning division at Reed Elsevier Publishers.
Dave Lash is a strategy and innovation consultant withexpertise in designing and implementing new initiatives.Principal of Dave Lash & Company(www.davelash.com), he helped develop the conceptualmodels and visual orientation of this report.
Mass Insight Education and Research InstituteSenior management and project-related staff:William Guenther, PresidentAndrew Calkins, Senior Vice PresidentMelanie Winklosky, Vice President, Development & OperationsAlison Fraser, Great Schools Campaign DirectorJoanna Manikas, Design and Production DirectorGrace Belfiore, Senior EditorCharles Chieppo, Senior WriterChris Tracey, Researcher/WriterDeb Abbott, Finance ManagerJulie Corbett, Program AssociateElizabeth Hiles, Research AssociateLinda Neri Watts, Contributing EditorDonna Michitson, Graphic DesignerDanielle Stein, [former] Program Mgr., Building Blocks
Project and editorial consultants:Ethan Cancell, Brockton Public SchoolsBryan Hassel, Public Impact, Inc.Irving Hamer, Millennium GroupRichard O’Neill, Renaissance School ServicesAdam Kernan-Schloss, KSA-PlusJennifer Vranek, Education First ConsultingAnne Lewis
Project partners:Michael Cohen and Matt Gandal, Achieve Inc.
National project advisors and focus group participants:Richard Elmore, Harvard UniversityTokes Fashola, American Institutes for ResearchLauren Rhim, University of MarylandDouglas Sears, Boston UniversityKen Wong, Brown UniversityTim Knowles, University of ChicagoBarbara Byrd-Bennett, Cleveland State UniversityVicki Phillips, [formerly] Portland, OR Public SchoolsKati Haycock, The Education TrustAndrew Rotherham, Ed SectorRichard Hess, American Enterprise InstituteAmy Starzynski, Holland & KnightScott Palmer, Holland & KnightAna Tilton, NewSchools Venture FundRenuka Kher, NewSchools Venture FundAnthony Cavanna, American Institutes for ResearchRobin Lake, Center for Reinventing EducationMonica Byrn-Jimenez, UMass BostonBrett Lane, Education Alliance at Brown UniversityCheryl Almedia, Jobs for the FutureCeline Coggins, Rennie Center for Education ReformDavid Farbman, Mass 2020Jamie Gass, Pioneer InstituteFred Carrigg, New Jersey Department of EducationRon Peiffer, Maryland Department of EducationJoAnne Carter, Maryland Department of EducationDane Linn, National Governors AssociationFritz Edelstein, U.S. Conference of MayorsJulie Bell, National Conference of State LegislaturesSunny Kristin, National Conference of State Legislatures
Massachusetts project advisors and focus group participants:Juliane Dow, Massachusetts Department of EducationLynda Foisy, Massachusetts Department of EducationSpencer Blasdale, Academy of the Pacific Rim, BostonSally Dias, Emmanuel CollegePeggy Kemp, Fenway High School, BostonKen Klau, Massachusetts Department of EducationMatt Malone, Swampscott Public SchoolsEarl Metzler, Sterling Middle School, QuincyPaul Natola, Boston Public SchoolsBasan Nembirkow, Brockton Public SchoolsKiki Papagiotis, Salem High SchoolAnn Southworth, Springfield Public Schools
Acknowledgements

THE TURNAROUND CHALLENGE: SUPPLEMENT 1
INTRODUCTIONDrilling down: Closer analysis at the state, district, school, and student levels .........................................................2
STATE EFFORTS Profiles of Ten State Intervention Strategies for Under-Performing SchoolsThe upshot: mostly tentative steps, and more frustration than success
Introduction..................................................................................................................................................6Alabama.......................................................................................................................................................9Arizona.......................................................................................................................................................11California....................................................................................................................................................13Florida ........................................................................................................................................................15Hawaii ........................................................................................................................................................17Maryland ....................................................................................................................................................19Massachusetts ............................................................................................................................................21Michigan ....................................................................................................................................................24Ohio ...........................................................................................................................................................26Virginia.......................................................................................................................................................28
DISTRICT EFFORTSThe Turnaround Laboratories: Four Major Districts' Turnaround StrategiesExperiments in fundamental change
Introduction................................................................................................................................................32Chicago’s Renaissance 2010: A spectrum of autonomy-for-accountability options ........................................34Miami-Dade’s School Improvement Zone: Significant reform through
central control and uniform design.........................................................................................................42New York’s Children First: A districtwide empowerment strategy..................................................................48Philadelphia’s Diverse Provider Model: The “thin management” theory, in practice.......................................56
BENCHMARK SCHOOLSVisualizing the Goal: HPHP Schools in ActionLessons from high-performing, high-poverty high schools ...........................................................................................64
STUDENTS’ CHALLENGESPoverty’s “Perfect Storm” Impact on Learning and the Implications for School DesignThree colliding factors = a hurricane of challenges......................................................................................................74
RESOURCE DIRECTORYAnnotated bibliography of selected turnaround resources...........................................................................................87
SCHOOL TURNAROUND R&D INITIATIVE PROFILEBrief description of the larger turnaround initiative of which The Turnaround Challenge is a part..............................94
Table of Contents, Supplement to the Main Report

©2007 MASS INSIGHT2
The turnaround recommendations and framework in The Turnaround Challenge grew out of both new research
and synthesis of extensive existing research, as carried out byMass Insight Education & Research Institute and its partnerssince September 2005. The highlights of this analysis are pre-sented in the main report.
If the main report is the tip of proverbial iceberg, this supple-ment represents at least part of the mass underneath it. In thecourse of preparing the main report, we examined state and dis-trict intervention strategies and high-performing, high-povertyschools at a deeper level of specificity than what the design of
the main report allowed us to present. The highlights of thatresearch are presented here in this supplement, along with amore extensive probe into poverty’s impact on learning and theconsequent implications for the design of high-performingschools serving high-poverty enrollments.
Readers of The Turnaround Challenge should therefore regard this supplement not as a separate report, but as a set of “drill-downs” at four levels:
• State: Brief profiles of ten representative state strategies to intervene in failing schools
• District: More detailed exploration of four high-profile district experiments in school turnaround
• School: Close analysis of five high-performing, high-poverty schools that can help us visualize the end goal of turnaround efforts
• Student: Summary of emerging research on the three categories of impact that poverty has on students’ readiness to learn.
What’s Not Here: Turnaround Exemplars at ScaleThere is fairly extensive research on what does not succeed inturning around chronically under-performing schools, and thereis an emerging research base on the small number of schoolseffectively serving high-poverty student enrollments. However,there is practically no research available on successful turn-around of failing schools at scale. Some of the individual schoolsserving high-poverty students extraordinarily well are traditionalpublic schools, but most (especially at the high school level) arenew school startups. Unfortunately, as we point out in the mainreport, instances of complete school turnaround – from failingall the way to surpassing district averages – at the high schoollevel are rare. Finding exemplary high schools that were oncechronic under-performers is surpassingly rare.
Drilling Down on School TurnaroundCloser analysis at the state, district, school, and student levels
“Success is not the norm. While there have been successful turnarounds, the interventionexperience is marked more by valiant effortthan by notable success.”
– Researcher Ronald Brady
I N T R O D U C T I O N
THE TURNAROUND CHALLENGE: SUPPLEMENT 3
In his 2003 report for the Thomas Fordham Foundation, CanFailing Schools Be Fixed?, Ronald Brady analyzed intervention infailing schools up to that date and concluded flatly: “Success isnot the norm. While there have been successful turnarounds, theintervention experience is marked more by valiant effort than bynotable success.” As he pointed out, “such well-intended effortsbegin with a paradox. Much is known about how effectiveschools work, but it is far less clear how to move an ineffectiveschool from failure to success.”
The continued search for documentation on individual schoolsthat have made dramatic improvements has also come up short.As Public Impact reported in its 2005 publication, Turnaroundswith New Leaders and Staff, “we could identify neither cross-siteanalyses nor published case studies about individual schoolsthat documented successful turnaround processes in schools.Experts from the two known state and national turnaroundleader training programs confirmed this gap in the publishedresearch literature.”
The landscape is not without strong hints of promise. Clearly,individual schools have made sometimes quite dramaticimprovements in their school culture, attendance rates, andtheir students’ academic performance. There are a number ofstudies of “turnarounds” that differ in degree and definition.Some of the schools profiled negotiated much of their “turn-around” before the implementation of standards-based educa-tion, so they do not provide particularly relevant comparisonsto today’s reform context. Others have made strides over signifi-cantly longer periods of time than our current chronicallyunder-performing schools have in order to produce improve-ment. Still others have impressively moved from chronicallypoor to consistently average – still not good enough by a long
shot for today’s public school graduates – or have failed to sus-tain initial improvements. Lastly, there are schools that havemade commendable improvements in student performance orclosed achievement gaps, but with student populations that aresignificantly different from the high-poverty, high-minorityurban populations that make up the bulk of the schools now inneed of turnaround under NCLB.
In fact, even broadening the scope to gather in high-performing,high-poverty high schools that may not have emerged fromturnaround per se, the lack of exemplars is striking. Two recentstudies that reviewed all of the available literature on high-per-forming, high-poverty schools confirm that result. “Mounting
evidence suggests that reform at the secondary level is far morecomplicated than at the elementary level. While several whole-school reforms of the past fifteen years have elicited improvedachievement in the lower grades, these reforms have failed toproduce similar results in high schools.” That was the conclusionof the Boston-based Rennie Center in its 2005 report, Scaling Up:Reform Lessons for Urban Comprehensive High Schools. Thereport continues, “The momentum of a reform effort often stag-nates against the bureaucratic forces of the large urban highschool. While one prominent response has been to create new,smaller high schools that are student-centered and free from ahistory of inertia, this is a solution that impacts only a fraction ofurban adolescents.”
Even broadening the scope to gather in high-performing, high-poverty high schools that may not have emerged from turnaroundper se, the lack of exemplars is striking.
©2007 MASS INSIGHT4
The Rennie Center’s previous report in the area, Head of theClass: Characteristics of Higher Performing Urban High Schoolsin Massachusetts, had identified and provided preliminaryinformation on the practices of high-performing urban highschools serving low-income, ethnically and racially diversestudent populations. “Our findings,” the authors wrote, “are quite startling. A review of available performance datarevealed only one such Massachusetts school in which stu-dents consistently performed at high levels – University ParkCampus School in Worcester.” (UPCS is a Worcester publicdistrict school, high-poverty and non-selective, but it benefitsfrom its partnership with nearby Clark University and verysmall size, and was a new start, rather than a turnaround. It isfeatured in the third section of this supplemental report,which describes five high-performing, high-poverty schools.)By broadening its search to include “higher” performing high-poverty urban high schools, the Rennie study included nineschools in total in its study, but significantly only two of thenine were non-selective, comprehensive high schools. The restcomprised three charter schools, two pilot schools (districtschools with charter-like conditions) and two non-traditionaldistrict schools (including UPCS).
Karin Chenowith’s recently published book, It’s Being Done:Academic Success in Unexpected Schools (Harvard UniversityPress, 2007), confirms that not a lot has changed in the last yearor two. Out of 15 schools she searched out across the country inan attempt to understand how some schools manage to helptheir students achieve despite highly adverse conditions, onlythree are high schools – and she had a hard time finding those.
UPCS was the easy one to spot. “I thought it would be easy,” shewrites, “to find more high schools. But I was wrong. All theresources of the Education Trust – and they are considerable –had been spent trying to find high schools that were successfulin educating poor kids and kids of color, and they were comingup empty… Every time we thought we had found one, we wouldlook a little deeper and find that the school somehow ‘lost’ halfits students between freshman and senior years, or that it didn’tbother administering the state test to half of its students, or thatit required students to pass an exam to enter, or in some otherway was disqualified from being considered.”
The two other high schools that Chenoweth included areElmont Memorial Junior-Senior High School in Elmont, NewYork, and Granger High School in Granger, Washington –and she had to make an exception for Granger, as the schoolhadn’t made AYP, as had all of the other schools she profiled.She made the exception in part, she says, because “it hadproven very difficult to find a high school that met all the cri-teria for selection.” For its part, Elmont is not a truly high-poverty school; about a quarter of its students arefree/reduced-price-lunch eligible. Its achievement levels dostand out clearly among middle and high schools in New Yorkstate that primarily serve students of color (more than half ofGranger's enrollment is African-American).
For this project, Mass Insight reviewed all of the research wecould identify that focused on high-performing, high-povertyeducation. (See Part 2.5 of the Main Report for a table extract-ing findings from 13 of the most prominent studies.) Our syn-thesis of that research produced the Readiness Model – a con-struct that defines what we believe the research reveals abouthow high-performing, high-poverty schools operate. Our analy-
Introduction continued
THE TURNAROUND CHALLENGE: SUPPLEMENT 5
sis was also directly supported by research that Mass Insight hasconducted in Massachusetts over the past six years, as part ofour Building Blocks Initiative for Standards-Based Reform. Thatresearch is distilled and presented in the third section of thissupplemental report, and involves five high-performing schoolsserving relatively (some extremely) high-poverty enrollments. Itis intended to set a benchmark – to show how a few high
schools right now are producing dramatically better achieve-ment outcomes (as well as graduation and four-year collegematriculation rates) than peer schools serving demographicallysimilar enrollments.
Along with the information on these benchmark schools, thissupplement provides a more detailed examination of four dis-tricts that have launched strategies designed to proactively bringabout comprehensive turnaround – that is, turnaround with alarger vision than simply “fixing” what’s “broken” within achronically failing traditional-model school. We lead off with aprofile of ten different approaches taken by states to address thechallenge of failing schools, and, in the supplement’s final sec-
tion, we provide a deeper analysis of the challenges virtually allof these schools face at the student level, serving children whotend to lack the stable and supportive learning environment out-side of school that their more affluent counterparts enjoy.
What’s Next: Operationalizing Comprehensive TurnaroundThanks to continuing support from the Bill & Melinda GatesFoundation, the research that produced The TurnaroundChallenge – including this supplemental report – will continue.A follow-up grant from the Foundation will enable MassInsight, working in conjunction with a number of nationalpartners, to develop the workplans, policy templates, samplecontract language, and other tools necessary for states, districts,and external partners to adapt and “operationalize” the recom-mendations in The Turnaround Challenge. These tools shouldbe complete by mid-2008, and Mass Insight plans to workclosely with selected states and large districts to customize andimplement comprehensive turnaround strategies. Funding forthe work will come from private and public sources; at somepoint, NCLB’s reauthorization and new state budgets (recog-nizing the urgency represented by the increasing number ofschools identified as failing, the depth of the achievement gapin these schools, and its enormous social cost) should initiate anew stream of public investment.
Practitioners, policymakers, education reform leaders, andinvestors whose interest is piqued by the findings, analysis, andrecommendations of this report – the foundation-laying elementin Mass Insight’s larger turnaround initiative – are invited tocontact us at [email protected] and to visit our website atwww.massinsight.org. There is a lot of work to be done.
“All the resources of the Education Trust – andthey are considerable – had been spent tryingto find high schools that were successful ineducating poor kids and kids of color, and theywere coming up empty.”
– Writer Karin Chenoweth

©2007 MASS INSIGHT6
One of the most potentially radical aspects of No Child LeftBehind is the Act’s mandated timetable for restructuring
schools with stagnant and “inadequate” performance. Five yearsinto the law’s implementation, nearly 2,000 schools nationwidehave been identified as requiring restructuring.1 This figure hasrisen rapidly and is predicted to continue rising in the years tocome, to 5,000 or more schools by 2009-10. The proliferation ofsuch restructuring designations under No Child Left Behind hasresulted in restructuring efforts at a scale previously unprecedent-ed in the United States.
No Child Left Behind establishes a Local Education Agency-cen-tered approach to restructuring of schools, with few expresslymandated state actions. For the most part, required state actionsare limited to conducting timely data analysis and providing
technical assistance to restructuring schools.2 But states are alsorequired to monitor LEA restructuring efforts and take correc-tive action when the LEA fails to fully carry out its responsibili-ties. Though explicit state responsibilities under No Child LeftBehind are few, state approaches to restructuring vary widely.The factors influencing state roles are too numerous to fullyenumerate, but the varied roles appear to be largely influencedby several factors including capacity concerns, political will, andthe legal relationship between LEAs and the state.
As part of this project, Mass Insight conducted national researchon the implementation of restructuring programs to determinewhich states have taken novel approaches to their role in
restructuring. This initial research identified 10 states that haveeither taken somewhat unique approaches or pursued strategiesthat offer important lessons about state intervention. The analy-sis that follows distills several of the most important lessonslearned from this research, and informed the conclusions andrecommendations presented in the main report. Specific infor-mation about the approaches taken in each of the 10 states ispresented in the profiles that follow this analysis.
“Light-touch” Technical Assistance Is Not EnoughThe states profiled differ widely in their will to implement mean-ingful school-level reforms. Such differences are certain to persist,but recent policy changes in a few states signify – perhaps – grow-ing recognition of the need for states to adopt an active role inschool restructuring. For example, Ohio, initially one of the morepassive states, recently enacted regulations that dictate statetakeover of chronically under-performing LEAs. In California, astate whose passive approach was a response to severe capacityconcerns, officials have recently been implementing programsthat increase state aid and technical assistance to LEAs that housethe state’s lowest performing schools. Recent changes to restruc-turing regulations in Massachusetts provide state officials with thepower to intervene in schools more quickly and dramatically.Arizona officials have reformed their accountability system inways that reward LEA compliance with state directives.
The reasons for such policy shifts are difficult to pinpoint, but like-ly include recognition of both enforcement requirements placedon states and the untenable political scenarios that can result froma passive state approach. Research included in this report, as wellas research from other sources, suggests that meaningful change inchronically under-performing schools is more likely when the stateassumes an active role.3 This research also suggests that suchchange has been less likely to occur when states fail to, at mini-
Intervention in Under-Performing Schools:Profiles of Ten States’ StrategiesMostly tentative steps, and more frustration than success
Recent policy changes in a few states signify – perhaps – growing recognition of the need for states to adopt an active role in school restructuring.
S T A T E E F F O R T S
THE TURNAROUND CHALLENGE: SUPPLEMENT 7
mum, take affirmative steps to ensure that LEAs engage in effectiverestructuring practices. With so many more low-performingschools being identified, failure to turn them around increases thepressure on states to intervene. This public pressure to incitechange in chronically under-performing schools may create a polit-ically difficult, or even untenable, scenario for state officials.
Proactive State Turnaround Policies Set Standards forTurnaround – and Consequences for InactionThe main Turnaround Challenge report presents in some detailour analysis of the failure of most current state policymaking onschool intervention, and our ideas for a more proactive response.The research on intervention strongly suggests the importance ofthe state role in defining what restructuring requires; otherwise,the open-ended fifth option in the current NCLB language onrestructuring permits districts and schools (who have, after all,been the engineers of such poor performance) to fiddle whenmuch more dramatic intervention is called for. Our analysis there-fore calls for much more attention by state policy to establishingcriteria for turnaround that, among other things, create the flexi-ble, supportive kinds of operating conditions that turnaroundleadership teams need in order to succeed. The analysis also callsfor attention to capacity-building (both internally in schools anddistricts and externally among lead turnaround partners) and tomechanisms that will help organize turnaround work in clusters ofschools for the sake of both efficiency and effectiveness.
Our analysis also suggests that none of these policies will havemuch impact where they’re needed most if states fail to matchthese “carrots” – flexible operating conditions, added capacity,increased resources – with the “stick” of an unpalatable conse-quence for inaction. The positives of a truly comprehensive stateturnaround initiative are vital, but insufficient without a conse-quence for districts that fail to act or schools that fail to improve
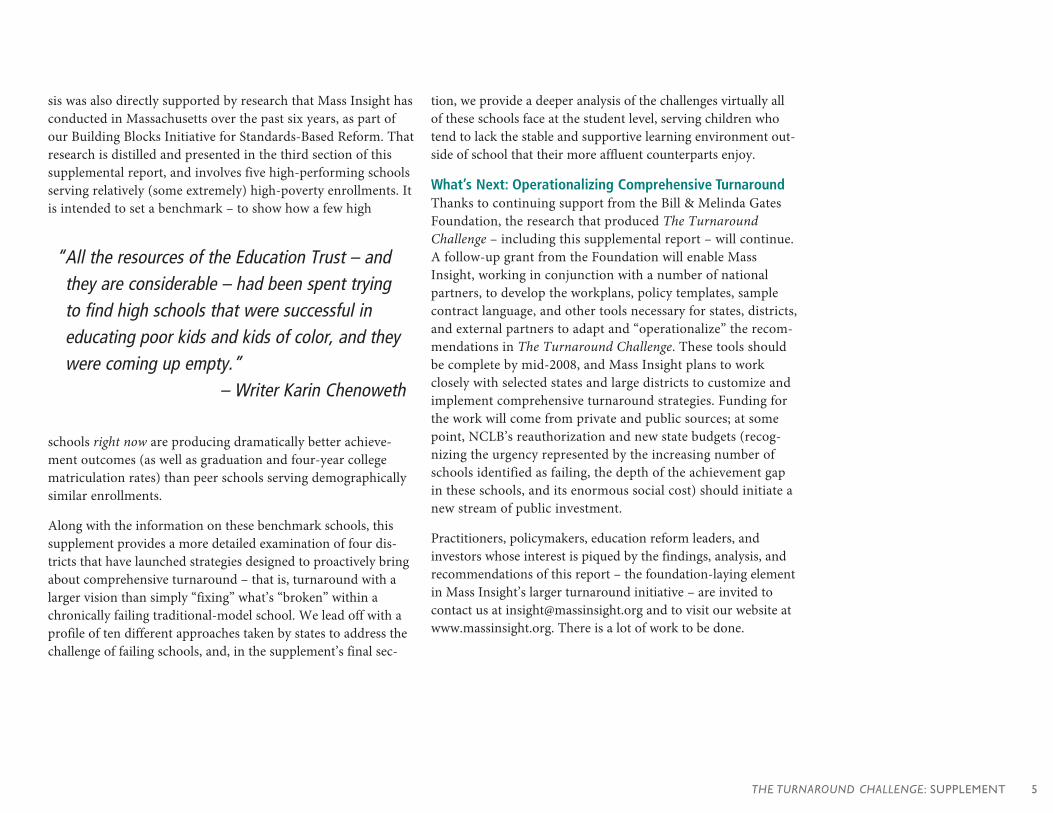
after two years of turnaroundeffort. In Michigan, for example,the lack of a clear consequencebecame problematic whenschools began “aging out” of theNo Child Left Behind continu-um of mandated interventions.Michigan’s reluctance to pre-scribe an ultimate consequencefor these schools, exhibited bystate officials’ pleas for federalguidance, has resulted intremendous pressure on thestate to respond in the case ofschools that have not met per-formance requirements for seven or more years. WhileMichigan’s lack of an ultimate consequence is not unique amongthe states (many have publicly stated they would not take overschools), their implementation of No Child Left Behind has puttheir schools ahead of those in other states along the interven-tion continuum. It thus serves as an indicator of what may be instore for other states that choose a similarly passive route.
The state profiles suggest that, without an ultimate consequence,states have struggled to spur substantial change in all schools.Faced with this challenge, several states have devised creativeresponses. Florida, a state that had publicly announced it wouldnot take over schools, threatened to withhold discretionary fundsand grants from LEAs in which chronically under-performingschools were located if the LEAs failed to implement a set of intru-sive reforms at the school level. Virginia was not permitted to takeover schools, so it embraced its ability to take corrective actionagainst LEAs that house unaccredited schools. It used this powerto create additional incentives for LEA compliance. The Arizona
Ten Sample StatesProgram Change: Primarily coaching, PD, “light-touch” consulting
Alabama: Striving for CoherenceCalifornia: Uncertainty in the Face of Enormous Scale
Hawaii: Experimenting with Outside ProvidersMichigan: Seeking Deeper Impact in Restructuring Schools
Ohio: Moving Closer to Active Intervention
Program & People Change: Training in turnaround,applying new capacity
Virginia: Investing in Turnaround Leaders
Program, People, and Moving Towards Conditions Change:Arizona: Local Efforts, State LeverageFlorida: Pressuring Districts for More Proactive Turnaround
Maryland: Caught in Political Cross-fireMassachusetts: Seeking to Set Standards for Turnaround
©2007 MASS INSIGHT8
system now dictates that severe state interventions may resultfrom either stagnant low performance or a lack of good faithrestructuring effort by the LEA. Each of these states has used ter-minal consequences conditioned on compliance to create addi-tional incentives at the LEA-level to encourage substantial reform.That form of leverage may, in fact, be the most useful applicationof a terminal consequence for failing schools, as the successrecord for state takeovers, historically, has not been bright.
States Must Prepare for Legal and Political ResistanceThe experience in several states also suggests that states taking anactive role in restructuring should prepare for political and legalresistance to their actions. In Maryland, a plan to implement pri-vate management for several Baltimore schools resulted in theBaltimore Teachers’ Association and the legislature suing to delayfurther implementation of the plan. In Massachusetts, the statelegislature balked at provisions in new restructuring regulationsthat would have permitted a close-and-reopen “New Beginnings”strategy for schools where all other interventions had failed. InVirginia, the state Board of Education’s efforts to increase statepower over restructuring decisions had to pass both houses of thegeneral assembly. These examples demonstrate that significantobstacles will likely accompany a strong state role. States adoptingsuch roles must build the political will to overcome oppositionand be prepared to defend the legality of their approach.
States Must Build Capacity and Increase CoherenceThe experience in states like Alabama highlights the need forcapacity-building efforts and the benefits of improving thecoherence of state responses to restructuring mandates. Basedon its prior experience with state-directed school restructuring,state officials decided that the state lacked the ability to sustainimprovements at the school level without a strong local gover-nance role. Their approach moved towards trying to provide thebest possible assistance to LEAs as they undertake schoolrestructuring efforts. Recognizing a lack of the capacity neededto support LEAs and the disconnectedness of many state servic-
es being provided to these schools and their communities,Alabama created the Accountability Roundtable, a board com-posed of members of each division in the state’s InstructionalSupport Services department. This body created a task force thatcould collaborate across departments to provide the uniqueservices each struggling school required. Reports from Alabamaindicate that Roundtable members have incorporated an under-standing of restructuring into their in-department activities, andthey conduct their daily work with an awareness of the effecttheir actions have on school-level restructuring efforts.
Hawaii, on the other hand, is faced with an extraordinary capac-ity problem resulting from an unusually high percentage ofschools in restructuring and the lack of local governance struc-tures to undertake restructuring efforts. (The state has just onestatewide school district.) Its response has been to contract withprivate service providers, who consult with schools to conductreform efforts. As the number of restructuring schools in Hawaiicontinues to rise, state allotments for such private services havenaturally increased. Recent comments from Hawaii officials sug-gest the state is beginning to confront the reality that the cost ofthis approach will be problematic as the scale of schools inrestructuring continues to increase. If costs become untenable,Hawaii will have provided services without building capacitywithin the state school system to carry on the work.
These lessons represent some of the major trends in the states pro-filed. The individual state profiles that follow provide further insightinto both the varied state responses to NCLB’s regulatory require-ments, as well as the elements needed to promote meaningfulreform in chronically under-performing schools. They are meant toilluminate and expand upon the analysis in the report to which theyare attached. All of the profiles offered here provide valuable lessonsto state policy strategists, but we suggest particularly close attentionto Arizona, Florida, Maryland, and Massachusetts. The experiencein these states is most relevant to the framework for turnaround thatis presented in the main report.
State Intervention continued
None of these policieswill have much impactwhere they’re neededmost if states fail tomatch these “carrots” – flexible operating conditions, added capacity, increasedresources – with the“stick” of an unpalatableconsequence for inaction.
THE TURNAROUND CHALLENGE: SUPPLEMENT 9
A labama offers at least a partial lesson in how one state hasattempted to end the “silo-izing” of its intervention
effort, connecting it to multiple agencies that play supportroles for schools and children. After less-than-successfulefforts with failing school takeover, Alabama’s state educationagency recognized a lack of capacity and coordination in the new restructuring process it was preparing to conduct. In response, officials created a new board to manage staterestructuring efforts. Reports suggest that the board has been effective in solving the coordination problem. It has also improved state capacity by distributing restructuringknowledge throughout the agency. The result is a state entitythat recognizes the centrality of restructuring efforts to allagency operations.
Traditionally Strong State Role in EducationAlabama has a history of strong state involvement in publicschools, due to state constitutional limitations on the politicalpower of local education agencies (LEAs), a high percentage ofschool costs being funded by the state, and a tradition of statelevel control.4 The strong centralized power in Alabama was evi-denced by the state board of education taking over the financialoperation of 13 school districts between 1995 and 2001. Yet, likestates with less centralized power, Alabama has chosen to adopta collaborative, coaching-based approach to school restructuringin the wake of No Child Left Behind. The approach was foundedon the recognition that past state takeovers had not resulted insustained change and that the state department of education,when initially faced with the prospect of intervening in schoolsas a result of No Child Left Behind, lacked institutional knowl-edge of school turnaround processes. The collaborative-coachingmodel was also thought to be an appropriate tool to support thestate department of education’s stance that school improvementactivities are relevant not only in the lowest performing schools,but for all schools in the state.
While primary authority for the creation and implementation ofa school reform plan rests with LEAs, the state support teamprovides critical coaching and collaborative assistance through-out the planning and implementation stages. The state supportteam is composed of three primary actors: regional schoolimprovement coaches, peer mentors, and school improvementspecialists. LEA-hired school improvement specialists act as thecoordinator of reform efforts, as well as a coach, providing ongo-ing professional development to instructors and leaders. Peermentors are highly qualified “master” teachers loaned by LEAsto the state department of education. They serve as a source of
Alabama: Striving for Coherence
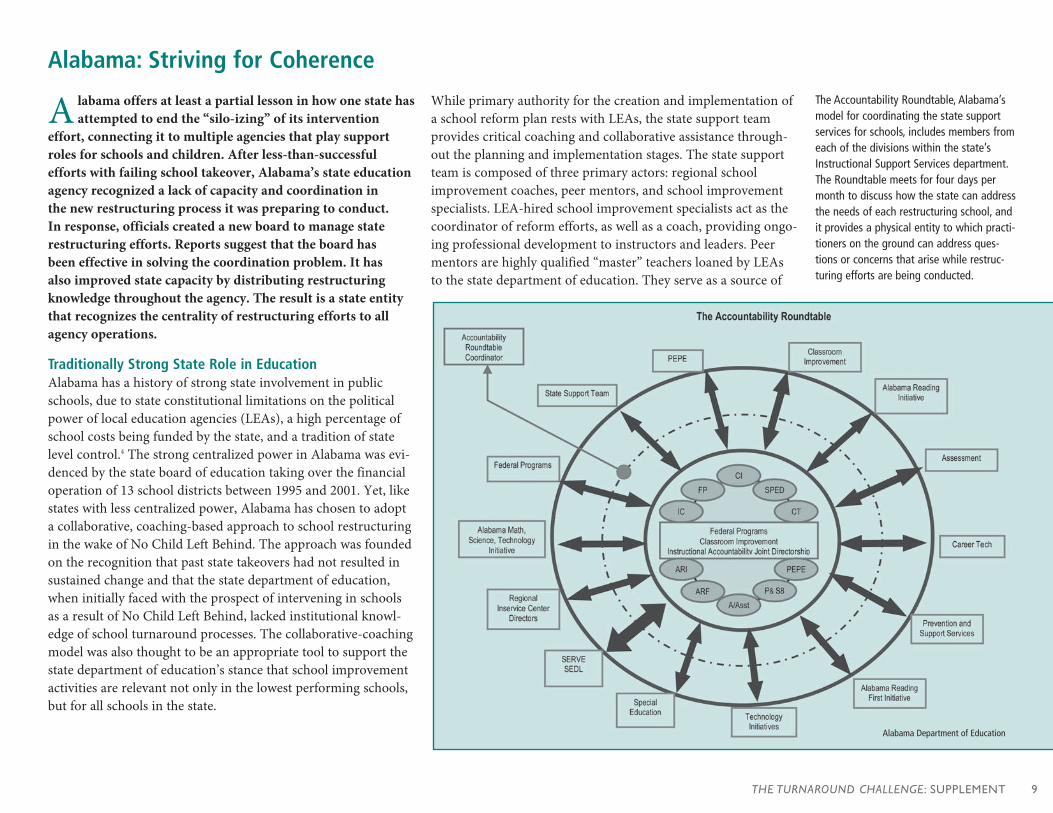
The Accountability Roundtable, Alabama’smodel for coordinating the state supportservices for schools, includes members fromeach of the divisions within the state’sInstructional Support Services department.The Roundtable meets for four days permonth to discuss how the state can addressthe needs of each restructuring school, andit provides a physical entity to which practi-tioners on the ground can address ques-tions or concerns that arise while restruc-turing efforts are being conducted.
Alabama Department of Education
©2007 MASS INSIGHT10
intensive instructional capacity building, and serve under thedirection of the state board and the school improvement special-ists. Regional school improvement coaches work with districtscontaining under-performing schools in one of Alabama’s 11 in-service regions to both help LEAs identify necessary reforminterventions in each under-performing school and create anintervention plan. These regional support coaches serve asliaisons between LEAs and the state education agency by report-ing the needs of an individual school or LEA to theAccountability Roundtable, the state body responsible for coor-dinating support services.
The Accountability RoundtableIn response to the looming need to intervene in schools creat-ed by No Child Left Behind and the lack of institutionalknowledge about school improvement and turnaroundprocesses at the state level, the Alabama Department ofEducation established the Accountability Roundtable (ART) inJuly 2005. The panel consists of one member from each of thedivisions within the state’s Instructional Support Servicesdepartment,5 as well as representatives from the stateDepartment of Education’s Career and Technical Services andTechnology Initiatives divisions. The stated purpose of theRoundtable is to provide seamless coordination of supportservices for restructuring schools at the state level.
The Roundtable currently meets four days per month to reviewinformation on school turnaround efforts provided by theregional school improvement coaches operating throughoutthe state. At these meetings, roundtable members discuss howeach Instructional Support division may address the identifiedneeds of a particular school or district. Individual Roundtablemembers then work with the regional school improvementcoaches to ensure that appropriate technical assistance andother state services arrive at the school level. In this way, theRoundtable acts as a single conduit of school improvement
services and strategy, ensuring that all state-level schoolimprovement efforts are coordinated.
While the Roundtable’s key function is coordination of stateservices in response to defined local need, the Alabama experi-ence suggests that the Roundtable is also valuable as a way tobuild capacity within the state department of education and fos-ter a culture focused on school improvement and restructuringat the state level. During the Roundtable’s first year, the panelmet twice weekly to define the operational structure of statereform efforts, as well as build its internal capacity to assistrestructuring schools. Roundtable members also acted as region-al school improvement coaches during the first year of planimplementation. This experience provided members with anappreciation of how school improvement and restructuringoperate at the local level. The knowledge gained through thisexperience was then utilized in the training Roundtable mem-bers conducted for the regional school improvement coacheswho replaced them.
State officials point to other ancillary benefits of the Roundtable.The familiarity with restructuring gained by state officials helpsfocus divisional tasks on support of the lowest performingschools. Officials report that Roundtable members incorporatetheir experience on the panel into their everyday work, continu-ously considering how the actions of their division will impactreform efforts on the ground. A reverse accountability loop hasalso formed. LEAs that receive conflicting information fromstate officials have begun to report such conflicts to the ART,holding state officials accountable for coordination amongdepartments and personnel. Such reverse accountability helpscreate a more efficient restructuring process.
Alabama continued
Like states with less cen-tralized power, Alabamahas chosen to adopt acollaborative, coaching-based approach toschool restructuring inthe wake of No ChildLeft Behind.
THE TURNAROUND CHALLENGE: SUPPLEMENT 11
A rizona’s effort to centralize power over restructuringefforts at the state level recognizes that without a state-
based incentive structure, meaningful local reform is unlikely.The Arizona approach also recognizes that effective localefforts should not be disturbed. The result is a system ofincentives designed to guarantee good-faith restructuringefforts at the local level, while ensuring that a lack of compli-ance will incite significant state intervention.
Strengthening State ControlArizona has a three-tiered approach to state intervention inschools. To facilitate interventions, each school is placed in oneof three categories: Prevention, School Improvement Assistance,or School Improvement Intervention. Schools are placed in thesecategories based on a combination of their performance in theArizona state accountability system (Arizona LEARNS), theiradequate yearly progress (AYP) status under No Child LeftBehind, and feedback from state review teams in the field.Schools in Prevention status are the highest achieving schoolsand are provided with technical assistance, as well as focused
support should they fail to meet AYP for the first time. Schoolsin the School Improvement Assistance tier receive capacity-building services from the state department of education as theyplan for improvement and are subject to state monitoring. Thelowest performing schools are subject to School ImprovementIntervention and have their restructuring planning and imple-mentation managed by the Arizona Department of Education.
Amendments to Arizona LEARNS identify the requirementsplaced upon the state to intervene in these lowest performingschools.6 Under the state accountability system, schools deemed“under-performing” for three years may be classified as schools
“failing to meet academic standards.” Their classification is notautomatic. It is dependent upon input from state-assignedreview teams. Schools classified as “failing to meet academicstandards” are subject to School Improvement Intervention. The
Arizona: Local Efforts, State Leverage
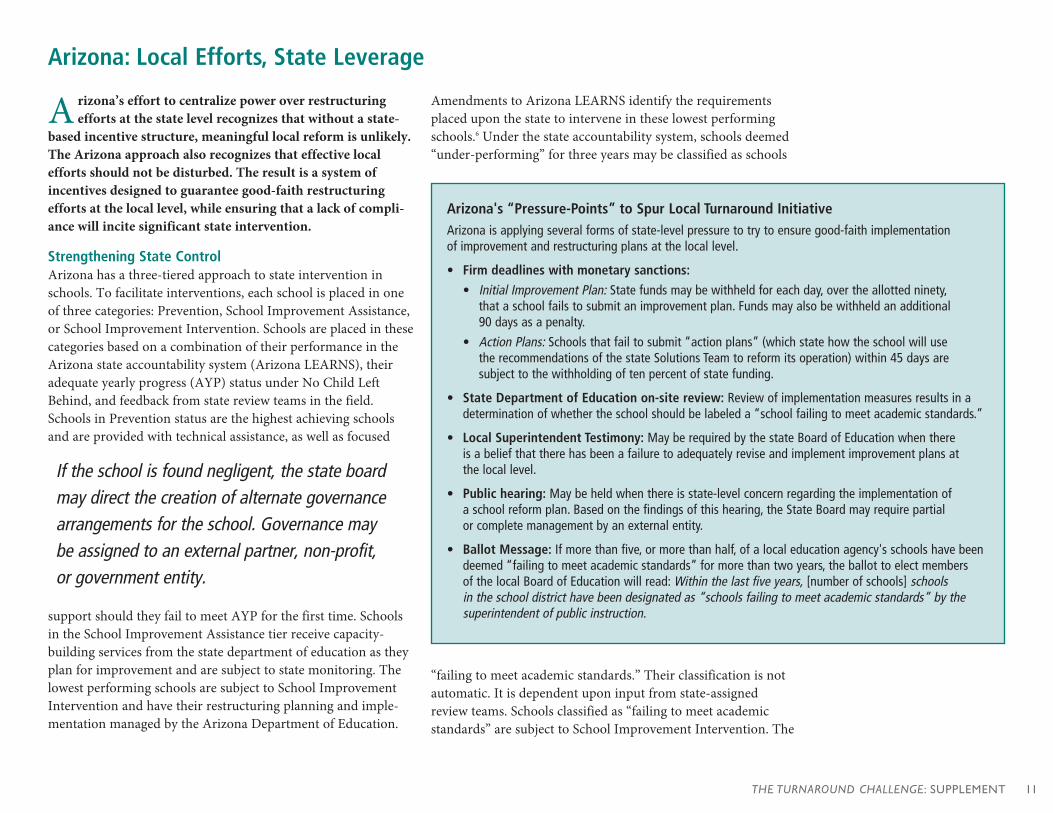
If the school is found negligent, the state boardmay direct the creation of alternate governancearrangements for the school. Governance maybe assigned to an external partner, non-profit,or government entity.
Arizona's “Pressure-Points” to Spur Local Turnaround InitiativeArizona is applying several forms of state-level pressure to try to ensure good-faith implementation of improvement and restructuring plans at the local level.
• Firm deadlines with monetary sanctions:
• Initial Improvement Plan: State funds may be withheld for each day, over the allotted ninety,that a school fails to submit an improvement plan. Funds may also be withheld an additional 90 days as a penalty.
• Action Plans: Schools that fail to submit “action plans” (which state how the school will use the recommendations of the state Solutions Team to reform its operation) within 45 days are subject to the withholding of ten percent of state funding.
• State Department of Education on-site review: Review of implementation measures results in adetermination of whether the school should be labeled a “school failing to meet academic standards.”
• Local Superintendent Testimony: May be required by the state Board of Education when there is a belief that there has been a failure to adequately revise and implement improvement plans at the local level.
• Public hearing: May be held when there is state-level concern regarding the implementation of a school reform plan. Based on the findings of this hearing, the State Board may require partial or complete management by an external entity.
• Ballot Message: If more than five, or more than half, of a local education agency's schools have beendeemed “failing to meet academic standards” for more than two years, the ballot to elect members of the local Board of Education will read: Within the last five years, [number of schools] schools in the school district have been designated as “schools failing to meet academic standards” by thesuperintendent of public instruction.
©2007 MASS INSIGHT12
state also has the option of intervening in any other school uponagreement with the local board of education.
Additional amendments to Arizona LEARNS have provided thestate board of education even more extensive powers to restruc-ture schools by empowering the board to request and hold a pub-lic hearing to determine whether any school in improvement sta-tus has been negligent in implementing its school improvementplan. If the school is found negligent, the state board may directthe creation of alternate governance arrangements for the school.Governance may be assigned to an external partner, non-profit,or government entity. The state also gained increased power overthe contents of school improvement plans constructed whileschools are in the “under-performing” category. The current stateeducation administration will reportedly request further expan-sion of their power to influence school restructuring. This pro-
posed expansion would provide state officials the authority towithhold funding from school districts that “deliberately andsubstantially” ignore state education laws and shift accountabilityfor the reform of under-performing schools from the buildingadministrator to members of the local school board.7
Arizona’s “Solutions Teams”Three-person units comprised of a master teacher, fiscal analyst,and a curriculum expert, all of whom have met the requirementsof the state to be deemed Arizona Academic StandardsTechnicians,8 work in schools subject to School Improvement
Intervention. These “solutions teams” visit schools in both theSchool Improvement Assistance and School ImprovementIntervention tiers. In School Improvement Assistance schools,the team assists with creation and implementation of a schoolimprovement plan.9 Should the school again fail to meet stateand federal standards the following year, the solutions teamreviews the school’s actions before again implementing theimprovement plan. The solutions team may recommend that theschool be provided one last opportunity to make progress, orthat it be labeled “failing to meet academic standards.”
Should the school be designated “failing to meet academic stan-dards,” the solutions team conducts on-site, data-based inquiries.They attempt to identify existing school deficiencies, evaluatewhether structures and conditions are in place to support imple-mentation of a successful restructuring plan, and considerwhether the state can provide any other assistance to further thereform effort. The solutions team makes recommendationsregarding the school restructuring plan that are generally adopt-ed by state officials. The Arizona Department of Education thenassigns a school improvement coach to coordinate and overseeschool restructuring. The school is also eligible to receive up to$60,000 to implement the restructuring plan. The schoolimprovement coach consults with the solutions team and imple-ments their recommendations at the school. Schools that fail toimprove their accountability designation face increasingly severeinterventions, including removal of school leaders and faculty.
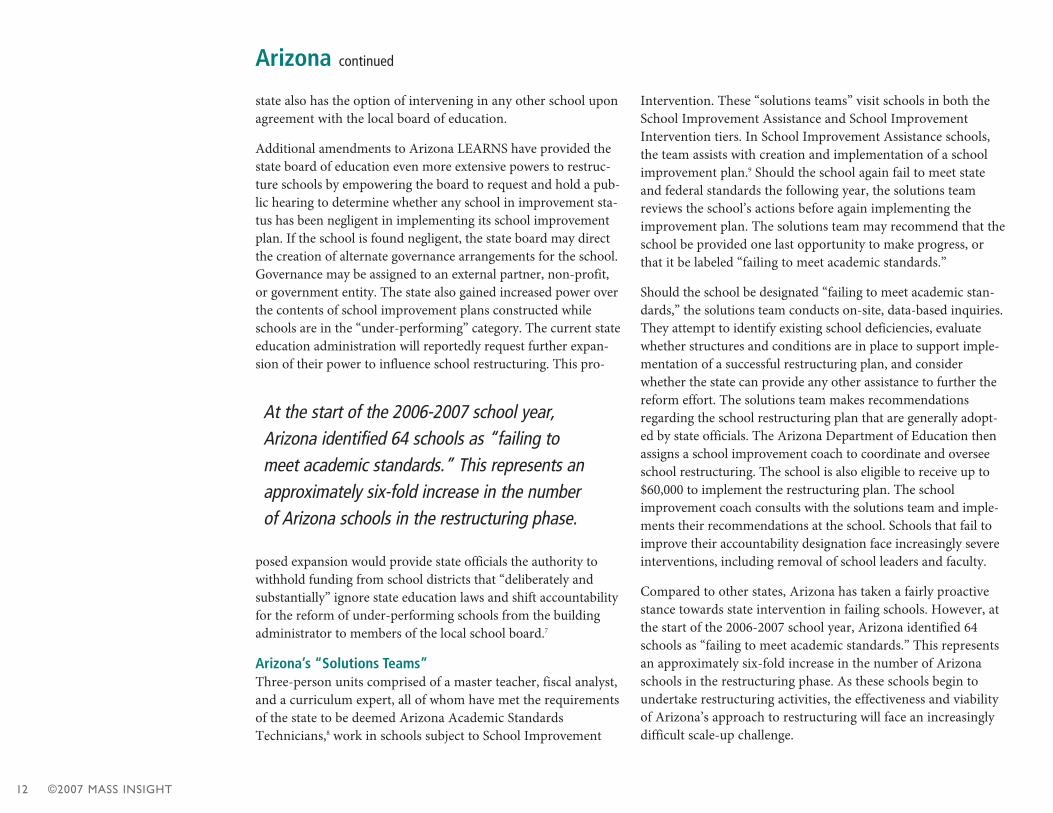
Compared to other states, Arizona has taken a fairly proactivestance towards state intervention in failing schools. However, atthe start of the 2006-2007 school year, Arizona identified 64schools as “failing to meet academic standards.” This representsan approximately six-fold increase in the number of Arizonaschools in the restructuring phase. As these schools begin toundertake restructuring activities, the effectiveness and viabilityof Arizona’s approach to restructuring will face an increasinglydifficult scale-up challenge.
Arizona continued
At the start of the 2006-2007 school year,Arizona identified 64 schools as “failing to meet academic standards.” This represents an approximately six-fold increase in the number of Arizona schools in the restructuring phase.
THE TURNAROUND CHALLENGE: SUPPLEMENT 13
C alifornia, which in 1999 enacted a system of significantstate intervention in chronically under-performing
schools, was forced to abandon this system in the wake of NoChild Left Behind due to severe capacity concerns. Whereasthe pre-No Child Left Behind system isolated the schools mostin need of dramatic reform, the scaling up necessitated by NoChild Left Behind caused these efforts to be de-emphasized.While the result has been nearly total reliance on local officialsto conduct restructuring and little central oversight, the statecontinues to make efforts to intervene both financially andwith support services in the neediest schools.
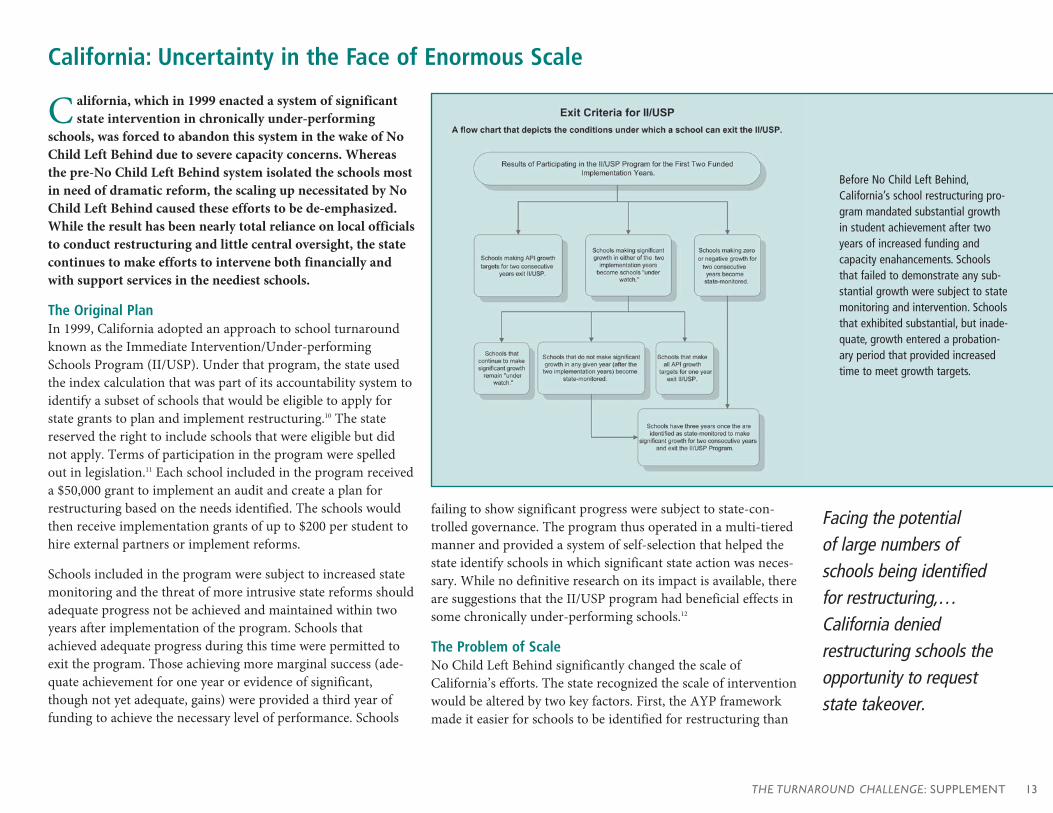
The Original PlanIn 1999, California adopted an approach to school turnaroundknown as the Immediate Intervention/Under-performingSchools Program (II/USP). Under that program, the state usedthe index calculation that was part of its accountability system toidentify a subset of schools that would be eligible to apply forstate grants to plan and implement restructuring.10 The statereserved the right to include schools that were eligible but didnot apply. Terms of participation in the program were spelledout in legislation.11 Each school included in the program receiveda $50,000 grant to implement an audit and create a plan forrestructuring based on the needs identified. The schools wouldthen receive implementation grants of up to $200 per student tohire external partners or implement reforms.
Schools included in the program were subject to increased statemonitoring and the threat of more intrusive state reforms shouldadequate progress not be achieved and maintained within twoyears after implementation of the program. Schools thatachieved adequate progress during this time were permitted toexit the program. Those achieving more marginal success (ade-quate achievement for one year or evidence of significant,though not yet adequate, gains) were provided a third year offunding to achieve the necessary level of performance. Schools
failing to show significant progress were subject to state-con-trolled governance. The program thus operated in a multi-tieredmanner and provided a system of self-selection that helped thestate identify schools in which significant state action was neces-sary. While no definitive research on its impact is available, thereare suggestions that the II/USP program had beneficial effects insome chronically under-performing schools.12
The Problem of ScaleNo Child Left Behind significantly changed the scale ofCalifornia’s efforts. The state recognized the scale of interventionwould be altered by two key factors. First, the AYP frameworkmade it easier for schools to be identified for restructuring than
California: Uncertainty in the Face of Enormous Scale
Before No Child Left Behind,California’s school restructuring pro-gram mandated substantial growthin student achievement after twoyears of increased funding andcapacity enahancements. Schoolsthat failed to demonstrate any sub-stantial growth were subject to statemonitoring and intervention. Schoolsthat exhibited substantial, but inade-quate, growth entered a probation-ary period that provided increasedtime to meet growth targets.
Facing the potential of large numbers ofschools being identifiedfor restructuring,…California denied restructuring schools theopportunity to requeststate takeover.
©2007 MASS INSIGHT14
it had been under the II/USP program. Second, the II/USP pro-gram had built-in mechanisms to cap and control the number ofschools that could participate, while No Child Left Behind con-tained no such controls. Facing the potential of large numbers ofschools being identified for restructuring in the years followingNo Child Left Behind’s implementation, California deniedrestructuring schools the opportunity to request state takeoverand chose not to incorporate the II/USP program into its NoChild Left Behind accountability plan.
The anticipated scale problems have become a reality inCalifornia. The state has experienced dramatic growth in thenumber of schools planning or implementing restructuringunder No Child Left Behind. During the 2005-2006 school year,401 California schools were in either the planning or implemen-tation stages of restructuring. Entering the 2006-2007 schoolyear, this number jumped about 75 percent, to 701 schools.13
With a substantial increase in annual measurable objectives (thecut points determining what constitutes adequate progressunder No Child Left Behind) built into California’s accountabili-ty system next year, this growth is likely to continue.
In response to the challenges of scale, California has changedcourse dramatically, adopting an approach to restructuring thatfocuses heavily on local control of school turnaround efforts. Infact, California does not require state approval of restructuringplans and provides technical assistance to local education
agencies only regarding the procedural considerations of devis-ing a restructuring plan. Thus, the state does not provide inputon or retain control over the content of the restructuring plan.
Recognizing the struggles of the state’s lowest performingschools and local education agencies to enact meaningful turn-around plans, California established two programs more recent-ly that will increase assistance to a select group of schools anddistricts. As part of the settlement of a school funding lawsuit,500 of the lowest performing schools in the state will be provid-ed a share of a $2.9 billion fund the state has agreed to supply ascompensation for past under-funding of education. A list ofapproximately 1,500 schools will be eligible to apply for inclu-sion in the program. The decision to limit the receiving schoolsto 500 was made to ensure that the funds would have significantimpact in at least a subset of schools. The schools selected willreceive grants over a seven-year period, according to the follow-ing formula: annual payments of $500 per pupil from kinder-garten through grade 3; $900 from grades 4 through 8, and$1,000 for grades 9 through 12. A second program, funded by a$15.5 million grant from the Bill & Melinda Gates Foundation,will provide 15 local education agencies with intervention teamsto undertake restructuring efforts in their schools. The purposeof this program is to increase local education agency capacity toeffectively turn around their lowest performing schools.
While California appears to be seeking creative ways to funneladditional resources to its most challenged local education agen-cies and schools, it is important to note that state officials havenot been able to apply such programs across the board due toincreasing capacity concerns. Indeed, such capacity and scaleconcerns have essentially dictated the adoption of the somewhatwatered-down approach to school restructuring that Californiahas implemented.
California continued
During the 2005-2006 school year, 401California schools were in either the planning orimplementation stages of restructuring. Enteringthe 2006-2007 school year, this number jumpedabout 75 percent, to 701 schools.
THE TURNAROUND CHALLENGE: SUPPLEMENT 15
C oncerned with the pace and intensity of reforms at thelocal level, Florida state education officials decided to
take aggressive action to guarantee more proactive restructur-ing in the state’s lowest-performing schools. Since the statehad already publicly dismissed state takeover as an option, itwas forced to develop creative ways to pressure LEAs. Intensepressure from the State Department of Education combinedwith publicity and symbolic financial sanctions are now actingas a catalyst to incite personnel and conditions change in theseschools.
SWAT Teams for Failing Schools The Florida Department of Education assigns each school in thestate a grade from “A” to “F”14 as part of its A+ Plan forEducation accountability system. School grades are the fulcrumfor a system of rewards and sanctions. Schools that receive an Agrade or whose grade improves significantly earn both financialrewards (up to $100 per student) and public recognition. Schoolsreceiving grades of D or F and schools that failed to make AYPmust develop school improvement plans and undertake othermandated actions outlined on a grade-based differentiatedschool improvement rubric.15 Schools categorized by Florida’ssystem are simultaneously subject to the requirements of NoChild Left Behind, including requirements for offering publicschool choice and supplemental education services.
Assistance Plus, Florida’s program for improving under-per-forming schools, provides technical assistance, capacity buildingmeasures, and increased funding to the lowest performingschools in the state (those receiving Ds or Fs). Technical assis-tance and capacity building are provided by School-wideAssistance Teams (SWAT), full-time school improvementliaisons, reading coaches, and formative assessment tools. TheSWAT teams are composed of state-approved “high perform-ing” educators who provide coaching, leadership development,and other school-level strategic interventions focused on
improving the instructional and leadership capacity of teachersand school administrators. Like coaching programs in manystates, the SWAT program’s goal is to establish links betweenthe state’s most effective instructors and its highest-needschools. Low-performing schools in Florida are also provided
Florida: Pressuring Districts for More Proactive Turnaround
Schools that receive repeated F grades are subject to a state-imposed action plan that lists 26 school reform measures that must beundertaken by the LEA. Included in these statemandates are requirements that all instructionalstaff re-apply for their jobs.
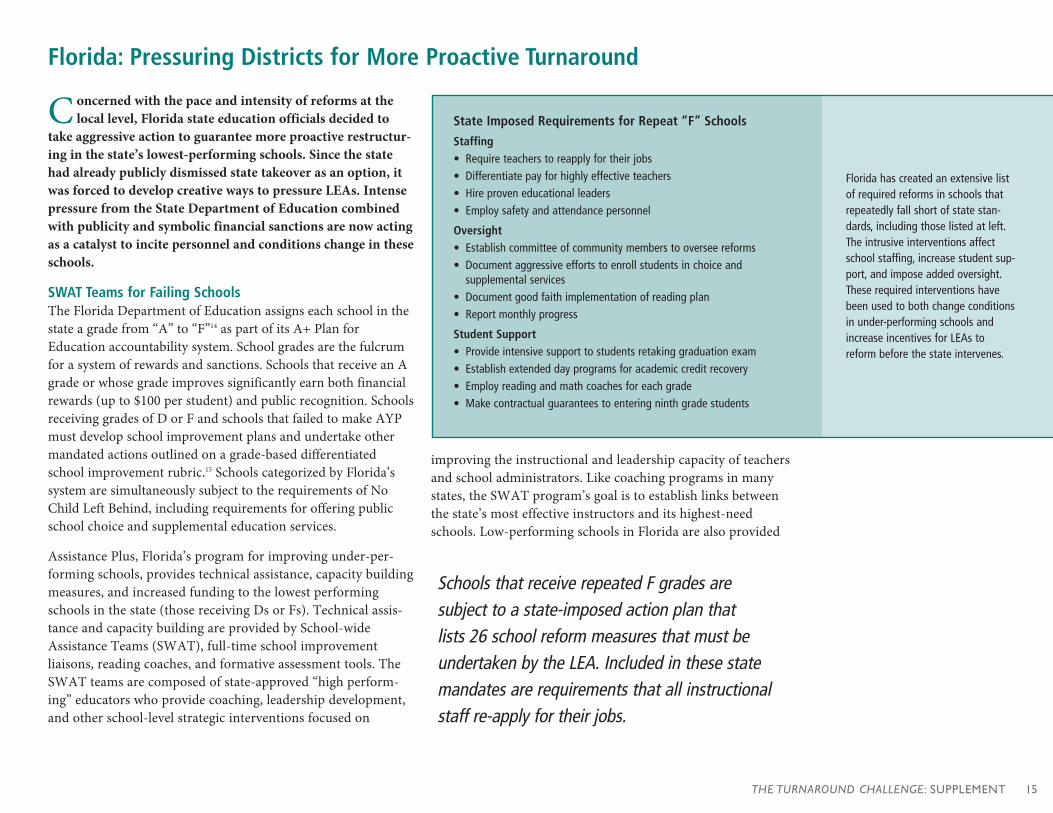
Florida has created an extensive listof required reforms in schools thatrepeatedly fall short of state stan-dards, including those listed at left.The intrusive interventions affectschool staffing, increase student sup-port, and impose added oversight.These required interventions havebeen used to both change conditionsin under-performing schools andincrease incentives for LEAs toreform before the state intervenes.
State Imposed Requirements for Repeat “F” Schools
Staffing • Require teachers to reapply for their jobs • Differentiate pay for highly effective teachers• Hire proven educational leaders • Employ safety and attendance personnel
Oversight • Establish committee of community members to oversee reforms• Document aggressive efforts to enroll students in choice and
supplemental services• Document good faith implementation of reading plan• Report monthly progress
Student Support • Provide intensive support to students retaking graduation exam• Establish extended day programs for academic credit recovery • Employ reading and math coaches for each grade• Make contractual guarantees to entering ninth grade students
©2007 MASS INSIGHT16
with a school improvement liaison and are eligible to receiveincreased funding as part of their participation in AssistancePlus, with the state providing $1,000 per student to helpincrease fiscal capacity at the school level.
26 Requirements for ChangeWhile Florida’s structure for intervening in under-performingschools is similar to that of other states, it is the bold action thestate has taken to change conditions and personnel in chronical-ly under-performing schools that makes the state’s approachunique. Schools that receive repeated F grades are subject to astate-imposed action plan that lists 26 school reform measures
that must be undertaken by the LEA.16 Included in these statemandates are requirements that all instructional staff re-applyfor their jobs; that the LEA provide professional developmentopportunities; and that the LEA implement differentiated andperformance-based pay. In addition, the LEA must supply read-ing and math coaches, assure that high performing teachers areteaching the lowest performing students, draft explicit contractswith parents indicating how student achievement will beimproved, and hire school leaders who have proven that theycan turn around schools (by having brought a D or F school toan A or B grade) to run the failing school.
The state reform mandates also require that these schools beassigned a Community Assessment Team charged with recom-mending school-specific reform measures.17 This team is com-
posed of a department representative, parents, business repre-sentatives, educators, representatives of local governments, andcommunity activists. The Community Assessment Team reviewsthree years of data from the school and makes recommendationsto the state board of education outlining specific reform meas-ures it deems necessary for effective school turnaround to occur.The failing school is required to implement these reforms. Theteam continuously monitors the school’s performance for signsof improvement and reports monthly to the state department ofeducation concerning the school’s progress.
To date, the state board of education has taken action againstseven LEAs housing schools identified as repeat, or chronic, “F”schools.18 The state board defined compliance as full implemen-tation of all 26 mandates, and during the 2006-2007 school yearit took bold action when it grew frustrated with a lack of compli-ance.19 The state first increased its presence in the schools bysending in state review teams every two weeks to monitorreform activities and file progress reports. The board threatenedto withhold discretionary funding and superintendent pay fromthe non-compliant LEAs. When two LEAs resisted, the statereduced monthly assistance by an amount equal to the superin-tendent’s salary.20
While the withholding of funds in this instance was largely sym-bolic, the threat of withholding more and the attention generat-ed by the action resulted in increased compliance and, eventual-ly, negotiated compromises between the state and LEAs. Theapproach appears to have been effective, particularly in light ofthe state’s clear stance that it would not take over schools. Thesteps taken by state officials re-established an incentive for com-pliance in a manner unique among the states we studied. Suchan approach might serve as a model for using the threat of mon-etary sanctions instead of governance change to elicit serioussteps toward reform at the local level.
Florida continued
The board threatened to withhold discretionaryfunding and superintendent pay from the non-compliant LEAs. When two LEAs resisted, thestate reduced monthly assistance by an amountequal to the superintendent’s salary.

THE TURNAROUND CHALLENGE: SUPPLEMENT 17
I n Hawaii, ambitious state learning standards and a challeng-ing student population have contributed to an extremely
high rate of schools identified for restructuring. This has creat-ed added pressure in a state with few local governance struc-tures as a result of its statewide, single-district system. Theseunique pressures have resulted in a strategy to rely solely onoutside providers that, as in other states, is now in jeopardybecause of the number of schools in the accountability pipeline.
Unique Circumstances, Unique ApproachHawaii has been plagued by large numbers of schools failing tomake Adequate Yearly Progress under No Child Left Behind. In2005, 66 percent of Hawaii’s schools failed to make AYP. Hawaiiis also the state with the highest rate of schools entering restruc-turing under No Child Left Behind, with 24 of the state’s approxi-mately 280 schools (8.5 percent) identified for restructuring dur-ing the 2005-2006 school year, and 53 (18.9 percent) in 2006-2007.21 Some studies attributed these high failure rates to Hawaii’sachievement standards, which are among the most rigorous in thenation. Other theories suggested that Hawaii’s large immigrantpopulation translates into an increased number of limited-Englishproficient subgroups failing to make AYP. The massive issue ofscale facing school reform in Hawaii is compounded by Hawaii’sunique statewide system structure. This school governance systemplaces increased pressure on the state department of education totake an active role in school improvement and restructuring.
The Hawaii Board of Education responded to the capacity con-cerns raised by these unique circumstances by approving con-tracts with three private entities: Edison Alliance, ETS Pulliam,and the National Center on Education and the Economy (and itsAmerica’s Choice program) in May 2005. The contracts estab-lished that these organizations would act as the assistanceproviders (without total governance authority) for particularschools that had been identified for restructuring. These agree-ments represented a state commitment of approximately $7.9million to restructure 20 under-performing schools during the
Hawaii: Experimenting with Outside Providers
[Excerpt from Hawaii’s plan for school intervention]
©2007 MASS INSIGHT18
2005-2006 school year.22 Both the NCEE/America’s Choice andEdison Alliance contracts contained seven schools, while theETS Pulliam contract included six. The number of schools even-tually increased to 24, though education officials indicated thatthe cost of the contracts increased only slightly due to the inclu-
sion of significant startup and relocation costs included in theoriginal contracts. Entering the 2006-2007 school year, the num-ber of schools requiring restructuring rose to 53, and the stateanticipated paying upwards of $15 million to the private entitiesto provide similar services to the newly identified schools.
Concerns Over ImplementationSeveral complicating factors – some unique to the state – haveimpacted Hawaii’s restructuring strategy. The use of the outside
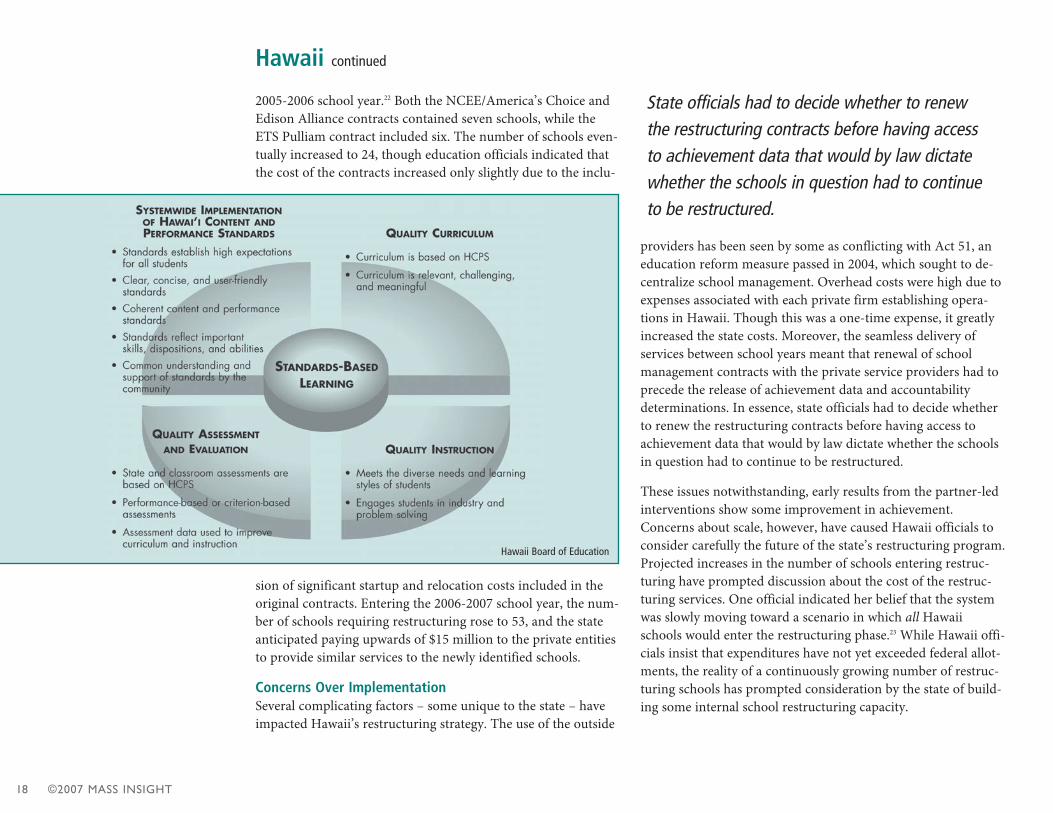
providers has been seen by some as conflicting with Act 51, aneducation reform measure passed in 2004, which sought to de-centralize school management. Overhead costs were high due toexpenses associated with each private firm establishing opera-tions in Hawaii. Though this was a one-time expense, it greatlyincreased the state costs. Moreover, the seamless delivery ofservices between school years meant that renewal of schoolmanagement contracts with the private service providers had toprecede the release of achievement data and accountabilitydeterminations. In essence, state officials had to decide whetherto renew the restructuring contracts before having access toachievement data that would by law dictate whether the schoolsin question had to continue to be restructured.
These issues notwithstanding, early results from the partner-ledinterventions show some improvement in achievement.Concerns about scale, however, have caused Hawaii officials toconsider carefully the future of the state’s restructuring program.Projected increases in the number of schools entering restruc-turing have prompted discussion about the cost of the restruc-turing services. One official indicated her belief that the systemwas slowly moving toward a scenario in which all Hawaiischools would enter the restructuring phase.23 While Hawaii offi-cials insist that expenditures have not yet exceeded federal allot-ments, the reality of a continuously growing number of restruc-turing schools has prompted consideration by the state of build-ing some internal school restructuring capacity.
Hawaii continued
State officials had to decide whether to renewthe restructuring contracts before having accessto achievement data that would by law dictatewhether the schools in question had to continueto be restructured.
Hawaii Board of Education

THE TURNAROUND CHALLENGE: SUPPLEMENT 19
M aryland, which has chosen an aggressive, highly targetedturnaround strategy, has been handcuffed by political
and legal opposition to its closely-watched intervention inBaltimore’s public schools. Maryland’s experience suggeststhat a state education agency’s will to conduct comprehensiveturnaround is not enough. Political will must reach a certaincritical mass for the reform effort to endure and thrive.
An Activist ApproachIn 1993, Maryland established a school accountability systemthat included a two-tiered school reconstitution framework.24
Under the plan, schools that consistently underperformed onstate assessments would be placed on the state’s “watch list.”These schools would also become eligible for reconstitution. The system called for local school boards to take over gover-nance of the school during the first tier of the reconstitutionprocess.25 The plan also allowed the state to take over schoolsthat failed to respond to local interventions.
Though forward thinking in adopting state takeover policies, itwas not until 2000 that the state acted to take over schools underthe plan. It took over governance of three chronically under-per-forming elementary schools in Baltimore. Rather than reconsti-tute the schools, the state board opted to contract their manage-ment out to an external partner, Edison Schools, beginning inJuly of that year. While Edison continues to manage the schools,the state’s takeover actions have encountered a fair amount ofpolitical and legal wrangling.
The Baltimore Teachers Union challenged the state board’sauthority to take over schools, seemingly as a means of protectingmembers’ jobs in the affected schools. Ultimately, the MarylandCourt of Appeals ruled that the state board of education may nothave had the authority to enact the regulations that establishedstate takeover power, but subsequent action by the state legisla-
ture retroactively approved such authority. In addition to legalchallenges to state authority to take over schools, the efficacy ofhiring a private, for-profit contractor to run the schools in ques-tion has been hotly debated. The academic outcomes of theschools have been followed closely, and while the results havebeen subject to conflicting interpretations, they appear positiverelative to district performance in the same time period. The cost-efficiency of using Edison has also been part of the public debate.One study found that using Edison was significantly more expen-sive than if a government agency continued to provide the serv-ice.26 Criticism of the contract was based on Edison’s profit, thehigh rate spending on administration, and other factors that, inthe eyes of the authors, deserved further exploration.
Maryland: Caught in Political Cross-fire
When the state legislature moved to pass legislation delaying any potential statetakeovers for one year,… state officials arguedthat No Child Left Behind essentially requiredsuch efforts by the state.
Maryland State Department of Education
©2007 MASS INSIGHT20
Pressure to Weaken State PolicyMaryland was able to enact the school restructuring provisionsof No Child Left Behind rather seamlessly because the law’s pro-visions were closely aligned with its own system. State educationofficials essentially maintained the same approach as had beenadopted in the 1990s, but adopted a new assessment system andused the AYP formula to determine when schools should beplaced on watch and subsequently restructured. Marylandreserved the right, as it had done in the past, to intervene inschools that failed to make progress after local restructuringefforts had been adopted.
Maryland currently has 79 schools in restructuring. The state provides eight choices for local approaches to school restructuring:
Employ a private management company to govern the school Convert to a charter schoolConvert to a quasi-charter schoolReplace school staffDistrict takeoverReopen as a “school of choice” Implement an external reform model, or Employ a turnaround specialist to provide input on schoolreform and governance.27
Nearly three-quarters of Maryland’s restructuring schools havechosen to hire a turnaround specialist (46 of 63 schools thathave adopted new governance procedures have chosen thisoption). A majority of the remaining schools have adopted a“zero-basing” approach that requires all school staff to re-applyfor their positions. Again, both of these approaches have beenmet with controversy. Critics suggest that the turnaround spe-cialist approach has been rendered ineffective by implementa-tion at the local level: a lack of authority that has resulted in thespecialists acting more like part-time consultants than a new,shared-governance structure.28 The state has acknowledged itsdiscontent with such implementation. The effectiveness of“zero-basing” as the sole turnaround strategy has also beenquestioned.29 Criticism of both approaches has centered in parton the lack of comprehensiveness in their design and execution.
In light of these local restructuring difficulties, state educationofficials have maintained that state-level takeovers have beenmore effective and sought to take over 11 more schools in early2006. When the state legislature moved to pass legislationdelaying any potential state takeovers for one year (a movedesigned to provide time to search for other approaches), stateofficials argued that No Child Left Behind essentially requiredsuch efforts by the state. In fact, the U.S. Department ofEducation sent a warning letter suggesting that such an actionby the state legislature would contradict the requirements ofNo Child Left Behind and could result in loss of federal fund-ing. Ultimately, the legislature did pass legislation preventingthe state from taking over the additional schools.30 The resulthas been an increased emphasis on restructuring at the locallevel, where the approaches taken have been less dramatic thanthe state would like.
ss
ss
ss
ss
Maryland continued
Ultimately, the legislature did pass legislationpreventing the state from taking over the addi-tional schools. The result has been an increasedemphasis on restructuring at the local level,where the approaches taken have been less dramatic than the state would like.

THE TURNAROUND CHALLENGE: SUPPLEMENT 21
M assachusetts, after a history of “light-touch” guidancefor its under-performing schools, began to intervene
more substantially in 2005-2006 in three middle schools.Impatient with the pace and progress of improvement in itslowest-performing schools, the state board of educationpassed new regulations late in 2006 that now require schoolsreaching “Commonwealth Priority” status to meet unambigu-ous criteria in their turnaround plans. The criteria insist, forexample, that principals have “authority to select and assignstaff to positions in the school without regard to seniority.”Massachusetts is also experimenting with a second form ofconditions-change, through a Commonwealth Pilot initiativethat allows restructuring schools to gain extensive authorityover staff, schedule, budget, and program if they can meeteven stiffer criteria for change. Most recently, the state hassought to address the scale issue by identifying and workingdirectly with nine “Commissioner’s Districts” that collectivelyrepresent the majority of all Restructuring and CorrectiveAction schools in the state. These new efforts have no trackrecord yet, but collectively they make the Commonwealth oneof the states worth watching.
Shortening the Review ProcessPrior to the adoption of new regulations, the state had a lengthyreview process for analysis of under-performing schools. (Someobservers believe it remains quite lengthy today.) Schools thatperformed poorly on accountability measures were reviewed by aspecially trained group from the Department of Education. If theschool was deemed to be in need of assistance, it would then be
audited by a state-appointed panel to gather evidence that wouldinform the Commissioner’s determination of whether the schoolwould be labeled “under-performing.” The five-member panelsincluded state officials, education consultants, and school-basedpractitioners. Schools that were in corrective action or restruc-turing were prioritized for such reviews, as were schools that hadpoor (“very low” or “critically low”) performance ratings andexhibited no progress on state assessments.31 The panel’s findingswere the key factor in determining whether a school would bedesignated as chronically under-performing, which would trig-ger more vigorous state intervention.
Once a school was determined to be under-performing, it wasgiven assistance through a state improvement specialist to designa reform plan, along with $25,000 to implement the plan. Theschool would then be given two years to work on the plan andshow significant improvement in student outcomes. If noprogress was seen during this period, the state Commissionercould recommend that the Board of Education deem the school“chronically under-performing.” Such a designation is akin tostate takeover, with the state gaining the right to appoint a prin-cipal and make decisions regarding whether to retain staff andreform the curriculum. The state first took such action with onemiddle school during the 2004-2005 school year – seven yearsafter its first failure to meet AYP.32 It subsequently took actionwith two more middle schools during the 2005-2006 schoolyear.33 The state received some criticism during implementationof the first intervention process for a perceived lack of willingness to take more dramatic action in consistently poor-performing schools.
A New Process, with New RequirementsThe state Board of Education, desiring more expedited state sup-port for under-performing schools, passed new regulations inOctober 2006, which streamlined the state intervention process.34
The expedited services were achieved by eliminating the multiple
Massachusetts: Seeking to Set Standards for Turnaround
Under these regulations, LEAs must provide thebuilding administrator of the CommonwealthPriority School the power to control staffing anda degree of building-level budgetary power.
©2007 MASS INSIGHT22
stages of review that accompanied determinations of school status in the accountability framework. Rather than requiring a panel review and state Board of Education review to designatean “under-performing” school, the new regulations require onlythat a school fail to make AYP in the same subject for four years.Rather than “under-performing” – a label that caused some consternation in the field – these schools will now be called“Commonwealth Priority Schools.” The designation initiates a30-day period during which the superintendent and schoolboard of the LEA must undertake a needs assessment and report
their findings to the state. Local officials are then granted sixmonths to create a reform plan that aims to achieve AYP in thesubject matter in question within two years.
The new regulations spell out specific requirements that must beincluded in the reform plan to satisfy the regulations. (See box.)Under these regulations, LEAs must provide the buildingadministrator of the Commonwealth Priority School the powerto control staffing and a degree of building-level budgetarypower. The school must also be provided with at least two sub-ject–area coaches in reading and mathematics and must haveboth interim assessments and an opportunity for teachers toconsult with one another regarding student progress. Periodicreview of staff is also required. In addition, LEAs are stronglyencouraged to consider using an external management partner
and may consider becoming a charter school. During theschool’s time as a Commonwealth Priority School, it is entitledto priority in terms of state funding, technical assistance, andexternal resources.
The plan is submitted to the state Board of Education, which hasthe power to amend it. The Board then issues an order outliningthe reform that is to take place at the school level. Failure tocomply with the order can result in the withholding of funds ordesignation of the LEA as “chronically under-performing,”which subjects it to state receivership. (The Board had theoption to defer such action while the improvements were beingput in place, and did so on many occasions—granting schools asmany as three extra years before declarations of “chronicallyunder-performing.”) During the reform implementation period,schools can terminate the Commonwealth Priority School desig-nation by making AYP in both reading and mathematics (aslong as they are not in restructuring under NCLB), or byrequest, if they have failed to make AYP but exhibited signifi-cant progress.35 Exit from the program is subject to state Boardof Education approval. If such progress has not been made with-in two years of becoming a Commonwealth Priority School, theBoard has the option to intervene and declare the school chroni-cally under-performing, as it did in the prior scheme, and imple-ment the same state alternative-governance option. (More spe-cific language on this option, which at one point was called“New Beginnings” schools, was removed from the regulationsout of concern that the legislature might view this it as overstep-ping the restructuring authority granted the Board under thestate’s 1993 Education Reform Act.)
The result of the new regulations is an expedited timeframe andreduction in state discretion at the earliest stages of the processfor reforming the state’s lowest performing schools. Thereforms have also provided stronger accountability for LEAs
Massachusetts continued
This option… embraces the need for fundamen-tal changes in operating conditions identified in the main report, including authority over five areas: staff, schedule, budget, curriculum,and governance.
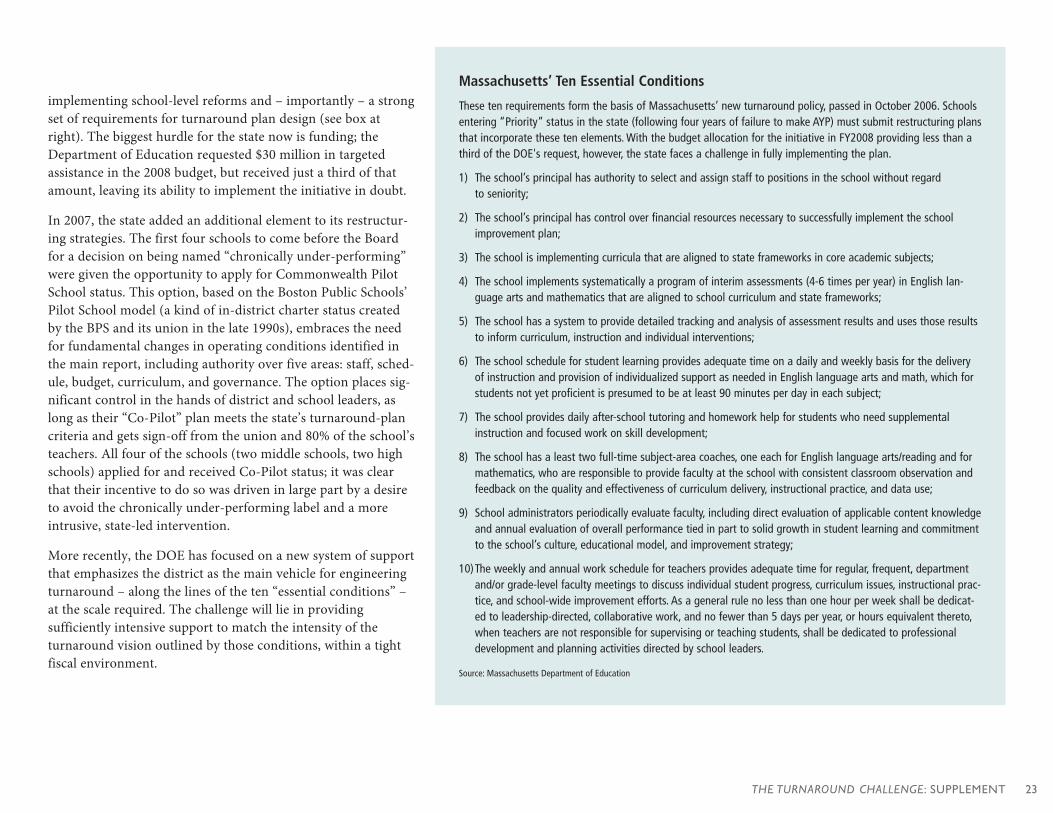
THE TURNAROUND CHALLENGE: SUPPLEMENT 23
implementing school-level reforms and – importantly – a strongset of requirements for turnaround plan design (see box atright). The biggest hurdle for the state now is funding; theDepartment of Education requested $30 million in targetedassistance in the 2008 budget, but received just a third of thatamount, leaving its ability to implement the initiative in doubt.
In 2007, the state added an additional element to its restructur-ing strategies. The first four schools to come before the Boardfor a decision on being named “chronically under-performing”were given the opportunity to apply for Commonwealth PilotSchool status. This option, based on the Boston Public Schools’Pilot School model (a kind of in-district charter status createdby the BPS and its union in the late 1990s), embraces the needfor fundamental changes in operating conditions identified inthe main report, including authority over five areas: staff, sched-ule, budget, curriculum, and governance. The option places sig-nificant control in the hands of district and school leaders, aslong as their “Co-Pilot” plan meets the state’s turnaround-plancriteria and gets sign-off from the union and 80% of the school’steachers. All four of the schools (two middle schools, two highschools) applied for and received Co-Pilot status; it was clearthat their incentive to do so was driven in large part by a desireto avoid the chronically under-performing label and a moreintrusive, state-led intervention.
More recently, the DOE has focused on a new system of supportthat emphasizes the district as the main vehicle for engineeringturnaround – along the lines of the ten “essential conditions” –at the scale required. The challenge will lie in providing sufficiently intensive support to match the intensity of the turnaround vision outlined by those conditions, within a tightfiscal environment.
Massachusetts’ Ten Essential Conditions
These ten requirements form the basis of Massachusetts’ new turnaround policy, passed in October 2006. Schoolsentering “Priority” status in the state (following four years of failure to make AYP) must submit restructuring plansthat incorporate these ten elements. With the budget allocation for the initiative in FY2008 providing less than athird of the DOE's request, however, the state faces a challenge in fully implementing the plan.
1) The school’s principal has authority to select and assign staff to positions in the school without regard to seniority;
2) The school’s principal has control over financial resources necessary to successfully implement the schoolimprovement plan;
3) The school is implementing curricula that are aligned to state frameworks in core academic subjects;
4) The school implements systematically a program of interim assessments (4-6 times per year) in English lan-guage arts and mathematics that are aligned to school curriculum and state frameworks;
5) The school has a system to provide detailed tracking and analysis of assessment results and uses those resultsto inform curriculum, instruction and individual interventions;
6) The school schedule for student learning provides adequate time on a daily and weekly basis for the deliveryof instruction and provision of individualized support as needed in English language arts and math, which forstudents not yet proficient is presumed to be at least 90 minutes per day in each subject;
7) The school provides daily after-school tutoring and homework help for students who need supplementalinstruction and focused work on skill development;
8) The school has a least two full-time subject-area coaches, one each for English language arts/reading and formathematics, who are responsible to provide faculty at the school with consistent classroom observation andfeedback on the quality and effectiveness of curriculum delivery, instructional practice, and data use;
9) School administrators periodically evaluate faculty, including direct evaluation of applicable content knowledgeand annual evaluation of overall performance tied in part to solid growth in student learning and commitmentto the school’s culture, educational model, and improvement strategy;
10)The weekly and annual work schedule for teachers provides adequate time for regular, frequent, departmentand/or grade-level faculty meetings to discuss individual student progress, curriculum issues, instructional prac-tice, and school-wide improvement efforts. As a general rule no less than one hour per week shall be dedicat-ed to leadership-directed, collaborative work, and no fewer than 5 days per year, or hours equivalent thereto,when teachers are not responsible for supervising or teaching students, shall be dedicated to professionaldevelopment and planning activities directed by school leaders.
Source: Massachusetts Department of Education
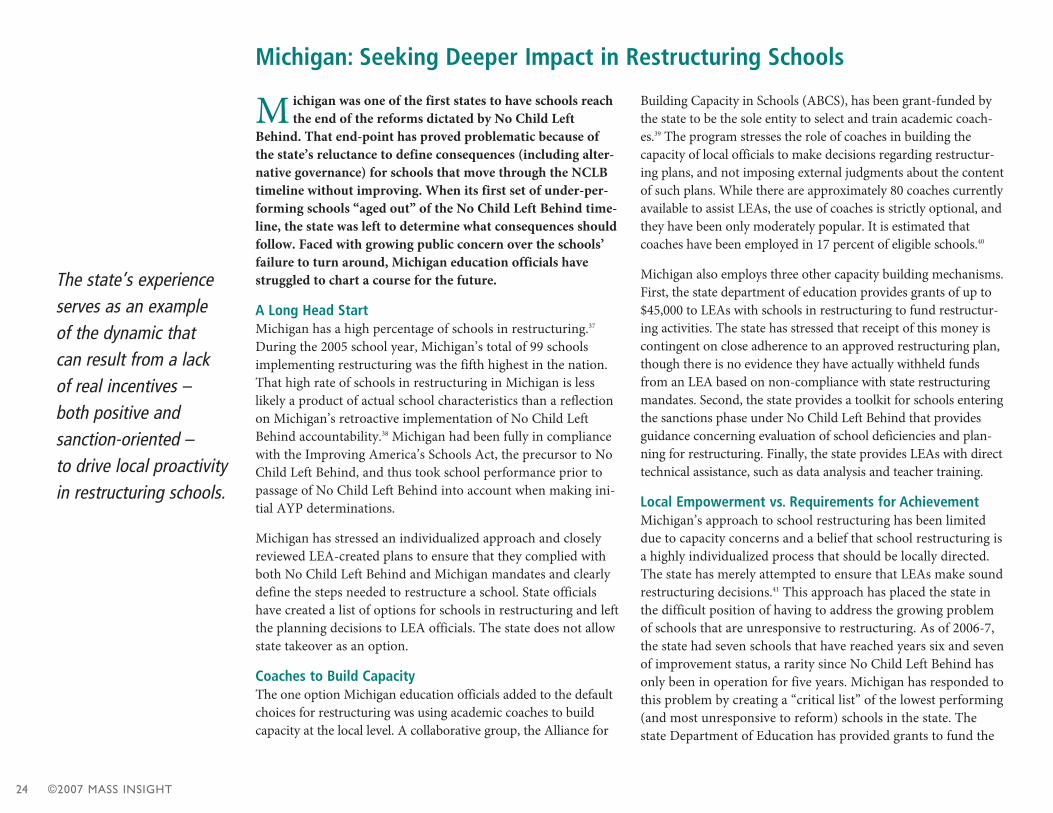
©2007 MASS INSIGHT24
M ichigan was one of the first states to have schools reachthe end of the reforms dictated by No Child Left
Behind. That end-point has proved problematic because ofthe state’s reluctance to define consequences (including alter-native governance) for schools that move through the NCLBtimeline without improving. When its first set of under-per-forming schools “aged out” of the No Child Left Behind time-line, the state was left to determine what consequences shouldfollow. Faced with growing public concern over the schools’failure to turn around, Michigan education officials havestruggled to chart a course for the future.
A Long Head StartMichigan has a high percentage of schools in restructuring.37
During the 2005 school year, Michigan’s total of 99 schoolsimplementing restructuring was the fifth highest in the nation.That high rate of schools in restructuring in Michigan is lesslikely a product of actual school characteristics than a reflectionon Michigan’s retroactive implementation of No Child LeftBehind accountability.38 Michigan had been fully in compliancewith the Improving America’s Schools Act, the precursor to NoChild Left Behind, and thus took school performance prior topassage of No Child Left Behind into account when making ini-tial AYP determinations.
Michigan has stressed an individualized approach and closelyreviewed LEA-created plans to ensure that they complied withboth No Child Left Behind and Michigan mandates and clearlydefine the steps needed to restructure a school. State officialshave created a list of options for schools in restructuring and leftthe planning decisions to LEA officials. The state does not allowstate takeover as an option.
Coaches to Build CapacityThe one option Michigan education officials added to the defaultchoices for restructuring was using academic coaches to buildcapacity at the local level. A collaborative group, the Alliance for
Building Capacity in Schools (ABCS), has been grant-funded bythe state to be the sole entity to select and train academic coach-es.39 The program stresses the role of coaches in building thecapacity of local officials to make decisions regarding restructur-ing plans, and not imposing external judgments about the contentof such plans. While there are approximately 80 coaches currentlyavailable to assist LEAs, the use of coaches is strictly optional, andthey have been only moderately popular. It is estimated thatcoaches have been employed in 17 percent of eligible schools.40
Michigan also employs three other capacity building mechanisms.First, the state department of education provides grants of up to$45,000 to LEAs with schools in restructuring to fund restructur-ing activities. The state has stressed that receipt of this money iscontingent on close adherence to an approved restructuring plan,though there is no evidence they have actually withheld fundsfrom an LEA based on non-compliance with state restructuringmandates. Second, the state provides a toolkit for schools enteringthe sanctions phase under No Child Left Behind that providesguidance concerning evaluation of school deficiencies and plan-ning for restructuring. Finally, the state provides LEAs with directtechnical assistance, such as data analysis and teacher training.
Local Empowerment vs. Requirements for AchievementMichigan’s approach to school restructuring has been limiteddue to capacity concerns and a belief that school restructuring isa highly individualized process that should be locally directed.The state has merely attempted to ensure that LEAs make soundrestructuring decisions.41 This approach has placed the state inthe difficult position of having to address the growing problemof schools that are unresponsive to restructuring. As of 2006-7,the state had seven schools that have reached years six and sevenof improvement status, a rarity since No Child Left Behind hasonly been in operation for five years. Michigan has responded tothis problem by creating a “critical list” of the lowest performing(and most unresponsive to reform) schools in the state. Thestate Department of Education has provided grants to fund the
Michigan: Seeking Deeper Impact in Restructuring Schools
The state’s experienceserves as an example of the dynamic that can result from a lack of real incentives – both positive and sanction-oriented – to drive local proactivityin restructuring schools.
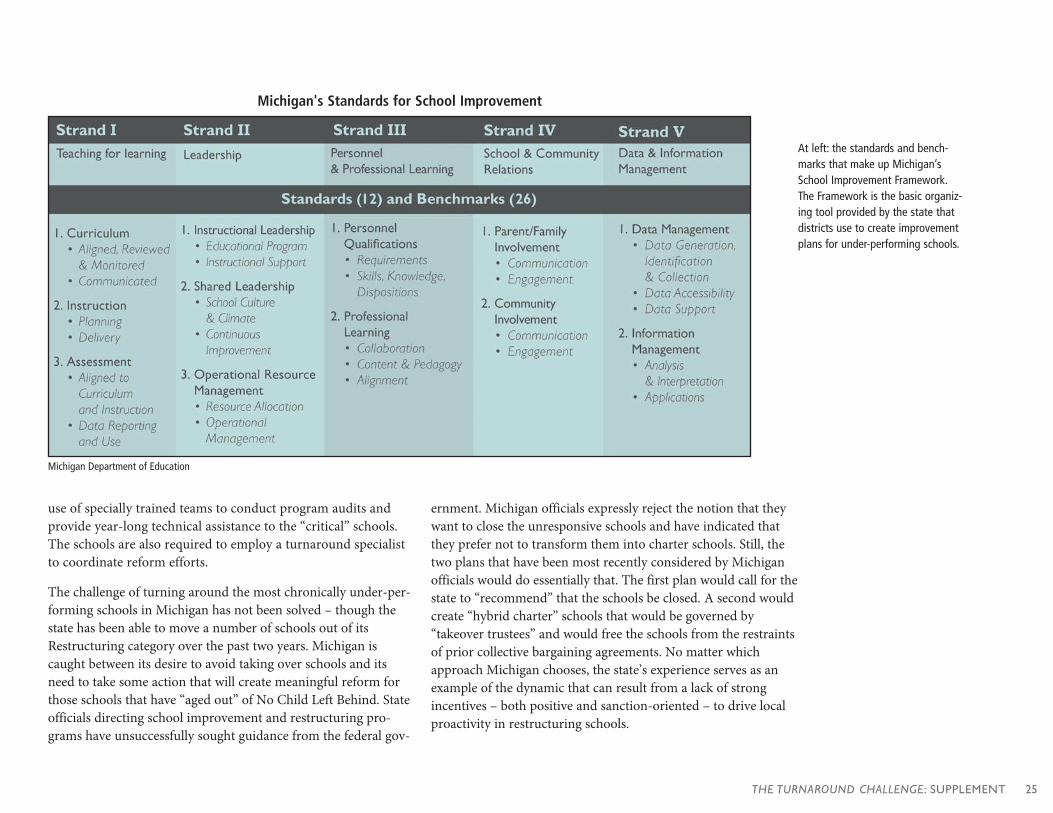
THE TURNAROUND CHALLENGE: SUPPLEMENT 25
use of specially trained teams to conduct program audits andprovide year-long technical assistance to the “critical” schools.The schools are also required to employ a turnaround specialistto coordinate reform efforts.
The challenge of turning around the most chronically under-per-forming schools in Michigan has not been solved – though thestate has been able to move a number of schools out of itsRestructuring category over the past two years. Michigan iscaught between its desire to avoid taking over schools and itsneed to take some action that will create meaningful reform forthose schools that have “aged out” of No Child Left Behind. Stateofficials directing school improvement and restructuring pro-grams have unsuccessfully sought guidance from the federal gov-
ernment. Michigan officials expressly reject the notion that theywant to close the unresponsive schools and have indicated thatthey prefer not to transform them into charter schools. Still, thetwo plans that have been most recently considered by Michiganofficials would do essentially that. The first plan would call for thestate to “recommend” that the schools be closed. A second wouldcreate “hybrid charter” schools that would be governed by“takeover trustees” and would free the schools from the restraintsof prior collective bargaining agreements. No matter whichapproach Michigan chooses, the state’s experience serves as anexample of the dynamic that can result from a lack of strongincentives – both positive and sanction-oriented – to drive localproactivity in restructuring schools.
At left: the standards and bench-marks that make up Michigan’sSchool Improvement Framework.The Framework is the basic organiz-ing tool provided by the state thatdistricts use to create improvementplans for under-performing schools.
Michigan's Standards for School Improvement
Michigan Department of Education
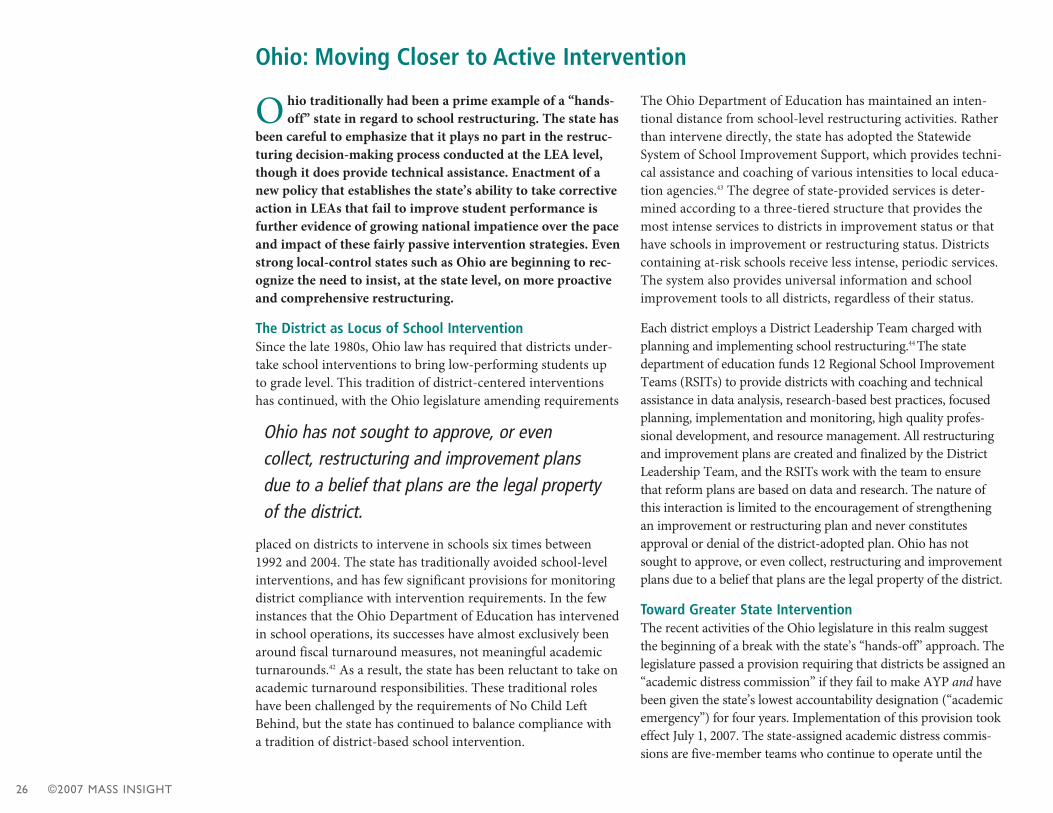
©2007 MASS INSIGHT26
O hio traditionally had been a prime example of a “hands-off” state in regard to school restructuring. The state has
been careful to emphasize that it plays no part in the restruc-turing decision-making process conducted at the LEA level,though it does provide technical assistance. Enactment of anew policy that establishes the state’s ability to take correctiveaction in LEAs that fail to improve student performance isfurther evidence of growing national impatience over the paceand impact of these fairly passive intervention strategies. Evenstrong local-control states such as Ohio are beginning to rec-ognize the need to insist, at the state level, on more proactiveand comprehensive restructuring.
The District as Locus of School Intervention Since the late 1980s, Ohio law has required that districts under-take school interventions to bring low-performing students upto grade level. This tradition of district-centered interventionshas continued, with the Ohio legislature amending requirements
placed on districts to intervene in schools six times between1992 and 2004. The state has traditionally avoided school-levelinterventions, and has few significant provisions for monitoringdistrict compliance with intervention requirements. In the fewinstances that the Ohio Department of Education has intervenedin school operations, its successes have almost exclusively beenaround fiscal turnaround measures, not meaningful academicturnarounds.42 As a result, the state has been reluctant to take onacademic turnaround responsibilities. These traditional roleshave been challenged by the requirements of No Child LeftBehind, but the state has continued to balance compliance witha tradition of district-based school intervention.
The Ohio Department of Education has maintained an inten-tional distance from school-level restructuring activities. Ratherthan intervene directly, the state has adopted the StatewideSystem of School Improvement Support, which provides techni-cal assistance and coaching of various intensities to local educa-tion agencies.43 The degree of state-provided services is deter-mined according to a three-tiered structure that provides themost intense services to districts in improvement status or thathave schools in improvement or restructuring status. Districtscontaining at-risk schools receive less intense, periodic services.The system also provides universal information and schoolimprovement tools to all districts, regardless of their status.
Each district employs a District Leadership Team charged withplanning and implementing school restructuring.44 The statedepartment of education funds 12 Regional School ImprovementTeams (RSITs) to provide districts with coaching and technicalassistance in data analysis, research-based best practices, focusedplanning, implementation and monitoring, high quality profes-sional development, and resource management. All restructuringand improvement plans are created and finalized by the DistrictLeadership Team, and the RSITs work with the team to ensurethat reform plans are based on data and research. The nature ofthis interaction is limited to the encouragement of strengtheningan improvement or restructuring plan and never constitutesapproval or denial of the district-adopted plan. Ohio has notsought to approve, or even collect, restructuring and improvementplans due to a belief that plans are the legal property of the district.
Toward Greater State InterventionThe recent activities of the Ohio legislature in this realm suggestthe beginning of a break with the state’s “hands-off” approach. Thelegislature passed a provision requiring that districts be assigned an“academic distress commission” if they fail to make AYP and havebeen given the state’s lowest accountability designation (“academicemergency”) for four years. Implementation of this provision tookeffect July 1, 2007. The state-assigned academic distress commis-sions are five-member teams who continue to operate until the
Ohio: Moving Closer to Active Intervention
Ohio has not sought to approve, or even collect, restructuring and improvement plansdue to a belief that plans are the legal propertyof the district.
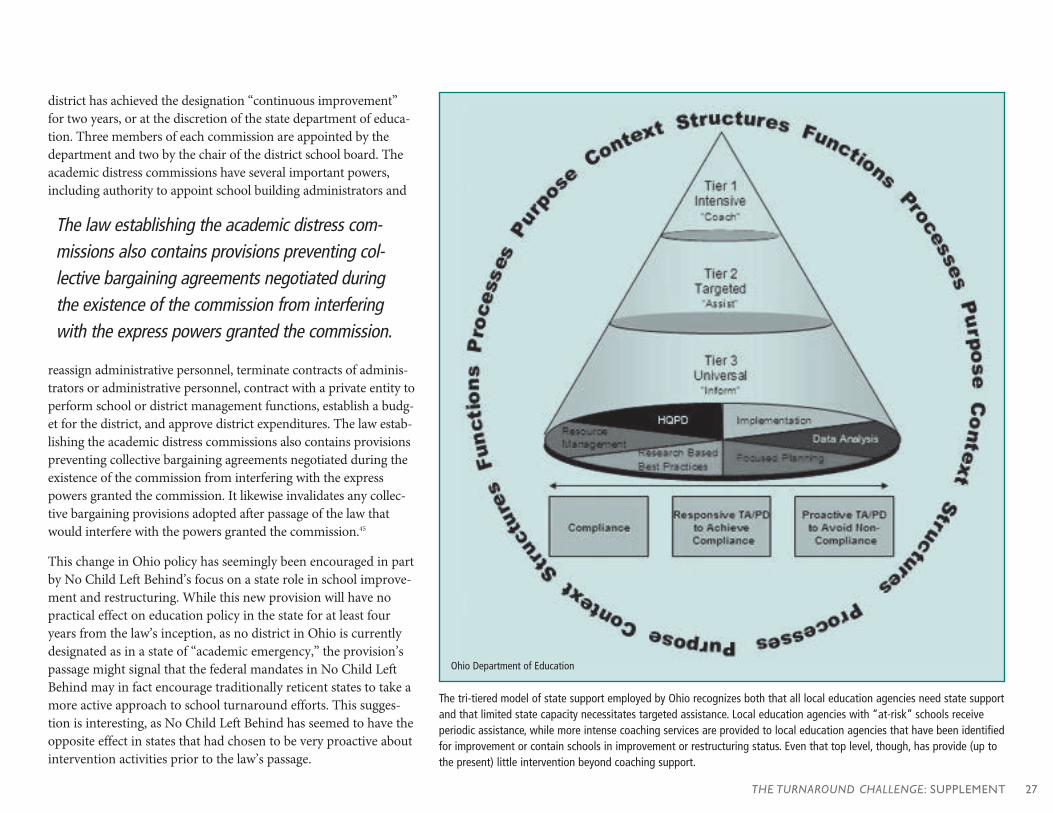
THE TURNAROUND CHALLENGE: SUPPLEMENT 27
district has achieved the designation “continuous improvement”for two years, or at the discretion of the state department of educa-tion. Three members of each commission are appointed by thedepartment and two by the chair of the district school board. Theacademic distress commissions have several important powers,including authority to appoint school building administrators and
reassign administrative personnel, terminate contracts of adminis-trators or administrative personnel, contract with a private entity toperform school or district management functions, establish a budg-et for the district, and approve district expenditures. The law estab-lishing the academic distress commissions also contains provisionspreventing collective bargaining agreements negotiated during theexistence of the commission from interfering with the expresspowers granted the commission. It likewise invalidates any collec-tive bargaining provisions adopted after passage of the law thatwould interfere with the powers granted the commission.45
This change in Ohio policy has seemingly been encouraged in partby No Child Left Behind’s focus on a state role in school improve-ment and restructuring. While this new provision will have nopractical effect on education policy in the state for at least fouryears from the law’s inception, as no district in Ohio is currentlydesignated as in a state of “academic emergency,” the provision’spassage might signal that the federal mandates in No Child LeftBehind may in fact encourage traditionally reticent states to take amore active approach to school turnaround efforts. This sugges-tion is interesting, as No Child Left Behind has seemed to have theopposite effect in states that had chosen to be very proactive aboutintervention activities prior to the law’s passage.
The law establishing the academic distress com-missions also contains provisions preventing col-lective bargaining agreements negotiated duringthe existence of the commission from interferingwith the express powers granted the commission.
The tri-tiered model of state support employed by Ohio recognizes both that all local education agencies need state supportand that limited state capacity necessitates targeted assistance. Local education agencies with “at-risk” schools receiveperiodic assistance, while more intense coaching services are provided to local education agencies that have been identifiedfor improvement or contain schools in improvement or restructuring status. Even that top level, though, has provide (up tothe present) little intervention beyond coaching support.
Ohio Department of Education

©2007 MASS INSIGHT28
L ike other states, Virginia has strengthened and clarifiedits ability to take corrective action against LEAs that fail
to incite the necessary degree of school-level reform. Virginiahas also focused on identifying and deploying individual lead-ers who can lead school intervention effectively. The approachhas gained momentum and backing at the same time that ithas been questioned by some for the degree of impact it hashad on the ground. Virginia’s experience suggests that anapproach that relies too exclusively on individual leaders –without corollary attention to the operating conditions inwhich they do their work – may not be sufficient to generatefundamental change in stagnant systems, particularly at scale.
Accreditation’s Role in AccountabilityVirginia makes decisions about intervention in under-perform-ing schools based on a dual system of accountability thatinvolves both state accreditation standards and No Child LeftBehind AYP standards. The unique element of this dual
accountability structure is the primacy of academic standards inthe accreditation process for public schools in Virginia.Accreditation decisions are thus based on not only administra-tion and facilities (the norm in many states), but in fact primari-ly on performance-based academic assessments.46 Assessmentperformance determines into which of five categories of accredi-tation the school will fall.
Those schools that do not meet the state-established academiccriteria are deemed Accredited with Warning and subject to athree-tiered academic review process, with the state conductingthe review for those schools determined to be most in need.Schools in the Accredited with Warning category have threeyears to become accredited or they are categorized asAccreditation Denied. These schools face more intrusivereforms, and the district may enter into a voluntary agreementwith the state that outlines reforms to be undertaken to turn theschool around. In 2004, the state Board of Education reformedthe Virginia Standards of Quality to increase the state’s power todirect reforms in schools that remain unaccredited. The newStandards of Quality require that districts maintain fully accred-ited schools. They also establish that the state may take actionagainst districts that fail to maintain accredited schools. Thestate had taken action to dictate reforms in three schools thathave been unable to achieve accreditation, as of the 2006-7school year.
The Virginia School Turnaround Specialist Program (VSTSP)Virginia allows districts to choose from a group of commonlyused reforms when intervening in schools in the Accreditedwith Warning and Accreditation Denied categories.47 The mostunique aspect of the reform efforts in Virginia, however, is theVirginia School Turnaround Specialist Program. This approachto turning around chronically under-performing schools focus-es on the identification and training of effective school leadersto act as inciters of change. VSTSP is a state-funded “executiveeducation program” conducted by the University of Virginia’seducation and business schools. It was first introduced in 2004,as part of then-Governor Mark Warner’s “Education for aLifetime” initiative.48
Virginia: Investing in Turnaround Leaders
This approach to turning around chronicallyunder-performing schools focuses on the identification and training of effective schoolleaders to act as inciters of change.
THE TURNAROUND CHALLENGE: SUPPLEMENT 29
The Program began with two successive classes of 10 turnaroundspecialists, accomplished school leaders trained in the businessand education skills that UVA deemed necessary for schoolturnaround.49 The most recent cohort included 25 leaders fromaround the country, an indication that Virginia’s approach hasdrawn interest from other localities struggling with the need to
restructure schools at scale. The program has three trainingcomponents. Turnaround Specialists (each of whom has beenidentified as a principal with an effective track record of raisingachievement in high-poverty schools) attend a five-day programat the Darden School of Business Management to hone the skillsnecessary for turnaround work. These skills include responses toleadership challenges, strategic change and data-based decision-making, conflict management, and resource leveraging. Next, theDistrict Leadership Academy allows for the Specialists to workwith their district-level leadership to ensure that the level of sup-port necessary for success is in place. Finally, the TurnaroundLeadership Institute includes implementation of a system ofproject management. Program participants commit to servingmulti-year tenures in the schools.50 While the districts deploying
the Turnaround Specialists commit to some additional financialsupport on a per-pupil basis for each turnaround school, thestate does not require any other form of increased authority orchange in operating conditions to support the work.
Recently, media reports have called the program’s early effec-tiveness into question. One report noted the struggles of a par-ticular Turnaround Specialist, and went on to add that 14 ofthe Program’s first 21 principals oversaw schools that failed tomeet AYP standards, based on 2005-2006 testing.51
Additionally, more than half the Turnaround Specialists havechanged schools or left the Program, despite making three-yearcommitments. At least one school has closed under the leader-ship of a School Turnaround Specialist.52 The Program’sadministrators counter such criticism with research indicatingthat 12 of 18 schools whose administrator was in the first yearof the Program experienced at least a 10 percent reduction instate assessment failure rates.53 The VSTSP continues to receivea fair amount of attention nationally for its articulation of thespecific skills school leaders need in order to manage turn-around effectively, and for the training it provides its Specialistcohorts. The experience of those leaders, once placed in turn-around schools, would seem to support The TurnaroundChallenge’s contention that good leadership, while a vital ele-ment in turnaround, is not sufficient without corollary changesto the operating context in which those leaders work.
While the districts deploying the TurnaroundSpecialists commit to some additional financialsupport on a per-pupil basis for each turnaroundschool, the state does not require any other formof increased authority or change in operating conditions to support the work.
©2007 MASS INSIGHT30
1Feller, B. (2006, May 10). Overhaul looms for rising number of schools.The Boston Globe.
220 U.S.C. 6311, §1116(a)(14).3See, for example: Hassel, B. & T. Ziebarth. (2005). School restructuring viathe No Child Left Behind Act: Potential state roles. Education Commissionof the States.
4Governance and Policy Making. In Alabama Education Policy Primer. A+Education Foundation (2006). Available at http://www.aplusala.org/primer/pdfs/5_Governance_9-16.pdf
5The divisions represented are the following: Classroom Improvement;Federal Programs; Alabama Reading Initiative; Alabama Math, Science,and Technology Initiative; Student Assessment; Special EducationServices; Professional Education Personnel Evaluation; and Preventionand Support Services.
6Information regarding the structure of the Arizona accountability systemmay be found on the Arizona Department of Education website at:http://www.ade.state.az.us/azlearns/AZ_LEARNS_History.pdf
7Del Puerto, L. (2006, December 15). AZ Sen. Karen Johnson wants to takecritical look at ‘No Child’ in Arizona. Capitol Times.
8Garcia, D.R. & J.M. Ryan. (2004). The Condition of SchoolAccountability in Arizona: 2004. Arizona Education Policy Initiative,Arizona State University.
9Parcell, D.E. & P.S. Young. Arizona LEARNS and the School ImprovementUnit. Available athttp://www.ade.state.az.us/azlearns/School_Improvement.pdf
10For a full description of the plan’s selection criteria, see the CaliforniaEducation Code § 52053.
11California Education Code § 52054. 12Education Commission of the States. (2002), State interventions
in low-performing schools and school districts. Available athttp://www.ecs.org/clearinghouse/41/52/4152.pdf.
13Scott, C. (2007) Beyond the mountains: An early look at restructuringresults in California. Center on Education Policy.
14To determine school grades, points are awarded to the school based onboth the percentage of students scoring in the three highest perform-ance categories and the percentage of students exhibiting significantlearning gains on both the reading and mathematics versions of theFlorida Comprehensive Assessment Test (FCAT). These points arethen combined with consideration of the school’s Adequate YearlyProgress (AYP) status to determine the school’s final grade. For anexplanation of the state’s grading system, see: Florida Department ofEducation. Grading Florida Public Schools 2005-2006. Available athttp://schoolgrades.fldoe.org/pdf/0506/schlGrds_pages_1_2.pdf.
15Bureau of School Improvement, Florida Department of Education.2005-2006 School Improvement Plan Guidance. Available athttp://www.bsi.fsu.edu/pdf/0506GuidanceSIPPlan.PDF
16Florida State Board of Education. District Action Plan for Repeating FSchools. Available at http://www.bsi.fsu.edu/pdf/DistActionPlanTemplate_RepeatingFSchools.pdf
17Fla. Stat. § 1008.345. The state has also indicated that other “schools ofconcern,” including those that experience a substantial drop in perform-ance or suffer failure during its first year of existence may be subject tothe sanctions described in this section. To date, the state has enforced thesanctions only against schools with repeated F grades.
18Three of the repeat F schools are located in Miami-Dade County, twolocated in Orlando (Orange County), and one school each is located inJacksonville (Duval County) and Jefferson County. All of the repeat Fschools are high schools.
19Postal, L. (2006, April 19). F schools need ‘urgency.’ Orlando Sentinel, p.D1.
20Winn, J., comments. (2006, November). Fixing Failing Schools: Is the NO CHILD LEFT BEHIND Toolkit Working? American Enterprise Institute Symposium. Transcript available at:http://www.aei.org/events/filter.,eventID.1351/transcript.asp
21Hawaii Department of Education. (2005, March 3). 24 Hawaii schools tar-geted for restructuring under NO CHILD LEFT BEHIND. Press Release.Available at http://www.hcps.k12.hi.us/STATE/COMM/DOEPRESS.NSF/0/8b5a7de30f32d8550a256fb2000be60c?OpenDocument
22Hurley, T. (2005, May 6). Plan for struggling schools OK’d. The HonoluluAdvertiser, p. 1B.
23Creamer, B. (2006, August 28). Cost of test aid could double. TheHonolulu Advertiser, p. 1A.
24See Baltimore Teachers Union v. Md. State Bd. of Educ., 379 Md. 192 (2006). 25See Md. State Bd. of Educ., 379 Md. at 195. 26Going public with school privatization: State’s contract with Edison
Schools, Inc. is in its fifth year: Is it a good deal for the Baltimore CityPublic Schools? The Abell Report, Vol. 18, No. 3 (2005). Available at:http://www.abell.org/pubsitems/arn905.pdf
27Center on Educational Policy. Building on State Reform: MarylandSchool Restructuring.
28De Vise, D. (2006, September 26). ‘Lite’ Choice in School Reform.Washington Post, p.B5.
29Wan, W. (2007, January 29). Staff is reeling after bold move: All employ-ees must reapply for jobs. Washington Post, p. B6.
THE TURNAROUND CHALLENGE: SUPPLEMENT 31
30Bowie, L. (2006, April 2). Schoolyard Brawl: City and state leaders stand onopposing sides of the debate over how to improve public education inBaltimore; Grasmick mingles politics, accountability. Baltimore Sun, p. 1A.
31For a detailed description of the state review panels, see the School DistrictAccountability page on the Massachusetts Department of Education website: http://www.doe.mass.edu/sda/review/panel/overview.html
32Tench, M. (2004, September 28). Ailing school eyed for state takeover. The Boston Globe, p.A1.
33Schworm, P. (2005, October 30). Critics say state delayed as a schoolfloundered: Despite legal powers, intervention is rare. The Boston Globe.
34Massachusetts Department of Education. (2006, October 26). BOE votesto allow state to step in sooner to help low performing schools. PressRelease. Available at http://www.doe.mass.edu/news/news.asp?id=3121
35See 603 CMR 2.03 for more detail on the new regulations.36For information on the budget requests, see
http://finance1.doe.mass.edu/doe_budget/FY2008.html37By one estimate, about 70% of the schools nationwide identified as failing
and facing No Child Left Behind sanctions are in just seven states:Michigan, New York, New Jersey, Illinois, Pennsylvania, California andGeorgia. See 544 Michigan Schools Fail Federal Standards. Detroit FreePress (2006, August 25), p. 1.
38Scott, C. (2004, November). Makeovers, facelifts, or reconstructive sur-gery: An early look at NO CHILD LEFT BEHIND restructuring inMichigan. Center on Education Policy. Available at http://www.cep-dc.org/fededprograms/Michigan_Nov2004.pdf
39For more information on the ABCS coaching program , seehttp://www.abcscoaches.org/aboutABCS.asp
40Scott, C., Kober, N., Stark Rentner, D., & Jennings, J. (2005, November).Hope but no miracle cures: Michigan’s early restructuring lessons. Centeron Education Policy. Available at http://www.cep-dc.org/fededprograms/michiganNov2005/HopebutNoMiracleCure.pdf
41For example, maintaining a strict restructuring plan approval process andstressing the value of coaching.
42McRobbie, J. (1998, Spring). Can state intervention spur academic turn-around? WestEd. Available at http://www.wested.org/wested/papers/state_intervention/StateIntervention.html
43Ohio Department of Education. Ohio’s Statewide System of SchoolImprovement Support. Available at http://www.ode.state.oh.us/GD/Templates/Pages/ODE/ODEDetail.aspx?page=3&TopicRelationID=1105&ContentID=16293&Content=21407
44For a full interactive presentation explaining the structure and operationof the Ohio Statewide System of School Improvement Support, seehttp://www.ode.state.oh.us/GD/DocumentManagement/DocumentDownload.aspx?DocumentID=20339. See also Council of Chief State SchoolOfficers. (2006). State Support to Schools in Need of Improvement.Consortium for School Improvement Policy Brief. Available athttp://www.ccsso.org/content/pdfs/SSSNI_FINAL.pdf
45The new law is available at ORC Ann. 3302.10468 VAC 20-131-28047Kastner, L. (2006, September 27). Last chance for a failing school; New
principal, teachers part of mandate to improve Richmond’s ChandlerMiddle. The Richmond Times-Dispatch, p. A-1.
48The Program was established with a $1.5 million grant from the state. Itlater received funding of up to $4 million from Microsoft, through thePartners in Education program. See National Model PR Newswire (2004,September 23). Commonwealth of Virginia Will Expand TurnaroundSpecialist Program With Microsoft Partners in Learning; MultimillionMicrosoft Investment Offers Ongoing Support and National Model.According to then-Governor Warner, the Program is unique in itsapproach to promoting business-model approaches to change in an edu-cational setting. See Santos, C. (2004, June 22).
49For a full description of the cohorts and a summary description of theProgram, see http://www.darden.virginia.edu/html/standard.aspx?menu_id=39&styleid=3&id=6154
50In the past year, the commitment has been reduced from three years to two.
51Merrow, J. (2006, October 11). Principal works to improve failing inner-city school. The Online News Hour. Available at http://www.pbs.org/new-shour/bb/education/july-dec06/turnaround_10-11.html
52Fernandes, D. (2006, April 21). Problems plagued school for years, reportsshow. The Virginian-Pilot, p. A-10.
53http://www.darden.virginia.edu/html/standard.aspx?menu_id=39&styleid=3&id=6154

©2007 MASS INSIGHT32
Big-change efforts that reject marginal reform
While Mass Insight's research into existing state strategiesfor intervention in chronically under-performing schools
provides some important lessons for future action, the stepstaken have, as noted in the previous section, been fairly tentativeso far. While some incorporate promising approaches, mosthave encountered significant frustrations, and none has pro-duced substantial, enduring change in a scaled-up manner.
Perhaps unsurprisingly – since they are that much closer to thechallenge – much of the bolder work on organizing school turn-around to date has happened at the district level, where a hand-ful of entrepreneurial superintendents, driven by extreme per-formance challenges and political pressures, have jumped infront to create some dramatically different new strategies.
These turnaround laboratories are two to three years old, so onlypreliminary indications can be drawn on the effectiveness oftheir experiments. But it is clear that some of the district experi-ments are making much more headway in shaking up the statusquo than has been the case with more traditional reform strate-gies focused exclusively on coaching and staff development. It isalso clear that these approaches share some critical common ele-ments, though they deliver these elements in a variety of ways.
Mass Insight reviewed the approaches and direction of a num-ber of districts both for this project and for concurrent researchon school turnaround for the NewSchools Venture Fund. Tothese ends, Mass Insight and its consultants conducted more
than 50 structured, protocol-based interviews with district offi-cials, representatives of education management organizations(EMOs) and individuals with detailed direct knowledge of eachdistrict. The research team also scoured public sources of dataand media reports. They developed a “market factbase” for eachgeographic area studied, including information about factorssuch as the scope and scale of the turnaround challenge and cur-rent district approaches to restructuring in use in the district.
Using these factbases, as well as independent, more in-depthstudies on the most promising districts, leading-edge practiceswere identified in four districts for this report: Chicago, Miami-Dade, New York City, and Philadelphia.
Hallmarks Across All Four DistrictsThe directions taken by these cities vary, and are greatly influ-enced by their local circumstances, politics, and capacities.There are, however, a few basic ideas at the heart of all thestrategies. All four cities have created initiatives that recognize:
• The need for dramatic, fundamental change, replacing incre-mental reforms that have not produced results
• The need for changed operating conditions: union-negotiatedflexibility in hiring, evaluation, hours and pay, incentives,personnel deployment options, and other work rules
• The need to apply greater capacity to accomplish turnaround,in part through intensive collaboration with externalproviders
• The need for additional investment.
These hallmarks support, in general, major findings in The Turnaround Challenge and some of the principal recom-mendations in the main report's proposed framework for schoolturnaround at scale.
The Turnaround Laboratories:Four Major Districts' Turnaround Strategies
Perhaps most importantly, this research high-lights the need for a special, protected space toprovide the enabling conditions necessary forturning around under-performing schools.
D I S T R I C T E F F O R T S
THE TURNAROUND CHALLENGE: SUPPLEMENT 33
Management and Decision-Making DynamicsThese innovative models may share important attributes, butthey come to grips in different ways with key implementationquestions. For example: the districts vary in their approach towhat The Turnaround Challenge (among other research reports)calls the “loose-tight” management dynamic. Where does strate-gic and implementation decision-making reside – at the dis-trict/network level (centralized/tight) or at the school level(decentralized/loose)? Taken together, the four districts describea continuum as follows, from tight to loose:
1. Centralized/Tight: Miami-Dade's School Improvement ZoneA single cluster of schools, in one Zone, managed tightly and directly by the district. Miami-Dade, eager to produceresults quickly, went with one core set of strategies andapplied it across 39 under-performing schools.
2. Portfolio (Mixed) Approach: Chicago's Renaissance 2010and Philadelphia's “Diverse Provider” modelCreating different clusters of schools that rest at different pointson the autonomy continuum. Both districts have experimentedwith schools managed by partners that can establish, to adegree, their own approaches and operating rules. Both districtshave also undertaken turnaround work themselves, on behalf of failing schools that remain under direct district control.
3. Decentralized/Loose: Empowerment Zone and ChildrenFirst, New York CityNew York's Children First initiative differs from the othermodels profile here because it is a districtwide effort. Its essen-tial idea, though, is the empowerment of the leaders who areclosest to the students (i.e., at the school level) to make deci-sions on school design, budget, management, curriculum,staffing, schedules, and operations, in exchange for fairly tightdistrict control over achievement standards and accountability.
Our aim here was to look for bold steps: districts that areattempting to reinvent the status quo. In New York, strong politi-cal leadership has enabled that reinvention process to be broughtbefore the whole district; in the other three districts, it has begunwith the failing schools where consensus on the need for funda-mental change was most evident. Our guess is that most districtsand states may need to follow that path. The longevity, clout, andstrong working relationships shared by Mayor MichaelBloomberg and School Chancellor Joel Klein in New York are theexception, not the rule (though Chicago's Richard Daley andArne Duncan come close). That political strength is what hasenabled these school districts to move ahead.
It is also worth reiterating that all of these district programs arestill in the experimental stage. It is still too early to measure theirfull impact on performance, particularly over time and at scale.However, they encompass creative, sometimes dramatic, andoften promising approaches to the three 'C' issues Mass Insightidentifies in The Turnaround Challenge as crucial to state actionon turnaround: conditions change, capacity-building, and clus-tering for efficiency and effectiveness.
Perhaps most importantly, for example, this research highlightsthe need for a special, protected space to provide the enablingconditions necessary for turning around under-performingschools. The specifics differ, but the main idea is the same acrossMiami-Dade's School Improvement Zone, Chicago's Ren-10schools, Philadelphia's Creative Action and Results Region andprivate partnership options, and New York City's Empowermentoptions within Children First. It is partly from their experiencethat Mass Insight developed its proposed turnaround frame-work, designed to help states ensure that such creative, strategicresponses to the turnaround challenge are not limited to a fewindividually entrepreneurial districts, but are more easily accessi-ble to all public school districts statewide.
Much of the bolder workon organizing schoolturnaround to date hashappened at the districtlevel, where a handful of entrepreneurial superintendents havecreated dramatically different new strategies.
©2007 MASS INSIGHT34
District-Based Turnaround Lab 1:The Renaissance 2010 Story
At its heart, the Renaissance 2010 initiative (or “Ren-10,” asit’s called) is Chicago’s attempt to marry the opportunity
for fundamental reform represented by under-performingschools with the changes in authority and governance modeledby the district’s successful charter school movement. To builddistrict and community-wide support, however, it does sothrough a variety of approaches that offer autonomy inexchange for increased accountability.
ContextIntervention HistoryChicago has a long and complex history with school reform. Thenation’s third-largest school system, CPS has over 600 schools
and serves over 420,000 racially diverse students who are largelyfrom low-income homes. Like many other large urban systems,CPS entered the modern reform era having historically faced upto its difficult challenges with ultimately unsuccessful responses– so unsuccessful, in fact, that in 1987, the U.S. Secretary ofEducation deemed it “the worst school system in America.”
Thus began the first of three waves of Chicago school reform.The first wave began in 1988 and focused on decentralization,
with the creation of locally elected councils that had the primarytask of hiring and firing school principals. This wave of reformsuccessfully gained parental and community investment and fos-tered site-based innovation, but failed to markedly increase stu-dent achievement. The system also struggled with fiscal mis-management, labor instability, and crumbling infrastructure.
The second wave of reform began in 1995 when Mayor RichardDaley was granted sweeping authority over CPS, including theright to appoint the school board. Under the leadership of CEOPaul Vallas, the district focused on accountability. The newadministration improved the district’s financial situation, stabi-lized labor relations, repaired decaying schools, and built newschools to alleviate overcrowding. The district also experimentedwith charter schools, supplementary programs, and new curricu-lar initiatives. Student achievement slowly began to rise, mostnotably in the district’s 15 new charter schools. Overall progress,however, did not result in the broad-based achievement gainsnecessary to meet the demands of No Child Left Behind.
The third wave of reform began when Arne Duncan becameCEO in 2001. Beginning in 2004, he attempted to implement aplan to close all schools in four high-poverty neighborhoods onthe south side and reopen them under new management. Therewas huge opposition from the communities, and it was shelved.Duncan’s strategy now centers on a theory of opening newschools – and the Renaissance 2010 plan, unveiled in June 2004.
Current District Approaches to RestructuringTo address the needs of its chronically failing schools, CPS hasdeveloped 11 restructuring options, most of which fit intoNCLB’s fifth category of “other major restructuring.” By 2005
Chicago’s Renaissance 2010:A Spectrum of Autonomy-for-Accountability Options
The district issues an RFP for each newschool, which is then opened under one ofthree governance structures: Charter School,Contract School, or Performance School.

THE TURNAROUND CHALLENGE: SUPPLEMENT 35
there were 200 district schools that were either undergoing someform of NCLB-mandated planning for restructuring or inrestructuring itself. Of those, 195 chose the “other” category,while one replaced staff and principal, four replaced the princi-pal. None chose to charterize.
The district emphasizes choice for students and families.Chicago is engaged in multiple, overlapping strands of schoolrestructuring. Major current initiatives include:
NCLB Restructuring
Magnet Schools: some without attendance boundaries andMagnet Cluster Schools with attendance boundaries
Small Schools led by teams of teachers
Transformation Project Schools: A new effort for the 2006-2007 school year, the Transformation Project replaces theChicago High School Redesign Project (CHISRE). CHISREwas an intermediary set up with funding from the GatesFoundation to create 36 small schools. However, these smallschools often opened using the same leadership as the schoolsthey replaced. The Transformation High Schools (there aremore than a dozen in all) will use new leadership and curricu-la designed by multiple providers, including Kaplan K-12Learning Services.
Renaissance 2010: Up to 100 new schools are being opened under Renaissance 2010 (or Ren-10); 55 had openedas of 2006-7. See details on this initiative in the remainder of this section.
Highlighted Initiative: Renaissance 2010Ren-10 OverviewChicago’s latest reform story, the Renaissance 2010 initiative,aims to shut down approximately 70 district schools, either forunder-performance or because of under-utilized space consider-ations. Ren-10 aims to open 100 schools in their place by 2010 –primarily new starts, along with a smaller number of schools thatundergo turnaround or closure and reopening.
The district's Office of New Schools issues an RFP for each newschool, which is then opened under one of three governancestructures: Charter School, Contract School, or PerformanceSchool (see sections and chart below for detailed summary ofthese options). Most Renaissance schools will be small, enrollingno more than 600 students. All neighborhood students are eligi-ble to attend Renaissance schools, though some will be open tostudents city-wide; students who attended turnaround schoolswill have priority when the new school reopens. The number ofRenaissance schools selected each year will depend on the qualityof the proposals submitted, and accepted proposals will be heldaccountable for meeting stated student achievement goals inexchange for increased autonomy. Initial contracts will be forfive years, and are funded on a per-pupil basis.
s
ss
ss
CPS has been a proactive charter authorizer,opening close to the maximum allowed by law,and indeed testing the law by allowing high-performing charters to open multiple campuses.
©2007 MASS INSIGHT36
At the elementary school level, new schools and turnaroundsgenerally affect every grade level at once; at the high school level,in some cases turnaround is conducted (or new schools areopened) grade by grade. In those instances, grade-by-gradephase-in starts with the freshman class, while the remaininggrades stay in the school and are phased out as that classadvances.
In 2006, the district offered two Ren-10 RFPs – one invitingexisting operators to replicate successful models, the other opento all. The invited RFP was given to those who currently operateat least two successful schools and who have previously partici-pated in the open RFP process. This gives applicants an oppor-tunity to create up to 2,400 new seats over a four-year period.
Ren-10 schools are chosen for “rebirth” because of federal andstate laws, and Chicago Board of Education policies that grantCPS authorization to temporarily close and re-open low per-forming schools. Public hearings are required before the boardacts. Key factors in choosing schools for “rebirth” are academicperformance and rate of improvement (or lack thereof). Theexistence of empty school buildings and the district’s ability toreassign students to under-filled buildings during transitionyears are vital to this plan.
Renaissance 2010’s portfolio of reform options provides forthree levels of management autonomy:
Charter Schools are funded by the Board of Education, but havefreedom from many state laws, district initiatives, and boardpolicies and are not required to follow many board regulations.They can set their own policies for curriculum, school hours,and discipline, but are held accountable for student academicachievement. Teachers and staff are either employees of thenon-profit organization that governs the charter school or of aneducation management organization hired by the non-profit.
Teachers may remain covered by the district bargaining agree-ment, negotiate as a separate unit with the charter school govern-ing body, or work independently. Certification is not required,but uncertified teachers must meet stated requirements (a bache-lor’s degree, five years experience in the degree area, passingscore on state teacher tests, and evidence of professional growth).Mentoring must also be provided to uncertified teachers.Charters must participate in the state’s retirement system.
CPS has been a proactive charter authorizer, opening the maxi-mum (30) allowed by law, and indeed testing the law by allowinghigh-performing charters from among the first 15 operators toopen multiple campuses. CPS is considered to have one of themost thoughtful approaches to authorizing charters, with theirslow-growth, high-quality plan that is selective, transparent, andincludes an ongoing rigorous audit process. As of September 2007,there were 56 charter campuses, operated by 28 independent enti-ties. A majority of the charters are part of the Ren-10 initiative.
Contract Schools are managed by independent non-profits inaccordance with a five-year Performance Agreement betweenthe organization and the Board of Education. Contract Schoolsare free from many CPS policies and requirements, but not from
Chicago’s Renaissance 2010 continued
Teachers whose schools have been closed donot, apparently, hold any priority in the hiringprocess for either the newly opened schools orelsewhere in the district.
THE TURNAROUND CHALLENGE: SUPPLEMENT 37
state school laws. Contract School teachers and school staff areemployees of the non-profit or company that has the “contract.”
There were some schools called “contract” schools before Ren-10 was officially announced, such as a KIPP school that hassince closed. There are now four Ren-10 contract schools; thefirst was opened by American Quality Schools, in partnershipwith the Westside Ministers Coalition. The Austin Businessand Entrepreneurship Academy opened in fall 2006 with itsninth grade class, as a “school of high standards providing stu-dents with a strong academic foundation, business knowledge,social skills, and practical experiences to enable them to pursueeconomic opportunity for themselves and create economicopportunity for the Austin community.” There are also twocontract schools outside of Ren-10 – two elementaries closedfor low performance and re-opened in 2003 as contract schools.The district plans to open as many as eight contract schools bythe fall of 2008.
Performance Schools are CPS district-run schools exempt fromor given additional flexibility on many district initiatives andpolicies, but subject to state laws. Teachers and school staff are employees of CPS. There are 19 performance schools open as of fall 2007.
For further comparison of the three Ren-10 options, see next section.
Renaissance 2010 Management DynamicsBy giving entrepreneurs the opportunity to launch new schoolsor turn around existing ones, coupled with strict accountabilityrequirements, the district effectively placed the initiative’s focuson student achievement, rather than on who’s in charge. Theflexibility among several design options has generated a combi-nation of unique, locally founded schools as well as privatelymanaged, more easily replicable models. The “readiness to act”
factors addressed through Ren-10 include: autonomy, decision-making, governance, and teacher contracts.
AutonomyThe three possible school types under Renaissance 2010 – char-ter, contract, and performance schools – offer schools differingdegrees of freedom from CPS rules and regulations. This rangealso allows for varied levels of autonomy with respect to staffing,budget, and governance. The main thrust of the Ren-10 policy,however, is that all schools are held accountable for meeting stat-ed goals for student achievement and success in exchange fortheir increased autonomy. Like failing traditional public schools,Ren-10 schools that are not meeting their student performancemarkers are subject to closure by the district.
Decision-MakingRenaissance 2010 schools are all offered extensive programmaticand curricular flexibility, which is intended to encourage innova-tive designs and creative models. Though all school types mustmeet state learning standards, contract and performance schoolsalso generate a performance agreement as to how they’ll meetCPS standards through a designated series of student outcomemeasures. Decisions on individual curricular elements are flexi-ble and are agreed upon in the individual school performanceplan. Charter schools are not linked to other CPS initiatives,whereas contract and performance schools have the option toparticipate if they so desire. All three school types are also able tomanipulate the academic calendar and traditional school day,provided they meet CPS minimums.
GovernanceGovernance under Ren-10 also varies depending on school type.Both charter and contract schools are administered by approvedindependent organizations, whereas performance schools aregoverned by CPS, but granted specific autonomies. Charters arerun by a governing board, but performance schools are managed
©2007 MASS INSIGHT38
by a local school council composed of community members,parents, and school leaders. Contract schools can select either a board or a local school council.
Teacher ContractsDifferent forms of contracts and differentiated pay scales forteachers are also hallmarks of the Ren-10 schools. Performanceschools are most like traditional schools in this arena, in thattheir teachers must be compensated according to union guide-lines and all teachers are members of Chicago Teachers’ Union.On the other hand, charter and contract schools can determinetheir own teacher compensation scale and their teachers canchoose whether to unionize. Contract and charter school teach-ers may join the CTU, but may not participate in the actual bar-gaining agreement with the district.
Teachers whose schools have been closed do not, apparently,hold any priority in the hiring process for either the newlyopened schools or elsewhere in the district (though they will notbe "excessed" or laid off). Under Renaissance 2010 guidelines,whether the converted and re-opened schools require theirteachers to be certified depends on the school type; all teachersin contract and performance schools must hold appropriate cer-tifications, but only half the teachers in new charter schools arebound to such regulations. Leaders of Ren-10 schools may hailfrom various non-traditional fields, including business, highereducation, and community organizations.
For a summary of the Ren-10 options, see the table on next page.
Results to DateGiven that the Renaissance 2010 schools are only in their firstyears of operation, it is too soon to judge whether the initiativewill be successful. We do know that the average attendance rateat the 22 Cohort One schools is 96 percent, two percentagepoints higher than that of other CPS schools. There are otherearly signals of promise; all ten new high schools reportingPrairie State Achievement Exam (PSAE) scores in 2007 did bet-ter than their comparison neighborhood high schools in the per-centage of students meeting or exceeding state standards. A per-formance contract has since been incorporated into each school’sannual audit. The performance reports will examine threeaspects of student test scores: percentage of students meetingstandards in current year, how these figures changed from previ-ous year, and how they compare to figures in schools charterstudents would have attended.
It is worth noting that student achievement in CPS schools generally rose dramatically in almost all portions of the 2005-2006 Illinois Standards Achievement Test (ISAT), with up to 96 percent of schools improving in math and 92 percentimproving in both reading and science. These results representthe largest one-year test score gains since Mayor Daley first tookoffice in 1995 and echo the upward trend since the first adminis-tration of the ISAT in 2000. Those increases continued in 2007across the board, for new schools, charters, Ren-10 schools, andfor the district as a whole, with grade 3-8 students in newschools and charters slightly outperforming district averages.
It may also be relevant to note the performance of CPS’s olderCPS charter schools, on which the Ren-10 initiative is broadlybased: Chicago’s charters perform better than the availableneighborhood schools three-quarters of the time. The chartersalmost all have strong graduation rates, huge waiting lists, higherattendance rates (in all but one), and the models are being repli-cated by non-charter district schools. Seventy percent of CPScharter elementary schools improved faster than CPS as a whole;
Chicago has benefited from the presence of aproactive mayor and superintendent who operateon a very strong political foundation.
Chicago’s Renaissance 2010 continued
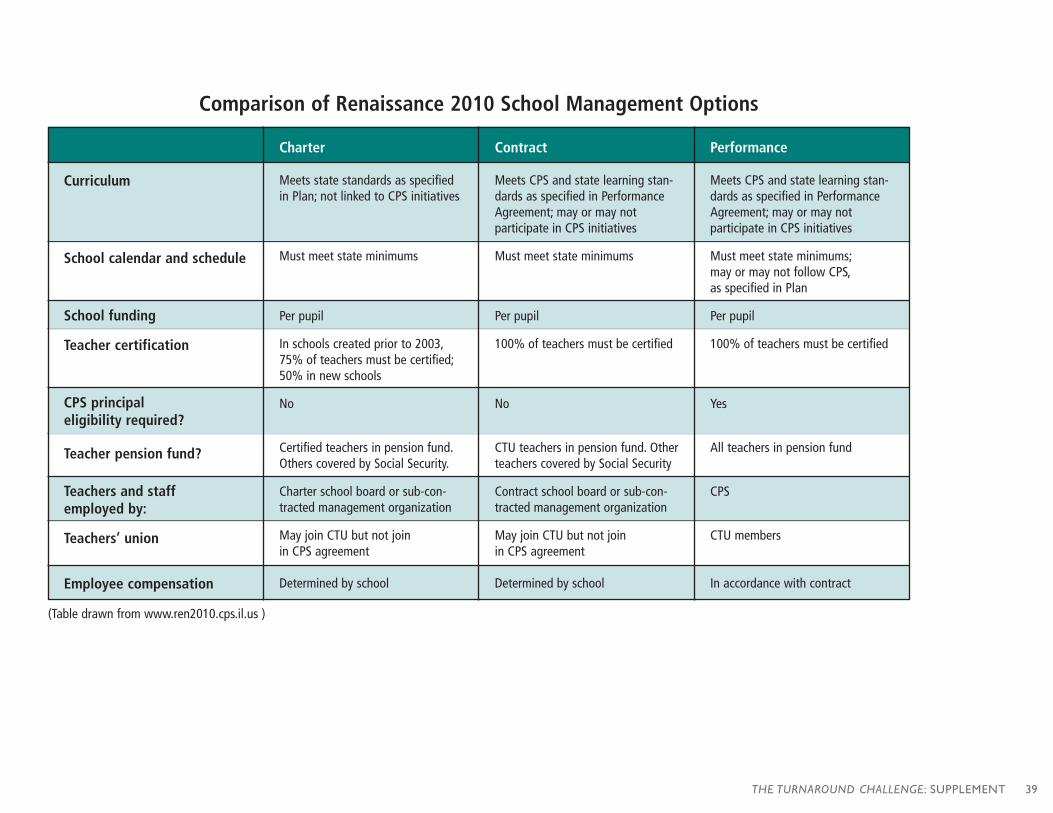
THE TURNAROUND CHALLENGE: SUPPLEMENT 39
Comparison of Renaissance 2010 School Management Options
(Table drawn from www.ren2010.cps.il.us )
Charter Contract Performance
Curriculum
School calendar and schedule
School funding
Teacher certification
CPS principal eligibility required?
Teacher pension fund?
Teachers and staff employed by:
Teachers’ union
Employee compensation
Meets state standards as specifiedin Plan; not linked to CPS initiatives
Must meet state minimums
Per pupil
In schools created prior to 2003,75% of teachers must be certified;50% in new schools
No
Certified teachers in pension fund.Others covered by Social Security.
Charter school board or sub-con-tracted management organization
May join CTU but not join in CPS agreement
Determined by school
Meets CPS and state learning stan-dards as specified in PerformanceAgreement; may or may not participate in CPS initiatives
Must meet state minimums
Per pupil
100% of teachers must be certified
No
CTU teachers in pension fund. Otherteachers covered by Social Security
Contract school board or sub-con-tracted management organization
May join CTU but not join in CPS agreement
Determined by school
Meets CPS and state learning stan-dards as specified in PerformanceAgreement; may or may not participate in CPS initiatives
Must meet state minimums;may or may not follow CPS,as specified in Plan
Per pupil
100% of teachers must be certified
Yes
All teachers in pension fund
CPS
CTU members
In accordance with contract
©2007 MASS INSIGHT40
all CPS charter high schools outperformed the district schoolsstudents would have otherwise attended. Charters remain, how-ever, a relatively small part of the educational landscape, educat-ing eight percent of Chicago students.
Strengths and Challenges of Chicago’s Intervention ExperienceStrong Political FoundationChicago has benefited from the presence of a proactive mayorand superintendent who operate on a very strong political foun-dation. Controversial approaches such as Ren-10 appear torequire this kind of strong-willed authority – whether providedthrough state intervention (such as Oakland and Philadelphia)or the ballot box (Chicago and New York).
Substantial Interest from PartnersRenaissance 2010 has generated a substantial amount of interestfrom community members, private organizations, parents andteachers. More than 50 proposals were received for the very first
RFP in 2004, and 22 were accepted. In 2006, CPS offered twofurther RFPs. (The Ren-10 RFP is a comprehensive, thoughtfuldocument that turnaround policy planners would do well to lookover. See the listing in the Resources section.) However, somestakeholders have expressed concern (see below).
The Perils of ClosureChicago has been in the vanguard for garnering communityinput into its schools, but the current local political climate sug-gests this is a double-edged sword. The success of Ren-10depends upon strong local community support to get past theshock of school closure, so CPS must work hard to address exist-ing community concerns for the policy to gain traction. It is alsoimportant that CPS is equally clear about the criteria for schoolclosures as it is for new-school proposals, so that the plan doesn’tfeel like a covert attack on schools in certain areas or on publiceducation more generally.
Many educators and community members are concerned aboutthe negative impact school closures might have on their formerstudents. According to some reports, violence and behaviorissues have increased somewhat in schools that have receivedlarge numbers of students from closed failing schools, sparkingpublic concern.
Getting the Oversight RightAdditionally, the performance pressure placed on schools byNCLB and other accountability policies has resulted in the dis-trict tightening the reins on many Renaissance schools. The dis-trict has created the Office of New Schools to work with the newschools, and has moved towards increasing the amount of sup-port it offers to leaders of the schools. Some of the new-schooloperators are slightly concerned about a "slippery slope" of dis-trict involvement in their schools, while others welcome it as asource of support for schools that may not, in every case, haveenough local capacity to address the challenges they face.
Chicago’s Renaissance 2010 continued
Chicago remains, along with New York City, one of the nation's most compelling centers ofbreak-the-mold school reform and a district thatdeserves close attention.
THE TURNAROUND CHALLENGE: SUPPLEMENT 41
On-going Charter HurdlesWhile the success of the original generation of Chicago chartersprovided much of the inspiration for Ren-10 initiatives andchartering represents one of the three options offered, the initia-tive is not providing a clear victory for charter supporters.
First, the state cap on charters has begun to limit their growth.State law only allows for 60 schools, and Chicago’s cap is 30.There was an allowance, originally for each charter to set upmultiple campuses; however, this has been changed to allow onlythe original 15 Chicago charters to open additional campuses –new charters cannot expand.
Second, given that substantial support from private foundationsand community organizations was key to the success ofChicago’s original charters, many wonder if there is enough pri-vate funding for all the proposed new schools. Business commu-nity backers originally committed to raising money for 100 newcharter schools, but have some concerns about the district’s abil-ity to do that, given the charter cap.
Other HurdlesOther hurdles include resistance within some parts of the CPSbureaucracy, lingering community opposition, and influential,anti-charter teacher unions. (Union leaders and communityactivists remain skeptical about the educational soundness of charters and the Ren-10 strategy, while appreciative of the“portfolio” aspect of the approach that permits them to beactively engaged in the work.)
An Entrepreneurial ResponseChicago faces all of the same organizational dynamics, fundingchallenges, and social issues that other big-city districts face. Butlike New York City, it has responded with energy, creativity, andsustained commitment. Its efforts have made it a hotbed, ofsorts, for school reform, drawing significant local and nationalresources. For example: over the course of the 2007-8 schoolyear, the district is cooperating with NewSchools Venture Fundand Chicago International Charter School, the city’s largest char-ter operator, to “incubate” a new turnaround organization to becalled ChicagoRise. The initiative is another signal of the dis-trict's readiness, with able partners, to directly address importantchallenges – in this case, the dearth of high-capacity externalpartners dedicated to conducting school turnaround. Strategiessuch as these that are under development in Chicago make it alaboratory of reform that should be of prime interest to urbaneducation reform leaders everywhere.
The initiative is anothersignal of the district'sreadiness, with able part-ners, to directly addressimportant challenges – in this case, the dearth of high-capacity externalpartners dedicated to conducting schoolturnaround.
©2007 MASS INSIGHT42
District-Based Turnaround Lab 2:A Cohort of “Superintendent’s Schools”
For policymakers interested in the efficacy of direct, centrally-managed turnaround work, Miami-Dade’s School Improvement
Zone is the initiative to watch. Within a sub-district that acts asan intensive care unit for chronically under-performing schools,Superintendent Rudy Crew is pursuing substantial reform in these schools through centralized control of prescribed inter-ventions focused on (but not limited to) literacy – with promis-ing early success.
ContextIntervention HistoryWhen Rudolph “Rudy” Crew became superintendent of Miami-Dade County Public Schools in the summer of 2004, M-DCPS
was facing severe challenges in several arenas, including personnelissues, school overcrowding, financial mismanagement, and per-sistent student underperformance. In response, the Florida legisla-ture was seriously considering breaking up the Miami-Dadeschool district (the fourth largest school system in the country),and some state resources were being redirected to the northernpart of Florida where it was hoped they’d have more impact.
Then the district recruited Crew, who had launched the high-profile Chancellor’s District for failing schools in New York City.When he arrived, Crew immediately began work on a dis-trictwide overhaul and comprehensive school reform strategy. Heand his team pledged that they’d raise the state-issued “letter”grades for at least 10 of the district’s lowest performing schoolsduring the first year of their tenure. Further, they promised toraise the FCAT (Florida Comprehensive Achievement Test)scores of over 3,000 M-DCPS students within the same period.
During the first phase of his plan, Crew implemented severalblanket reforms by increasing teacher pay, planning to improveschool capacity, engaging the local community, and restructur-ing fiscal and personnel processes.
Current District Approaches to RestructuringUnlike Chicago and Philadelphia, which have clearly distributeddecision-making about how to effect school restructuring to avariety of in- and out-of district agents, Miami-Dade centraloffice has focused on the centrally-directed Improvement Zoneturnaround approach in order to achieve maximum impact in aminimum timeframe. However, several of the school optionsfeatured in restructuring in the other districts – such as charterand magnet schools – also form part of the landscape in Miami-Dade. In fact, these options are particularly significant inMiami-Dade because the state and district have an extensive his-tory of school choice, started decades ago as a remedy for resi-dential segregation. As described by Jane Hannaway and SarahCohodes of the Urban Institute (2007), the current set of choices(some of which comprise different school models, others ofwhich are programs to provide access to a selection of standarddistrict schools) includes:
Miami-Dade’s School Improvement Zone: Significant Reform through Central Control and Uniform Design
Crew believes the Zone approach – rapid implementation of a broad strategy within asignificant number of schools – was necessaryto create critical mass to change the cultureacross the rest of the district.
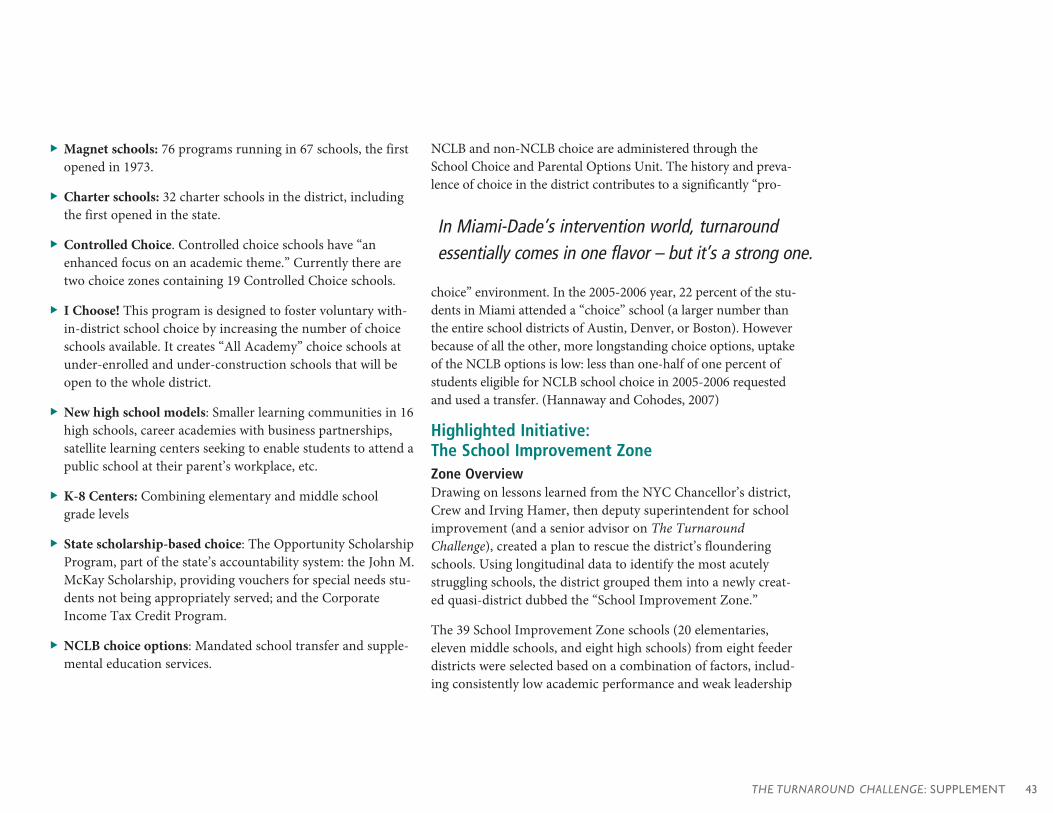
THE TURNAROUND CHALLENGE: SUPPLEMENT 43
Magnet schools: 76 programs running in 67 schools, the firstopened in 1973.
Charter schools: 32 charter schools in the district, includingthe first opened in the state.
Controlled Choice. Controlled choice schools have “anenhanced focus on an academic theme.” Currently there aretwo choice zones containing 19 Controlled Choice schools.
I Choose! This program is designed to foster voluntary with-in-district school choice by increasing the number of choiceschools available. It creates “All Academy” choice schools atunder-enrolled and under-construction schools that will beopen to the whole district.
New high school models: Smaller learning communities in 16high schools, career academies with business partnerships,satellite learning centers seeking to enable students to attend apublic school at their parent’s workplace, etc.
K-8 Centers: Combining elementary and middle school grade levels
State scholarship-based choice: The Opportunity ScholarshipProgram, part of the state’s accountability system: the John M.McKay Scholarship, providing vouchers for special needs stu-dents not being appropriately served; and the CorporateIncome Tax Credit Program.
NCLB choice options: Mandated school transfer and supple-mental education services.
NCLB and non-NCLB choice are administered through theSchool Choice and Parental Options Unit. The history and preva-lence of choice in the district contributes to a significantly “pro-
choice” environment. In the 2005-2006 year, 22 percent of the stu-dents in Miami attended a “choice” school (a larger number thanthe entire school districts of Austin, Denver, or Boston). Howeverbecause of all the other, more longstanding choice options, uptakeof the NCLB options is low: less than one-half of one percent ofstudents eligible for NCLB school choice in 2005-2006 requestedand used a transfer. (Hannaway and Cohodes, 2007)
Highlighted Initiative:The School Improvement Zone Zone OverviewDrawing on lessons learned from the NYC Chancellor’s district,Crew and Irving Hamer, then deputy superintendent for schoolimprovement (and a senior advisor on The TurnaroundChallenge), created a plan to rescue the district’s flounderingschools. Using longitudinal data to identify the most acutelystruggling schools, the district grouped them into a newly creat-ed quasi-district dubbed the “School Improvement Zone.”
The 39 School Improvement Zone schools (20 elementaries,eleven middle schools, and eight high schools) from eight feederdistricts were selected based on a combination of factors, includ-ing consistently low academic performance and weak leadership
ss
ss
ss
ss
In Miami-Dade’s intervention world, turnaroundessentially comes in one flavor – but it’s a strong one.
©2007 MASS INSIGHT44
capacity. Many of these schools had received failing grades fromthe state for over three consecutive academic years, but were notall designated for state takeover under NCLB. All Zone schoolsremain in the Zone for three years.
Zone reform mandates a high level of conformity among itsschools and their leaders on several important levels (discussedbelow). Though the reforms are not entirely inflexible,Superintendent Crew claims that this tighter, more centralized
reform structure is necessary given persistent, pervasive under-performing conditions. But in parallel with mandated reforms,Zone schools have been enhanced by higher teacher salaries,longer school days and years, more resources, and intensiveteacher training for the standards-based curricula.
The Zone also relies on sophisticated data-analysis. Using thesame long-term test-score data that helped identify the 39chronically under-performing schools, the system zeroed in on3,000 specific students who were struggling, but showed thepotential for better performance. Schools were helped to targetthese students to assist them in improving their scores.
Crew believes the Zone approach – rapid implementation of abroad strategy within a significant number of schools – was nec-essary to create critical mass to change the culture across the restof the district. “I learned that you need enough schools so thatyou can create a conversation about the rest of the system,”Crew says. “You need to be able to put enough energy into these
39 schools so that it impacts the shape and redesign of the dis-trict. It has to affect issues of staffing, and major issues like com-pensation and professional development. You have to haveenough size and scope so that you approximate the tipping pointof the organization. You need to have a wide enough statisticalfield so you can look at the concept with some objectivity andget a sense of the range of success.” (Farrell, 2005)
Zone Management DynamicsIn Miami-Dade’s intervention world, turnaround essentiallycomes in one flavor – but it’s a strong one. Bucking reformtheories holding that decentralization and autonomy at theschool level are necessary to achieve success, particularly inurban settings where schools are microcosms of their diverseneighborhoods, Miami’s central office retains control andmandates uniform interventions in Zone schools. Crewbelieves that bottom-up reform efforts are still “very vital,” buthe contends that the enormity of the problem calls for central-ized control. (Farrell, 2005)
More Structure than AutonomyMiami-Dade’s Zone emphasizes central office mandates ratherthan school autonomy. There is nothing piecemeal about theturnaround plan formed by the district, or about its implemen-tation. Unlike many previous districtwide urban educationreform efforts, Crew’s scheme immediately tackled underperfor-mance from a range of different angles. Zone policy mandateseverything from uniform curriculum, schedules, compensationand teacher training requirements. (For more on these, see thenext section.)
Given this control model, it is not surprising that Crew isstrongly opposed to hiring external partners to manage Zoneschools that continue to fail. Nor does he support the charteringof chronically failing schools, a suggestion promoted by theschool board president.
Miami-Dade’s School Improvement Zone continued
Prior to introduction of the Zone, there were asmany as eight different reading programs usedacross the district. Now the Zone mandates theuse of common literacy curricula.
THE TURNAROUND CHALLENGE: SUPPLEMENT 45
Local stakeholders like community partners and parents havebeen involved primarily in support roles. When they first imple-mented the Zone strategy, district leaders met with strategiccommunity partners such as after-school providers to help sup-port the holistic development of especially vulnerable students.In addition, the Miami-Dade district instituted the (first of itskind) Parent Academy in partnership with local universities andwith the financial support of a few large foundations. Thoughnot specifically part of the Zone strategy, development of parentcapacity across the district promises to help buttress the successof M-DCPS students both inside and outside the Zone.
Elements of Improvement Zone ReformZone schools are required to follow the reform plans set out bythe district. These cover most aspects of the “readiness to teach”side of the learning triangle discussed in other parts of thisreport, including:
Uniform core curricula: Prior to introduction of the Zone,there were as many as eight different reading programs usedacross the district. Now the Zone mandates the use of com-mon literacy curricula.
Intensive teacher development: A key component of theZone strategy was increasing the capacity of its teachers. All ofthe Zone’s teachers are required to attend 56 hours of profes-sional development per academic year, a much more rigorousrequirement than the 120 development hours per five yearsrequired for other Florida schoolteachers.
Capacity building for school leaders: Principals of Zoneschools also receive extensive professional development andmentoring. The District hosts two leadership institutes forprincipals that emphasize literacy and successful instructiontechniques and focus on the challenges specific to urban secondary schools.
The Zone reforms go further, requiring:
Longer learning day and learning year: Zone schools have bothan extended academic year (+10 days) and a longer school day(+1 hour), designed to support increased achievement despitechallenging circumstances. Schools use the extra time for inten-sive reading tutoring and test prep for struggling students.
Longer class periods: In addition, all Zone middle and highschools must implement block scheduling. The 100-minuteclass periods facilitate the type of intensive small-group litera-cy remediation required for students who performed at thelowest levels on the state’s standardized FCAT exam.
Support for key student transitions: To help ease what canoften be difficult transitions for students at key points in theirschooling, Zone schools introduced sixth and ninth gradeTransition Academies that focus on academic planning, studyhabits, career development, and FCAT preparation. In addi-tion, Zone schools provide personalized support for particu-larly vulnerable elementary children: third graders who havebeen retained as well as pre-kindergarten through secondgrade students who are not performing to capacity.
In contrast to the central role of the district in other matters, deci-sions relating to professional development are made at the schoollevel. Each Zone school elects a nine-member in-house profes-sional development team that includes the assistant principal, lit-eracy leader, and union representative. These teams are taskedwith creating a set of professional development options they feelwill meet the needs of the teachers at their particular school site.
ss
s
ss
s
Zone schools have both an extended academicyear (+10 days) and a longer school day (+1 hour), designed to support increasedachievement despite challenging circumstances.
©2007 MASS INSIGHT46
GovernanceMiami-Dade has carved out a new associate superintendentposition dedicated to running the School Improvement Zone.This position is advised and supported by the SchoolImprovement Zone University and Community Advisory Board.The advisory board, including university presidents, businessprofessionals, elected officials, clergy, and parents, serves as aworking group to help the Zone accomplish goals relating toteacher working environments, holistic child supports, and thepreparation of students for higher education and work.
Teacher ContractsLike “regular” district teachers, Zone teachers are districtemployees and union members. However the key elements ofthe Zone strategy required considerable changes to the condi-tions of teaching and learning within the sub-district. TheUnited Teachers of Dade (the teachers union) worked relativelycooperatively with Crew and his team in support of these newreforms. Some of this may well have been due to the timing ofthe reform, which came on the heels of a devastating scandalinvolving union leadership. Nonetheless, union support helpedfacilitate the successful implementation of the plan in January2005, enabling the adoption of several conditions-changinglinchpins of the Zone strategy, such as:
Increased incentives: Miami-Dade uses financial as well asother incentives to attract and retain high-quality veteran
teachers. Educator salaries are 20 percent higher in Zoneschools to compensate for longer work schedules, increasedprofessional development requirements, and a degree ofrelinquished autonomy in instructional matters, such as liter-acy curricula.
Personnel changes: One of the important strategic elementsof Zone reforms was that it enabled personnel changes at var-ious levels across the district. Fifteen of the 39 original Zoneschool principals were replaced. While Zone strategy aimedto attract highly qualified teachers, it did not necessarilyinvolve the strategic replacement of current teachers in Zoneschools. Instead, current teachers were offered the option toeither accept the new conditions required of Zone teachers(discussed above) or request a transfer to another non-Zoneschool. Though many teachers initially requested a transferout of the Zone, a substantial number of them changed theirminds when thousands of new applicants from across thecountry began to lobby for their former jobs.
Results to DateThe School Improvement Zone has been in place a year longerthan some of the other district turnaround experiments investi-gated for this report, so it is possible to get an early picture ofprogress under the model, which looks promising.
The results of the 2005 FCAT exam, administered just six weeksafter the union negotiations ended, were encouraging. At theend of the 2004-2005 school year, Miami’s Zone schools alsoreceived higher grades from the state than non-Zone schools.The more revealing 2006 results largely extended these trends.FCAT results demonstrated continued improvement both dis-trictwide and in Zone schools. The districtwide third throughtenth grade reading proficiency rate rose to 51 percent – a six-percentage-point jump over 2005 that pushed the percentage of
s
s
Miami-Dade’s School Improvement Zone continued
Miami-Dade’s School Improvement Zone was conceived, designed, and implemented within a couple of years – and gives signs ofreasonably significant, immediate impact onchildren’s learning.
THE TURNAROUND CHALLENGE: SUPPLEMENT 47
proficient readers in the District above 50 percent for the firsttime since the start of FCAT. In math, the District’s overall pro-ficiency rate rose to 55 percent. Twenty-two of the 39 schools inthe Zone earned a higher grade than in the previous year, echo-ing improvement across the district.
The percentage of Miami-Dade third graders reading at gradelevel rose to 71 percent in 2006. This collective 10-percentage-point increase over 2005 was fueled by a 17 percent jump inZone elementary schools. As a result, more than half the Zone’sthird graders – 55 percent – read at grade level by 2006. (Bycomparison, about a third of these Zone third graders were read-ing at grade level when the District launched the initiative.) Inmath, the percentage of Miami-Dade third graders scoring atgrade level rose to 69 percent. This collective six-point increaseover 2005 was similarly fueled by a Zone school increase of 10percent. These gains largely continued with the 2007 scores, withincreases in both reading and math scores at all grade levels test-ed, 3 through 10.
Strengths and Challenges of Miami-Dade’s Intervention ExperienceUrgency/Speed of TurnaroundMiami-Dade’s School Improvement Zone was conceived,designed, and implemented within a couple of years – and givessigns of reasonably significant, immediate impact on children’slearning. The track record in Miami undermines some reform-ers’ arguments that turnaround can take five to seven years toshow real progress. (See below for sustainability issues.)
Community Involvement: Important for the Long TermCritiques of Zone planning and implementation have sometimesfocused on the flip side of its rapidly implemented, top-downreform model: lack of local buy-in and limited communityinvolvement. Hamer, architect with Crew of the Zone policy,suggests that while the “fast turnaround” objectives of the initialZone reform did not allow time or resources for broader consul-tation and involvement, “this is a crucial piece to sustaining theZone’s success.” (School Leadership News, Spring 2006)
Building on Successful Union Partnership for Scale-upThe cooperation of the Dade teachers’ union was critical inchanging underlying conditions that allow Zone educators andadministrators to act in ways that put the interest of studentsfirst. One challenge is to extend some of the Zone operating con-ditions, like the 56 hours of professional development for everyZone teacher, to all Miami-Dade teachers.
SustainabilityBesides the issue of scaling up Zone terms and conditions to therest of the district, Crew also faces the question of how to sustainthe progress made in the Zone schools beyond the proposedthree-year “sunsetting” of the Zone. The district will need toaddress how schools will return to their original regional config-urations. Will they retain any of the extra professional develop-ment, the extended day and year, etc.? What supports can beprovided so that they and their students retain the progressthey’ve made?
The cooperation of the Dade teachers’ unionwas critical in changing underlying conditionsthat allow Zone educators and administrators toact in ways that put the interest of students first.
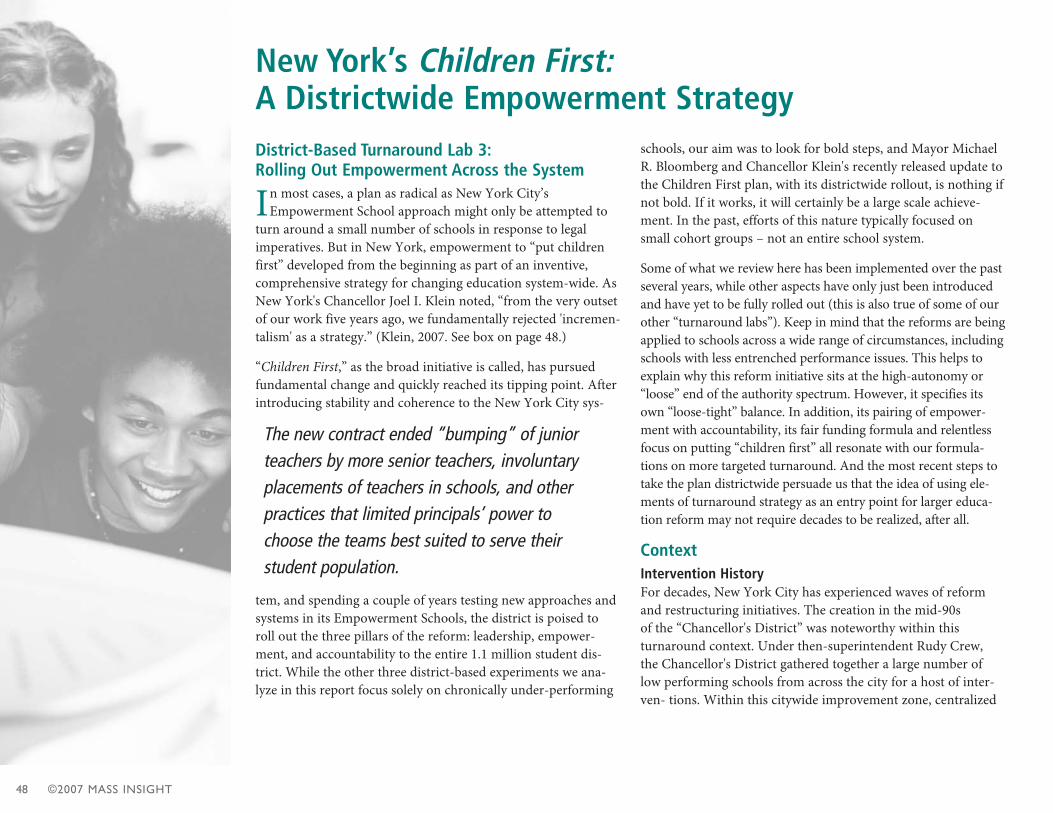
©2007 MASS INSIGHT48
District-Based Turnaround Lab 3:Rolling Out Empowerment Across the System
In most cases, a plan as radical as New York City’sEmpowerment School approach might only be attempted to
turn around a small number of schools in response to legalimperatives. But in New York, empowerment to “put childrenfirst” developed from the beginning as part of an inventive,comprehensive strategy for changing education system-wide. AsNew York's Chancellor Joel I. Klein noted, “from the very outsetof our work five years ago, we fundamentally rejected 'incremen-talism' as a strategy.” (Klein, 2007. See box on page 48.)
“Children First,” as the broad initiative is called, has pursuedfundamental change and quickly reached its tipping point. Afterintroducing stability and coherence to the New York City sys-
tem, and spending a couple of years testing new approaches andsystems in its Empowerment Schools, the district is poised toroll out the three pillars of the reform: leadership, empower-ment, and accountability to the entire 1.1 million student dis-trict. While the other three district-based experiments we ana-lyze in this report focus solely on chronically under-performing
schools, our aim was to look for bold steps, and Mayor MichaelR. Bloomberg and Chancellor Klein's recently released update tothe Children First plan, with its districtwide rollout, is nothing ifnot bold. If it works, it will certainly be a large scale achieve-ment. In the past, efforts of this nature typically focused onsmall cohort groups – not an entire school system.
Some of what we review here has been implemented over the pastseveral years, while other aspects have only just been introducedand have yet to be fully rolled out (this is also true of some of ourother “turnaround labs”). Keep in mind that the reforms are beingapplied to schools across a wide range of circumstances, includingschools with less entrenched performance issues. This helps toexplain why this reform initiative sits at the high-autonomy or“loose” end of the authority spectrum. However, it specifies itsown “loose-tight” balance. In addition, its pairing of empower-ment with accountability, its fair funding formula and relentlessfocus on putting “children first” all resonate with our formula-tions on more targeted turnaround. And the most recent steps totake the plan districtwide persuade us that the idea of using ele-ments of turnaround strategy as an entry point for larger educa-tion reform may not require decades to be realized, after all.
ContextIntervention HistoryFor decades, New York City has experienced waves of reformand restructuring initiatives. The creation in the mid-90s of the “Chancellor's District” was noteworthy within this turnaround context. Under then-superintendent Rudy Crew, the Chancellor's District gathered together a large number oflow performing schools from across the city for a host of inter-ven- tions. Within this citywide improvement zone, centralized
New York’s Children First:A Districtwide Empowerment Strategy
The new contract ended “bumping” of juniorteachers by more senior teachers, involuntaryplacements of teachers in schools, and otherpractices that limited principals’ power tochoose the teams best suited to serve theirstudent population.

THE TURNAROUND CHALLENGE: SUPPLEMENT 49
management, rather than local control, was the critical variableused to initiate, enforce and ensure the implementation of schoolimprovement. Just as the Chancellor's District was beginning toshow some signs of impact, however, yet another wave of changecame over the city.
This most recent, particularly intense period of change began in2002 when the New York state legislature granted MayorBloomberg direct control over the New York City public schoolsystem. The mayor appointed Joel Klein chancellor, and togetherthey began a two-stage reform process aimed at radicallyimproving the city's schools. (See more on the driving assump-tions of Children First, below.) In the first stage, they focused onbringing stability and coherence to the system. In 2003, the city's32 community school districts were eliminated. In their place,New York City's 1,400 schools were grouped into 10 regions,each led by an instructional superintendent – so fewer layersexisted between principals and the top district administrator.The DOE also adopted a coherent system-wide approach forinstruction in reading, writing and math. In a controversialmove, these changes swept away the Chancellor's District. Kleinmaintained that he had expanded implementation of many ofthe Chancellor's District strategies citywide, while critics say itwas a mistake to dismantle such a promising initiative. (Indeed,Miami-Dade recruited Rudy Crew in part to create a similarimprovement zone there.)
As part of its reform efforts, the department created theLeadership Academy to train new school leaders and worked withthe United Federation of Teachers (UFT) to bring major changesto the conditions under which New York City public schoolsoperate. The new contract with the UFT increased starting
teachers' salaries by 43% between 2002 and 2007, and ended“bumping” of junior teachers by more senior teachers, involuntaryplacements of teachers in schools, and other practices that limited
principals' power to choose the teams best suited to serve theirstudent population. It also gave the DOE the ability to create leadteacher positions with differential salaries; added a housing incen-tive for experienced math, science, and special education teachers;and streamlined the discipline and grievance procedure.
The Chancellor also launched a pilot program called the“Autonomy Zone.” Principals of these schools were given addition-al decision-making power over programs, personnel, and financesin exchange for signing performance contracts. This program waslater expanded into the Empowerment Schools initiative.
Current District Approaches to RestructuringAs part of widespread efforts to achieve system-wide change,there are a number of initiatives specifically aimed at chronicallyunder-performing schools and their populations:
NCLB Restructuring: For schools formally in NCLB restructuring, NYC uses a variety of strategies described inThe Turnaround Challenge as “providing help” approaches –providing a range of assistance including capacity-building,
s
Those with top ratings will receive bonuses for serving as demonstration sites for others. High-performing schools will also be eligible for additional funds for accepting struggling students from poor-performing schools.
©2007 MASS INSIGHT50
curricular reform, and data analysis, along with support fromexternal providers, without relinquishing managementresponsibility for the school.
Schools under Registration Review (SURR): New York Statehas a separate process for identifying failing schools under its own accountability system, one of the earliest, most com-prehensive and rigorous of such state identification efforts.As with NCLB restructuring (which overlaps), the SURR initiative is primarily using what we describe in the mainreport as “providing help” approaches with these schools.
Close and re-open/new small schools: NYC has aggressivelyused close-and-reopen to restructure failing schools, oftenindependent of any federal or state mandates. Sixteen largehigh schools have closed or are being closed, and 185 newsmall schools have opened the wake of these closures. Thesmall schools range from academically selective schools (oneis modeled after Boston Latin), trade schools, and some thatfocus on general improvement in the City's lowest-perform-ing high school buildings.
As with NCLB and SURR restructuring, NYC has madeheavy use of external partners in this work through interme-diaries such as New Visions for Public Schools, which hasreceived substantial Bill & Melinda Gates Foundation fund-ing for the high school work. An increasing number ofschools are run in conjunction with these school supportorganizations, which function as a partner to principals, providing instructional support and organizational design,but which are not accountable for performance.
Charter conversions: Charters and charter conversions mayalso be used as alternatives for failing schools. Currently thereare 60 charters in the City. A traditional district school canapply to the Chancellor to convert the school to a publiccharter with parental support. The state has nearly reached its
state charter cap (100), but conversions do not count againstthe cap. In 2005, Klein called for 50 more NYC charterschools by 2009.
Empowerment schools and Children First innovations: Inaddition to the specific restructuring programs just listed,aspects of NYC's Empowerment schools expansion and theentire Children First initiative can be seen to address aspectsof underperformance and radical change that in most dis-tricts are limited (if they exist at all) to specific programsaimed at schools already identified as failing. This initiative ishighlighted below.
Highlighted Initiative: Children FirstOverview: The Three Big IdeasHaving addressed stability and coherence in the first phase ofChildren First (as described in Intervention History above),phase two has moved on to a more radical set of integratedreforms, which its designers feel are needed to reorient educa-tion to put children's needs ahead of everything else. Thesereforms rest on three big ideas: those closest to the studentsshould get to make the key decisions about what will best helptheir students succeed; empowered schools must be accountablefor results; and schools should be able to count on funding thatis fair and transparent.
Empowerment: The Heart of the StrategyAt the start of the 2006-07 school year, NYC already had 332Empowerment Schools, the most tangible embodiment of theChildren First approach. In return for agreeing to becomeaccountable for achieving significant gains in student perform-ance, they have:
Greater authority over instructional decisions
More resources over the course of a four-year performanceagreement) and more discretion over spending
ss
s
ss
s
New York’s Children First Empowerment Strategy continued
THE TURNAROUND CHALLENGE: SUPPLEMENT 51
Fewer administrative requirements
Membership in a network of self-affiliated schools supportedby an integrated team of instructional and business staffselected by the schools.
These autonomies and support elements, including the requiredclusters of Empowerment schools, align fairly closely with therecommendations in The Turnaround Challenge.
In January, 2007, Mayor Bloomberg announced a significantthree-point expansion of “empowerment”:
Starting in 2007-8, all schools were given the power to selectfrom three types of School Support Organization: they canbecome full Empowerment Schools; partner with a LearningSupport Organization (LSO) led and operated by four accom-plished educational leaders; or choose to align with aPartnership Support Organization (PSO) -one of a number ofnot-for-profit organizations with a strong record of support-ing schools and communities. (More on this below.)
The central bureaucracy is being further reduced andresources are redirected to schools.
In order to empower school leaders, the district has launchedtwo additional initiatives to give them flexibility to recruit andkeep the best teachers: first, to make tenure an earned anddeserved honor rather than a right; and second, to provideschool leaders with additional support to address poorly per-forming teachers.
Accountability: Requirements for Empowerment SchoolsThe accountability system that is at the core of theEmpowerment School concept is now being implemented city-wide. The system includes three components:
Clear performance reporting to parents and all stakeholders.Schools will receive progress reports with a letter grade. Theywill be ranked with similar schools and compared to the City'sbest schools. Over time, a school's progress will be measuredand reported. The results of Quality Reviews, conducted by byteams of experienced educators, will also be reported to par-ents and stakeholders.
A broader set of tools to accurately measure and analyze stu-dent achievement, enabling teachers and principals to adjustinstruction accordingly. Schools will be provided with diag-nostic assessments and an achievement data system to trackprogress and analyze the results of changes in teaching.
Rewards for strong performance and consequences for chroniclow performance. Those with top ratings will receive bonusesfor serving as demonstration sites for others. High-performingschools will also be eligible for additional funds for acceptingstruggling students from poor performing schools. Schoolswith “D” and “F” ratings face a four-year cycle of target set-ting, planning, leadership changes, and ultimate restructuringor closure. The interventions will, according to the January2007 Children First report, be “aggressive.”
Fair Student FundingThe Children First plan asserts, “If we want principals to meet theneeds of each and every one of their diverse students, then ourfunding system also must treat students as individuals.” Theytherefore are joining the growing number of school districts that“fund the child.” Under such a system, all dollars follow the student
ss
s
ss
ss
s
“If we want principals to meet the needs ofeach and every one of their diverse students,then our funding system also must treat students as individuals.”
– Children First
©2007 MASS INSIGHT52
to the New York City public school he or she attends. Schoolsreceive a base allocation for each child, and additional dollars follow some students, based on their needs. The system is beingphased in to preserve core programs and services. The Fair StudentFunding system is meant to be equitable, and also easy to under-stand. The district promises that about two-thirds of a school'sbudget will be presented on a simple, single page.
Children First Management DynamicsMatching Autonomy with AccountabilityChildren First devolves far more autonomy and budgetary con-trol to individual schools, and in return demands greateraccountability for results. The three main components of theaccountability regime have been tested in Empowerment Schoolsand will be applied citywide during the 2007-8 school year:
Schools will be graded on the clarity of student performanceinformation provided to parents through tools such asprogress reports and quality reviews.
A broader set of diagnostic assessments will be utilized four to five times per year to measure and analyze studentachievement, as well as to adjust instruction.
• A powerful Web-based data management system will allowfor additional collaboration and customization of instruction.
• Intensive citywide support and training in the use of datatools is being provided citywide.
All schools are graded on an A-F scale based on outcomes,including year-to-year progress and how well they are doingcompared with schools that serve similar student populations.Schools receiving “D” or “F” grades face aggressive intervention,potentially culminating in closure.
Three Flavors of Decision-Making ControlA key to the entire NYC approach is the three levels of school-based control over decision-making described earlier, and thefact that principals were given, this year, the power to choosetheir desired “flavor.” Once again, they include the following:
Become an Empowerment School: These schools maintainauthority over key educational decisions including instruction
ss
s
New York’s Children First Empowerment Strategy continued
A Fundamental Rejection of “Incrementalism”
Given the departure that the system-wide approach of Children First represents, it is perhaps worth noting the assumptions that underlie the approach. The latest installment to the Children First plan explains it this way: “We call our plan Children First, and we meanit. Our goal is to focus everything we do on the only outcome that really matters: studentsuccess.” Throughout the report, descriptions of one radical systemic change after anotherare punctuated, like a drumbeat, with the end goal and justification: “Children First.”
In a speech to the Partnership for New York City the day after the plan was published,Chancellor Klein summarized the four “simple beliefs” at the heart of the Children First initiatives, past and projected. According to Klein, the plan's framers:
• “fundamentally reject incrementalism” in favor of bold action
• “fundamentally reject the notion that the challenges of urban education are insurmount-able in light of failures endemic to our society or the difficult circumstances surroundingthe lives of many students”
• “fundamentally reject the notion that we should ask our great educators to succeed with children but deny them the authority and resources to craft the most effective path to success”
• “fundamentally reject the notion that education” is “not compatible with meaningfulaccountability at every level.”

THE TURNAROUND CHALLENGE: SUPPLEMENT 53
professional development and scheduling. They also havegreater discretion over budget, access to significant additionaldiscretionary funding, authority to select their own adminis-trative support team and fewer administrative requirementsin return for more accountability for results.
Partner with one of the four internal district LearningSupport Organizations – distinct, differentiated supportorganizations.
Partner with an external Partnership Support Organization.An RFP process is being used to develop a market of qualifiednon-profits to provide support.
The first-year choices of NYC principals were released in 2007.Most principals (54 percent) chose to work with one of theinternal LSOs. Thirty-five percent chose to become anEmpowerment School, and 11% chose to work with a PSO.
GovernanceDespite enhanced autonomy, all schools will remain subject to direct public authority and control. The DOE will set the standards and hold schools accountable for achieving them.Responsibility for all employment decisions regarding profes-sional staff, including principals, remains with the DOE. All collective bargaining agreements continue to apply.
Teacher ContractsThe United Federation of Teachers has challenged a number ofaspects of Children First. But the union recently was able tocome to agreement with the district around some issues, includ-ing seniority, length of the work day, and hiring of principals, in
exchange for a pay raise. The district also replaced bumping andinvoluntary teacher placement with an “open market hiring sys-tem” under which more than 3,000 experienced teachers appliedfor open jobs and were selected by principals for vacancies acrossthe system. Two new initiatives were launched for the 2007-8school year:
Teacher tenure will no longer be routine and will instead be earned. Principals will be required to focus on how theysupport the development and evaluate the performance of new teachers. Principals’ judgments will be subject to external review.
Increased support will be provided to poorly performingtenured teachers. The UFT has already agreed to a new peerintervention program for struggling teachers, and two newsupport tools will be added.
• Teams of expert retired principals will observe and makerecommendations to struggling teachers.
• Where remediation fails, principals will be given additionalsupport to remove the lowest performers.s
s
ss
The union recently was able to come to agree-ment with the district around some issues,including seniority, length of the work day, andhiring of principals, in exchange for a pay raise.
©2007 MASS INSIGHT54
Results to DateAfter four years, results from Children First appear promising:improved academic achievement, higher graduation rates, saferschools, more high-quality school options, less bureaucracy,higher teacher salaries, new buildings, and huge increases in private support. Since Bloomberg and Klein took responsibilityfor the City’s public schools:
The percentage of fourth-graders passing state reading examshas increased by about12 points, compared to 4 points in therest of the state.
The percent of fourth-graders passing state math exams has increased by 22 points, compared to a six-point gain bystudents in the rest of the state.
The graduation rate has increased to the highest level in 20-plus years. 60% of students graduated on time in 2006, up from 50.8% in 2002.
As the Empowerment schools initiative is in its second year ofoperation, it is still too early to tell how successful it will be inraising student achievement. Empowerment schools recordedbaseline date in fall of 2006 and, like all New York City schools,received their first of a new-style graded Progress Report in sum-mer 2007. According to the DOE, the autonomy zone schoolsupon which the Empowerment initiative is based outperformedcitywide averages in their first year (2004-2005), and further
improved upon their past performance before entering the pilotprogram. In addition, according to the DOE, 85 percent ofschools (22 out of 26 participating schools) in the autonomy zonepilot program met their performance targets. (NYC Council,2007) The Council briefing paper notes that this statistic onlytakes into account 26 of the autonomy zone schools (rather thanthe 48 listed in DOE literature), and it is unclear how the remain-ing 22 autonomy zone schools faired in evaluations.
In the meantime, a recent survey of the pilot Empowermentschools indicates high levels of satisfaction from Empowermentschool principals: 92 percent feel the joining “has had a positiveor highly positive impact on their school community,” 88 per-cent say one of the benefits is “the increased time they have inschool,” 90 percent say that “overall classroom instruction hasimproved,” and 95 percent felt that being an EmpowermentSchool has “improved the use of data by teachers to informinstruction.” (NYC Department of Education, EmpowermentSchools, 2007)
Strengths and Challengesof New York’s Intervention ExperienceStrong Political FoundationClearly, the Children First initiative has benefited from the workof a proactive mayor and chancellor operating in a political context that is particularly conducive to reform. Thanks to thestrength of the mayor's and chancellor's power base followingBloomberg's landslide election, the successful conclusion of thetransit strike, and, because of term limits, the lack of need toplay for re-election, the team has had more latitude than mostcivic leaders to implement their plans.
ss
s
New York’s Children First Empowerment Strategy continued
An RFP process is being used to develop a market of qualified non-profits and other entitiesto provide support and technical assistance.
THE TURNAROUND CHALLENGE: SUPPLEMENT 55
Inventive ApproachThe roll-out phase of the most “empowering” parts of the initia-tive has just begun, but the scene-setting districtwide changeswere bold in themselves, and the additional bureaucratic reor-ganizations and distribution of autonomy will – if they proceedas planned – constitute some of the most significant systemicreform underway in any district in the country. The fact that it istaking place in the nation's single largest school district makes itall the more noteworthy. The district was recognized, in fact, asthe 2007 recipient of the Broad Prize for districtwide improve-ment in urban education.
Challenges of Middle ManagementAccording to district observers, the Chancellor has had chal-lenges with district middle management, which has resistedchange. However, the DOE culture is reported to have changedsubstantially over time. In particular, creation of the Office ofNew Schools – now called the Office of Portfolio Development –is credited with dealing with schools and outside providers innew ways and running interference for them with the widerbureaucracy. This office could serve as a model, in many ways,for the sub-district cluster and special district turnaround officeconcepts discussed in the main report.
Potential Risks of StreamliningEmpowerment and the resources to fund it have been created by streamlining existing bureaucratic support for schools, so there is some concern that the newly empowered schools may find that they spend more time and money replacing theservices and supports they had previously than focusing on children’s achievement.
Facilities ChallengesNew York City has done more than many other districts to makefacilities available, with both an active effort to reopen newschools in old buildings and a $250 million charter school facili-ties financing program. Facilities issues still represent a centralchallenge in many of the restructured new schools, however.
All of the elements of Children First represent a risk. In thewords of education historian Diane Ravitch, “No one knowswhat any of this means.” (New York Sun, June 7, 2007) But asdistrict leaders continually point out, the scale and urgency rep-resented by educational failure in New York City are staggering.The numbers make the challenges facing most states look smallby comparison. A total of 140,000 16-21 year old students havedropped out or are at risk of dropping out from current highschool classes. More than 60 percent of eighth graders are stillnot reading or doing math at grade level. The average AfricanAmerican, Latino and low-income high school student performsseveral grade levels below his or her peers and only one in fourof them ends up with a Regents Diploma. If nothing else, the dis-trict’s initiative certainly has shaken the status quo that con-tributed to this level of under-performance. Reformers and edu-cation leaders in districts and states nationwide will be watchingthe results of New York’s efforts closely.
The districtwidechanges, bureaucraticreorganizations, and distribution of autonomywill – if they proceed asplanned – constitutesome of the most significant systemicreform underway in anydistrict in the country.
©2007 MASS INSIGHT56
District-Based Turnaround Lab 4:A Blend of District Control and Outsourced School Management
Philadelphia’s portfolio of initiatives to turn around its moststruggling schools has been closely watched. The early
assessment: to date, improvement in general across the range ofapproaches, with the rate of improvement in the district’s cohortof privately managed schools no better than that of the districtas a whole, and in fact not as promising as the district’s owndirectly-managed restructured schools.
There are lessons to be learned from what has been called “thenation’s largest experiment in the private management of publicschools” (Gill, et al, 2007) – but probably not the ones educationreformers had wanted to see, at least not yet. Rather than
providing a true test of “private management,” the Philadelphiaexperience illustrates emerging outcomes of a hybrid governancesystem in which the district retains significant control over per-sonnel and budgets, while outsourcing to external partners a setof what’s been called “thin management” autonomies. The dis-trict – spurred by state action after being placed into a form ofstate receivership – deserves the credit and attention it has
received for conducting some extensive, out-of-the-box experiments. The conclusions that reformers will draw fromPhiladelphia’s portfolio approach will probably differ with theirunderlying opinions on the outsourcing of school management:proof that it does not work, to some, and proof that the district’shybrid governance model for the outsourced schools was flawed,to others.
ContextIntervention HistoryPhiladelphia’s experiment with the private management of pub-lic schools began in 2002 when, after years of low achievementand budget crises, the state of Pennsylvania launched a “friendlytakeover” of the 200,000-pupil district. District management wasturned over to the appointed School Reform Commission(SRC), the chair of which was granted a seven-year term – farexceeding that of the Governor who appointed him. The SRChired a new chief executive who proceeded to implement wide-ranging reforms, including:
Centralized mandatory core curriculum
Edison-based system of formative benchmark assessmentsevery six weeks
Standardized professional development for teachers based on the formative assessments
Extended learning time for struggling students
Upgrading the central office human resource function
Expanding and rationalizing contractual relationships with fee-for-service providers in professional developmentand curriculum
ss
ss
ss
Philadelphia’s Diverse Provider Model:The “Thin-Management” Theory, in Practice
The district’s basic strategy has been to intro-duce market forces through private contracts,charters, and university partnerships; to provide some intensive district support; and use the state takeover status to increaseflexibility from contractual obligations.
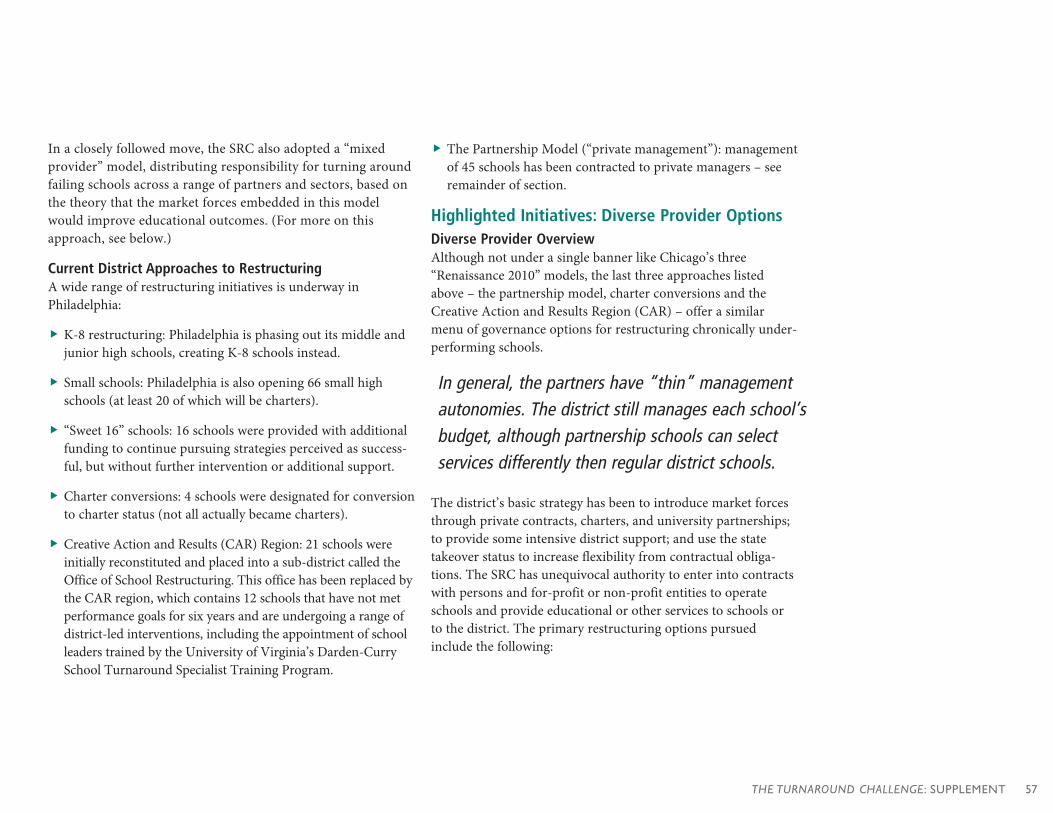
THE TURNAROUND CHALLENGE: SUPPLEMENT 57
In a closely followed move, the SRC also adopted a “mixedprovider” model, distributing responsibility for turning aroundfailing schools across a range of partners and sectors, based onthe theory that the market forces embedded in this modelwould improve educational outcomes. (For more on thisapproach, see below.)
Current District Approaches to RestructuringA wide range of restructuring initiatives is underway inPhiladelphia:
K-8 restructuring: Philadelphia is phasing out its middle andjunior high schools, creating K-8 schools instead.
Small schools: Philadelphia is also opening 66 small highschools (at least 20 of which will be charters).
“Sweet 16” schools: 16 schools were provided with additionalfunding to continue pursuing strategies perceived as success-ful, but without further intervention or additional support.
Charter conversions: 4 schools were designated for conversionto charter status (not all actually became charters).
Creative Action and Results (CAR) Region: 21 schools wereinitially reconstituted and placed into a sub-district called theOffice of School Restructuring. This office has been replaced bythe CAR region, which contains 12 schools that have not metperformance goals for six years and are undergoing a range ofdistrict-led interventions, including the appointment of schoolleaders trained by the University of Virginia’s Darden-CurrySchool Turnaround Specialist Training Program.
The Partnership Model (“private management”): managementof 45 schools has been contracted to private managers – seeremainder of section.
Highlighted Initiatives: Diverse Provider OptionsDiverse Provider OverviewAlthough not under a single banner like Chicago’s three“Renaissance 2010” models, the last three approaches listedabove – the partnership model, charter conversions and theCreative Action and Results Region (CAR) – offer a similarmenu of governance options for restructuring chronically under-performing schools.
The district’s basic strategy has been to introduce market forcesthrough private contracts, charters, and university partnerships;to provide some intensive district support; and use the statetakeover status to increase flexibility from contractual obliga-tions. The SRC has unequivocal authority to enter into contractswith persons and for-profit or non-profit entities to operateschools and provide educational or other services to schools orto the district. The primary restructuring options pursuedinclude the following:
s
ss
ss
s
In general, the partners have “thin” managementautonomies. The district still manages each school’sbudget, although partnership schools can select services differently then regular district schools.
©2007 MASS INSIGHT58
Partnership ModelBeginning in 2002, Philadelphia outsourced management of 45of the district’s 264 schools to seven external providers fromthree different sectors:
For-profit education management organizations: EdisonSchools, Victory Schools, Chancellor Beacon Academies
Local Universities: Temple University (Public) and Universityof Pennsylvania (Private)
Non-profits: Non-profit school management organizations,foundations, etc.
All schools in this original partnership model received addition-al per-pupil funding.
In reality, however, the Partnership School Model did not con-stitute the radical privatization experiment envisioned by some.Instead, the emphasis has been on partnership, with the districtand each of the multiple private organizations sharing responsi-bility for academic and operational aspects of low-performingschools. Perhaps not surprisingly, there has been significant con-fusion about responsibility and flexibility. In 2003, the district’ssecond RFP called for collaborative partnerships, within whichexternal providers, rather than managing whole schools, providea specific service for approximately $170 per pupil. (Drexel,Eastern, Franklin, Holy Family, Lock Haven, St. Joseph’s, theUniversity of Sciences, and K12 Inc won contracts in thisround.) In general, the partners have “thin” managementautonomies. The district still manages each school’s budget,although partnership schools can select services differently thanregular district schools. In addition, the district has exertedincreasing control over curriculum choices, time, facilities, spe-cial education, etc. (For more on district and provider responsi-bilities, see Management Dynamics section below.)
The partnership model was originally intended to be a “transi-tional” arrangement providing a bridge to full private manage-ment, but it has not evolved in this direction. In fact, since theschools that were served by the district’s own Office ofRestructuring Schools more or less outperformed most of thePartnership schools (as detailed below in the results section), thedistrict has continued to require many of its district reform ini-tiatives to apply to partnership schools as well.
Creative Action and Results (CAR) RegionThe district had also decided to reconstitute 21 low-performingschools, but retain responsibility for their management. Theseschools were supposed to act as a control group for the external-ly run schools. The restructured schools adopted instructionaland curricular changes such as block scheduling, a core curricu-lum, and additional professional development. They reducedclass sizes and extended learning hours. Some of the schoolswere assigned new principals and received additional money.After the Office of Restructured Schools, which managed these
21 schools, was shut down in 2005, the schools mostly dispersedback to their home regions, and a Creative Action and Results(CAR) Region was opened in its place to run the twelve “regu-lar” district schools that have continued to not meet AYP.
More recently, the district has implemented further managedinstructional programs that standardize curriculum and instruc-tional models, use data-driven instruction with six-week bench
ss
s
Philadelphia’s Diverse Provider Model continued
In reality, the Partnership School Model did notconstitute the radical privatization experimentenvisioned by some.
THE TURNAROUND CHALLENGE: SUPPLEMENT 59
marks and assessments, increase and standardize professionaldevelopment, and increase time in ELA and math. The districthas also recently moved to a site-selection process, allowingprincipals, school staff, and parents an expanded role in teacherselection when positions become available. Three-quarters of aschool’s staff have to agree to sever ties with the district’s tradi-tional hiring process to use site-based selection.
Charter SchoolsThe district converted one school to charter status and grantedthree schools “pre-charter” status. In parallel to the districtrestructured schools, additional per pupil funding was allocatedto the full-status charter school to implement a variety of reforms.The three pre-charter schools went to external managementorganizations. (These Talent Development Middle Schools werein fact told they were going to become independent charters, buttheir teachers balked because of impending removal from theunion. Thus, the district called them “transitional charters,”allowing them to remain in the district but be loosely managed.)
While chartering was part of the state’s and district’s plans fordiverse providers, its role in the scale of restructuring is notlarge. All told, Philadelphia has approximately 53 charterschools, but the rest are all new schools chartered by the localschool board, separate from the district’s restructuring efforts. Inany event, Pennsylvania’s charter school law does not grant thelevel of flexibility that laws in many other states do. For example,75 percent of a charter school’s faculty must be certified.Alternate routes to certification are lengthy and difficult. Thus,Pennsylvania charter schools are far more constrained in termsof hiring than those in many other states. District teachers, onthe other hand, may transfer to a charter school without losingtheir seniority, right of return, retirement and health benefits.Charter school staff can bargain collectively, but not as part ofthe district’s regular bargaining unit.
Diverse Provider Management DynamicsIn theory, the three options in the diverse provider spectrum(private EMOs, restructured district schools and charter restruc-tures) should have provided a clearly defined spread of gover-nance, autonomy, and decision-making in Philadelphia. In prac-tice, the niches that would have been occupied by the charterschools are underrepresented in the restructuring arena, and themanagement dynamics for the private partnerships and districtmanaged schools are more overlapping and complex.
AutonomyThe restructured CAR schools are still firmly under district con-trol. As mentioned above, the partnership schools only haveautonomy in certain areas, characterized as “thin” managementautonomies. Compared to Miami-Dade’s district-directedImprovement Zone approach, Philadelphia’s partnership initia-tive (along with potential charter reorganizations) provides a setof models that are midway out on the autonomy spectrum, stop-ping short of the more extensive authorities provided by Chicagoto its Ren-10 schools.
Decision-MakingDistrict-restructured CAR schools are subject to district-mandat-ed reforms, ranging from curriculum to scheduling, professionaldevelopment, and class size. Some were assigned new principalsby the central office. Recently, however, they have been offeredthe option of site-selection, which allows principals, school staffand parents an expanded role in teacher selection. Three quarters
Compared to Miami-Dade’s district-directedImprovement Zone approach, Philadelphia’s partnership initiative provides a set of models that are midway out on the autonomy spectrum.
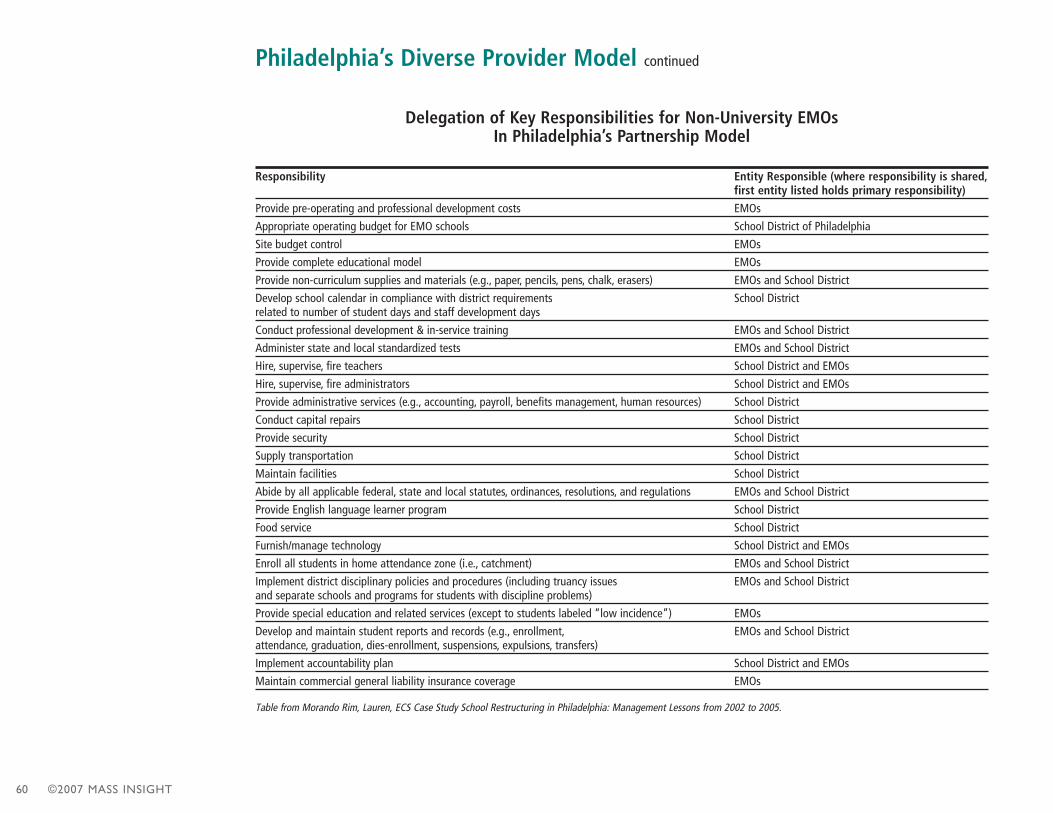
©2007 MASS INSIGHT60
Philadelphia’s Diverse Provider Model continued
Delegation of Key Responsibilities for Non-University EMOs In Philadelphia’s Partnership Model
Responsibility Entity Responsible (where responsibility is shared,first entity listed holds primary responsibility)
Provide pre-operating and professional development costs EMOs
Appropriate operating budget for EMO schools School District of Philadelphia
Site budget control EMOs
Provide complete educational model EMOs
Provide non-curriculum supplies and materials (e.g., paper, pencils, pens, chalk, erasers) EMOs and School District
Develop school calendar in compliance with district requirements School District related to number of student days and staff development days
Conduct professional development & in-service training EMOs and School District
Administer state and local standardized tests EMOs and School District
Hire, supervise, fire teachers School District and EMOs
Hire, supervise, fire administrators School District and EMOs
Provide administrative services (e.g., accounting, payroll, benefits management, human resources) School District
Conduct capital repairs School District
Provide security School District
Supply transportation School District
Maintain facilities School District
Abide by all applicable federal, state and local statutes, ordinances, resolutions, and regulations EMOs and School District
Provide English language learner program School District
Food service School District
Furnish/manage technology School District and EMOs
Enroll all students in home attendance zone (i.e., catchment) EMOs and School District
Implement district disciplinary policies and procedures (including truancy issues EMOs and School District and separate schools and programs for students with discipline problems)
Provide special education and related services (except to students labeled “low incidence”) EMOs
Develop and maintain student reports and records (e.g., enrollment, EMOs and School District attendance, graduation, dies-enrollment, suspensions, expulsions, transfers)
Implement accountability plan School District and EMOs
Maintain commercial general liability insurance coverage EMOs
Table from Morando Rim, Lauren, ECS Case Study School Restructuring in Philadelphia: Management Lessons from 2002 to 2005.
THE TURNAROUND CHALLENGE: SUPPLEMENT 61
of a school’s staff must agree to sever ties with the district’s tradi-tional hiring process to use site-based selection. Under thisoption, half the vacancies in a school can be filled by principalsinstead of the central office.
For EMO partnership schools, decision-making is shared withthe district. A summary of how key responsibilities are delegat-ed to non-university EMOs is provided in the table on theopposite page. Many of the university partners actually functionas something more akin to professional development providersthan whole-school managers.
GovernanceThe state’s takeover of the entire school district is the central fea-ture of the governance picture in Philadelphia. Pennsylvania cre-ated the School Reform Commission in place of the schoolboard, and the Governor appoints three of its members. In aunique partnership, the Mayor appoints the other two members.This board then hires the CEO and other district executives.
The district restructuring schools are managed by the district ina regional structure. The partnership schools have shared gover-nance with the EMO responsible for improving outcomes(although they do not have complete control of the factors thatcontribute to those outcomes) and the district central office ulti-mately retains responsibility for the schools.
Teacher ContractsStaff of the 45 partnership schools remain employees of the dis-trict. In addition, the 2004 teachers’ contract established theoption for school-based hiring of new teachers. The SRC won thisconcession by working hard to gain civic support for hiring andstaffing flexibility. State takeover also revoked the union’s right tostrike. Thus recent reforms have gone a long way toward disman-tling cumbersome hiring and seniority rights. The new processmay not be completely streamlined and efficient, nor does it
result in equity of staffing quality, but it provides a good dealmore hiring flexibility to principals than was the case in the past.
The district also has made impressive gains in hiring and retain-ing better qualified teachers, according to a range of analyses ofthe Philadelphia experiments that we reviewed, in part as a resultof the introduction of an improved human resources functionwith a stronger focus on teachers.
Results to DateWithin the district as a whole, performance has improved afterfour years of effort. The proportion of elementary and middle-school students achieving proficiency in reading and mathincreased substantially, albeit not spectacularly. From 2001-2002to 2005-2006, an additional 11 percent of fifth grade students
reached proficiency in reading and 23 percent reached proficien-cy in math, according to state tests. Similarly, an additional 20percent of eighth grade students reached proficiency in readingand 19 percent reached proficiency in math.
The four-year gains for Philadelphia’s low-achieving schools,however, which include the majority of schools in the district,were generally on par with gains from similar low-achievingschools in the rest of the state (with the exception thatPhiladelphia’s schools out-gained comparison schools in middle-school reading).
The new process may not be completely streamlined and efficient, nor does it result in equity of staffing quality, but it provides a good deal more hiring flexibility to principalsthan was the case in the past.
©2007 MASS INSIGHT62
Furthermore, according to an analysis published in February2007 by the RAND Corporation and Research for Action,improvement among students attending the privately managedschools kept pace with, but did not exceed, the achievementgains of students in the rest of the district. While significant aca-demic gains were made from 2002 to 2006 by students acrossPhiladelphia, the elementary and middle schools contracted outdid not achieve gains exceeding districtwide trends.
According to Rand, the major findings relating to achievementeffects under the diverse provider model in its first four yearscan be summarized as follows:
Privately managed schools (as a group): There were no sta-tistically significant effects, positive or negative, in readingor math, in any of the four years after takeover. Results byprovider type (universities, other non-profits, for-profits)show no statistically significant effects; neither do results forindividual providers, except for significantly negative resultsfor one provider in math and ELA and another in math.
Sweet 16 schools: There were no statistically significanteffects, positive or negative, in reading or math, in any of thefour years in which they received additional resources.
Restructured schools: There were significantly positiveeffects in math in all three years of implementation and inreading in the first year. In the fourth year, after the ORS
had been disbanded and the schools ceased receiving addi-tional resources, the former restructured schools maintaineda substantial (though only marginally significant statistically)effect in math.
Implications of these results, with caveats, include:
1. “Thin management” does not seem to have provided a leverfor improvements above and beyond the norm, at least as ithas been implemented in Philadelphia. While JolleyChristman, co-founder of Research for Action, contends “ourfindings show the investment in private management ofschools has not paid the expected dividends,” others argue thereal problem is that not enough autonomy was given.Advocates for private management of public schools say theapproach works best when private managers have full controlof campuses and parents decide where to enroll their children— measures that were not fully implemented in Philadelphia.In addition, some contend that the schools most at risk –those with the very worst scores, leadership, and teaching per-sonnel – were chosen to be contracted out, making compari-son with those in district restructuring unfair.
2. Philadelphia’s in-district school restructuring efforts seem tohave proven more effective than expected. There is somespeculation, as mentioned above, that the reason the dis-trict’s scores increased so much is because the districtfarmed out their worst schools to EMOs, letting the districtfocus on a smaller number of slightly higher performingschools. Some observers say the district placed its strongestprincipals in the restructured schools and gave them time toprepare for the initial year of work, as opposed to the EMOs,which didn’t receive their contracts until the summer beforethe initial school year started.
ss
s
Philadelphia’s Diverse Provider Model continued
The state takeover established a nimble SchoolReform Commission that was able to institutereforms quickly and gave then-CEO Paul Vallasthe ability to pursue his reform efforts withoutnoticeable bureaucratic delay.
THE TURNAROUND CHALLENGE: SUPPLEMENT 63
Strengths and Challengesof Philadelphia’s Intervention ExperienceBenefits of the State’s Initial PushThe state takeover established a nimble School ReformCommission that was able to institute reforms quickly and gavethen-CEO Paul Vallas the ability to pursue his reform effortswithout noticeable bureaucratic delay. However, political, logis-tical and local pressures still exert significant pressures thatshape how initiatives play out (e.g. the evolution of the thinmanagement model). Vallas recently departed to become headof the New Orleans public schools, a move that many attrib-uted at least partly to constant battling over Philadelphia’s sig-nificant budget shortfalls.
Special Office for Private Management SupportThe district established a development office whose purpose is toclear bureaucratic obstacles for external providers. Philadelphia’sexperience in contracting has confirmed that if a district choosesto contract out services, it should a) allocate time and financialresources for planning and implementing the process of privatemanagement; b) hire professionals who are expert in designingand managing contracts (a skill set that is quite new in manyregards for public education;) and c) articulate in detail what itrequires of the providers (see next point).
The Challenge of Role ConfusionSignificant confusion has occurred in Philadelphia around theroles and responsibility of the external providers. In more recentcontracts, the district gives more authority to the contractors,and also spells out performance clauses more clearly. Explicitmeans of assessing provider performance forms the basis fordecisions relating to renewing or terminating contracts, as well asproviding evidence of accountability to the broader community– a good step forward.
The Costs of OutsourcingOne lesson from Philadelphia’s experience is that contractingout services has not resulted in any cost savings. In Philadelphia,the for-profit and non-profit external management fees havebeen a source of on-going controversy, and have been caughtup in the district’s overall financial challenges (the districtbegan 2006-7 with a previously unknown $80 million deficit).
It is possible that the costs of outsourcing in Philadelphia sim-ply reflect the expense of doing reform work. It is also probablethat the marketplace among providers here (as is the case virtu-ally everywhere) was not well enough developed to keep initialcosts down. The cost of building capacity among the “resourcebase” of potential external partners is an issue that state anddistrict reformers will need to keep fully in mind, if they pursuesuch a strategy.
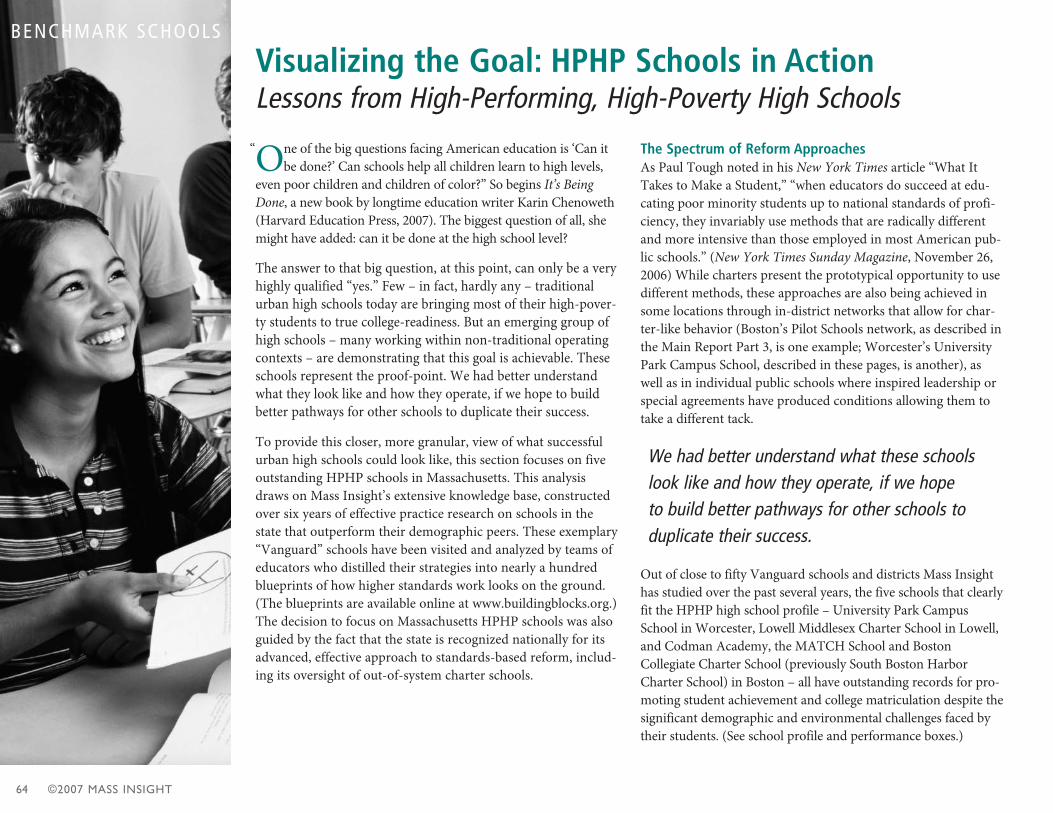
©2007 MASS INSIGHT64
One of the big questions facing American education is ‘Can itbe done?’ Can schools help all children learn to high levels,
even poor children and children of color?” So begins It’s BeingDone, a new book by longtime education writer Karin Chenoweth(Harvard Education Press, 2007). The biggest question of all, shemight have added: can it be done at the high school level?
The answer to that big question, at this point, can only be a veryhighly qualified “yes.” Few – in fact, hardly any – traditionalurban high schools today are bringing most of their high-pover-ty students to true college-readiness. But an emerging group ofhigh schools – many working within non-traditional operatingcontexts – are demonstrating that this goal is achievable. Theseschools represent the proof-point. We had better understandwhat they look like and how they operate, if we hope to buildbetter pathways for other schools to duplicate their success.
To provide this closer, more granular, view of what successfulurban high schools could look like, this section focuses on fiveoutstanding HPHP schools in Massachusetts. This analysisdraws on Mass Insight’s extensive knowledge base, constructedover six years of effective practice research on schools in thestate that outperform their demographic peers. These exemplary“Vanguard” schools have been visited and analyzed by teams ofeducators who distilled their strategies into nearly a hundredblueprints of how higher standards work looks on the ground.(The blueprints are available online at www.buildingblocks.org.)The decision to focus on Massachusetts HPHP schools was alsoguided by the fact that the state is recognized nationally for itsadvanced, effective approach to standards-based reform, includ-ing its oversight of out-of-system charter schools.
The Spectrum of Reform ApproachesAs Paul Tough noted in his New York Times article “What ItTakes to Make a Student,” “when educators do succeed at edu-cating poor minority students up to national standards of profi-ciency, they invariably use methods that are radically differentand more intensive than those employed in most American pub-lic schools.” (New York Times Sunday Magazine, November 26,2006) While charters present the prototypical opportunity to usedifferent methods, these approaches are also being achieved insome locations through in-district networks that allow for char-ter-like behavior (Boston’s Pilot Schools network, as described inthe Main Report Part 3, is one example; Worcester’s UniversityPark Campus School, described in these pages, is another), aswell as in individual public schools where inspired leadership orspecial agreements have produced conditions allowing them totake a different tack.
Out of close to fifty Vanguard schools and districts Mass Insighthas studied over the past several years, the five schools that clearlyfit the HPHP high school profile – University Park CampusSchool in Worcester, Lowell Middlesex Charter School in Lowell,and Codman Academy, the MATCH School and BostonCollegiate Charter School (previously South Boston HarborCharter School) in Boston – all have outstanding records for pro-moting student achievement and college matriculation despite thesignificant demographic and environmental challenges faced bytheir students. (See school profile and performance boxes.)
Visualizing the Goal: HPHP Schools in ActionLessons from High-Performing, High-Poverty High Schools
We had better understand what these schoolslook like and how they operate, if we hope to build better pathways for other schools toduplicate their success.
“
BENCHMARK SCHOOLS
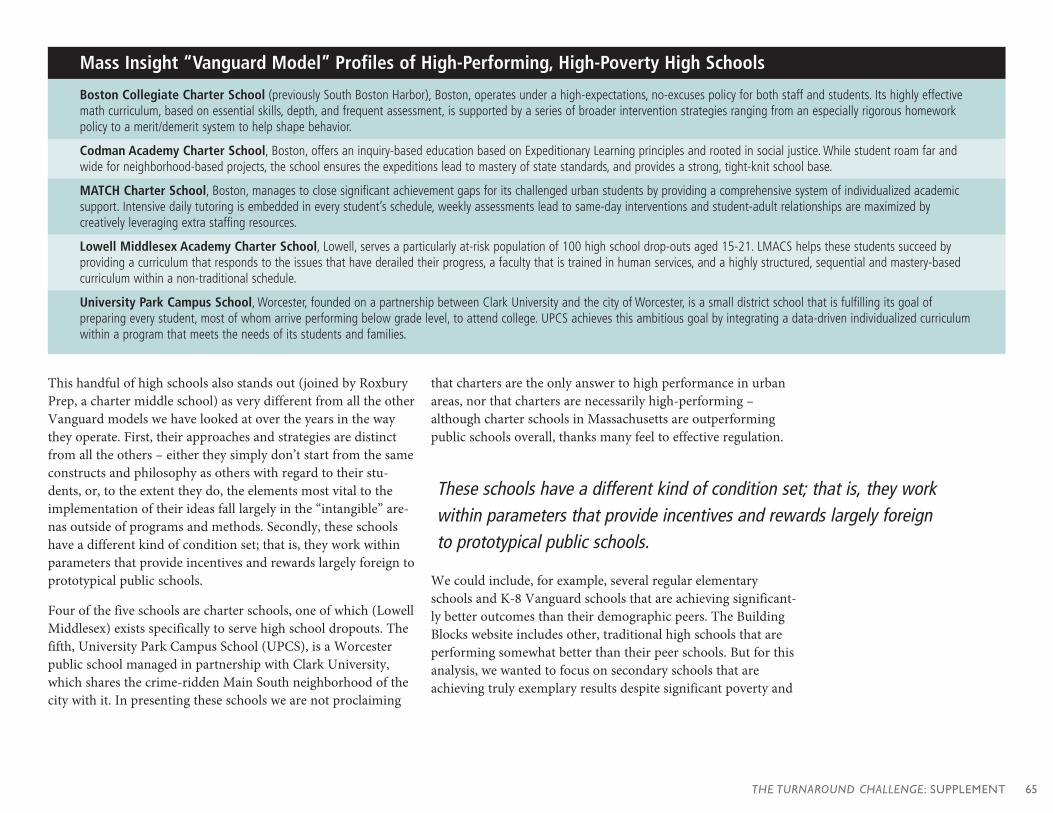
THE TURNAROUND CHALLENGE: SUPPLEMENT 65
This handful of high schools also stands out (joined by RoxburyPrep, a charter middle school) as very different from all the otherVanguard models we have looked at over the years in the waythey operate. First, their approaches and strategies are distinctfrom all the others – either they simply don’t start from the sameconstructs and philosophy as others with regard to their stu-dents, or, to the extent they do, the elements most vital to theimplementation of their ideas fall largely in the “intangible” are-nas outside of programs and methods. Secondly, these schoolshave a different kind of condition set; that is, they work withinparameters that provide incentives and rewards largely foreign toprototypical public schools.
Four of the five schools are charter schools, one of which (LowellMiddlesex) exists specifically to serve high school dropouts. Thefifth, University Park Campus School (UPCS), is a Worcesterpublic school managed in partnership with Clark University,which shares the crime-ridden Main South neighborhood of thecity with it. In presenting these schools we are not proclaiming
that charters are the only answer to high performance in urbanareas, nor that charters are necessarily high-performing –although charter schools in Massachusetts are outperformingpublic schools overall, thanks many feel to effective regulation.
We could include, for example, several regular elementaryschools and K-8 Vanguard schools that are achieving significant-ly better outcomes than their demographic peers. The BuildingBlocks website includes other, traditional high schools that areperforming somewhat better than their peer schools. But for thisanalysis, we wanted to focus on secondary schools that areachieving truly exemplary results despite significant poverty and
Mass Insight “Vanguard Model” Profiles of High-Performing, High-Poverty High Schools
Boston Collegiate Charter School (previously South Boston Harbor), Boston, operates under a high-expectations, no-excuses policy for both staff and students. Its highly effectivemath curriculum, based on essential skills, depth, and frequent assessment, is supported by a series of broader intervention strategies ranging from an especially rigorous homeworkpolicy to a merit/demerit system to help shape behavior.
Codman Academy Charter School, Boston, offers an inquiry-based education based on Expeditionary Learning principles and rooted in social justice. While student roam far andwide for neighborhood-based projects, the school ensures the expeditions lead to mastery of state standards, and provides a strong, tight-knit school base.
MATCH Charter School, Boston, manages to close significant achievement gaps for its challenged urban students by providing a comprehensive system of individualized academicsupport. Intensive daily tutoring is embedded in every student’s schedule, weekly assessments lead to same-day interventions and student-adult relationships are maximized by creatively leveraging extra staffing resources.
Lowell Middlesex Academy Charter School, Lowell, serves a particularly at-risk population of 100 high school drop-outs aged 15-21. LMACS helps these students succeed byproviding a curriculum that responds to the issues that have derailed their progress, a faculty that is trained in human services, and a highly structured, sequential and mastery-basedcurriculum within a non-traditional schedule.
University Park Campus School, Worcester, founded on a partnership between Clark University and the city of Worcester, is a small district school that is fulfilling its goal of preparing every student, most of whom arrive performing below grade level, to attend college. UPCS achieves this ambitious goal by integrating a data-driven individualized curriculumwithin a program that meets the needs of its students and families.
These schools have a different kind of condition set; that is, they workwithin parameters that provide incentives and rewards largely foreign to prototypical public schools.
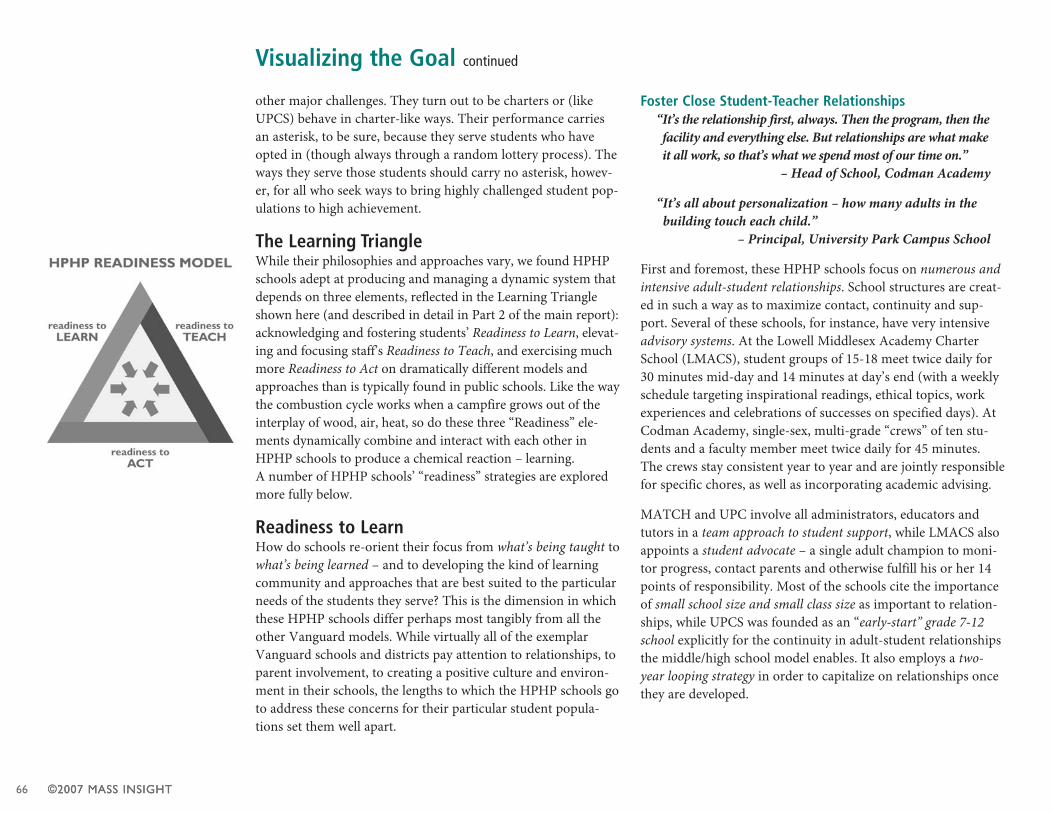
©2007 MASS INSIGHT66
other major challenges. They turn out to be charters or (likeUPCS) behave in charter-like ways. Their performance carriesan asterisk, to be sure, because they serve students who haveopted in (though always through a random lottery process). Theways they serve those students should carry no asterisk, howev-er, for all who seek ways to bring highly challenged student pop-ulations to high achievement.
The Learning TriangleWhile their philosophies and approaches vary, we found HPHPschools adept at producing and managing a dynamic system thatdepends on three elements, reflected in the Learning Triangleshown here (and described in detail in Part 2 of the main report):acknowledging and fostering students’ Readiness to Learn, elevat-ing and focusing staff’s Readiness to Teach, and exercising muchmore Readiness to Act on dramatically different models andapproaches than is typically found in public schools. Like the waythe combustion cycle works when a campfire grows out of theinterplay of wood, air, heat, so do these three “Readiness” ele-ments dynamically combine and interact with each other inHPHP schools to produce a chemical reaction – learning. A number of HPHP schools’ “readiness” strategies are exploredmore fully below.
Readiness to LearnHow do schools re-orient their focus from what’s being taught towhat’s being learned – and to developing the kind of learningcommunity and approaches that are best suited to the particularneeds of the students they serve? This is the dimension in whichthese HPHP schools differ perhaps most tangibly from all theother Vanguard models. While virtually all of the exemplarVanguard schools and districts pay attention to relationships, toparent involvement, to creating a positive culture and environ-ment in their schools, the lengths to which the HPHP schools goto address these concerns for their particular student popula-tions set them well apart.
Foster Close Student-Teacher Relationships“It’s the relationship first, always. Then the program, then thefacility and everything else. But relationships are what makeit all work, so that’s what we spend most of our time on.”
– Head of School, Codman Academy
“It’s all about personalization – how many adults in thebuilding touch each child.”
– Principal, University Park Campus School
First and foremost, these HPHP schools focus on numerous andintensive adult-student relationships. School structures are creat-ed in such a way as to maximize contact, continuity and sup-port. Several of these schools, for instance, have very intensiveadvisory systems. At the Lowell Middlesex Academy CharterSchool (LMACS), student groups of 15-18 meet twice daily for30 minutes mid-day and 14 minutes at day’s end (with a weeklyschedule targeting inspirational readings, ethical topics, workexperiences and celebrations of successes on specified days). AtCodman Academy, single-sex, multi-grade “crews” of ten stu-dents and a faculty member meet twice daily for 45 minutes.The crews stay consistent year to year and are jointly responsiblefor specific chores, as well as incorporating academic advising.
MATCH and UPC involve all administrators, educators andtutors in a team approach to student support, while LMACS alsoappoints a student advocate – a single adult champion to moni-tor progress, contact parents and otherwise fulfill his or her 14points of responsibility. Most of the schools cite the importanceof small school size and small class size as important to relation-ships, while UPCS was founded as an “early-start” grade 7-12school explicitly for the continuity in adult-student relationshipsthe middle/high school model enables. It also employs a two-year looping strategy in order to capitalize on relationships oncethey are developed.
Visualizing the Goal continued
©2007 MASS INSIGHT
THE TURNAROUND CHALLENGE: SUPPLEMENT 67
Promote the “School as Community” Construct“We’re competing against a lot of negative pressures these
kids have in their lives – crime, drugs, gangs. So in a way,we’re trying to make Codman be the gang.”
– Head of School, Codman
The approaches these schools take involve not only weaving aweb of relationships to and from each student but also creatingstrong community constructs for the school as a whole –stronger than traditional public schools, and many private onesas well. Codman exemplifies this approach, with its fostering of“the Codman way.” The school has developed all-encompassingrituals and traditions, even its own vocabulary (with “crews”instead of advisories, “community circle” instead of all-schoolmeeting, etc.) The mandatory Codman Saturday School programheld ten Saturdays per semester offers group enrichment, whichis seen as valuable in its own right, but is also intended to exposestudents to the Codman culture six days most weeks. “When youare here until 5 pm every weekday and half the day on Saturday,it makes it very difficult to hold on to your old friends and yourold life,” explains the principal. “This becomes like a boardingschool. We want kids to bond with each other, to keep eachother on the right track.”
Other Vanguard HPHP schools like UPCS and SBC have theirown versions of these constructs. While less extensive, their con-structs are still novel enough for these districts, like Codman, tofeel the need for week-long acculturation programs prior to thestart of the year for entering students.
Make Expectations Explicit – and Enlist Students to Transmit Them
“Fifth graders for the first few weeks are in shell-shock,”because the behaviors that earn demerits were never asclosely monitored in their previous schools.
– Principal, Boston Collegiate
The advance acculturation programs also begin the process theHPHP schools use to make explicit their expectations for behav-ior and academic achievement. LMACS has its “non-negotiablerules and policies,” Boston Collegiate has a full merit and demeritsystem, and a weekly individual demerit sheet that travels, alongwith a class behavior rubric, from teacher to teacher throughoutthe day.
Codman focuses more on academic expectations, which theyacknowledge come as a “culture shock” to most entering stu-dents. Incoming freshman receive a booklet of advice lettersprepared the previous June by students just completing theirfirst year, providing an unvarnished view of what is to come.They also attend a summertime dinner and listen to these now-experienced students talk about the school and its culture ofconsiderably higher expectations. By their first day of class, theyhave already had significant contact with the school and haveheard in meaningful ways what to expect. (See family involve-ment section below.)
Focus on Psycho-Social Needs“We just think social/emotional health is vital and that[this work] has to be done. Instead of bus monitors andlunch ladies and paraprofessionals, we have social workers.”
– Head of School, Codman
Educators at these schools generally see their students as moti-vated to succeed but beset by circumstances that can interferewith their academic achievement. At LMACS, which serves apopulation of high school drop-outs aged 15-21, all of the full-time faculty have experience and/or formal training in humanservices to enhance their understanding of their students’ chal-lenges. The school also supplements the main curriculum with“psycho-educational courses” such as life skills, non-violent con-flict resolution and parenting. Codman employs a full-time socialworker to address the non-academic needs of both the students
©2007 MASS INSIGHT68
and their families, including job training, child care or healthservices. UPCS also provides services for parents, such as GEDand ESL programs.
Require Involvement by Parents and Caregivers“Getting it right from the beginning is so important… We want to get them talking, telling us the story.”
– Head of School, Codman
Most of these schools require parental involvement – evenbefore students enter. UPCS and Codman both have a mandatorypre-enrollment meeting. Codman, in fact, makes three positivecontacts with parents before the opening of school. The mostimportant is an extensive intake interview, typically at least anhour with the family, including time with the student and par-ent/guardian together, and then each separately. The first ques-tion is always “Tell me the story of your child’s name.” Head ofSchool Meg Campbell explains: “Names bring up so much: afamily history, their aspirations for their child…” The secondquestion: “What are your goals and dreams for your child?”Students are asked to assess their own learning style, strengthsand challenges. Parents are asked to comment on the student’shome and life experiences. When necessary, Codman’s socialworker helps the family find resources for identified needs.
All the schools prioritize on-going communication with parentsas well, including weekly calls at MATCH and University Park,and home visits from advisors at Boston Collegiate. While all theschools make significant efforts to attract family involvement,Codman reinforces their incentives with negative consequences aswell: parents failing to attend required parent-teacher meetingslose the right to subsidized public transportation passes for theirchild for the following term.
Readiness to TeachOn the surface, HPHP schools’ attention to the readiness toteach side of the learning triangle developed for this report looksmore similar to the efforts put forth by their colleagues at lesschallenged schools. Like any school attempting to improve stan-dards, they need to incorporate curricular focus and data-drivendifferentiated instruction, and to develop effective interventionsfor students needing special help. And in order to achieve any ofthis, they need to foster a collaborative teaching atmosphere.
There is, of course, more than one route to successful teachingand learning, particularly given different audiences. TheseHPHP schools carefully design their instructional programs toensure that they address the needs of their students. ThusLMACS provides its older, dropout students with a clear,sequential program that is self-paced and focuses on skill mas-tery. Similarly, Boston Collegiate uses a highly structured mathprogram with in-depth focus on essential concepts and skillsand lots of repetition.
Codman, on the other hand, offers inquiry-based expeditionarylearning, based around the big questions that require criticalthinking, gathering research and working in groups. Yet theschool works very hard to ensure that the students are indeedmastering the required learning standards through their proj-ects, and gains a tremendous advantage in terms of relevance asstudents pursue their learning by interacting with the real worldaround them.
But on looking closer, it is also clear that the HPHP schoolsapproach the readiness to teach dimension with more intensitythan many other schools. This seems particularly true withregard to a few key domains, including sheer time allotted forteaching, the link between frequent assessment and individual-ized instruction, and human capacity issues relating to theirteaching force.
Visualizing the Goal continued
©2007 MASS INSIGHT
THE TURNAROUND CHALLENGE: SUPPLEMENT 69
Provide More Time in Which to Teach and LearnMany of the students at these five high schools arrive up to sev-eral years behind grade level in basic skills. Consequently, theseHPHP schools spend more time teaching than their standardcounterparts. MATCH extends its “regular” day to include twomandatory small-group tutoring periods for all. UPCS’s day runsfrom 8:00 to 4:00, with additional before and after school ses-sions from 7:30 to 6:00. Boston Collegiate has similarly longhours, along with a longer year (45 weeks for teachers, plus tenpaid professional development days). Codman adds mandatorySaturday classes.
Individual schools also schedule the time the students have inways they feel are most productive. LMACS tailors its unortho-dox schedule of late starts and finishes to its older, less tradition-al population. Codman schedules in large time blocks to allow forschoolwide, class and individual projects. Students are providedone full day a week for site explorations, and two days a monthfor interning activities. Several other schools use 60 or 90 minuteteaching block as well, in order to accommodate individualizedinstruction. Virtually all of the leaders of these schools stress thatthey use the extra time not simply to offer more of the same kindof instruction; they use it to construct dramatically differentschool-day schedules that suit the goals of their school and theneeds of their students.
Use Frequent Assessment to Individualize Instruction“We teach students, not material.” – Teacher, UPCS
While data-driven instruction is a cornerstone of school reform,some of these HPHP schools implement this strategy with a spe-cial intensity. Every Friday morning from 8:30 to 9:40 MATCHSchool students take five weekly assessments on the material theywere taught that week. Tutors grade the assessment immediatelywhile students attend the Schoolwide Assembly. Students whopass all five parts are dismissed at 11:30; those who pass four outof five are dismissed at 12:30; all others stay until 2:30. This time
is used to provide immediate individualized intervention on top-ics students had trouble with. The assessments also triggeradjustments to the general instruction for the following week.
UPCS also collects voluminous data on performance, which ituses to inform instruction. (See next page for a flowchart depict-ing the school’s approach.) As part of this approach, UPCS stu-dents use an electronic assessment/feedback system 20 minutes aday to help monitor performance. The program provides indi-vidualized progress reports that allow both students and teachersto determine where each student needs help.
LMACS developmental math program includes frequent assess-ments at the end of individualized tutorials, and progress checksare administered to all students every Thursday to assess theirunderstanding. Boston Collegiate also has structured weeklyassessments designed to catch problems for individual studentsbefore they compound. Even Codman’s expeditionary learningprojects have built-in periodic assessments to keep instructionon track and emphasize student accountability.
Pay Extreme Attention to Human CapitalThese HPHP schools also do some things differently when itcomes to finding and supporting the teachers they connect theirstudents with. Many look for individuals who are particularlysuited to working with the challenging populations they serve.LMACS, as previously mentioned, hires only people with socialservices experience or qualifications. Boston Collegiate, like theothers, focuses on the mission of the school “to prepare each stu-dent for college” and makes it clear that this means all students,even if that means teachers need to put in longer hours.
Codman recruits teachers who are motivated to build their owncurricula around their interests and those of their students.MATCH takes an unusual approach with its MATCH Corpstutors, recruiting young, highly motivated and accomplishedrecent college graduates.
Virtually all of the lead-ers of these schoolsstress that they use theextra time not simply tooffer more of the samekind of instruction; theyuse it to construct dramatically differentschool-day schedules.
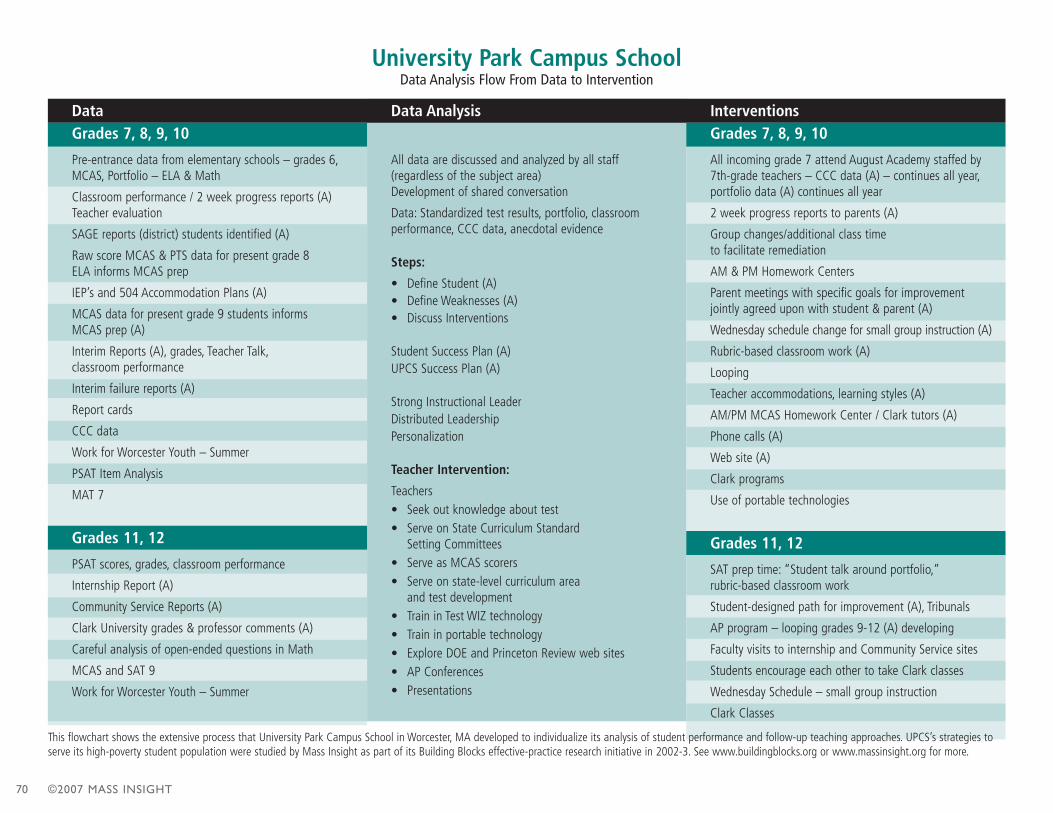
©2007 MASS INSIGHT70
University Park Campus SchoolData Analysis Flow From Data to Intervention
DataGrades 7, 8, 9, 10
Pre-entrance data from elementary schools – grades 6,MCAS, Portfolio – ELA & Math
Classroom performance / 2 week progress reports (A)Teacher evaluation
SAGE reports (district) students identified (A)
Raw score MCAS & PTS data for present grade 8 ELA informs MCAS prep
IEP’s and 504 Accommodation Plans (A)
MCAS data for present grade 9 students informs MCAS prep (A)
Interim Reports (A), grades, Teacher Talk,classroom performance
Interim failure reports (A)
Report cards
CCC data
Work for Worcester Youth – Summer
PSAT Item Analysis
MAT 7
Grades 11, 12
PSAT scores, grades, classroom performance
Internship Report (A)
Community Service Reports (A)
Clark University grades & professor comments (A)
Careful analysis of open-ended questions in Math
MCAS and SAT 9
Work for Worcester Youth – Summer
InterventionsGrades 7, 8, 9, 10
All incoming grade 7 attend August Academy staffed by7th-grade teachers – CCC data (A) – continues all year,portfolio data (A) continues all year
2 week progress reports to parents (A)
Group changes/additional class time to facilitate remediation
AM & PM Homework Centers
Parent meetings with specific goals for improvementjointly agreed upon with student & parent (A)
Wednesday schedule change for small group instruction (A)
Rubric-based classroom work (A)
Looping
Teacher accommodations, learning styles (A)
AM/PM MCAS Homework Center / Clark tutors (A)
Phone calls (A)
Web site (A)
Clark programs
Use of portable technologies
Grades 11, 12
SAT prep time: “Student talk around portfolio,”rubric-based classroom work
Student-designed path for improvement (A), Tribunals
AP program – looping grades 9-12 (A) developing
Faculty visits to internship and Community Service sites
Students encourage each other to take Clark classes
Wednesday Schedule – small group instruction
Clark Classes
Data Analysis
All data are discussed and analyzed by all staff (regardless of the subject area) Development of shared conversation
Data: Standardized test results, portfolio, classroom performance, CCC data, anecdotal evidence
Steps:
• Define Student (A)• Define Weaknesses (A)• Discuss Interventions
Student Success Plan (A)UPCS Success Plan (A)
Strong Instructional LeaderDistributed LeadershipPersonalization
Teacher Intervention:
Teachers • Seek out knowledge about test• Serve on State Curriculum Standard
Setting Committees• Serve as MCAS scorers• Serve on state-level curriculum area
and test development• Train in Test WIZ technology• Train in portable technology• Explore DOE and Princeton Review web sites• AP Conferences• Presentations
This flowchart shows the extensive process that University Park Campus School in Worcester, MA developed to individualize its analysis of student performance and follow-up teaching approaches. UPCS’s strategies toserve its high-poverty student population were studied by Mass Insight as part of its Building Blocks effective-practice research initiative in 2002-3. See www.buildingblocks.org or www.massinsight.org for more.
THE TURNAROUND CHALLENGE: SUPPLEMENT 71
In return for the mission-focus, the challenges and long hours,however, teachers at these schools say they are offered a climateof professionalism and the chance to focus on teaching that theymight not find elsewhere. All these schools schedule significantcollaborative planning time, mentoring opportunities and ele-ments of creative control. Where their conditions allow, schoolsalso offer merit pay and other incentives (see below).
Readiness to ActDespite the increasing attention devoted to student-centeredlearning, in the standard model of public education, bureau-cratic imperatives frequently impede action that is truly bestfor students. At the same time, some of the incentives thatshape adult behavior in the traditional system have becomeremoved from the students’ interest. In schools that work, con-ditions allow decisions to focus on student needs and incen-tives become re-integrated with the “children first” mission. Ifnot for the presence of a different condition set, many of themost crucial ways in which these schools support their stu-dents’ readiness to learn and their educators’ readiness to teachsimply would not be possible.
This readiness to act dimension of HPHP schools can be seen intwo main arenas:
• Authority over the critical resources: people, time, andmoney. The question is: Who has the freedom and authorityto make fundamental decisions relating to the use of funds,the allocation of time, and the hiring, firing and deploymentof staff? The more clearly that this authority lies in the handsof school or district leadership, the more likely it is that thevision of a school’s plan can be fulfilled.
• Professional human resources approaches and norms. Public-sector teaching has not kept pace with other sectors in thedevelopment of twenty-first century HR norms and approaches.HPHP Vanguard schools, on the other hand, have taken somenew and different paths to recruiting, work conditions, profes-sional development, pay and other professional incentives.
Both types of change often require either close involvement andnegotiation with unions or a “work around” of union regula-tions, which is why these types of approaches have tended toemerge within charter and charter-like schools. (The news fromthese experiments seems to be having some of the intended “lab-
oratory” effect. More recently, some districts across the nationhave been able to work with their unions to negotiate conditionsand financial incentives that re-orient the way schools work. Foran example, see the review of New York City’s Children Firstreport, released early in 2007, and other district experiments inthe second section of this supplemental report.) The readiness toact dimension of the Vanguard HPHP schools shows up in the following examples.
HPHP Vanguard schools have taken some new and different paths to recruiting, workconditions, professional development, andother professional incentives.
©2007 MASS INSIGHT72
Authority to Increase and Use Time to Support the MissionWhen Principal Rodrigues first began the process of creat-ing a new school, she did a series of “what if” scenarios:What if teachers had more time to plan and collaborate?What if students had more time to learn? What if everyonebelieved that students could achieve more? And so on. Oneof the most significant results of this brainstorming was thecreation of a radically different schedule – one that wouldmake the most of students’ and teachers’ limited hours, sothat both could accomplish more.
– Excerpt from www.buildingblocks.org (UCPS strategy)
As evidenced in the learning and teaching strategies summa-rized above in the readiness to teach section, many of theseHPHP schools’ more intensive approaches require longer schooldays and longer school years. This is necessary both to increasethe amount of time available for student learning, and toincrease the amount of time available for teacher collaborationand development.
In the charter schools, longer hours are incorporated into theteacher contracts from the start. At UPCS, it all started withsome out-of-the-box thinking based on designing a school
around what students (and staff) needed, as described in the boxat the top of this section. When the school was launched, theofficial school day ran from 8 am to 4 pm, and before- and after-school programs kept the school open from 7:30 am to as late as
6 pm. Like all aspects of the school’s programming, the longerday was approved by both the school committee and the localteachers union. The school did, of course, have to pay for thesehours; teachers received 19% additional compensation becauseof the extended day. (Note: Due to budget cuts in more recentyears, UPCS had to cut back on its longer day. The principal willcontinue to offer before- and after-school programming, but reg-ular school hours were considerably trimmed.)
These high-performing, high-poverty schools also use unortho-dox scheduling to achieve a number of their other teaching andlearning goals. Some, like UPCS, use longer blocks to give teach-ers more time to delve deeply into topics and develop project-based units. (It also means less time is lost shuffling from oneclass to another). Others, like MATCH, rearrange teaching tocarve out time for weekly assessments. Codman accommodatesthe on-site explorations throughout the city that are so central toits learning approach. None of these would be possible withoutthe freedom and authority to tailor scheduling and the use oftime to students’ needs.
Authority to Choose Staff Best-Suited to the Mission, andFreedom to Offer Them Incentives
“There is no question that the success of [Boston Collegiate]… would not be possible without the hard work and dedica-tion of the school’s educators…. But in return they enjoy avery professional environment – one that sets clear expecta-tions and rewards performance.” Excerpt from www.build-ingblocks.org (South Boston Harbor Academy [now BostonCollegiate] strategy.)
Charter schools are free from the types of union restrictionson hiring, firing and allocation of staff that cause the most dif-ficulty for instructional leaders attempting to bring about aradical culture change within a school: seniority, “bumping”and “force placing.” The absence of such practices and the useof open recruiting or open posting of teaching positions can
Visualizing the Goal continued
Ultimately, the union approved the new schoollargely because 1) the steering committee was careful to involve the union in ongoing dialogue, and 2) all parties agreed that theschool would be carefully monitored.
THE TURNAROUND CHALLENGE: SUPPLEMENT 73
go a long way to helping bring in teachers who are focused onstudent achievement.
Again, UPCS, as the only district HPHP school in our group, hadto pursue similar ends through the system. In this case, the unionproved to be a largely willing partner in the development of thenew school. A clause in the union contract states that changes tothe contract could be made with a two-thirds faculty vote. Thisallowed the principal to choose staff based on more than just sen-iority in the Worcester Public Schools. Ultimately, the unionapproved the new school largely because 1) the steering commit-tee was careful to involve the union in ongoing dialogue, and 2)all parties agreed that the school would be carefully monitored.
Where possible, several of these HPHP schools also let payreflect merit. Boston Collegiate, for example, has the ability tovary pay according to the merit of each individual. The startingsalary of a Boston Collegiate teacher is typically higher thanthat of a BPS teacher, but salaries also plateau sooner. In strongbudget years, teachers might receive anywhere from a four to aten percent pay rise. However, in tight budget years, raises areless substantial.
Readiness to Increase Resources to Implement a MoreIntensive Approach
“MATCH School has moved to an atypical “resource-rais-ing” approach…[It] invests in building relationships withpotential private sector partners and funders…. Promotionof its successes initiates a “virtuous cycle” that leads to fur-ther interest and funding.” Excerpt from www.building-blocks.org (MATCH strategy)
As we have seen, turning around learning for students withsignificant poverty and related challenges requires somethingmore, and something substantially different from what maywork adequately well with less challenged students. Not sur-prisingly, it can also require significantly more resources.
Under standard public school district allocations, such fundsare often not available. Schools with the freedom and authorityto pursue funds from other sources have often been the onesthat have been able to work out ways to make their child-cen-tered vision a reality. Several of our Vanguard HPHP schoolshave been particularly resourceful in finding additional fund-ing or other in-kind resources to enable the intensiveapproaches they take with their students.
Rather than living within typical resource allocation limits, forexample, MATCH School has moved to an atypical “resource-raising” approach — expanding adult support and raisingadditional financial resources through both working and fund-ing partnerships with the public and private sectors. Theyexpanded adult support resources by developing their MATCHCorps of recent college graduates to fulfill the need for inten-sive tutoring that they could neither fund the teaching staff for,nor leave to volunteers. They entered into partnerships withlocal universities and nearby high schools. They also looked toa range of public financing options (such as leveraging FederalTax Credits to secure funding for a new construction) as wellas to drawing additional funds from private sector companiesand private philanthropies.
UPCS has been able to leverage its partnership with ClarkUniversity to increase its resource pool. Codman also collabo-rates with a wide variety of organizations and individuals tobring inquiry-based learning to life for its students. From small-scale partnerships (the Boston Globe delivers free newspapers toeach freshman’s home every weekday), to larger, multi-year col-laborations (the Huntington Theater hosts ninth and tenthCodman students every Friday from October to June), theschool puts untiring effort into identifying the resources neces-sary to make the school experience active, engaging, and rele-vant to students’ lives.
Several of our VanguardHPHP schools have beenparticularly resourcefulin finding additionalfunding or other in-kindresources to enable theintensive approachesthey take with their students.
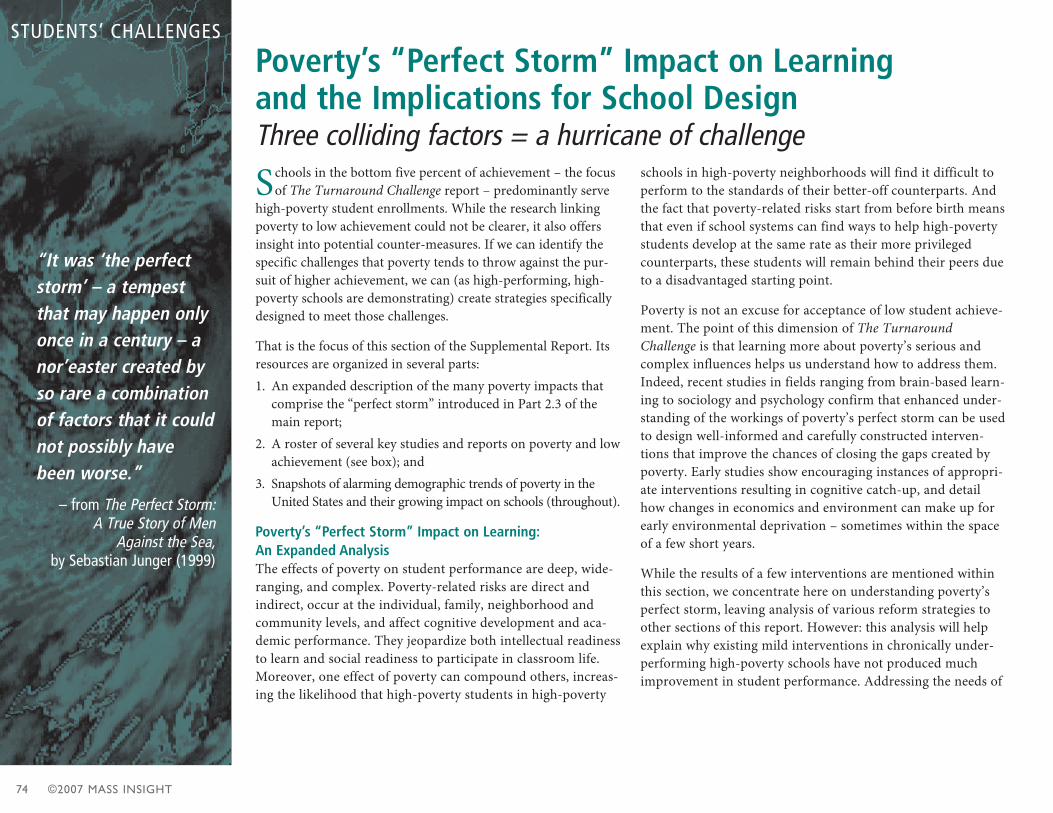
©2007 MASS INSIGHT74
Schools in the bottom five percent of achievement – the focusof The Turnaround Challenge report – predominantly serve
high-poverty student enrollments. While the research linkingpoverty to low achievement could not be clearer, it also offersinsight into potential counter-measures. If we can identify thespecific challenges that poverty tends to throw against the pur-suit of higher achievement, we can (as high-performing, high-poverty schools are demonstrating) create strategies specificallydesigned to meet those challenges.
That is the focus of this section of the Supplemental Report. Itsresources are organized in several parts:1. An expanded description of the many poverty impacts that
comprise the “perfect storm” introduced in Part 2.3 of themain report;
2. A roster of several key studies and reports on poverty and lowachievement (see box); and
3. Snapshots of alarming demographic trends of poverty in theUnited States and their growing impact on schools (throughout).
Poverty’s “Perfect Storm” Impact on Learning:An Expanded AnalysisThe effects of poverty on student performance are deep, wide-ranging, and complex. Poverty-related risks are direct andindirect, occur at the individual, family, neighborhood andcommunity levels, and affect cognitive development and aca-demic performance. They jeopardize both intellectual readinessto learn and social readiness to participate in classroom life.Moreover, one effect of poverty can compound others, increas-ing the likelihood that high-poverty students in high-poverty
schools in high-poverty neighborhoods will find it difficult toperform to the standards of their better-off counterparts. Andthe fact that poverty-related risks start from before birth meansthat even if school systems can find ways to help high-povertystudents develop at the same rate as their more privilegedcounterparts, these students will remain behind their peers dueto a disadvantaged starting point.
Poverty is not an excuse for acceptance of low student achieve-ment. The point of this dimension of The TurnaroundChallenge is that learning more about poverty’s serious andcomplex influences helps us understand how to address them.Indeed, recent studies in fields ranging from brain-based learn-ing to sociology and psychology confirm that enhanced under-standing of the workings of poverty’s perfect storm can be usedto design well-informed and carefully constructed interven-tions that improve the chances of closing the gaps created bypoverty. Early studies show encouraging instances of appropri-ate interventions resulting in cognitive catch-up, and detailhow changes in economics and environment can make up forearly environmental deprivation – sometimes within the spaceof a few short years.
While the results of a few interventions are mentioned withinthis section, we concentrate here on understanding poverty’sperfect storm, leaving analysis of various reform strategies toother sections of this report. However: this analysis will helpexplain why existing mild interventions in chronically under-performing high-poverty schools have not produced muchimprovement in student performance. Addressing the needs of
Poverty’s “Perfect Storm” Impact on Learning and the Implications for School DesignThree colliding factors = a hurricane of challenge
“It was ‘the perfectstorm’ – a tempest that may happen onlyonce in a century – anor’easter created byso rare a combinationof factors that it couldnot possibly havebeen worse.”
– from The Perfect Storm: A True Story of Men
Against the Sea, by Sebastian Junger (1999)
STUDENTS‘ CHALLENGES
THE TURNAROUND CHALLENGE: SUPPLEMENT 75
high-poverty students in high-poverty settings is bound to be avery demanding task, one that is very different from increasingperformance within other types of schools and communities.Again: what this section doesn’t provide is an excuse not totackle the task at all, or to continue to pursue the same types ofreforms that have failed to substantially improve chronically
under-performing high-poverty schools. Instead, it provides aset of parameters that buttress the points made in the mainTurnaround Challenge report and earlier in this SupplementalReport: that failing, high-poverty schools need much more thanincremental change. They need a fundamental rethinking of allof the ways they serve their high-need students.
The current decade has seen an explosion of research onpoverty’s role in our schools and the lives of young people.On the one hand, No Child Left Behind has generated amountain of valuable statistical data on the patterns ofpoverty and low achievement. Concurrently, cognitive andsocial scientists are constructing a deeper and more profoundunderstanding of poverty’s devastating effect on childhoodand personal development, and in some cases, what can bedone about it.
Several resources are particularly useful in providing a cogentoverview of current factors and suggesting research andresources for further study. More complete reference informa-tion can be found in the reference section of the main report,or the resources section at the end of this Supplement.
Paul Tough: What it Takes to Make a Student (New YorkTimes Sunday Magazine. (November 26, 2006)This article looks at the political history and research onefforts to close the achievement gap between poor/minoritystudents and wealthier/white students. The author concludesthat we have the means and strategies to close the gap, butquestions whether we have the collective public will to do so.
Karen Pellino: The Effects of Poverty on Teaching and Learning (2001)A reading specialist in a high-poverty New York school, Pellinocaptures the effects of poverty in real classrooms, with realteachers struggling to assist real children. An outstandingintroduction for practitioners and policymakers alike.
Martha Farah et al: Poverty, Privilege, and BrainDevelopment: Empirical Findings and EthicalImplications (2006)This team of neuroscientists summarizes recent research onthe relation between poverty and children’s cognitive devel-opment. Their reference list is a valuable conduit to otherresearch in this field.
David Berliner: Our Impoverished View of Education Reform (2006)This highly-respected education researcher connects the dotsfrom many fields of research to provide a stunning andsobering profile of poverty in our schools. While we greatlyadmire his analysis, we depart from one of his conclusionsthat “poverty places severe limits on what can be accom-plished through school reform efforts;” instead, we believethat school reform must be expanded to encompass mitiga-tions of poverty’s effects – hence the HPHP Readiness Modelpresented in the main report.
Jean Anyon: What “Counts” as Educational Policy?Notes towards a New Paradigm (2005)Anyon argues that the problems of urban education are nest-ed in underlying social policies and inequities, and that oursuccess in solving the achievement gap lies in redefining edu-cation policy by making schools the hub of a new, broad“policy alignment” that recognizes and attacks poverty andpoor schooling as two facets of the same problem.
Richard Rothstein: Class and Schools: Using Social,Economic, and Educational Reform to Close the Black-White Achievement Gap (2004)Rothstein seeks to explain how social class differences arelikely to affect the academic performance of children. Of par-ticular interest is his unvarnished assessment of some of thebetter publicized reform initiatives.
Abigail and Stephan Thernstrom: No Excuses: Closing the Racial Gap in Learning (2003)A close, data-driven look at cultural impacts on achievement,with a focus on schools that are successfully mitigating those impacts.
Waxman et al: Review of Research on Educational Resilience (2003)The authors discuss a crucial area of research: the resiliency demonstrated by students who succeed despitevery adverse conditions.
New Research Is Pinpointing Poverty’s Most Critical Impacts
©2007 MASS INSIGHT76
INDIVIDUAL AND FAMILY RISK FACTORS
Storm #1: How Poverty UndercutsChildren’s Readiness to Learn
One thing is clear: the academic achievement levels of poorurban students are markedly lower than those of their
counterparts in suburban and rural schools. This is not at all tosuggest that poor urban students are inherently less intelligent.
Rather, a wide body of researchshows that persistent and extremepoverty, and related social, envi-ronmental, and psychological fac-tors (some parallel and some sec-ondary), affect both the cognitivedevelopment and school achieve-ment of individual children.(Anyon, 2005)
The picture is complex even at theindividual and family level, and itis perhaps important to capture across-section of the main risk fac-tors to understand that the wholeis greater than the sum of itsparts. Children of poverty are notnearly as prepared as the non-poor to enter the classroom.Before kindergarten, they alreadytest lower on assessments of cog-nitive skills. They come from fam-ilies that face grave economic sce-narios, and endure both physical
and psychological factors that limit their ability to thrive. Healthand safety risks can often overshadow the need for higher orderthinking skills, and parent and familial modeling often fail toencourage children to focus on school. In addition, high-poverty
students often suffer from poor self-image, or are influenced bystereotypic behaviors that thwart goal-setting and their desire tosucceed. One factor compounds another; as students who arenot at risk continue to develop and progress on a higher trajec-tory, poor students fall even further behind.
Taken together, these individual and family risk factors go along way to explain the persistence of current underperfor-mance. But the more we discover about poverty’s perfect storm,the more opportunity we have to design focused, effective inter-ventions that can break longstanding trajectories of risk. Recentresearch on a number of the risk factors confirms that some riskcan be mitigated. While recognizing that many of the factors areinterrelated, we will identify several of the most importantstrands in the following sections.
Developmental Readiness and School ReadinessThe impacts of divisions between rich and the poor, urban andsuburban, at-risk or not, begin at birth and are reinforced dailyby a child’s surroundings. While both the causes and manifesta-tions of these disadvantages are difficult to disentangle, manyresearchers make a distinction between a child’s readiness tolearn, or “developmental readiness,” and his or her readiness toenter the classroom, or “school readiness.”
The more we discover about poverty’s perfectstorm, the more opportunity we have to designfocused, effective interventions that can breaklongstanding trajectories of risk.
The term “at-risk” is widely used to describe children, families andcommunities based on a variety of indicators, yet our survey of theresearch indicates that there is no consistent definition used byproviders, funders, policy makers, or media.
Generally speaking, though, primary measures for risk include:
• For children: limited reading proficiency, abuse or traumaexperiences, disability or illness, or exhibition of behavioralproblems (Anderson).
• For families: poverty, low parental education level, increasednumbers of children per household, lack of home ownership,single parent households, welfare dependence, substance abuseand/or physical abuse, mental or physical illness, or other familydysfunction.
• For communities: neighborhood poverty, crime rates, unem-ployment rates, and the number of teen parents.
Whatever the specific metrics used for risk at each level, it is clearthat a large percentage of students in chronically under-performingschools will be “at-risk” at two or at all three levels.
What Does “At-Risk” Really Mean?
THE TURNAROUND CHALLENGE: SUPPLEMENT 77
Developmental readiness indicates the cognitive developmentlevel at which a child is ready to undertake learning specifictasks. School readiness refers to readiness to enter the classroomand access the instruction taking place. It incorporates the levelof physical, emotional, and social development necessary for achild to succeed in the classroom. There is general acceptance ofthe broad categories that contribute to “school readiness,” but todate, there is little agreement among researchers and educatorsas to precisely which characteristics constitute school readiness –or how to measure them. Few tools exist to measure this type ofreadiness for individual children. (Anderson, 2006) That pres-ents a challenge to schools serving high-poverty schools withhigh percentages of children who may not be school-ready whentheir age implies they should be.
Health Risks and Brain DevelopmentInadequate nutrition and insufficient access to a proper diet areamong many of the health risks associated with children livingin poverty. Children who do not ingest either the volume offood or the nutrients necessary each day are at risk for slowedbrain development and chronic stress on the body. (Given,1998) Other health risks include lack of safety, inadequate med-ical care, teen pregnancy, and increased infant mortality, toname a few. Other health factors, such as low incidence ofbreast-feeding and high rates of childhood disease, prematurebirths, and low birth weights, all affect the a child’s growth andcognitive and physical development.
There are also health risks that cause additional problemsbecause they go undiagnosed from an early age. Recurring otitismedia, for example, is linked to hearing impairments, slowedlanguage development and reading problems in school. The dis-ease is not a product of poverty, but the number of cases that goundiagnosed and the number of children who do not receivetreatment is affected by poverty and the lack of access to health
care. (Berliner, 2006) Similarly, while lead poisoning is on thedecline, some 450,000 children between the ages of one and five,mostly poor and mostly of color, still have enough lead in theirblood to cause cognitive damage. (CDC, 2004)
Family Economic HardshipOver 30 percent of urban students live in poverty, with 42 per-cent eligible for free and reduced lunch, compared with 18 per-cent of suburban and 31 percent of rural students who are simi-larly eligible. (Anyon, 2005) The figures for students in chroni-cally failing schools targeted for turnaround are even higher.
The implications of this type of economic hardship for students’families are far-reaching. Parents often move from one locationto another in search of work, which contributes to a high level ofmobility among poor, urban students. Parents can rent weekly,even daily in some places, while job hunting or dealing withother personal, social, or family issues. Frequent moves havestrong academic and social consequences for students, whotransfer from one school to another, often unaccompanied byrecords or concrete information that can be passed on to thestudent’s next teacher. (Pellino, 2001)
Lack of resources also contributes to poor families’ inability toaccess high quality day care and pre-school. Children from high-poverty families enter school without the advantages of enrichedpre-K learning environments.
Research suggests, however, that even small increases in theincomes of poor families can improve student performance.(Anyon, 2005) These increases enhance cognitive development,and may also improve the likelihood of future success in theworkforce. One study, for example, found that income supple-ments as small as $4,000/year improved school achievement forelementary students by 10 to 15 percent compared with stu-dents in the control groups.
Inadequate nutritionand insufficient accessto a proper diet areamong many of thehealth risks associatedwith children livingin poverty.
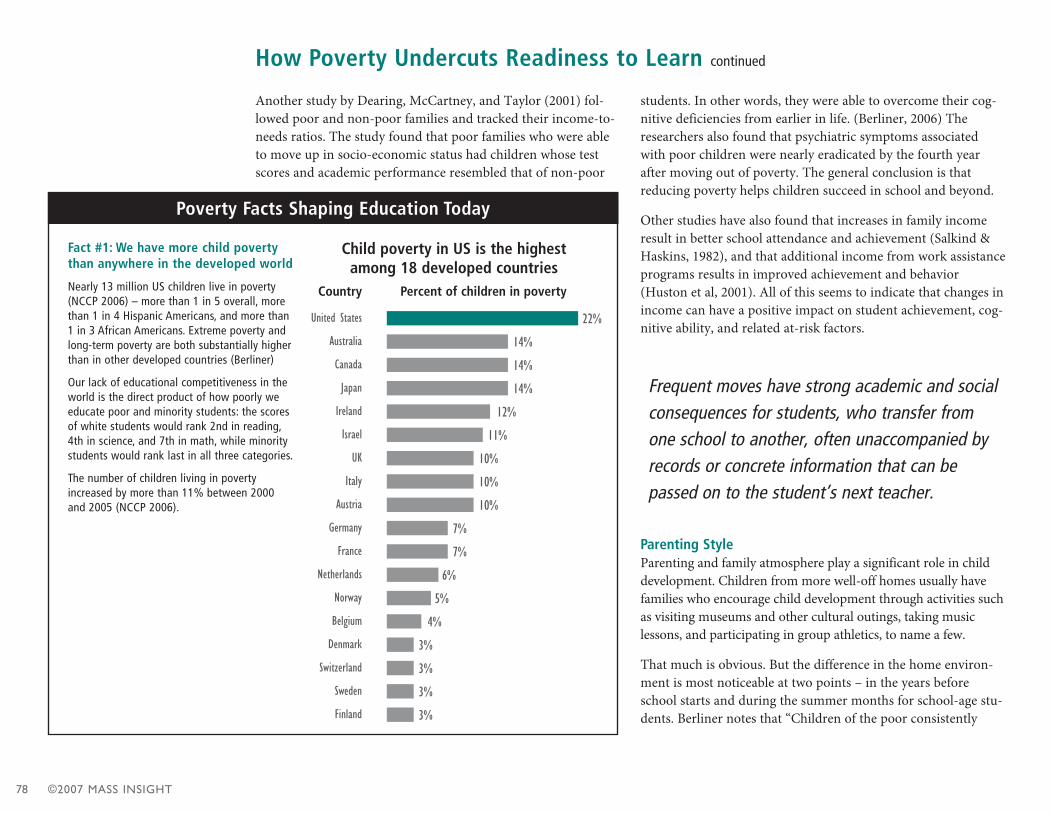
©2007 MASS INSIGHT78
Another study by Dearing, McCartney, and Taylor (2001) fol-lowed poor and non-poor families and tracked their income-to-needs ratios. The study found that poor families who were ableto move up in socio-economic status had children whose testscores and academic performance resembled that of non-poor
students. In other words, they were able to overcome their cog-nitive deficiencies from earlier in life. (Berliner, 2006) Theresearchers also found that psychiatric symptoms associatedwith poor children were nearly eradicated by the fourth yearafter moving out of poverty. The general conclusion is thatreducing poverty helps children succeed in school and beyond.
Other studies have also found that increases in family incomeresult in better school attendance and achievement (Salkind &Haskins, 1982), and that additional income from work assistanceprograms results in improved achievement and behavior(Huston et al, 2001). All of this seems to indicate that changes inincome can have a positive impact on student achievement, cog-nitive ability, and related at-risk factors.
Parenting StyleParenting and family atmosphere play a significant role in childdevelopment. Children from more well-off homes usually havefamilies who encourage child development through activities suchas visiting museums and other cultural outings, taking music lessons, and participating in group athletics, to name a few.
That much is obvious. But the difference in the home environ-ment is most noticeable at two points – in the years beforeschool starts and during the summer months for school-age stu-dents. Berliner notes that “Children of the poor consistently
How Poverty Undercuts Readiness to Learn continued
Child poverty in US is the highest among 18 developed countries
Country Percent of children in poverty
United States
Australia
Canada
Japan
Ireland
Israel
UK
Italy
Austria
Germany
France
Netherlands
Norway
Belgium
Denmark
Switzerland
Sweden
Finland
22%
14%
14%
14%
12%
11%
10%
10%
10%
7%
7%
6%
5%
4%
3%
3%
3%
3%
Fact #1: We have more child povertythan anywhere in the developed world
Nearly 13 million US children live in poverty(NCCP 2006) – more than 1 in 5 overall, morethan 1 in 4 Hispanic Americans, and more than1 in 3 African Americans. Extreme poverty andlong-term poverty are both substantially higherthan in other developed countries (Berliner)
Our lack of educational competitiveness in theworld is the direct product of how poorly weeducate poor and minority students: the scoresof white students would rank 2nd in reading,4th in science, and 7th in math, while minoritystudents would rank last in all three categories.
The number of children living in povertyincreased by more than 11% between 2000and 2005 (NCCP 2006).
Poverty Facts Shaping Education Today
Frequent moves have strong academic and socialconsequences for students, who transfer fromone school to another, often unaccompanied byrecords or concrete information that can bepassed on to the student’s next teacher.

THE TURNAROUND CHALLENGE: SUPPLEMENT 79
show greater learning losses over summer than do children ofthe middle class (Cooper, Nye, Charlton, Lindsay & Greathouse,1996). Middle-class children apparently get a much more nutri-tious cultural and academic diet during the summer than thepoor. This results in middle-class children gaining in readingachievement over the summer, while lower-class children loseground.” (Berliner, 2006)
Participation in these activities is less common among lowerincome families, partly due to economic and logistical con-straints, but also possibly due to different expectations formedby the parents’ own educational experiences. Sixty-two percentof children from low income families have parents who havenever attended college, and some 82 percent of children whoseparents have less than a high school diploma live in low-incomefamilies. Yet when parents have at least some college, the figuresdecrease significantly – only 24 percent of children with parentswho have attained some college education live in low-incomefamilies. (NCCP, 2006)
Living in poverty, and the emotional and psychological strainthat go along with it, have also been shown to affect parentingstyle in ways that can directly impact cognitive growth and stu-dent achievement. (Pellino, 2001) In particular, processes of lan-guage development and use, and parental attitudes toward lifeand success – both strongly related to student performance –have been shown to vary significantly by economic status.
Recent research indicates a strong correlation between economicstatus and language use and acquisition, which appear to con-tribute to disparities in cognitive development. One longitudinalstudy tracked 42 families with newborns and researched eachchild’s language development along with each parent’s commu-nication style. Results indicated that children with parents whowere professionals were exposed to greater vocabulary and knew
over 1,100 words. The other end of the spectrum included chil-dren whose parents were on welfare. These children retained anaverage of 525 words. The IQ scores between the professionalgroup and the welfare group were also strikingly disparate: theaverage IQ for the children of professionals was 117; for the wel-fare group, it was only 79. (Tough, 2006) In explaining the cause
of these differences, researchers noted that the parents from theprofessional group spoke about three times more words or utter-ances per hour than those from the welfare group.
In addition, the same study also concluded that a far higherpercentage of the parental utterances heard by children of pro-fessionals were words of encouragement, while the welfare par-ent group relied heavily on discouragements and prohibitions.In general, parents in more affluent homes appear to have beenmore sensitive to children’s viewpoints, more encouraging, lessintrusive, and less detached. These parenting behaviors helpincrease both IQ and school readiness. (Tough, 2006) Parentsof working class and poor families generally appear to applyparenting strategies that are less structured, and reinforce moreof a leader and follower mentality, in comparison to the morecollaborative home environments in the middle class families.While there are apparent strengths in both approaches (theworking class and poor children were allowed more free time,and seemed to be more autonomous and less bored orstressed), research shows that the middle-class children
One assessment determined that the cognitivescores of children entering kindergarten from thehighest socio-economic group are 60 percentgreater than those from the lowest.
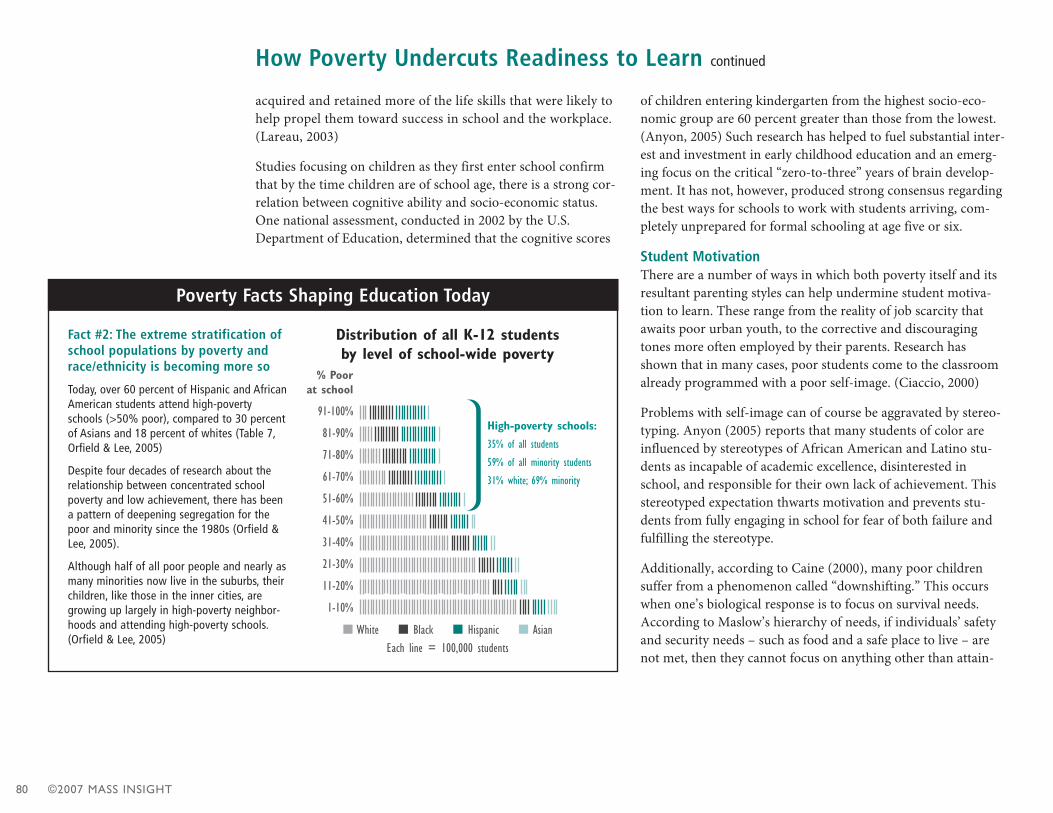
©2007 MASS INSIGHT80
acquired and retained more of the life skills that were likely tohelp propel them toward success in school and the workplace.(Lareau, 2003)
Studies focusing on children as they first enter school confirmthat by the time children are of school age, there is a strong cor-relation between cognitive ability and socio-economic status.One national assessment, conducted in 2002 by the U.S.Department of Education, determined that the cognitive scores
of children entering kindergarten from the highest socio-eco-nomic group are 60 percent greater than those from the lowest.(Anyon, 2005) Such research has helped to fuel substantial inter-est and investment in early childhood education and an emerg-ing focus on the critical “zero-to-three” years of brain develop-ment. It has not, however, produced strong consensus regardingthe best ways for schools to work with students arriving, com-pletely unprepared for formal schooling at age five or six.
Student MotivationThere are a number of ways in which both poverty itself and itsresultant parenting styles can help undermine student motiva-tion to learn. These range from the reality of job scarcity thatawaits poor urban youth, to the corrective and discouragingtones more often employed by their parents. Research hasshown that in many cases, poor students come to the classroomalready programmed with a poor self-image. (Ciaccio, 2000)
Problems with self-image can of course be aggravated by stereo-typing. Anyon (2005) reports that many students of color areinfluenced by stereotypes of African American and Latino stu-dents as incapable of academic excellence, disinterested inschool, and responsible for their own lack of achievement. Thisstereotyped expectation thwarts motivation and prevents stu-dents from fully engaging in school for fear of both failure andfulfilling the stereotype.
Additionally, according to Caine (2000), many poor childrensuffer from a phenomenon called “downshifting.” This occurswhen one’s biological response is to focus on survival needs.According to Maslow’s hierarchy of needs, if individuals’ safetyand security needs – such as food and a safe place to live – arenot met, then they cannot focus on anything other than attain-
How Poverty Undercuts Readiness to Learn continued
Fact #2: The extreme stratification ofschool populations by poverty andrace/ethnicity is becoming more so
Today, over 60 percent of Hispanic and AfricanAmerican students attend high-povertyschools (>50% poor), compared to 30 percentof Asians and 18 percent of whites (Table 7,Orfield & Lee, 2005)
Despite four decades of research about therelationship between concentrated schoolpoverty and low achievement, there has beena pattern of deepening segregation for thepoor and minority since the 1980s (Orfield &Lee, 2005).
Although half of all poor people and nearly asmany minorities now live in the suburbs, theirchildren, like those in the inner cities, aregrowing up largely in high-poverty neighbor-hoods and attending high-poverty schools.(Orfield & Lee, 2005)
Poverty Facts Shaping Education Today
Distribution of all K-12 studentsby level of school-wide poverty
% Poor at school
91-100%
81-90%
71-80%
61-70%
51-60%
41-50%
31-40%
21-30%
11-20%
1-10%
High-poverty schools:
35% of all students
59% of all minority students
31% white; 69% minority
n White n Black n Hispanic n AsianEach line = 100,000 students
THE TURNAROUND CHALLENGE: SUPPLEMENT 81
ing what is necessary for survival. For a child of poverty, whentheir brains downshift (because, for example, the path they trav-el to school is dangerous), they are literally only able to focus onsurvival. Downshifting can contribute to a sense of helplessness,low self-esteem, fatigue, unresolved emotional issues, volatility,and defiance.
A related issue involves difficulties with the teacher as anauthority figure. Raised in home environments more likely toreinforce direct and punitive authority, students from low-income families are more likely to maintain resistance towardteaches and their authority. This can lead to an inability to han-dle even benign, constructive criticism or to view the classroomas welcoming and engaging in any way. (Pellino, 2001)
As a result, as documented by Mather (2002), poor childrendemonstrate more frequently than affluent children the follow-ing characteristics in school: dislike of authority, disorganiza-tion, physical aggression, open displays of emotion, and the viewthat discipline is more about penance and forgiveness thanchange, to name a few. Other academic and behavioral problemsinclude delays in language development, violence, social with-drawal, substance abuse, and depression. (Pellino, 2001).
Our examination of high-performing, high-poverty schoolshighlights these schools’ relentless focus on students’ readinessto learn. In some ways, that phrase (and that analysis, found inPart 2 of the main report) can serve as a summary of poverty’simpact on individual children and, consequently, on the strate-gies successful schools use to educate these students effectively.Though there are always exceptions, in general poverty dramati-cally undercuts students’ readiness to learn. High standards,demanding curricula, and appropriate performance tracking areall important elements in serving children of poverty, but theyare not sufficient. As the HPHP schools demonstrate, what’srequired is a reorienting of the education model that takessquarely into account the learning and behavioral deficits thatpoverty inflicts on so many of students they serve.
What’s required is a reorienting of the educationmodel that takes squarely into account the learning and behavioral deficits that povertyinflicts on so many of students they serve.

©2007 MASS INSIGHT82
COMMUNITY AND ENVIRONMENTAL EFFECTS
Storm #2: How High-Poverty Environments Complicate Schools’ Mission
As if the challenges of individual and family effects weren’tenough, children of poverty face additional layers of risk.
“Compositional” effects, such as the community into which oneis born, or the neighborhood in which one dwells, also have adeeply significant impact on a child’s educational experienceand performance in the classroom. Being born into a wealthysuburban community or inner-city ghetto correlates strongly
with whether a student is likely to graduate from high schooland attend and graduate from college. This is the second ofpoverty’s perfect-storm triad of impacts: the neighborhood andschool environment in which children of poverty grow up.
The Influence of the NeighborhoodThere is much research to indicate that living in poor neighbor-hoods increases the odds of gang involvement, behavioral prob-lems, dropping out of school, and teenage pregnancy. (Lipp, 1996)While students spend an average of 1,000 hours per year in school,they spend nearly 5,000 hours per year out and about in their com-munities and with their family. This suggests that children are gain-ing the bulk of their influential experiences in their surroundingneighborhoods. (Berliner, 2006) Neighborhoods help establish thestandards and norms under which children operate with regard toachievement and expectations, as well as basic behavioral norms.
Researchers have investigated school achievement levels for chil-dren with similar academic and familial backgrounds, but wholive in neighborhoods with different levels of deprivation. Theoutcomes confirm that educational attainment does differ basedon zip code. In fact, one’s zip code or neighborhood is just as like-ly, current figures show, to determine student success as familialinfluence. (Berliner, 2006) The achievement records of the high-performing, high-poverty schools demonstrate that zip code neednot sync with student success – but right now, that is the norm.
The importance of community and school context is underlined ina number of studies focusing on the performance of poor, innercity students who attend schools in middle class suburbs. Studiesin Boston, St. Louis, and Chicago, for example, all found that thestudents had higher achievement levels, greater college attendancerates, and generally had more success than their counterparts whoremained in poor, inner city schools. All this is suggestive of thepower of both neighborhood and school to influence the directionand success of students’ lives, even when they carry with them thecognitive lags and ingrained disadvantages of having grown up inpoverty. (Berliner, year) And it parallels the experience of the high-poverty-high performance schools cited in the next section of thisreport that achieve significant success by providing “suburban”
Fact #3: The powerful impact of immigration on public education is only beginning
• The most severe dropout problems are in segregated high-poverty (>50%) schools; one-third of such schoolsgraduated less than half of their class of 2002 (Orfield & Lee, 2005)
• 74% of the children of high school dropouts are low-income today, compared to 64% in 1985. Conversely,low-income status occurs for only 16% of the children of parents with some college experience.
Poverty Facts Shaping Education Today
Immigrant and minority enrollments are growing rapidly40
Foreign-born Population (millions)30
20
10
01840 1880 1920 1960 2000
40Minority
Non-Minority30
20
10
02000 2010 2020 2030 2040 2050
Child population, ages 0-14 (millions)

THE TURNAROUND CHALLENGE: SUPPLEMENT 83
school conditions and expectations, and extend time and servicesthat enrich their students’ out-of-school-day environment.
There is additional evidence to suggest that a move from high-poverty to low-poverty neighborhoods not only increases the like-lihood of success in school, but decreases teens’ chances of beingarrested and committing violent crimes. The numbers indicatethat teens moving out of high-poverty communities are arrestedless and commit 50 percent fewer violent crimes. (Anyon, 2005)
The Influence of the SchoolAlongside all of the overlapping factors (largely originating out-side of school) that determine students’ at-risk status, the pover-ty context of the schools that children attend has a significantimpact as well. In fact, some studies have indicated that schoolpoverty level is more strongly related to student achievementthan individual family poverty level. In other words, students ina high-poverty school are likely to be less engaged, put forth lesseffort, and have lower aspirations than students from high-poverty families who attend a more affluent school.
To understand the context and impact high-poverty schoolsgenerally seem to have on the students they serve, it is importantto understand where these schools are located – and what chal-lenges they present to students and the adults working in themalike. Urban students are more likely than rural or suburban stu-dents to be enrolled in schools that have poverty concentrationsgreater than 40 percent. While 10 percent of suburban and 25percent of rural students attend high-poverty schools, 40 percentof urban students receive their classroom instruction in thesehigh-poverty schools.
Hidden in these statistics is the fact that segregation is still the rulein inner city classrooms. Twelve percent of white students attendschools where the majority is non-white, and only 1 percent attendschools that are over 90 percent minority. It is clear that students
are segregated not only by poverty level, but by race and ethnicityas well. (Berliner, 2006) Furthermore, the highest poverty schoolshave the highest percentage of black and Hispanic students, thehighest percentage of children who speak a language other thanEnglish at home, the highest percentage of fourth grade classroomteachers that have less than five years experience, and the lowestnumber of white students per classroom. (NCES, 2006)
The high-poverty concentration in these schools generates orcoexists with a host of compounding factors that also tend toundermine students’ readiness for learning. High-poverty urbanstudents are more likely to change schools more frequently, lesslikely to participate in school-sponsored extracurricular activitiesand athletics, less likely to come from a two-parent home, and lesslikely to have a parent who is employed full time. (Lipp, 1996)
Urban students are also likely to undertake their schooling withina large school-bureaucracy setting (though the small-schoolsmovement is increasingly serving them in schools with smallerenrollments). Larger school systems have unwieldy administrativestructures that can impede collegiality, affect resource distribution,and create school environments that tend towards impersonality.(Lipp, 1996) The numbers indicate, on average, that urban schoolsystems educate more students than suburban or rural schools. Forexample, the average urban high school has 1,313 students. Inrural areas, the average high school has a student body of 577,while suburban schools enroll and average of 1,197 students.
Thus zip code and school demographics, despite clear evidencethat their challenges can be overcome, do continue to play anenormous role in affecting a child’s experience of education. Wemust understand the importance of these compositional factorsand how they compound and negatively reinforce each other inhigh-poverty schools before we can design and implementreforms that address achievement gaps.
The achievement records of the high-performing, high-povertyschools demonstrate that zip code need notsync with student success– but right now, that is the norm.
High-poverty urban students are more likely to change schools more frequently, less likelyto participate in school-sponsored extracurricular activities and athletics, less likely tocome from a two-parent home, and less likely to have a parent who is employed full time.
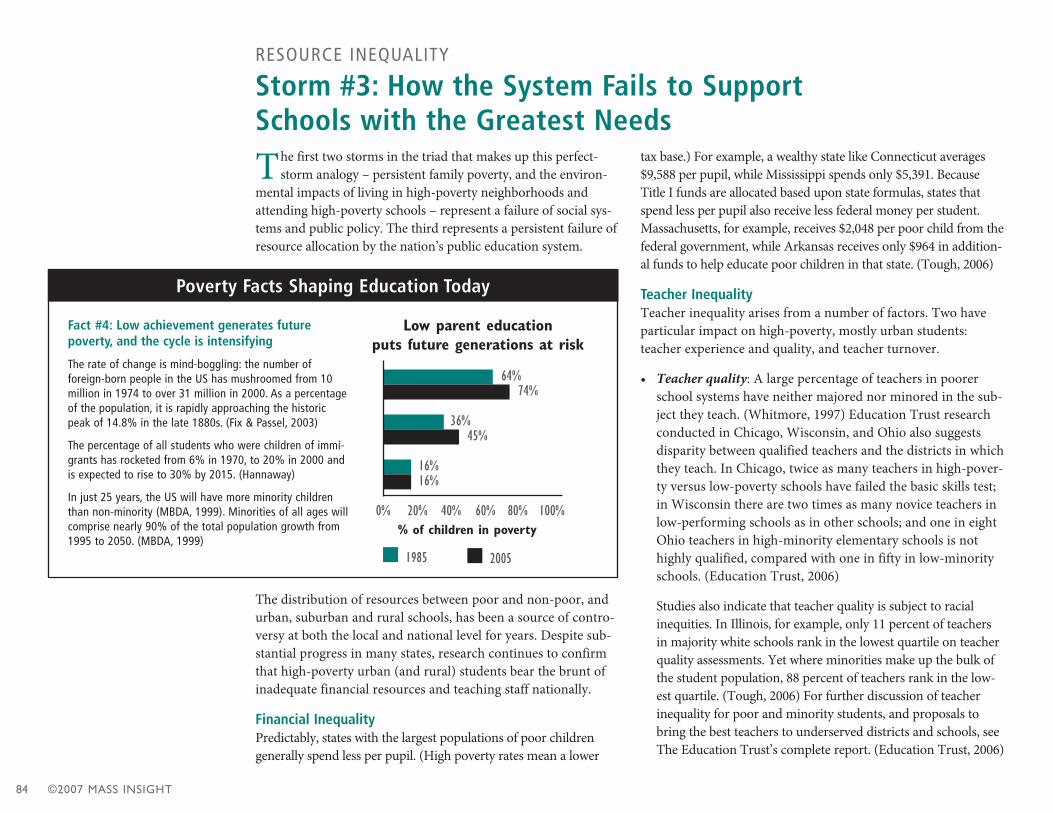
©2007 MASS INSIGHT84
RESOURCE INEQUALITY
Storm #3: How the System Fails to Support Schools with the Greatest Needs
The first two storms in the triad that makes up this perfect-storm analogy – persistent family poverty, and the environ-
mental impacts of living in high-poverty neighborhoods andattending high-poverty schools – represent a failure of social sys-tems and public policy. The third represents a persistent failure ofresource allocation by the nation’s public education system.
The distribution of resources between poor and non-poor, andurban, suburban and rural schools, has been a source of contro-versy at both the local and national level for years. Despite sub-stantial progress in many states, research continues to confirmthat high-poverty urban (and rural) students bear the brunt ofinadequate financial resources and teaching staff nationally.
Financial InequalityPredictably, states with the largest populations of poor childrengenerally spend less per pupil. (High poverty rates mean a lower
tax base.) For example, a wealthy state like Connecticut averages$9,588 per pupil, while Mississippi spends only $5,391. BecauseTitle I funds are allocated based upon state formulas, states thatspend less per pupil also receive less federal money per student.Massachusetts, for example, receives $2,048 per poor child from thefederal government, while Arkansas receives only $964 in addition-al funds to help educate poor children in that state. (Tough, 2006)
Teacher InequalityTeacher inequality arises from a number of factors. Two haveparticular impact on high-poverty, mostly urban students:teacher experience and quality, and teacher turnover.
• Teacher quality: A large percentage of teachers in poorerschool systems have neither majored nor minored in the sub-ject they teach. (Whitmore, 1997) Education Trust researchconducted in Chicago, Wisconsin, and Ohio also suggestsdisparity between qualified teachers and the districts in whichthey teach. In Chicago, twice as many teachers in high-pover-ty versus low-poverty schools have failed the basic skills test;in Wisconsin there are two times as many novice teachers inlow-performing schools as in other schools; and one in eightOhio teachers in high-minority elementary schools is nothighly qualified, compared with one in fifty in low-minorityschools. (Education Trust, 2006)
Studies also indicate that teacher quality is subject to racialinequities. In Illinois, for example, only 11 percent of teachersin majority white schools rank in the lowest quartile on teacherquality assessments. Yet where minorities make up the bulk ofthe student population, 88 percent of teachers rank in the low-est quartile. (Tough, 2006) For further discussion of teacherinequality for poor and minority students, and proposals tobring the best teachers to underserved districts and schools, seeThe Education Trust’s complete report. (Education Trust, 2006)
Fact #4: Low achievement generates futurepoverty, and the cycle is intensifying
The rate of change is mind-boggling: the number of foreign-born people in the US has mushroomed from 10million in 1974 to over 31 million in 2000. As a percentageof the population, it is rapidly approaching the historicpeak of 14.8% in the late 1880s. (Fix & Passel, 2003)
The percentage of all students who were children of immi-grants has rocketed from 6% in 1970, to 20% in 2000 andis expected to rise to 30% by 2015. (Hannaway)
In just 25 years, the US will have more minority childrenthan non-minority (MBDA, 1999). Minorities of all ages willcomprise nearly 90% of the total population growth from1995 to 2050. (MBDA, 1999)
Poverty Facts Shaping Education Today
% of children in poverty
64%74%
36%45%
16%
Low parent education puts future generations at risk
0%
1985
20% 40% 60% 80% 100%
16%
2005
THE TURNAROUND CHALLENGE: SUPPLEMENT 85
• Teacher turnover: The teacher turnover issue or, as Ingersollterms it, the “revolving door,” contributes greatly to teacherstaffing difficulties throughout the United States. Annual teacherturnover rates fluctuate from 13 to 16 percent. However, this fig-ure jumps to 22 percent for high-poverty schools. (Ingersoll,2004) Since teachers comprise over 4 percent of the civilianworkforce in the U.S., that means large numbers of people aremoving in and out of the teaching profession. During the courseof a year, in fact, over one million people transition in and out ofthe classroom. These findings – higher mobility rates and largernumbers than other professions – suggest that teacher turnoveris largely attributable to the structure and organization of theprofession itself. Teachers cite numerous non-financial reasonsfor leaving their schools, including lack of administrative sup-port, inability to impact the system, disciplinary issues, andintrusions on teaching time. (Ingersoll, 2004)
Whatever the cause, teacher turnover disrupts school function-ing and curricular sequencing and can impact student perform-ance. While the loss of learning to teacher turnover has not beenwidely studied, a 2000 Texas Center for Educational Researchstudy concluded the annual financial costs are in the hundredsof millions of dollars. (TCER, 2000)
In high-poverty schools, turnover and teacher quality challengesconverge, as schools with mostly poor students retain only 1 percentof the most qualified and highest ranking teachers. (Tough, 2006)Disadvantaged schools likewise experience barriers to the hiringof new teachers, particularly high-quality new teachers. All of thissuggests that the schools that most need the best teachers tend toemploy the worst, and that teacher turnover and retention ratesare particularly serious concerns for high-poverty schools.
Addressing the Perfect StormThis survey of recent research on poverty’s perfect storm of nega-tive influences on students’ school experience and academic per-formance provides just a taste of what we are beginning to know.The cumulative effect of these influences is significant. It cannotbe solved with higher-expectations rhetoric – students will reachhigher standards if we just expect it of them. Nor can it beaddressed with well-intentioned, but incomplete, reform strate-gies focused solely on the “readiness to teach” dimension of theReadiness Model we developed for this report: standards-linkedcurricula, staff development, data analysis. That much we knowfrom the minimal impacts of these school improvement strate-gies on the most dysfunctional schools, and from the characteris-tics of high-performing, high-poverty schools. The HPHPschools are not using the impacts of high poverty on their stu-dent enrollments as an excuse; they are using these impacts asdesign parameters to understand how best to serve their students.
We have included this analysis to help explain why existing, incre-mental efforts to close poverty’s achievement gap have been large-ly unsuccessful – and to underline the importance of learningfrom new approaches and systems that are more successfullyaddressing the needs of high-poverty students. In order to addressboth the failing-schools gap and the poverty achievement gap,educators will have to create systems, services, incentives, partner-ships, and environments that go beyond what is offered in tradi-tional American public school models. Educators will likely haveto work closely with a range of partners, including school serviceproviders, neighborhood and community partners, and othersocial service providers, to be successful. All of this is happening,already, in isolated cases scattered across the country. The chal-lenge for all of us will be to extend that success to every schooland to all children, no matter what disadvantages they face.
One in eight Ohio teachers in high-minority elementary schools isnot highly qualified, compared with one in fifty in low-minority schools.


R E S O U R C E D I R E C T O R Y
©2007 MASS INSIGHT88
Note: The turnaround resources listed and annotated here area sampling of the many available to researchers, practitioners,and policymakers. Many that we have included here are notexclusively focused on turnaround, but touch on related top-ics we believe would be helpful to designers of turnaroundstrategy. Many more useful resources can be found in the ref-erence section of The Turnaround Challenge main report.This resource listing will be continually updated and expand-ed with live links at www.massinsight.org.
Basics of Accountability and School Reform Efforts
California Center for Effective Schools. Connections for Success:Effective School Correlates. Santa Barbara, CA: Author. Retrievedfrom http://effectiveschools.education.ucsb.edu/correlates.html
The Correlates provide a framework for reform based onseven guiding principles. These principles, derived fromempirical investigations and case studies of school success-es in California, describe the culture and learning climateof schools where students are achieving.
Comprehensive School Quality Center. (2006). CSRQ Center Report on Education Service Providers. Washington DC: Author. Retrieved fromwww.air.org/news/documents/CSRQ_Center_ESP_report_Final_Report.pdf
This report provides a systematic method to evaluate edu-cation service providers. Organizations are judged on fivemain categories: 1) positive effects on student achieve-ment; 2) positive effects on additional outcomes; 3) posi-tive effects on parent, family, and community involve-ment; 4) a link between research and the models design;5) services and support to schools to enable successfulimplementation.
Edmonds, Ronald. (1979, October). Effective Schools for theUrban Poor. Educational Leadership, 37(1), 15-24.
This landmark early article reviews research that hadbeen done to date on how urban schools can teach poorchildren successfully.
Elmore, R. F. (1996). Getting to Scale with Good EducationalPractice. Harvard Educational Review 66(1), 1-26. Retrievedfrom www.ku-crl.org/htmlfiles/SE2005/getting_to_scale.doc
Elmore attempts to answer why good ideas about teachingand learning have so little impact on educational practice.He argues that incentives fundamental to the school envi-ronment for teachers and administrators are key to boththe problem and a potential solution. Many of his laterworks build on the concepts presented here.
Elmore, R. F. (2003). Knowing the Right Thing to Do: SchoolImprovement and Performance-based Accountability.Washington DC: NGA Center for Best Practices. Retrieved from www.nga.org/cda/files/0803KNOWING.PDF
This widely-read paper focuses on “improving schools”that have hit a plateau and need assistance to become trulyhigh performance institutions. Elmore argues the basicproblem is not getting people to do the right thing but get-ting people to know the right thing to do. This informa-tion, he argues, can set the foundation of any instructionalimprovement plan.
Elmore, R. F. (2004). School Reform from the Inside Out: Policy, Practice, and Performance. Cambridge, MA: HarvardEducation Press.
This collection of previously published articles (reviewed individually) provides an in-depth analysis of standards-based reform, accountability, and instructional improvement.
Resource Directory for Turnaround Planning and Implementation
THE TURNAROUND CHALLENGE: SUPPLEMENT 89
Jerald, C. D. (2006). Measured Progress: A Report on the High School Reform Movement.Washington DC: Education Sector. Retrieved from www.educa-tionsector.org/research/research_show.htm?doc_id=362537
This report examines efforts to improve high schoolsthrough the redesign of high schools into small learningcommunities. It finds that redesigned high schools madeless progress than new schools designed from scratch andnotes that a larger districtwide set of conditions must be inplace to help low-performing high schools improve.
Marzano, R. J. (2000). A New Era of School Reform: Going Wherethe Research Takes us. Aurora, CO: McREL. Retrieved fromwww.mcrel.org/PDF/SchoolImprovementReform/5002RR_NewEraSchoolReform.pdf
This technical monograph provides a thorough review ofthe major literature of school reform. It also addresseswhether or not the school or teachers can make up for thedifferences children bring to school as a result of theunequal distribution of wealth and social capital. Thereport includes an excellent bibliography.
National Education Association. (2002). Making Low-performingSchools a Priority: An Association Resource Guide. WashingtonDC: Author. Retrieved from www.nea.org/priorityschools/
While critics and some reformers point to unions asimpediments to reform, this report presents the largestteachers’ union’s approach to improving low-performingschools. It provides practical advice, plus tools to helpoperationalize improvement efforts.
Turnaround Definitions and the Impact of No Child Left Behind
Arkin, M. D. & Kowal, J.M. (2005). School Restructuring OptionsUnder No Child Left Behind: What Works When? Reopening as a Charter School. Naperville, IL: Learning Point Associates.Retrieved from http://www.ncrel.org/csri/resources/ncrel/knowl-edgeissues/Reopening.htm
This part of the What Works When series for schoolrestructuring provides a balanced and carefully supportedview of the charter school option under NCLB provisions.The report distinguishes between start-up charters and thetwo types of conversion charters (voluntary and “startingfresh,” when a school is converted by the state or districtinvoluntarily due to low performance).
DiBiase, R. W. (2005). State Involvement in School RestructuringUnder No Child Left Behind. Denver, CO: EducationCommission of the States. Retrieved fromwww.ecs.org/html/Document.asp?chouseid=6428
This brief report provides a concise summary of NCLB’srestructuring requirements. The report reviews the experi-ence of 13 states in implementing restructuring and illus-trates the considerable leeway NCLB provides statesregarding restructuring plans.
Hatch, T. (2000). What Does it Take to “Go to Scale”?Reflections on the Promise and Perils of Comprehensive School Reform. Journal of Education for Students Placed At Risk 5(4), 339-354. Retrieved fromwww.leaonline.com/doi/pdf/10.1207/S15327671ESPR0504
This article directly questions whether or not the condi-tions necessary for scaling up will ever exist if educationdoes not change. It is not a manifesto, but a balancedreview of a decade worth of CSR data, highlighting impor-tant lessons learned from the experience. The bibliographyis full of good citations on CSR studies.
©2007 MASS INSIGHT90
Kowal, J. M. & Arkin, M. D. (2005). School RestructuringOptions under No Child Left Behind: What Works When?Contracting with External Education Management Providers.Naperville, IL: Learning Point Associates. Retrieved fromwww.ncrel.org/csri/resources/ncrel/knowledgeissues/Contracting.htm
This part of the What Works When series for schoolrestructuring provides a strong foundation to understandthis often-discussed but minimally-studied educationalstrategy. The report provides a survey of the research oneducational management providers, and notes the success-es and challenges these efforts have shown.
Kowal, J. M. & Hassel, E. A. (2005). School Restructuring Options under No Child Left Behind: What Works When?Turnarounds with New Leaders and Staff. Naperville, IL:Learning Point Associates. Retrieved fromwww.ncrel.org/csri/resources/ncrel/knowledgeissues/Turnarounds.htm
This part of the What Works When series for schoolrestructuring discusses options for replacing school leadersand staff and addresses the qualities of an effective turn-around leader.
Steiner, L. M. (2005). School Restructuring Options under NoChild Left Behind: What Works When? State Takeovers ofIndividual Schools. Naperville, IL: Learning Point Associates.Retrieved from www.ncrel.org/csri/resources/ncrel/knowledgeis-sues/Takeovers.pdf
This part of the What Works When series for schoolrestructuring provides an overview of the options availablefor state takeover of individual schools. The report reviewspast takeovers and suggests success factors and potentialchallenges. It notes that very few states have taken overindividual schools despite having the legislative authorityto do so.
Tough, Paul. (2006, November 26). What it Takes to Make aStudent. New York Times Sunday Magazine.
This article looks at the political history and research onefforts to close the achievement gap between poor/minori-ty students and wealthier/white students. The author con-cludes that we have the means to close the gap, but thatwill require new strategies and public will.
Leadership for Turnaround
Davis, S., Darling-Hammond, L., et al. (2005). School LeadershipStudy: Developing Successful Principals. Palo Alto, CA: StanfordEducational Leadership Institute. Retrieved from http://seli.stan-ford.edu/research/documents/SELI_sls_research_review.pdf
This study makes a compelling case that school leadershipis second only to classroom instruction in influencing stu-dent learning. The report describes the elements of goodleadership; presents research on characteristics of pro-grams that will develop these leadership skills; and sug-gests numerous pathways to leadership development.
Fullan, M. (2005). Turnaround Leadership. The Educational Forum, 69(2), 174-181. Retrieved fromwww.kdp.org/archives/files/edforum/FV69N2P174-181.pdf
Fullan cautions that turnaround leadership can easily sac-rifice long-term gain for short-term superficial gain. Fullanbelieves capacity building must be at the key to any long-term effort of turnaround or improvement.
Orr, M. T., Byrne-Jimenez, M., McFarlane, P., & Brown, B.(2005, January). Leading out from Low-performing Schools: The Urban Principal Experience. Leadership and Policy inSchools, 4(1), 23-54. Retrieved fromwww.ingentaconnect.com/.../lpos/2005/00000004/
This report examines the role urban principals play in turn-ing around low-performing schools. It addresses key issuesof urban principalship, including the lack of clear evidenceon how to effectively turn around low-performing schools;
Resources continued
THE TURNAROUND CHALLENGE: SUPPLEMENT 91
the size and inexperience of urban districts’ leadershipteams; and differences between principals’ and districts’expectations for principal leadership and school change.
Waters, T., Marzano, R. J., et al. (2003). Balanced Leadership:What 30 Years of Research Tells us about the Effect of Leadershipon Student Achievement. Aurora, CO: McREL. Retrieved fromwww.mcrel.org/PDF/LeadershipOrganizationDevelopment/5031RR_BalancedLeadership.pdf
This meta-analysis of research over the past 30 yearsaddressing the effects of leadership on student achievementconcludes there is a relationship between leadership andstudent achievement with an average effect size of .25. Thestudy also finds 21 specific leadership responsibilities sig-nificantly correlated with student achievement.
Turnaround Policymaking: What’s Required to ProduceFundamental Change
(2004). Partners in Progress: A Framework for Raising StudentAchievement in Under-performing School Districts. Boston, MA:Governor’s Task Force on State Intervention in Under-perform-ing Districts. Retrieved fromwww.doe.mass.edu/infoservices/news04/Partners_in_Progress_04_4.pdf
This report provides compelling arguments for a districtrole in improving low-performing schools. The reportdefines characteristics of effective school districts, presentsfive major barriers to success, and makes recommenda-tions for statewide initiatives and targeted initiatives forunder performing districts.
(2005). Holding High Hopes: How High Schools Respond to StateAccountability Policies. Philadelphia, PA: Consortium for PolicyResearch in Education (CPRE). Retrieved fromwww.cpre.org/Publications/rr56.pdf
Focused on high schools, this report outlines 1) highschool responses to external accountability; 2) How
accountability influences high school decision making; 3)Efforts designed to improve instruction; 4) Districtresponses to accountability.
(2006, September 13). Leading for Learning. Supplement toEducation Week, S1-S19. Retrieved fromhttp://www.ecs.org/html/offsite.asp?document=http%3A%2F%2Fwww%2Eedweek%2Eorg%2Fmedia%2F03wallace%2Epdf
This series of articles and data reports provide a strongoverview of state efforts to help districts and schoolsimprove learning. The articles describe different types andlevels of support provided, and highlight effective practicesin Kentucky, New Mexico, and Pennsylvania.
Bowels, S. A., Churchill, A. M., et al. (2002). School and DistrictIntervention: A Decision-making Framework for Policymakers.Amherst, MA: University of Massachusetts Center for EducationPolicy. Retrieved fromwww.umass.edu/education/cep/research/intervention.htm
This report provides a step-by-step framework for policy-makers to understand district and school interventions.The report includes an easy-to-follow set of questions forpolicy makers covering: 1) performance criteria; 2) strate-gic criteria; 3) diagnostic intervention; 4) corrective inter-vention; 5) target; and 6) exit criteria.
Colby, S., K. Smith, et al. (2005). Expanding the Supply of High-quality Public Schools. Boston, MA: The Bridgespan Group.Retrieved fromhttp://www.bridgespangroup.org/kno_articles.html
This report cites two major levers associated with creatingand replicating successful schools: 1) The degree of mana-gerial responsibility, support and control the organizationchooses to exercise; and 2) the specificity of school design.The report provides an effective graphic placing the vari-ous school developers on a matrix of design specificity andmanagement responsibility, support, and control.
©2007 MASS INSIGHT92
Kirst, M. W. (2002). Mayoral Influence, New Regimes, and PublicSchool Governance. Philadelphia, PA: Consortium for PolicyResearch in Education (CPRE). Retrieved fromwww.cpre.org/Publications/rr49.pdf
This report provides a solid background to understandingthe growing trend of mayoral control over the publicschool system. This report presents a range from lowinvolvement to high involvement and provides analysis ofcities across the country that fall along this range.
Mazzeo, C. & Berman, I. (2003). Reaching New Heights: TurningAround Low-performing Schools. Washington DC: NationalGovernors Association Center for Best Practices. Retrieved fromwww.nga.org/cda/files/0803REACHING.PDF
This guide for governors lists five guiding principles: 1)Not all low-performing schools are the same; 2) Capacity-building must be part of the solution; 3) Districts areessential collaborators; 4) Be prepared for the long haul;and, 5) Assistance to low-performing schools should bepart of a larger strategy.
McRobbie, J. (1998). Can State Intervention Spur AcademicTurnaround? San Francisco, CA: WestEd. Retrieved fromwww.wested.org/cs/we/view/rs/470
This paper examines issues states confront when devis-ing programs of academic intervention for low-perform-ing schools. It emphasizes the need for clarity, fairness,coherence, understandability, capacity building, andlegal defensibility.
Mintrop, H. & Trujillo, T. (2005). Corrective Action in Low-per-forming Schools: Lessons for NCLB Implementation from Stateand District Strategies in First-generation Accountability Systems.Los Angeles, CA: National Center for Research on Evaluation,Standards, and Student Testing. Retrieved fromwww.cse.ucla.edu/reports/R657.pdf
This report carefully reviews the results of first-genera-tion accountability systems and draws important lessonsand conclusions from these states’ experiences. Viable
solutions are offered along with the clear message thatturning around low performing schools requires large-scale commitment and investment by state Departmentsof Education.
Scaling Up Turnaround: An Analysis of Current State andDistrict Efforts
Note: see Reference Section in the Main Report for many moreresources in this category. The following is just a sampling:
Views into 38 school districtsCenter on Education Policy. (2006). From the Capital to theClassroom: Year 4 of the No Child Left Behind Act. WashingtonDC: Author. Retreived from the Center on Education Policy:http://www.cep-dc.org/index.cfm?fuseaction=feature.showFeature&FeatureID=29&C:\CFusionMX7\verity\Data\dummy.txt
This comprehensive national study of the impact of NCLBincludes extensive research and analysis, a survey of educa-tion officials in 50 states, a nationally representative surveyof 299 school districts, and in-depth case studies in 38 geo-graphically diverse districts and 42 individual schools.Read the full report, as well as 38 separate case studies.
BaltimoreRhim, L. M. (2004). Restructuring Schools in Baltimore: AnAnalysis of State and District Efforts. Denver, CO: EducationCommission of the States. Retrieved fromwww.ecs.org/html/Document.asp?chouseid=5326
This report examines restructuring initiatives by theMaryland Department of Education and the BaltimoreCity Public Schools. It provides a thorough descriptionand analysis of how education management contractingwas used as a turnaround strategy.
Resources continued
THE TURNAROUND CHALLENGE: SUPPLEMENT 93
CaliforniaO’Day, J. & Bitter, C. (2003). Evaluation Study of the ImmediateIntervention/Under-performing Schools Program and HighAchieving/Improving Schools Program of the Public SchoolsAccountability Act of 1999. Palo Alto, CA: AIR. Retrieved fromwww.air.org/publications/pubs_ehd_school_reform.aspx
This evaluation of California’s accountability system(Public Schools Accountability Act or PSSA) paints a fair-ly stark picture. Overall, PSAA focused attention onimproving student achievement in low performingschools. However, both the lower-achieving and the high-er-achieving schools received negligible benefits fromthese programs.
PhiladelphiaRhim, L. M. (2005). School Restructuring in Philadelphia:Management Lessons from 2002 to 2005. Denver, CO: EducationCommission of the States. Retrieved from www.ecs.org/clearing-house/64/01/6401.pdf
This concise policy brief examines the Philadelphia experi-ment in a mixed provider model of restructuring.Philadelphia can serve as a harbinger of NCLB restructur-ing, and this report summarizes the efforts and providespreliminary analysis and conclusions.
Useem, E. (2005). Learning from Philadelphia’s School Reform:What do the Research Findings Show so Far? Philadelphia, PA:Research for Action. Retrieved fromwww.researchforaction.org/PSR/PublishedWorks.htm
This report is the definitive study of the beginnings ofPhiladelphia’s experiment with a diverse providermodel. It is too early to tell whether or not the experi-ment will be successful, but this report offers importantinsights for those who may wish to learn from thePhiladelphia experience.
Kansas CityConnell, J. (2003). Getting Off the Dime Toward MeaningfulReform in Secondary Schools: Lessons on How ModelDevelopers and School Districts can Facilitate the Success ofSchool Reform. Benchmarks 4(3), 1-11. Retrieved fromwww.irre.org/publications/pdfs/benchmarks_summer_2003.pdf
This report presents lessons learned from the First ThingsFirst (FTF) model, focusing largely on the Kansas City,Kansas, school reform effort. Although Kansas City is notnecessarily typical of a large, urban, academically-chal-lenged district, the results for secondary schools are fairlyimpressive.
MassachusettsMass Insight, 2001-05, Building Blocks Initiative. Available:http://www.buildingblocks.org
The Building Blocks Initiative Educators’ Blueprints are asearchable library of effective organizational strategies toimprove schools. These strategies have been pursued withsuccess by schools and districts in Massachusetts that areproducing student achievement levels exceeding those ofschools and districts serving similar student populations.

©2007 MASS INSIGHT94
The Turnaround Challenge, including this supplement to that report, ispart of a larger initiative aimed at helping states, districts, schools, and
partners to successfully address the issue of chronically under-performingschools – and to use failing-school turnaround as the entry point for funda-mental change more broadly in public education.
The Bill & Melinda Gates Foundation awarded the Mass Insight Education &Research Institute a grant late in 2005 to produce a framework for states anddistricts seeking a flexible, systemic approach for swift, significant improve-ment in schools (particularly high schools) that have clearly failed their mis-sion, producing track records of under-achievement that are indefensiblypoor. The Turnaround Challenge and corollary resources that can be found atwww.massinsight.org are the result of that grant.A follow-up grant from the Gates Foundation is supporting a Mass Insight-ledeffort to inform national and state leader discussions and actions around theissue of school turnaround, and to carry out a research and developmentprocess, in conjunction with national collaborators, that will help states, dis-tricts, and others implement the report's turnaround framework at three levels:• State and District Strategies for Turnaround at Scale: Developing work-
plans and templates for the strategic approaches, organizational structures,and policy language states and districts need to undertake effective turn-around in the bottom five percent of under-performing schools – and toinvite schools not yet in NCLB's Restructuring category to perform “pre-emptive turnaround,” using similar strategies.
• School Cluster/Partner Network: Defining a new model for integratedschool network partnerships – school clusters that amount to “mini-dis-tricts” supported by lead external partners and special district turnaroundoffices – and building a new generation of lead turnaround partners askey implementers.
• School: Producing detailed strategy choices, work-plans, and practicaltools for school leaders and their partners in implementing turnaround.
This research-and-development effort will also lay initial groundwork forthree potential national initiatives to build out these strategies:• Pilot Cohort of Turnaround States and Districts: Working closely with
three to five states and as many large urban districts (along with otherpartners) to implement a full range of turnaround strategies, adapted foreach site, emerging from this work.
• Turnaround Partner Capacity-Building: Creating intermediary organiza-tions or other national resources that would provide investment and tech-nical assistance to build a viable marketplace of lead turnaround partners.(Mass Insight does not intend to serve a lead turnaround role, but to act asa catalyst for the development of this resource base.)
• National Center: Develop a national center to conduct related research,advocate for comprehensive turnaround, produce additional tools andtemplates, and continue the work of defining and refining school turn-around as discipline.
All of the elements of this follow-up initiative will involve national collabora-tors, including individuals and organizations with particular expertise inurban education (including practitioners and external providers), turnaround(in education and other sectors as well), state policy, mission-driven invest-ment, communications and advocacy, and research. The initiative builds onand directly supports related work that Mass Insight has performed for theWashington and Illinois state boards of education, the latter in partnershipwith Holland & Knight and with contractual support from the GatesFoundation. For more information, please visit us on the web atwww.massinsight.org.
Meeting the Turnaround ChallengeImplementation Strategies and Tools for States, Districts, Schools, and Partners
PROFILE OF THE INITIATIVE
Mass Insight Education & Research Institute Funders
Leadership SponsorsBill & Melinda Gates FoundationBarr FoundationThe Boston FoundationNational Math & Science Initiative• Exxon Mobil Corporation• Bill & Melinda Gates Foundation• Michael & Susan Dell FoundationNellie Mae Education FoundationNewSchools Venture Fund
Major and Contributing SponsorsAnalog DevicesBank of AmericaIrene E. and George A. Davis FoundationEMC CorporationGenzyme CorporationGoodwin ProcterIBMIntel CorporationLiberty MutualMass High Tech CouncilMass Mutual InsuranceMicrosoft CorporationThe Noyce FoundationState Street CorporationTeradyneVerizon Communications
Public Sources of FundsFederal/State• Massachusetts Department of Education• Title IIA and IIB Math and Science Partnership• Comprehensive School Reform• Massachusetts Board of Higher EducationDistricts/Schools: Membership fees and earned revenue for field services
Mass Insight Education & Research Institute, founded in 1997, is an independentnon-profit that organizes public schools, higher education, business, and state government to significantly improve student achievement, with a focus on closingachievement gaps.
Mass Insight's education reform strategies are defined by two convictions: thatchange at scale depends on the practical integration of research, policy, and practice;and that only dramatic and comprehensive change in high-poverty schools will produce significant achievement gains. The strategies that Boston-based Mass Insightimplemented to help make Massachusetts a reform model now inform the organiza-tion's national work on two high-impact goals: • using Advanced Placement® as a lever to attain excellence in math and science
achievement and to transform school culture, and • the successful turnaround of consistently under-performing public schools.
We are:Synthesizers and providers of research. Mass Insight is a national resource forpractical information on how to effectively implement standards-based education.
The Turnaround Challenge represents a new form of educational policy research:highly graphical, presented in varying user-formats (print, presentation, web), andexpressly designed to spur action on both the policy and practice fronts. Our BuildingBlocks Initiative (www.buildingblocks.org) has been cited as a model for effective-practice research by the U.S. Department of Education. The landmark Keep thePromise Initiative studied urban, at-risk high school students in the first three classessubject to Massachusetts' MCAS graduation requirement and district strategies forserving them.
Policy facilitators. We are a leading statewide convener and catalyst for thoughtful,informed state education policymaking. Mass Insight's Great Schools Campaign and itspredecessor, the Campaign for Higher Standards, have played a highly visible role inshaping the priorities of Massachusetts' second decade of school reform. Mass Insightconsults on education policy formation outside Massachusetts as well - most recentlyhelping to design school turnaround programs in Illinois and Washington State.
Leaders in standards-based services to schools. We provide practical, research-based technical services, staff and leadership development programs, and consultingservices to schools and school districts - particularly to members of the Great SchoolsCoalition, a 10-year-old partnership of nearly 30 change-oriented Massachusetts districts. Our field services have focused on math and science, and over the next five-to-ten years will revolve principally around using increased access to AP® courses andimproved performance on AP tests to catalyze dramatic cultural and instructionalchange in schools across grades 6-12. The effort will be funded in part through theNational Math & Science Initiative, which recently awarded Mass Insight $13 millionas the Massachusetts lead on a competitive national RFP.
See www.massinsight.org for more details.

18 Tremont Street, Suite 930, Boston, MA 02108 • tel: 617-778-1500 • fax: 617-778-1505 • www.massinsight.org
School Turnaround: a dramatic and
comprehensive intervention in a low-performing
school that produces significant gains in student
achievement within two academic years.
The Turnaround
Challeng
e — Sup
plem
entM
ass Insight