Embed Size (px)
Citation preview
The UK Party System and Party Politics
Part II: Governance, Ideology and Policy
Patrick Dunleavy
Gv 311: British Politics course, Lecture 14 Lent Term
© P.J. Dunleavy
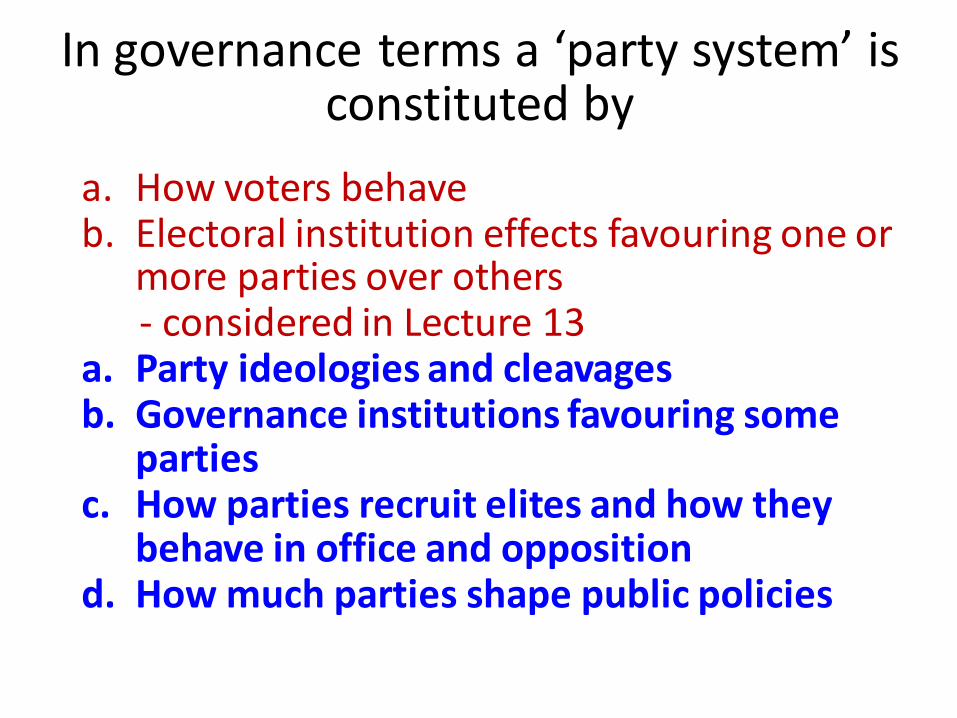
In governance terms a ‘party system’ is constituted by
a. How voters behave b. Electoral institution effects favouring one or
more parties over others - considered in Lecture 13 a. Party ideologies and cleavages b. Governance institutions favouring some
parties c. How parties recruit elites and how they
behave in office and opposition d. How much parties shape public policies
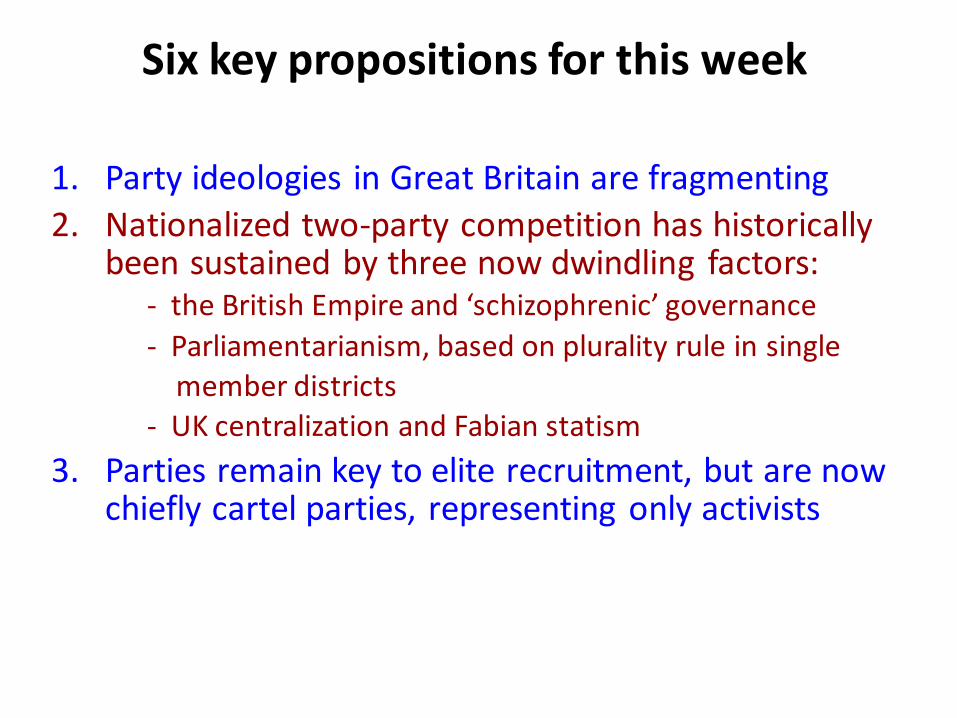
Six key propositions for this week
1. Party ideologies in Great Britain are fragmenting
2. Nationalized two-party competition has historically been sustained by three now dwindling factors:
- the British Empire and ‘schizophrenic’ governance
- Parliamentarianism, based on plurality rule in single member districts
- UK centralization and Fabian statism
3. Parties remain key to elite recruitment, but are now chiefly cartel parties, representing only activists
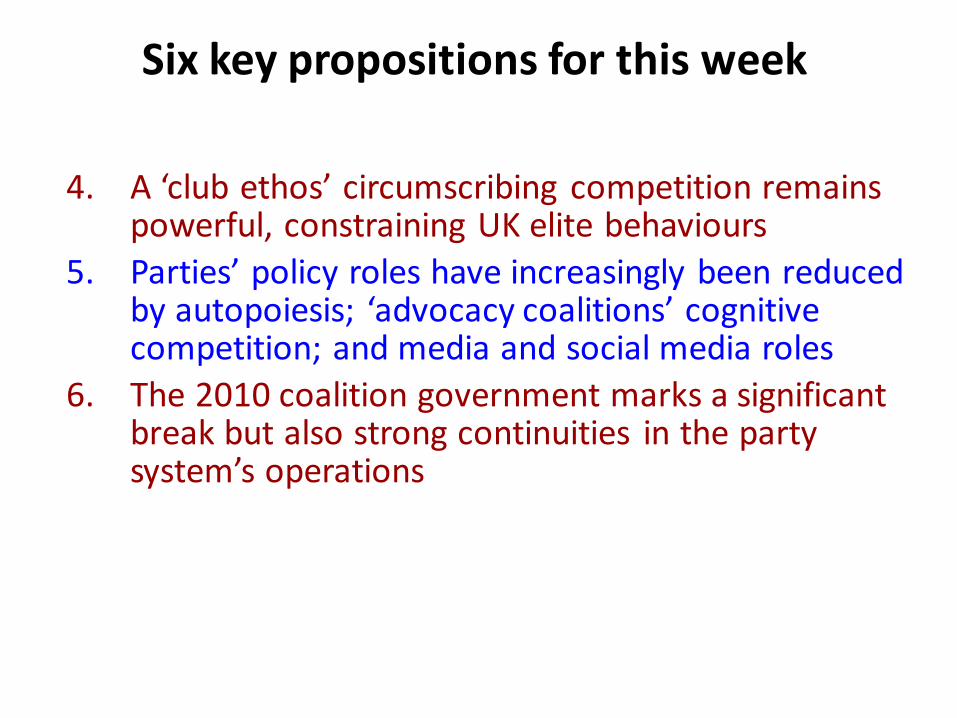
4. A ‘club ethos’ circumscribing competition remains powerful, constraining UK elite behaviours
5. Parties’ policy roles have increasingly been reduced by autopoiesis; ‘advocacy coalitions’ cognitive competition; and media and social media roles
6. The 2010 coalition government marks a significant break but also strong continuities in the party system’s operations
Six key propositions for this week
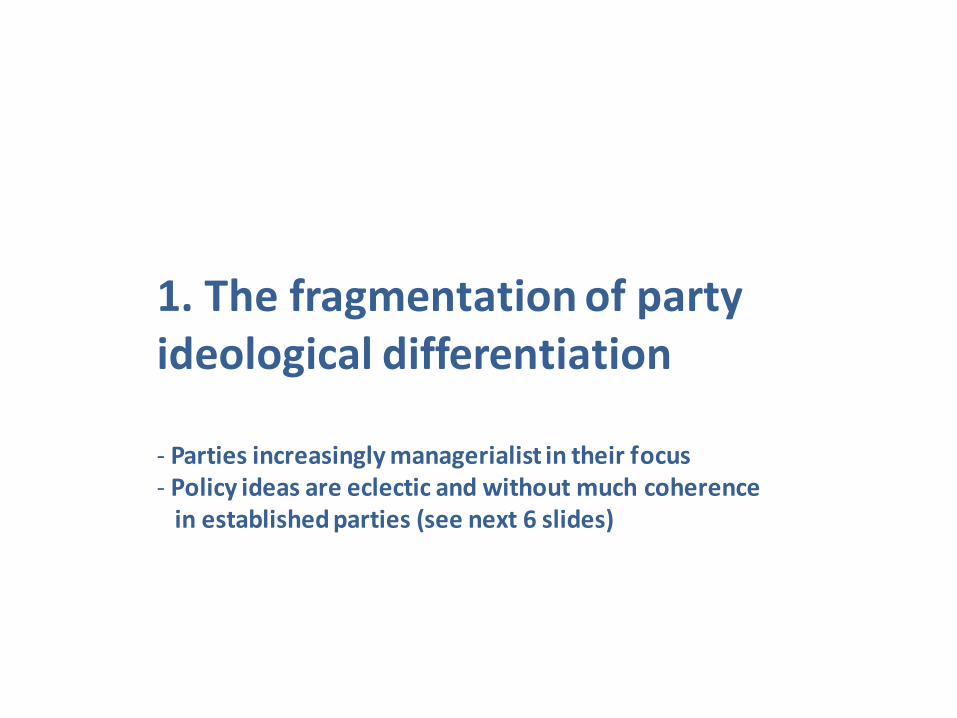
1. The fragmentation of party ideological differentiation - Parties increasingly managerialist in their focus - Policy ideas are eclectic and without much coherence in established parties (see next 6 slides)
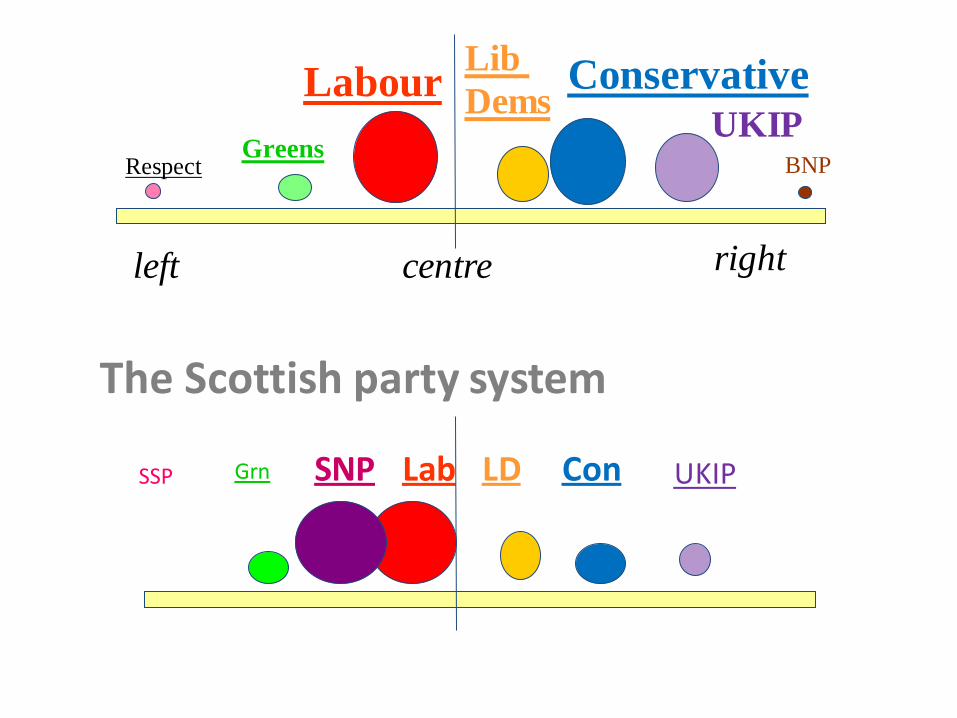
Con Lab LD SNP SSP Grn
The Scottish party system
UKIP
Conservative
centre
Labour Lib
Dems
BNP Greens
UKIP
left right
Respect
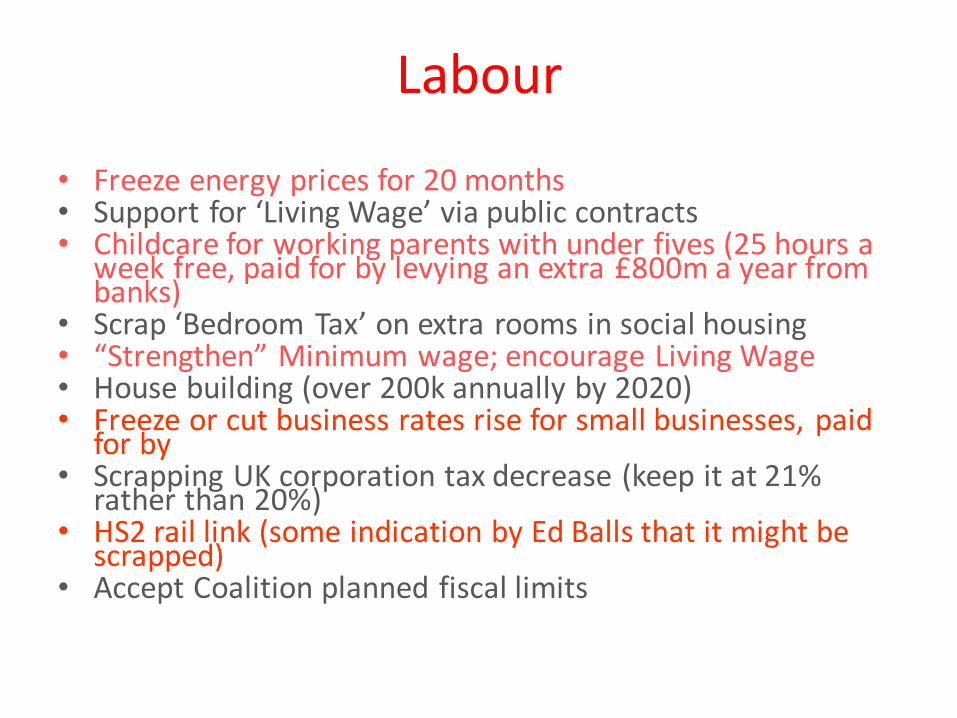
Labour
• Freeze energy prices for 20 months • Support for ‘Living Wage’ via public contracts • Childcare for working parents with under fives (25 hours a
week free, paid for by levying an extra £800m a year from banks)
• Scrap ‘Bedroom Tax’ on extra rooms in social housing • “Strengthen” Minimum wage; encourage Living Wage • House building (over 200k annually by 2020) • Freeze or cut business rates rise for small businesses, paid
for by • Scrapping UK corporation tax decrease (keep it at 21%
rather than 20%) • HS2 rail link (some indication by Ed Balls that it might be
scrapped) • Accept Coalition planned fiscal limits
Conservatives
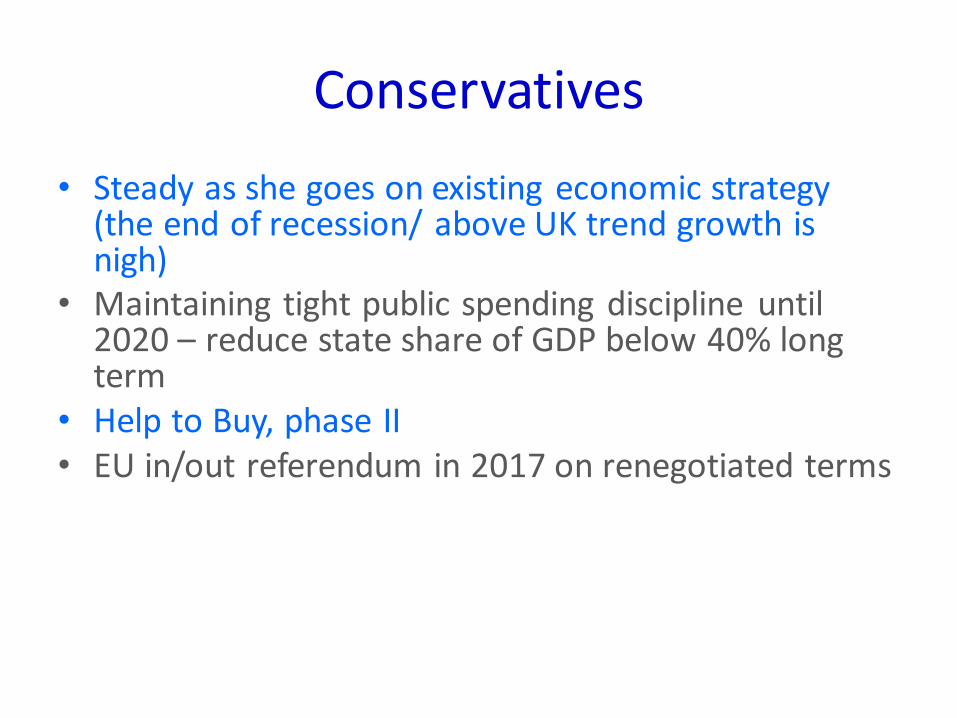
• Steady as she goes on existing economic strategy (the end of recession/ above UK trend growth is nigh)
• Maintaining tight public spending discipline until 2020 – reduce state share of GDP below 40% long term
• Help to Buy, phase II • EU in/out referendum in 2017 on renegotiated terms
Liberal Democrats
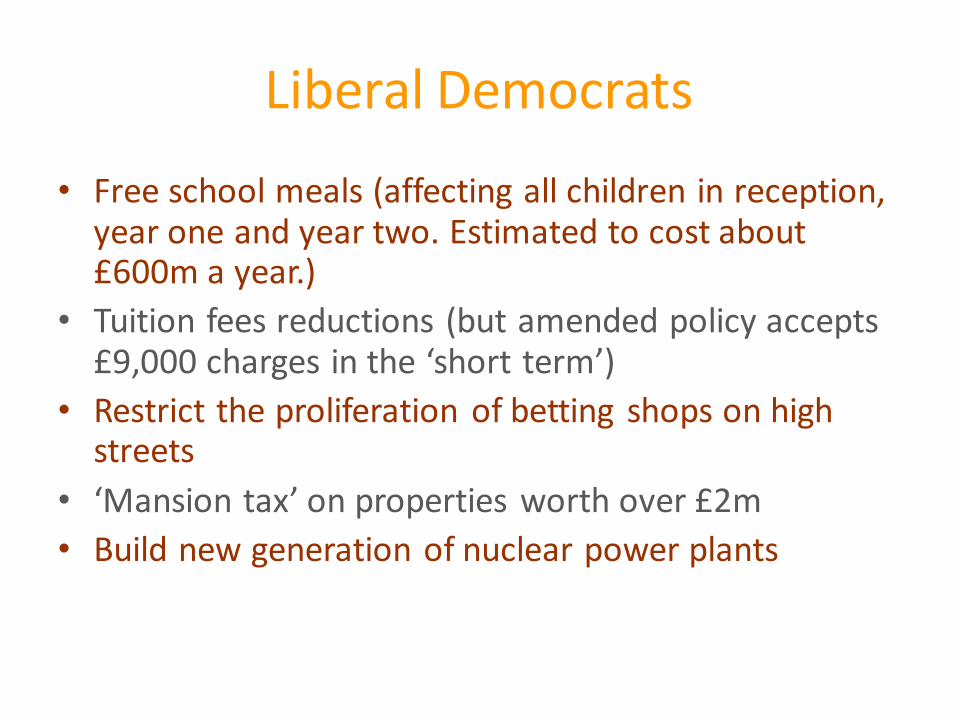
• Free school meals (affecting all children in reception, year one and year two. Estimated to cost about £600m a year.)
• Tuition fees reductions (but amended policy accepts £9,000 charges in the ‘short term’)
• Restrict the proliferation of betting shops on high streets
• ‘Mansion tax’ on properties worth over £2m
• Build new generation of nuclear power plants
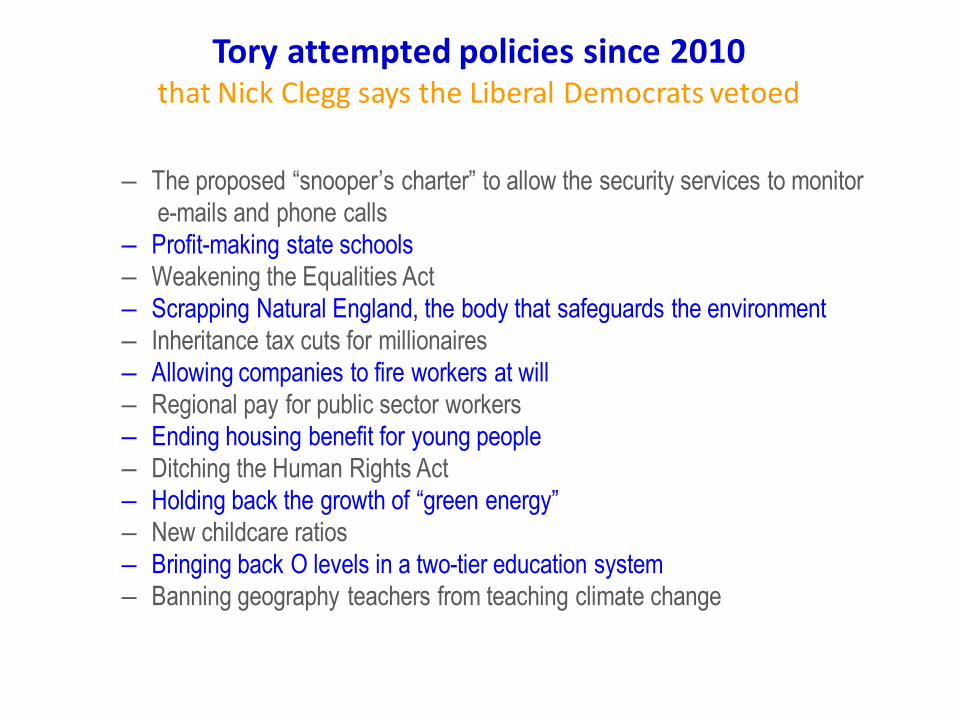
Tory attempted policies since 2010 that Nick Clegg says the Liberal Democrats vetoed
– The proposed “snooper’s charter” to allow the security services to monitor
e-mails and phone calls
– Profit-making state schools
– Weakening the Equalities Act
– Scrapping Natural England, the body that safeguards the environment
– Inheritance tax cuts for millionaires
– Allowing companies to fire workers at will
– Regional pay for public sector workers
– Ending housing benefit for young people
– Ditching the Human Rights Act
– Holding back the growth of “green energy”
– New childcare ratios
– Bringing back O levels in a two-tier education system
– Banning geography teachers from teaching climate change
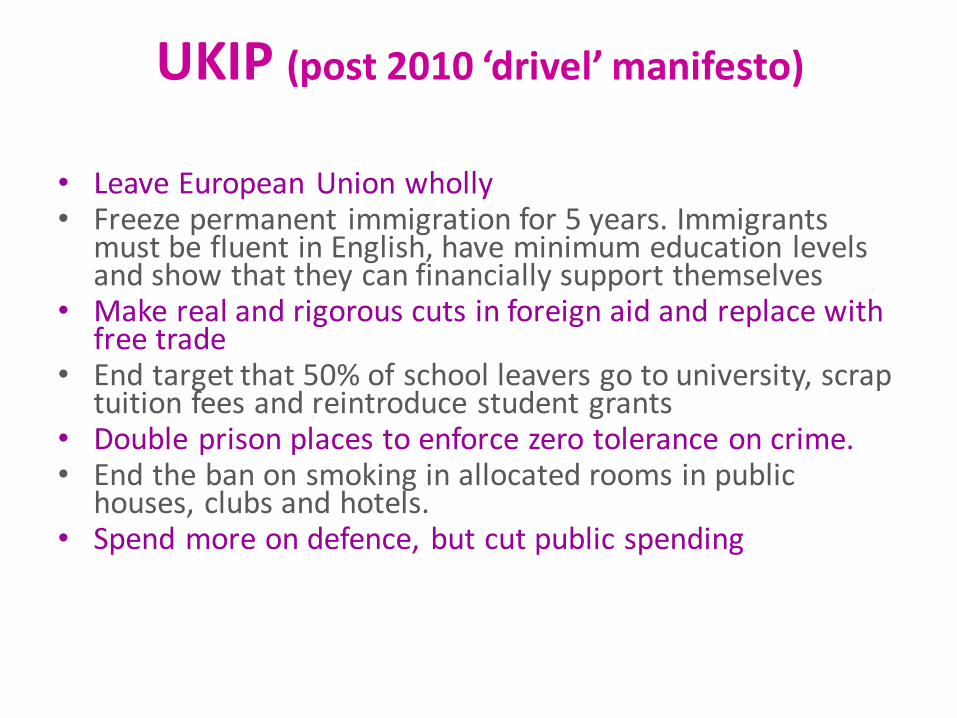
UKIP (post 2010 ‘drivel’ manifesto)
• Leave European Union wholly • Freeze permanent immigration for 5 years. Immigrants
must be fluent in English, have minimum education levels and show that they can financially support themselves
• Make real and rigorous cuts in foreign aid and replace with free trade
• End target that 50% of school leavers go to university, scrap tuition fees and reintroduce student grants
• Double prison places to enforce zero tolerance on crime. • End the ban on smoking in allocated rooms in public
houses, clubs and hotels. • Spend more on defence, but cut public spending
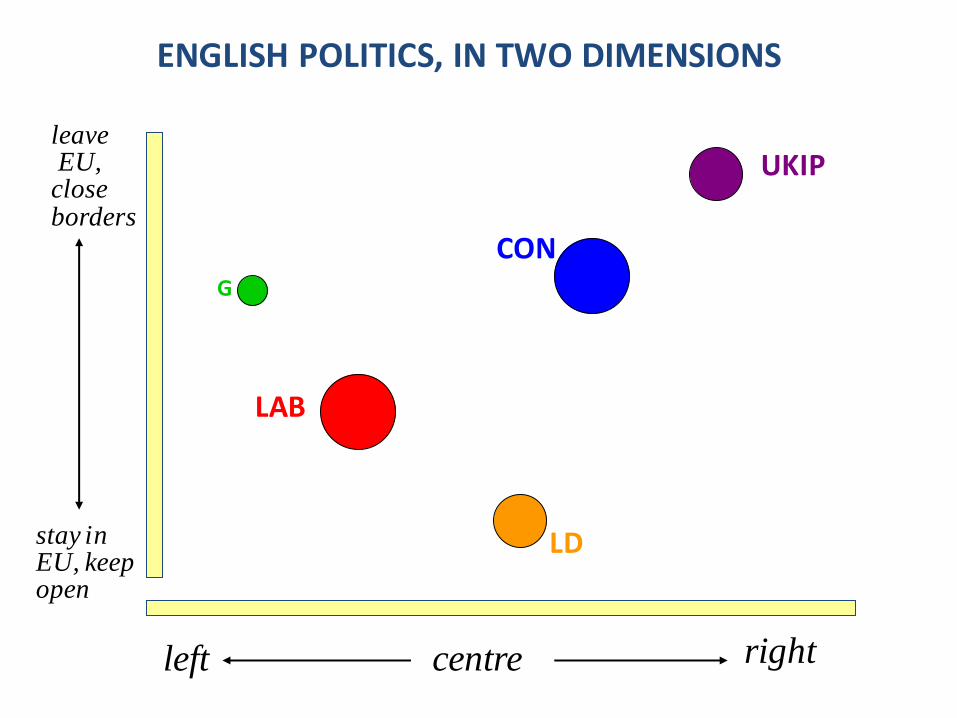
centre left right
CON
LAB
LD
leave EU, close borders
stay in EU, keep open
UKIP
G
ENGLISH POLITICS, IN TWO DIMENSIONS
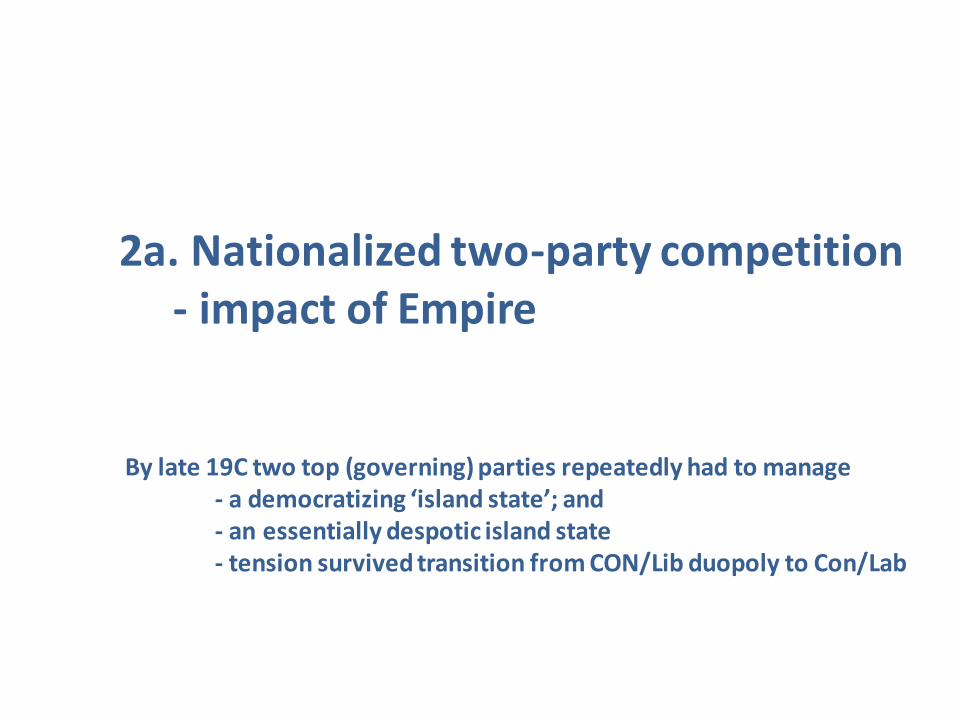
2a. Nationalized two-party competition - impact of Empire By late 19C two top (governing) parties repeatedly had to manage - a democratizing ‘island state’; and - an essentially despotic island state - tension survived transition from CON/Lib duopoly to Con/Lab
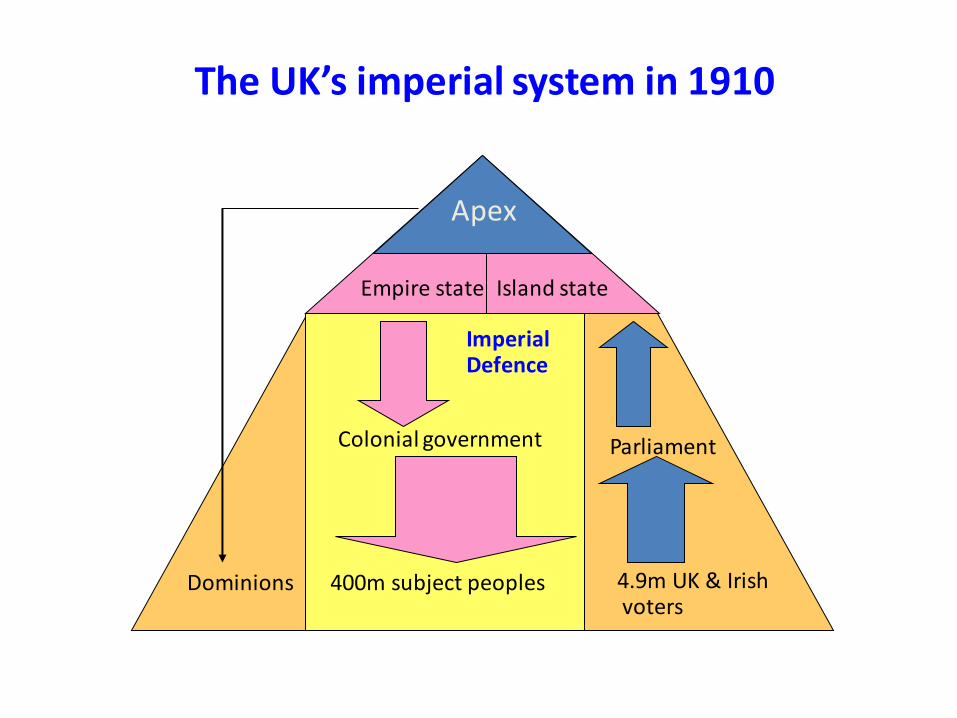
4.9m UK & Irish voters
Parliament
Island state Empire state
Apex
Colonial government
400m subject peoples Dominions
The UK’s imperial system in 1910
Imperial Defence
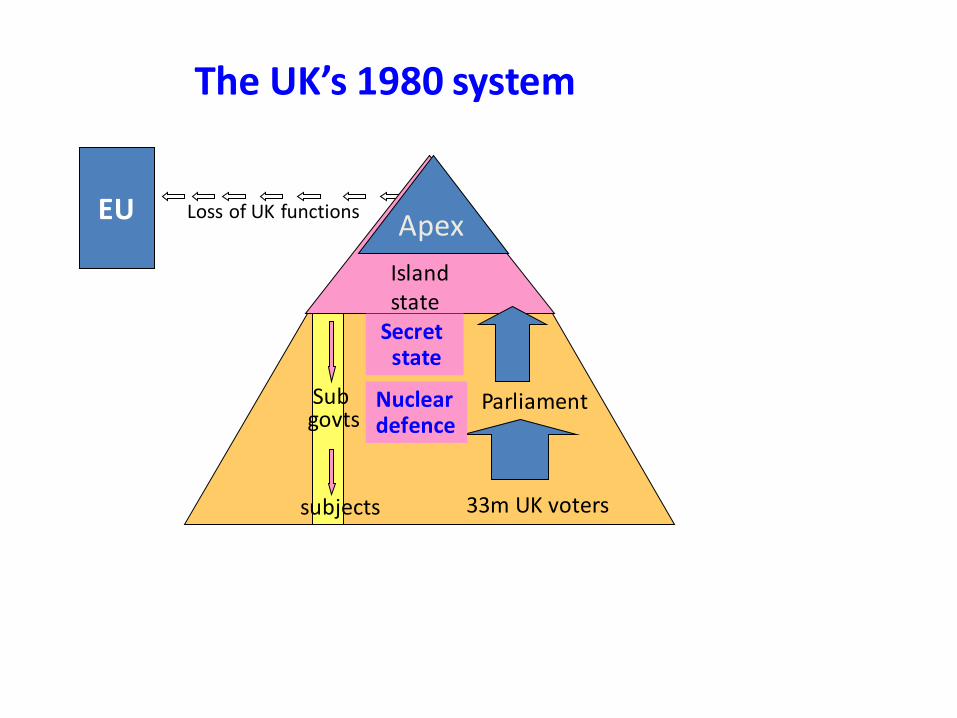
33m UK voters
Parliament
Island state
Apex
Sub govts
subjects
The UK’s 1980 system
Nuclear defence
Secret state
EU Loss of UK functions
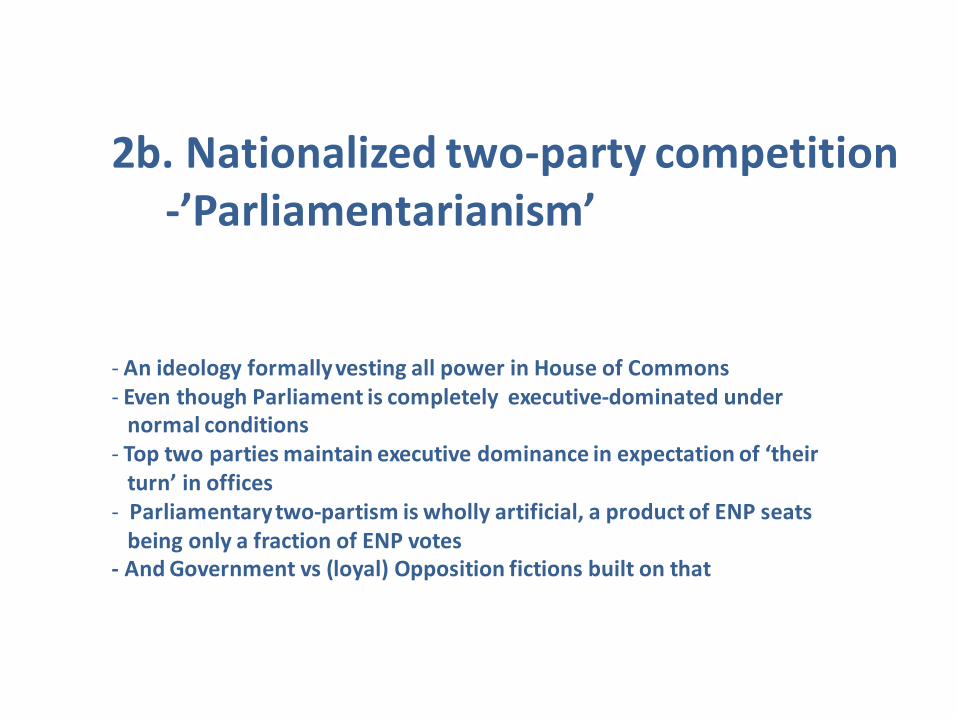
2b. Nationalized two-party competition -’Parliamentarianism’ - An ideology formally vesting all power in House of Commons - Even though Parliament is completely executive-dominated under normal conditions - Top two parties maintain executive dominance in expectation of ‘their turn’ in offices - Parliamentary two-partism is wholly artificial, a product of ENP seats being only a fraction of ENP votes - And Government vs (loyal) Opposition fictions built on that
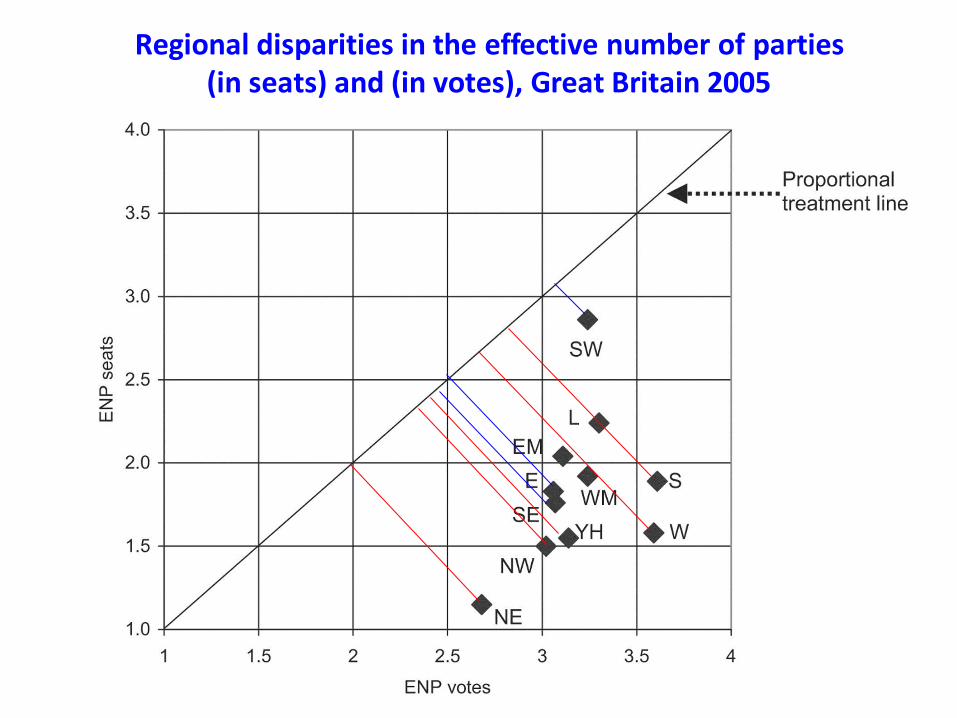
Regional disparities in the effective number of parties (in seats) and (in votes), Great Britain 2005
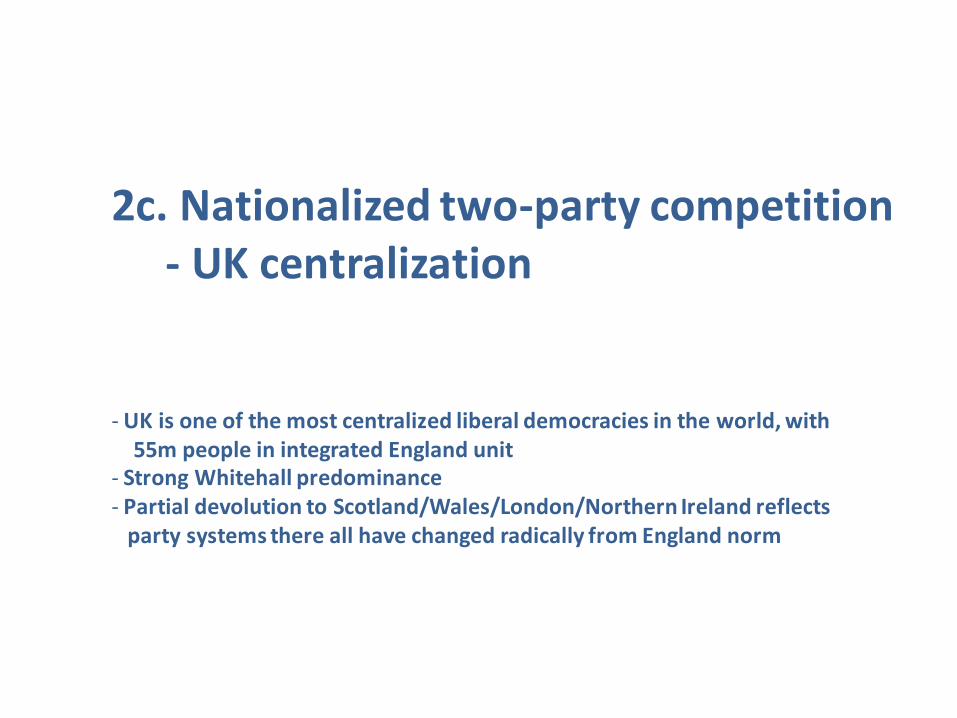
2c. Nationalized two-party competition - UK centralization - UK is one of the most centralized liberal democracies in the world, with 55m people in integrated England unit - Strong Whitehall predominance - Partial devolution to Scotland/Wales/London/Northern Ireland reflects party systems there all have changed radically from England norm
3. ‘Cartel’ parties and elite recruitment
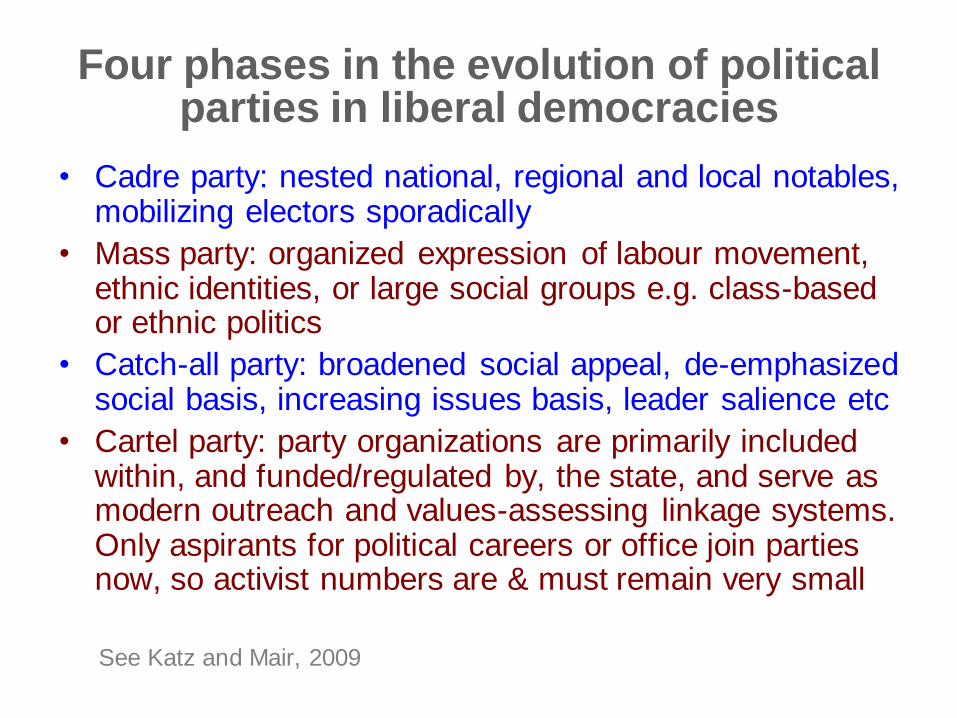
Four phases in the evolution of political parties in liberal democracies
• Cadre party: nested national, regional and local notables, mobilizing electors sporadically
• Mass party: organized expression of labour movement, ethnic identities, or large social groups e.g. class-based or ethnic politics
• Catch-all party: broadened social appeal, de-emphasized social basis, increasing issues basis, leader salience etc
• Cartel party: party organizations are primarily included within, and funded/regulated by, the state, and serve as modern outreach and values-assessing linkage systems. Only aspirants for political careers or office join parties now, so activist numbers are & must remain very small
See Katz and Mair, 2009
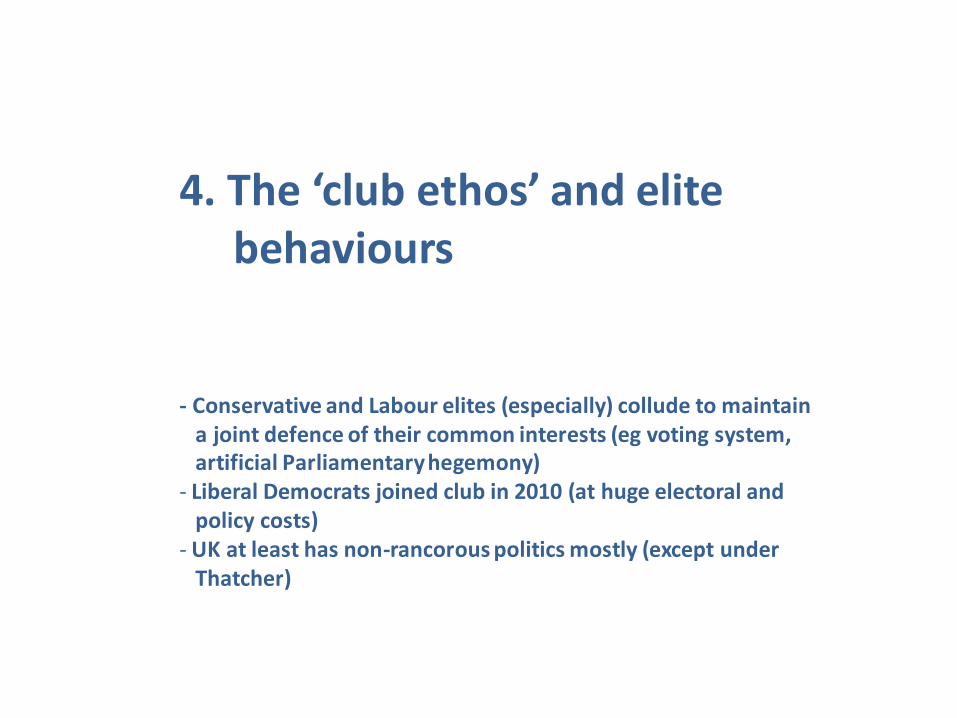
4. The ‘club ethos’ and elite behaviours - Conservative and Labour elites (especially) collude to maintain a joint defence of their common interests (eg voting system, artificial Parliamentary hegemony) - Liberal Democrats joined club in 2010 (at huge electoral and policy costs) - UK at least has non-rancorous politics mostly (except under Thatcher)
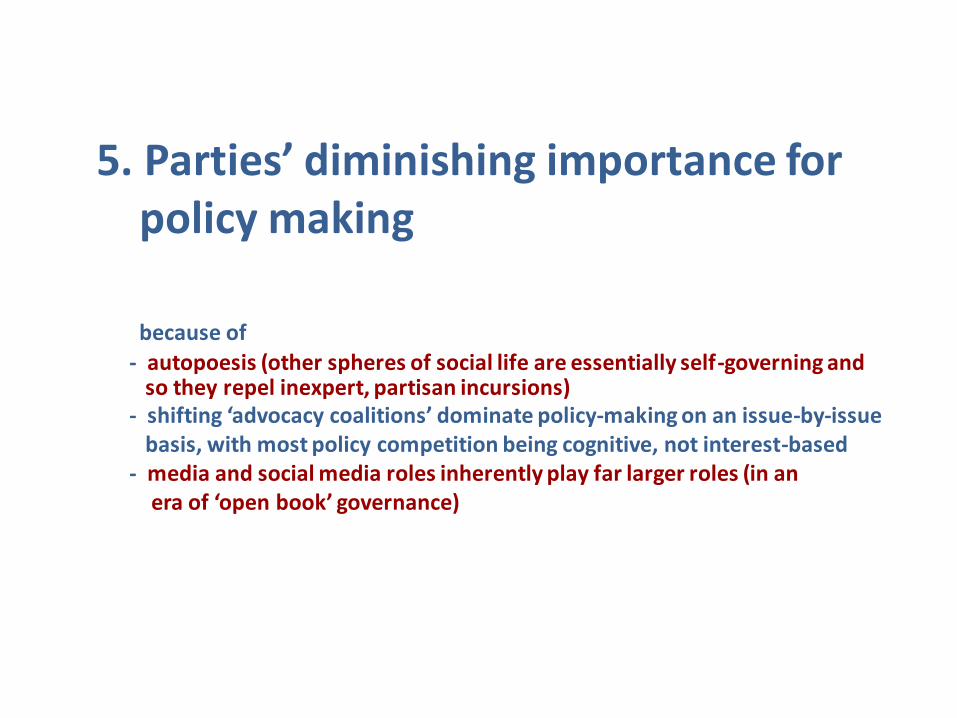
5. Parties’ diminishing importance for policy making because of
- autopoesis (other spheres of social life are essentially self-governing and so they repel inexpert, partisan incursions) - shifting ‘advocacy coalitions’ dominate policy-making on an issue-by-issue basis, with most policy competition being cognitive, not interest-based - media and social media roles inherently play far larger roles (in an era of ‘open book’ governance)
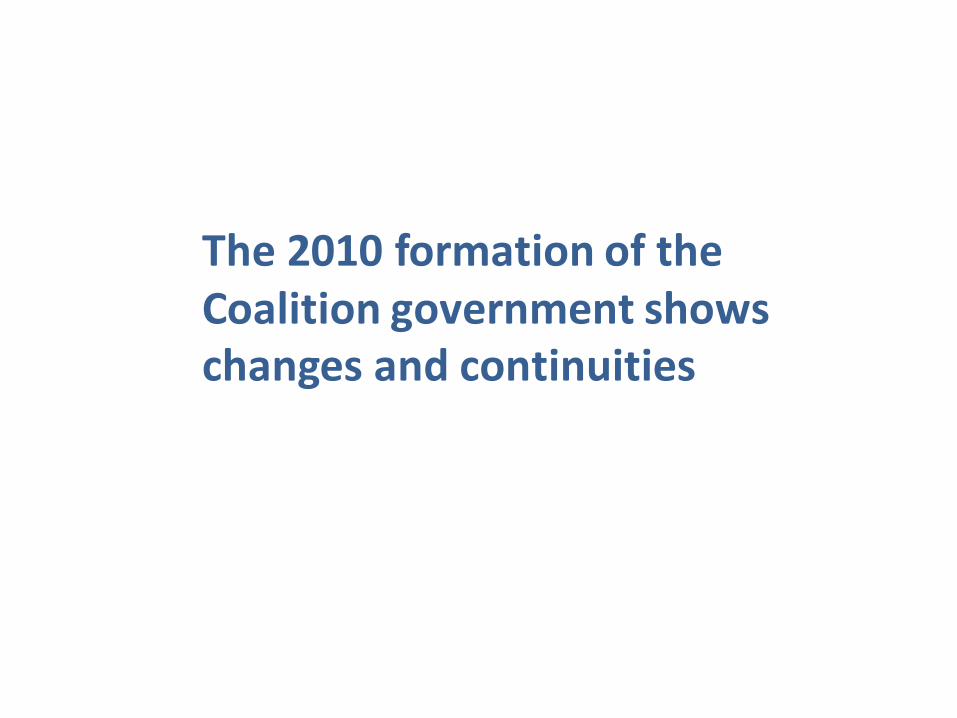
The 2010 formation of the Coalition government shows changes and continuities
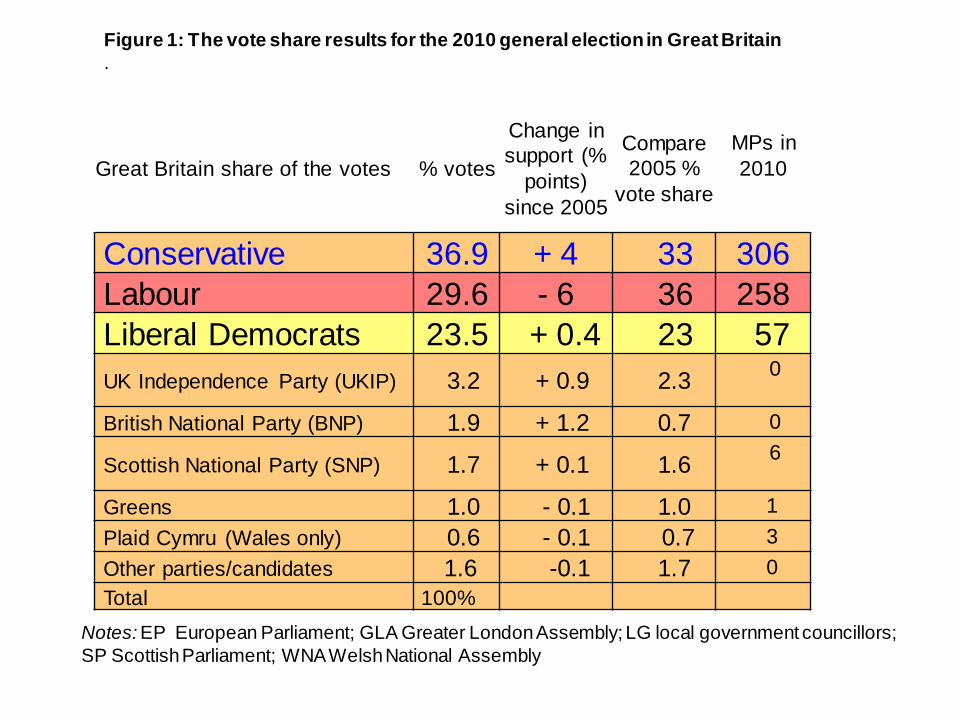
Great Britain share of the votes % votes
Change in
support (%
points)
since 2005
Compare
2005 %
vote share
MPs in
2010
Conservative 36.9 + 4 33 306
Labour 29.6 - 6 36 258
Liberal Democrats 23.5 + 0.4 23 57
UK Independence Party (UKIP) 3.2 + 0.9 2.3 0
British National Party (BNP) 1.9 + 1.2 0.7 0
Scottish National Party (SNP) 1.7 + 0.1 1.6 6
Greens 1.0 - 0.1 1.0 1
Plaid Cymru (Wales only) 0.6 - 0.1 0.7 3
Other parties/candidates 1.6 -0.1 1.7 0
Total 100%
Figure 1: The vote share results for the 2010 general election in Great Britain
.
Notes: EP European Parliament; GLA Greater London Assembly; LG local government councillors;
SP Scottish Parliament; WNA Welsh National Assembly
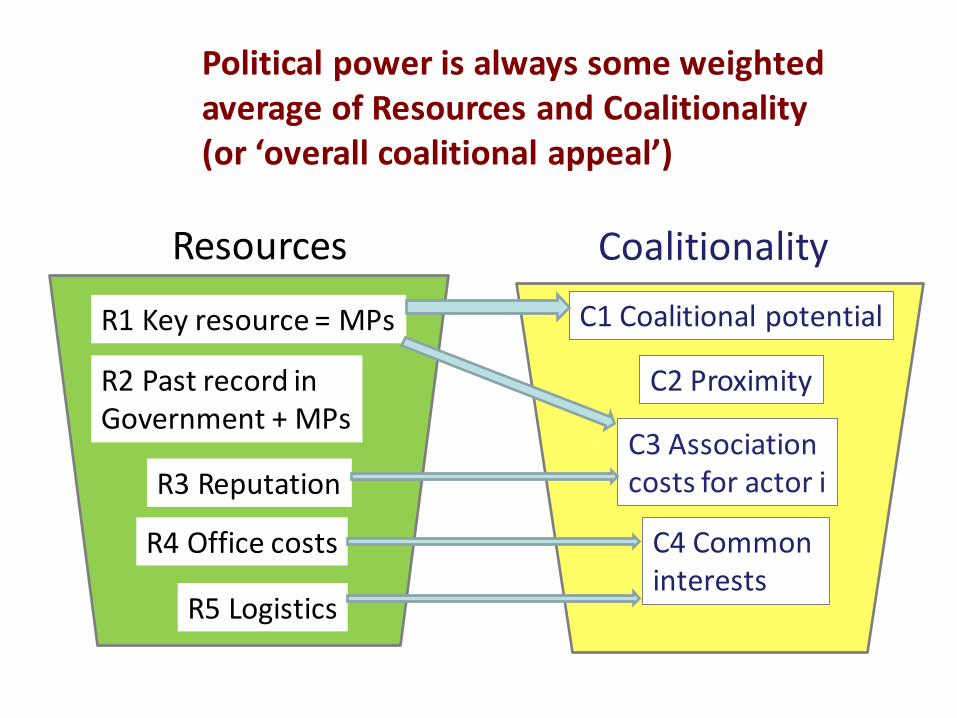
Coalitionality Resources
R1 Key resource = MPs
R2 Past record in Government + MPs
R3 Reputation
R5 Logistics
C1 Coalitional potential
C2 Proximity
Political power is always some weighted average of Resources and Coalitionality (or ‘overall coalitional appeal’)
R4 Office costs
C3 Association costs for actor i
C4 Common interests
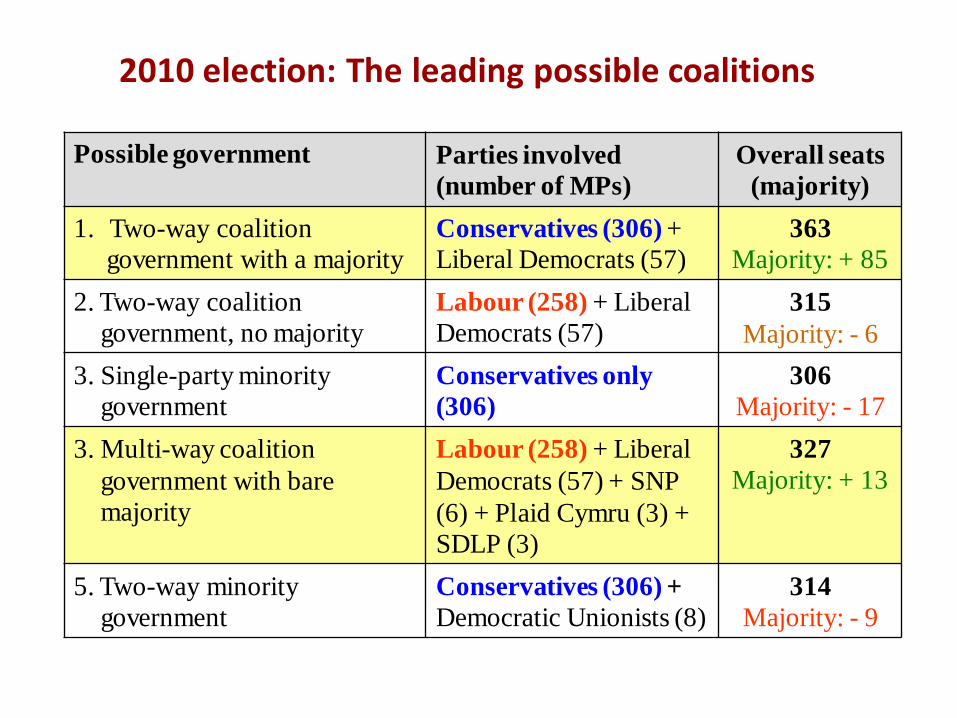
Possible government Parties involved
(number of MPs) Overall seats
(majority)
1. Two-way coalition
government with a majority Conservatives (306) +
Liberal Democrats (57) 363
Majority: + 85
2. Two-way coalition
government, no majority Labour (258) + Liberal
Democrats (57) 315
Majority: - 6
3. Single-party minority
government Conservatives only
(306) 306
Majority: - 17
3. Multi-way coalition
government with bare
majority
Labour (258) + Liberal
Democrats (57) + SNP
(6) + Plaid Cymru (3) +
SDLP (3)
327
Majority: + 13
5. Two-way minority
government Conservatives (306) +
Democratic Unionists (8) 314
Majority: - 9
2010 election: The leading possible coalitions
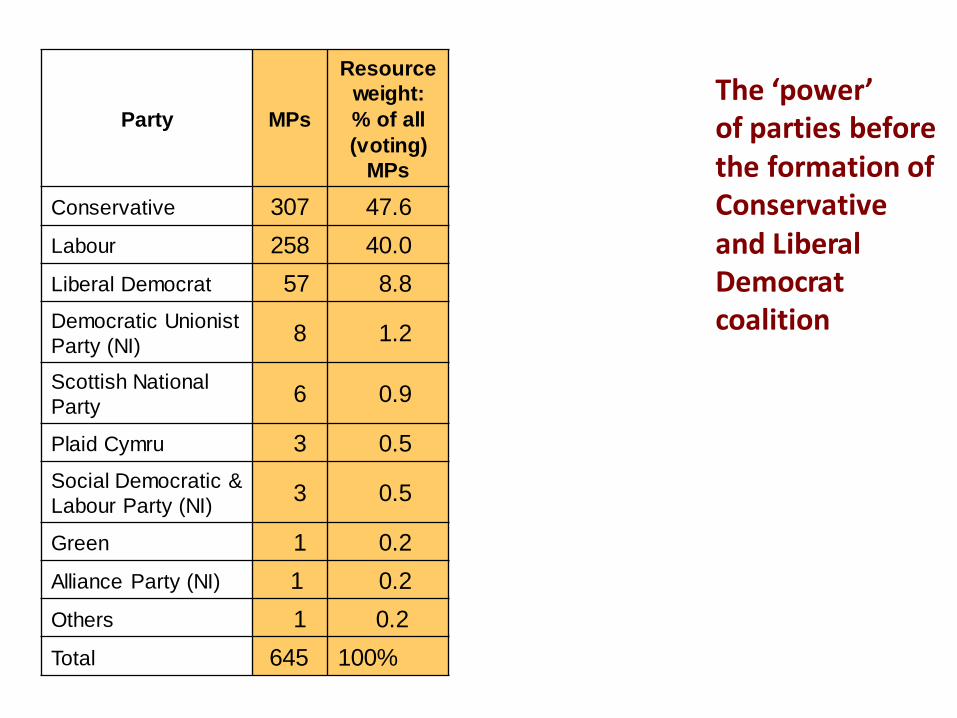
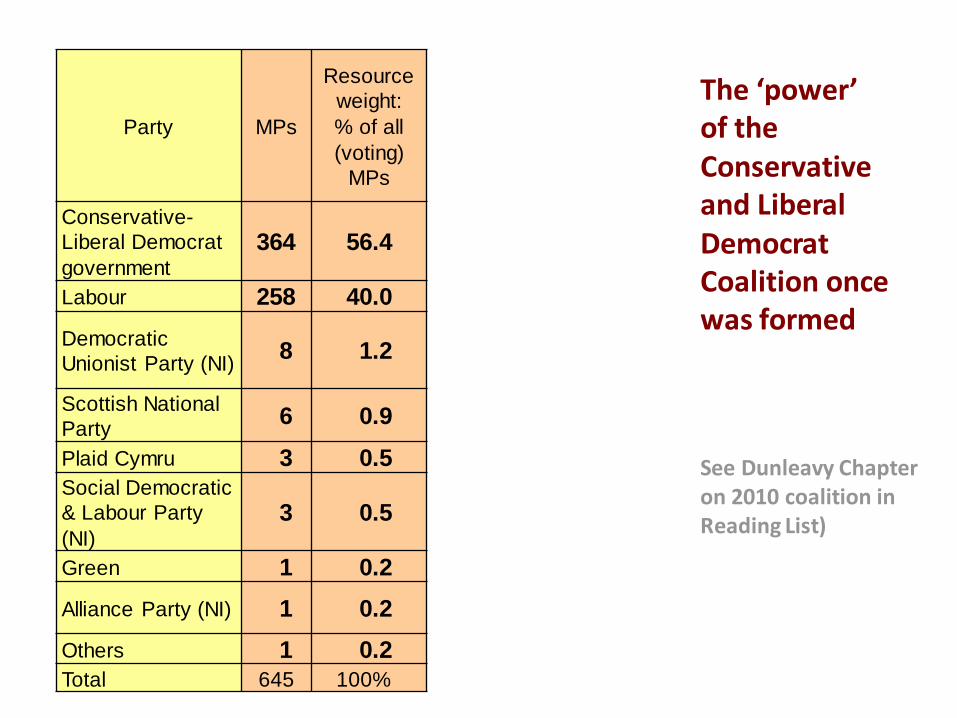
Party MPs
Resource
weight:
% of all
(voting)
MPs
Conservative 307 47.6
Labour 258 40.0
Liberal Democrat 57 8.8
Democratic Unionist
Party (NI) 8 1.2
Scottish National
Party 6 0.9
Plaid Cymru 3 0.5
Social Democratic &
Labour Party (NI) 3 0.5
Green 1 0.2
Alliance Party (NI) 1 0.2
Others 1 0.2
Total 645 100%
The ‘power’ of parties before the formation of Conservative and Liberal Democrat coalition
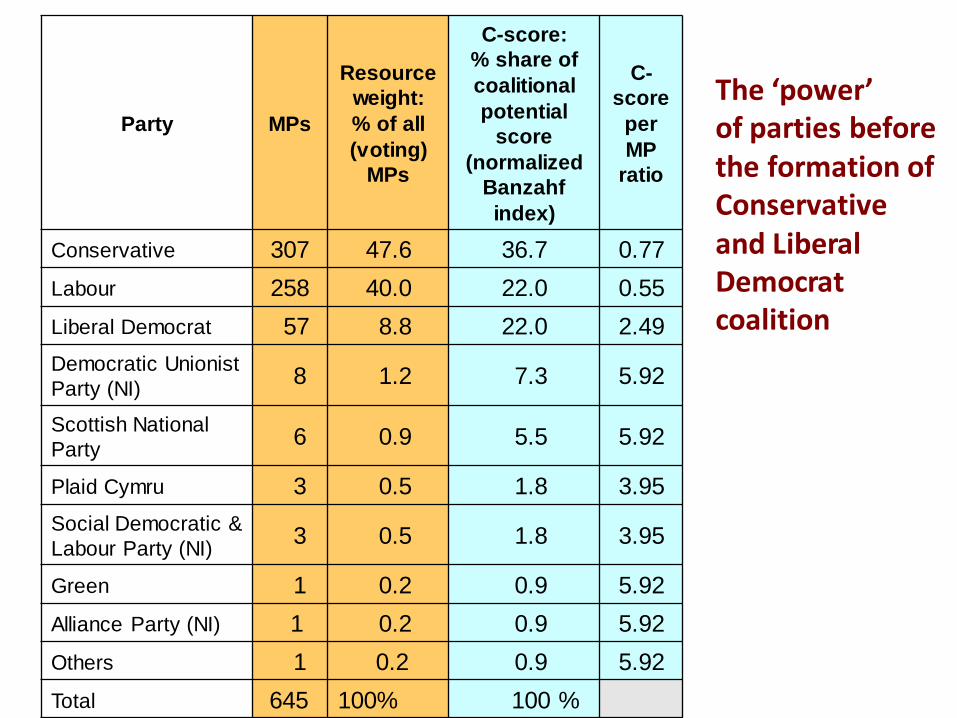
Party MPs
Resource
weight:
% of all
(voting)
MPs
C-score:
% share of
coalitional
potential
score
(normalized
Banzahf
index)
C-
score
per
MP
ratio
Conservative 307 47.6 36.7 0.77
Labour 258 40.0 22.0 0.55
Liberal Democrat 57 8.8 22.0 2.49
Democratic Unionist
Party (NI) 8 1.2 7.3 5.92
Scottish National
Party 6 0.9 5.5 5.92
Plaid Cymru 3 0.5 1.8 3.95
Social Democratic &
Labour Party (NI) 3 0.5 1.8 3.95
Green 1 0.2 0.9 5.92
Alliance Party (NI) 1 0.2 0.9 5.92
Others 1 0.2 0.9 5.92
Total 645 100% 100 %
The ‘power’ of parties before the formation of Conservative and Liberal Democrat coalition
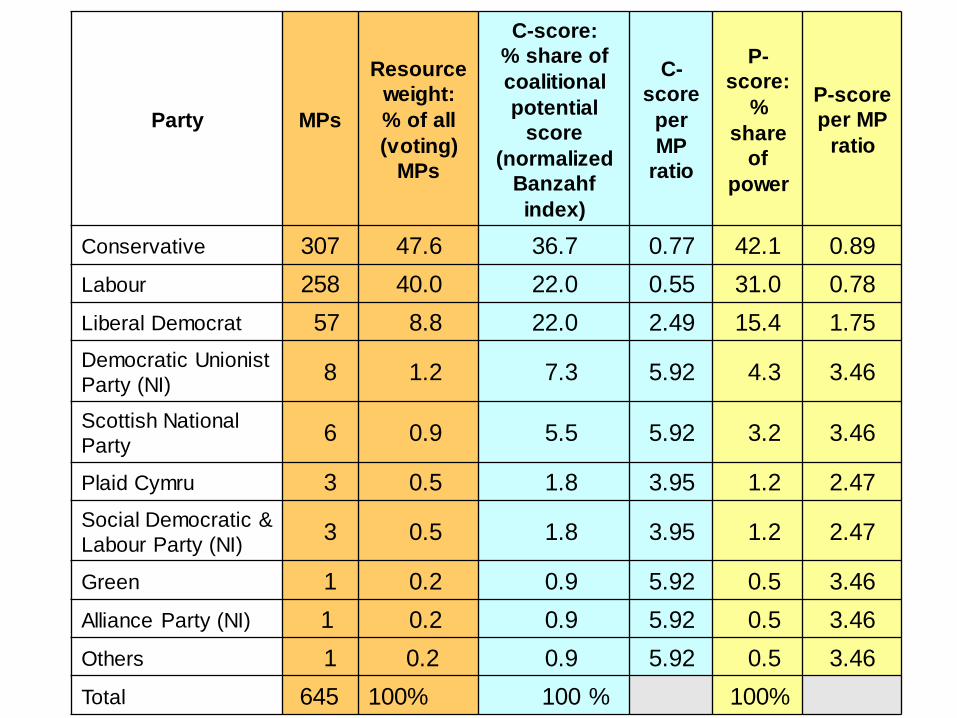
Party MPs
Resource
weight:
% of all
(voting)
MPs
C-score:
% share of
coalitional
potential
score
(normalized
Banzahf
index)
C-
score
per
MP
ratio
P-
score:
%
share
of
power
P-score
per MP
ratio
Conservative 307 47.6 36.7 0.77 42.1 0.89
Labour 258 40.0 22.0 0.55 31.0 0.78
Liberal Democrat 57 8.8 22.0 2.49 15.4 1.75
Democratic Unionist
Party (NI) 8 1.2 7.3 5.92 4.3 3.46
Scottish National
Party 6 0.9 5.5 5.92 3.2 3.46
Plaid Cymru 3 0.5 1.8 3.95 1.2 2.47
Social Democratic &
Labour Party (NI) 3 0.5 1.8 3.95 1.2 2.47
Green 1 0.2 0.9 5.92 0.5 3.46
Alliance Party (NI) 1 0.2 0.9 5.92 0.5 3.46
Others 1 0.2 0.9 5.92 0.5 3.46
Total 645 100% 100 % 100%
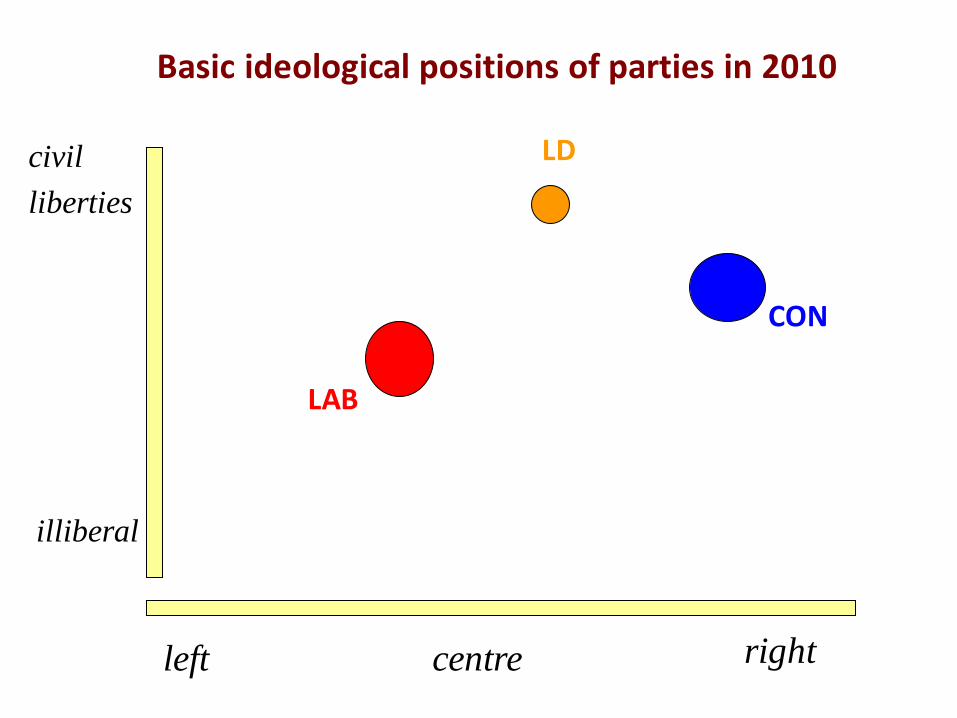
centre left right
CON
LAB
LD civil
liberties
illiberal
Basic ideological positions of parties in 2010
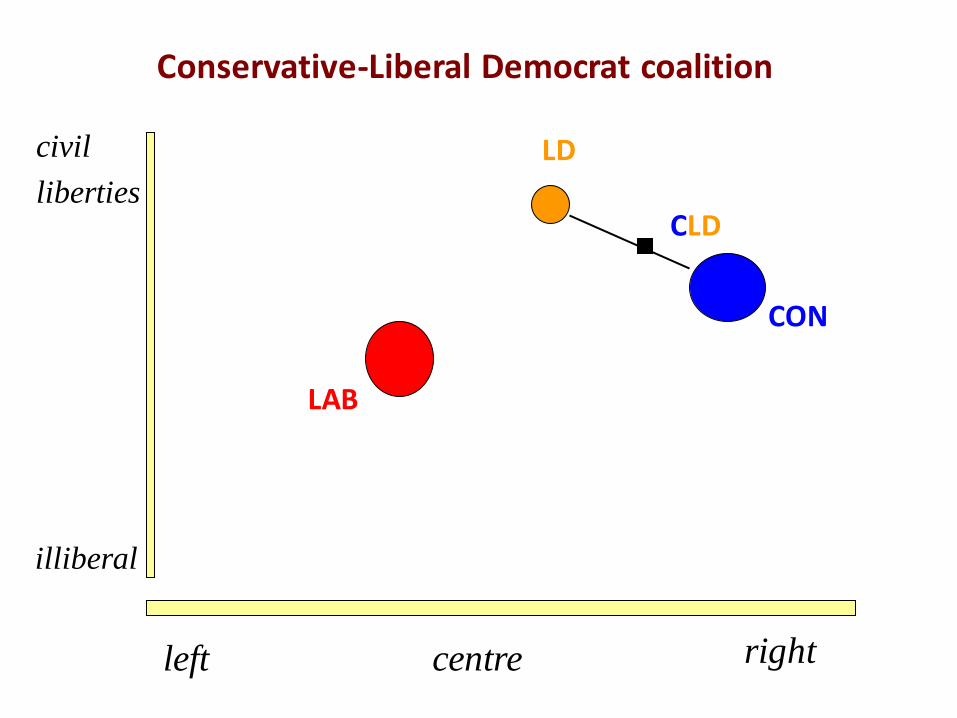
centre left right
CON
LAB
LD
CLD
civil
liberties
illiberal
Conservative-Liberal Democrat coalition
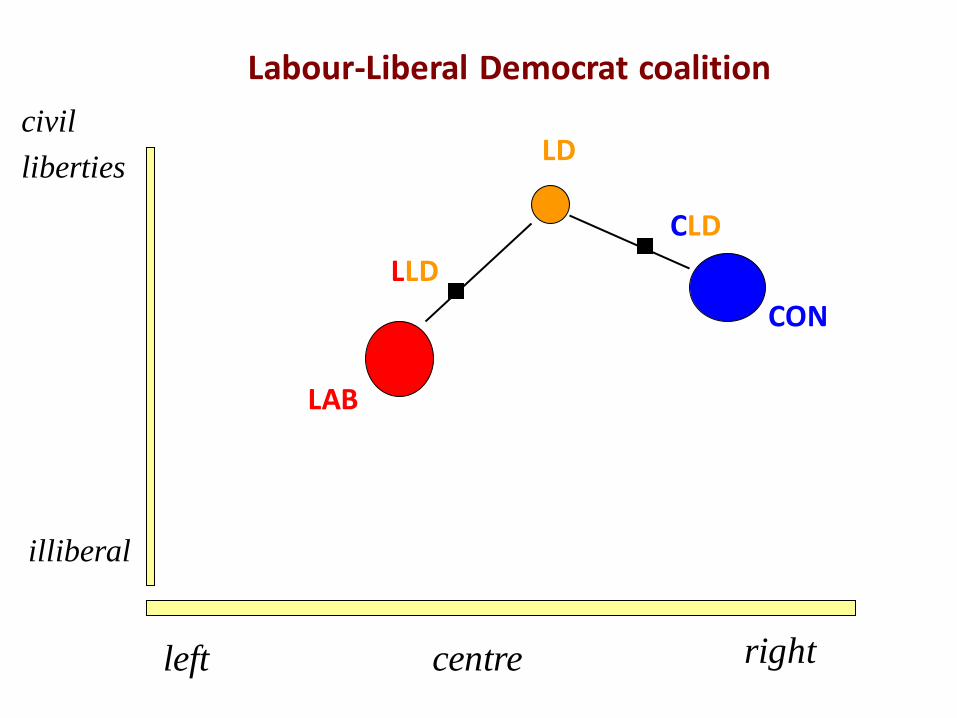
centre left right
CON
LAB
LD
CLD
LLD
civil
liberties
illiberal
Labour-Liberal Democrat coalition
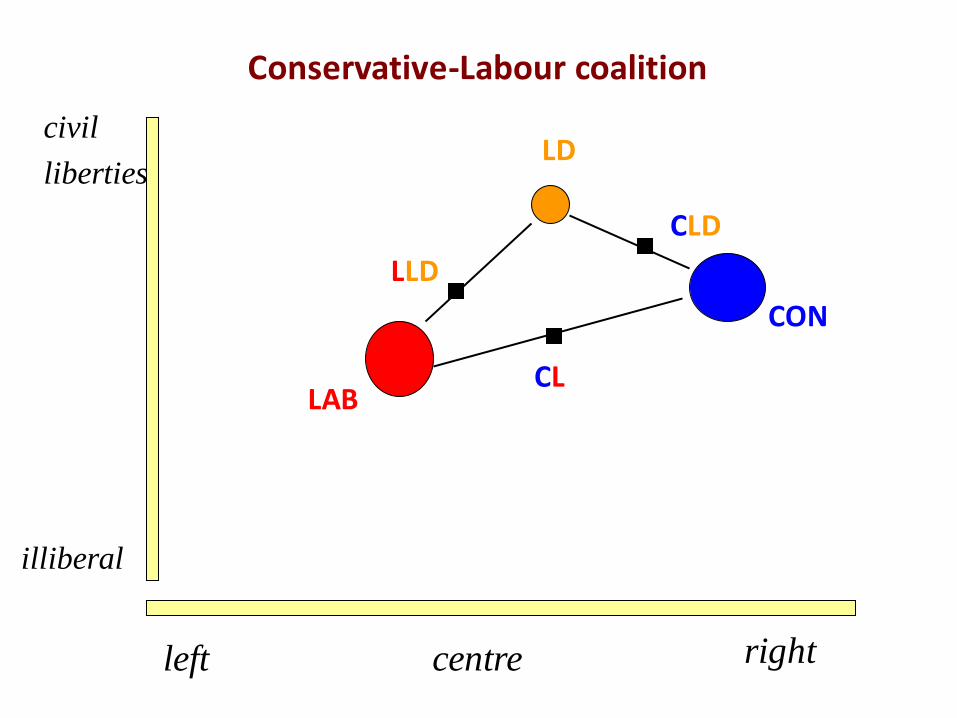
centre left right
CON
LAB
LD
CLD
LLD
CL
civil
liberties
illiberal
Conservative-Labour coalition
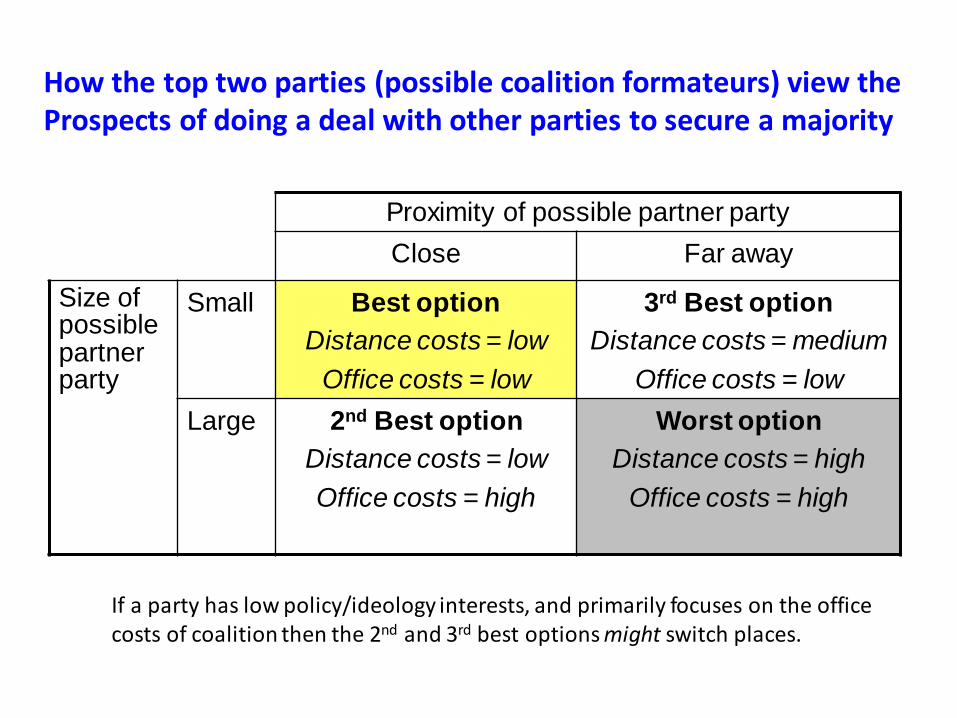
Proximity of possible partner party
Close Far away
Size of possible partner party
Small Best option
Distance costs = low
Office costs = low
3rd Best option
Distance costs = medium
Office costs = low
Large 2nd Best option
Distance costs = low
Office costs = high
Worst option
Distance costs = high
Office costs = high
How the top two parties (possible coalition formateurs) view the Prospects of doing a deal with other parties to secure a majority
If a party has low policy/ideology interests, and primarily focuses on the office costs of coalition then the 2nd and 3rd best options might switch places.
Party MPs
Resource
weight:
% of all
(voting)
MPs
Conservative-
Liberal Democrat
government
364 56.4
Labour 258 40.0
Democratic
Unionist Party (NI) 8 1.2
Scottish National
Party 6 0.9
Plaid Cymru 3 0.5
Social Democratic
& Labour Party
(NI)
3 0.5
Green 1 0.2
Alliance Party (NI) 1 0.2
Others 1 0.2
Total 645 100%
The ‘power’ of the Conservative and Liberal Democrat Coalition once was formed See Dunleavy Chapter on 2010 coalition in Reading List)
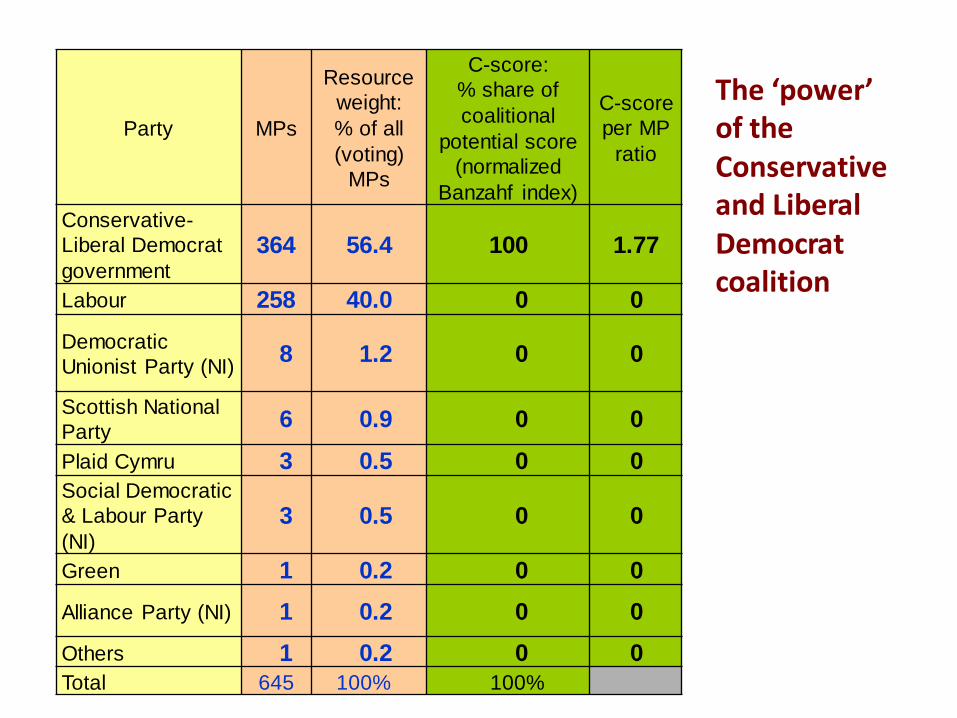
Party MPs
Resource
weight:
% of all
(voting)
MPs
C-score:
% share of
coalitional
potential score
(normalized
Banzahf index)
C-score
per MP
ratio
Conservative-
Liberal Democrat
government
364 56.4 100 1.77
Labour 258 40.0 0 0
Democratic
Unionist Party (NI) 8 1.2 0 0
Scottish National
Party 6 0.9 0 0
Plaid Cymru 3 0.5 0 0
Social Democratic
& Labour Party
(NI)
3 0.5 0 0
Green 1 0.2 0 0
Alliance Party (NI) 1 0.2 0 0
Others 1 0.2 0 0
Total 645 100% 100%
The ‘power’ of the Conservative and Liberal Democrat coalition
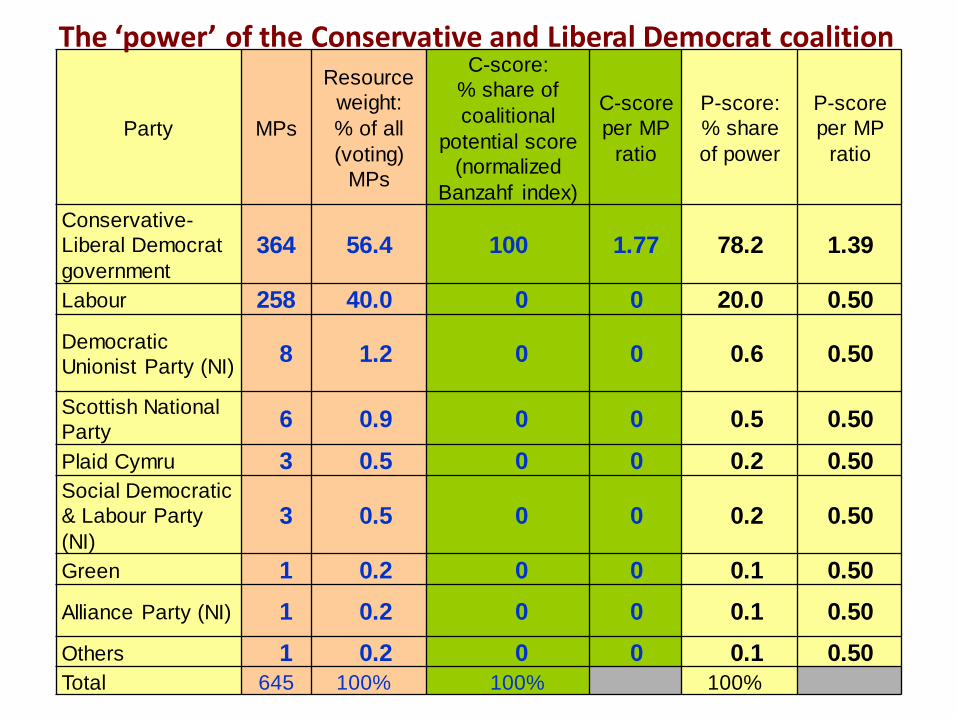
Party MPs
Resource
weight:
% of all
(voting)
MPs
C-score:
% share of
coalitional
potential score
(normalized
Banzahf index)
C-score
per MP
ratio
P-score:
% share
of power
P-score
per MP
ratio
Conservative-
Liberal Democrat
government
364 56.4 100 1.77 78.2 1.39
Labour 258 40.0 0 0 20.0 0.50
Democratic
Unionist Party (NI) 8 1.2 0 0 0.6 0.50
Scottish National
Party 6 0.9 0 0 0.5 0.50
Plaid Cymru 3 0.5 0 0 0.2 0.50
Social Democratic
& Labour Party
(NI)
3 0.5 0 0 0.2 0.50
Green 1 0.2 0 0 0.1 0.50
Alliance Party (NI) 1 0.2 0 0 0.1 0.50
Others 1 0.2 0 0 0.1 0.50
Total 645 100% 100% 100%
The ‘power’ of the Conservative and Liberal Democrat coalition
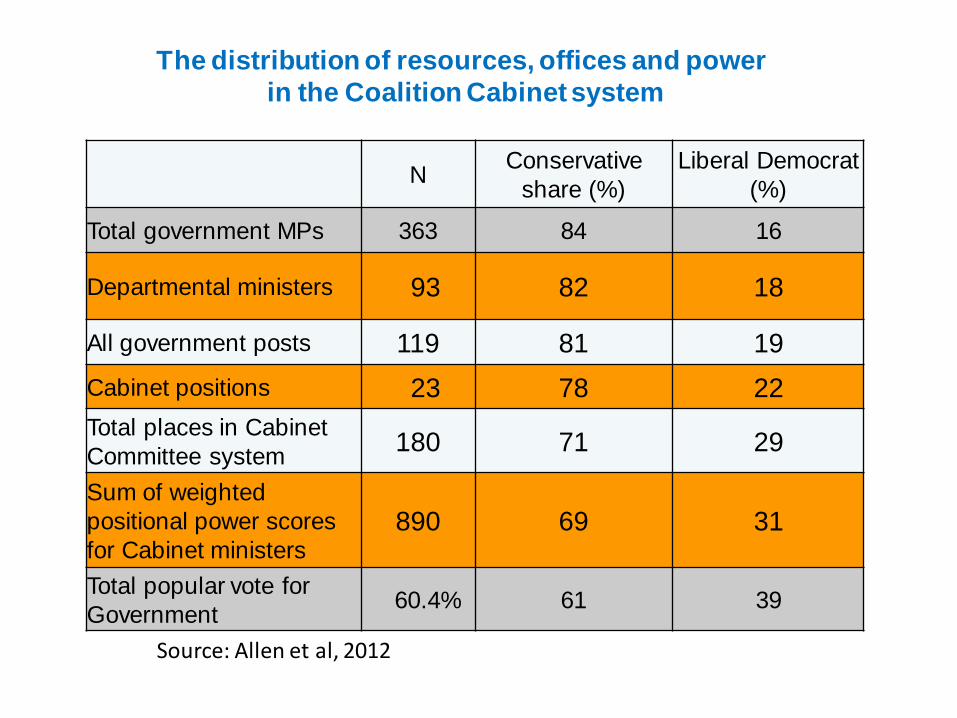
N Conservative
share (%)
Liberal Democrat
(%)
Total government MPs 363 84 16
Departmental ministers 93 82 18
All government posts 119 81 19
Cabinet positions 23 78 22
Total places in Cabinet
Committee system 180 71 29
Sum of weighted
positional power scores
for Cabinet ministers
890 69 31
Total popular vote for
Government 60.4% 61 39
The distribution of resources, offices and power
in the Coalition Cabinet system
Source: Allen et al, 2012