Embed Size (px)
Citation preview

The Ultra Linear
Power Amplifier
An adventure between triode and pentode
by Rudolf Moers
1

Who am I
2
Born in 1955 in Veldhoven and now living in Eindhoven in the Netherlands.
Education: Primary Technical School electrical engineering
Secondary Technical School electronics
High Technical School electronics
Summary of work experience:
Halin Analog video modification (RGB-keying)
Analog audio circuits with semi-conductors
Philips Optical Disk Mastering Compact Disk mastering electronics
Compact Disk signal processing electronics
And a lot more
Philips Medical Systems Diaphragm control of Röntgen camera
Philips Electron Optics Vacuum pump control for electron microscope
Secondary Technical School Teacher electronics, theory and practice
ASML Architecture of electronic hardware
Infrastructure of cabling and racks with
electronic boards and supplies.
Hobby : electron tube amplifiers and radio’s

Contents of this presentation
1. Introduction and history
2. Comparison of the static characteristic for Triode, Ultra Linear and
Pentode
3. Comparison of the powers for Triode, Ultra Linear and Pentode
4. Network analyses of the Ultra Linear Power Amplifier
a. Repetition of the pentode characteristics
b. Repetition of the pentode quantities
c. Current source and Voltage Source equivalent circuits of the
Pentode
d. Current source and Voltage Source equivalent circuits applied
Ultra Linear
5. Determination of the screen grid tap
3

4
Contents of this presentation
6. Test equipment
7. Practical evidence 1 of the network analyses of the Ultra Linear
Amplifier
8. Comparison of practical powers and efficiency of an amplifier in
Triode mode, in Ultra Linear mode and in Pentode mode
9. Practical evidence 2 of the network analyses of the Ultra Linear
Amplifier
10. Comparison practical frequency behavior of an amplifier in Triode
mode, in Ultra Linear mode and in Pentode mode
11. Comparison practical non-linear distortion of an amplifier in Triode
mode, in Ultra Linear mode and in Pentode mode
12. Bibliography

1. Introduction and history
David Hafler & Herbert Keroes (not the inventors) published
their Ultra Linear story in 1951.
Publishing in 1959 of the Dutch book “Radio Technique part 1”
written by A. J. Sietsma of the Philips company.
The Philips company has never published an Ultra Linear story, but A. J. Sietsma
made a homework exercise about screen grid negative feedback for students.
Rudolf Moers solved this homework exercise about negative feedback in 2006
with his own formulae which gave the same results as A. J. Sietsma.
5

6

0.0 ≤ x ≤ 1.0
ak
kg
ak
kg
v
vx
v
vx
,2,2
akkg vxv ,2
7
Screen grid tap of the
primary transformer
winding : x
x = 0 : pentode
0 < x < 1 : ultra-linear
x = 1 : triode

2. Comparison of the static characteristic for Triode, Ultra Linear
and Pentode
8
Same load lines
with different
scales for Vak
Constriction 40V Constriction 100V
Constriction 50V
triode
pentode
Ultra-linear

3. Comparison of the powers for Triode, Ultra Linear
9
and Pentode in theory.
Vap,triode << Vap,ultralinear
Vap,triode << Vap,pentode
Iap,triode << Iap,ultralinear
Iap,triode << Iap,pentode
Va,pentode = Va,ultralinear
Ia,pentode = Ia,ultralinear
By this:
Pap,triode << Pap,ultralinear
Pap,triode << Pap,pentode
Pa,pentode = Pa,ultralinear

In Menno’s first book some design examples are shown which use with jumpers to configure
the circuit into triode, ultra-linear and pentode.
Power results:
2x EL34 with transformer VDV6040PP: ptriode = 13W, pultralinear = 33W and ppentode = 40W
4x EL34 with transformer VDV3070PP: ptriode = 30W, pultralinear = 70W and ppentode = 80W
ptriode = 13 W 20 W pultralinear = 33 W versus pultralinear = 33 W 7 W ppentode = 40 W
ptriode = 30 W 40 W pultralinear = 70 W versus pultralinear = 70 W 10 W ppentode = 80 W
Reason : vap,triode << vap,ultralinear < vap,pentode
10
The constriction of the vg1,k -curves in the anode characteristic Ia = f (Vak)
near the Ia –axis is slightly more with ultra linear than with a pentode.
Comparison of the powers for Triode, Ultra Linear
and Pentode in practice.
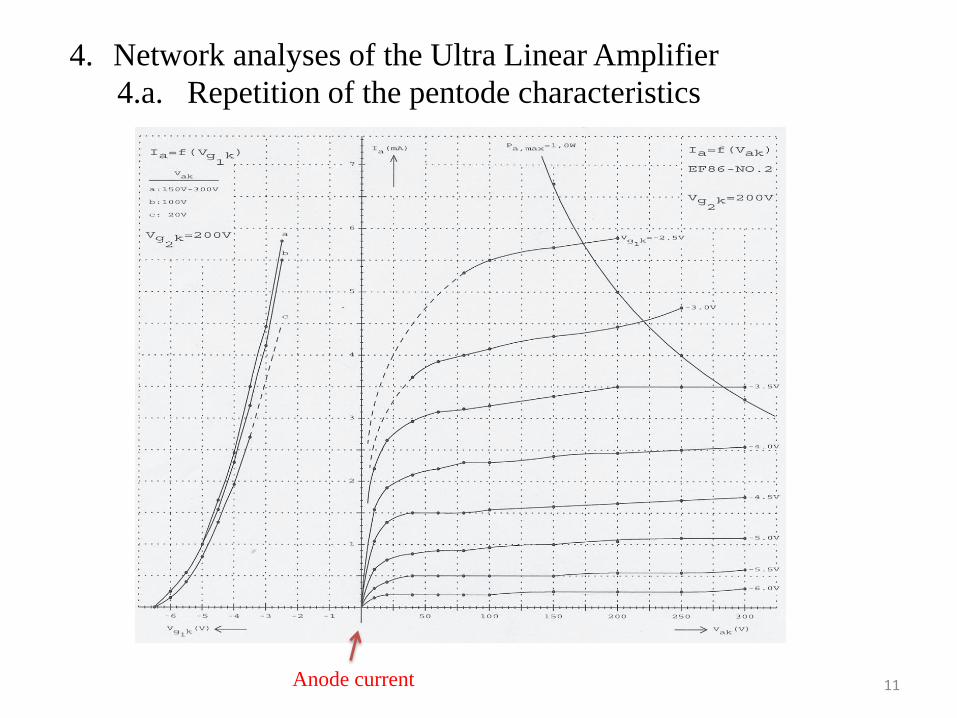
4. Network analyses of the Ultra Linear Amplifier
4.a. Repetition of the pentode characteristics
11 Anode current

12
Screen grid current

13

4.b. Repetition of the pentode quantities
kg
a
V
IS
,1
kg
a
v
iS
,1
Anode steepness is also called mutual conductance gm.
Definition of anode steepness : with constant Vak and Vg2,k
For small signals : with constant Vak and Vg2,k
Definition of screen grid steepness : with constant Vak and Vg2,k
For small signals : with constant Vak and Vg2,k
kg
g
V
IS
,1
2
2
kg
g
v
iS
,1
2
2
14

kg
ak
V
V
,1
kg
ak
v
v
,1
Definition of anode
amplification factor : with constant Ia and Vg2,k
For small signals : with constant Ia and Vg2,k
Definition of screen grid
amplification factor : with constant Ig2 and Vak
For small signals : with constant Ig2 and Vak
kg
kg
ggV
V
,1
,2
1,2
kg
kg
ggv
v
,1
,2
1,2
Anode penetration factor : Da = µ-1 = 1/µ (Anode Durchgriff )
Screen grid penetration factor : (Screen grid Durchgriff)
1,2
1
1,22 /1 gggggD
15

Definition of anode
AC internal resistance : with constant Vg1,k and Vg2,k
For small signals : with constant Vg1,k and Vg2,k
a
ak
iI
Vr
a
ak
ii
vr
Definition of screen grid
AC internal resistance : with constant Vg1,k and Vak
For small signals : with constant Vg1,k and Vak
2
,2
2
g
kg
iI
Vr
2
,2
2
g
kg
ii
vr
16
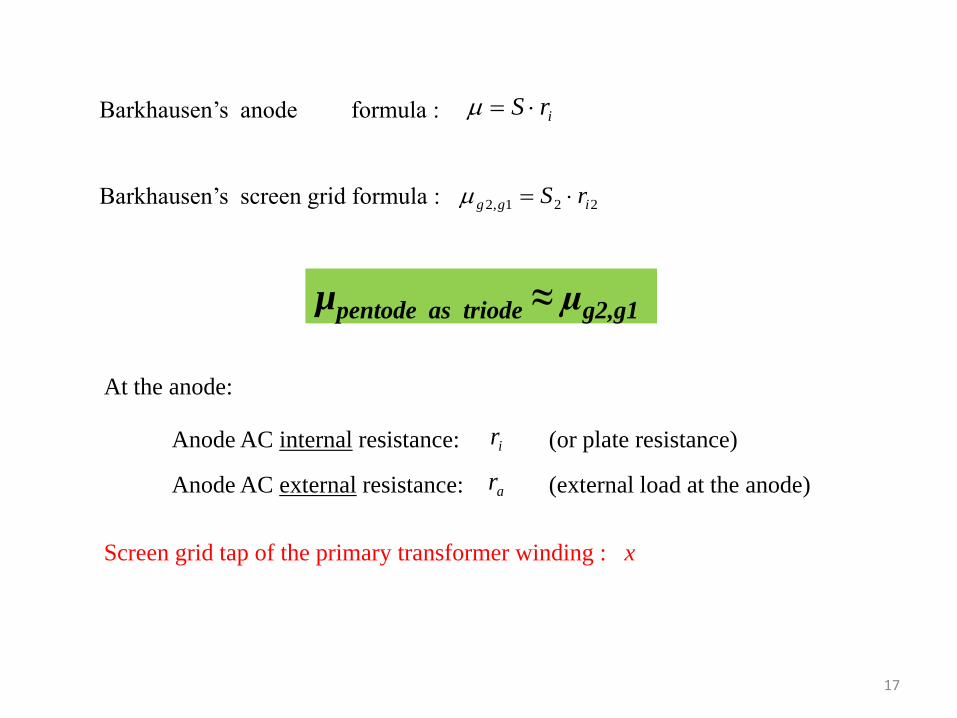
Barkhausen’s anode formula :
Barkhausen’s screen grid formula :
irS
221,2 igg rS
µpentode as triode ≈ µg2,g1
17
At the anode:
Anode AC internal resistance: ir
Anode AC external resistance: ar
(or plate resistance)
(external load at the anode)
Screen grid tap of the primary transformer winding : x
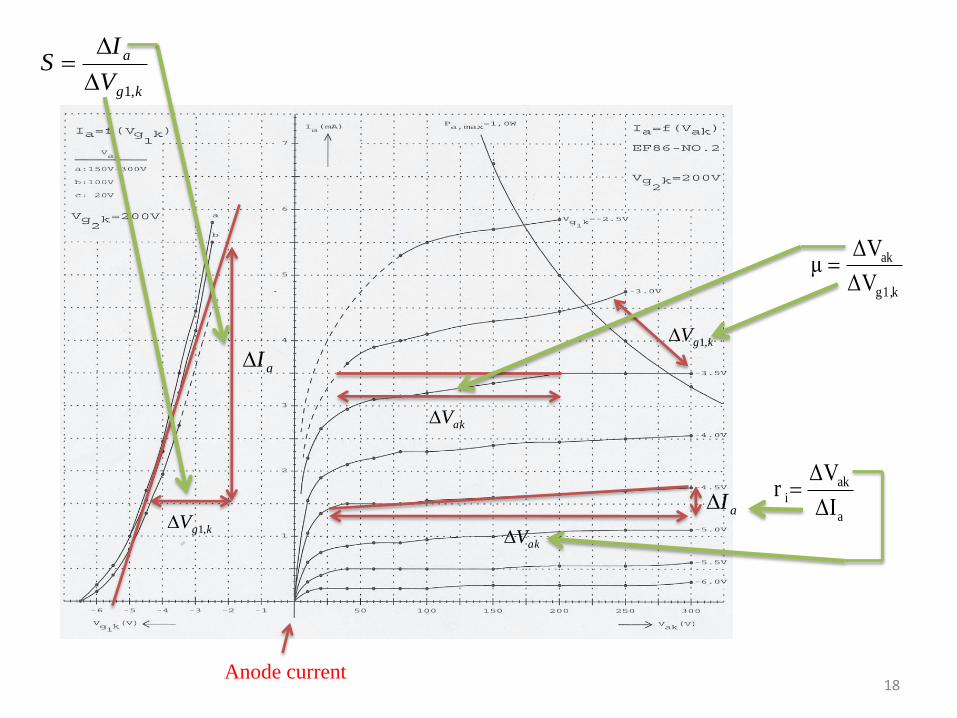
kg
a
V
IS
,1
aI
kgV ,1
akV
kgV ,1
kg1,
ak
ΔV
ΔVμ
akV
aIa
ak
iΔI
ΔVr
18 Anode current

kg
g
V
IS
,1
2
2
kg1,
kg2,
g1g2,ΔV
ΔVμ
g2
g2,k
i2ΔI
ΔVr
2gI
kgV ,1 kgV ,1
kgV ,2
kgV ,2
19
Screen grid current

kg
a
V
IS
,1
kg
g
V
IS
,1
2
2
∆Vg1,k for S = ∆Vg1,k for S2
2
2
,1S
I
S
IV
ga
kg
ag IS
SI 2
2
ag iS
Si 2
2
20

According to the definitions, AC voltage vg1,k causes anode current : ia1 = S·vg1,k
According to the definitions, AC voltage vak causes anode current : ia2 = vak / ri
For triodes:
Superposititon of ia1 and ia2 gives :
i
ak
kgar
vvSi ,1 irS apply Barkhausen’s
The triode equation :
ak
kga
vvSi ,1
For pentodes:
Factor contributes to the anode current slightly because µ is large
see anode steepness characteristic Ia = f (Vg1,k).
akv
Factor contributes significantly to the anode current because µg2,g1
is small, see screen grid steepness characteristic Ig2 = f (Vg1,k).
1,2
,2
gg
kgv
The pentode equation :
ak
gg
kg
kga
vvvSi
1,2
,2
,1
cc
21
4.c. Current and Voltage Source equivalent circuits for the Pentode
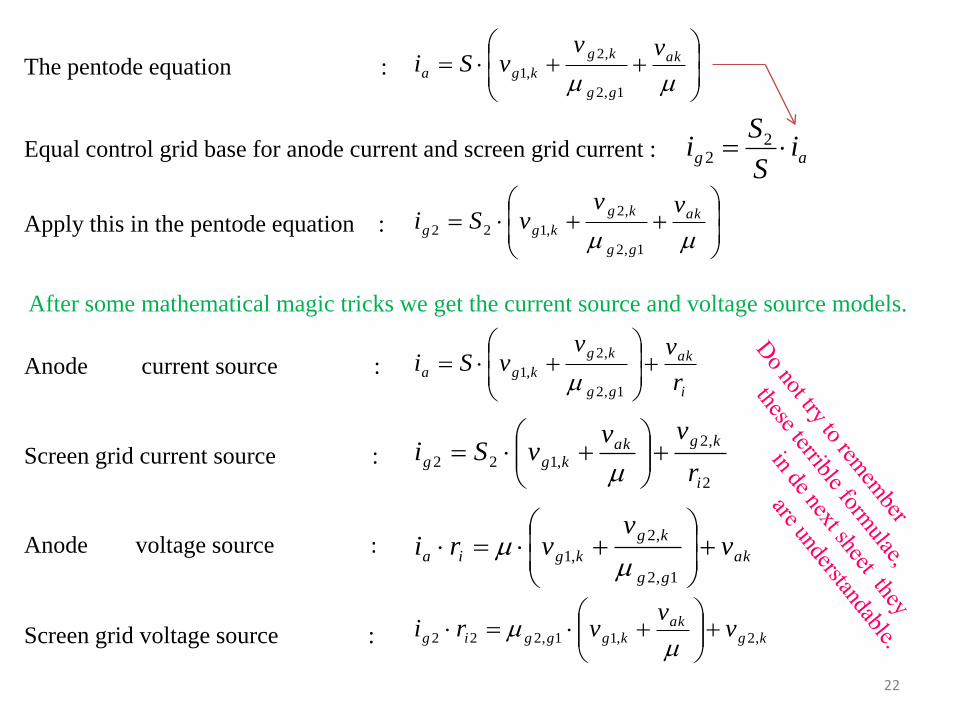
The pentode equation :
ak
gg
kg
kga
vvvSi
1,2
,2
,1
Apply this in the pentode equation :
ag iS
Si 2
2Equal control grid base for anode current and screen grid current :
ak
gg
kg
kgg
vvvSi
1,2
,2
,122
After some mathematical magic tricks we get the current source and voltage source models.
i
ak
gg
kg
kgar
vvvSi
1,2
,2
,1
2
,2
,122
i
kgak
kggr
vvvSi
ak
gg
kg
kgia vv
vri
1,2
,2
,1
kg
ak
kgggig vv
vri ,2,11,222
Anode current source :
Screen grid current source :
Anode voltage source :
Screen grid voltage source :
22

23

4.d. Current source and Voltage Source equivalent circuits
applied to Ultra Linear
akkg vxv ,2
0.0 ≤ x ≤ 1.0
ak
kg
ak
kg
v
vx
v
vx
,2,2
TARGET:
A = vo /vi = f (x) and rout = f (x)
24

25

Without formulae we see directly :
ig2 flows through part x of the primary winding partly contribution to power
ia flows through part (1−x) +x of the primary winding full contribution to power
With formulae derivation from the equivalent circuits we achieve :
Anode voltage : aaakaakgak rxirxirxivv 11,2
vg2,k = −(ia + ig2 ) ∙ x ∙ ra and is Kirchhoff’s first law ik = ia + ig2 for AC
Total AC current : totalga
a
ak iixir
v 2
The total AC current itotal is not the same as cathode AC current ik.
26

The pentode equation :
ak
gg
kg
kga
vvvSi
1,2
,2
,1
akkg vxv ,2
totalga
a
ak iixir
v 2
ag iS
Si 2
2
ak
gg
akkgtotal
vvxvS
S
Sxi
1,2
,121
atotalak riv
.………… we achieve at the anode:
a
gg
a
kg
ak
a
rSxSx
rSxS
v
vA
2
1,2
2
,1 11
27
With the art of magic
formula tricks …….
An easy formula derivation in small steps is available.

ak
p
so v
n
nv
a
gg
a
kg
ak
a
rSxSx
rSxS
v
vA
2
1,2
2
,1 11
and vi = vg1,k
a
gg
a
p
s
i
o
rSxSx
rSxS
n
n
v
vA
2
1,2
2
11
28

AC output resistance : itshortcircuo
openo
outi
vr
,
, (Thevenin’s theorem)
When we have vo,open then RL = ∞ with .
L
p
s
a Rn
nr
2
When we have io,shortcircuit then RL = 0 with . 0
2
L
p
s
a Rn
nr
29
itshortcircuo
openo
outi
vr
,
,
1
1
1,2
,
gg
p
s
i
openo
xn
n
v
v
i
s
p
itshortcircuo vSS
Sx
n
ni
2
, 1
1
1
1,2
2
2
gg
p
s
out
xSxS
n
nr
Again with the art of
magic formula tricks ….
.………… we achieve at the output:
An easy formula derivation in small steps is available.

a
gg
a
p
s
i
o
rSxSx
rSxS
n
n
v
vA
2
1,2
2
11
1
1
1,2
2
2
gg
p
s
out
xSxS
n
nr
Summary
30
x is the variable and the other quantities
are almost constant (in theory).

5. Determination of the screen grid tap
31

32

33

The adjustment of Vg2,k happens automatically of course, because the screen grid is connected to the anode.
The screen grid primary transformer tap x = 1.00 but that will surprise nobody, so pentode as triode.
Table 1. Measured values of line 1
Vak (V)
adjusted
Ia (mA)
read on
Ia-axis
Ig2 (mA)
measured
Vg2,k (V)
adjusted to
achieve the read Ia
ΔVak (V)
[300V – Vak]
ΔVg2,k (V)
[300V – Vg2,k]
0 0 0 0 300 300 1.00
25 0 0 25 275 275 1.00
50 0 0 50 250 250 1.00
75 0 0 75 225 225 1.00
100 0 0 100 200 200 1.00
125 0 0 125 175 175 1.00
150 0 0 150 150 150 1.00
175 2.6 0.1 175 125 125 1.00
200 8.5 0.7 200 100 100 1.00
225 19.2 1.6 225 75 75 1.00
250 35.6 2.9 250 50 50 1.00
275 55 4.6 275 25 25 1.00
300 79 7.0 300 0 0 unknown
325 110 9.2 325
Not further than
point W
Not further than
point W
Not further than
point W 350 140 12.1 350
375 170 16.5 375
400 200 21.0 400
ak
kg
V
Vx
,2
34

Table 3. Measured values of line 3
Vak (V)
adjusted
Ia (mA)
read on
Ia-axis
Ig2 (mA)
measured
Vg2,k (V)
adjusted to
achieve the read Ia
ΔVak (V)
[300V – Vak]
ΔVg2,k (V)
[300V – Vg2,k]
0 0 0 unknown 300 unknown unknown
25 6.5 3.8 206 275 94 0.34
50 13 12.5 237 250 63 0.25
75 19.5 16 251 225 49 0.22
100 26 13 254 200 46 0.23
125 32.5 10.4 259 175 41 0.23
150 39 8 263 150 37 0.25
175 45.5 7 269 125 31 0.25
200 52 6.5 275 100 25 0.25
225 58.5 6.5 281 75 19 0.25
250 65 6.5 288 50 12 0.24
275 71.5 6.5 294 25 6 0.24
300 78 7.1 300 0 0 unknown
ak
kg
V
Vx
,2
The average value of all screen grid primary transformer taps xaverage = 0.25. This value is mentioned at line 3.
For this specimen KT88-1 we have pure ultra-linear at x = 0.25. 35

Table 5. Measured values of line 5
Vak (V)
adjusted
Ia (mA)
read on
Ia-axis
Ig2 (mA)
measured
Vg2,k (V)
adjusted to
achieve the read Ia
ΔVak (V)
[300V – Vak]
ΔVg2,k (V)
[300V – Vg2,k]
0 1 54 300 300 0 0.00
25 60 30 300 275 0 0.00
50 60 30 300 250 0 0.00
75 61 28 300 225 0 0.00
100 63 22 300 200 0 0.00
125 65 19 300 175 0 0.00
150 68 14 300 150 0 0.00
175 70 12 300 125 0 0.00
200 72 9.5 300 100 0 0.00
225 74 8.5 300 75 0 0.00
250 75 7.8 300 50 0 0.00
275 76 7.2 300 25 0 0.00
300 77 7.0 300 0 0 unknown
325 78 6.5 300
Not further than point
W
Not further than point
W
Not further than
point W 350 79 6.3 300
375 80 6.0 300
400 80 6.0 300
ak
kg
V
Vx
,2
The adjustment of Vg2,k happens automatically of course, because the screen grid is connected to Vb.
The screen grid primary transformer tap x = 0.00 but that will surprise nobody, so pentode as pentode. 36

37
6. Test equipment

38

39
Given at Vak = 300V for KT88:
S = 11.5 mA/V
ri = 12 kΩ
µ = 138
S2 = 1.15 mA/V
µg2,g1 = 8
ra = 7000 Ω
1
1
1,2
2
2
gg
p
s
out
xSxS
n
nr
Working point:
Vak,w = 300 V
Ia,w = 80 mA
Vg1,kw = − 26 V
Vg2,kw ≈ 300 V
Input signal for each
value of x :
vg1,k = 3.72 VRMS
a
gg
a
kg
ak
a
rSxSx
rSxS
v
vA
2
1,2
2
,1 11

Table 6
x vg1,k (VRMS)
vak (VRMS)
vg2,k (VRMS)
pa (W)
vRL (VRMS)
pRL (W)
|Aa|
calculated by
formula
0.00 3.72 158.0 0 0.00 3.60 4.01 3.20 42.4 50.6
0.10 3.72 60.8 19.2 0.32 0.53 1.51 0.45 16.3 16.8
0.20 3.72 47.7 21.3 0.45 0.33 1.22 0.29 12.8 13.3
0.30 3.72 40.7 22.3 0.55 0.24 1.01 0.20 10.9 11.3
0.40 3.72 36.1 23.2 0.64 0.19 0.92 0.16 9.7 10.1
0.50 3.72 33.4 23.6 0.71 0.16 0.83 0.14 9.0 9.3
0.60 3.72 30.9 23.9 0.77 0.14 0.78 0.12 8.3 8.7
0.70 3.72 28.9 23.2 0.84 0.12 0.73 0.11 7.8 8.1
0.80 3.72 27.3 24.2 0.89 0.11 0.69 0.10 7.3 7.7
0.90 3.72 26.1 24.6 0.94 0.10 0.65 0.09 7.0 7.3
1.00 3.72 25.0 25.0 1.00 0.09 0.62 0.08 6.6 7.0
ak
kg
measuredv
vx
,2
kg
ak
av
vA
,1
measured
40
7. Practical evidence 1 of the network analyses of the Ultra Linear Amplifier

41
a
gg
a
kg
ak
a
rSxSx
rSxS
v
vA
2
1,2
2
,1 11

1
1
1,2
2
2
gg
p
s
out
xSxS
n
nr
21
21
oo
oo
outii
vvr
42
pentodeoutr ,
triodeoutr ,
rultralineaoutr ,

8. Comparison of practical powers and efficiencies of an amplifier in Triode mode, in Ultra Linear mode and in Pentode mode
43
My first electron tube amplifier according to a design from Menno’s first book.

Schematic diagram of my first electron tube amplifier
44
1,2gi
1ai
2ai
2,2gi

45
= 25 W pa
input power
anode dissipation
delivered anode power
anode efficiency
input power
anode dissipation
delivered anode power
anode efficiency
input power
anode dissipation delivered anode power
anode efficiency

9. Practical evidence 2 of the network analyses of the Ultra Linear Amplifier
Table 7.
vak (VRMS) vg2,k (VRMS) given x of power transformer VDV6040PP
31.1 12.5 0.402 0.400
100.0 40.1 0.401 0.400
193.6 78.0 0.403 0.400
ak
kg
measuredv
vx
,2
46

47
and RMSmeasuredaaa mAiii 59,21 RMSmeasuredggg mAiii 14,22,21,2
Substitution of these currents in: measuredgmeasuredatotal ixii ,2,
6.559144.059 totali
mAitotal 5.64
300060002
12
16040, PPVDVaaa rr
Wp ELa 5.1234,
a
akELa
r
vp
2
34, RMSakak Vv
v6.19330005.12
30005.12
2
Anode AC external resistance:
We have seen that the total anode power is 25W
a
akmeasuredgmeasuredatotal
r
vixii ,2,
For determination of apply : totali
Ar
vi
a
ak
total 0645.03000
6.193
mAitotal 5.64
The effect of this fictive is an anode power of 12.5 W for one power pentode.
The effect of is an anode power of 12.5 W for one power pentode. )( ,2, measuredgmeasureda ixi
totali

10. Comparison of practical frequency behavior of an amplifier in Triode, Ultra Linear and Pentode mode.
48
15 Hz
Triode Ultra-Linear Pentode
80 kHz 21 Hz
70 kHz 18 Hz
50 kHz
Differences in frequency and phase characteristics are small. The parasitic capacitances due to the Miller effect are not negligible for triodes, but their anode AC internal resistance is low. The parasitic capacitances due to the Miller effect are negligible for pentodes, but their anode AC internal resistance is high. The limiting of 3dB-high is mainly due to the limiting bandwidth of the transformer.

11. Comparison practical non-linear distortion of an amplifier in Triode mode, Ultra Linear mode and Pentode mode
49
totald
2d
3d
4d5d
totald
2d3d
4d5d
totald
2d
3d
4d5d
50
a
gg
a
p
s
i
o
rSxSx
rSxS
n
n
v
vA
2
1,2
2
11
1
1
1,2
2
2
gg
p
s
out
xSxS
n
nr
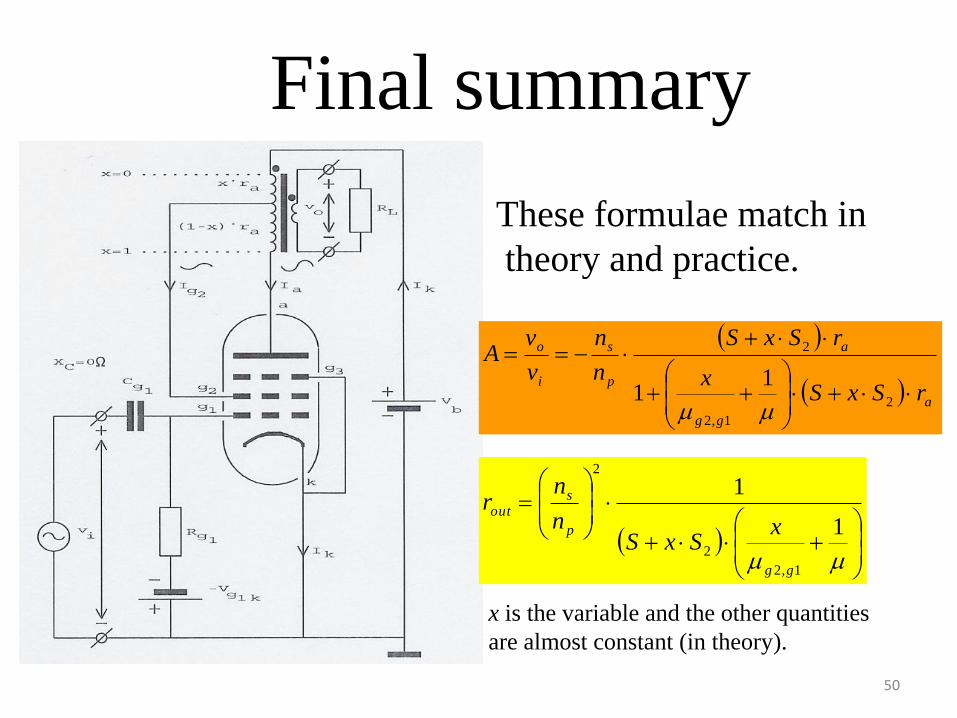
Final summary
x is the variable and the other quantities
are almost constant (in theory).
These formulae match in
theory and practice.

51
totalga
a
ak iixir
v 2
The contribution of the anode AC to the delivered output power is much more than
the contribution of the screen grid AC because in practice: x ≈ 0.4 and ag ii 2.02
The delivered output power at ultra-linear is slightly less than with pentode configuration.
The delivered output power at ultra-linear is much more than with triode configuration.
It is possible to determine screen grid tap x for an ultra-linear application for each
sample of a pentode after measuring the anode characteristics for both the triode and
pentode configurations of that pentode.
The configurations triode, ultra-linear and pentode have an almost equal audio bandwidth.
The ultra-linear configuration gives almost the same low non-linear distortion as the
triode configuration.
The ultra-linear configuration has the “high power advantage”
of the pentode configuration and the “low non-linear distortion
advantage” of the triode configuration.

12. Bibliography
52