Embed Size (px)
Citation preview

The Ultra-Light InerThe Ultra Light InerApproach in the Stu
Dr. AlessandraNational Center for A
Dr. Andre de Center for Transpo
1
rtial Profiler: a Newrtial Profiler: a New udy of Macrotexture
a Bianchini, PE,Asphalt Technology
Fortier Smitortation Research
at Auburn University
1

Out
• What is the ULIP?• Type of Data and ProType of Data and Pro• Comparison with CT
Additional Applicatio• Additional Applicatio
2
line
ocessingocessing M methodnsns
at Auburn University
2

Ultra Light InertiaLaser scanning pavement sFrequency 10,000 Hz (eveq y , (FHWA Software: MPD eve
al Profiler (ULIP)surfacery 0.5 mm)y )ry 0.5 m of profile

ULIP SurfaApplication: Texture identification Processing: Data filtering to remo
4
ace ProfileMean Profile Depth
ove ‘spikes’ and pavement slope
spikes/sp es/dropouts
at Auburn University
4

Circular TexturMean Profile
5ASTM E2157 ASTM E2157
re Meter (CTM)Depth (MPD)
at Auburn University
5

MPD Compariso
2.5y = 1.008x -
R2 = 0.92
TMet
er)
1
1.5
[mm
] (C
T
0.5MP
D
00 0.5 1
MPD
n: ULIP vs. CTM
- 0.02769654
1.5 2 2.5D [mm] (ULIPt)[ ] ( )

Applicapp
• Micro-milling macrotex• Noise predictionNoise prediction• Segregation prediction
7
ations
xture quality
n
at Auburn University
7

GDOT Old Rehab
¾ in OGFC¾ in OGFC
1 ½ in SMA1 ½ in SMA
Existing PavementExisting Pavement
8
bilitation Strategygy
11 –– 1 ¼ in PEM1 ¼ in PEM1 1 1 ¼ in PEM1 ¼ in PEM
1 ½ in in1 ½ in in1 ½ in in 1 ½ in in New SMANew SMA
1 1 -- 1 ¼ in 1 ¼ in Existing SMAExisting SMA
Existing PavementExisting Pavement
at Auburn University
8

GDOT New Reha
¾ in OGFC¾ in OGFC¾ in OGFC¾ in OGFC
1 ½ in SMA1 ½ in SMA1 ½ in SMA1 ½ in SMA
Existing PavementExisting Pavement
9
bilitation Strategygy
1 1 –– 1 ¼ in PEM1 ¼ in PEM
11 -- 1 ¼ in1 ¼ in1 1 -- 1 ¼ in 1 ¼ in Existing SMAExisting SMA
Existing PavementExisting Pavement
at Auburn University
9

ULIP as QA/QC
• Ridge-to-valley texture de
GDOT Micromilling Proje• Ridge-to-valley texture de
(RVD) measurements• 1 6 mm of RVD required• 1.6 mm of RVD required
specs • Correlation with CTM• Correlation with CTM
Example: Profile – Direction of Millin
1(Courtesy of G
Tool for Texture
epth
ectepth
byby
ng
at Auburn University
0GDOT)

Noise Measuremennts at the Test TrackT t N i• Texture -- Noise– Dense Graded– Stone Matrix Asphalt (SMA)– Stone Matrix Asphalt (SMA)– Open Graded Friction
Courses (OGFC/PFC)– Coarse Porous European
Mixture (PEM)

Noise an• Macrotexture characterizatio
nd MPDn – MPD

Noise and TexMicrotexture: wavelength λ < 0Macrotexture: 0.5 mm < λ < 50Profile Fourier Analysis WProfile Fourier Analysis W
Texture Wavelength
1(
xture Spectrum0.5 mm0 mmWavelengthWavelength
at Auburn University
3(Sandberg and Ejsmont, 2002)

ISO 1347SO 3
Characterization of pavCharacterization of pavof surface profiles
analysis of suanalysis of su
1
3-4:20083 008
vement texture by usevement texture by use s -- Part 4: Spectral urface profilesurface profiles
at Auburn University
4
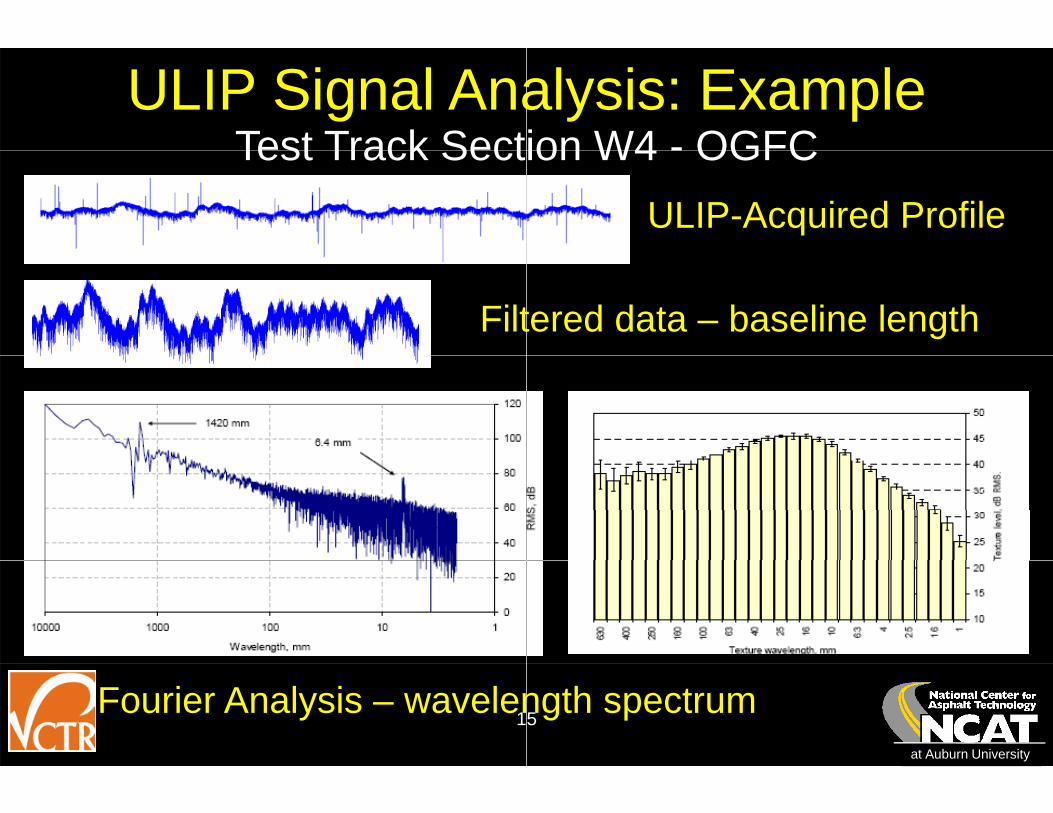
Test Track SectULIP Signal Ana
Test Track Sect
Filt
1Fourier Analysis – wavelen
ion W4 - OGFCalysis: Exampleion W4 - OGFC
ULIP-Acquired Profile
tered data – baseline length
at Auburn University
5ngth spectrum

ISO 10844: AcousISO 10844: Acousof test tracks for
measuring noisevehicles anvehicles an
Annex E: Calculation oby Noise level Differeylevel variation of the
1
tics - Specificationtics - Specification r the purpose of
e emitted by road d their tiresd their tires
of the Expected pass-ence from Texture road surface (ENDT)
at Auburn University
6
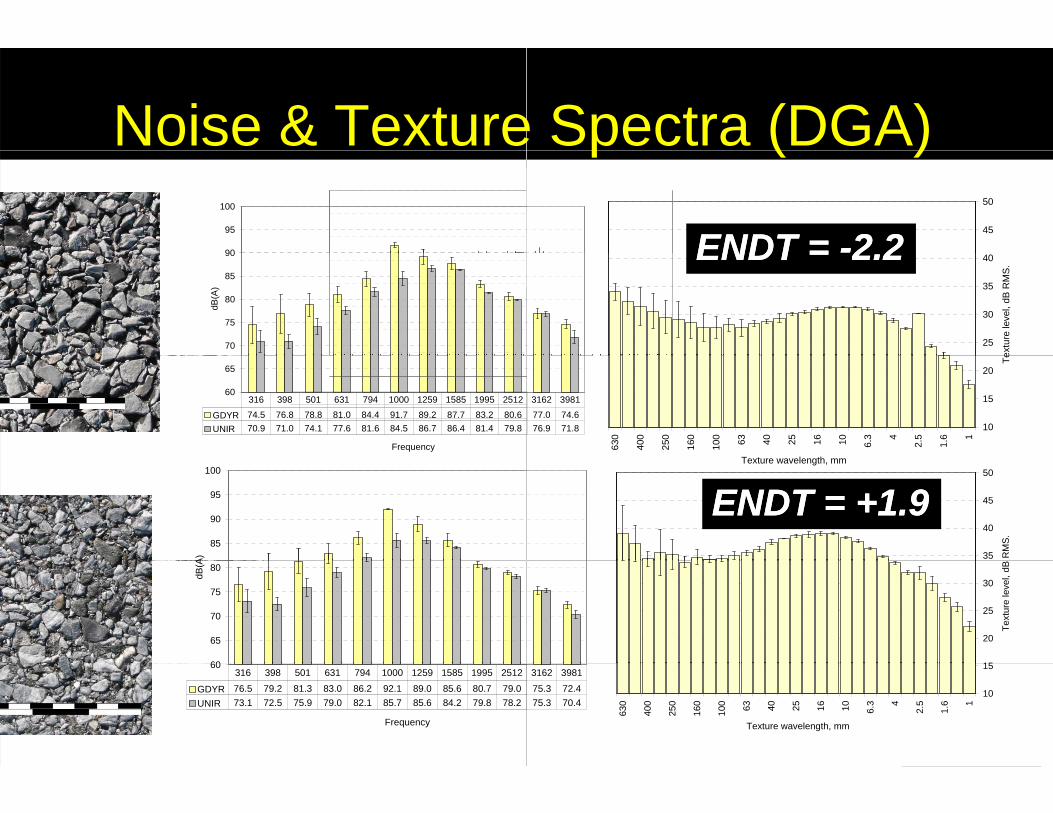
Noise & Texture90
95
100
90
95
100
65
70
75
80
85
dB(A
)
70
75
80
85
90
dB(A
)
60
65
Frequency
GDYR 74.5 76.8 78.8 81.0 84.4 91.7 89.2UNIR 70.9 71.0 74.1 77.6 81.6 84.5 86.7
316 398 501 631 794 1000 125960
65
Frequency
GDYR 74.5 76.8 78.8 81.0 84.4 91.7 89.2 87.7 83.2 80.6UNIR 70.9 71.0 74.1 77.6 81.6 84.5 86.7 86.4 81.4 79.8
316 398 501 631 794 1000 1259 1585 1995 2512
85
90
95
100
A)
60
65
70
75
80
dB(A
1
60
Frequency
GDYR 76.5 79.2 81.3 83.0 86.2 92.1 89.0 85.6 80.7 79.0UNIR 73.1 72.5 75.9 79.0 82.1 85.7 85.6 84.2 79.8 78.2
316 398 501 631 794 1000 1259 1585 1995 2512
e Spectra (DGA)p ( )45
50
ENDT =ENDT = --2 22 2
25
30
35
40
extu
re le
vel,
dB R
MS
.
ENDT = ENDT = 2.22.2
87.7 83.2 80.6 77.0 74.686.4 81.4 79.8 76.9 71.8
1585 1995 2512 3162 3981
10
15
20
1
1.6
2.54
6.31016254063100
160
250
400
630
T t l th
Te
77.0 74.676.9 71.8
3162 3981
Texture wavelength, mm
35
40
45
50
RM
S.
ENDT = +1.9ENDT = +1.9
15
20
25
30
Text
ure
leve
l, dB
at Auburn University
710
15
1
1.6
2.54
6.31016254063100
160
250
400
630
Texture wavelength, mm
75.3 72.475.3 70.4
3162 3981

Noise and Texture Spe
1
ectra: OGFC SectionsN5N5
N6N6
N9
at Auburn University
8
Positive & Negg
• NCAT research indicarelationship between mp
• Models do not directlyinfluence of positive &influence of positive &
• Proposal – look at whaP iti t t– Positive texture
– Negative texture
gative textureg
ates a complex macrotexture and noisey account for the & negative texture& negative textureat the tire “sees”:
at Auburn University

Definition of popos/neg texture?g
at Auburn University

Differentiate popos/neg textureg
at Auburn University

Texture wavelength texttext
spectrum of positive tureture
at Auburn University

Stiffness = slope of Ctexttext
Cumulative Positive tureture
at Auburn University

Porosity = slope of Ctexttext
Cumulative Negative tureture
at Auburn University

Segregatig g on profilep
at Auburn University

QuestQuest
2
tions?tions?
at Auburn University
6