Embed Size (px)
Citation preview

The Unequal Distribution of Economic Education: A Report on the Race, Ethnicity, and Gender of Economics Majors at US Colleges and Universities
Amanda Bayer Board of Governors of the Federal Reserve System
David Wilcox Board of Governors of the Federal Reserve System
System Working Paper 17-27 November 2017
The views expressed herein are those of the authors and not necessarily those of the Federal Reserve Bank of Minneapolis or the Federal Reserve System. This paper was originally published as Finance and Economics Discussion Series 2017-105 by the Board of Governors of the Federal Reserve System. This paper may be revised. The most current version is available at https://doi.org/10.17016/FEDS.2017.105. __________________________________________________________________________________________
Opportunity and Inclusive Growth Institute Federal Reserve Bank of Minneapolis • 90 Hennepin Avenue • Minneapolis, MN 55480-0291
https://www.minneapolisfed.org/institute

Finance and Economics Discussion SeriesDivisions of Research & Statistics and Monetary Affairs
Federal Reserve Board, Washington, D.C.
The Unequal Distribution of Economic Education: A Report onthe Race, Ethnicity, and Gender of Economics Majors at US
Colleges and Universities
Amanda Bayer and David Wilcox
2017-105
Please cite this paper as:Bayer, Amanda, and David Wilcox (2017). “The Unequal Distribution of Economic Edu-cation: A Report on the Race, Ethnicity, and Gender of Economics Majors at US Collegesand Universities,” Finance and Economics Discussion Series 2017-105. Washington: Boardof Governors of the Federal Reserve System, https://doi.org/10.17016/FEDS.2017.105.
NOTE: Staff working papers in the Finance and Economics Discussion Series (FEDS) are preliminarymaterials circulated to stimulate discussion and critical comment. The analysis and conclusions set forthare those of the authors and do not indicate concurrence by other members of the research staff or theBoard of Governors. References in publications to the Finance and Economics Discussion Series (other thanacknowledgement) should be cleared with the author(s) to protect the tentative character of these papers.

1
The Unequal Distribution of Economic Education:
A Report on the Race, Ethnicity, and Gender of Economics Majors at US Colleges and Universities
Amanda Bayer and David Wilcox1
Abstract: The distribution of economic education among US college graduates is quite unequal:
female and underrepresented minority undergraduates, collectively, major in economics at 0.36
the rate that white, non-Hispanic male students do. This paper makes a four-part contribution to
address this imbalance. First and foremost, we provide detailed comparative data at the institution
level to provoke and inform the attention of economists and senior administrators at colleges and
universities, among others. Second, we establish a definition of full inclusion in economic
education on college and university campuses and use that definition to evaluate the status quo
and to compare institutions. Third, we illuminate the reasons why the need to improve the
distribution of economic education is urgent, including the imperative to support economic
policymaking. Lastly, we point the way forward, identifying both currently available resources
and reasonable next steps for all involved parties to take.
In 2015, 38,947 students graduated with a major in economics from a bachelor’s degree program at a US
college or university. Fewer than one-third of those students were women or members of racial or ethnic
groups historically underrepresented in the US economy, despite those groups collectively representing
nearly two-thirds of graduates that year.2 In other terms, collectively, female and underrepresented
minority students majored in economics at 0.36 the rate that white, non-Hispanic male students did.
Through this paper, we aim to advance a national conversation about who is being trained in economics at
the undergraduate level in the United States. Building on the work of Bayer and Rouse (2016) and others
who note the disproportionate absence of women, African Americans, Hispanics/Latinos, and Native
Americans among PhD economists, we document the stark and pervasive underrepresentation of women
and racial/ethnic minority groups among undergraduates majoring in economics. We develop an inclusion
metric to compare institutions and track progress and offer motivation and direction for change in
undergraduate economics.
The imbalances that we document in the field of economics should concern us all. Certainly, colleges and
universities must follow through on their promises to provide all enrolled students with a complete
education and a fully inclusive academic experience; we suspect that the current imbalances in
undergraduate economics education indicate that institutions are not meeting that standard. Broad
representation in economics is also important because it will contribute to individual and collective
successes beyond college and university campuses. At the individual level, education in economics assists
students in their professional, personal, and civic lives. At the societal level, the identities and experiences
of those who study economics affect the creation of economic knowledge and the determination of
1 Swarthmore College and Federal Reserve Board, and Federal Reserve Board, respectively. The views expressed
here are those of the authors, and may not be shared by the members of the Board of Governors of the Federal
Reserve System or the other members of its staff. We thank without implicating Steve O’Connell, Lucie Schmidt,
Robin Shores, Melynda Wilcox, and the students in Economics 73 at Swarthmore College for helpful comments on
an earlier draft, and Morgan Smith for expert research assistance. 2 The statistics reported in this paper are authors’ calculations using data from the Integrated Postsecondary
Education Data System (IPEDS) at the U.S. Department of Education’s National Center for Education Statistics.
Here and in the rest of the paper, we report on US citizens and permanent residents (excluding non-resident aliens
except where noted) who graduated with bachelor’s degrees from not-for-profit private or public four-year colleges
and universities granting majors in economics. Additional details on the data are in Appendix A.
2
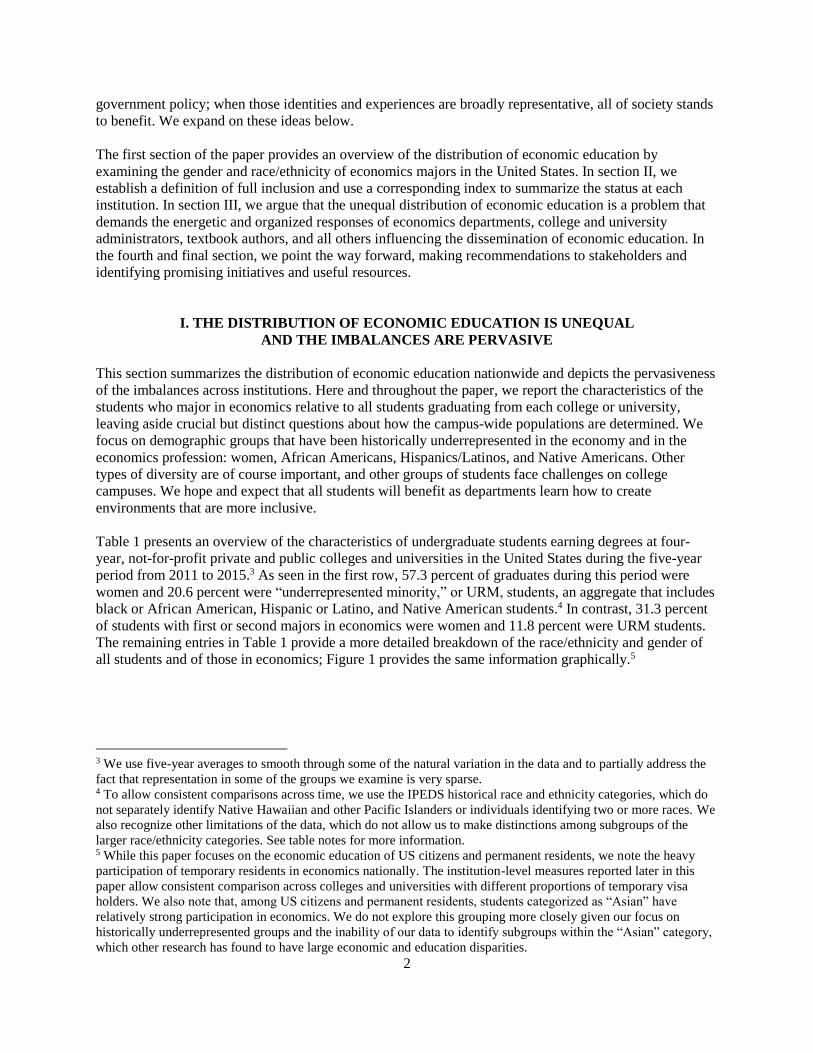
government policy; when those identities and experiences are broadly representative, all of society stands
to benefit. We expand on these ideas below.
The first section of the paper provides an overview of the distribution of economic education by
examining the gender and race/ethnicity of economics majors in the United States. In section II, we
establish a definition of full inclusion and use a corresponding index to summarize the status at each
institution. In section III, we argue that the unequal distribution of economic education is a problem that
demands the energetic and organized responses of economics departments, college and university
administrators, textbook authors, and all others influencing the dissemination of economic education. In
the fourth and final section, we point the way forward, making recommendations to stakeholders and
identifying promising initiatives and useful resources.
I. THE DISTRIBUTION OF ECONOMIC EDUCATION IS UNEQUAL
AND THE IMBALANCES ARE PERVASIVE
This section summarizes the distribution of economic education nationwide and depicts the pervasiveness
of the imbalances across institutions. Here and throughout the paper, we report the characteristics of the
students who major in economics relative to all students graduating from each college or university,
leaving aside crucial but distinct questions about how the campus-wide populations are determined. We
focus on demographic groups that have been historically underrepresented in the economy and in the
economics profession: women, African Americans, Hispanics/Latinos, and Native Americans. Other
types of diversity are of course important, and other groups of students face challenges on college
campuses. We hope and expect that all students will benefit as departments learn how to create
environments that are more inclusive.
Table 1 presents an overview of the characteristics of undergraduate students earning degrees at four-
year, not-for-profit private and public colleges and universities in the United States during the five-year
period from 2011 to 2015.3 As seen in the first row, 57.3 percent of graduates during this period were
women and 20.6 percent were “underrepresented minority,” or URM, students, an aggregate that includes
black or African American, Hispanic or Latino, and Native American students.4 In contrast, 31.3 percent
of students with first or second majors in economics were women and 11.8 percent were URM students.
The remaining entries in Table 1 provide a more detailed breakdown of the race/ethnicity and gender of
all students and of those in economics; Figure 1 provides the same information graphically.5
3 We use five-year averages to smooth through some of the natural variation in the data and to partially address the
fact that representation in some of the groups we examine is very sparse. 4 To allow consistent comparisons across time, we use the IPEDS historical race and ethnicity categories, which do
not separately identify Native Hawaiian and other Pacific Islanders or individuals identifying two or more races. We
also recognize other limitations of the data, which do not allow us to make distinctions among subgroups of the
larger race/ethnicity categories. See table notes for more information. 5 While this paper focuses on the economic education of US citizens and permanent residents, we note the heavy
participation of temporary residents in economics nationally. The institution-level measures reported later in this
paper allow consistent comparison across colleges and universities with different proportions of temporary visa
holders. We also note that, among US citizens and permanent residents, students categorized as “Asian” have
relatively strong participation in economics. We do not explore this grouping more closely given our focus on
historically underrepresented groups and the inability of our data to identify subgroups within the “Asian” category,
which other research has found to have large economic and education disparities.

3
Table 1. Composition of students graduating with bachelor’s degrees in any discipline and in economics,
percentages of graduates of four-year, not-for-profit colleges and universities in the US, 2011-2015
Female Under-
represented
minority
White
Black
Hispanic
Native
America
n
Asian
Other/
Unknown
race
Temporar
y Resident
Major in any discipline 57.3 20.6
Women 34.7 6.2 6.4 0.3 3.6 4.3 1.7
Men
27.1 3.3 4.1 0.2 3.0 3.2 1.8
Major in economics 31.3 11.8
Women
13.1 1.5 2.3 0.1 5.5 2.1 6.6
Men 39.6 2.8 4.8 0.2 8.2 4.7 8.3
See table notes in Appendix A.
Figure 1. Composition of students graduating with bachelor’s degrees in any discipline and in economics,
percentages of graduates of four-year, not-for-profit colleges and universities in the US, 2011-2015
When departments evaluate the demographic makeup of their majors, a common approach is to look at
the proportions of economics majors from various groups and compare those proportions to a parallel
categorization of the overall student body, similar to the analysis in Table 1. However, when tracking
multiple groups, share data can be misleading because one group’s representation in economics, such as
that of Hispanic men, may appear relatively strong due not to that group’s high participation in economics
but to the extremely low participation of members of another group, such as Hispanic women. To learn
about the effectiveness of economics departments in attracting a diverse representation of the campus-
wide population, we thus focus on the rates at which different groups of students graduate with a major in
economics.6
6 To see the problem with share data, consider an extreme and simplified situation in which non-Hispanic males at a
particular school major in economics at an ideal rate, while there are no women economics majors of any
race/ethnicity. A third group, Hispanic males, comprises the remaining student population and majors in economics
at a rate in between the two others, say 70 percent of the ideal rate. If the share of Hispanic males on campus were
10 percent, while non-Hispanic males and all females represented 30 percent and 60 percent, respectively, 19
percent of all economics majors would be Hispanic males, creating the impression that they were disproportionately
attracted to the major. Ultimately, of course, if a department were to attract majors from each demographic group at
equal rates, the composition of students graduating with bachelor’s degrees in economics would perfectly reflect the
composition of the college graduates of any major.

4
Table 2 presents the rates at which different groups of students graduate with a major in economics, with
each entry in the table representing the percentage of students in a particular demographic category that
graduated with a major in economics during the five-year period. Women and students from historically
underrepresented race/ethnicity groups graduate with a major in economics at lower rates than do their
counterparts. The pattern is observed both in aggregate and within gender and race/ethnicity categories.
For example, among whites, and confining our attention to institutions that offer a major in economics
(shown in the bottom block of the table), 5.5 percent of men graduate with a major in economics, whereas
only 1.7 percent of women do. Among underrepresented minorities, 4.6 percent of men graduate with a
major in economics, compared with 1.5 percent of women. Thus, among both whites and URM students,
men major in economics at roughly 3 times the rate of women, and, for both men and women, whites
major in economics at higher rates than do URM students.
Table 2. Rates at which students in various groups graduate with a major in economics at four-year, not-
for-profit colleges and universities in the US, 2011-2015 (percent)
Overall
Under-
represented
minority
White
Black
Hispanic
Native
American
Asian
Other/
Unknown
race
Temporary
Resident
Major in economics 1.9 1.1
Women 1.1 0.6 0.7 0.5 0.7 0.5 3.0 1.0 7.3
Men 3.1 2.0 2.8 1.6 2.2 1.8 5.2 2.9 9.0
Major in economics | economics major
offered at institution
3.9 2.9
Women 2.2 1.5 1.7 1.5 1.6 1.6 3.1 1.8 10.3
Men 5.8 4.6 5.5 4.5 4.7 4.5 6.1 5.6 13.5
See table notes in Appendix A.
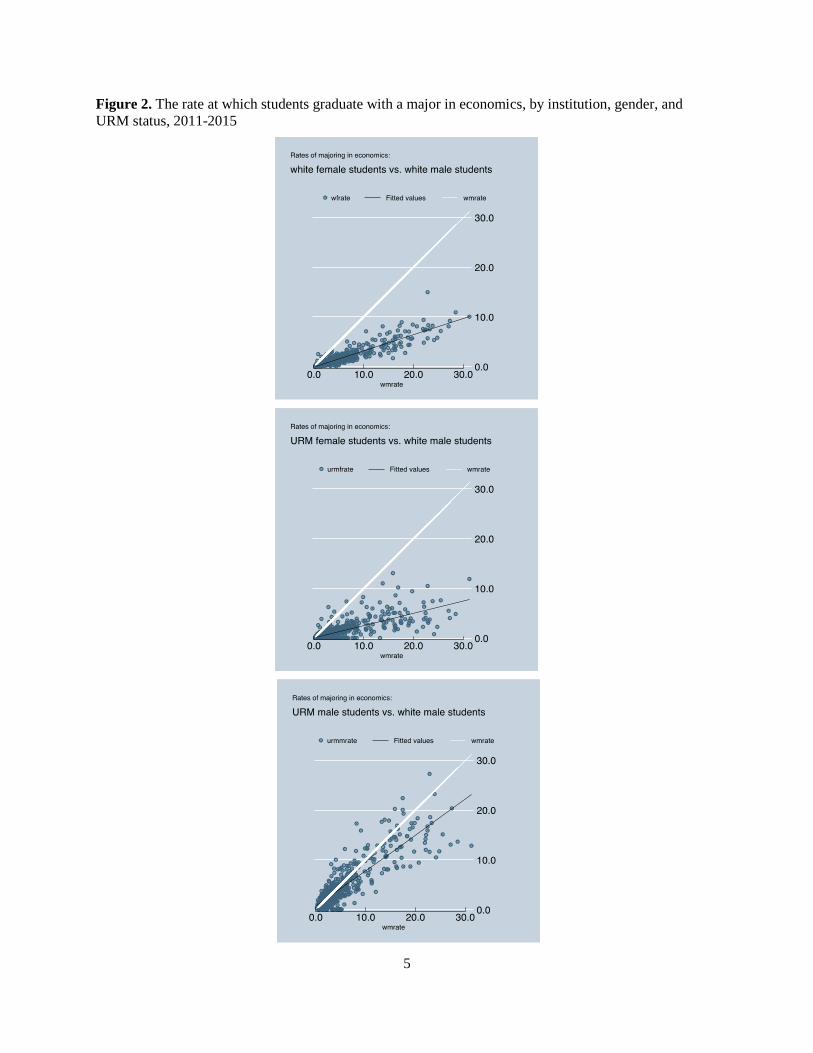
The three panels in Figure 2 tell a similar story at the institution level. These panels plot—institution by
institution—the rates at which white women, female URM students, and male URM students graduate
with a major in economics against the rate at which white men graduate as economics majors. If students
from each group attained majors in economics at equal rates, campus by campus, the points in the figures
would lie on the 45-degree line in each figure. In fact, however, the underrepresentation of women and
URM students in economics is stunningly pervasive: on most college campuses, economics majors are
disproportionately male (546 of 550 institutions) and non-URM (402 of 563 institutions). Simple trend
lines drawn through the points have slopes distinctly less than one: 0.32 for white women, 0.25 for URM
women, and 0.72 for URM men. At every institution in the nation where more than about 3 percent of
white men graduate with a major in economics, white women graduate with a major in economics at a
lower rate. URM females are similarly underrepresented at almost every institution. The
underrepresentation of URM males is less stark than it is for either white females or URM females, but
still notable. These institutional-level plots demonstrate that some schools are more successful than others
at drawing women and URM students into the economics major, and we document and describe that
variation more extensively in the next section of this paper.
5
Figure 2. The rate at which students graduate with a major in economics, by institution, gender, and
URM status, 2011-2015
6
Sometimes, economics faculty who teach at schools that do not have business programs respond to data
like those shown in Figure 2 with the hypothesis that the underrepresentation of women and URM
students in economics is due to the presence of would-be business majors, who are assumed mostly to be
white males, leading to a disproportionately white male population in the economics major.7 But then we
also hear claims in the opposition direction from colleagues at institutions that do offer undergraduate
business majors, who argue that the presence of the business major disproportionately draws capable
women and URM students away from the economics department, leaving a disproportionately white male
population in the economics major.
Figure 3 presents modified versions of the graphs shown in Figure 2. In particular, we draw two separate
versions of the three original graphs, stratifying by whether schools do or do not offer an undergraduate
business major. Comparing the graphs pairwise by row, the relative participation of white females appears
unrelated to whether a business major is offered, while that factor may be somewhat correlated with the
racial and ethnic composition of economics majors. However, the clearest message that comes out of
these graphs is that the pattern of underrepresentation in economics for women and URM students exists
in both sets of schools.
Thus, while some of the variation across economics departments may be explained by factors other than
conditions within the departments themselves, the institution-specific statics we present next clearly
demonstrate that the demographic imbalances are present in economics departments at all types of schools
and that all schools need to learn how to distribute economic education more equally.
7 Note that the undergraduate business major is considerably closer to demographic balance than is the
undergraduate economics major. Nationwide, 48 percent of majors in business are earned by females and 22 percent
by URM students; by contrast, as was noted in Table 1, 31 percent of economics majors are female and 12 percent
are URM.

7
Figure 3. The rate at which students graduate with a major in economics, by institution, gender, URM
status, and presence of business major, 2011-2015
No Business major available
Slope=0.32
Slope=0.14
Slope=0.58
Business major available
Slope=0.32
Slope=0.31
Slope=0.79

8
II. MOST INSTITUTIONS DISTRIBUTE ECONOMIC EDUCATION UNEQUALLY AND THUS
DO NOT ACHIEVE FULL ACADEMIC INCLUSION
In this section, we develop and use a metric to gauge the inclusiveness of economics departments and to
facilitate comparisons across schools, time, and disciplines. This metric is a mathematical formalization
of the definition of inclusive excellence in higher education, as stated by the Board of Directors of the
Association of American Colleges and Universities (2013).
To make excellence inclusive, our society must break free of earlier views that an excellent
liberal education should be reserved for the few…Increasing college access and degree
completion for all is necessary but insufficient to foster the growth of an educated citizenry for
our globally engaged democracy. We need to define student success not exclusively as degree
attainment, but also as the achievement of the primary goals of liberal education...Seeking
inclusive excellence requires reversing the current stratification of higher education and ensuring
that all students develop capacities to prosper economically, contribute civically, and flourish
personally…Without inclusion, there is no true excellence.
Excellence in higher education demands the full inclusion of members of all groups of students, both
across and within campuses. Something far less than excellence occurs when students have been enrolled
at an institution but do not feel welcome to participate fully in its offerings. Notably, equitable access to
academic majors is at least as important as social and extracurricular inclusion.
We thus define full academic inclusion as being achieved when members of all demographic groups
major in a field such as economics at equal rates.8 We construct an index that compares the rates at which
students in various groups graduate with a major in economics. In particular, our Economic Education
Inclusion Index (EEII) is calculated as the unweighted average of underrepresented groups’ rates of
majoring in economics relative to the rate at which white males major in economics:
EEII = 100 * average (WFrate, BFrate, BMrate, HFrate, HMrate) / WMrate
where WFrate, BFrate, BMrate, HFrate, HMrate, and WMrate are the rates at which white females, black
females, black males, Hispanic females, Hispanic males, and white males, respectively, major in
economics. We choose (non-Hispanic) white males as the reference group because they make up the
largest number of PhD economists in the United States and because their rate offers a consistent measure
of the scale of the economics major at each school.9 Possible values range from zero, for no inclusion, to
our target value of 100, for full inclusion. Index values in excess of 100 are possible and, in a few rare
cases, observed.
This formulation, while certainly not the only way to construct a measure of inclusion, has several
desirable attributes. It is scale and composition invariant and thus allows us to compare colleges and
universities of different sizes and with different mixes of student populations. By isolating the white male
rate in the denominator, the index does not impose anonymity, as familiar measures of inequality such as
the Gini coefficient do, but rather clearly indicates whether an institution replicates or resists the national
pattern on average. In the numerator, it tracks each major race/ethnicity by gender subgroup separately,
recognizing the different experiences of members of groups with intersecting race/ethnicity and gender
identities, and with equal weight, so that progress towards inclusion of all groups is rewarded.
8 As noted earlier, if this ideal were achieved, economics majors would be a representative draw from the population
of all students. 9 Later, we present modified indices for institutions with few white male students, women’s colleges and historically
black colleges and universities (HBCUs).

9
The EEII measure does, however, get noisy when a demographic group has only a small number of
members across all BAs/BSs. For this reason the overall index does not include Native American student
rates. The noisiness caused by small groups also clouds comparisons across institutions. Thus, we offer
the EEII not as a final pronouncement on a department’s inclusiveness but as a summary measure
designed to provoke closer inspection. That inspection should start with an examination of the rates at
which students in each demographic subgroup major in economics, which we also present in the tables
that follow.
Of course, the EEII formulation also raises some philosophical questions, which we address briefly here
and again in later sections of this paper. First, achieving the goal of full academic inclusion in economics
would affect the mix of students elsewhere on campus; students underrepresented in economics are
indeed majoring in other departments and are overrepresented in some of them. Extrapolating from
evidence we cite in the next section, we speculate that all disciplines would benefit from additional
diversity and would be better off with a representative mix of the campus population. We also wish to
push back against the argument that preferences drive the observed patterns in choice of major. The
variation in the rate at which members of underrepresented groups major in economics across colleges
and universities is just one indication that the departmental environment can heavily influence students’
decisions.
Table 3 presents inclusion index values in the most recent five-year period for all institutions offering
majors in economics and for various subsets of institutions, along with the corresponding rates at which
various groups of students graduate with majors in economics.10 It is striking how ineffective economics
departments are in attracting a representative slice of the campus population to the major. The average
institution has an EEII value slightly greater than 50, indicating that the typical institution’s economics
department is operating halfway between full inclusion and the complete exclusion of women and
historically underrepresented racial and ethnic groups.11 Universities with top-40 economics PhD
programs and top-50 liberal arts colleges are both below average in inclusive excellence. Together, these
two groups of otherwise elite institutions account for almost half (43 percent) of all graduating economics
majors.
10 See the appendix for notes on the construction of the data. Online versions of the tables in this paper include rates
for Native American and Asian American students and will be available at https://www.newyorkfed.org/data-and-
statistics/data-visualization/index.html. A companion working paper uses an inclusion index to track trends over
time and to compare economics to other disciplines. It also investigates whether departments that are more inclusive
with respect to gender are also more inclusive with respect to underrepresented minority groups. 11 The statistic that opens this paper—that, collectively, female and URM students majored in economics at 0.36 the
rate that white, non-Hispanic male students did in 2015—is indeed consistent with the reported mean EEII value of
54.1. Note that, by construction, the EEII overweights URM men, who have higher rates of participation in
economics than do women, relative to their representation on campuses. Note, too, that the 2015 figure is lower due
to a slight downward trend in the relative rate at which female and URM students major in economics.

10
Table 3. Economic Education Inclusion Index (EEII) values and corresponding rates at which students in
various groups graduate with majors in economics, 2011-2015
EEII
(0=no
inclusion;
100=full
inclusion)
Rates at which students major in economics
(percent) Percentage
of US
economics
majors
produced
White African
American Hispanic
M F M F M F
All four-year, not-for-profit
institutions offering majors in
economics*
54.1 5.6 1.7 4.7 1.5 4.8 1.5 100
Universities with top-40
economics PhD programs 51.7 9.6 3.4 6.7 2.2 8.5 3.2 32.5
All other universities with
economics PhD programs 58.9 4.5 1.3 4.1 1.5 4.4 1.5 29.1
Top-50 liberal arts colleges 47.9 16.5 5.4 12.7 4.1 12.2 4.0 10.2
All other colleges and universities 54.1 3.9 1.1 3.6 1.0 3.5 1.0 28.2
*Entries are simple means of the institution-level values. See other table notes in Appendix A.
Appendix Table 1 presents the calculated EEII values for each college and university in the dataset, and
Figure 4, below, presents the distribution of those values. The index value along with the corresponding
percentile allows us to gauge the effectiveness of individual economics departments in including students
from different key demographic groups in the economics major. For most institutions, index values are
well below 100, the full inclusion benchmark, signifying that economics departments at most colleges and
universities are far from full academic inclusion.
Figure 4. Distribution of institution-level EEII values, 2011-2015

11
Appendix Tables 2, 3, and 4 provide the institution level data similar to that reported in Appendix Table 1
for three distinct subsets of institutions: women’s colleges, men’s colleges, and HBCUs, respectively. The
tables also report adjusted EEII values, using only race/ethnicity or gender disparities, which, while not
fully comparable to the main EEII measure, reveal a wide range of outcomes across institutions in these
sets.
It appears that some economics departments are substantially better than others in terms of the
inclusiveness of their major. On the other hand, some institutions, even those with diverse student bodies
and otherwise excellent economics departments, have economics departments with dramatic
underrepresentation of women and minority students. As discussed earlier in this paper, comparisons
across institutions do need to be approached carefully, because index values can be affected by factors
outside a department’s control and by the noise that can occur when there are small numbers of students
in subgroups. Nevertheless, the EEII is an informative summary measure that should provoke closer
inspection both of the component statistics presented alongside the EEII in the tables and of the myriad
factors that are well within the control of departments and administrations.
Table 4 lists the institutions that have EEII values in the top quintile of all colleges and universities and
also have graduates in each of the five underrepresented groups—white females, black females, black
males, Hispanic females, and Hispanic males—majoring in economics at above average rates, relative to
white males.

12
Table 4. Thirty colleges and universities with high overall economic education inclusion, 2011-2015
EEII
Rates at which students major in
economics (percent) # of
Econ
BAs
per
year
Total
# of
BAs
per
year
White African
American Hispanic
M F M F M F
New Jersey City University 211.2 0.5 0.5 1.9 0.5 1.9 0.5 9 1261
Kean University 143.7 0.6 0.2 2.1 0.3 1.3 0.3 14 2617
Calvin College 133.1 3.6 3.3 6.7 4.3 5.0 4.4 29 823
University of Massachusetts-Lowell 128.9 1.1 0.4 1.3 1.5 3.1 1.0 21 2027
Seattle Pacific University 113 3.5 2.9 9.7 2.5 3.2 1.8 24 807
Xavier University 112.9 1.3 0.5 2.6 0.4 2.8 0.9 9 911
CUNY John Jay College of Criminal Justice 112.8 2.5 2.4 4.2 2.3 2.9 2.2 73 2395
Oakland University 110.9 0.7 0.2 1.4 0.2 1.2 0.6 11 2720
University of Vermont 104.1 4.8 2.3 12.3 2.4 6.9 1.3 85 2429
CUNY Bernard M Baruch College 90.4 2.9 1.0 3.0 2.8 4.8 1.6 62 2925
University of California-Riverside 89.8 3.6 1.8 6.3 2.0 4.2 1.7 175 4214
Farmingdale State College 87.5 0.7 0.4 0.7 0.9 0.7 0.4 9 1109
Washington and Lee University 84.9 13.9 8.0 17.9 3.3 15.0 14.6 53 447
United States Naval Academy 83.9 13.2 6.4 19.3 4.8 16.5 8.6 136 1069
University at Buffalo 83.5 2.5 0.7 3.5 1.9 3.3 1.2 93 4522
DePaul University 79.4 1.1 0.5 1.9 0.4 1.3 0.4 33 3687
Washington & Jefferson College 79.1 9.6 3.6 8.7 5.3 10.0 10.5 21 319
Rhodes College 78.8 8.1 4.7 7.9 3.2 12.0 4.0 29 405
Lafayette College 78.7 22.8 15.0 27.4 7.3 27.4 12.8 116 596
Portland State University 78.2 2.2 0.7 3.2 1.3 2.8 0.8 73 4215
American University 77.3 6.6 3.3 7.4 1.9 9.3 3.6 81 1662
Georgia State University 76.8 3.5 1.3 3.9 1.2 5.4 1.8 109 4523
California State University-East Bay 76.2 1.6 0.6 2.3 0.8 1.8 0.5 34 2836
Florida International University 76.2 1.6 0.5 2.1 0.7 2.3 0.5 95 7637
Northeastern University 75.3 3.0 1.5 3.5 2.1 2.8 1.3 103 3657
Pennsylvania State University-Main Campus 75.1 3.2 1.0 4.5 1.1 4.0 1.6 340 11049
Cornell University 74.3 14.7 6.6 17.4 6.6 18.1 6.1 457 3592
University of Maryland-Baltimore County 73.9 7.0 2.2 9.6 3.2 8.6 2.3 143 2191
University of Maryland-College Park 73.7 7.8 2.2 8.7 3.6 11.3 2.8 443 7144
Southwestern University 73.0 5.6 1.5 8.3 4.0 5.2 1.3 10 308

13
Looking at the experience of particular demographic groups, we see a wide range of outcomes across
schools, summarized in Table 5. The variation in the rate at which members of particular
underrepresented groups major in economics across colleges and universities suggests that the
departmental environment may influence outcomes. Appendix Tables 5 and 6 explore this idea further by
documenting the range of rates and overall inclusiveness at elite schools—those with top-40 PhD
programs or that are top-50 liberal arts colleges—which have students who are fairly similar at the time of
admission but who end up with fairly different experiences in economic education.
Table 5. Variation in rates of majoring in Economics across schools
Rate of majoring in Economics 10th percentile Median 90th percentile
White males 1.0 3.4 14.7
White females 0.2 0.9 4.6
Black males 0.0 2.8 12.2
Black females 0.0 0.7 4.3
Hispanic males 0.0 3.0 12.1
Hispanic females 0.0 0.7 4.3
Whereas most of the evidence we have presented thus far has focused on differences across institutions in
the degree to which they attract representative slices of the overall student body into the economics major,
Figure 5 shows the disparities in undergraduate economics over time and in comparison to those in
mathematics and statistics. There is no meaningful evidence of progress toward improved representation
of either women or URM students in economics in recent years. In fact, the rate of majoring in economics
among males edged up, on net, from about 2.5 percent in 2001 to about 3.1 percent in 2015. The rate of
majoring in economics among females drifted further below 1 percent over the same period, and, overall,
the imbalance in the gender composition of economics majors worsened slightly. The rate of majoring in
economics among URM male students is closer to, but consistently below, that of white males.

14
Figure 5. The rates at which students in various groups graduate with majors in Economics or in
Mathematics or Statistics, 2001-2015
Rates are calculated from the Integrated Postsecondary Education Data System (IPEDS) at the National
Center for Education Statistics using graduates from all 4-year, public or private not-for-profit institutions.
Appendix A provides additional details.
A common speculation is that the underrepresentation of women and URM students among economics
majors might reflect differential rates of math literacy or comfort among males than females. The data
summarized in Figure 5 do not support that interpretation. Throughout the period, differences in the rate
of majoring in math or statistics across demographic groups are distinctly smaller than in economics.
Indeed, white females major in mathematics at higher rates than they do in economics, despite math being
a less common major overall. As a result, the gender composition of math and statistics majors is
considerably more balanced throughout this period than it is in economics. Indeed, most recently, in 2015,
women earned only about 28 percent of undergraduate majors in economics, while earning 43 percent of
undergraduate majors in math.
In aggregate, the disparities in undergraduate economics are substantial. The first row of Table 6 presents
the average number of economics majors, by gender and race/ethnicity, produced in the U.S. each year
(averaging over the five-year period). The second row presents the number of additional students in each
group who would have graduated with a major in economics if all groups had majored in economics at the
same rate as do white males.
0.0%
0.5%
1.0%
1.5%
2.0%
2.5%
3.0%
3.5%
2001 2002 2003 2004 2005 2006 2007 2008 2009 2010 2011 2012 2013 2014 2015
Econ:Wh-M Econ:URM-M Econ:Wh-F Econ:URM-F
Math:Wh-M Math:URM-M Math:Wh-F Math:URM-F

15
Table 6. The average number of economics majors per year at all 4-year, not-for-profit institutions, by
race/ethnicity and gender, and the number of additional economics majors per year that would have
resulted if each group had majored in economics at the same rate as white males*
White African American Hispanic Native American
M F M F M F M F
Actual economics majors 14,006 4,635 1,004 543 1,699 793 72 29
Missing economics
majors N.A. 13,267 633 2,503 388 2,462 42 144
*Annual average based on 2011-2015 data. See other table notes in Appendix A.
Thus, taking as given the existing composition and distribution of undergraduates at US colleges and
universities, if women and URM students majored in economics at the same rates as white males, there
would be over 18,000 additional female economics majors and, with doublecounting, 6,000 additional
URM economics majors graduating every year. Of course, there is no single pathway to achieving full
inclusion, and these figures result from one possibly extreme approach to that objective—an approach in
which the majoring rates of every other group is brought up to that of white males. As we discuss in
section IV.D, other approaches involve drawing more white males into majors dominated by female
undergraduates and would not necessarily generate economics departments that are larger than they are
now. Later in this paper, we consider the societal implications of current imbalances and help departments
and universities think through possible reallocations to achieve full academic inclusion.
Making undergraduate economic education more inclusive would help to narrow the similarly substantial
demographic imbalance at the PhD level in economics. For example, in 2014, 42 doctorate degrees in
economics were awarded to African Americans, Hispanics, and Native Americans and 157 to women,
double-counting 11 minority women. In quick, back of the envelope calculations using data from Table 6,
we could quadruple the number of women PhD economists and double the number of URM PhD
economists graduating per year if we were to achieve our full inclusion goal, assuming conversion rates
from undergraduate majors into PhDs remain the same as at present.
A more balanced composition of undergraduate economics majors could have significant positive
implications for society, for the economy, and for the students themselves, as we discuss in the next
section.
III. THE DISTRIBUTION OF ECONOMIC EDUCATION MERITS URGENT ATTENTION
AND ACTION
The imbalances that we document above impact us all. Broad distribution of economic education is
critical to individual and collective success on and beyond college and university campuses. This section
briefly notes the benefits that accrue to individuals receiving economic education and then quickly moves
to consideration of societal issues.
The large disparities in undergraduate economic education certainly affect the employment outcomes of
individual students; careful research shows that the study of economics is good preparation for a variety
of careers and that large monetary premiums exist for graduates with business and economics majors even
after controlling for selection (Black, Sanders, and Taylor 2003; Arcidiacono 2004). Education also
brings significant nonpecuniary returns, in the form of improved health, happiness, civic participation,

16
and intergenerational benefits (Oreopoulos and Salvanes 2011), and economics education in particular
can facilitate better decision making, build understanding of policy issues, enhance intellectual
exploration of the world, and prepare students for further study in economics.
At the societal level, the identities and experiences of those who study and practice economics affect the
creation of economic knowledge and the determination of government policy; when those identities and
experiences are broadly representative, all of society stands to benefit.12 In economics, to a degree that
surely is not unique among academic disciplines but may be unusual, the field itself is endogenous to who
is practicing it: the problems that are deemed to be most important, the papers that are published in the
most prestigious journals, the individuals who are tenured at the most prestigious institutions, the policy
options that are developed and implemented, all plausibly depend on the identity and characteristics of
those who are driving each of these actions. In short, the identities of the incumbents matter. If white
males—especially ones who come from privileged backgrounds—are disproportionately left in charge of
the field, then we as a profession are likely to see one particular set of problems as most demanding our
attention, and we are similarly likely to see one particular set of solutions as providing the most
compelling remedies to those problems. But change the identity of who is participating in the policy
process, and we are likely to change both the problems that are seen as important and the solutions that
are seen as most promising.
The view that economics depends on who is practicing it has some empirical grounding. For example, a
2012 survey of members of the American Economic Association (AEA) found that female economists
were markedly more likely than male economists to favor requiring that employers provide health
insurance to their full-time employees; making the tax system more progressive; and linking the openness
of our trade to the labor standards of our trading partners (May, McGarvey, and Whaples 2014). Women
were much more likely than men to disagree with the statement that “job opportunities for men and
women in the United States are currently approximately equal.” Women were also vastly more likely to
disagree with the statement that “the gender wage gap is largely explained by differences in human capital
and voluntary occupational choices.” And women were more likely than men to see “graduate education
in economics in the United States currently” as favoring men more than women. Similar influences
deriving from the under-representation of blacks, Hispanics, and other important groups are entirely
plausible but are not documented in the survey of AEA members. None of this is to say that women’s
views are better than men’s, or the other way around. The point is that they are different and that it is
important that all perspectives be heard and carefully considered.
Diversity is also important in policymaking environments. Like many other policymaking organizations,
the Federal Reserve strives to create a team-oriented, collaborative environment, often combining
professionals with different specialties such as economists, attorneys, and persons with backgrounds in
the examination and regulation of financial institutions. However, it is important that the professional
environment exhibit diversity and inclusiveness not just in terms of professional training but also in terms
of race or ethnicity, gender, sexuality, socioeconomic status, and all the other characteristics that define
individuals as who they are.
Ample research documents that diverse teams generate more-robust decisions, higher-quality outcomes.13
Diverse teams include members that offer differing points of view; they challenge one another’s evidence;
12 Bayer and Rouse (2016) reviews the research supporting this statement. This section borrows language from “The
Sorry State of Diversity in Economics and What You Can Do About It” by David Wilcox, speech given at the
Seventh Annual Conference on Teaching and Research in Economic Education, May 31, 2017. 13 Again, see Bayer and Rouse (2016) for a review of this research. In addition, Rock, Grant, and Grey (2016)
describe a clever experiment in which three members of a Greek-style sorority or fraternity are typically unable to

17
they bring to bear different perspectives, and so are capable of thinking of possibilities that might escape
the imagination of homogenous teams.14 Interestingly, members of diverse teams may not particularly
enjoy being part of such a team15—it can be annoying to have one’s views challenged and one’s evidence
disputed—but they do a better job advancing the mission of the overall organization.
These research findings underscore the importance of cultivating diversity and inclusion in economic
policymaking environments. Economics is a tricky business: Even smart, highly trained people often get
it wrong the first time and on their own, so designing the professional environment to ensure that different
perspectives are brought to bear can be seen as part of the “quality assurance” process. These
considerations seem all the more pertinent for an agency like the Federal Reserve, where the practical
consequences of decisions can be profound. Given the importance of the mission, it is imperative that the
agency have access to the full energy and talents of all segments of the population. A work environment
that is diverse and inclusive will better draw in the full range of perspectives, and allow employees to
contribute and perform to their full potential.
Thus, full academic inclusion on college campuses, and in economic education in particular, is important
both to the quality of the immediate environment and for the contributions that a more diverse and
inclusive environment can make to the construction of knowledge and policy. While we do not deny that
more diversity and inclusion might benefit any discipline or occupation, economics is especially in need
of urgent attention and action, if for no other reason than the fact that diversity and inclusion have not
been accorded the attention and assistance in economics that they have in some other disciplines.
In the professional environments in which we work as individuals—Swarthmore College and the Federal
Reserve—we are also driven as individuals by the conviction that fostering diverse and inclusive
professional environments is simply the right thing to do. We feel an obligation to welcome and value
every individual with all of the characteristics that make them who they are; to invite them to harness
their passion and energy and creativity toward our shared goal of accomplishing the missions of our
respective institutions; and to make clear to each and every person that they share in the responsibility for
making each institution better than it already is, and that their characteristics as individuals will help them
do exactly that.
In our discussions with colleagues in the economics profession, we often hear skepticism expressed about
whether the demographic imbalances in economics are a social problem warranting countervailing action.
The skepticism usually takes one of two forms—and sometimes both. First, many people react with some
version of the question “Isn’t our loss some other field’s gain? If we lose a talented woman or a talented
African American or Hispanic to some other field, economics may be poorer as a result, but isn’t the other
field richer to the same extent?” We argue to the contrary. In part, our view rests on two ideas noted
above—that the very definition of the field depends on who is practicing it, and the documented finding
that diverse teams perform better. But it also derives from our casting a jaundiced eye toward the claim
that the choice of major in college or university and the choice of profession are just examples of
consumer sovereignty—and who are we to step in the way of individual choice? If we were totally
comfortable that economics was being presented in the classroom in a manner that was equally inviting
for all; that students’ decisions about which fields to pursue were based on full information about what
solve a puzzle (probability of getting the correct answer equals 29 percent) but when a fourth member is added to
the team who comes from a different Greek organization, the probability of getting the right answer doubles, to 60
percent. 14 Rock and Grant (2016) also discuss mechanisms through which diverse teams perform better; diverse teams focus
more on facts and they process those facts more carefully. 15 Rock, Grant, and Grey (2016) point out, however, that participants routinely overestimate the amount of conflict
that will actually be created on a diverse team. See also Lount, Sheldon, Rink, and Phillips (2015).

18
the field of economics is and what they could do with it; that their decisions were utterly free from social
norming effects or other distortions outside the self; if we were absolutely certain that the overwhelming
tendency of women to stay away from economics at both the undergraduate and graduate levels reflected
only benign factors, then perhaps we would be more open to the argument that the demographic
composition of the economics profession should be a matter of social indifference. But the evidence
refuting that view of the world is far too pervasive for us to think that anyone should rest easy, free of any
impulse to bring the economics profession closer into balance with overall demographic norms.
In fact, the research documenting the productivity dividend generated by diverse teams suggests to us that
a different allocation of students across majors should be taken as the default than the one that we
perceive to be the starting point for discussion at most institutions. Rather than accepting the status quo as
the baseline, we suggest that college and university academic departments and administrators adopt the
null hypothesis that all departments should draw a representative sample of the campus-wide population
into their respective majors.16 This is not to say that imbalances would not be tolerated, but that they
would be interrogated and would become a topic of conversation. If diverse teams are more creative and
productive, then a college or university should be approximately as concerned if its biology or psychology
major is overweighted toward women as it is if its economics department is overweighted toward men.
The argument is less clear with respect to URM students, because even if URM students are concentrated
in some majors at the expense of others, they are nonetheless likely to be a distinct minority in most cases
except at some minority-serving institutions. Even so, equal representation across departments seems to
us to be a better starting place for the campus conversation than an uncritical, though perhaps more
convenient, acceptance of the status quo. Just as in portfolio theory in the field of finance, maximum
diversification would seem to prevail when each academic department holds a representative slice of “the
market” in its corps of majors.
The unequal distribution of economic education is a problem that demands deliberate and immediate
responses from all of us. In the next and final section, we point the way forward.
IV. INNOVATORS POINT THE WAY FORWARD
We are far back in the queue of people who have recognized that representation in the field of economics
urgently needs to be improved. Many of those ahead of us in line have responded to that recognition by
investing enormous time and creativity in devising remedies. In this section, we present a catalogue of
such steps. The catalogue is imperfect in at least three respects:
First, although we have tried to make it reasonably comprehensive, it doubtless inadvertently
omits some—perhaps many—creative initiatives already in operation. We invite anyone who
knows of such initiatives to contact either one of the authors. We intend to keep a living version
of this section updated and available online.
Second, only a minority of the creative and well-intentioned steps described here have been
subjected to any sort of rigorous evaluation—though even fewer of our profession’s status quo
procedures are based in evidence—therefore, we cannot as of this writing confidently estimate the
incremental effect of implementing most of these steps. While STEM faculty have been much
more intentional about implementing and testing innovative approaches to teaching, we
economists too infrequently applied our research expertise to the tasks of evaluating and
16 In our companion paper, we explore such an allocation and use dissimilarity indices to assess how far away
colleges and universities currently are from full inclusion in this sense.

19
improving our own effectiveness.
Third, as creative and important as the steps catalogued here are, they are clearly insufficient
because over the past quarter century, representation in the field of economics has barely budged.
However—and this point bears stressing—other fields have made meaningful progress toward
diversifying their ranks. That progress was the result of intentional effort. We economists should
look closely at the steps taken by other fields, and determine whether there are lessons to be
learned for our profession.
To make the catalogue as useful as possible, we have organized it according to who might take each step.
Thus, for example, we begin with steps that might be taken by individual faculty members and then
proceed to introduce steps that might be taken by textbook authors, department chairs, university
administrators, and several others.
A. Steps for undergraduate instructors and mentors to consider
A convincing body of evidence suggests that classroom environment and faculty choices contribute
heavily to determining whether women and URM students see economics as a field that is relevant to
them and whether they see the economics department as a place where they want to devote a substantial
portion of their time and energies. Even in the friendliest classrooms, implicit associations can bias
instructor behavior without awareness or intent, and seemingly neutral practices and decision rules can
systematically disadvantage students who are members of traditionally underrepresented groups, as
described by Bayer and Rouse (2016). Therefore, our foremost request of classroom instructors is that
they recognize their sway over the situation; they have the ability and the responsibility to create an
encouraging environment, to examine the unintended consequences of their own behavior, and to
reconsider every aspect of their interactions with students, from textbook selection to class-time usage to
office-hours scheduling and advising.17.
To lead faculty members to understand their influence and to take concrete steps to draw a more diverse
group of students to economics, one of us in 2011 founded Diversifying Economic Quality, abbreviated
Div.E.Q. Now sponsored by the American Economic Association’s Committee on the Status of Minority
Groups in the Economics Profession, Div.E.Q. is a wiki offering evidence-based approaches to making
economics classrooms and departments more welcoming to all.18 The site, which can be accessed at
DiversifyingEcon.org, outlines the steps, and the research behind them, which economists can take to
improve practices inside and outside the classroom and in departments overall.19 Better teaching helps all
students but is particularly effective in attracting and retaining students who do not have the benefit of
prior training or encouragement in economics.
17 As a specific example, Bansak and Starr (2010) find that students “widely view economics as a business-oriented
field that prioritizes math skills and making money—a combination that is a turnoff for women, but not so much
men. Thus, emphasizing uses of economics for social welfare analysis, while de-emphasizing its business
applications, may help to rebalance predispositions at the outset of the principles class.” 18 Another source full of diagnoses of what is wrong with economics pedagogy and replete with practical
suggestions for what to do about it is Bartlett (1995). Though dated, the diagnoses and suggestions in Bartlett still
ring true to us more than 20 years later. 19 Complementary to this paper, the site also provides suggestions for course content and evidence on the extent of
the underrepresentation of women and URMs in the field of economics and discusses why that underrepresentation
matters. Comments on or suggestions for the site can be sent to [email protected].

20
Bayer and Rouse (2016) highlight several key evidence-based practices for instructors to adopt: they
emphasize the importance of instructors and students holding a growth mentality that values hard work,
making mistakes, and perseverance; they provide specific strategies for reducing stereotype threat, a
factor that may otherwise debilitate the performance of both women and minorities in economics
classrooms; and they note that “active learning increases exam scores and decreases failure rates relative
to traditional lecturing, with particular benefit for students from disadvantaged backgrounds and for
women in male-dominated fields.”20 To counter faculty members’ unconscious biases, Bayer and Rouse
(2016) recommend crowding out inequities, such as those documented by Milkman, Akinola, and Chugh
(2015), with affirmations, listening, and opening doors to opportunity.
Mentorship is one essential part of the educational process. Unfortunately, privileged students almost by
definition have easier access to mentorship and role models than do other students. One remedial step is
for instructors to think intentionally about the implications for diversity and inclusion of the mentorship
that they provide. At New York University’s Stern School of Business, Peter Henry implements a
particularly far-reaching form of intentional mentorship through his “PhD Excellence Initiative.”
Established as a post-baccalaureate research fellowship program with support from the Alfred P. Sloan
Foundation, the Initiative brings one to two high-achieving underrepresented minority students to New
York City annually, where they work closely with Professor Henry for a period of two years to prepare
for the rigors of doctoral studies in the field. During their participation in the Initiative, fellows engage in
collaborative research, receive intensive one-on-one mentoring including guidance on applications to
graduate programs, take courses for credit at NYU (up to two per semester), and network with peers.
They also participate in the annual Summer Workshop, which brings together current and past fellows as
well as visiting scholars, for a daylong program of research presentations, feedback, and professional
development.21
Another promising form of mentorship with the objective of promoting inclusivity was recently initiated
by Williams College, which hosted a Women in Economic Research Conference in April, 2017. The
conference provided a venue for undergraduate women to present their research and receive professional-
level feedback, hear from a keynote speaker, network with peers, and establish mentoring relationships.
Eligibility for participation at the conference was intended to be limited to students attending institutions
within 2½ hours’ driving time from Williamstown. A total of 31 students from 17 distinct institutions
responded to the call for bids to present. From those bids, 19 students from nine institutions were invited
to participate. Participants remarked on how meaningful they found their experience at the conference; at
least one participant said that she had never thought of herself as an economist until this event.22
Harvard University’s Research Scholar Initiative (RSI) is similar in some respects to Peter Henry’s PhD
Excellence Initiative. Scholars must have completed an undergraduate degree before starting the one- to
two-year program. The RSI “strongly encourages applications from underrepresented minorities,” and
admits three to four Scholars per year for the program in economics. (A similar program admits an
additional three to four scholars in life sciences.) Over the course of their engagement with the RSI,
Scholars work as part-time research assistants to members of the Harvard faculty, and may take courses at
either the undergraduate or graduate level at Harvard. Scholars receive a stipend, tuition for up to two
20 See p. 234. 21 Participants in the PhD Excellence Initiative must be US citizens. More information about the Initiative is
available at http://www.peterblairhenry.com/phd-excellence-initiative/. 22 The daylong experience was organized by Williams College faculty members Matthew Gibson, Sarah Jacobson,
Sara LaLumia, and Lucie Schmidt. This team intends to summarize their model and make it available to other
institutions that might be interested in replicating the event.

21
courses per semester, as well as health insurance, GRE preparation, and a one-time relocation allowance.
Like the PhD Excellence Initiative, the RSI in economics is funded by the Alfred P. Sloan Foundation.23
Mentorship, of course, most often happens in the course of ordinary academic life. Economics faculty
should certainly provide students with information about the external programs described in this paper,
and they should be intentional about offering research and teaching opportunities to students who may
otherwise feel on the margins. The selection of teaching assistants is particularly important because it
affects not only the students who are chosen but also those who see them at the front of the classroom.
B. Steps for textbook authors, publishers, and other curriculum writers to consider
Given the pervasiveness of the demographic imbalances in economics at the undergraduate level, it is
natural to look for factors that could exert their influences across many different campuses
simultaneously. One such factor is the set of instructional materials that instructors use—particularly at
the introductory level. Surely, these materials play a role in shaping the perceptions in the minds of
students of what economics is, and whether it might be relevant to their lives. Surprisingly, the issue of
inclusion appears to receive little analysis. For example, in a review essay focusing on the set of
principles textbooks available circa 2011, Lopus and Paringer (2012) includes a brief reference in passing
to two previous essays that investigated “the treatment of women and minorities in principles of
economics textbooks (Robson 2001; Feiner 1993),” but otherwise makes no reference to issues of
inclusion in instructional materials. It is striking that the two essays referenced in Lopus and Paringer
(2012) were already, by that point, quite dated.
Another essay in the same volume, Bartlett (2012), notes the absence of women from introductory
textbooks. “In an early study, Feiner and Morgan (1987) found that women were virtually absent from
introductory textbooks. In the hundreds of pages reviewed in leading texts, women and minorities were
mentioned in 1.3 percent of them. Their qualitative analyses suggest that introductory textbooks are
indeed race and gender blind and that white male behavior, both implicitly and explicitly described, is
held up as the norm. In later studies, Feiner (1993) and then Robson (2001) found that the inclusion of
women and minorities in introductory texts had improved; they could now be found in around 3 percent
of the pages.”24 As Bartlett concludes, “If economics pedagogies are not more inclusive, we stand a
chance of losing those students with the voices and experiences who have the most to contribute to
making economics more universally applicable.” In other words, making the content of economics
courses—especially introductory classes—more inclusive is likely to make the clientele of such courses
more inclusive as well.
Thus, our foremost request of textbook authors, publishers, and other curriculum writers such as the
College Board is that they design and revise their materials with one central question in mind: Are issues
of race, gender, and class integrated into the material in a way that will allow a broader swath of students
to see economics as relevant to people like them? We suggest that textbook authors commission critical
reviews of their own materials, with an eye toward identifying how those materials can be made more
inclusive, along gender, race/ethnicity, and socioeconomic lines. We also suggest that authors and others
construct curricula around teaching core competencies in economics (e.g., Allgood and Bayer 2017) to
avoid crowding out important economic issues with laundry lists of concepts and content.
C. Steps for department chairs to consider
23 Participants in the RSI must be either US citizens or permanent residents. More information about the RSI is
available at https://gsas.harvard.edu/diversity/research-scholar-initiative. 24 Bartlett (2012) p. 217.

22
By dint of their leadership positions, department chairs play a disproportionate role in setting the climate
in their departments. They can signal by their actions and statements that they recognize diversity and
inclusion as important issues. In doing so, they provide critical support to other members of the
department, often junior, female, and/or underrepresented faculty, who care deeply about these issues.
Chairs also control resources that can be used to support diversity and inclusion initiatives within their
departments and to support faculty who wish to participate in external opportunities. Our foremost request
of department chairs is that they be proactive in implementing an array of interventions to be more
welcoming of diverse students and colleagues. There is no neutral course; the status quo certainly appears
not to be serving well students who are not white males, and doing nothing is as much a choice as taking
action.
Department chairs should give careful consideration to maximizing demographic balance among
instructors, especially at the introductory level. Intuition suggests that the characteristics of the individual
at the front of the classroom might matter for whether students see a pathway to success for themselves,
and this intuition is supported by evidence. In particular, Carrell, Page, and West (2010) exploit the fact
that at the U.S. Air Force Academy, students are randomly assigned to professors for some of their
classes. Carrell et al. hypothesize a variety of different reasons why the gender of the course instructor
might matter for a student’s proclivity to pursue further study in a STEM field, including the possible
importance of role models, “differences in the academic expectations of teachers, differences in teaching
styles, or differences in the extent to which teachers provide advice and encouragement.”25 They conclude
that “although professor gender has only a limited impact on male students, it has a powerful effect on
female students’ performance in math and science classes, their likelihood of taking future math and
science courses, and their likelihood of graduating with a STEM degree.”26 It does not seem like much of
a leap to suppose that similar effects might result from the identity of the instructor in an economics
classroom. Moreover, Fairlie, Hoffmann, and Oreopoulos (2014) find analogous effects with respect to
the race and ethnicity of instructors.
Most departments, of course, are currently severely gender- and race/ethnicity-imbalanced. Accordingly,
if done badly, demographic balance in the classroom could come at the expense of overburdening female
and URM members of the faculty. However, other approaches that are respectful of fairness seem
possible. For example, introductory classes could be team-taught, with white male instructors paired with
a female or URM instructor. The relative burden on female instructors could be reduced by more-
generously provisioning them with teaching assistants, to free them up for devoting a larger fraction of
their time to direct interaction with students in the classroom. Department chairs can also partially
compensate for insufficient diversity among the faculty by encouraging selection of a diverse set of
student teaching assistants.
Department chairs should also work actively to improve the culture of their departments, expressed both
in formal policies and in the everyday practices of faculty and students. A group of economics faculty
from liberal arts colleges is working together to enhance the inclusivity of their departments, sharing
curricula and strategies and conducting coordinated, randomized evaluations to generate credible
evidence on whether specific approaches are effective. Their collaboration began in 2015 with a grant
from the Alliance to Advance Liberal Arts Colleges, which funded a workshop attended by economists
from fifteen liberal arts colleges (Barnard College, Furman University, Grinnell College, Haverford
College, Middlebury College, Oberlin College, Occidental College, Pomona College, Smith College,
Swarthmore College, Vassar College, Washington & Lee University, Wesleyan University, Wellesley
College, and Williams College). The group continues to meet, and economists from several other colleges
25 Carrell, Page, and West, p. 1103. 26 Ibid, p. 1104.

23
are joining this year.27 Ultimately, results of their experimentation and evaluation can guide improvement
at all institutions.
Interventions may also be identified through the challenge grant program known as “Undergraduate
Women in Economics.” UWE is designed as a randomized controlled trial that aims to identify
interventions that are effective in increasing the representation of women in the economics major. The
project was initiated by Claudia Goldin, Professor of Economics at Harvard University, managed by
Tatyana Avilova at the NBER, and advised by a group of experts from across the country; funding was
provided by the Sloan Foundation.28 Twenty undergraduate institutions from around the country were
selected to serve as “treatment” schools, while 35 institutions agreed to provide control data. Treatment
schools received $12,500 each to implement interventions of their choosing and consistent with the goals
of the project. Treatment began with the class of students entering in the fall of 2015, thus results are not
yet available. However, in a set of notes describing the project, Goldin observes that “the UWE program
has been instrumental in giving women in these 20 [treatment] schools more of a voice and giving all
potential majors better information about economics as a discipline” (p.2).29 The program has also been
instrumental in raising awareness across the profession about the lack of women in the economics major.
D. Steps for university and college administrators to consider
Our foremost request of university and college presidents, deans, provosts, and other university personnel
outside the economics department is that they change the starting point of conversations about
representation in classrooms on their respective campuses. Our sense is that most such conversations
center on the implicit assumption that today’s distribution of students across departments optimally
reflects fundamental characteristics of students and disciplines. Instead, we think it overwhelmingly likely
that stereotypes, information gaps, and an array of social, psychological, and other influences are
distorting the choices of both faculty and students. Current departmental and university practices that seek
to limit enrollments in economics departments may be exploiting rather than correcting those distortions
and thus come at the expense of the students who are deprived of a full academic experience.
A better starting point for conversations about representation, in our view, would be the premise that
every classroom should attract a proportionate slice of the campus-wide population. We are open to the
possibility that, even in the best of all possible worlds, women or URM students might tend toward
different academic pursuits than white men, but we think that campus administrators and instructors need
to satisfy themselves that the conditions that could justify deviations from proportionate representation
actually prevail. Are you comfortable that the atmosphere in economics classrooms is not unwelcoming to
women or URM students? Symmetrically, are you confident that subtle cues in sociology or education
classrooms are not diverting men to other fields? Are you comfortable with the presumption that math
literacy somehow explains the imbalances in economics, computer science, and physics lecture halls,
even though the mathematics major is more gender-balanced than the economics major? And yes, to
answer a question frequently posed to us, we are approximately as concerned when other majors are
disproportionately female as we are by the fact that economics majors are disproportionately male. Full
academic inclusion might best be achieved not by generating economics departments that are even larger
than they are now, but by asking other departments to broaden their appeal and making changes that draw
more white males into majors such as literature, education, and psychology.
27 See http://www.aalac.org/archive-of-previously-funded-workshops. Fernando Lozano of Pomona College and
Amanda Bayer of Swarthmore College won the initial grant to organize the collaboration. 28 https://scholar.harvard.edu/goldin/UWE 29 “Change Starts with UWE: Gender and the Undergraduate Economics Major,“ by Claudia Goldin 2015
(https://www.aeaweb.org/conference/2016/retrieve.php?pdfid=340).
24
Many educational institutions have done an admirable job of granting admission in recent years to larger
numbers of first-generation students as well as students of color, and students who come from less-
privileged rungs on the socioeconomic ladder. For all of these students, the transition to a highly rigorous
academic environment possibly dominated by privileged whites can be extremely challenging. Thus, a
critical next step is to ensure that all students are fully supported across every opportunity, once they have
reached the campus. Consistent with that objective, some institutions have begun to offer a “bridge
program” to selected students during the summer before freshman year. Williams College is one such
institution. Their Summer Humanities and Social Sciences (SHSS) bridge program is targeted to URM
and first-generation students who will be beginning their first year at the college in the subsequent fall.
The five-week program offers participants a first taste of what the academic experience will be like at
Williams, in the company of other students like themselves and before the pressure of grades enters the
equation. Participants take a set of classes intended to simulate the workload during a regular academic
semester at Williams. Early results suggest that participation in SHSS during years when an economics
class is included in the curriculum, in place of a mathematics course, increases the probability that
participants take economics classes, improves their performance in Principles of Microeconomics, and
boosts enrollment in regular mathematics classes.30
E. Steps for employers—both academic and non-academic—to consider
Extensive research shows the pervasive role that discrimination can play in the hiring process.31 Even if
overt racism plays a smaller role today, much research demonstrates that implicit bias can still influence
outcomes materially. Interestingly, the evidence shows that implicit bias is a pervasive phenomenon, and
that women and people of color are susceptible to it just as white males are. Surfacing the issue and
discussing it openly are important first steps to reducing its impact.
In the economics divisions at the Federal Reserve Board, we have instituted decision-making procedures
that limit the opportunity for bias to influence evaluations, and we now require every individual who
participates in the economist recruiting process to undergo training for implicit bias awareness before the
recruiting process begins. Participants are exposed to research on diversity, disparities, and bias applied to
the economics profession in particular, such as that in Bayer and Rouse (2016), and are provided multiple
venues to discuss its relevance to their work at the Board.32
Our foremost request of everyone involved in hiring economists is that they, too, recognize the likely
impacts of explicit and implicit biases, and take steps to combat them.
F. Steps for foundations to consider
Incentives matter, and paying for post-secondary education can be a daunting prospect, especially for
students who do not come from privileged backgrounds. The Andrew W. Mellon Foundation, through its
Mellon-Mays Undergraduate Fellowships, provides funding to 48 institutions, which in turn select
fellows, taking into account “race and ethnicity, in relation to their underrepresentation in designated
fields of study.”33 Fellows, typically selected in the sophomore year, receive holistic support—faculty
30 See “Teaching Economics in a Summer Bridge Program,” by Lucie Schmidt, Williams College, presentation for
the AALAC Workshop on Diversifying Economics, February 2016. 31 See, for example, Bertrand, Marianne, and Sendhil Mullainathan (2004) “Are Emily and Greg More Employable
than Lakisha and Jamal? A Field Experiment on Labor Market Discrimination” American Economic Review
September 94(4) pp. 991-1013. 32 Recent steps that have been taken at the Federal Reserve Board are discussed in Wilcox (2017). 33 http://www.mmuf.org/eligibility

25
mentoring, special programming, stipends for term-time and summer research, and repayment of
undergraduate loans up to $10,000—“provided that fellows pursue doctoral study in eligible fields.”34
Unfortunately, economics is not an eligible field of study and is extremely unlikely to become one.
Therefore, beyond continuing and expanding programs like those funded by the Sloan Foundation and
described above, our foremost request of foundations is that they consider stepping in at the
undergraduate level to fill the void left by Mellon.35 Foundation funds could also be productively used to
create incentives for economists, inducing them to attend teaching workshops or to conduct research on
diversity and inclusion. Underrepresented minority groups are so underrepresented in economics (with
only 40 to 50 PhDs in economics awarded annually to black and Hispanic recipients) that even a
relatively modest investment could move the needle meaningfully.
G. Steps for the AEA to consider
Nearly fifty years ago, the AEA established two committees to address disparities in the profession.
The AEA’s Committee on the Status of Minority Groups in the Economics Profession (CSMGEP)
“was established by the American Economic Association (AEA) in 1968 to increase the
representation of minorities in the economics profession, primarily by broadening opportunities for
the training of underrepresented minorities. CSMGEP… also works to ensure that issues related to the
representation of minorities are considered in the work of the AEA, and engages in other efforts to
promote the advancement of minorities in the economics profession.”36
Similarly, the Committee on the Status of Women in the Economics Profession “was founded in 1971
to eliminate discrimination against women, and to redress the low representation of women, in the
economics profession. CSWEP is based on the principle that economics is a woman's field as much as
it is a man's field... CSWEP works to assure that women's issues are considered in the committee
work of the American Economic Association (AEA), makes an annual report to the AEA on the status
of women in the economics profession, and engages in other efforts to promote the advancement of
women in the economics profession.”37
Other professional organizations, such as those described below, also represent long-standing institutional
efforts to broaden representation in the field of economics.
“The National Economic Association (NEA) was founded in 1969 as the Caucus of Black Economists
to promote the professional lives of minorities within the profession. In addition to continuing its
founding mission, the organization is particularly interested in producing and distributing knowledge
of economic issues that are of exceptional interest to promoting economic growth among native and
immigrant African Americans, Latinos, and other people of color.”38
“The American Society of Hispanic Economists (ASHE) is a professional association of economists
who are concerned with the under-representation of Hispanic Americans in the economics profession
34 http://www.mmuf.org/program-glance-0 35 Alternative approaches are possible. For example, Williams College, under the auspices of the Allison Davis
Research Fellowship, partners with Mellon-Mays to provide support to students in economics and other fields that
are not eligible for funding under Mellon-Mays alone. See https://osap.williams.edu/fellowships/. 36 https://www.aeaweb.org/about-aea/committees/csmgep 37 https://www.aeaweb.org/about-aea/committees/cswep/about/mission 38 http://www.neaecon.org/about

26
at a time when Hispanics represent over 16 percent of the United States’ population. [The primary
goals of ASHE] include: promoting the vitality of Hispanics in the economics profession through
education, service, and excellence; promoting rigorous research on economic and policy issues
affecting U.S. Hispanic communities and the nation as a whole; and engaging more Hispanic
Americans to effectively participate in the economics profession.”39
These groups oversee critically important initiatives. Most relevant to the focus of this paper, the AEA
Summer Program, currently hosted by Michigan State University in collaboration with Western Michigan
University, trains undergraduate representatives of groups that have historically been underrepresented in
economics, giving them two months of intensive instruction in the technical skills needed to succeed at
the PhD level in economics. The program is provided free of charge to participants, and participants
“receive a $3,250 stipend upon successful program completion.”40 Becker, Rouse, and Chen (2016)
estimate that the program may directly account for 17 to 21 percent of the PhDs awarded to minorities in
economics over the past 20 years.
But these groups alone cannot bring about the kinds of change the profession needs to correct the large
disparities in undergraduate economic education and to achieve diversity and inclusion more broadly. In
fact, the very existence of CSMGEP and CSWEP may create the impression within the profession that
women and URM economists have the responsibility and power to fix the problems they identify.
Therefore, our foremost request of AEA leadership is that it communicate through statements and
initiatives that the underrepresentation of women and minority economists is a problem that belongs to
every member of the association, both in terms of causes and consequences. The AEA can complement
existing pipeline initiatives with interventions that provide guidance and training to all its members. The
association can coordinate and fund workshops, pilot programs, and research projects and can lead
economists and university departments to take concrete steps such as those outlined above. More
generally, the association can borrow proven strategies from other professions, such as business and some
of the STEM fields, which have successfully improved representation.
H. Steps for students to consider
As the rest of us learn more about how to improve the culture and curriculum of economics, we ask
students to be persistent. Try not to let the current environment, which often imposes an additional tax on
women and URM students, limit your future; neither the choices made by other students nor the guidance
offered by faculty are necessarily right for you. Know you can develop ability in economics just like you
learned to read, write, or walk, through practice, mistakes, and perseverance. Know also that economics is
a more powerful and relevant subject of study than many assume. Keep seeking knowledge and people to
help you succeed. The marginal social benefit to your majoring in economics is large.
V. CONCLUSION
Economic education is distributed extremely unequally, which harms students, the discipline, and the
economy. We call on all involved parties to adopt a new mindset in which full academic inclusion is the
benchmark they use to evaluate current conditions and to take action to achieve that standard.
39 http://asheweb.net/ 40 https://www.aeaweb.org/about-aea/committees/aeasp/finances-scholorship

27
REFERENCES
Allgood, Sam, and Amanda Bayer. 2017. "Learning Outcomes for Economists." American Economic
Review, 107(5): 660-64.
Arcidiacono, Peter. 2004. “Ability Sorting and the Returns to College Major.” Journal of Econometrics,
121(1): 343-375.
Bansak, Cynthia A., and Martha Starr. 2010. “Gender Differences in Predispositions Towards
Economics.” Eastern Economic Journal, 36: 33-57.
Bartlett, Robin. 2012. “Integrating Race, Gender and Class,” Chapter 20 in International Handbook on
Teaching and Learning Economics, Hoyt and McGoldrick, eds., Edward Elgar.
Bayer, Amanda, ed. 2011. Diversifying Economic Quality: A Wiki for Instructors and Departments. The
AEA Committee on the Status of Minority Groups in the Economics Profession. http://www.diversify-
ingecon.org (accessed June 1, 2017).
Bayer, Amanda, and Cecilia Elena Rouse. 2016. "Diversity in the Economics Profession: A New
Attack on an Old Problem." Journal of Economic Perspectives, 30(4): 221-42.
Becker, Charles M., Cecilia Elena Rouse, and Mingyu Chen. 2016. “Can a Summer Make a Differ-
ence? The Impact of the American Economic Association Summer Program on Minority Student
Outcomes.” Economics of Education Review, 53: 46–71.
Black, D. A., Sanders, S. and Taylor, L. 2003. “The Economic Reward for Studying Economics.”
Economic Inquiry, 41: 365–377.
Carrell, Scott E., Marianne E. Page, and James E. West. 2010. “Sex and Science: How Professor
Gender Perpetuates the Gender Gap.” Quarterly Journal of Economics, August, pp. 1101-44.
Fairlie, Robert W., Florian Hoffmann, and Philip Oreopoulos. 2014. “A Community College
Instructor Like Me: Race and Ethnicity Interactions in the Classroom.” American Economic Review,
104(8): 2567–91.
Feiner, Susan F. 1993. “Introductory Economics Textbooks and the Treatment of Issues Relating to
Women and Minorities, 1984 and 1991.” Journal of Economic Education, Vol. 24, No. 2 (Spring), pp.
145-162.
Lount, Robert B. Jr., Oliver J. Sheldon, Floor Rink, and Katherine W. Phillips. 2015. “Biased
Perceptions of Racially Diverse Teams and Their Consequences for Resource Support.” Organization
Science http://pubsonline.informs.org/doi/full/10.1287/orsc.2015.0994, accessed June 11, 2017.
May, Ann Mari, Mary G. McGarvey, and Robert Whaples. 2014. “Are Disagreements Among Male
and Female Economists Marginal at Best?: A Survey of AEA Members and Their Views on Economics
and Economic Policy.” Contemporary Economic Policy, 32(1): 111–32.
Milkman, Katherine L., Modupe Akinola, and Dolly Chugh. 2015. “What Happens Before? A Field
Experiment Exploring How Pay and Representation Differentially Shape Bias on the Pathway into
Organizations.” Journal of Applied Psychology, 100(6): 1678–1712.

28
Oreopoulos, Philip, and Kjell G. Salvanes. 2011. "Priceless: The Nonpecuniary Benefits of Schooling."
Journal of Economic Perspectives, 25(1): 159-84.
Robson, Denise. 2001. “Women and Minorities in Economics Textbooks: Are They Being Adequately
Represented?” Journal of Economic Education, Vol. 32, No. 2 (Spring), pp. 186-191.
Rock, David, and Heidi Grant. 2016. “Why Diverse Teams Are Smarter.” Harvard Business Review
https://hbr.org/2016/11/why-diverse-teams-are-smarter, accessed June 11, 2017.
Rock, David, Heidi Grant, and Jacqui Grey. 2016. “Diverse Teams Feel Less Comfortable—and
That’s Why They Perform Better.” Harvard Business Review, https://hbr.org/2016/09/diverse-teams-feel-
less-comfortable-and-thats-why-they-perform-better, accessed June 11, 2017.
US Department of Education, Institute of Education Sciences, National Center for Education
Statistics. No date. Integrated Postsecondary Education Data System (IPEDS). http://nces.ed.gov/ipeds/.
Wilcox, David. 2017. “Diversity and Inclusion at the Federal Reserve Board: A Program for Change.”
CSWEP News, p. 5, https://www.aeaweb.org/content/file?id=5524, accessed October 12, 2017.

29
APPENDIX A. Table Notes
i. The tables report authors’ calculations from the Integrated Postsecondary Education Data System
(IPEDS) at the National Center for Education Statistics, using data on bachelor’s degrees from
four-year, public or private not-for-profit, Title-IV participating colleges and universities that
awarded at least 25 majors in economics to US citizens or permanent residents (i.e., excluding
non-resident aliens) in the five-year period from 2011 through 2015. The resulting dataset
includes 566 institutions and accounts for over 98 percent of all economics degrees granted to US
citizens or permanent residents. Economics degrees are defined as first or second majors with
IPEDS Classification of Instructional Program codes for “Economics, General,” “Agricultural
Economics,” “Applied Economics,” “Econometrics and Quantitative Economics,” “Development
Economics and International Development,” “International Economics” and “Economics, Other.”
Student counts sum across first majors only to avoid double counting.
ii. The tables use IPEDS historical race and ethnicity, and citizenship, classifications. “White”
indicates non-Hispanic white individuals. URM denotes underrepresented minority groups—
Hispanic or Latino, (non-Hispanic) American Indian or Alaska Native, and (non-Hispanic) Black
or African American. Individuals whose ethnicity is unknown and non-Hispanic individuals
whose race is unknown or with more than one racial designation are reported in a separate catch-
all group and are not included in these counts. Tables 1 and 2 report information on temporary
residents, defined as individuals who are not citizens or nationals of the United States and who
are in the country on a visa or temporary basis only. Temporary residents are not included in any
of the racial/ethnic categories.
iii. The top-40 economics PhD programs as ranked by U.S.News in 2017—but closely aligned with
other rankings including NRC (1995) and McPherson (2012)—account for 58.9 percent of PhDs
in economics produced since 2000. The 41 institutions are: Boston College, Boston University,
Brown University, California Institute of Technology, Carnegie Mellon University, Columbia
University, Cornell University, Duke University, Harvard University, Johns Hopkins University,
Massachusetts Institute of Technology, Michigan State University, New York University,
Northwestern University, Ohio State University, Pennsylvania State University, Princeton
University, Stanford University, University of California—Berkeley, University of California—
Davis, University of California—Los Angeles, University of California—San Diego, University
of Chicago, University of Illinois—Urbana-Champaign, University of Maryland, University of
Michigan, University of Minnesota, University of North Carolina, University of Pennsylvania,
University of Pittsburgh, University of Rochester, University of Texas, University of Virginia,
University of Washington, University of Wisconsin—Madison, Vanderbilt University,
Washington University in St. Louis, and Yale University.
iv. The other economics PhD programs account for 36.8 percent of PhDs in economics produced
since 2000. The 82 institutions, each averaging at least one graduate per year, are: American
University, Arizona State University, Auburn University, Brandeis University, Clark University,
Clemson University, Colorado School of Mines, Colorado State University, CUNY Graduate
Center, Drexel University, Emory University, Florida International University, Florida State
University, Fordham University, George Mason University, George Washington University,
Georgetown University, Georgia State University, Howard University, Iowa State University,
Kansas State University, Middle Tennessee State University, Mississippi State University,
Northeastern University, Northern Illinois University, Oklahoma State University, Oregon State
University, Purdue University, Rice University, Rutgers University, Southern Illinois University,
Southern Methodist University, Stony Brook University, Suffolk University, SUNY at Albany,
SUNY at Binghamton, Syracuse University, Temple University, Texas Tech University, The

30
New School, The University of Tennessee, The University of Texas at Dallas, Tulane University,
University at Buffalo, University of Arizona, University of California-Irvine, University of
California-Riverside, University of California-Santa Cruz, University of Colorado Boulder,
University of Connecticut, University of Delaware, University of Florida, University of Georgia,
University of Hawaii at Manoa, University of Houston, University of Illinois at Chicago,
University of Iowa, University of Kansas, University of Kentucky, University of Massachusetts-
Amherst, University of Memphis, University of Miami, University of Mississippi, University of
Missouri-Columbia, University of Missouri-Kansas City, University of Nebraska, University of
New Hampshire, University of New Mexico, University of Notre Dame, University of
Oklahoma-Norman, University of Oregon, University of Rhode Island, University of South
Carolina, University of South Florida, University of Utah, University of Wisconsin-Milwaukee,
Utah State University, Virginia Polytechnic Institute and State University, Washington State
University, Wayne State University, West Virginia University, and Western Michigan University.
v. The top liberal arts group includes institutions ranked in U.S. News & World Report’s National
Liberal Arts Colleges in 2017, excluding military academies, plus five other highly selective
institutions classified as top national or regional universities in the rankings but which have few
graduate programs (noted in italics below). The top-50 group of coeducational institutions is:
Amherst College, Bates College, Bowdoin College, Bucknell University, Carleton College,
Centre College, Claremont McKenna College, Colby College, Colgate University, College of the
Holy Cross, College of William and Mary, Colorado College, Connecticut College, Dartmouth
College, Davidson College, Denison University, DePauw University, Dickinson College,
Franklin and Marshall College, Furman University, Gettysburg College, Grinnell College,
Hamilton College, Haverford College, Kenyon College, Lafayette College, Macalester College,
Miami University-Oxford, Middlebury College, Oberlin College, Occidental College, Pitzer
College, Pomona College, Reed College, Rhodes College, Sewanee-The University of the South,
Skidmore College, St. Lawrence University, St. Olaf College, Swarthmore College, Trinity
College, Trinity University, Tufts University, Union College, University of Richmond, Vassar
College, Washington and Lee University, Wesleyan University, Whitman College, and Williams
College. Six highly ranked women’s colleges, included in analyses where noted, are: Barnard
College, Bryn Mawr College, Mount Holyoke College, Scripps College, Smith College, and
Wellesley College.

31
APPENDIX B. Institution-Level Tables
Appendix Table 1 reports data on all institutions in our data set. Appendix Tables 2-4 present data on
women’s colleges, men’s colleges, and HBCUs, respectively. Appendix Tables 5 and 6 retabulate data on
universities with top PhD programs and top liberal arts colleges (LACs). While the institution-level data
may be subject to random variation when the number of students in a given group is small, we choose to
report index values and rates for all institutions in the data set to facilitate examination of economics
departments of all sizes.
Appendix Table 1. Rating the inclusiveness of economics departments, Economic Education Inclusion
Index values and percentiles, 2011-2015
Institution Name
Economic
Education
Inclusion Index
(EEII)41
Rates at which students major in
economics (percent)
White African
American Hispanic
Value Percen
tile M F M F M F
Adelphi University 27.3 15 1.4 0.2 1.6 0.2 0 0.0
Agnes Scott College . . . 5 . 9.3 . 6.7
Albion College 66.3 75 16.4 5.6 20.7 7.7 10.5 10
Alcorn State University . . 0 0 3.7 1.1 0 0
Allegheny College 62.4 70 17.4 4.8 34.4 3.3 8.3 3.6
American University 77.3 85 6.6 3.3 7.4 1.9 9.3 3.6
Amherst College 35.6 25 21.9 7.5 15.7 1.4 11.3 3.2
Appalachian State University 43.1 35 2.2 0.4 1.8 0 2.2 0.3
Arizona State University-Tempe 48.5 44 3 0.7 3.2 0.6 2.3 0.4
Arkansas State University-Main Campus 29.8 17 0.5 0.2 0.3 0.3 0 0
Armstrong State University 43 35 6.2 1.2 3.6 0.4 6.5 1.7
Assumption College 23 9 8 1.2 0 0 6.7 1.4
Auburn University 34.7 23 2.6 0.7 1.1 0.6 1.8 0.4
Augsburg College 72.3 80 5.4 0.7 8.9 1.5 5.6 2.9
Augustana College 45.3 38 3.3 0.4 0 0 4.4 2.5
Augustana University 4.6 2 3.5 0.8 0 0 0 0
Austin College 64.1 71 7.9 1.8 7.1 5.3 8.3 2.6
Ave Maria University 72.2 80 9.9 4.3 7.7 0 13.6 10.2
Baldwin Wallace University 47.1 41 2.2 0.6 2.6 0 2 0
Barnard College . . . 6.7 . 8.6 . 6.1
Bates College 32.2 20 17.6 4 9.8 1.6 8.7 4.3
Bellarmine University 8.3 4 5.2 2.2 0 0 0 0
Beloit College 69.3 78 8.6 2 25 0 0 2.7
Benedict College . . 0 0 1.9 2.1 0 0
Benedictine College 6.2 3 3.3 1 0 0 0 0
Bethel University 0.9 1 4.1 0.2 0 0 0 0
Birmingham Southern College 30.7 18 6.2 1.1 6.5 1.9 0 0
41 Higher value and higher percentile indicate more inclusion. Inclusion Index=100*average(wfrate, bmrate, bfrate,
hmrate, hfrate)/wmrate

32
Institution Name
Economic
Education
Inclusion Index
(EEII)41
Rates at which students major in
economics (percent)
White African
American Hispanic
Value Percen
tile M F M F M F
Bloomsburg University of Pennsylvania 69.3 77 2.7 0.6 4.6 0.4 2.4 1.3
Boise State University 40.1 31 0.8 0.2 0.8 0 0.6 0
Boston College 50.3 48 18.4 7.1 11.8 5.1 16.2 6
Boston University 58 63 4.7 1.6 2.4 1.5 5.8 2.3
Bowdoin College 24.8 12 22.8 5.7 2.7 1.5 14.2 4.3
Bowling Green State University-Main Campus 67.5 75 1.4 0.3 2.5 0.6 1 0.4
Brandeis University 39.7 30 17.2 4.6 5.6 5.3 14.3 4.4
Bridgewater State University 52.4 53 2.5 0.6 2.4 1.7 1.4 0.5
Brigham Young University-Idaho 89.8 92 1 0.1 0 2.7 1.3 0.3
Brigham Young University-Provo 56.9 61 4.5 0.6 7.6 0 3.6 1
Brown University 55.2 58 17.3 8.2 13.3 7.4 12.1 6.7
Bryant University 77.9 86 1.7 0.5 1.3 0 2.4 2.2
Bryn Mawr College . . . 1.8 . 3.7 . 0
Bucknell University 65.9 74 17.6 8.9 23.3 6.2 16.2 3.3
Butler University 89 91 3.7 0.5 8.7 1.3 6.2 0
CUNY Bernard M Baruch College 90.4 92 2.9 1 3 2.8 4.8 1.6
CUNY Brooklyn College 70.3 79 1.1 0.4 1.2 0.2 1.5 0.6
CUNY City College 66.2 74 5.4 1.7 7.9 1.9 5.2 1.2
CUNY Hunter College 44.9 37 7.4 1.9 5.3 1.6 5.8 1.9
CUNY John Jay College of Criminal Justice 112.8 97 2.5 2.4 4.2 2.3 2.9 2.2
CUNY Lehman College 47.4 42 5.1 0.8 3.6 1.9 4.5 1.4
CUNY Queens College 61.1 69 13.8 4 14.8 5 12.7 5.6
CUNY York College 50.9 49 2.6 0.8 1.3 0.7 3.3 0.6
California Polytechnic State University-San Luis Obispo 63.4 71 2.4 0.7 1.2 3.2 1.8 0.6
California State Polytechnic University-Pomona 64.3 71 0.8 0.2 0.7 0.3 0.8 0.3
California State University-Bakersfield 35.4 24 1.6 0.5 0 0.8 1.4 0.3
California State University-Channel Islands 48.4 44 3.1 0.6 2.8 0 3.4 0.8
California State University-Chico 33.4 22 2 0.3 0.8 0 1.5 0.7
California State University-East Bay 76.2 84 1.6 0.6 2.3 0.8 1.8 0.5
California State University-Fresno 36.6 26 1.5 0.2 1.2 0 1.1 0.2
California State University-Fullerton 43.8 36 1.5 0.3 1.2 0.4 1.2 0.2
California State University-Long Beach 56 59 1.6 0.4 0.9 0.7 2.1 0.5
California State University-Los Angeles 23.9 10 2.1 0.3 1 0.2 0.8 0.1
California State University-Northridge 41.8 33 2 0.4 1.7 0.2 1.6 0.3
California State University-Sacramento 55.2 58 3.9 0.7 5.1 0.7 3.4 0.9
California State University-San Bernardino 74.2 83 1.6 0.6 2.7 0.6 1.7 0.3
California State University-San Marcos 40.5 31 3.8 0.5 3.7 0 3 0.5
California State University-Stanislaus 39 28 2 0.7 1.4 0 1.5 0.3
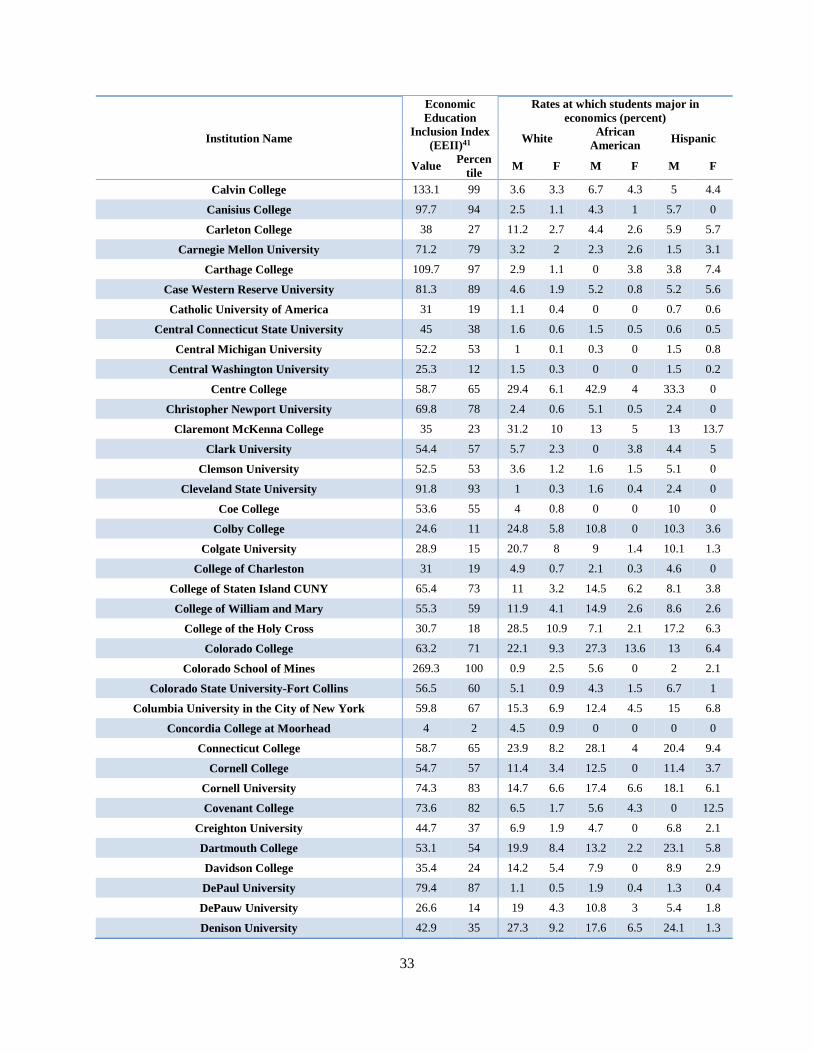
33
Institution Name
Economic
Education
Inclusion Index
(EEII)41
Rates at which students major in
economics (percent)
White African
American Hispanic
Value Percen
tile M F M F M F
Calvin College 133.1 99 3.6 3.3 6.7 4.3 5 4.4
Canisius College 97.7 94 2.5 1.1 4.3 1 5.7 0
Carleton College 38 27 11.2 2.7 4.4 2.6 5.9 5.7
Carnegie Mellon University 71.2 79 3.2 2 2.3 2.6 1.5 3.1
Carthage College 109.7 97 2.9 1.1 0 3.8 3.8 7.4
Case Western Reserve University 81.3 89 4.6 1.9 5.2 0.8 5.2 5.6
Catholic University of America 31 19 1.1 0.4 0 0 0.7 0.6
Central Connecticut State University 45 38 1.6 0.6 1.5 0.5 0.6 0.5
Central Michigan University 52.2 53 1 0.1 0.3 0 1.5 0.8
Central Washington University 25.3 12 1.5 0.3 0 0 1.5 0.2
Centre College 58.7 65 29.4 6.1 42.9 4 33.3 0
Christopher Newport University 69.8 78 2.4 0.6 5.1 0.5 2.4 0
Claremont McKenna College 35 23 31.2 10 13 5 13 13.7
Clark University 54.4 57 5.7 2.3 0 3.8 4.4 5
Clemson University 52.5 53 3.6 1.2 1.6 1.5 5.1 0
Cleveland State University 91.8 93 1 0.3 1.6 0.4 2.4 0
Coe College 53.6 55 4 0.8 0 0 10 0
Colby College 24.6 11 24.8 5.8 10.8 0 10.3 3.6
Colgate University 28.9 15 20.7 8 9 1.4 10.1 1.3
College of Charleston 31 19 4.9 0.7 2.1 0.3 4.6 0
College of Staten Island CUNY 65.4 73 11 3.2 14.5 6.2 8.1 3.8
College of William and Mary 55.3 59 11.9 4.1 14.9 2.6 8.6 2.6
College of the Holy Cross 30.7 18 28.5 10.9 7.1 2.1 17.2 6.3
Colorado College 63.2 71 22.1 9.3 27.3 13.6 13 6.4
Colorado School of Mines 269.3 100 0.9 2.5 5.6 0 2 2.1
Colorado State University-Fort Collins 56.5 60 5.1 0.9 4.3 1.5 6.7 1
Columbia University in the City of New York 59.8 67 15.3 6.9 12.4 4.5 15 6.8
Concordia College at Moorhead 4 2 4.5 0.9 0 0 0 0
Connecticut College 58.7 65 23.9 8.2 28.1 4 20.4 9.4
Cornell College 54.7 57 11.4 3.4 12.5 0 11.4 3.7
Cornell University 74.3 83 14.7 6.6 17.4 6.6 18.1 6.1
Covenant College 73.6 82 6.5 1.7 5.6 4.3 0 12.5
Creighton University 44.7 37 6.9 1.9 4.7 0 6.8 2.1
Dartmouth College 53.1 54 19.9 8.4 13.2 2.2 23.1 5.8
Davidson College 35.4 24 14.2 5.4 7.9 0 8.9 2.9
DePaul University 79.4 87 1.1 0.5 1.9 0.4 1.3 0.4
DePauw University 26.6 14 19 4.3 10.8 3 5.4 1.8
Denison University 42.9 35 27.3 9.2 17.6 6.5 24.1 1.3

34
Institution Name
Economic
Education
Inclusion Index
(EEII)41
Rates at which students major in
economics (percent)
White African
American Hispanic
Value Percen
tile M F M F M F
Dickinson College 48 43 11.6 3.3 15.7 4.1 4.8 0
Drake University 19.2 7 2.5 0.8 1.6 0 0 0
Drew University 60.1 68 15.7 3.3 20 5.4 12.2 6.3
Drexel University 29.5 16 1.4 0.3 0.6 0.3 0.6 0.3
Duke University 40 30 14.5 4.4 5.6 1.4 11.8 5.8
East Carolina University 50.3 48 4.2 0.7 5.1 1.1 2.3 1.2
East Stroudsburg University of Pennsylvania 73.3 81 2.4 0.3 3.4 1.1 3.8 0.4
East Tennessee State University 42.8 35 0.4 0.2 0.6 0 0 0
Eastern Connecticut State University 46.1 39 3.4 0.8 4.7 1.6 0.7 0
Eastern Illinois University 38.5 28 1.1 0.1 0.9 0.4 0.6 0
Eastern Kentucky University 70.2 79 0.6 0.2 0 0 0 2
Eastern Michigan University 65 73 0.8 0.2 0.8 0.1 1.1 0.4
Eastern Washington University 102.6 95 1.3 0.5 3.9 0.7 0.8 0.9
Eckerd College 50.2 48 3 1 1.7 0 4.9 0
Elmhurst College 23.6 10 3.7 1 2.1 1.3 0 0
Elmira College 10.9 5 3.4 1.8 0 0 0 0
Elon University 24.2 11 3.8 1.4 1.2 0 1.3 0.8
Emory & Henry College 20.9 8 6.4 1.3 5.4 0 0 0
Emory University 49.2 46 14.3 4.6 8.9 5.1 12.8 3.7
Fairfield University 48.1 43 7.1 1.3 5.5 1.2 7.5 1.7
Farmingdale State College 87.5 91 0.7 0.4 0.7 0.9 0.7 0.4
Fitchburg State University 76.6 85 1.3 0.1 1.3 2.2 1.3 0
Flagler College-St Augustine 101.8 95 2.6 0.5 5.6 0 6.5 0.8
Florida Agricultural and Mechanical University 95.5 94 1 0 1.9 0.5 2.6 0
Florida Atlantic University 50.2 48 2.9 0.4 2.5 0.6 2.7 1.1
Florida Gulf Coast University 39.1 29 1.3 0.3 1.6 0 0.5 0.2
Florida International University 76.2 84 1.6 0.5 2.1 0.7 2.3 0.5
Florida Southern College 32.4 21 2.8 0.3 1.9 0 0 2.4
Florida State University 49.4 46 5.4 1.1 3.6 1.1 6.2 1.3
Fordham University 73.4 81 7.6 2.8 4.9 4.6 10.5 5.2
Fort Lewis College 25.2 12 2.9 1.1 0 0 1.9 0.7
Fort Valley State University . . 0 0 2.1 1.7 0 0
Framingham State University 113.1 98 2 0.9 4.7 0 4.7 1.3
Francis Marion University 82.3 89 2.7 0.3 1.6 0 9.1 0
Franklin College 7.1 3 4.1 1.5 0 0 0 0
Franklin University 89.8 92 0.6 0.1 1 0.2 1.6 0
Franklin and Marshall College 58.5 64 8.7 1.6 13.3 2.3 6 2.3
Frostburg State University 10.9 5 1.8 0.5 0.2 0.2 0 0

35
Institution Name
Economic
Education
Inclusion Index
(EEII)41
Rates at which students major in
economics (percent)
White African
American Hispanic
Value Percen
tile M F M F M F
Furman University 76.9 85 6.3 2.6 8.2 1.1 10.3 2
George Mason University 44.2 36 5.6 1.5 3.8 1.2 4.5 1.5
George Washington University 49.5 46 8.7 3.1 4.1 3.8 7.7 2.9
Georgetown University 48.9 45 10.9 4.5 4.1 2.8 10.9 4.3
Georgia Southern University 73.8 82 0.4 0 0.6 0.3 0.4 0
Georgia State University 76.8 85 3.5 1.3 3.9 1.2 5.4 1.8
Gettysburg College 25.4 13 13.3 2.5 4.3 0 10 0
Gonzaga University 55.3 59 3.9 1.3 5.4 0 1.8 2.3
Gordon College 70.4 79 3.2 0.8 7.1 0 3.4 0
Goucher College 26 14 4.8 1.6 0 4.6 0 0
Grand Valley State University 38.9 28 0.6 0.2 0.3 0 0.7 0
Grinnell College 51.1 50 13.4 2.2 14 4 10.5 3.6
Guilford College 58.5 64 3.9 0.5 3.9 0.5 6.4 0
Gustavus Adolphus College 8.2 4 7.8 1.1 2.1 0 0 0
Hamilton College 22.2 9 24.2 5.3 7.3 0 12.9 1.2
Hamline University 31.6 19 6.4 1.7 3.8 0 4.5 0
Hampden-Sydney College . . 20.5 . 22.4 . 9.5 .
Hanover College 17.5 6 8.6 1.3 6.2 0 0 0
Hardin-Simmons University 30.5 18 6.3 1.3 0 0 8.3 0
Hartwick College 61.9 69 4.4 0.3 10 0 3.2 0
Harvard University 52.9 54 15.1 4.8 12.7 4.4 12.9 5.1
Hastings College 47 41 3.8 1.1 0 0 7.7 0
Haverford College 28.3 15 16.2 3.6 2.5 1.6 13.7 1.5
Hendrix College 69.2 77 10.4 2.9 13.3 7.1 12.5 0
Hobart William Smith Colleges 33.8 22 16.3 6 3.8 2.3 12.8 2.6
Hofstra University 35.3 24 1.7 0.3 2.2 0 0 0.5
Hope College 6.3 3 1.8 0.6 0 0 0 0
Howard University . . 0 0 3.4 1.1 0 0
Humboldt State University 46.3 39 1.3 0.8 0 0 1.9 0.3
Idaho State University 48.4 44 1.2 0.3 0 0 2.7 0
Illinois College 123.5 98 4.1 2.1 10 0 0 13.3
Illinois State University 59.3 66 2 0.2 2.4 0.5 2.5 0.3
Illinois Wesleyan University 35.3 24 5.8 1.8 4.3 4.1 0 0
Indiana University of Pennsylvania-Main Campus 50.7 49 2 0.7 1.1 1.3 1.2 0.7
Indiana University-Bloomington 29.6 16 3.5 0.5 0.8 0.4 3.2 0.3
Indiana University-Purdue University-Indianapolis 55.1 58 1.3 0.1 2.1 0.1 0.8 0.2
Indiana Wesleyan University-Marion 1.7 1 0.6 0.1 0 0 0 0
Iona College 68.7 76 1.3 0.7 1.2 1.2 1.1 0

36
Institution Name
Economic
Education
Inclusion Index
(EEII)41
Rates at which students major in
economics (percent)
White African
American Hispanic
Value Percen
tile M F M F M F
Iowa State University 62.3 70 0.8 0.3 1.1 0.4 0.8 0
Ithaca College 90.5 92 1.4 0.3 2.8 2.2 0.7 0.5
Jacksonville State University 19.2 7 1.7 0.3 1.2 0.1 0 0
Jacksonville University 20.1 8 2.5 0.7 0.5 0.2 1.2 0
James Madison University 55 58 1.7 0.3 1.1 0.2 2.9 0
John Carroll University 56.3 60 2.5 0.9 0 1.2 3.5 1.5
Johns Hopkins University 19.4 7 12.1 2.6 2.5 0.7 4.1 1.7
Kalamazoo College 35.9 25 14.1 3.7 3.6 3 13.2 1.9
Kansas State University 19 7 3.4 1 0.8 0 0.9 0.6
Kean University 143.7 99 0.6 0.2 2.1 0.3 1.3 0.3
Keene State College 29.9 17 3.3 0.3 0 0 4.7 0
Kenyon College 49.6 46 16.5 4.1 23.3 2.9 8.8 1.7
Knox College 58.2 63 10.6 4.6 6.9 2.1 7.5 9.7
LIU Post 124.6 98 0.8 0.2 2.3 0 2.6 0
La Salle University 24.1 11 1.9 0.7 0 0.4 1.2 0
Lafayette College 78.7 87 22.8 15 27.4 7.3 27.4 12.8
Lake Forest College 68.2 76 10.5 7 11.8 0 14.3 2.6
Lawrence University 29.1 16 8.2 1.6 4.8 0 5.6 0
Le Moyne College 5.3 3 2.3 0.6 0 0 0 0
Lebanon Valley College 8.8 4 4.5 2 0 0 0 0
Lewis & Clark College 77.5 86 5.7 2.3 8 4 6.8 1.1
Linfield College-McMinnville Campus 47.7 42 8.1 3.4 7.1 0 5.7 3.1
Longwood University 69.3 77 2.8 0.4 0 0.6 8.7 0
Louisiana State University and Agricultural &
Mechanical College 52.5 53 0.5 0.1 0.7 0 0.3 0.2
Loyola Marymount University 75.2 83 3.8 1.7 5.4 0.4 5.6 1.3
Loyola University Maryland 59.5 66 2.6 0.4 2 0.8 4.5 0
Luther College 55.1 58 3.3 0.8 0 8.3 0 0
Lycoming College 79 87 5.9 2 4.8 5.3 11.1 0
Lynchburg College 47 40 4.4 1.4 4.3 1.6 0 3
Macalester College 49.9 47 11.4 3.8 13.6 0 10 1.1
Manhattan College 52.1 52 1.7 0.9 0 0 2.8 0.8
Marist College 24.4 11 1.8 0.3 0 0.9 0.6 0.4
Marquette University 30.7 18 2.3 0.4 0.9 0.5 0.8 0.9
Massachusetts Institute of Technology 80.7 88 3.1 2.2 4.6 1.6 2.6 1.6
McDaniel College 1 1 5 0.3 0 0 0 0
McKendree University 27.2 14 4.1 1.6 3.4 0.7 0 0
Mercer University 25.1 12 3.2 0.9 1 0.2 1.9 0
Meredith College . . . 1.2 . 1.1 . 1.9

37
Institution Name
Economic
Education
Inclusion Index
(EEII)41
Rates at which students major in
economics (percent)
White African
American Hispanic
Value Percen
tile M F M F M F
Merrimack College 38.4 27 3.3 0.9 2.5 0 1.6 1.3
Metropolitan State University 47.8 42 1 0.2 1.4 0.2 0.6 0
Metropolitan State University of Denver 28.9 15 1.1 0.2 0 0.5 0.6 0.2
Miami University-Oxford 42.3 34 2.3 0.3 0.3 0.2 4 0
Michigan State University 57.8 62 3.4 0.5 3.8 0.9 4.4 0.3
Michigan Technological University 20.4 8 0.6 0.6 0 0 0 0
Middle Tennessee State University 35.6 25 0.8 0.2 0.6 0.1 0.4 0.3
Middlebury College 41.4 32 22.2 7.3 11.8 3 16.5 7.3
Millersville University of Pennsylvania 99.4 94 2.1 0.5 4 0 5.4 0.5
Mills College . . . 5.1 . 6.7 . 4.6
Millsaps College 42 33 4.7 1.7 8.1 0 0 0
Minnesota State University Moorhead 58.7 65 1.4 0.2 1.4 2.3 0 0
Minnesota State University-Mankato 39.9 30 2.5 0.3 2.2 0.7 1.7 0
Mississippi State University 62.6 70 0.5 0.1 0.4 0.1 0.9 0
Missouri State University-Springfield 46.9 40 1.1 0.3 0.6 0 0 1.7
Missouri University of Science and Technology 122.1 98 1.2 0.7 1.3 3.1 2.3 0
Missouri Western State University 25.3 13 3 0.7 2.1 1 0 0
Monmouth College 30.2 17 4.6 2.6 0 1.9 0 2.5
Montana State University 62.2 69 1.1 0.8 0 0 1 1.7
Montclair State University 70.2 78 0.7 0.2 0.9 0.5 0.6 0.4
Moravian College 30.6 18 5.6 1.3 0 0 5 2.2
Morehouse College . . 16.7 . 5.7 . 0 .
Mount Holyoke College . . . 2.8 . 2.2 . 1.4
Mount St Mary's University 54.6 57 4.5 0.7 3.6 0 5.9 2.1
Muhlenberg College 53.8 56 6.3 1.4 6.1 2.1 5.7 1.6
Murray State University 48.1 44 0.7 0.2 0 0 0 1.6
Nazareth College 59.4 66 3.3 0.9 0 0 9.1 0
Nebraska Wesleyan University 70.7 79 3.4 0.1 0 0 11.8 0
New Jersey City University 211.2 100 0.5 0.5 1.9 0.5 1.9 0.5
New Mexico State University-Main Campus 65.2 73 1.2 0.4 0.6 1.8 0.8 0.4
New York University 60.5 68 7.6 3.4 5.8 2 7.7 4.2
North Carolina A & T State University 41.2 32 4.5 0 2.5 1.2 1.8 3.9
North Central College 42.1 34 7.7 1.8 2.1 4.8 5.7 1.8
North Dakota State University-Main Campus 17.4 6 4.3 0.9 2.8 0 0 0
Northeastern Illinois University 51.8 52 4.9 1.6 4.7 1.2 4.1 1.2
Northeastern University 75.3 84 3 1.5 3.5 2.1 2.8 1.3
Northern Arizona University 24.3 11 0.2 0 0 0 0.2 0
Northern Illinois University 60.6 68 2.9 0.5 3.3 1.1 3.1 0.8

38
Institution Name
Economic
Education
Inclusion Index
(EEII)41
Rates at which students major in
economics (percent)
White African
American Hispanic
Value Percen
tile M F M F M F
Northern Michigan University 24.7 12 2.3 0.5 0 0 2.4 0
Northwestern University 39 29 19.1 7 8.7 1.7 16.4 3.4
Oakland University 110.9 97 0.7 0.2 1.4 0.2 1.2 0.6
Oberlin College 32.3 20 8.4 1.7 2.7 1.9 5.6 1.6
Occidental College 49.1 46 22.5 7.4 19.5 10.2 14.4 3.7
Oglethorpe University 38.7 28 7.1 1.7 9.3 2.7 0 0
Ohio State University-Main Campus 67.8 76 4.5 1.2 7.1 1.5 4.7 0.7
Ohio University-Main Campus 41.3 32 1 0.1 0.3 0.2 1.5 0
Ohio Wesleyan University 42 33 5.3 1.5 6.5 0 0 3.2
Oklahoma State University-Main Campus 43.5 36 1.9 0.9 1.9 0 0.3 1.1
Olivet Nazarene University 7.7 4 4.4 0.5 1.2 0 0 0
Oregon State University 92.8 93 1.9 0.7 2.7 0 3.5 1.9
Otterbein University 54.3 57 2 0.4 0 0 5 0
Pace University-New York 70.5 79 1.3 0.7 1.3 0.2 1 1.4
Pacific Lutheran University 56.1 60 4.5 1.3 3.4 2.1 5.1 0.8
Pennsylvania State University-Main Campus 75.1 83 3.2 1 4.5 1.1 4 1.6
Pepperdine University 39.1 29 10.5 1.9 8.1 3.1 6.5 0.9
Pitzer College 35.1 23 11.2 2 0 6.1 7.5 4
Point Loma Nazarene University 84 90 1.1 0.6 0 0 3 0.8
Pomona College 51.5 51 16.9 7.2 18.6 2.4 13.9 1.4
Portland State University 78.2 86 2.2 0.7 3.2 1.3 2.8 0.8
Princeton University 60.5 68 12.4 5.3 6.5 2.7 16.7 6.2
Providence College 53.6 55 5.2 1.7 6.4 2.5 1.4 1.8
Purdue University-Calumet Campus 85.2 90 1.3 0.5 3 0.4 1.3 0.2
Purdue University-Main Campus 58.4 64 2.8 1.1 2.4 0.7 3.2 0.6
Quinnipiac University 25.9 14 3.4 0.6 1.1 0 2.3 0.4
Radford University 101.8 95 1.9 0.2 3.8 0 4.4 1.5
Ramapo College of New Jersey 68.8 77 0.8 0.2 0 0 2.2 0.2
Randolph-Macon College 50.2 47 18.9 5.9 17.4 3.9 15 5.3
Reed College 73.7 82 6.7 1.6 6.7 5.3 8 3.2
Regis University 6.2 3 1.8 0.1 0 0 0.4 0
Rhode Island College 90.2 92 1.2 0.2 3.4 0.5 1.5 0
Rhodes College 78.8 87 8.1 4.7 7.9 3.2 12 4
Rice University 64.7 72 11.8 5.4 13.3 4.3 8.6 6.6
Ripon College 7.9 4 6.7 2.6 0 0 0 0
Roanoke College 176.4 100 3.1 0.6 13.6 4 6.7 2.6
Robert Morris University 72 80 1.2 0.4 0 0.9 3 0
Rochester Institute of Technology 29.1 16 0.6 0.2 0.7 0 0 0

39
Institution Name
Economic
Education
Inclusion Index
(EEII)41
Rates at which students major in
economics (percent)
White African
American Hispanic
Value Percen
tile M F M F M F
Rockhurst University 51.9 52 7 1 0 2.7 11.9 2.4
Rollins College 52.5 53 19.3 4.3 22.4 4.9 15.8 3.1
Roosevelt University 23.8 10 1.7 0.4 0.5 0.3 0.5 0.2
Rowan University 49.9 47 1.5 0.3 1.6 0.2 1.5 0.2
Rutgers University-Camden 111.3 97 4 1 11.8 1.4 7.3 0.9
Rutgers University-New Brunswick 47.6 42 6.3 1.3 4.3 1.3 6.8 1.2
Rutgers University-Newark 76.5 85 3 0.8 4.1 2.2 3.3 1.2
SUNY Buffalo State 99.9 94 3.2 0.5 8.5 1.5 3.4 2
SUNY College at Cortland 60.7 68 4.2 1.2 5.6 2.1 2.3 1.5
SUNY College at Geneseo 36 26 4.3 0.9 2.8 0 4.2 0
SUNY College at Oswego 79.9 88 1.3 0.6 2.1 1.1 1.6 0
SUNY College at Plattsburgh 134.3 99 1.2 0.1 4.6 0 3.2 0
SUNY at Albany 61.4 69 8 1.6 9.6 2.7 8.2 2.4
SUNY at Binghamton 65.9 74 8.6 2.9 7.8 4 9.8 3.8
SUNY at Fredonia 22.9 9 1.7 0.6 1.3 0 0 0
SUNY at Purchase College 76.3 85 2.4 0.5 2.8 1.1 3.5 1.1
Sacred Heart University 52.7 54 4.6 0.8 4.6 3 3.1 0.5
Saint Ambrose University 19 7 2.2 0.4 0 0 1.7 0
Saint Cloud State University 108.7 96 1.2 0.3 3.4 0 2.1 0.8
Saint Edward's University 11.5 5 2.3 0.2 0 0 0.8 0.3
Saint John Fisher College 48.6 44 2.7 0.4 0 0.9 5.1 0
Saint Johns University (MN) . . 5.7 . 0 . 2.1 .
Saint Joseph's University 23.1 9 3.9 0.8 1 0.4 2.3 0
Saint Mary's College of California 25.9 13 5.8 1.6 3.3 0 2.6 0
Saint Michael's College 9.8 5 4.9 2.4 0 0 0 0
Saint Norbert College 29.2 16 6.2 0.7 0 0 8.3 0
Salem State University 52.8 54 1.6 0.3 1.1 1.2 1.4 0.2
Salisbury University 58.6 64 1.8 0.2 1.7 0.4 2.4 0.5
Salve Regina University 40 30 4.9 0.4 0 0 4.8 4.5
San Diego State University 54 56 5.1 1.1 3.9 1.8 5 1.8
San Francisco State University 35.9 25 1.4 0.2 0.9 0.5 0.7 0.2
San Jose State University 49 46 2.6 0.3 3.6 0.9 1.5 0.2
Santa Clara University 60.9 69 7.2 4.2 3.9 3.4 8.2 2.3
Scripps College . . 0 4.8 . 4.9 . 8.3
Seattle Pacific University 113 98 3.5 2.9 9.7 2.5 3.2 1.8
Seattle University 58.3 63 3 1.3 2.5 0.6 2.4 2
Seton Hall University 68.8 77 1.3 0.5 1 0.6 1.7 0.7
Sewanee-The University of the South 59.1 66 17 6.1 17.2 18.2 5.6 3.1

40
Institution Name
Economic
Education
Inclusion Index
(EEII)41
Rates at which students major in
economics (percent)
White African
American Hispanic
Value Percen
tile M F M F M F
Shepherd University 53.1 54 2.8 1 3.4 0 3 0
Shippensburg University of Pennsylvania 5.1 2 1.7 0.4 0 0 0 0
Siena College 73.4 81 5.7 2.5 9.3 0 9.1 0
Simmons College . . . 1.9 . 0.6 . 2.3
Simpson College 5.5 3 4.7 1.3 0 0 0 0
Skidmore College 48.7 45 8.2 2.1 7.5 4.9 5.4 0
Smith College . . . 4.3 . 10.3 . 4.9
Sonoma State University 37.1 27 4 0.7 2 0 3.4 1.3
South Dakota State University 91 93 6.2 2.6 15.6 4.5 5.6 0
Southeast Missouri State University 58 62 1.1 0.2 0.4 0 2.4 0
Southern Connecticut State University 41.3 32 1.1 0.2 0.6 0.5 0.9 0.2
Southern Illinois University-Carbondale 45.2 38 1.8 1.3 1.6 0.2 0.5 0.5
Southern Illinois University-Edwardsville 92.9 93 0.5 0.1 0.4 0.3 1.4 0
Southern Methodist University 54.3 57 15 2.7 14.1 3.3 16.6 4
Southern New Hampshire University 33.2 22 2.1 0.5 1.7 1.4 0 0
Southern Oregon University 43 35 2.6 0.2 2.5 0 2.2 0.6
Southern Utah University 16 6 2.3 0.4 0 0 1.4 0
Southwestern University 73 81 5.6 1.5 8.3 4 5.2 1.3
Spelman College . . . . . 8 . 0
St Catherine University . . 0 2.1 0 0 . 5.4
St Francis College 47.4 42 3.6 2.8 1.7 1.2 2.3 0.4
St John's University-New York 65.4 74 1.7 0.5 2.1 0.8 1.9 0.4
St Lawrence University 47 41 19.5 5.6 21.7 2.9 10.8 4.8
St Mary's College of Maryland 66.5 75 17.5 6.2 18.2 3.8 28.1 1.8
St Mary's University 79.6 87 2.3 0.4 6.7 0 1.3 0.8
St Olaf College 35.3 23 15.8 5.3 10.3 3.7 5.1 3.6
Stanford University 53.6 55 6.9 2.8 4.2 1.7 6.9 2.8
State University of New York at New Paltz 48 43 1.3 0.4 0.9 0.4 1.1 0.3
Stockton University 74.5 83 1 0.1 1.8 0.8 0.8 0.2
Stonehill College 31 18 5.2 1.6 2.1 0 4.3 0
Stony Brook University 56.8 61 5.5 1.3 5.5 2.3 5.5 1
Suffolk University 59.1 66 2.4 0.6 2.2 0.6 3.2 0.6
Susquehanna University 47.9 42 4.7 1 7.7 0 2.6 0
Swarthmore College 46.4 39 19.7 5.6 8.6 7.7 13.3 10.6
Syracuse University 73.6 81 5.1 0.9 7.2 1.1 6.9 2.7
Tarleton State University 16 6 3.1 0.8 0.4 0 1.3 0
Temple University 40.3 31 1.9 0.3 1.8 0.4 1.2 0.3
Texas A & M University-College Station 50.4 48 4.7 1.5 3.1 1.6 4.4 1.3

41
Institution Name
Economic
Education
Inclusion Index
(EEII)41
Rates at which students major in
economics (percent)
White African
American Hispanic
Value Percen
tile M F M F M F
Texas Christian University 43.5 36 6 0.7 5.1 1.2 4.7 1.3
Texas State University 57.2 61 0.6 0.1 0.8 0.2 0.5 0.1
Texas Tech University 32.3 20 5.4 1.2 2.8 0.9 2.9 1
The College of New Jersey 36.3 26 1.9 0.6 0.9 0 2 0
The College of Wooster 32.1 20 8.4 1.7 3.3 1.1 3.8 3.6
The New School 23.4 10 1.2 0.3 0 1.1 0 0
The University of Montana 93.1 93 1.7 0.4 0 5 1.5 1.1
The University of Tampa 102.2 95 1.5 0.6 4.8 0 2.2 0.2
The University of Tennessee-Chattanooga 26.7 14 1.4 0.3 1.6 0 0 0
The University of Tennessee-Knoxville 94.4 94 1.6 0.3 3.9 0.7 1.3 1.1
The University of Texas Rio Grande Valley 19.4 7 1.2 0.4 0 0 0.5 0.2
The University of Texas at Arlington 35.1 23 2.6 0.4 1.7 0.2 1.9 0.3
The University of Texas at Austin 46.8 40 6.1 1.4 4.8 1.3 5.4 1.3
The University of Texas at Dallas 64.6 72 3.2 1 4.4 1.7 2.8 0.4
Tougaloo College 51.3 50 50 0 20.3 8 100 0
Towson University 59.2 66 3.4 0.5 4 0.7 3.9 0.9
Transylvania University 4 2 5 1 0 0 0 0
Trinity College 33 21 27.1 8 9.1 5.4 16.5 5.6
Trinity University 46.5 40 11.3 2.8 5.6 9.1 5.1 3.7
Truman State University 36.3 26 3.1 0.7 2.3 0 1.7 1
Tufts University 48 43 16.3 5.8 8.3 5.4 14.6 5
Tulane University of Louisiana 56.8 61 5.7 2.6 3.6 0.4 8.2 1.4
Union College 32.3 20 22.1 4.8 7 1.7 16.4 5.7
Union University 29 15 2.2 0.3 0 0 0 2.9
United States Air Force Academy 62.9 70 6.6 3.4 4.8 2 6.9 3.7
United States Military Academy 55.5 59 7.6 2.9 5.3 5.9 4.9 2
United States Naval Academy 83.9 90 13.2 6.4 19.3 4.8 16.5 8.6
University at Buffalo 83.5 89 2.5 0.7 3.5 1.9 3.3 1.2
University of Akron Main Campus 42.7 34 0.6 0.2 1.1 0 0 0
University of Alaska Anchorage 59.9 67 2.5 1 2.2 0 2.8 1.6
University of Alaska Fairbanks 72.2 80 1.3 0.8 0 0 3.8 0
University of Arizona 53.7 55 3.4 0.7 3.8 1.2 2.8 0.7
University of Arkansas 48.9 45 1 0.2 0.9 0.3 0.5 0.4
University of California-Berkeley 38.7 28 5.5 2.1 2.3 1 4.1 1.2
University of California-Davis 54.1 56 8.1 2.1 9.1 1.9 6.7 2
University of California-Irvine 58.5 64 4 1.4 4.5 1.1 3.5 1.3
University of California-Los Angeles 65.1 73 6.7 5 3.5 3.7 4.6 5
University of California-Merced 78.2 86 3.7 1.4 2.4 3.2 5.5 2

42
Institution Name
Economic
Education
Inclusion Index
(EEII)41
Rates at which students major in
economics (percent)
White African
American Hispanic
Value Percen
tile M F M F M F
University of California-Riverside 89.8 92 3.6 1.8 6.3 2 4.2 1.7
University of California-San Diego 55.9 59 7 2.7 7.4 1.2 6.1 2.2
University of California-Santa Barbara 35.6 24 8.7 2.7 4.5 1.1 5.4 1.8
University of California-Santa Cruz 65.3 73 4 1.8 3.7 1.7 3.9 1.8
University of Central Arkansas 26 14 2.2 0.4 1 0.2 1.3 0
University of Central Florida 52.1 52 0.6 0.1 0.7 0.1 0.5 0.2
University of Central Missouri 32.4 21 1.1 0.2 0.4 0 1.2 0
University of Chicago 39.5 29 22.5 7.4 10.8 2.3 18.9 5
University of Cincinnati-Main Campus 51.3 50 1.9 0.4 1.5 0.7 1.5 0.7
University of Colorado Boulder 48.1 43 7.3 1.9 5.2 2 6.7 1.7
University of Colorado Colorado Springs 79.9 88 2 0.5 3.1 0 3.5 0.8
University of Colorado Denver/Anschutz Medical
Campus 59.7 67 3.2 0.7 3.8 0.4 3.6 1
University of Connecticut 66.7 75 10.3 2.2 14.3 3.8 10.7 3.3
University of Dallas 102.4 95 13.5 4 50 0 10.6 4.6
University of Dayton 109.1 97 0.7 1.1 0 0.8 1.1 1
University of Delaware 42 33 5 0.9 3.4 0.9 4.3 0.9
University of Denver 46.1 39 2.2 0.8 2.3 0.9 1.1 0
University of Detroit Mercy 22.7 9 2.6 0.4 2.1 0.5 0 0
University of Florida 50.9 49 6 2.1 3.7 1.6 5.8 2.1
University of Georgia 38 27 2.4 0.7 1.6 0.8 1.2 0.2
University of Hawaii at Hilo 83 89 1.3 0.6 5 0 0 0
University of Hawaii at Manoa 69.9 78 4.4 0.7 6.2 2.9 4.7 0.9
University of Houston 58.7 65 4.4 0.8 5.8 1.7 3.5 1.1
University of Idaho 58 62 0.5 0.3 0 0 0.7 0.3
University of Illinois at Chicago 64.6 72 3 1 3.5 1.4 2.7 1.1
University of Illinois at Urbana-Champaign 31.2 19 8.3 2.5 2.9 1.4 4.5 1.6
University of Iowa 45.5 38 6 1.3 4 1.6 5.6 1.2
University of Kansas 65.8 74 4.3 0.6 5.6 2.2 4 1.5
University of Kentucky 58.2 63 6.3 1.5 8.2 2.7 4 1.9
University of Louisville 87.5 91 0.4 0.2 0.4 0 1 0.4
University of Maine 73.4 81 2.9 0.7 1.5 4 2.1 2.2
University of Mary Washington 50.5 49 5.7 1.6 4.3 2.8 3.7 2
University of Maryland-Baltimore County 73.9 82 7 2.2 9.6 3.2 8.6 2.3
University of Maryland-College Park 73.7 82 7.8 2.2 8.7 3.6 11.3 2.8
University of Massachusetts-Amherst 69.2 77 8.1 1.8 12.9 4.3 6.8 2.2
University of Massachusetts-Boston 77.8 86 5.2 1.3 9.9 1.4 5.8 1.6
University of Massachusetts-Dartmouth 69.4 78 1.8 0.5 3.2 0 1.8 0.6
University of Massachusetts-Lowell 128.9 99 1.1 0.4 1.3 1.5 3.1 1

43
Institution Name
Economic
Education
Inclusion Index
(EEII)41
Rates at which students major in
economics (percent)
White African
American Hispanic
Value Percen
tile M F M F M F
University of Memphis 33 22 0.9 0.1 0.6 0.1 0.7 0
University of Miami 54 56 5.5 2.2 2.9 1.8 6 2
University of Michigan-Ann Arbor 49.7 47 8 2.6 4.5 0.9 8.6 3.2
University of Michigan-Dearborn 75.8 84 3.1 0.5 6 1.3 4.1 0
University of Michigan-Flint 46.6 40 2 0.3 1.4 0 3 0
University of Minnesota-Duluth 56.2 60 2.4 0.5 0 2.7 3.6 0
University of Minnesota-Morris 54.2 56 5 1.9 0 0 11.8 0
University of Minnesota-Twin Cities 50.3 48 4.5 1.2 4.4 1.4 3.2 1.1
University of Mississippi 57.4 62 0.4 0.2 0.2 0.1 0.8 0
University of Missouri-Columbia 31.2 19 1.9 0.4 1 0 1.4 0.2
University of Missouri-Kansas City 105.7 96 1.8 0.5 3.7 0.3 3.9 1
University of Missouri-St Louis 51.1 50 2.4 0.5 2.1 0.5 3.1 0
University of Mount Union 3.5 1 2.2 0.4 0 0 0 0
University of Nebraska at Omaha 80.3 88 0.4 0.1 0.5 0.4 0.6 0
University of Nebraska-Lincoln 32.6 21 2.7 0.6 1.5 0 2.3 0
University of Nevada-Las Vegas 51.6 51 2.1 0.6 1.9 0 2.5 0.3
University of New Hampshire-Main Campus 41 31 2.5 0.7 3.6 0 0.8 0
University of New Mexico-Main Campus 54.7 57 2.8 0.7 2.8 1 2.6 0.8
University of North Carolina Wilmington 36 25 0.9 0.2 0 0 1.2 0.2
University of North Carolina at Asheville 56.7 60 3.2 1.4 3 0 4.7 0
University of North Carolina at Chapel Hill 42 33 14 3.3 8.4 1.7 12.7 3.4
University of North Carolina at Charlotte 59.6 67 0.8 0.3 0.7 0.4 0.9 0.2
University of North Carolina at Greensboro 52.7 53 2 0.3 1.2 0.3 2.7 0.8
University of North Dakota 30.4 17 0.9 0.1 1.3 0 0 0
University of North Florida 44.2 37 1.2 0.4 0.6 0.4 1 0.1
University of North Texas 50.9 49 1.2 0.5 1.3 0.3 1.1 0.1
University of Northern Colorado 22 9 2 0.3 0.8 0 0.9 0.1
University of Northern Iowa 23.3 10 2.6 0.6 0 1 0 1.4
University of Notre Dame 32.6 21 9 3.9 1.9 1.3 6.4 1.2
University of Oklahoma-Norman Campus 68.2 76 1.3 0.5 1 0.9 1.5 0.4
University of Oregon 47 40 7.2 1.1 4.5 0.6 8.5 2.3
University of Pennsylvania 43.2 35 8.6 3.3 4 2.4 5.4 3.4
University of Pittsburgh-Pittsburgh Campus 53.6 55 5 1.7 5.1 2.1 2.7 1.7
University of Portland 148.6 100 1.1 0.5 5.3 0 2 0.5
University of Puget Sound 25.5 13 9.4 2.6 5.3 0 3 1.2
University of Redlands 19.5 8 3.9 1 0 0 2.2 0.7
University of Rhode Island 51.8 51 4 0.6 3 0.9 4.9 0.8
University of Richmond 52.1 52 6.5 2.6 1.6 1.4 7.1 4.2

44
Institution Name
Economic
Education
Inclusion Index
(EEII)41
Rates at which students major in
economics (percent)
White African
American Hispanic
Value Percen
tile M F M F M F
University of Rochester 53.6 55 11 2.6 11.8 2.2 9.7 3.1
University of San Diego 42.3 34 3.6 0.6 1.3 2.2 2.8 0.7
University of San Francisco 59.5 67 4.6 1.6 4.5 0.7 4.3 2.3
University of Scranton 25.6 13 1.6 0.2 0 0 1.8 0
University of South Carolina-Columbia 51.4 51 2.3 0.2 2.7 0.4 2.2 0.4
University of South Dakota 48.3 44 3.4 0.7 4 0 3.6 0
University of South Florida-Main Campus 64.4 72 2 0.5 3 0.6 2 0.5
University of South Florida-St Petersburg 84.7 90 1.7 0.4 3.2 0.7 2.6 0
University of Southern California 64.1 71 4.4 1.6 4.6 1.9 4.5 1.7
University of Southern Indiana 58.8 65 1.5 0.2 1.1 0 3 0
University of Southern Maine 56.9 61 2.7 0.4 4.3 0 2.9 0
University of St Thomas 105.9 96 1.5 1.9 0 0 1.7 4.3
University of St Thomas 45.6 38 4.4 2.2 2.9 1.2 2.9 0.8
University of Toledo 63 70 0.7 0.1 0.8 0 0.9 0.4
University of Tulsa 85.8 90 3.2 1.6 0 1.5 9.2 1.5
University of Utah 65.6 74 6.5 1.6 8.4 2.5 6.9 1.8
University of Vermont 104.1 96 4.8 2.3 12.3 2.4 6.9 1.3
University of Virginia-Main Campus 44.3 37 13.7 5.2 4.6 1.5 12 7.1
University of Washington-Seattle Campus 34.3 22 3.8 1.3 2.1 0.6 2.2 0.4
University of West Georgia 75.1 83 3 0.6 1.4 0.7 7.4 1.2
University of Wisconsin-Eau Claire 38.1 27 3 0.6 0 0 5.2 0
University of Wisconsin-Green Bay 79.6 88 2.8 0.3 0 3.7 7.1 0
University of Wisconsin-La Crosse 66.7 75 3.1 0.7 7 0 2.8 0
University of Wisconsin-Madison 48.6 45 10.4 2.5 7.5 0.5 12.3 2.7
University of Wisconsin-Milwaukee 51.7 51 2.8 0.9 2.5 0.9 2.3 0.8
University of Wisconsin-Oshkosh 39.5 30 5.4 1.1 6 0 3.6 0
University of Wisconsin-Parkside 9.7 5 2.9 0.7 0 0 0.7 0
University of Wisconsin-River Falls 98.7 94 3.7 1.1 10 0 7.1 0
University of Wisconsin-Stevens Point 29.4 16 2.5 0.5 1.8 0 1.5 0
University of Wisconsin-Whitewater 49 45 1.7 0.2 0.7 0 3.2 0
University of the District of Columbia 35.4 24 5.8 5 4.1 1.1 0 0
University of the Pacific 82.5 89 2.9 1.4 6.7 0 3.1 0.9
Ursinus College 39.5 29 25.5 7.1 12.2 7.5 17.9 5.6
Utah State University 47.4 41 5.1 1 5.7 0 5.1 0.4
Utah Valley University 17.9 6 0.3 0 0 0 0.3 0
Valparaiso University 20 8 2.3 1.3 0 0 0 1
Vanderbilt University 42.3 34 23.3 7.5 11.3 1.6 22.9 6
Vassar College 64.4 72 9.9 2.9 12.5 6.1 8.8 1.7
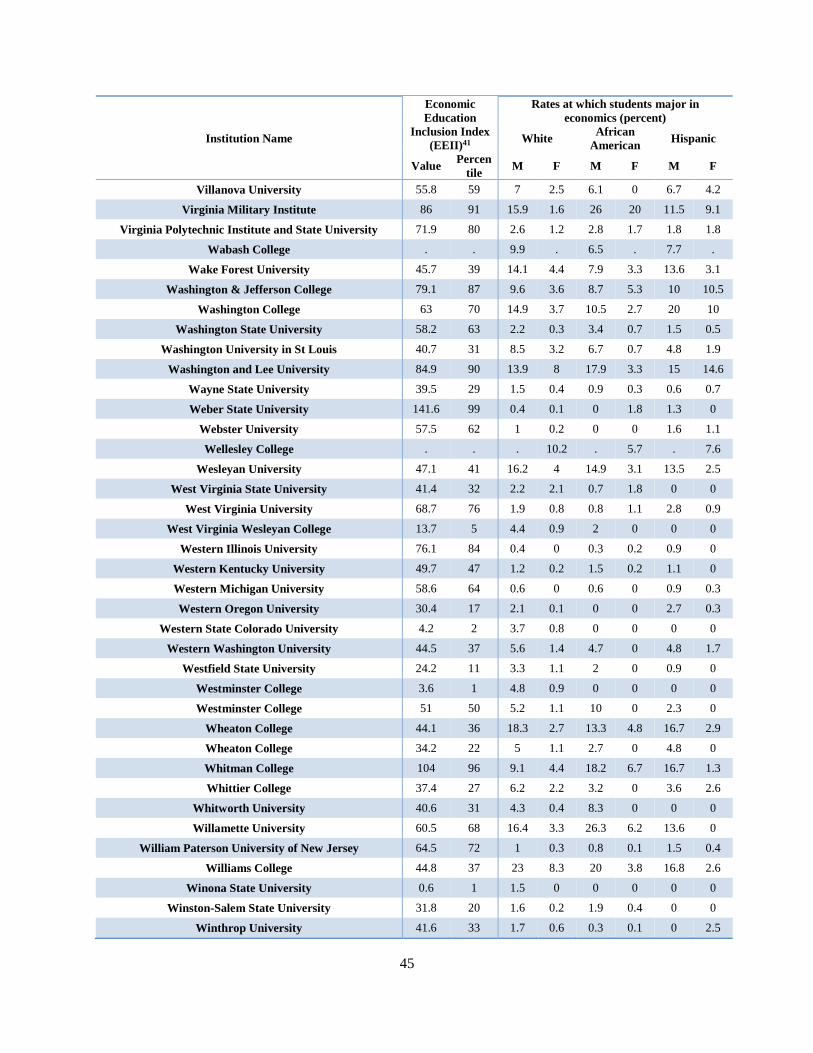
45
Institution Name
Economic
Education
Inclusion Index
(EEII)41
Rates at which students major in
economics (percent)
White African
American Hispanic
Value Percen
tile M F M F M F
Villanova University 55.8 59 7 2.5 6.1 0 6.7 4.2
Virginia Military Institute 86 91 15.9 1.6 26 20 11.5 9.1
Virginia Polytechnic Institute and State University 71.9 80 2.6 1.2 2.8 1.7 1.8 1.8
Wabash College . . 9.9 . 6.5 . 7.7 .
Wake Forest University 45.7 39 14.1 4.4 7.9 3.3 13.6 3.1
Washington & Jefferson College 79.1 87 9.6 3.6 8.7 5.3 10 10.5
Washington College 63 70 14.9 3.7 10.5 2.7 20 10
Washington State University 58.2 63 2.2 0.3 3.4 0.7 1.5 0.5
Washington University in St Louis 40.7 31 8.5 3.2 6.7 0.7 4.8 1.9
Washington and Lee University 84.9 90 13.9 8 17.9 3.3 15 14.6
Wayne State University 39.5 29 1.5 0.4 0.9 0.3 0.6 0.7
Weber State University 141.6 99 0.4 0.1 0 1.8 1.3 0
Webster University 57.5 62 1 0.2 0 0 1.6 1.1
Wellesley College . . . 10.2 . 5.7 . 7.6
Wesleyan University 47.1 41 16.2 4 14.9 3.1 13.5 2.5
West Virginia State University 41.4 32 2.2 2.1 0.7 1.8 0 0
West Virginia University 68.7 76 1.9 0.8 0.8 1.1 2.8 0.9
West Virginia Wesleyan College 13.7 5 4.4 0.9 2 0 0 0
Western Illinois University 76.1 84 0.4 0 0.3 0.2 0.9 0
Western Kentucky University 49.7 47 1.2 0.2 1.5 0.2 1.1 0
Western Michigan University 58.6 64 0.6 0 0.6 0 0.9 0.3
Western Oregon University 30.4 17 2.1 0.1 0 0 2.7 0.3
Western State Colorado University 4.2 2 3.7 0.8 0 0 0 0
Western Washington University 44.5 37 5.6 1.4 4.7 0 4.8 1.7
Westfield State University 24.2 11 3.3 1.1 2 0 0.9 0
Westminster College 3.6 1 4.8 0.9 0 0 0 0
Westminster College 51 50 5.2 1.1 10 0 2.3 0
Wheaton College 44.1 36 18.3 2.7 13.3 4.8 16.7 2.9
Wheaton College 34.2 22 5 1.1 2.7 0 4.8 0
Whitman College 104 96 9.1 4.4 18.2 6.7 16.7 1.3
Whittier College 37.4 27 6.2 2.2 3.2 0 3.6 2.6
Whitworth University 40.6 31 4.3 0.4 8.3 0 0 0
Willamette University 60.5 68 16.4 3.3 26.3 6.2 13.6 0
William Paterson University of New Jersey 64.5 72 1 0.3 0.8 0.1 1.5 0.4
Williams College 44.8 37 23 8.3 20 3.8 16.8 2.6
Winona State University 0.6 1 1.5 0 0 0 0 0
Winston-Salem State University 31.8 20 1.6 0.2 1.9 0.4 0 0
Winthrop University 41.6 33 1.7 0.6 0.3 0.1 0 2.5

46
Institution Name
Economic
Education
Inclusion Index
(EEII)41
Rates at which students major in
economics (percent)
White African
American Hispanic
Value Percen
tile M F M F M F
Wittenberg University 36 26 7 1.8 2.4 2.6 5.9 0
Wofford College 51.6 51 6.8 2.3 5.3 0 10 0
Worcester State University 88 91 2 0.4 2.7 0 5.7 0
Wright State University-Main Campus 105.7 96 0.3 0.1 1.4 0.4 0 0
Xavier University 112.9 98 1.3 0.5 2.6 0.4 2.8 0.9
Yale University 57.1 61 16 4.7 18.1 5.8 12.1 4.9
Yeshiva University 165 100 8.2 1.7 50 0 16 0

47
Appendix Table 2. Rating the inclusiveness of economics departments at women’s colleges, 2011-2015
Adjusted EEII42
race/ethnicity
disparities only
White female
rate of majoring
in economics
(percent)
Black female
rate of majoring
in economics
(percent)
Hispanic female rate
of majoring in
economics
(percent)
Agnes Scott College 159.2 5.0 9.3 6.7
Barnard College 109.7 6.7 8.6 6.1
Bryn Mawr College 104.5 1.8 3.7 0.0
Meredith College 123.9 1.2 1.1 1.9
Mills College 110.3 5.1 6.7 4.6
Mount Holyoke College 62.9 2.8 2.2 1.4
Scripps College 138.3 4.8 4.9 8.3
Simmons College 74.9 1.9 0.6 2.3
Smith College 177.8 4.3 10.3 4.9
Spelman College . . 8.0 0.0
St Catherine University 128.1 2.1 0.0 5.4
Wellesley College 65.6 10.2 5.7 7.6
Appendix Table 3. Rating the inclusiveness of economics departments at men’s colleges, 2011-2015
Adjusted EEII43
race/ethnicity
disparities only
White male rate
of majoring in
economics
(percent)
Black male rate
of majoring in
economics
(percent)
Hispanic male rate
of majoring in
economics
(percent)
Hampden-Sydney College 77.9 20.5 22.4 9.5
Morehouse College 17.2 16.7 5.7 0.0
Saint Johns University (MN) 18.5 5.7 0.0 2.1
Wabash College 72.0 9.9 6.5 7.7
Appendix Table 4. Rating the inclusiveness of economics departments at HBCUs, 2011-2015
Adjusted EEII,44
gender
disparities
only
Black male rate
of majoring in
economics
(percent)
Black female
rate of
majoring in
economics
(percent)
Alcorn State University 28.5 3.7 1.1
Benedict College 113.6 1.9 2.1
Florida Agricultural and Mechanical University 25.5 1.9 0.5
Fort Valley State University 78.5 2.1 1.7
Howard University 31.6 3.4 1.1
Morehouse College . 5.7 .
North Carolina Agricultural and Technical State University 46.6 2.5 1.2
Spelman College . . 8.0
Tougaloo College 39.7 20.3 8.0
University of the District of Columbia 27.6 4.1 1.1
West Virginia State University45 - - -
Winston-Salem State University 21.6 1.9 0.4
42 Higher value indicates more inclusion. Inclusion Index=100*average(bfrate, hfrate)/wfrate 43 Higher value indicates more inclusion. Inclusion Index=100*average(bmrate, hmrate)/wmrate 44 Higher value indicates more inclusion. Inclusion Index=100*bfrate/bmrate 45 Data on West Virginia State University are suppressed here, but are fully reported in Appendix Table 1, because
of the large proportions of white students in the overall BA count and among economics majors specifically.

48
Appendix Table 5. Rating the inclusiveness of economics departments at top LACs, 2011-2015
EEII Rates at which students major in economics (percent)
White African American Hispanic
Value Percen
tile M F M F M F
Amherst College 35.6 25 21.9 7.5 15.7 1.4 11.3 3.2
Barnard College . . . 6.7 . 8.6 . 6.1
Bates College 32.2 20 17.6 4 9.8 1.6 8.7 4.3
Bowdoin College 24.8 12 22.8 5.7 2.7 1.5 14.2 4.3
Bryn Mawr College . . . 1.8 . 3.7 . 0
Bucknell University 65.9 74 17.6 8.9 23.3 6.2 16.2 3.3
Carleton College 38 27 11.2 2.7 4.4 2.6 5.9 5.7
Centre College 58.7 65 29.4 6.1 42.9 4 33.3 0
Claremont McKenna 35 23 31.2 10 13 5 13 13.7
Colby College 24.6 11 24.8 5.8 10.8 0 10.3 3.6
Colgate University 28.9 15 20.7 8 9 1.4 10.1 1.3
College of William and Mary 55.3 59 11.9 4.1 14.9 2.6 8.6 2.6
College of Holy Cross 30.7 18 28.5 10.9 7.1 2.1 17.2 6.3
Colorado College 63.2 71 22.1 9.3 27.3 13.6 13 6.4
Connecticut College 58.7 65 23.9 8.2 28.1 4 20.4 9.4
Dartmouth College 53.1 54 19.9 8.4 13.2 2.2 23.1 5.8
Davidson College 35.4 24 14.2 5.4 7.9 0 8.9 2.9
DePauw University 26.6 14 19 4.3 10.8 3 5.4 1.8
Denison University 42.9 35 27.3 9.2 17.6 6.5 24.1 1.3
Dickinson College 48 43 11.6 3.3 15.7 4.1 4.8 0
Franklin and Marshall College 58.5 64 8.7 1.6 13.3 2.3 6 2.3
Furman University 76.9 85 6.3 2.6 8.2 1.1 10.3 2
Gettysburg College 25.4 13 13.3 2.5 4.3 0 10 0
Grinnell College 51.1 50 13.4 2.2 14 4 10.5 3.6
Hamilton College 22.2 9 24.2 5.3 7.3 0 12.9 1.2
Haverford College 28.3 15 16.2 3.6 2.5 1.6 13.7 1.5
Kenyon College 49.6 46 16.5 4.1 23.3 2.9 8.8 1.7
Lafayette College 78.7 87 22.8 15 27.4 7.3 27.4 12.8
Macalester College 49.9 47 11.4 3.8 13.6 0 10 1.1
Miami University-Oxford 42.3 34 2.3 0.3 0.3 0.2 4 0
Middlebury College 41.4 32 22.2 7.3 11.8 3 16.5 7.3
Mount Holyoke College . . . 2.8 . 2.2 . 1.4
Oberlin College 32.3 20 8.4 1.7 2.7 1.9 5.6 1.6
Occidental College 49.1 46 22.5 7.4 19.5 10.2 14.4 3.7
Pitzer College 35.1 23 11.2 2 0 6.1 7.5 4
Pomona College 51.5 51 16.9 7.2 18.6 2.4 13.9 1.4
Reed College 73.7 82 6.7 1.6 6.7 5.3 8 3.2
Rhodes College 78.8 87 8.1 4.7 7.9 3.2 12 4
Scripps College . . 0 4.8 . 4.9 . 8.3
Sewanee 59.1 66 17 6.1 17.2 18.2 5.6 3.1
Skidmore College 48.7 45 8.2 2.1 7.5 4.9 5.4 0
Smith College . . . 4.3 . 10.3 . 4.9
St Lawrence University 47 41 19.5 5.6 21.7 2.9 10.8 4.8
St Olaf College 35.3 23 15.8 5.3 10.3 3.7 5.1 3.6
Swarthmore College 46.4 39 19.7 5.6 8.6 7.7 13.3 10.6
Trinity College 33 21 27.1 8 9.1 5.4 16.5 5.6
Trinity University 46.5 40 11.3 2.8 5.6 9.1 5.1 3.7
Tufts University 48 43 16.3 5.8 8.3 5.4 14.6 5
Union College 32.3 20 22.1 4.8 7 1.7 16.4 5.7
University of Richmond 52.1 52 6.5 2.6 1.6 1.4 7.1 4.2
Vassar College 64.4 72 9.9 2.9 12.5 6.1 8.8 1.7
Washington and Lee 84.9 90 13.9 8 17.9 3.3 15 14.6
Wellesley College . . . 10.2 . 5.7 . 7.6
Wesleyan University 47.1 41 16.2 4 14.9 3.1 13.5 2.5
Whitman College 104 96 9.1 4.4 18.2 6.7 16.7 1.3
Williams College 44.8 37 23 8.3 20 3.8 16.8 2.6

49
Appendix Table 6. Rating the inclusiveness of economics departments at universities with top PhD
programs, 2011-2015
Institution Name Economic
Education
Inclusion Index
(EEII)
Rates at which students major in
economics (percent)
White African
American
Hispanic
Value Percen
tile
M F M F M F
Boston College 50.3 48 18.4 7.1 11.8 5.1 16.2 6
Boston University 58 63 4.7 1.6 2.4 1.5 5.8 2.3
Brown University 55.2 58 17.3 8.2 13.3 7.4 12.1 6.7
Carnegie Mellon University 71.2 79 3.2 2 2.3 2.6 1.5 3.1
Columbia University 59.8 67 15.3 6.9 12.4 4.5 15 6.8
Cornell University 74.3 83 14.7 6.6 17.4 6.6 18.1 6.1
Duke University 40 30 14.5 4.4 5.6 1.4 11.8 5.8
Harvard University 52.9 54 15.1 4.8 12.7 4.4 12.9 5.1
Indiana University-Bloomington 29.6 16 3.5 0.5 0.8 0.4 3.2 0.3
Johns Hopkins University 19.4 7 12.1 2.6 2.5 0.7 4.1 1.7
Massachusetts Institute of Technology 80.7 88 3.1 2.2 4.6 1.6 2.6 1.6
Michigan State University 57.8 62 3.4 0.5 3.8 0.9 4.4 0.3
New York University 60.5 68 7.6 3.4 5.8 2 7.7 4.2
Northwestern University 39 29 19.1 7 8.7 1.7 16.4 3.4
Ohio State University-Main Campus 67.8 76 4.5 1.2 7.1 1.5 4.7 0.7
Pennsylvania State University 75.1 83 3.2 1 4.5 1.1 4 1.6
Princeton University 60.5 68 12.4 5.3 6.5 2.7 16.7 6.2
Stanford University 53.6 55 6.9 2.8 4.2 1.7 6.9 2.8
Texas A & M University-College Station 50.4 48 4.7 1.5 3.1 1.6 4.4 1.3
The University of Texas at Austin 46.8 40 6.1 1.4 4.8 1.3 5.4 1.3
University of California-Berkeley 38.7 28 5.5 2.1 2.3 1 4.1 1.2
University of California-Davis 54.1 56 8.1 2.1 9.1 1.9 6.7 2
University of California-Los Angeles 65.1 73 6.7 5 3.5 3.7 4.6 5
University of California-San Diego 55.9 59 7 2.7 7.4 1.2 6.1 2.2
University of California-Santa Barbara 35.6 24 8.7 2.7 4.5 1.1 5.4 1.8
University of Chicago 39.5 29 22.5 7.4 10.8 2.3 18.9 5
University of Illinois, Urbana-Champaign 31.2 19 8.3 2.5 2.9 1.4 4.5 1.6
University of Maryland-College Park 73.7 82 7.8 2.2 8.7 3.6 11.3 2.8
University of Michigan-Ann Arbor 49.7 47 8 2.6 4.5 0.9 8.6 3.2
University of Minnesota-Twin Cities 50.3 48 4.5 1.2 4.4 1.4 3.2 1.1
University of North Carolina, Chapel Hill 42 33 14 3.3 8.4 1.7 12.7 3.4
University of Pennsylvania 43.2 35 8.6 3.3 4 2.4 5.4 3.4
University of Pittsburgh 53.6 55 5 1.7 5.1 2.1 2.7 1.7
University of Rochester 53.6 55 11 2.6 11.8 2.2 9.7 3.1
University of Southern California 64.1 71 4.4 1.6 4.6 1.9 4.5 1.7
University of Virginia-Main Campus 44.3 37 13.7 5.2 4.6 1.5 12 7.1
University of Washington 34.3 22 3.8 1.3 2.1 0.6 2.2 0.4
University of Wisconsin-Madison 48.6 45 10.4 2.5 7.5 0.5 12.3 2.7
Vanderbilt University 42.3 34 23.3 7.5 11.3 1.6 22.9 6
Washington University in St Louis 40.7 31 8.5 3.2 6.7 0.7 4.8 1.9
Yale University 57.1 61 16 4.7 18.1 5.8 12.1 4.9