Embed Size (px)
Citation preview

The unique radar properties of silicic lava domes
Jeffrey J. Plaut,1 Steven W. Anderson,2 David A. Crown,3 Ellen R. Stofan,4
and Jakob J. van Zyl1
Received 25 November 2002; revised 26 November 2003; accepted 31 December 2003; published 2 March 2004.
[1] Silicic lava domes exhibit distinct morphologic characteristics at scales of centimetersto kilometers. Multiparameter radar observations capture the unique geometric signaturesof silicic domes in a set of radar scattering properties that are unlike any other naturalgeologic surfaces. Backscatter cross-section values are among the highest observed onterrestrial lava flows and show only a weak decrease with incidence angle. Cross-polarization backscatter (HV) shows a unique behavior, increasing with increasingwavelength. Circular polarization ratios are relatively high, in the 0.3–0.95 range, andincrease with increasing wavelength. Field measurements of boulder size frequencydistributions and microtopography indicate that silicic dome surfaces are among theroughest ever measured. Rms heights at a 1 m lateral scale range from 13 cm to 50 cm.Rms slopes at 1 m spacing range from 12 to 43 degrees. Modeling of the scatteringbehavior suggests it results from a combination of rough surface (facet) scattering andscattering from block edges that act as a random collection of dipoles. The unusualwavelength dependence of the radar parameters appears to result from a higher componentof edge scattering at large wavelengths, producing, for example, higher cross-polarizedbackscatter at P band (68 cm). Steep-sided volcanic domes on Venus superficiallyresemble terrestrial silicic domes in plan view gross morphology, but few similaritiesremain when the radar scattering and three-dimensional shapes of the features arecompared. The unique radar scattering properties suggest that such volcanic surfaces canbe identified with multiparameter radar observations in future planetary radar missions andin active terrestrial volcanoes, where dome development can represent serioushazards. INDEX TERMS: 5464 Planetology: Solid Surface Planets: Remote sensing; 5480 Planetology:
Solid Surface Planets: Volcanism (8450); 6295 Planetology: Solar System Objects: Venus; 6207 Planetology:
Solar System Objects: Comparative planetology; 8429 Volcanology: Lava rheology and morphology;
KEYWORDS: radar, remote sensing, volcanology
Citation: Plaut, J. J., S. W. Anderson, D. A. Crown, E. R. Stofan, and J. J. van Zyl (2004), The unique radar properties of silicic lava
domes, J. Geophys. Res., 109, E03001, doi:10.1029/2002JE002017.
1. Introduction
[2] Investigation of volcanic landforms and surfaces withremote sensing has become an important element in geo-logic studies of the surfaces of the planets. Interpretation ofdata from planetary missions requires an understanding ofrelated phenomena on Earth, a task that often includes asearch for appropriate terrestrial analogues to planetaryfeatures. The Magellan radar mapping mission to Venusrevealed a variety of volcanic features, and the interpretationof the radar images inspired a number of studies utilizingradar remote sensing of terrestrial volcanoes and lava flows
[e.g., Greeley and Martel, 1988; Ford et al., 1989; Gaddiset al., 1989, 1990; Campbell and Campbell, 1992; Arvidsonet al., 1993; Mouginis-Mark, 1995; Campbell and Shepard,1996]. A remarkable finding from Magellan was a class ofapparently volcanic landforms referred to as ‘‘steep-sided’’or ‘‘pancake’’ domes [Head et al., 1992; Pavri et al., 1992;McKenzie et al., 1992; Fink et al., 1993; Bridges, 1997;Stofan et al., 2000]. The gross morphology of these featureswas reminiscent of silicic lava domes on Earth, and earlyworkers suggested that they represented viscous lava flows,silicic in composition [McKenzie et al., 1992] or alterna-tively, less silicic lavas with enhanced gas bubble content[Pavri et al., 1992].[3] In this paper, we examine the radar scattering behav-
ior of the silicic domes of the Inyo volcanic chain, Cal-ifornia, with an emphasis on the scattering characteristicsthat distinguish the dome surfaces from other lava flowsurfaces. We then incorporate field measurements of theroughness characteristics of the dome surfaces into ananalysis of the mechanisms of radar scattering that producethe unique signatures. Finally, we compare the observations
JOURNAL OF GEOPHYSICAL RESEARCH, VOL. 109, E03001, doi:10.1029/2002JE002017, 2004
1Jet Propulsion Laboratory, California Institute of Technology,Pasadena, California, USA.
2Department of Science, Black Hills State University, Spearfish, SouthDakota, USA.
3Planetary Science Institute, Tucson, Arizona, USA.4Proxemy Research, Rectortown, Virginia, USA.
Copyright 2004 by the American Geophysical Union.0148-0227/04/2002JE002017$09.00
E03001 1 of 12

of terrestrial silicic domes with those of steep-sided domeson Venus, and discuss the implications for the formation ofthe Venusian domes.
2. Geologic Description
[4] The Inyo chain is a series of silicic lava flows andexplosion pits that cut across the northern margin of LongValley caldera in eastern California (Figure 1). The mostprominent features in this chain are four recently emplacedrhyolitic extrusions. Deadman Dome, Glass Creek Dome,and Obsidian Dome formed after a series of explosiveeruptions 550–650 years ago, and Wilson Butte extrudedapproximately 1200–1350 years ago [Miller, 1985]. Aseries of small pyroclastic eruptions preceded the emplace-ment of the three youngest domes in the Inyo chain [Miller,1985]. An en echelon dike system [Fink, 1985; Reches andFink, 1988] that apparently tapped more than one magmabody fed the dome-building eruptions [Eichelberger et al.,1988]. The domes vary in volume, ranging from 0.026 km3
for Wilson Butte (roughly cylindrical in shape with anaverage radius of 320 m and an average thickness of80 m), to 0.17 km3 for Obsidian Dome [Miller, 1985](see section 3.3 below for new estimates of volumes).Anderson and Fink [1992] estimated an effusion rate of106 m3/s for the Glass Creek Dome from studies of creasestructure formation. This rate is somewhat higher than thosemeasured for lobes at the Mount St. Helens dome (1.4–40.3 m3/s [Anderson and Fink, 1990]).[5] Two distinct lava types comprise the three most
recently emplaced Inyo domes: a finely porphyritic (phe-nocrysts generally <2 mm) and a coarsely porphyriticrhyolite (phenocrysts generally 3–10 mm) [Bailey et al.,1976, 1983; Sampson, 1987; Sampson and Cameron,1987; Swanson et al., 1989]. The finely porphyriticrhyolite shows both chemical and mineralogical zonation[Bailey et al., 1976], suggesting that mingling of twodifferent magma types occurred during emplacement[Vogel et al., 1989]. According to detailed surface map-
ping by Sampson [1987], Deadman Dome consists primar-ily of coarsely porphyritic lava, Glass Creek Domecontains roughly equal amounts of coarsely and finelyporphyritic varieties, and Obsidian Dome is entirely finelyporphyritic rhyolite. Wilson Butte consists of a phenocryst-poor rhyolite that is megascopically similar to the finelyporphyritic rhyolite found at the other Inyo domes.[6] Surface and drilling studies reveal a complex stratig-
raphy of glassy and vesicular textures within the finelyporphyritic lavas of the Inyo chain. Rhyolitic extrusionstypically consist of a surface layer of finely vesicularpumice (FVP) underlain by a zone of obsidian [Fink,1983; Fink and Manley, 1987; Manley and Fink, 1988].Beneath this upper obsidian zone, a layer of coarselyvesicular pumice (CVP) forms where volatiles released inthe flow interior accumulate beneath the cooled crust ofobsidian and FVP. This layer has a lower density than theoverlying material and may rise to the surface as regularlyspaced diapirs [Fink and Manley, 1987; Manley and Fink,1988]. These diapirs may then deform as the flow surfacecompresses during ridge formation [Fink, 1983]. Smallcrease structures commonly cut across CVP diapirs due toextensional stresses accumulating perpendicular to the di-rection of compression during ridge formation [Andersonand Fink, 1992].
3. Radar Data Analysis
[7] Multiple-wavelength polarimetric SAR (syntheticaperture radar) data were acquired over the Inyo domesby the NASA/JPL AIRSAR system in August, 1993(Figure 2a). Data were acquired at three incidence angles,using the P (68 cm), L (24 cm) and C band (5.6 cm) quad-polarization modes [van Zyl et al., 1987]. The quad-polarization mode captures the full scattering matrix foreach �10 m pixel, allowing synthesis of any combinationof transmit and receive polarizations, as well as measure-ments of the phase difference between polarizations. Inthis paper we refer to the linear polarizations as H and V,for horizontal and vertical respectively, and transmit/receive combinations as, e.g., HV for horizontal transmit/vertical receive. Several radar passes were obtained in theTOPSAR mode, a single-pass, dual-antenna interferometrictopographic SAR [Zebker et al., 1992], using the C bandwavelength (Figure 2b). This mode produces an ortho-rectified C band VV polarization SAR image, elevationmeasurements at 5 m postings, and an interferometricphase coherence value for each pixel.[8] The three Inyo domes analyzed are Deadman Dome,
Glass Creek Dome, and Obsidian Dome (Figure 1). Polar-imetric data were collected on a due south flight line, withimages illuminated from the west. Incidence angles rangedfrom 23.9� to 53.3� for the entire set of observations of thedomes; in a given image, the incidence angles across asingle dome may vary as much as 11�. Data were processedin a slant range geometry, at a pixel spacing of 6.66 m inslant range and 8.10 m in azimuth. Calibration of the datawas based on analysis of corner reflector signatures fromthe Rosamond test site obtained during the same flightseason. Absolute uncertainties in calibration are 3 dB,between wavelength channels 1.5 dB, and between polar-izations at a single wavelength 0.5 dB [Lou et al., 1996].
Figure 1. Map of study area. Inyo domes occur along anorth-south trend crossing the northwest boundary of theLong Valley caldera.
E03001 PLAUT ET AL.: RADAR PROPERTIES OF SILICIC LAVA DOMES
2 of 12
E03001

[9] The AIRSAR data set of the Inyo domes is diverse inincidence angle, polarization and wavelength. In this sec-tion, the variation of backscatter cross section (also knownas the backscatter coefficient or sigma zero, s0) is examinedas a function of these three parameters. Because the data arewell-calibrated, comparisons of the behavior of theseparameters are readily made with observations of othersurface types.
3.1. Backscatter Trends
[10] Figures 3a and 3b show s0 values for two of theInyo domes, Deadman and Obsidian domes, as a functionof incidence angle, for the co-polarization (HH) andcross-polarization (HV) modes. Values were extractedfrom the entire upper surface of each dome, i.e., not
including the steep margins which show strong artifacts ins0 values due to local incidence angle effects. Plottedvalues are the median s0, which is used to describe the‘‘typical’’ scattering behavior. The median values differfrom the arithmetic means by no more than 2 dB, andstandard deviations from the mean are typically in therange of 2–4 dB. Each point on the plots representsseveral hundred pixels, each 8.10 m in azimuth by 6.66 min slant range.[11] The s0 values shown in Figure 3 imply that the dome
surfaces are extremely rough, based on the high values andthe negligible decrease with incidence angle. Comparison totypical basaltic lava flow surfaces at Kilauea Volcano,Hawaii (Figures 3c and 3d; see Campbell and Campbell[1992] for an earlier analysis of these AIRSAR data ofKilauea) indicates that the silicic dome surfaces have adistinct backscatter signature. HH s0 values on the domesare higher at all three wavelengths than on both a’a andpahoehoe flows on Kilauea. Moreover, the dome HH valuesshow little dependence on wavelength, whereas the Kilaueavalues generally decrease as the wavelength increases.Pahoehoe flows show a systematic decrease from C to Lto P band, while a’a flow values are similar at C and L, butlower at P. The silicic domes are apparently ‘‘rough’’ at allthree wavelength scales.[12] HV s0 values show an unexpected behavior, appar-
ently unique to silicic lava flows. HV s0 is seen to increaseslightly with increasing wavelength. This result is robustwithin the inter-channel calibration uncertainties, at least forthe observation that P and L HV values exceed C bandvalues. This trend is opposite to that observed on theKilauea flows, where both a’a and pahoehoe flows have Pband HV s0 values that are consistently 5–10 dB less thanC band (Figures 3c and 3d).
3.2. Polarization Ratios
[13] The polarization diversity of the AIRSAR data setcan be utilized to show variations of s0 as a function ofpolarization. It is useful to compare backscatter at twopolarizations as a ratio, of either circular or linear polariza-tion pairs. The circular polarization ratio, mc, is the ratio ofthe power in the circular polarization transmitted andreceived in the same rotation sense (SC, also known asLL for ‘‘left-left’’) to the power in the circular polarizationtransmitted in one rotation sense and received in theopposite sense (OC, also known as LR for ‘‘left-right’’).A single specular reflection event is expected to reversethe circular polarization sense, giving backscattered powerexclusively in the OC component. Double reflections(from ‘‘dihedral’’ corner reflectors), coherent backscattereffects [Hapke, 1990], and diffuse scattering can allcontribute to the SC component, giving a mc > 0. Circularpolarization ratios in excess of unity are observed on avariety of icy surfaces, including the icy Galileansatellites [Ostro et al., 1992], the polar regions of Mars[Muhleman et al., 1991] and Mercury [Slade et al.,1992], terrestrial ice sheets [Rignot et al., 1993; Rignot,1995] and glaciers [Haldemann, 1997]. On rockysurfaces, mc values are typically less than unity, with severalnotable exceptions. Portions of the blocky basaltic andesiteSP lava flow (AZ) were reported by Campbell et al.[1993] to show mc > 1 at L band. Certain regions in the
Figure 2. Radar data of Inyo domes. a) AIRSAR HVpolarization color composite; blue = C band, green = L band,red = P band. Brightness proportional to s0 in dB, withidentical contrast stretch in all bands. Reddish color ondome surfaces indicates that P band contains the highest HVs0 values. North is toward the top. Illumination is from theleft. Incidence angles on the domes are 45�–51�. Domes,south to north: Deadman, Glass Creek, Obsidian. Swath is7 km long. b) TOPSAR-derived digital elevation maps.Elevations are relative to an arbitrary base level for eachdome. Each dome shows total relief of �150 m. Overallprofile is convex-up for all domes, with highest topographyin the central vent regions.
E03001 PLAUT ET AL.: RADAR PROPERTIES OF SILICIC LAVA DOMES
3 of 12
E03001

reflective highlands of Venus have also displayed mc > 1 inEarth-based radar observations [Tryka and Muhleman,1992; Campbell et al., 1999].[14] Polarization ratios of the Inyo dome surfaces and
Kilauea flows are shown in Figure 4. The dome surfaces
show a wide separation in mc values at the three AIRSARwavelengths, with C band values of 0.3–0.4, L band0.6–0.7 and P band 0.8–0.95. The dome mc values alsoshow a slight decrease with incidence angle. Kilaueaflows show lower mc values, and a much smaller separa-
Figure 3. HH (solid symbols) and HV (open symbols) backscatter cross section, s0, as a function ofincidence angle for two of the Inyo domes and two lava flow surfaces at Kilauea, Hawaii. Data at threewavelengths are shown: C band (5.6 cm; solid lines), L band (24 cm; dashed lines) and P band (68 cm;dotted lines). a) Deadman Dome. b) Obsidian Dome. HV values on dome surfaces show directdependence on wavelength (P band is highest), unlike most geologic surfaces. c) A’a lava. d) Pahoehoelava. P band values are lowest for both HH and HV, on both Kilauea lava types. Well-behaved inversedependence on wavelength for pahoehoe surface suggests sub-wavelength roughness controls thescattering, with no ‘‘saturation’’ effect.
E03001 PLAUT ET AL.: RADAR PROPERTIES OF SILICIC LAVA DOMES
4 of 12
E03001

tion with wavelength. Values on a’a flows are in therange 0.3–0.6, and pahoehoe flows 0.15–0.4 for allwavelengths. All Kilauea flows show an increase in mcwith incidence angle. The most striking difference incircular polarization behavior is the strong wavelength-dependence of mc for the dome surfaces, with valuesapproaching unity at P band.
[15] The linear polarization ratio, ml, is the ratio of thebackscatter at HV polarization to that at HH. Scatteringfrom randomly distributed dipoles is predicted to produceml = 1/3 [Long, 1965]. Values of ml > 1/3 may indicateunusual scattering behavior, and have been observed on icesheets and glaciers [Rignot et al., 1993; Rignot, 1995;Haldemann, 1997] at C band, on the Galilean satellites at
Figure 4. Linear (ml = HV/HH; solid symbols) and circular (mc = SC/OC; open symbols) polarizationratios as a function of incidence angle for two of the Inyo domes and two lava flow surfaces at Kilauea,Hawaii. Data at three wavelengths are shown: C band (solid lines), L band (dashed lines) and P band(dotted lines). a) Deadman Dome. b) Obsidian Dome. Strong wavelength dependence is seen on thedomes, with highest polarization ratios at P band. P band mc values approach unity, indicating a possibledouble-bounce component. c) A’a lava. d) Pahoehoe lava. Note the lower values than those of the Inyodomes, especially P band mc, which does not exceed 0.5 on Kilauea flows.
E03001 PLAUT ET AL.: RADAR PROPERTIES OF SILICIC LAVA DOMES
5 of 12
E03001

S band (13 cm [Ostro et al., 1992]), and in the Venushighlands at S band [Campbell et al., 1999]. Values of ml onlava flows are shown in Figure 4. A similar behavior to thatobserved for mc is seen for ml: ml shows a strong wavelengthdependence, with the highest values (about 0.3) at P band.The dome ml values are generally higher than those of theKilauea flows, especially at the longer wavelengths. At Cband, the highest ml values are seen on the Kilauea a’aflows. Little incidence angle dependence is seen for any ofthe flow surfaces.
3.3. TOPSAR Digital Topography
[16] Figure 2b shows digital elevation data for the Inyodomes, obtained by the TOPSAR C band mode of theNASA/JPL AIRSAR radar system. These topographic datahave a lateral spacing of 5 m, with a relative vertical accuracyof about 1–3 m [Madsen et al., 1995]. High resolution digitaltopographic data allow direct measurements of large-scalemorphological characteristics of the Inyo domes. Table 1gives the average diameter, maximum height above theaverage base level of the surroundings, aspect ratio and totaldome volume. Volumes were estimated by summing alldigital values of height with respect to the average base levelof the surroundings.[17] The TOPSAR data shown in Figure 2b clearly
display the general convex shape of the Inyo domes, withthe highest elevations in the central vent areas. Theaverage slope from the vent summit to the lip abovethe dome margin for Deadman Dome is 10.6�, forObsidian Dome, 4.9�. Glass Creek Dome apparently
erupted onto terrain of significant relief, making averageslope estimates more difficult to extract.
4. Field Observations
[18] In order to characterize the flow surface geometricstructure responsible for the observed scattering signatures,we collected two types of field data at sites on the Inyodomes: microtopographic transects and block size frequencydistributions.[19] We selected representative sites within each of the
morphologic surface types (vent, jumbled and ridged[Anderson et al., 1998]), for each of the Inyo domes.Figure 5 is a field photograph of typical ridged site.Perpendicular 20 m transects were marked with a tautline. Surface heights relative to the lines were measuredat a horizontal spacing of 25 cm. Data reduction included:detrending, RMS height (standard deviation of surfaceheights, in profile segments of 20 m and 1 m [Shepard etal., 2001]), RMS slope (standard deviation of point-to-adjacent-point slopes, at spacings of 25 cm and 1 m), andfractal dimension, fit at the scale of 25 cm to several m(variogram method; see Shepard et al. [1995] and Campbelland Shepard [1996]). Table 2 summarizes the topographicparameters for the 83 transects measured. Figure 6 showshistograms of the RMS height and RMS slope measure-ments. As noted by Shepard et al. [2001], the Inyo domesurfaces represent the extreme example in surface roughness
Table 1. Morphometric Parameters of Inyo Domes, Derived From
TOPSAR Digital Elevation Data
DomeDiameter,
kmMax.
Height, mAspectRatio
Volume,km3
Deadman 1.25 138 0.110 0.0669Glass Creek 1.04 134 0.128 0.0513Obsidian 1.53 129 0.084 0.0960
Figure 5. Measurement site at Deadman Dome. Note ubiquitous blocks, up to several meters in size(person at left for scale).
Table 2. Topographic Parameters from 83 Transects of Inyo
Dome Surfacesa
Min Mean Max
Rms height, cm (20 m) 20.4 62.0 198Rms height, cm (1 m) 13.0 28.3 50.0Rms slope, deg. (1 m) 12.1 27.7 43.3Rms slope, deg. (25cm) 28.6 48.7 63.4Fractal dimension 1.18 1.57 1.84
aRms heights are given for profile segments of 20 m and 1 m. Rms slopesare given for horizontal step sizes of 1 m and 25 cm.
E03001 PLAUT ET AL.: RADAR PROPERTIES OF SILICIC LAVA DOMES
6 of 12
E03001
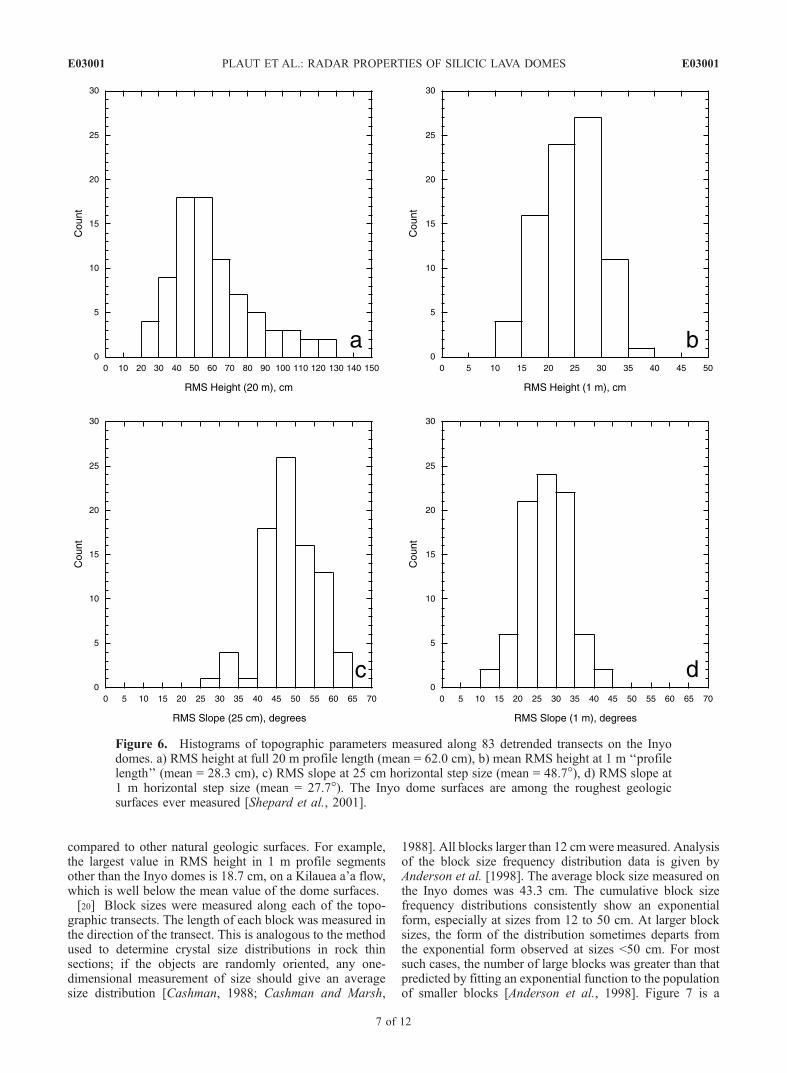
compared to other natural geologic surfaces. For example,the largest value in RMS height in 1 m profile segmentsother than the Inyo domes is 18.7 cm, on a Kilauea a’a flow,which is well below the mean value of the dome surfaces.[20] Block sizes were measured along each of the topo-
graphic transects. The length of each block was measured inthe direction of the transect. This is analogous to the methodused to determine crystal size distributions in rock thinsections; if the objects are randomly oriented, any one-dimensional measurement of size should give an averagesize distribution [Cashman, 1988; Cashman and Marsh,
1988]. All blocks larger than 12 cm were measured. Analysisof the block size frequency distribution data is given byAnderson et al. [1998]. The average block size measured onthe Inyo domes was 43.3 cm. The cumulative block sizefrequency distributions consistently show an exponentialform, especially at sizes from 12 to 50 cm. At larger blocksizes, the form of the distribution sometimes departs fromthe exponential form observed at sizes <50 cm. For mostsuch cases, the number of large blocks was greater than thatpredicted by fitting an exponential function to the populationof smaller blocks [Anderson et al., 1998]. Figure 7 is a
Figure 6. Histograms of topographic parameters measured along 83 detrended transects on the Inyodomes. a) RMS height at full 20 m profile length (mean = 62.0 cm), b) mean RMS height at 1 m ‘‘profilelength’’ (mean = 28.3 cm), c) RMS slope at 25 cm horizontal step size (mean = 48.7�), d) RMS slope at1 m horizontal step size (mean = 27.7�). The Inyo dome surfaces are among the roughest geologicsurfaces ever measured [Shepard et al., 2001].
E03001 PLAUT ET AL.: RADAR PROPERTIES OF SILICIC LAVA DOMES
7 of 12
E03001

histogram of the fraction of the block-count transect occu-pied by blocks larger than 50 cm. At a majority of the sites,more than 38% of the surface was occupied by blocks largerthan 50 cm. At 10 of the 43 sites, more than 50% of thesurface was occupied by blocks larger than 50 cm.
5. Scattering Models
[21] A complete model of the radar interactions with thedome surfaces needs to account for the following character-istics observed in the scattering behavior: high backscattercross sections at all wavelengths and polarizations, shallowscattering law slopes, weak wavelength dependence of s0 atHH, direct wavelength dependence at HV, strong directdependence of circular and linear polarization ratios onwavelength, high mc values at P band (0.8–0.95), and weakvariation of mc with incidence angle. Table 3 summarizes thebehavior as compared to basalt flows, and as a function ofwavelength and incidence angle.[22] The domes’ polarization ratios show two important
trends that distinguish them from the Kilauea flows: muchhigher values at the longer wavelengths (P and L), and astrong direct wavelength dependence of mc and ml [mP) > mL)> mC)].[23] The dome surfaces are clearly extreme in their
roughness, based on field measurements and suggested bythe high backscatter and shallow scattering laws. The natureof the roughness–large blocks with typically smooth facesand sharp linear edges–is quite different from that usuallyencountered in rough surface scattering, such as that of theKilauea flows. This unusual morphology suggests that theradar signatures of these surfaces may result from differentcontributions of scattering mechanisms than those encoun-tered on normal rough surfaces. We can rule out penetrationand volume scattering as the surface materials are predom-inantly dense rhyolite (with only minor pumice and obsid-ian), and because the polarization signatures are inconsistentwith those predicted for volume scattering.
[24] Several models for rough surface scattering may beapplicable to the Inyo observations, and as we will show,more than one mechanism may have to be considered tofully explain the observed scattering. We evaluate thecontributions of two mechanisms, one described by a roughsurface (specular points or facet) scattering model and theother by an edge or dipole scattering model. The relativelylarge number of blocky boulders might lead one to considerthe so-called incoherent component of scattering from avery rough surface. This scattering is applicable when thesurface roughness is such that kh > 5 [Barrick, 1968, 1970],where, k is the radar wave number (2pl ) and h is the surfaceRMS height. The measurements of RMS height at theshorter length scales (Table 2) suggest that even at P bandthis condition might be met. This model considers scatteringthat is dominated by the incoherent returns from specularpoints on the surface. An example of the predicted co-polarized scattering cross section of this model is [Barrick,1970]
s0 ¼ sec4 qs2
ffiffie
p� 1ffiffi
ep
þ 1
��������2
exp � 1
s2tan2 q
� �ð1Þ
This particular expression is valid for a surface with aGaussian surface height probability function, where s is thesurface RMS slope (for a Gaussian surface), e is the surfacedielectric constant, and q is the radar incidence angle. Notethat the quantity s is defined in a theoretical sense as twicethe ratio of the surface RMS height to the surfacecorrelation length. The interpretation of this quantity asthe RMS slope of the surface is theoretically only correct fora surface with a Gaussian correlation function. Theassumption of a Gaussian function is mathematicallyconvenient, but may not be applicable to all naturalsurfaces. The specular points model predicts the cross-polarized return in the backscatter direction to be zero,which is clearly not the case for the dome surfaces.[25] The specular points model, at first glance, appears to
predict a radar cross section that is independent of the radarfrequency. In reality, this model is derived assuming that thelocal radius of curvature is large compared to the radarwavelength. In practice, this means that at lower frequen-cies, only the larger scale scatterers will scatter according tothe specular-point theory. These larger scale scattererstypically have smaller RMS slopes, as can be seen fromthe measurements shown in Figures 6c and 6d. The moregentle slopes at the larger spatial scales will result in lowercross sections at lower frequencies. If we assume theappropriate spatial scale to use to be several wavelengths(numerical scattering simulations suggest 2–3 wave-lengths), we would need to use measurements on the order
Figure 7. Histogram of the fraction of the block-counttransect occupied by blocks larger than 50 cm. Values areaverages from multiple transects for each of the 43 sites. Amajority of the sites have more than 30% of the surfacecovered with blocks larger than 50 cm.
Table 3. Summary of Scattering Behavior Observed for Inyo
Dome Surfaces
ParameterCompared toBasalt Flows
As WavelengthIncreases
As IncidenceAngle Increases
s0 HH high decreases flats0 HV high increases flatmc high increases flatml high increases decreases
E03001 PLAUT ET AL.: RADAR PROPERTIES OF SILICIC LAVA DOMES
8 of 12
E03001

of 20 cm for C band, 75 cm for L band, and about 2 m for Pband. At 2 m spacing, the average RMS slope is about18 degrees, with a significant fraction of the slopes as highas 30 degrees. At L band, the average is in the range of25–30 degrees, and at C band 45–50 degrees.[26] On the basis of these observations one would expect
to see lower co-polarized cross sections at P band than at Lband and C band, consistent with observations. We usedthe measured RMS slope at the appropriate scale andequation (1) to calculate a weighted average of the expectedradar cross section. However, such a model failed to predictthe observed behavior. The predicted cross-section valuesare lower than observed, and the differences between thepredicted cross sections at the various frequencies are muchlarger than observed. In addition, since the specular pointsmodel does not predict any cross-polarized return, thismodel by itself would not be able to completely explainthe dome (or for that matter, the Kilauea) observations.[27] Campbell et al. [1993] suggested that scattering from
randomly oriented linear edges of surface rocks contributesa dipole component to the scattering. Randomly orienteddipoles and randomly oriented thin cylinders have beenused as a model to explain the observed scattering fromvegetated surfaces [van Zyl, 1985, 1992]. In the limit wherethe cylinders are thin compared to the radar wavelength (aswould be the case if line sources are created by theconcentration of electrical charge at the edges of rocksurfaces), one would expect a linear polarization ratio ashigh as 1/3. Therefore it is conceivable that the edges of the
blocky surfaces such as those present on the Inyo domesmake a significant contribution to the observed linearpolarization ratio. We hypothesize that the total scatteringis the incoherent sum of rough surface and edge scattering.We denote the ratio of the two mechanisms as R:
R ¼ ml0:33� ml
; 0 � ml � 0:33 ð2Þ
The total co-polarized return would be
sohh ¼ sohh rough 1þ Rð Þ ð3Þ
where shh rougho represents the co-polarized return from the
rough surface (‘‘specular points’’) scattering only. Theexpected angular variation in the edge scattering is similarto that observed for a layer of randomly oriented cylinders.Since there is no intrinsic difference in the scatteringgeometry, other than the projection of the incoming waveonto the layer, a cosine variation with angle of incidence isexpected.[28] Using the measured linear depolarization ratios, we
can then calculate the required ratio of the two scatteringmechanisms. The result must be self-consistent in the sensethat we should then be able to use the calculated ratio to findthe expected co-polarized cross section, and this predictionmust be consistent with the observations.[29] We implement the model as follows: we first predict
the specular points scattering contribution, using the field
Figure 8. a) Scattering model results (lines) compared with observations (symbols) for s0. Bold linesand symbols are HH s0 at the three wavelengths; thin lines and open symbols are HV s0. Note that themodel replicates the unusual direct wavelength dependence of HV backscatter (i.e., P and L band exceedC band). b) Scattering model results (lines) compared with observations (symbols) for polarization ratios.Bold lines and symbols are linear polarization ratios, ml, at the three wavelengths; thin lines and opensymbols are circular polarization ratios, mc. Circular polarization trends are well reproduced by the model,though a mismatch in magnitude suggests an unmodeled component may contribute the high mc (seetext).
E03001 PLAUT ET AL.: RADAR PROPERTIES OF SILICIC LAVA DOMES
9 of 12
E03001

measurements of RMS slope at a scale appropriate to thewavelength. To estimate the strength of the edge scatteringreturn relative to that of the specular points, we apply theaverage observed linear polarization ratio to expression (2).We then assign this ratio of scattering strengths to theobservations at 40�, and calculate the value of the edgescattering strength. The strength of the edge scattering atother angles is then easily calculated using the cosine of theangle of incidence. The total radar cross section is then theincoherent sum of the edge returns and the specular pointsreturns.[30] Results and a comparison to the cross-section data
for Obsidian Dome are shown in Figure 8a. The predictedcross sections show very reasonable agreement with theobservations. First, the absolute cross sections are in verygood agreement with the observations, and second, thecross-polarized (HV) returns show the observed directdependence with wavelength. The predicted angular varia-tions are similar to the observations, although the modelseems to over-predict LHH, CHH and CHV at the smallincidence angles. However, the differences only slightlyexceed the accuracy of the absolute calibration of our data.[31] Model results and a comparison to the polarization
data for Obsidian Dome are shown in Figure 8b. Thescattering matrix formulation of the model [van Zyl andUlaby, 1990] allows us to predict both linear and circularpolarization ratios. Because the linear polarization ratio at
40� is used as an input to the model, the modeled ratios atthat angle are required to agree with the observations. Theminimal (flat) angular dependence of the linear polarizationratio is not well reproduced by the model, which predicts anincrease with incidence angle. The predicted circular polar-ization ratios match the trends of the data well, though themagnitudes are slightly higher than observed. We suggestthat an unmodeled component of dihedral (double-bounce)scattering may contribute to the higher observed values ofcircular polarization ratio.[32] The model results suggest that edge scattering plays
a much larger role at the longer wavelengths than does thespecular points scattering, based on the ratio of contribu-tions calculated from the linear polarization ratios in ex-pression (2). This is not unexpected, since for a given blocksize, the specular return would be stronger at C band than Pband because of the larger size relative to the wavelength.At the same time, the block edges may be straightercompared to the P band than to the C band wavelength. AP band scale block edge also will have a broader radiationpattern than a C band scale edge, allowing more P bandenergy to radiate in the backscatter direction than C band fora random collection of edges. This ‘‘forgiving’’ aspect of theradiation pattern at long wavelengths is often observed inAIRSAR images of linear objects such as fence- and power-lines. These effects would tend to reduce the C band edgescattering strength relative to that at P band, and ultimatelyproduce the unusually high cross-polarization cross sectionsat P band.
6. Comparison to Venusian Domes
[33] SAR data acquired at Venus by the Magellan space-craft revealed a class of apparently volcanic landformsreferred to as ‘‘steep-sided’’ or ‘‘pancake’’ domes [Headet al., 1992; Pavri et al., 1992]. Pavri et al. [1992]identified 145 domes, with diameters ranging from 7 to94 km, and heights ranging from 66 m to more than 4 km.Ford [1994] analyzed the radar scattering properties of asubset of 20 of the Venus domes. Using an assumedtopographic profile derived from the spreading of a viscousNewtonian fluid [McKenzie et al., 1992], Ford [1994]adjusted the observed s0 values to ‘‘corrected’’ values, ata local incidence angle derived from the model profile. Thedome surfaces, with bright lineament pixels filtered out,for the most part showed s0 values within 2 dB of theaverage values for all of Venus, which is dominated bysmooth plains surfaces [Pettengill et al., 1997]. The shapeassumption used by Ford [1994] was likely inappropriatefor some of the domes analyzed, based on visual interpre-tation of the morphology (e.g., presence of pits, depressedcentral topography, collapsed margins, etc.). Magellan s0
values measured directly, without resorting to assumptionsof dome shape, provide an appropriate comparison to theterrestrial silicic domes.[34] Figure 9 shows s0 HH values for four typical
Venusian domes, each viewed at two incidence anglesduring the Magellan mission. For comparison, AIRSARLHH and CHH data for the Inyo domes are also plotted.The Magellan S band wavelength (12.6 cm) is bracketed bythe AIRSAR L and C band wavelengths. The Magellanspatial resolution is 100–200 m, with a radiometric accu-
Figure 9. Comparison of backscatter measurements forterrestrial and Venusian domes. Latitude and longitudelocations of the Venus domes are indicated in the legend.Magellan data for Venus are at S band wavelength (12.6 cm),which is bracketed by AIRSAR’s C and L bands. Inyo domesdiffer from Venusian domes in both the magnitude of s0 andthe behavior with incidence angle. Venus domes s0 values aresimilar to or lower than the average Venus surface, whichresembles smooth pahoehoe in s0.
E03001 PLAUT ET AL.: RADAR PROPERTIES OF SILICIC LAVA DOMES
10 of 12
E03001
racy of ±2 dB [Saunders et al., 1992]. The Venusian domesshow s0 values comparable or less than the average Venusscattering law, while the Inyo domes lie 6–12 dB above theVenus average. The Venusian domes also show a substantialdecrease in s0 with incidence angle similar to the averageVenus behavior, whereas the Inyo domes’ s0 values showlittle decrease with angle. The s0 values and scatteringlaws for the Venusian domes (�10 to �20 dB at incidenceangles of 25�–45�) are similar to smooth Hawaiianpahoehoe and lava pond surfaces (see Figure 3d and, e.g.,Campbell and Campbell [1992]). The Venusian domesurfaces do not display any of the extreme roughnesscharacteristics observed in the radar data of the Inyo domes.This suggests fundamental differences in the mechanisms ofemplacement of at least the upper surfaces of terrestrial silicicdomes and Venusian domes. Venusian domes are apparentlydevoid of large (>5 cm) blocks or fractures, indicating that thelava surface was unfragmented and perhaps never coveredwith a stable crust until the final stages of emplacement[Stofan et al., 2000]. Alternatively, the Venusian domesurfaces may have been extensively modified sinceemplacement, but the smoothing of blocky surfaces requiredto produce the observed radar signature seems unlikely.[35] The morphology of Venusian steep-sided domes was
examined by Pavri et al. [1992], Fink et al. [1993], andStofan et al. [2000]. Most domes are highly circular in planview, and typically have steep margins (subject to radarlayover in some instances). Topographic profiles of domescan sometimes be inferred from backscatter variations in asingle image, and Pavri et al. [1992] developed a classifi-cation scheme based on inferred profiles. These classesincluded (inverted) bowl-shaped, flat-topped, shield-like,annular (with a depressed central area), complex, tiered,and fractured. Pavri et al. [1992] found the majority of the145 domes examined were in the first two categories:inverted bowl-shaped or flat-topped. However, a survey of175 domes with diameters >19 km [Stofan et al., 2000], andanalyses of stereo pairs for this study, indicate that the‘‘annular’’ type profile (i.e., concave-up) is at least ascommon as the flat-topped or inverted bowl-shaped types.Some cases were found where stereo data show portions ofthe central depressed areas of domes at similar elevations tothe surroundings. Only two of the domes examined byStofan et al. [2000] showed evidence for elevated centralvent structures that characterize many terrestrial silicicdomes, including the Inyo domes.
7. Discussion and Conclusions
[36] The radar backscattering characteristics of the Inyosilicic lava domes apparently reflect the unique geometricstructure of the surface roughness of the flows. The extremeroughness evident in the field measurements can explainsome of the behavior, such as the negligible decrease in s0
with incidence angle. However, the absolute magnitudes ofs0, and in particular the unusually weak (or even ‘‘direct’’)wavelength dependence, imply that the unique geometry ofthe roughness is also controlling the scattering behavior.While the block size frequency distributions and the esti-mates of fractal dimension extracted from profiling aresimilar in form to other geologic surfaces, we suggest thatthe shape of the blocks themselves (angular, equant, with
smooth sides), and the relative scales of the blocks and theradar wavelengths are the key characteristics responsible forthe unique radar signatures.[37] Our modeling of the scattering mechanism incorpo-
rates a combination of rough surface scattering and scatter-ing from block edges. The ratio of the contributions of thesescattering mechanisms varies as a function of wavelength,with the longer wavelength P and L bands dominated by theedge mechanism. We suggest that radar observations atthese moderately long wavelengths can be used to identifyrough blocky surfaces with characteristics similar to silicicdomes. For example, a dual-polarization P or L band radarsystem could detect the unusually high linear polarizationratios seen only on the dome surfaces (see Figure 4), andthus identify these unique volcanic textures. In terrestrialapplications, such a radar could be used to identify andmonitor actively growing domes to assess volcanic hazards.[38] In summary, our analysis of multiparameter radar
scattering data of silicic dome surfaces, and field measure-ments of surface roughness and block size, indicate thatthese surfaces have characteristics that make them uniqueamong natural geologic surfaces. They are among theroughest natural surfaces ever measured. The scale andshape of the blocks that comprise the surfaces produceradar scattering characteristics unlike those of other lavaflows. In particular, the minimal wavelength dependence ofbackscatter values, the direct wavelength dependence incross-polarization backscatter values, and the high andwavelength-dependent values of polarization ratios distin-guish silicic lava flows from any other natural geologicsurface observed by radar. Comparison of backscatterproperties of terrestrial and Venusian dome surfaces indi-cate that the Venusian surfaces do not display these uniquerough and blocky textures. This suggests fundamentaldifferences in the mechanisms of emplacement; i.e., thatthe Venusian domes’ surfaces were unfragmented andperhaps never covered with a stable crust until the finalstages of emplacement.
[39] Acknowledgments. This work was supported by National Aero-nautics and Space Administration contracts under the Venus Data AnalysisProgram. We again would like to thank the following individuals for fieldassistance: Mark Bulmer, Dave Finnegan, Elke Jahns, Stefanie Lawson,Jennifer Mercer, Denise Neugebauer, Mike Ramsey, Kelly Schoenfield andAdrian Anderson. Thanks also to Bruce Campbell for many discussions andfor a formal review of the manuscript. Mike Shepard is also acknowledgedfor numerous consultations.
ReferencesAnderson, S. W., and J. H. Fink (1990), The development and distributionof lava textures at the Mount St. Helens dome, in Lava Flows andDomes: Emplacement Mechanisms and Hazard Implications, IAVCEIProc. Volcanol., vol. 2, edited by J. H. Fink, pp. 25–46, Springer-Verlag,New York.
Anderson, S. W., and J. H. Fink (1992), Crease structures as indicators ofemplacement rates and surface stress regimes of lava flows, Geol. Soc.Am. Bull., 104, 615–626.
Anderson, S. W., E. R. Stofan, J. J. Plaut, and D. A. Crown (1998), Blocksize distributions on silicic lava flow surfaces: Implications for emplace-ment conditions, Geol. Soc. Am. Bull., 110, 1258–1267.
Arvidson, R. E., M. K. Shepard, E. A. Guinness, S. B. Petroy, J. J. Plaut,D. L. Evans, T. G. Farr, R. Greeley, N. Lancaster, and L. R. Gaddis(1993), Characterization of lava-flow degradation in the Pisgah and Cimavolcanic fields, California, using Landsat thematic mapper and AIRSARdata, Geol. Soc. Am. Bull., 105, 175–188.
Bailey, R. A., G. B. Dalrymple, and M. A. Lanphere (1976), Volcanism,structure and geochronology of Long Valley caldera, Mono County,California, J. Geophys. Res., 81, 725–744.
E03001 PLAUT ET AL.: RADAR PROPERTIES OF SILICIC LAVA DOMES
11 of 12
E03001

Bailey, R. A., R. A. Macdonald, and J. E. Thomas (1983), The Inyo-Monocraters: Products of an actively differentiating rhyolite magma chamber,eastern California, Eos Trans. AGU, 64(18), 336.
Barrick, D. E. (1968), Rough surface scattering based on the specular pointtheory, IEEE Trans. Antennas Propag., 16, 449–454.
Barrick, D. E. (1970), Rough surfaces, in Radar Cross Section Handbook,vol. 2, edited by G. T. Ruck, Plenum, New York.
Bridges, N. T. (1997), Ambient effects on basalt and rhyolite lavas underVenusian, subaerial, and subaqueous conditions, J. Geophys. Res., 102,9243–9255.
Campbell, B. A., and D. B. Campbell (1992), Analysis of volcanic surfacemorphology on Venus from comparison of Arecibo, Magellan andterrestrial airborne radar data, J. Geophys. Res., 97, 16,293–16,314.
Campbell, B. A., and M. K. Shepard (1996), Lava flow surface roughnessand depolarized radar scattering, J. Geophys. Res., 101, 18,941–18,952.
Campbell, B. A., R. E. Arvidson, and M. K. Shepard (1993), Radar polar-ization properties of volcanic and playa surfaces: Applications to terres-trial remote sensing and Venus data interpretation, J. Geophys. Res., 98,17,099–17,113.
Campbell, B. A., D. B. Campbell, and C. DeVries (1999), Surface pro-cesses in the Venus highlands: Results from analysis of Magellan andArecibo data, J. Geophys. Res., 104, 1897–1916.
Cashman, K. V. (1988), Crystallization of Mount St. Helens dacite:A quantitative textural approach, Bull. Volcanol., 50, 194–209.
Cashman, K. V., and B. D. Marsh (1988), Crystal size distribution in rocksand the kinetics and dynamics of crystallization: II. Makaopuhi lava lake,Contrib. Mineral. Petrol., 99, 292–305.
Eichelberger, J. C., T. A. Vogel, L. W. Younker, C. D. Miller, G. H. Heiken,and K. H. Wohletz (1988), Structure and stratigraphy beneath a youngphreatic vent: South Inyo Crater, Long Valley Caldera, California,J. Geophys. Res., 93, 13,208–13,220.
Fink, J. H. (1983), Structure and emplacement of a rhyolitic obsidian flow:Little Glass Mountain, Medicine Lake Highland, northern California,Geol. Soc. Am. Bull., 94, 362–380.
Fink, J. H. (1985), Geometry of silicic dikes beneath the Inyo Domes,California, J. Geophys. Res., 90, 11,127–11,133.
Fink, J. H., and C. M. Manley (1987), Origin of pumiceous and glassytextures in rhyolite domes and lava flows, in The Emplacement of SilicicDomes and Lava Flows, edited by J. H. Fink, Spec. Pap. Geol. Soc. Am.,212, 77–88.
Fink, J. H., N. T. Bridges, and R. E. Grimm (1993), Shapes of Venusian‘‘pancake’’ domes imply episodic emplacement and silicic composition,Geophys. Res. Lett., 20, 261–264.
Ford, J. P., R. G. Blom, J. A. Crisp, C. Elachi, T. G. Farr, R. S. Saunders,E. E. Theilig, S. D. Wall, and S. B. Yewell (1989), Spaceborne radarobservations: A guide for Magellan radar-image analysis, JPL Publ. 89-41, Jet Propul. Lab., Pasadena, Calif.
Ford, P. G. (1994), Radar scattering properties of steep-sided domes onVenus, Icarus, 112, 204–218.
Gaddis, L. R., P. J. Mouginis-Mark, R. B. Singer, and V. H. Kaupp (1989),Geologic analyses of shuttle imaging radar (SIR-B) data of Kilauea Vol-cano, Hawaii, Geol. Soc. Am. Bull., 101, 317–332.
Gaddis, L. R., P. J. Mouginis-Mark, and J. Hayashi (1990), Lava flowsurface textures: SIR-B radar image texture, field observations, andterrain measurements, Photogramm. Eng. Remote Sens., 56, 211–224.
Greeley, R., and L. Martel (1988), Radar observations of basaltic lavaflows, Craters of the Moon, Idaho, Int. J. Remote Sens., 9, 1071–1085.
Haldemann, A. F. C. (1997), Interpreting radar scattering: Circular polar-ization perspectives from three terrestrial planets, Ph.D. thesis, 231 pp.,Calif. Inst. of Technol., Pasadena.
Hapke, B. (1990), Coherent backscatter and the radar characteristics ofouter planet satellites, Icarus, 88, 407–417.
Head, J. W., L. S. Crumpler, J. C. Aubele, J. E. Guest, and R. S. Saunders(1992), Venus volcanism: Classification of volcanic features and struc-tures, associations, and global distribution from Magellan data, J. Geo-phys. Res., 97, 13,153–13,198.
Long, M. W. (1965), On the polarization and wavelength dependence of seaecho, IEEE Trans. Antennas Propag., AP-13, 749–754.
Lou, Y., Y. Kim, and J. J. van Zyl (1996), The NASA/JPL Airborne Syn-thetic Aperture Radar system, in Summaries of the Sixth Annual JPLAirborne Science Workshop, vol. 2, JPL Publ. 96-4, pp. 51–56, JetPropul. Lab., Pasadena, Calif.
Madsen, S. N., J. M. Martin, and H. A. Zebker (1995), Analysis andevaluation of the NASA/JPL TOPSAR across-track interferometricSAR system, IEEE Trans. Geosci. Remote Sens., 33, 383–391.
Manley, C. R., and J. H. Fink (1988), Internal textures of rhyolite flows asrevealed by research drilling, Geology, 15, 549–552.
McKenzie, D., J. M. McKenzie, and R. S. Saunders (1992), Pancakelikedomes on Venus, J. Geophys. Res., 97, 15,967–15,976.
Miller, C. D. (1985), Holocene eruptions at the Inyo Volcanic Chain,California: Implications for possible eruptions in the Long Valley caldera,Geology, 13, 14–17.
Mouginis-Mark, P. J. (1995), Preliminary observations of volcanoes withthe SIR-C radar, IEEE Trans. Geosci. Remote Sens,., 33, 934–941.
Muhleman, D. O., B. J. Butler, A. W. Grossman, and M. A. Slade (1991),Radar images of Mars, Science, 253, 1508–1513.
Ostro, S. J., et al. (1992), Europa, Ganymede and Callisto: New radarresults from Arecibo and Goldstone, J. Geophys. Res., 97, 18,227–18,244.
Pavri, B., J. W. Head, K. B. Klose, and L. Wilson (1992), Steep-sideddomes on Venus: Characteristics, geologic setting, and eruption condi-tions from Magellan data, J. Geophys. Res., 97, 13,445–13,478.
Pettengill, G. H., B. A. Campbell, D. B. Campbell, and R. A. Simpson,(1997), Surface scattering and dielectric properties, in Venus II, edited byS. W. Bougher, pp. 527–546, Univ. of Ariz. Press, Tucson.
Reches, Z., and J. Fink (1988), The mechanism of intrusion of the InyoDikes, Long Valley Caldera, California, J. Geophys. Res., 93, 4321–4334.
Rignot, E. J. (1995), Backscatter model for the unusual radar properties ofthe Greenland ice sheet, J. Geophys. Res., 100, 9389–9400.
Rignot, E. J., S. J. Ostro, J. J. van Zyl, and K. C. Jezek (1993), Unusualechoes from the Greenland ice sheet, Science, 261, 1710–1713.
Sampson, D. E. (1987), Textural heterogeneities and vent area structures inthe 600-year-old lavas of the Inyo volcanic chain, eastern California, inThe Emplacement of Silicic Domes and Lava Flows, edited by J. H. Fink,Spec. Pap. Geol. Soc. Am., 212, 89–100.
Sampson, D. E., and K. L. Cameron (1987), The geochemistry of the Inyovolcanic chain: Multiple magma systems in the Long Valley region, east-ern California, J. Geophys. Res., 92, 10,403–10,421.
Saunders, R. S., et al. (1992), Magellan mission summary, J. Geophys. Res.,97, 13,067–13,090.
Shepard, M. K., R. A. Brackett, and R. E. Arvidson (1995), Self-affine(fractal) topography: Surface parameterization and radar scattering,J. Geophys. Res., 100, 11,709–11,718.
Shepard, M. K., B. A. Campbell, M. H. Bulmer, T. G. Farr, L. R. Gaddis,and J. J. Plaut (2001), The roughness of natural terrain: A planetary andremote sensing perspective, J. Geophys. Res., 106, 32,777–32,795.
Slade, M. A., B. J. Butler, and D. O. Muhleman (1992), Mercury radarimaging—Evidence for polar ice, Science, 258, 635–640.
Stofan, E. R., S. W. Anderson, D. A. Crown, and J. J. Plaut (2000), Em-placement and composition of steep-sided domes on Venus, J. Geophys.Res., 105, 26,757–26,771.
Swanson, S. E., M. T. Naney, H. R. Westrich, and J. C. Eichelberger (1989),Crystallization history of Obsidian Dome, Inyo Domes, California, Bull.Volcanol., 51, 161–176.
Tryka, K. A., and D. O. Muhleman (1992), Reflection and emission proper-ties on Venus: Alpha Regio, J. Geophys. Res., 97, 13,379–13,394.
van Zyl, J. J. (1985), On the importance of polarization in radar scatteringproblems, Caltech Antenna Lab. Rep. 120, Ph.D. thesis, 152 pp., Calif.Inst. of Technol, Pasadena.
van Zyl, J. J. (1992), Application of Cloude’s target decomposition theoremto polarimetric imaging data, Proc. SPIE Conf. Radar Polarimetry, 1748,184–191.
van Zyl, J. J., and F. T. Ulaby (1990), Scattering matrix representation forsimple targets, in Radar Polarimetry for Geoscience Applications, editedby F. T. Ulaby and C. Elachi, pp. 17–52, Artech House, Norwood, Mass.
van Zyl, J. J., H. A. Zebker, and D. N. Held (1987), Imaging radar polar-ization signatures: Theory and observation, Radio Sci., 22, 529–543.
Vogel, T. A., J. C. Eichelberger, L. W. Younker, B. C. Schuraytz, J. P.Horkowitz, H. W. Stockman, and H. R. Westrich (1989), Petrology andemplacement dynamics of intrusive and extrusive rhyolites of ObsidianDome, Inyo Craters volcanic chain, eastern California, J. Geophys. Res.,94, 17,937–17,956.
Zebker, H. A., S. N. Madsen, J. Martin, K. B. Wheeler, T. Miller, Y. Lou,G. Alberti, S. Vetrella, and A. Cucci (1992), The TOPSAR interfero-metric radar topographic mapping instrument, IEEE Trans. Geosci.Remote Sens., 30, 933–940.
�����������������������S. W. Anderson, Department of Science, Black Hills State University,
USB9102, Spearfish, SD 57799, USA.D. A. Crown, Planetary Science Institute, 1700 East Ft. Lowell Road,
Tucson, AZ 85719, USA.J. J. Plaut and J. J. van Zyl, Jet Propulsion Laboratory, California Institute
of Technology, 4800 Oak Grove Drive, Pasadena, CA 91109, USA.([email protected])E. R. Stofan, Proxemy Research, P.O. Box 338, Rectortown, VA 20140,
USA.
E03001 PLAUT ET AL.: RADAR PROPERTIES OF SILICIC LAVA DOMES
12 of 12
E03001