Embed Size (px)
Citation preview

THE UNITED REPUBLIC OF TANZANIA
MINISTRY OF WATER
LAKE NYASA BASIN WATER BOARD
BASIN ANNUAL HYDROLOGICAL REPORT
NOV.2012 – OCT.2013
LAKE NYASA BASIN WATER BOARD
P.O. BOX 240
TUKUYU
Tel: +255 25 255 2250
Fax: +255 25 255 2350
E-mail: [email protected]
Website: www.lakenyasabasin.com JANUARY, 2014

i
TABLE OF CONTENTS
EXECUTIVE SUMMARY ………………………………………………………………………………………………………………1
1.0 GENERAL INTRODUCTION ............................................................................................................... 4
1.1 Objectives of the Report ..................................................................................................................... 4
1.3 Physiography ....................................................................................................................................... 4
1.3.1 Topography .................................................................................................................................. 4
1.3.2 Geomorphology ........................................................................................................................... 5
1.3.3 Drainage Patten ............................................................................................................................ 6
1.3.4 Land Use/Cover ........................................................................................................................... 6
1.3.5 Soils.............................................................................................................................................. 7
1.4 Main Features in the Basin.................................................................................................................. 7
2.1.1 Data Management ..................................................................................................................... 17
2.1.3 Processing of Data ..................................................................................................................... 17
2.2 Rivers water level Data ..................................................................................................................... 18
2.3 Water Quality Data ........................................................................................................................... 21
2.4. Data Management ........................................................................................................................ 22
2.4.1 Temporal and Spatial Coverage of Measuring Stations ............................................................. 23
2.4.2 Water Quality Management ....................................................................................................... 23
2.5 Lake Nyasa information .................................................................................................................... 23
2.6 Groundwater Data ............................................................................................................................. 23
2.6.1 Data Management ...................................................................................................................... 24
2.6.2 Temporal and Spatial Coverage of Borehole/Groundwater Stations ......................................... 24
2.6.3 Processing of Data ..................................................................................................................... 24
2.7 Water Use/Abstraction Data ............................................................................................................. 24
ii
2.7.1 Data Management ...................................................................................................................... 24
2.7.2 Temporal and Spatial Coverage of Water Use/Abstraction Points ............................................ 25
2.7.3 Processing of Data ..................................................................................................................... 25
3.0 HYDROLOGY OF THE BASIN ......................................................................................................... 26
3.1 Climate .............................................................................................................................................. 26
3.2 Runoff Distribution ........................................................................................................................... 26
3.3 Sediment Transport ........................................................................................................................... 26
3.4 Water Storage .................................................................................................................................... 27
3.5 Groundwater Occurrence .................................................................................................................. 27
3.6 Pollution sources ............................................................................................................................... 27
4.0 WATER AVAILABILITY AND UTILIZATION IN THE BASIN .................................................... 28
5.0 GENERAL REMARKS AND WAYFORWARD.......................................................................... 28

iii
Tables
Table 1.1: Area of each country in Lake Nyasa Basin………………………………………….……………………4
Table 2.1: shows statistical water use customers...........................................................................25
Figures
Figures 2.1(b):Tenende monthly total rainfall for (Nov.2011-Oct.2012) annual hydrological
year………………………………………………………………………………………………12
Figures 2.1(a): Tenende monthly total rainfall for (Nov.2012-Oct.2013) annual hydrological
Year………………………………………………………………………………………………12
Figure 2.2(b): Unyamwanga monthly total rainfall for 2011-12 and 2012-13 annual hydrological
year……………………………………………………………………………………………….13
Figure 2.2(a): Unyamwanga monthly total rainfall for 2011-12 and 2012-13 annual hydrological
year………………………………………………………………………………………………13
Figure 2.3(b):Madaba monthly total rainfall for (Nov.2011-Oct.2012) annual hydrological
year………………………………………………………………………………………………14
Figure 2.3(a):Madaba monthly total rainfall for (Nov.2012-Oct.2013) annual hydrological
year………………………………………………………………………………………………14
Figure 2.4(b): Masigira monthly total rainfall for (Nov.2011-Oct.2012 ) annual hydrological
year……………………………………………………………………………………………….15
Figure 2.4(a): Masigira monthly total rainfall for (Nov.2012-Oct.2013) annual hydrological
year……………………………………………………………………………………………….15
Figure 2.5 (b): Ileje Maji yard monthly total rainfall for (Nov.2011-Oct.2012) and 2012-13
annual hydrological year………………………………………………………………………...16
Figure 2.5 (a): Ileje Maji yard monthly total rainfall for (Nov. 2012-Oct.2013) annual
hydrological year………………………………………………………………………………...16
Figure 2.6: Kiwira River water level at Ipyana………………………………………….…….....18
Figure 2.7: Ruhuhu river water level at Masigira (upstream)…………………………….……...19
Figure 2.8: Ruhuhu River water level at Kikonge (down stream)…………………………..…...19
Figure 2.9 (a): Lake Nyasa water level at Itungi Port (Nov.2012-Oct.2013)…………………....20
Figure 2.9 (b): Lake Nyasa water level at Itungi Port (Nov.2011-Oct.2012)…….……….…..…20

iv
Plates
Plate 1.1; show Ngozi Crater Lake……………………………………………………………......9
Plate 1.2; show Kaparogwe Falls ……………………………………………………………..….9
Plate 1.3; show the Natural Bridge (Bridge of God)…………………………………………….10
Plate 1.4; show the Lake Masoko………………………………………………………………..10
Plate 2.2: A washed gauge stuff due to flash flood at Luhekei river at Nangombo (March,
2013)……………………………………………………………………………………………..21
Plate 2.1: construction of Water level gauging station Lufilyo at Ipinda
(Downstream)………………………………………………………………….………………...21
Plate 2.3:Coal transportation at Lake Nyasa at New Kiwira port in Kyela district………………….23
ANNEXES....................................................................................................................................24

1
EXECUTIVE SUMMARY
The Lake Nyasa Basin has plenty of water sources which are greatly found through springs,
rivers, wetlands, reservoirs and lakes. The basin receives heavy annual precipitation for both its
surface and groundwater. Most of the rivers are perennially flowing into Lake Nyasa. During this
reporting period the basin has experienced moderate rainfalls in most part of the basin. Data have
been collected at different operating hydrometric and rainfall stations distributed in the basin.
During this reporting period rainfall has been recorded ranging between 900-2300mm per
annum. Normal rainfall ranges between 1000-2800mm per year. This indicates that rainfall was a
little bit below normal average. Day temperatures experienced an average of 12- 21oC during
rainy season, while 19 - 28 o
C during dry season. The onset of the rain season has become
unpredictable while the long dry spells within the rain season has increased across the basin.
Since the basin has much water from the rivers which flow throughout the year the population is
easily getting water, but most areas they lack proper technology only to gain an improved water
supply. But most of these perennial rivers their amount of water keep decreasing especially
during dry season. Lake Nyasa and rivers water levels recorded indicate the situation of this
year. However, there was discharge measurements computed from Lilondi river at Lingatunda
falls, Mngaka river at Paradiso, Lutukira at Litumbandyosi (tributaries of Ruhuhu river), Luswisi
river at Bwenda (a tributary of Kiwira river), Kiwira river at Natural Bridge, Kiwira river at
Kiwira Village, Chiwindi river at Mtupale, Mbawa river at Mkali, Songwe river at Kasumulu.
Other discharge measurement were conducted on spot gauging for the purpose of water
allocation, see the annex-vi below.
Lake Nyasa is a big water body in the SADC region and has an outlet of Shire river only towards
Zambezi river basin. Lake Nyasa on Tanzania side receives inflow from rivers which contribute
about 59%, compared to shared countries of Mozambique and Malawi. A portion of 2%
catchment area Tanzania contribute to Zambezi River basin, while 11.3% volume of water
through Shire River.
Generally the Water quality in Lake Nyasa Basin has remained normal due to most sources of
pollution are originated from agrochemicals, industry, municipal waste waters, disposal of solid
waste etc.
Lake Nyasa Basin has 38 hydrometric stations (35 are River gauges and 3 are Lake Level
gauges), all stations are operational; 6 Meteorological stations were constructed and
rehabilitated, but only 4 Meteorological stations are working fully; 4 Automatic rainfall stations
were constructed, but only 3 are in operational, 12 manual rainfall are existing and operating.

2
Rainfall is a primary source of freshwater in the basin and most of the rural communities, who
make the majority, also depend directly on water in rivers, wetlands and Lakes for domestic
water supply and income generating activities. A changing climate will affect all aspects of life
in the basin in which the majority of farmers depend on rain-fed agriculture for their livelihoods.

3
4
1.0 GENERAL INTRODUCTION
1.1 Objectives of the Report
In Hydrological aspect of the basin offers the best opportunity as an appropriate unit, for
analytical and coordinated water resources management. The information collected enable in
decision making, planning and development in the basin.
1.2 Location of the Basin and Administrative Units
Lake Nyasa Basin is a trans-boundary basin and is located between coordinates 90S to 12
0S
latitudes and 330E to 36
0E longitudes in the southern highlands of Tanzania. Lake Nyasa basin
encompasses all land whose rivers drain water into Lake Nyasa. The main rivers that pour their
water into Lake Nyasa from the Tanzania side with respective catchment sizes include Ruhuhu
(13,490Km2), Songwe (3550 Km
2), Kiwira (1660 Km
2), Rufirio (1350 Km
2), and Lumbira (1414
Km2). Other river systems include Mbaka, Nkiwe, Malisa, Mnyamaji, Mbawa, Luika, Luhekei
and Mchuchuma. Administratively, there are twelve (14) districts, in three regions of Mbeya,
Njombe and Ruvuma regions all of which fall partially within Lake Nyasa Basin. Districts falling
fully into Lake Nyasa basin are Rungwe, Kyela, Ileje, in Mbeya region, Ludewa in Njombe
region. Districts with partial coverage into Lake Nyasa include Mbozi (10%), Mbeya Rural (6%),
Makete (about 80%), Njombe (about 45%), Songea (50%), Mbinga (about 50%), Nyasa (80%),
Momba (8%), Wanging’ombe (5%) and Namtumbo (20%). The population is estimated to be 2.2
million inhabitants
1.3 Physiography
1.3.1 Topography
Lake Nyasa Basin forms the south-west part of Tanzania with common borders of
Mozambique and Malawi territories. The total area covered is approximately 165,109
Km2 (inclusive of lake waters (33,457 Km
2), land area (131,652 Km
2) distributed as
follows:-
Table 1: Area of each country in Lake Nyasa Basin
Land Area
Total Area
Km2
Part of Total area (Km2)
Malawi Tanzania Mozambique
131,652 89,745 39,140 2,767
Lake Area 33,457 19,372 8,105 5,980
Total 165,109 109,117 47,245 8,747
The Tanzania portion of the basin is 47,245 Km2). The basin is generally mountainous
and hilly, with Rungwe, Kipengere mountains being the highest over 2,000 metres above

5
sea level. The lowest land is around the Lake Nyasa which is 470 metres above sea level
on the average. The mountainous areas of Ruvuma region are of lesser altitudes than
those of Njombe and Mbeya regions and most of the region is covered by undulating
hills.
The characteristic features of the basin, apart from the Rift Valley system, are the
surrounding uplifted and warped plateaus, covering nearly 90 percent of the total basin
area. The plateaus represent by far the most common land form. They are separated by
fault-lines and erosion scarps, and is the result of steady erosion that has taken place since
the late Jurassic period.
The oldest plateaus are found at the highest levels from 1800 to 2700 m above sea level
(i.e. the Mporoto and Kipengere ranges ) the remaining parts of the basin is occupied by
areas where deposition of the material has taken place notably in the Rungwe Volcanic
and around Rungwe district.
The Rungwe Volcanic, with the Rungwe Mountain (2960 m.a.s.l.) as its centre of
eruption, forms an area of pronounced topographical relief. The craters, lava flows and
volcanic ash covers make the volcanic area completely different from the rest of the
Basin.
1.3.2 Geomorphology
Most of the Basin consists of African Land surface with Gondwana remnants being found
in the higher areas of Songea and Mbinga districts. Towards Lake Nyasa, Congo surfaces
are found with also some scraps in the north of Mbinga and Songea districts. The Karoo
formation of the Basin (i.e. north Songea, Ludewa, Ileje, Rungwe and Kyela) is of
particular geomorphologic interest since the easily eroded rock system result in
permeable sub-strata and high aquifer recharge.
About 68 percent of the basin area is underlying by crystalline rocks belonging to the
Basement Complex. The remaining 32 percent is underlying by sedimentary rocks of the
Karroo System and (volcanic formation) mainly of Neogene age.
Intensive in-situ chemical weathering by circulating groundwater has produced a thick
mantle of overburden across the plateaus. This overburden in some places effectively
masks the exact geological nature of the underlying rocks, as well as their tectonic and
structure features.
At an early stage of the study, it became apparent that in the basement complex,
groundwater occurred in the lower part of the in-situ weathered rock zone, and that the
distribution of the landforms played an important role in determining the hydrogeological
conditions. The factors controlling the hydrogeology of the basement complex were
therefore found to be uniquely related to the geomorphology of the given area, and by
6
means of a geomorphologic classification it became immediately possible to describe
qualitatively the groundwater conditions of the most area. The description would become
complete once enough borehole data will be available to express the groundwater
occurrences in quantities terms.
1.3.3 Drainage Patten
The major rivers that drain into Lake Nyasa are Ruhuhu (13,490Km2), Songwe (3550
Km2), Kiwira (1660 Km
2), Lufilyo (1350 Km
2), and Lumbira (1414 Km
2) – (The
numbers in the brackets are the catchment areas in Km2). Which through the Shire and
Zambezi rivers is connected to the Indian Ocean the surface runoff pattern in the Basin
corresponds rather closely to the general unimodal rainfall pattern. Streams starts rising
in November-December, experience a maximum flow in March-April, and have their
recession period from May to October-November with annual rainfall below 500-800
mm and the mean annual runoff is generally below 2 l/s/km2. At the other part of the
Basin where annual rainfall is in the range of 1000-2500 mm, streams and rivers are
perennial, and the mean annual runoff exceeds 10 l/s/km2. Exceptional high mean annual
runoff can be found in areas like Kiwira River (40 l/s/km2) from the 1660 km
2 catchment
at Kyela.
1.3.4 Land Use/Cover
Although large areas of the Basin are now cultivated, the vast majority of the land is still
covered by natural vegetation.
The most predominant natural vegetation in the Basin is the ‘Miombo’ woodland, which
is associated with rainfall between 800 and 1200 mm per annum, and covers most of the
soil groups, with the exception of very alkaline and poorly drained soils.
Areas with high rainfall (1500mm to 2800mm) like the Rungwe, Makete and Kyela
districts, support forests. In a few of these areas are primeval rainforest still exists, but in
most places extensive deforestation has taken place for agriculture and Human settlement
(Social-economical activities) purposes.
Rainfall regime is a dominating factor also with respect to land use and vegetation
patterns. Distribution of the main cultivation areas is to a large extent determined by soil
fertility and water availability, and it is characteristic that the agriculture areas in the
Basin coincide with areas of high rainfall.
In order of importance the main Crops grown in the Basin are: maize, wheat, beans,
bananas cassava and paddy. Cash crops grown in the Basin are: tea, tobacco, pyrethrum,
wattle, cocoa, coffee and cashews. Cash crops are generally cultivated on plantations,
whereas food crops are grown on smaller individually held plots, often on a rotation basis

7
with some land tracts lying fallow for a number of years to be cleared again when needed
for further cultivation.(slash and cut cultivation ).
1.3.5 Soils
The soils of the Basin are generally well drained sands, clays, loams and mixtures of
these. Only one place is characterized by imperfect or poor drainage and the flood plains,
north of the Basin in Kyela District.
Eight different soils classes have been identified for Tanzania as a whole, of which all
eight are found in the Basin. This classification relates to the soils texture of the upper 30
cm of the profile. The most predominant classes in Tanzania are loamy, sand and sand
loamy. These are also the most common classes in the Basin.
The areas of highest elevation, the Mporoto and the Kipengere ranges with their well-
drained loamy soils, the Mbeya and hilly areas of western Ruvuma Region with a soil
cover of clayey loam with good drainage constitute the best agriculture lands in the basin.
Other soil classes such as sands, sand clay loams, sandy clays and clays make up smaller
portions of the Basin.
1.4 Main Features in the Basin
The Lake Nyasa Basin is the wettest basin in the country with an average of 1500 mm
rain per annum. The basin has water sources like springs, wetlands, streams, crater lakes,
rivers and groundwater has been identified in some parts of the basin. The main rivers in
the basin are Ruhuhu, Songwe, Kiwira, Mbaka, Rufirio, Nyitule, Lumbira, Nkiwe,
Mchuchuma, Luhekei, Mbawa and Mwinamaji. These are perennial rivers.
There is abundant energy potential in the basin. Further, there is about 1057.81MW of
firm hydropower (Apart from Coal and Hydrothermal sources) in the Kiwira 18MW
(Rungwe), Rumakali 222MW (Makete), Ruhuhu 192MW (Songea), Songwe River
600MW (Ileje), Kitewaka 25.81M (Ludewa) etc.
Lake Nyasa is one of the centres for fish bio-diversity in the world. The breeding areas in
the Songwe River are peculiar because the fish species that traditionally do not breed in
rivers are also breeding there. The observation that Cichlidae and Bagridae species are
also spawning there is of particular interest for conservation of the species.

8
KITULO NATIONAL PARK
It is the first park in Tropical Africa, which is popular in its primary floristic significance.
Kitulo National Park covers an area of 412.9 sq km situated between the Livingstone and
Uporoto range in Lake Nyasa Basin, partly in Njombe and Mbeya regions. Also known
locally as Bustani ya Mungu (God's garden). Much of the plateau lies above 2500-3000
m.a.s.l.
Kitulo is one of the greatest flora spectacles in the world, also had over 350 species of
endemic wildflowers, including 45 species of terrestrial or orchids alone, many found
nowhere else in the world; 31 of which are unique to the Kipengeres.
Tanzania endemics, 16 are endemic to the Kitulo region; at least three species are
endemic to the plateau itself; and two more are found only on the plateau and in the
adjoining forests.
In the rainy seasons, the plateau erupts in a glorious show of color, which apart from its
intrinsic beauty, also attracts breeding colonies of rare important bird species, again many
endemic to Tanzania including the pallid harnieor, Njombe Cisticola and Kipengere seed-
eater, while some of the world's rarest butterflies also inhabit the area. The park is also
home to lion, leopard, buffalo and antelope, to name but a few.
NGOZI CRATER LAKE
Lake Ngozi in Lake Nyasa Basin is the second largest Crater Lake in Africa.
Ngozi Crater Lake is a sight of outstanding natural beauty and a superb hiking location. A
green shimmering Lake walled by the collapsed caldera of the extinct Ngozi Volcano.
The peak of Ngozi is 2,620m and is the highest point of the Mporoto Ridge Forest
Reserve. The forest has an endemic three horned chameleon (Chameleo fuelleborni).
Ngozi Crater Lake is a spectacular volcanic lake located in the Mporoto Ridge Forest
Reserve. Often shrouded in mist above the lake is Ngozi Peak, at 2620 m, the highest
elevation in the Mporoto Ridge Forest Reserve and on the caldera wall.
The Ngozi Crater Lake is located in the east of Mporoto Ridge Forest Reserve. The forest
reserve has an area of about 9332 hectares, and is located at 80 58’- 9
0 05’S and 33
026'-
33036'E with altitudes ranging from 1750-2620 m. The crater is roughly 40 km southeast
of the Mbeya city. It is accessible by a dirt road in the dry season; in the wet it can be
difficult. The lake is reached by one hour hike through the forest.

9
Ngozi Crater Lake
Ngozi is another million year old volcano that can be climbed. The centre of this volcano
collapse and has later been in filled by the Ngozi Crater Lake.
Plate 1.1; show Ngozi Crater Lake
Kaporogwe Falls
Where the Kiwira River hurls itself over a ledge of basalt lava, you find one of the most
impressive waterfalls of the Rungwe area, the Kaparogwe falls.
Plate 1.2; show Kaparogwe Falls
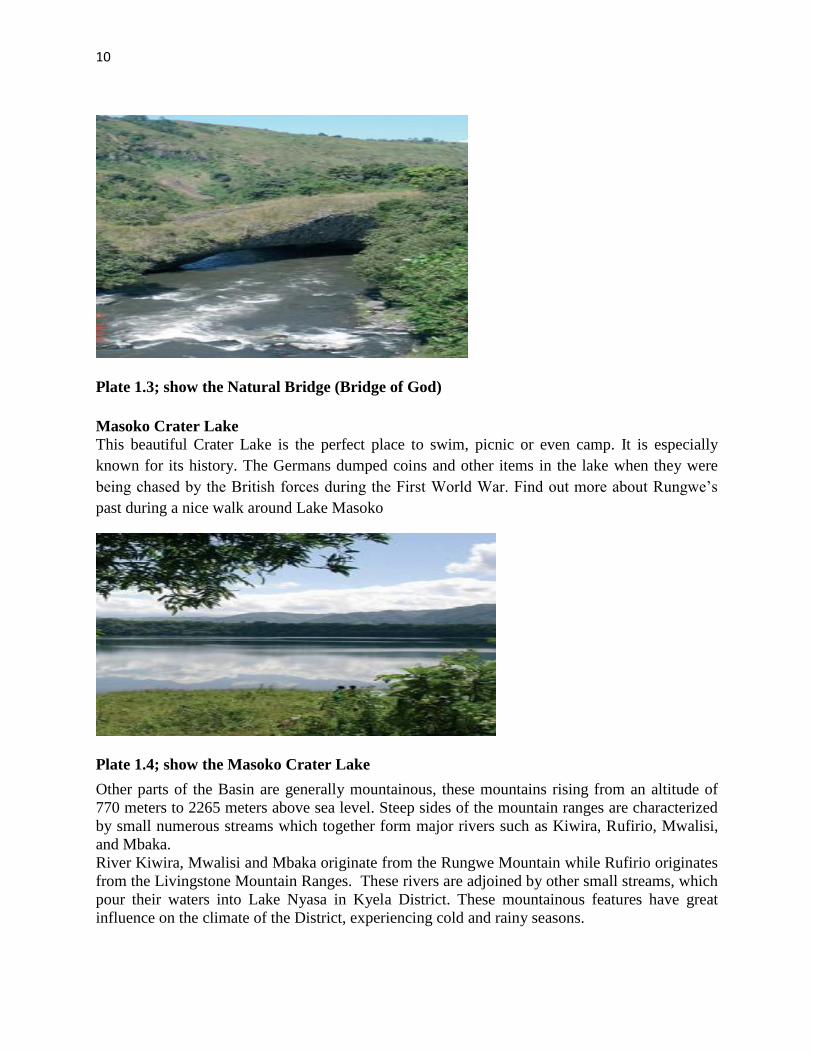
The Natural Bridge (Bridge of God)
In the Kiwira valley you can find a famous local attraction; the Bridge of God (Daraja la
Mungu).A huge, probably millions of years old rocks, forms a natural bridge that crosses the
river This ‘bridge’ is only one of the attractions here Just a few kilometers up the valley is the
where the Kiwira river falls into cooking pot’ a seething cauldron or sump, and the Marasusa
falls
10
Plate 1.3; show the Natural Bridge (Bridge of God)
Masoko Crater Lake
This beautiful Crater Lake is the perfect place to swim, picnic or even camp. It is especially
known for its history. The Germans dumped coins and other items in the lake when they were
being chased by the British forces during the First World War. Find out more about Rungwe’s
past during a nice walk around Lake Masoko
Plate 1.4; show the Masoko Crater Lake
Other parts of the Basin are generally mountainous, these mountains rising from an altitude of
770 meters to 2265 meters above sea level. Steep sides of the mountain ranges are characterized
by small numerous streams which together form major rivers such as Kiwira, Rufirio, Mwalisi,
and Mbaka.
River Kiwira, Mwalisi and Mbaka originate from the Rungwe Mountain while Rufirio originates
from the Livingstone Mountain Ranges. These rivers are adjoined by other small streams, which
pour their waters into Lake Nyasa in Kyela District. These mountainous features have great
influence on the climate of the District, experiencing cold and rainy seasons.

11
1.5 Geology
The rocks found in the Basin can be divided by their geological age in three main groups:
Neogene deposits, Karoo sediments and pre-Cambrian rocks
The pre-Cambrian rocks are collectively referred to as the Basement Complex and they occupy
roughly 68 percent of the Basin. They are, therefore the most important geological unit, and the
majority of the water supply from the groundwater in the Basin will inevitably have to be derived
from these rocks. A water supply from groundwater in the Basin would for a large part depend
on the Karroo Rocks, Neogene rocks of the Rungwe Volcanic Province and Neogene Lake
deposits the stratigraphy and the local distribution of the major rock type and rock groups in the
region.
1.6 Social-economical Characteristics of the Basin
The whole basin has reliable rainfall; most of the soils are suitable for Agriculture. Main
economic activities are agriculture over 80% of the population. Major food crops are maize,
beans, Soya beans, potatoes, sweet potatoes, bananas and wheat. Cash crops are tea, coffee, Soya
beans, groundnuts, wheat and rice. Other activities like fishing, livestock keeping, artisanal
mining, tourism and petty businesses are taking place also. Generally the economic condition of
the people in the basin is poor although there is high opportunity for Development.
Since poverty reduction has a high priority it is important that the linkages between sustainable
basin management and poverty reduction are made very clear in the plan to ensure effective
engagement of all stakeholders. The area of the Basin is 47,245 Km2 with a population of around
2.2 million people of which 90% lived in rural areas.
Peasant agriculture is the backbone of the Basin’s economy. It seems probable that around 85%
of the population in the Basin is dependent on agriculture for their main source of livelihood.
Approximately one-third of the total land area in the Basin is of medium to high fertility and
receives adequate rains. Thus the natural resource endowment is favorable for a wide range of
agriculture activities.
Livestock is kept for a number of economical and culture reasons. The live-stock population is
not known with any degree of accuracy. Official figures indicate that by 1978 there were
850,000 cattle; 69,000 sheep; and 101,000 thousand goats. Livestock is not very important for
the peasant economy in the Basin. The main crops in the rain lands are maize, beans, pyrethrum,
tea and wheat. Maize is grown everywhere. Surpluses are consistory produced but transport of
the crop out of the area is a major problem: the roads are very bad.
The wet highlands zones, covers most of the district of Rungwe and the southern part of Ileje
district. Most of the zone receives an annual rainfall between 1300 mm and 2500 mm.
topographically; this zone varies from the low foothills bordering Kyela to mountainous areas
12
with altitudes up to approximately 2000 m.a.s.l. The best land is occupied by large tea estates
and coffee plantations.
The lake shore zone: Apart from the easternmost part of the district the whole of this zone is
equivalent with Kyela district. The zone covers approximately 850 km2. It is a broad flood plain
with four great rivers draining into Lake Nyasa. The mean annual rainfall is more than 2500 mm.
Every year from March and April large areas near the lake is flooded. The flood in particular and
the heavy rain in general influence the health situation adversely. Since 1978 cholera has been
endemic and often outbreaks of cholera occur. Bilharzias and malaria are widespread throughout
the Basin for the whole year.
2.0 HYDROLOGICAL DATA
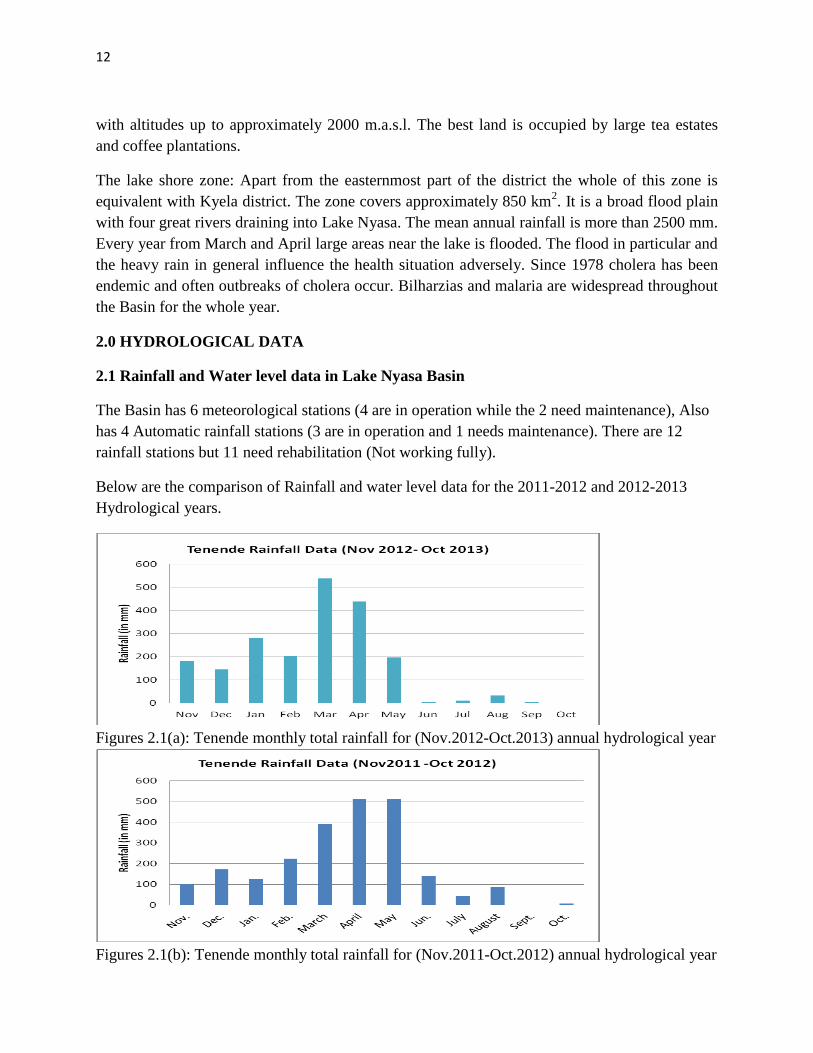
2.1 Rainfall and Water level data in Lake Nyasa Basin
The Basin has 6 meteorological stations (4 are in operation while the 2 need maintenance), Also
has 4 Automatic rainfall stations (3 are in operation and 1 needs maintenance). There are 12
rainfall stations but 11 need rehabilitation (Not working fully).
Below are the comparison of Rainfall and water level data for the 2011-2012 and 2012-2013
Hydrological years.
Figures 2.1(a): Tenende monthly total rainfall for (Nov.2012-Oct.2013) annual hydrological year
Figures 2.1(b): Tenende monthly total rainfall for (Nov.2011-Oct.2012) annual hydrological year

13
Tenende Rainfall station is located in Kyela district, the figures above showing the trends of
rainfall in 2011-12 was a little bit more compared with 2012-13. Kyela district is one of the
districts which receiving more rainfall, other districts are Rungwe and Makete
Figure 2.2(a): Unyamwanga monthly total rainfall for 2011-12 and 2012-13 annual hydrological
year
Figure 2.2(b): Unyamwanga monthly total rainfall for 2011-12 and 2012-13 annual hydrological
year
Unyamwangwa rainfall station located in Rungwe district, Rungwe district is among three
district experince more rainfall per year. The figures above indicate the decrease of rainfall on
this reporting annual hydrological years compared with last hydrological year.

14
Figure 2.3(a):Madaba monthly total rainfall for (Nov.2012-Oct.2013) annual hydrological year
Figure 2.3(b):Madaba monthly total rainfall for (Nov.2011-Oct.2012) annual hydrological year
Madaba rainfall station located in Songea the figures above showing the decrease in this
reporting time, i.e see the November 2011 the rainfall approximately to 100mm while the same
November 2012 shown approx. 50mm. and January 2011 have approx. 400mm of rainfall while
January 2012 have 300mm of rainfall.

15
Figure 2.4(a): Masigira monthly total rainfall for (Nov.2012-Oct.2013) annual hydrological year
Figure 2.4(b): Masigira monthly total rainfall for (Nov.2011-Oct.2012 ) annual hydrological year
The Masigira rainfall station is in Songea district but is located very close to the border between
Songea and Ludewa districts, the trends of rainfall for year 2011-12 and 2012-13 shown a
change for months of December, January , February, May and June. Although the December
2012 show more rainfall record than December 2011, but the May, June and October of 2012
received rainfall while the respective months for 2013 do not have rainfall.

16
Figure 2.5 (a): Ileje Maji yard monthly total rainfall for (Nov. 2012-Oct.2013) annual
hydrological year
Figure 2.5 (b): Ileje Maji yard monthly total rainfall for (Nov.2011-Oct.2012) and 2012-13
annual hydrological year
The Ileje Maji Yard station is located in Ileje district, For November , Febrauary and March of (2011-
2012) shown more rainfall than the respectively months in (2012-2013).
Findings
The above Figures demonstrate the rainfall tendency which indicate the decreases of rainfall in this
reporting Period. The causes of this impact might be resulted from the several reasons but commonly is
Environmental degradation which result to Climate change and global changes impacts. As this early
warning instruments alarming to take important measures to overcome more impact.

17
2.1.1 Data Management
Management of climatic data involves several interdependent stages which include the
following:
(a) Data Collection: The data is collected from the network of meteorological stations spread
across the Basin.
(b) Transmission: The data is then transmitted to the Basin Headquarter located at Tukuyu-
Mbeya Region at monthly interval and other operational time-scales, mainly by Mobile phone
and by gauge reader themselves.
2.1.2 Temporal and Spatial Coverage of Measuring Stations
(i) Daily rainfall data
Rainfall data is obtained from all categories of climate stations in addition to the rainfall stations
operated by individuals’ organizations. Now, there are 12 rainfall stations, although not all
maintain an uninterrupted reporting programme during any given year.
About 6 weather stations and 4 Automatic rainfall stations that operated during this reporting
period some useful records were collected.
(ii) Other surface data
This is mainly due to other Meteorological Stations which measures daily maximum and
minimum temperature, Relative Humidity, Atmospheric Pressure, Evaporation and Wind speed
from 3 meteorological stations with varying record lengths. During this reporting time we
couldn’t able to have such parameters and this was caused by some problems brought by the
instrumentations/ devices which were not configured before and on station called Madaba
experience a vandalism of solar power panel and Battery.
2.1.3 Processing of Data
At the data centre, the data is first checked for completeness and obvious errors before being
entered to a computer based digital database (Hydata or Microsoft Office Excel) and currently
the database started to be shifted to Lake Nyasa Decision Support System (LNBDSS). This stage
includes concurrent quality control done during the data-entry sessions, and a dedicated
validation process done after data-entry.
The data that have gone through data-entry, quality control and validation are kept offline, for
security purposes, in a systematic manner.
As needed, data that are online or purposefully brought back online are retrieved in a variety of
customized formats for use within and outside the Basin.
18
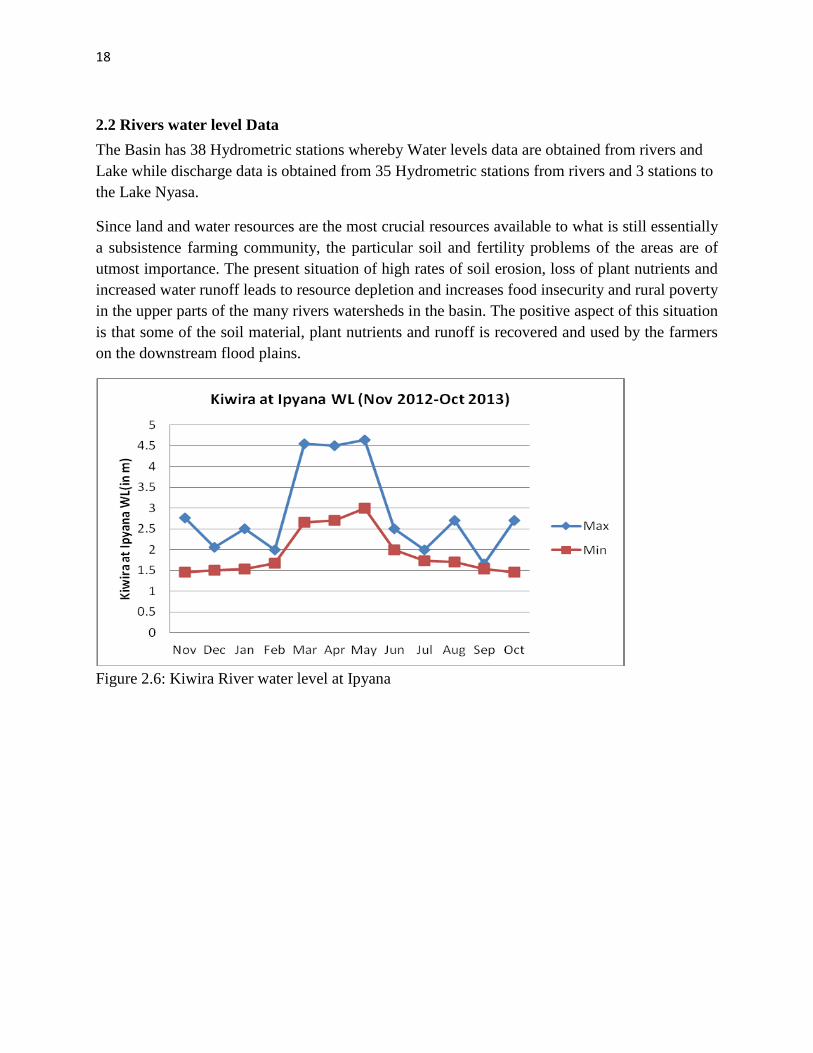
2.2 Rivers water level Data
The Basin has 38 Hydrometric stations whereby Water levels data are obtained from rivers and
Lake while discharge data is obtained from 35 Hydrometric stations from rivers and 3 stations to
the Lake Nyasa.
Since land and water resources are the most crucial resources available to what is still essentially
a subsistence farming community, the particular soil and fertility problems of the areas are of
utmost importance. The present situation of high rates of soil erosion, loss of plant nutrients and
increased water runoff leads to resource depletion and increases food insecurity and rural poverty
in the upper parts of the many rivers watersheds in the basin. The positive aspect of this situation
is that some of the soil material, plant nutrients and runoff is recovered and used by the farmers
on the downstream flood plains.
Figure 2.6: Kiwira River water level at Ipyana

19
Figure 2.7: Ruhuhu river water level at Masigira (upstream)
Figure 2.8: Ruhuhu River water level at Kikonge (down stream)

20
Water level situation for Lake Nyasa at Itungi Port (Nov. 2011-Oct. 2012 and Nov.2012-
Oct.2013)
Figure 2.9 (b): Lake Nyasa water level at Itungi Port (Nov.2012-Oct.2013)
Figure 2.9 (b): Lake Nyasa water level at Itungi Port (Nov.2011-Oct.2012)
The water level of Lake Nyasa drop down as the data of water level on figures above
illuminating the turn down of Lake water level as campared with the last annual hydrological
year (2011-2012). This indicated the low rainfall which result to low inflow into rivers. The
Figure 2.9(b) shown Maximum water level was recorded in May 2012 approximate to 7m in
2011-2012, while 6.5m was recorded in May, (2012-2013).

21
Plate 2.1: construction of Water level gauging station Lufilyo at Ipinda (Downstream)
Plate 2.2: A washed gauge stuff due to flash flood at Luhekei river at Nangombo (March, 2013)
2.3 Water Quality Data
The surface water quality in the Basin is polluted through 5 categories namely agriculture
(sediments), agrochemicals, settlements pollution, industrial and mining (chemicals and
siltation). The monitoring of water quality is done to ensure the quality of water in the rivers and
lake is as per recommended standards.
The Basin has pointed out 15 Water Quality and 7 Pollution monitoring stations located at the
rivers and the lake. During this reporting period about 30 Water samples were collected from 6
Water Quality and 4 Water monitoring control pollution stations.

22
2.3.1 Water Sampling
This reporting Hydrological year some of the Water quality stations were sampled and analysed
including a spots area for determination of point sources of pollution. The procedure of water
quality monitoring, covers a total of six water samples being collected and analyzed for both on-
site and latter at Mbeya Zonal Water Quality Laboratory. The samples were for bacteriological
examination (Pyrex 250ml glass bottles) and 1000ml plastic bottles for Physical and Chemical
analysis.
Analytical procedures for 24 parameters, 144 tests and data recording were also among our
responsibility for this vulnerable exercise. The chosen locations for water sampling were Songwe
River (at Kasumulu), Itungi port (at Lake Nyasa), Kiwira River (at Ipyana hyro met), Lufilyo
River (at Ipinda), Mbaka River (at Mwaya) and Mambwe Stream (Mbambo intake). The pictures
on annex below shows water sampling activity to various sampling sites for more water quality
results.
Plate 2.3:Coal transportation at Lake Nyasa at New Kiwira port in Kyela district. Coal
transportation is one of the major challenges to Water Pollution of Lake Nyasa
2.4. Data Management
Management of Water Quality data involves several interdependent stages which include the
following:
(a) Data Collection: The data is collected from the selected network of hydrometric stations
spread across the Basin. The selection of these stations is based on different criteria such as most
stations with high risk of pollution data are collected by water quality expert from the Basin
23
2.4.1 Temporal and Spatial Coverage of Measuring Stations
Water Quality data are collected from selected hydrometric stations. The Basin has pointed 22
Water Quality monitoring and Pollution stations, these are 15 at river and three lake gauging
stations and 7 are pollution point sources in the mining areas.
2.4.2 Water Quality Management
The basin used water Quality laboratory located in Songea town and Mbeya city these laboratory
can do Physical, Bacteriological and Chemical analysis. Analysis for heavy metals is usually
referred main Central laboratory in the Ministry of Water Dar es Salaam. Several water quality
parameters are normally sampled and analyzed. These include pH, DO, BOD, temperature,
conductivity, turbidity, and discharge or flow measurements. Fecal coliform samples are also
collected and tested.
2.5 Lake Nyasa information
Lake Nyasa is the third largest African Great Lake (after Lake Victoria and Lake Tanganyika),
the eighth largest lake in the world. The largest river flowing into this lake is the Ruhuhu river.
This large freshwater lake has an outlet, which is the Shire River, a tributary that flows through
Malawi into the very large River of Zambezi. It is the second deepest lake in Africa and its
tropical waters have more fish species than any other lake on Earth.
The water in Lake Nyasa is typically alkaline with a pH of 7.7- 8.6. The lake water is generally
warm, having a surface temperature that ranges from 240- 29
0C and a deep level temperature of
220C.
Matema beach is on the northern shores of Lake Nyasa and is one of the most beautiful beaches
on the lake, which has been referred to as the most scenic body of water in Africa! Relatively
undeveloped for tourism giving it an authentic feel (unlike the Malawian shores), this is a very
relaxing destination and the lake water is blood warm and suitable for swimming. There are
some interesting cultural excursions within the region, and lots of walking possibilities.
2.6 Groundwater Data
In the Basin there are a total of 312 boreholes (shallow, medium and deep wells). Most of the
boreholes are found in the east side of the Basin whereby districts of Songea, Namtumbo and
Mbinga districts are presents. Few boreholes are found in the districts of Ludewa, Kyela, Ileje
and Rungwe.
Groundwater quality, generally about 96% is good and fit for human consumption. It is
important to monitor the groundwater quality to reduce the effect of pollution sources that may
degrade the groundwater quality,although the new boreholes for observation are not yet drilled
and established. The groundwater contaminants in the Basin slightly may originate from
agrochemicals, industry, municipal waste waters, disposal of solid waste, air pollution etc.

24
2.6.1 Data Management
The basin has selected 10 potential areas for establishing new observation monitoring borehole
stations for effective management of groundwater.
2.6.2 Temporal and Spatial Coverage of Borehole/Groundwater Stations
There are 10 Ground Water Monitoring stations sited in the Basin but not drilled yet. Currently
the sites are prepared to carry out geophysical survey at Maguu, Hanga and Mavanga villages in
Songea district; Ludewa town in Ludewa district; Bulongwa in Makete district; Mwakaleli in
Rungwe district; Isongole village in Ileje district; Kyela town in Kyela district; Imiliwaha in
Njombe district and Kilosa town in Mbinga distict.
2.6.3 Processing of Data
Hydrogeological (borehole) data since the beginning used to be collected, processed and
analyzed and stored in the Ministry Database in Dodoma which is the headquarter of
Hydrogeological department of the Ministry of Water. Recently since the start of the Basin
Water Boards, all the data now is collected, processed and analyzed by the BWBs before it is
transmitted to the HQ in Dodoma.
2.7 Water Use/Abstraction Data
The major water use in the basin is for domestic, Irrigation, Livestock, Industrial (majority Small
and medium scale mining) and hydropower development. Each of these major users will be
mapped and the amount that each one is using will be determined. The Basin has 427 water users
in a database system, this number included all customers granted provisional water use permit
for domestic, Irrigation, Industrial and Hydropower uses. Hydromil plants are very popular in the
Basin especially in Mbinga district, Ruvuma region.
2.7.1 Data Management
Collected data in the Basin is highly needed for various stakeholders based on different type of
water uses. This sharing information and communication between community and Basin Water
Office gives further development for water resource users such as domestic water supply, mini-
hydropower production, irrigated agriculture, industry, livestock, mining, fishing, navigation,
tourism, refreshment etc. This involves research, technical works and administrative and legal
controls for the purpose of preserving and allocating the available water resources to the needs of
the society.

25
2.7.2 Temporal and Spatial Coverage of Water Use/Abstraction Points
In the Lake Nyasa Basin water resources is used as has indicated in the table
Table 2.1: shows statistical water use customer
Na. Uses
Ruvuma Mbeya Njombe
Total Permit Application Permit Application Permit Application
1 Domestic 78 0 77 0 64 0 219
2 Min
Hydropower
26 0 15 0 19 0 60
3 Irrigation 22 0 43 0 17 0 82
4 Indrustrial 11 0 37 0 8 0 56
5 Livestock 0 0 0 0 0 0 0
6 Mining 8 0 2 0 0 0 10
TOTAL 145 0 174 0 108 0 427
2.7.3 Processing of Data
Processing of water use abstraction data in the Basin is done through the following stages:
(a) According to type of water use and amount of water abstracted
(b) Hydrological Report Recommendation letter from DED and DAS
(c) Environmental Impact Assessment (EIA)
(d) Basin Water Board Decision
After completion of the above processes the applicants list is brought to the BWB meeting
whereby final decision is made on whether the permit should be given or not. During this
reporting period, a total of 198 new customers applied for Water permits and 44 were re-
registered for the Water Permits.

26
3.0 HYDROLOGY OF THE BASIN
3.1 Climate
The climate of the Basin is tropical displaying wet and dry seasonal patterns rather than cold and
warm. It is significantly affected by the location of the inter-tropical convergence zone. During
December to February this zone is located south of the Basin and the dry and warm north-east
monsoon pre-dominates. From March the zone moves northwards and is located over the Basin
and results in the heaviest rainfall of the year. By June the zone has moved north of the Basin
and the colder but dry south-east air streams predominate. The convergence zone then moves
south again, although more rapidly than its northward journey, and by November is again
situated over the Basin area giving rise to some light rains.
The rainfall regime in the Basin is typically of the unimodal type with a single rainy seasonal
from November through May and dry conditions the rest of the year.
3.2 Runoff Distribution
Lake Nyasa Basin has an average rainfall range between 1000 and 2500mm per year. Much of
this rains occur in the rainy season between the months of November and May. The highest
rainfall is recorded in the Northern part of the lake in Kyela, Rungwe and Makete districts. The
lowest rainfall is recorded at the lower Ruhuhu valley in Mbinga and Ludewa Districts. The
surface runoff pattern corresponds closely to the rainfall pattern. In many areas of the basin
annual mean runoff exceeds 10 l/s/sq.km. Exceptional high mean annual runoff can be found in
areas like Kiwira river (40 l/s/sq.km) from 1660 sq. km. catchment at Ipyana gauging Station in
Kyela. The Lake is about 580 km long, 80 km wide at its widest point. The average surface
elevation of the Lake is 470 m.a.s.l and maximum is 701 m.a.s.l.
3.3 Sediment Transport
Since land and water resources are the most crucial resources available to what is still essentially
a subsistence farming community, the particular soil and fertility problems of the areas are of
utmost importance. The present situation of high rates of soil erosion, loss of plant nutrients and
increased water runoff leads to resource depletion and increases food insecurity and rural poverty
in the upper parts of the many rivers watersheds in the basin. The positive aspect of this situation
is that some of the soil material, plant nutrients and runoff is recovered and used by the farmers
on the downstream flood plains. Their well-being appears, to some extent, to depend on this
input. There is an increasing of high land degradation, rivers become shallow and cause more
floods, and distortion of fish spawning.The Basin still planning and prepare to collect
measurements for sediment load data.

27
3.4 Water Storage
Man made Storage
Fair amount of unreliable storage (some fish ponds, reservoirs for hydropower generation
and irrigated agriculture)
Natural storage
Huge unrealized groundwater
Huge underutilized storage i.e. groundwater and Lakes such as Lake Nyasa, Masoko and
ngozi Crater Lake.
Lake Nyasa has the volume of 7775km3as the storage water.
3.5 Groundwater Occurrence
Groundwater potential in the basin is high and variable. It is potentially found in weathered
crystalline rocks, fractured/fissured or faults, or joints i.e. granites, metamorphic, gneisses and
migmatites. However, it is one of the major sources of water particularly in the areas not easily
served by gravity or surface water.
Test drilling carried out within the basin showed that there is groundwater potential in Kyela and
areas of the Lakeshore and Ludewa, Mbamba-Bay, Mbinga and makete districts. Other areas
bordering and along the Lake do have potential. The Livingstone Mountains are remnants of
Gondwana / Post Gondwana Land surface whereby Groundwater from these mountains is in the
form of springs, which flow from the foot of the hills towards the Lake. Developing groundwater
potential in the basin is possible and it needs proper and intensive hydrogeological survey to be
carried out.
About 20% of all the drilled shallow and deep wells are successful yielding between 0.8 m3/hr to
20m3/hr. However, there is no established groundwater observation monitoring boreholes
stations at present.
3.6 Pollution sources
Non-point and point sources of pollution of water resources in the basin are the urban/village and
nutrients runoffs; Discharges from sewages, or factories contaminants have been reported to be
responsible for deterioration of the water quality respectively. Non-point source pollution is the
cumulative effect of small amounts of contaminants gathered from a large area, thus, when storm
water from sheet flow over the urban/village/agricultural fields the contaminants flow to
wetlands, streams, rivers and lake. Organic and inorganic contaminants like food processing
waste, insecticides and herbicides, chemical waste like acidity, ammonia, fertilizers (i.e.
eutrophication of nitrates and phosphates) and high sediments are normally reported. Inadequate

28
water supply and sanitation facilities have resulted in communities using the lake for many
different uses, drinking, washing, and bathing and for defecating as well.
Although, in most cases depends on soil characteristics, hydrology and nature of the contaminant
itself. No groundwater contamination case has been reported in particular. Therefore, it requires
to establish a serious and strong Environmental Pollution Control Management system unit for
Monitoring (follow – up) and evaluation of pollution risks in the basin.
4.0 WATER AVAILABILITY AND UTILIZATION IN THE BASIN
Lake Nyasa Basin is the wettest basin in the country with an average of 1500 mm rain per
annum. The basin has water sources like springs, wetlands, streams, rivers and groundwater has
been identified in some parts of the basin. The main rivers in the basin are Ruhuhu, Songwe,
Kiwira, Mbaka, Rufirio, Nyitule, Lumbira, Nkiwe, Mchuchuma, Luhekei, Mbawa and
Mwinamaji. All these are perennial rivers.
Water Resources in the basin is mainly used in the following categories: Domestic Water
supplies, Irrigation, Hydropower, Mining, Fishing and Navigation especially in Lake Nyasa. The
aforementioned categories of water use automatically form the types of stakeholders we have in
the basin.
5.0 GENERAL REMARKS AND WAYFORWARD
In order to meet the goals in managing water resources this will need new actions combining
innovative thinking and the LNBWO comprehensive water inventory data to provide guidance
for local development decisions and these activities the LNBWO is embraced this as one of the
highest priorities. At this stage we will require a new level of cooperation between
Municipalities, LGAs, UWSAs, NGOs, WUAs ect. To reach at this stage the basin will require
to adopt the IWRMD Plan where the basin watershed inventory and other management and
technical tools we will work to make sure that the future development decision are based on the
availability of water and a need to protect, conserve and efficiently use the basin water
resources.The Basin is planning to carryout comprehensive water use and water permit
assessment which will provide important input in the process of reviewing and granting water
permits in the future.

29
6.0 ANNEXES
Annex 1(a): Rainfall and Other Climatic Data Summary
Tenende station daily Rainfall data
Date Nov Dec Jan Feb Mar Apr May Jun Jul Aug Sep Oct
1 0 0 5.4 9 0 14.6 34.7 0 10.6 0 0
2 7.8 0 0.2 0 0 3.8 37.5 0 4.7 0 0
3 49.4 0 24.8 0 69.6 0 19.2 0 8.7 0 0
4 0 0 0 2.6 7.7 0 0.2 0 6.9 0 0
5 0 0 4.7 0 6.2 0 13.8 0 2.1 0 0
6 0 0 0 0 2.6 12.2 5.4 0.8 0 2.2 0
7 0 0 31 0 0 0 8.5 0 0 0.3 0
8 0 0 0.7 0 5.1 0 11.6 0 0 0 0
9 0 0 0.3 0 0 0 0.4 0 0 0 0
10 0 0 4.4 0 3.2 0 0 0 0 0 0
11 3.8 9.9 6.6 0 0 20.6 0 0 0 0 2
12 0 18.6 0 0 5.4 65.7 21.3 1.8 0 0 0
13 0 74.4 0 0 34.7 46.6 5.4 0 0 0 0
14 0 0.4 0 2.6 62.6 93 0 0 0 0 0
15 0 0 0 0 0 0 0 0 0 0 0
16 0 0 0 8.6 0.3 1.1 0 0 0 0 0
17 0 0 0 25.8 0 0.8 0 0 0 0 1
18 0 0 86.3 0 11.5 0.2 0 0.7 0 0 0 0
19 0 0 0 3 18.1 0 1.4 2.3 0 0 0 0
20 0 0 0 0 1.5 0 23.8 0 0 0 0 0
21 0 28.2 0 0 11.5 2.7 0 0 0 0 0
22 0 12.4 0 0 58 0 0 0 0 0 0
23 0 1.8 0 3.2 63 0 0 0 0 0 0 0
24 0 0 0.8 0 26 0 2.9 0 0 0 0 0
25 0 0 0 73.2 4.5 94.2 2.6 0 0 0 0 0
26 0 0 70.1 52.4 12.6 15.8 0.3 0 0 0 0 0
27 0 0 0 23.4 22.6 4.5 5.6 0 0 0 0 0
28 20.9 0 3.8 0 29 36 3 0 0 0 0 0
29 98.8 0 16.3 32.4 2.2 0 0 0 0 0 0
30 0 0 20.9 44.1 25.3 0 0 8.6 0 0 0
31 0 4.7 5.6 0 0 0 0
Total 180.7 145.7 281 203.8 537.8 439.3 197.6 3 11.2 33 2.5 3
Average 6.023 4.7 9.06 7.279 17.35 14.64 6.814 0.2 0.36 1.06 0.1 0.1

30
Annex 1(b): Unyamwanga station daily Rainfall data
Date Nov Dec Jan Feb Mar Apr May Jun Jul Aug Sep Oct
1 0 5.6 16.5 1.6 24.5 0 0 0 0 0
2 66.5 4.3 2.6 1 0 0 0 0 2.7 0
3 1.5 8.1 0 6 0.5 0 0 0 0 0
4 12 2 0 8 5.5 0 0 0 1.5 0
5 3 0.8 3.5 48.1 12.3 0 0 0 0 0
6 1.8 4.3 3.6 11.5 4.3 1.6 0 0 0 0
7 16.8 2 1.6 4.4 0.7 3.9 0 0 0 3.3
8 15.8 3.5 6.3 10.5 3.5 0 0 0 0 0
9 42.7 0 9.5 3.5 0 0 0 0 0 0
10 10 0 10.1 8.2 2.5 0 0 0 0 0
11 7.4 0 1.1 10.4 8.2 0 0 0 0 0
12 16.1 0 2.4 24.9 5 2.3 0 0 0 0
13 3.1 4.5 1.3 14 9 3.5 0 0 0 0
14 0 2.1 16.2 18.1 10 0 0 0 0 0
15 20.4 5.1 3.2 6.8 5.1 0 0 0 0 0
16 30.1 4.1 10.5 0 0 0 0 0 0 0
17 10.9 20.4 11.6 10.4 0 0 0 0 0 0
18 0 24.5 9.4 20.2 9.4 0 0 0 0 0
19 0 15.7 26.9 8.2 0 0 0 0 0 0
20 0 10 34.6 42.1 0 0 0 0 0 0
21 0 10.2 18.5 10.2 0 0 0 0 0 0
22 0 0.9 0 19.2 0 0 0 0 0 0
23 0 0 10.3 10.3 0 1 0 0 0 0
24 0 0 19.8 3.6 19.2 0 0 0 0 0
25 0 0 9.7 16.1 9.3 0 0 0 0 0
26 0 0 19.7 50.5 10.1 0 0 0 0 0
27 0 0 0 15.4 5.2 0 0 0 0 0
28 25.8 15.3 1.1 0 15 0 0 0 0 0
29 3.9 2.9 16.2 20.3 0 0 0 0 0
30 29 3.5 17.3 5 0 0 0 0 0
31 5.4 12 0 0 0
Total 316.8 0 155.2 250 428.7 184.6 12.3 0 0 4.2 3.3
Average 10.56 5.006 8.929 13.83 6.153 0.4 0 0 0.1 0.1

31
Annex 1(c): Madaba station daily Rainfall data
Date Nov Dec Jan Feb Mar Apr May Jun Jul Aug Sep Oct
1 0.5 0 0 63.2 0 0 0 0 0 0 0 0
2 2.5 0 0 5.4 0 0 0 0 0 1.3 0 21.4
3 0 0 32.2 0 0 0 0 0 0 0 0 11.3
4 0 0 38.3 0 0 0 0 0 0 0 0 0
5 0 0 0.6 0 75.4 1 3.5 0 0 0 0 0
6 0 0 0 0 2.3 22.8 0 0 0 0 0 0
7 0 0 30.5 0 0 31.8 0 0 0 0 0 0
8 0 0 0 0 0 70.5 0 0 0 0 0 0
9 0 0 0 0 0 4.4 0 0 0 0 0 0
10 0 0 20.3 65.8 0 0 0 0 0 0 0 0
11 0 44.8 10.4 0 0 0 0 0 0 0 0 0
12 0 23.5 0 0 53.5 0 0 0 0 0 0 0
13 0 23.3 0 0 0 42.4 0 0 0 0 0 0
14 0 12.5 0 0 13.4 0 0 0 0 0 0 0
15 0 0 0 17.5 17.6 0 0 0 0 0 0 0
16 0 0 0 9.8 40.5 0 0 0 0 0 0 0
17 0 0 0 15.3 0 0 0 0 0 0 0 0
18 0 0 0 0 0 0 0 0 0 0 0 0
19 0 76.1 0 27.8 0 0 0 0 0 0 0 0
20 0 0 8.4 9.9 5.9 0 0 0 0 0 0 0
21 0 40.8 1.8 0 0 0 0 0 0 0 0 0
22 0 0 0 0 0 0 0 0 0 0 0 0
23 13.7 8.4 8.3 1.4 0 0 0 0 0 0 0 0
24 0 7.9 0 3.5 0 0 0 0 0 0 0 0
25 0 0 0 6.9 15.9 0 0 0 0 0 0 0
26 0 0 24.7 12.5 5.1 0 0 0 0 0 0 0
27 0 10.5 0 12.1 13.5 0 0 0 0 0 0 0
28 0 0 16.1 0 52.1 0 0 0 0 0 0 0
29 0 0 0 1.4 0 0 0 0 0 0 0
30 14.8 0 0 16.9 0 0 0 0 0 0 0
31 0 0 0 0 4.3 0 0
Total 31.5 247.8 191.6 251.1 313.5 172.9 3.5 0 4.3 1.3 0 32.7
Average 1.05 7.994 6.181 8.968 10.11 5.763 0.11 0 0.1 0.0 0 1.05

32
Annex 1(d): Masigira Station daily Rainfall data
Date Nov Dec Jan Feb Mar Apr May Jun Jul Aug Sep Oct
1 0 5.3 10.2 4.1 0 0 0 0 0 0 0 0
2 0 0 0 9.2 0 8.3 0 0 0 0 0 0
3 21.5 0 45.8 0 16.8 9.7 0 0 0 0 0 0
4 20.2 0 0 3.8 4.3 0 0 0 0 0 0 0
5 4.6 0 9.3 19.5 5.8 0 3.5 0 0 0 0 0
6 0 0 0 0 0 10.2 0 0 0 0 0 0
7 0 0 0 0 43.2 0 0 0 0 0 0 0
8 0 0 5.2 6.2 0 19.5 0 0 0 0 0 0
9 0 0 21.7 14.7 6.9 44.3 0 0 0 0 0 0
10 0 0 0 10.5 0 0 0 0 0 0 0 0
11 0 59.8 0 0 18.3 0 0 0 0 0 0 0
12 0 0 20.3 0 21.8 83.2 0 0 0 0 0 0
13 0 36.3 0 25.8 13.2 38.6 0 0 0 0 0 0
14 0 0 0 13.2 12.5 24.9 0 0 0 0 0 0
15 0 0 0 0 4.2 0 0 0 0 0 0 0
16 0 0 0 7.5 0 0 0 0 0 0 0 0
17 0 0 0 0 1.2 0 0 0 0 0 0 0
18 0 0 0 0 0 0 0 0 0 0 0 0
19 0 65.3 18.6 12.3 25.1 0 0 0 0 0 0 0
20 3.1 48.7 0 30.7 0 0 0 0 0 0 0 0
21 0 26.2 0 0 0 0 0 0 0 0 0 0
22 0 0 0 0 0 0 0 0 0 0 0 0
23 0 0 0 14.9 0 0 0 0 0 0 0
24 0 0 0 0 8.7 0 0 0 0 0 0 0
25 0 23.5 10.3 15.2 0 0 0 0 0 0 0 0
26 0 0 8.5 24.5 0 0 0 0 0 0 0 0
27 0 0 14.1 0 6.4 0 0 0 0 0 0 0
28 0 0 7.9 0 46.8 0 0 0 0 0 0 0
29 0 0 10.7 5.2 0 0 0 0 0 0 0
30 0 Nil 0 2.5 0 0 0 0 0 0 0
31 6.3 10.3 0 0 0 0
Total 49.4 265.1 188.9 197.2 268.1 238.7 3.5 0 0 0 0 0
Average 1.65 9.141 6.094 7.304 8.648 7.957 0.11 0 0 0 0 0

33
Annex 1(e): Ileje maji yard station daily Rainfall data
Date Nov Dec Jan Feb Mar Apr May Jun Jul Aug Sep Oct
1 Nil 0 30 0 15 0 0 0 0 0 0 0
2 Nil 0 15 0 25 0 0 0 0 0 0 0
3 25 0 0 0 35 0 0 0 0 0 0 0
4 30 0 0 15 0 0 0 0 0 0 0 0
5 15 0 0 25 0 15 0 0 0 0 0 0
6 0 0 45 5 0 5 0 0 0 0 0 0
7 0 0 25 0 0 30 0 0 0 0 0 0
8 0 0 0 0 0 0 0 0 0 0 0 0
9 0 0 0 0 0 0 0 0 0 0 0 0
10 0 0 35 25 0 0 0 0 0 0 0 0
11 0 0 10 15 0 0 0 0 0 0 0 0
12 0 0 0 0 0 0 0 0 0 0 0 0
13 0 15 0 0 0 0 0 0 0 0 0 0
14 0 0 0 35 Nil 0 0 0 0 0 0 0
15 0 30 0 0 Nil 0 0 0 0 0 0 0
16 Nil 25 0 0 Nil 0 0 0 0 0 0 0
17 Nil Nil 0 10 25 0 0 0 0 0 0 0
18 Nil Nil 0 5 5 0 0 0 0 0 0 0
19 Nil Nil 0 30 0 0 0 0 0 0 0 0
20 Nil 10 0 15 0 0 0 0 0 0 0 0
21 Nil 25 0 0 10 0 0 0 0 0 0 0
22 Nil 0 0 0 35 0 0 0 0 0 0 0
23 Nil 0 0 0 10 0 0 0 0 0 0 0
24 Nil 0 25 0 5 0 0 0 0 0 0 0
25 Nil 0 30 0 0 0 0 0 0 0 0 0
26 Nil 15 10 15 0 0 0 0 0 0 0 0
27 Nil 10 0 35 0 0 0 0 0 0 0 0
28 Nil 0 0 25 0 0 0 0 0 0 0 0
29 Nil 0 0 Nil 0 0 0 0 0 0 0 0
30 Nil 0 0 Nil 0 0 0 0 0 0 Nil 0
31 Nil 0 30 Nil 0 0 0 0 Nil 0
Total 70 130 255 255 165 50 0 0 0 0 0 0
Average 5.4 4.6 8.2 9.1 5.9 1.7 0 0 0 0 0 0

34
6.2 Water level Data Summary
Annex 2(a): Ruhuhu River at Masigira Water Level
Date Nov Dec Jan Feb Mar Apr May Jun Jul Aug Sep Oct
1 0.65 0.66 0.86 1.38 1.13 1.53 1.24 0.94 0.88 0.87 0.8 0.74
2 0.65 0.67 0.87 1.36 1.09 1.49 1.2 0.94 0.88 0.88 0.8 0.78
3 0.65 0.67 0.87 1.4 1.07 1.44 1.18 0.94 0.88 0.88 0.8 0.84
4 0.65 0.66 0.87 1.43 1.04 1.38 1.13 0.94 0.88 0.88 0.79 0.84
5 0.65 0.66 0.89 1.44 1.03 1.34 1.1 0.94 0.88 0.88 0.79 0.84
6 0.67 0.65 0.89 1.41 1.01 1.31 1.01 0.93 0.88 0.88 0.79 0.84
7 0.68 0.65 0.94 1.37 1.08 1.36 0.99 0.93 0.88 0.88 0.79 0.83
8 0.78 0.64 0.94 1.35 1.05 1.32 0.99 0.93 0.88 0.88 0.79 0.83
9 0.78 0.64 0.93 1.42 1.04 1.35 0.99 0.93 0.88 0.88 0.79 0.83
10 0.78 0.63 0.91 1.46 1.02 1.38 0.99 0.93 0.88 0.88 0.79 0.82
11 0.75 0.63 0.91 1.43 1.02 1.38 0.97 0.93 0.88 0.88 0.79 0.82
12 0.75 0.63 0.9 1.47 1.05 1.37 0.96 0.93 0.88 0.88 0.79 0.82
13 0.74 0.62 0.9 1.34 1.11 1.36 0.95 0.92 0.88 0.88 0.79 0.82
14 0.74 0.62 0.9 1.31 1.18 1.39 0.95 0.92 0.88 0.88 0.78 0.82
15 0.74 0.62 0.9 1.32 1.26 1.38 0.95 0.92 0.88 0.88 0.78 0.82
16 0.74 0.62 0.89 1.42 1.33 1.53 0.95 0.92 0.88 0.87 0.78 0.82
17 0.73 0.62 0.89 1.44 1.25 1.55 0.94 0.92 0.88 0.87 0.78 0.81
18 0.73 0.61 0.89 1.48 1.21 1.55 0.94 0.92 0.87 0.87 0.79 0.81
19 0.72 0.61 0.89 1.36 1.12 1.47 0.94 0.92 0.87 0.86 0.79 0.8
20 0.72 0.61 0.9 1.35 1.11 1.49 0.94 0.92 0.87 0.86 0.79 0.8
21 0.72 0.61 0.96 1.35 1.1 1.48 0.93 0.92 0.87 0.86 0.79 0.79
22 0.72 0.6 1.17 1.34 1.15 1.5 0.93 0.91 0.86 0.86 0.79 0.78
23 0.72 0.6 1.2 1.33 1.19 1.53 0.93 0.91 0.86 0.85 0.79 0.78
24 0.72 0.6 1.24 1.33 1.2 1.54 0.93 0.91 0.86 0.85 0.79 0.77
25 0.72 0.6 1.19 1.33 1.26 1.69 0.92 0.91 0.86 0.85 0.78 0.76
26 0.73 0.59 1.17 1.33 1.22 1.77 0.92 0.91 0.86 0.85 0.78 0.76
27 0.74 0.59 1.16 1.33 1.18 1.83 0.92 0.91 0.86 0.85 0.78 0.76
28 0.79 0.59 1.14 1.36 1.29 1.7 0.92 0.91 0.86 0.85 0.78 0.75
29 0.78 0.61 1.13 1.27 1.66 0.92 0.91 0.86 0.84 0.78 0.75
30 0.76 0.67 1.13 1.25 1.6 0.93 0.91 0.86 0.84 0.78 0.74
31 0.71 1.11 1.31 0.93 0.86 0.84 0.74
Max 0.79 0.71 1.24 1.48 1.33 1.83 1.24 0.94 0.88 0.88 0.8 0.84
Min 0.65 0.59 0.86 1.31 1.01 1.31 0.92 0.91 0.86 0.84 0.78 0.74

35
Annex 2(b): Lake Nyasa at Itungi Port station (Lake Level)
Date Nov Dec Jan Feb Mar Apr May Jun Jul Aug Sep Oct
1 5.2 5.03 5.19 5.28 5.42 5.64 5.9 5.59 5.38 5.28 5.09 4.96
2 5.2 5.03 5.19 5.29 5.38 5.64 6.5 5.57 5.36 5.18 5.11 4.96
3 5.3 5.03 5.2 5.29 5.42 5.66 6.08 5.56 5.36 5.26 5.1 4.95
4 5.6 5.03 5.18 5.28 5.41 5.7 6.04 5.56 5.34 5.23 5.1 4.96
5 5.6 5.03 5.19 5.28 5.41 5.71 5.8 5.56 5.34 5.24 5.1 4.97
6 5.8 5.03 5.17 5.28 5.41 5.7 5.76 5.55 5.34 5.2 5.09 4.96
7 5.8 5.25 5.18 5.28 5.4 5.7 5.74 5.59 5.34 5.21 5.1 4.92
8 5.7 5.23 5.18 5.28 5.41 5.7 5.72 5.51 5.33 5.22 5.08 4.9
9 5.8 5.22 5.18 5.28 5.41 5.7 5.7 5.56 5.33 5.2 5.08 4.9
10 5.7 5.21 5.2 5.29 5.4 5.72 5.71 5.61 5.32 5.2 5.08 4.91
11 5.4 5.23 5.19 5.24 5.4 5.74 5.71 5.6 5.33 5.2 5.08 4.91
12 5.7 5.22 5.2 5.27 5.38 5.76 5.7 5.57 5.32 5.2 5.08 4.9
13 5.1 5.21 5.2 5.29 5.39 5.76 5.7 5.62 5.32 5.2 5.1 4.92
14 5.4 5.21 5.21 5.29 5.39 5.74 5.71 5.55 5.32 5.2 5.09 4.92
15 5.1 5.21 5.2 5.29 5.4 5.73 5.7 5.54 5.33 5.21 5.08 4.9
16 5.1 5.21 5.21 5.29 5.39 5.72 5.71 5.54 5.3 5.2 5.07 4.92
17 5.1 5.2 5.2 5.29 5.4 5.72 5.71 5.52 5.3 5.21 5.07 4.93
18 5.1 5.2 5.2 5.3 5.4 5.7 5.71 5.5 5.3 5.2 5.07 4.91
19 5.1 5.2 5.21 5.3 5.4 5.72 5.7 5.51 5.3 5.2 5.08 4.9
20 5.8 5.2 5.21 5.29 5.39 5.72 5.66 5.5 5.3 5.2 5.06 4.91
21 5.4 5.19 5.2 5.3 5.43 5.73 5.65 5.51 5.3 5.2 5.06 4.92
22 5.2 5.18 5.18 5.29 5.46 5.74 5.7 5.5 5.28 5.2 5.06 4.9
23 5 5.18 5.19 5.29 5.48 5.72 5.7 5.5 5.3 5.2 5.06 4.91
24 5 5.18 5.18 5.28 5.49 5.74 5.7 5.5 5.29 5.2 5.06 4.9
25 5 5.23 5.18 5.29 5.53 5.76 5.7 5.5 5.29 5.21 5.04 4.9
26 5 5.2 5.19 5.28 5.56 5.82 5.7 5.48 5.3 5.2 5.02 4.9
27 5 5.21 5.19 5.29 5.58 5.94 5.68 5.49 5.28 5.2 5.02 4.91
28 4.96 5.2 5.18 5.29 5.62 5.96 5.71 5.47 5.29 5.2 5.04 4.91
29 4.95 5.21 5.18 5.66 5.86 5.69 5.49 5.3 5.2 5.02 4.9
30 4.97 5.21 5.18 5.66 5.84 5.67 5.48 5.24 5.18 5 4.9
31 4.95 5.21 5.18 5.64 5.66 5.22 5.19 4.88
Max 5.8 5.25 5.21 5.3 5.66 5.96 6.5 5.62 5.38 5.28 5.11 4.97
Min 4.95 5.03 5.17 5.24 5.38 5.64 5.65 5.47 5.22 5.18 5 4.88

36
Annex 2(c): Kiwira Ipyana station daily water level
Date Nov Dec Jan Feb Mar Apr May Jun Jul Aug Sep Oct
1 1.45 1.8 1.6 1.8 2.95 3.6 4.2 2.5 2 1.88 1.6 1.6
2 1.48 1.76 1.56 1.78 2.9 3.56 3.68 2 2 2.5 1.6 1.6
3 1.6 1.74 1.56 1.78 2.86 3.5 4.63 2.48 2 2.7 1.59 1.6
4 1.77 1.74 1.54 1.7 2.8 3.4 4.5 2.46 1.96 2.7 1.59 1.6
5 1.77 1.96 2.5 1.7 2.75 3.33 4.4 2.46 1.96 2 1.59 1.6
6 2.1 1.85 2.46 1.67 2.72 3.3 4 2.4 1.94 1.96 1.58 1.58
7 2.7 1.85 2.46 1.8 2.7 3.05 3.86 2.4 1.9 1.94 1.65 1.56
8 2.76 1.8 2.3 1.8 2.65 3 3.65 2.36 1.9 1.83 1.64 1.56
9 2.6 1.8 2.28 1.9 2.75 3 3.55 2.35 1.95 1.86 1.64 1.56
10 2.55 1.75 2.26 1.87 2.7 2.95 3.5 2.32 1.94 1.8 1.62 1.56
11 2.55 1.75 1.98 1.86 2.95 2.94 4.5 2.32 1.94 1.98 1.62 1.56
12 2.5 1.7 1.9 1.8 2.9 2.92 4.25 2.3 1.92 1.96 1.61 1.65
13 2.6 1.68 1.86 1.8 4.55 4.5 3.86 2.3 1.9 1.89 1.61 1.64
14 2.59 1.67 1.8 1.77 4.45 3.9 3.8 2.3 1.9 1.89 1.61 1.64
15 2.56 1.65 1.8 1.78 4.3 3.86 4.5 2.28 1.9 1.89 1.61 1.62
16 2.54 1.65 1.78 1.76 3.86 3.5 4.3 2.25 1.89 1.87 1.6 1.62
17 2.45 1.55 1.75 2 3.8 3 4.2 2.25 1.89 1.87 1.6 1.61
18 2.44 1.54 1.71 1.98 3.66 3 4 2.23 1.86 1.85 1.6 1.61
19 1.51 1.5 1.7 1.95 3.7 2.97 3.86 2.23 1.86 1.85 1.6 1.61
20 1.51 1.5 1.67 1.88 3.65 2.8 3.75 2.2 1.84 1.8 1.6 1.45
21 1.51 1.65 1.67 1.86 3.6 2.8 3.7 2.2 1.84 1.8 1.58 1.48
22 1.51 1.67 1.64 1.85 2.98 2.7 3.58 2.2 1.82 1.78 1.56 1.6
23 1.51 1.77 2.2 1.87 2.95 3.8 3.65 2.2 1.82 1.78 1.56 1.77
24 1.5 1.75 2.15 1.85 3 3.7 3.5 2.2 1.8 1.76 1.56 1.77
25 1.5 1.7 2 1.85 3.15 3.6 3.46 2.18 1.8 1.76 1.56 2.1
26 1.5 1.7 1.94 1.8 3.06 3.55 3.4 2.16 1.8 1.76 1.56 2.7
27 1.48 1.68 2.1 1.8 3 3.68 3.4 2.16 1.78 1.74 1.54 2.1
28 1.46 1.66 2 1.75 2.98 3 3.33 2.15 1.76 1.73 1.54 2
29 1.46 2.06 2.5 4.16 4.5 3.31 2.2 1.76 1.73 1.54 2.1
30 1.46 1.96 2.28 3.86 3.8 3 2.23 1.74 1.73 1.54 2.2
31 1.87 2.19 3.84 3 1.74 1.7 2.1
Max 2.76 2.06 2.5 2 4.55 4.5 4.63 2.5 2 2.7 1.65 2.7
Min 1.45 1.5 1.54 1.67 2.65 2.7 3 2 1.74 1.7 1.54 1.45

37
Annex 1(d) Ruhuhu at Kikonge station Water Level
Date Nov Dec Jan Feb Mar Apr May Jun Jul Aug Sep Oct
1 1.22 1.36 1.35 1.54 2.78 4.17 2.52 2 1.78 1.69 1.48 1.24
2 1.4 1.35 1.32 1.5 2.71 4.03 2.51 1.99 1.77 1.69 1.47 1.23
3 1.3 1.33 1.28 1.33 2.64 3.86 2.49 1.97 1.77 1.68 1.47 1.23
4 1.26 1.32 1.24 1.29 2.6 3.77 2.48 1.96 1.77 1.68 1.47 1.22
5 1.71 1.31 1.22 1.26 2.74 3.62 2.52 1.96 1.76 1.67 1.46 1.22
6 1.56 1.3 1.27 1.24 2.66 3.49 2.49 1.96 1.76 1.67 1.46 1.21
7 1.68 1.3 1.7 1.2 2.63 3.4 2.47 1.95 1.77 1.66 1.45 1.21
8 1.62 1.29 1.67 1.19 2.6 3.34 2.46 1.95 1.77 1.66 1.45 1.2
9 1.61 1.3 1.56 1.16 2.58 3.5 2.45 1.94 1.76 1.68 1.46 1.2
10 1.58 1.28 1.52 1.14 2.52 3.25 2.44 1.93 1.76 1.68 1.46 1.19
11 1.56 1.27 1.44 1.07 2.61 4.14 2.44 1.92 1.76 1.68 1.45 1.21
12 1.52 1.26 1.4 1.04 2.58 4.63 2.43 1.91 1.76 1.68 1.45 1.2
13 1.48 1.26 1.32 1.94 2.57 4.4 2.47 1.91 1.75 1.68 1.48 1.27
14 1.46 1.25 1.3 1.9 2.56 4.2 2.45 1.9 1.74 1.67 1.48 1.25
15 1.65 1.23 1.27 1.82 2.43 4.03 2.5 1.89 1.73 1.67 1.47 1.23
16 1.59 1.23 1.35 1.8 3.02 3.92 2.49 1.89 1.73 1.67 1.47 1.22
17 1.4 1.22 1.68 1.64 2.84 3.84 2.46 1.9 1.73 1.67 1.46 1.49
18 1.38 1.21 1.8 1.6 2.8 3.74 2.44 1.9 1.72 1.67 1.46 1.48
19 1.39 1.2 1.54 1.56 3.84 4.02 2.39 1.89 1.72 1.64 1.45 1.46
20 1.38 1.2 1.5 1.5 3.5 3.96 2.37 1.89 1.71 1.63 1.44 1.44
21 1.41 1.24 1.42 1.45 4.46 3.7 2.35 1.88 1.71 1.62 1.44 1.42
22 1.4 1.27 1.38 1.37 4.66 3.57 2.32 1.89 1.71 1.62 1.43 1.4
23 1.37 1.33 1.32 1.26 4.08 3.74 2.3 1.88 1.71 1.62 1.43 1.34
24 1.35 1.54 1.3 1.24 4.02 3.63 2.29 1.87 1.71 1.62 1.42 1.33
25 1.32 1.92 1.28 1.2 4.94 4.75 2.32 1.86 1.7 1.6 1.42 1.31
26 1.3 1.6 1.27 1.18 4.84 4.7 2.3 1.86 1.7 1.6 1.41 1.3
27 1.3 1.5 1.26 1.16 5.5 6.14 2.32 1.85 1.7 1.59 1.4 1.33
28 1.28 1.47 1.25 1.12 6.74 5.4 2.31 1.85 1.7 1.59 1.4 1.32
29 1.27 1.42 1.24 5.48 4.66 2.27 1.85 1.7 1.58 1.4 1.32
30 1.25 1.4 1.23 5.42 4.54 2.24 1.85 1.7 1.58 1.41 1.3
31 1.5 1.21 5.18 2.21 1.7 1.58 1.3
Max 1.71 1.92 1.8 1.94 6.74 6.14 2.52 2 1.78 1.69 1.48 1.49
Min 1.22 1.2 1.21 1.04 2.43 3.25 2.21 1.85 1.7 1.58 1.4 1.19

38
Annex 3: shows discharge measurement results from spot gauges for water allocation purposes
C/NO NAME O F A
PPLICANT
SOURCE
NAME
LOCATION OF
VILLAGE
SOURCE
CAPACITY
WATER
ABSTRACTED
REMARKS
1 Bula A Group Mnange
Stream
Lukanzauti 1.3 l/s 0.63 l/s
3 ST.Alois Gonzaga Luwaita
River
Luwaita Village 0.314 m3/s 0.171 m
3/s Hydromill
4 Amua sasa
Association
Luwaita
River
Luwaita Village 0.269 m3/s Not existing
5 Umoja wa
Umwagiliaji Mkali
Mbawa
River
Mkali Village 1.472 m3/s 0.341 m
3/s
6 Ndembo Water
Project
Ngukula
Ndembo
Spring
Kindimba Village 1.26 l/s 0.261 l/s
7 DAE LTD Mihala
stream
Njombe
Jitegemee(Ngima)
1.1 l/s 0.4 l/s
8 DAE LTD Kibao
stream
Litenga (Ngima
ward) kitunda
village
0.96 l/s 0.32 l/s Litenga is
where water
used
9 DAE LTD Ngoni
stream
Kihongo(Mapera
ward)
2.4 l/s 0.6 l/s
10 DAE LTD Kihigo-
makala
stream
Mibua
mikalanga/kambara
ge ward
2.4 l/s 0.591 l/s
11 DAE LTD Kigua
stream
Mahilo
Bunifu(Kitula
ward)
0.648 l/s 0.26 l/s MPU
12 DAE LTD Kimbalakat
a stream
Kibandai (Maguu
ward)
2.4 l/s 0.6 l/s
13 DAE LTD Kibao
stream
Kitunda(Myangaya
nga ward)
0.96 l/s 0.32 l/s
14 DAE LTD Mtanga
stream
Ngima(Ngima
ward)
1.3 l/s 0.63 l/s AMCOS
15 DAE LTD Manolo
stream
Lilwambo(Ngima
ward)
1.3 l/s 0.33 l/s

39
16 DAE LTD Lugarawa
stream
Moha (Langiro
ward)
1.8 l/s 0.6 l/s
17 DAE LTD Matili
stream
Mhagawa(Litembo
ward)
6 l/s 2 l/s
18 DAE LTD Wili Kitesa
stream
Mitawa (Mpapa
ward)
1.6 l/s 0.4 l/s
19 DAE LTD Kilimanjal
o stream
Mkinga (Mapera
ward)
2.9 l/s 0.6 l/s
20 DAE LTD Ubena
stream
Mitanga(Mpapawa
rd)
3 l/s 0.6 l/s
21 DAE LTD Mtetema
stream
Litembo(Litembo
ward)
3.6 l/s 1.2 l/s
22 DAE LTD Lusweka
stream
Kilindi(Matiri
ward)
3.6 l/s 1.2 l/s
23 DAE LTD Tutuma
stream
Kitumbi(Kipapa
ward)
1.2 l/s 0.3 l/s
24 DAE LTD Lugarawa
stream
Linda (Linda ward) 1.5 l/s 0.75 l/s
25 DAE LTD Kioka
stream
Minungu(Nyoni
ward)
8 l/s 2 l/s
26 DAE LTD Ngindo
stream
Tukuzi(Luwaita
ward)
6 l/s 1.2 l/s
27 DAE LTD Kihulila
stream
Kihulila (Nyoni
ward)
4.3 l/s 1.1 l/s
28 DAE LTD Kitesa
liwihi
stream
Mikalanga
(Mikalanga ward)
2.8 l/s 0.92 l/s
29 DAE LTD Handeni
stream
Lugari(Mkumbi
ward)
9 l/s 3 l/s
30 DAE LTD Mtawa
stream
Liwihi(Kitumbalo
mo ward)
1.5 l/s 0.75 l/s
31 DAE LTD Litoronji
stream
Ndembo (Linda
ward)/Mkumbi
3.7 l/s 0.92 l/s
32 DAE LTD Kigua
stream
Mahilo bunifu
(Kitula ward)
48 l/s 2.5 l/s CPU

40
33 DAE LTD Kitesa
stream
Mihindo (Mpapa
ward)
1.6 l/s 0.4 l/s
34 DAE LTD Mahuka
stream
K/Mahuka (K/
Mahuka ward)
3.9 l/s 1.3 l/s
35 DAE LTD Mitomoni
stream
Muhuru (Ngima
ward)
1.9 l/s 0.92 l/s
36 DAE LTD Maganigwa
stream
Kihuhi Group
(Ngima ward)
4.4 l/s 1 l/s
37 DAE LTD Mbega
stream
Langiro Langiro
ward
0.8 l/s 0.2 l/s
38 DAE LTD Magingo
stream
Mundeki
(Myangayanga
ward)
12 l/s 3 l/s
39 DAE LTD Myangayan
ga stream
Myangayanga
village
0.48 l/s 0.2 l/s
40 DAE LTD Makkumbu
kila stream
Luwaita
village(Luwaita
ward)
0.6 l/s 0.3 l/s
41 DAE LTD Mandita
stream
K/Juu Mbuji ward 0.06 l/s 0.02 l/s
42 DAE LTD Liyombo
stream
Liyombo (Liyombo
ward)
0.04 l/s 0.02 l/s
43 DAE LTD Ukinga
stream
Matuta village
(kipapa ward)
4.5 l/s 1.5 l/s
44 DAE LTD Nambingi
stream
Nsasa
village(Ngima
ward)
0.1 l/s 0.04 l/s
45 DAE LTD Manguki
stream
Kigua
bunifu(Kitura
ward)
0.23 l/s 0.1 l/s
46 DAE LTD Kiurungu
stream
Buruma village
(Mpapa ward)
4.4 l/s 1.01 l/s
47 DAE LTD Magogo
stream
Ngima village
(Ngima ward)
12 l/s 3 l/s CPU
48 DAE LTD Uluwa Uluwa (Mkumbi 0.5 l/s 0.2 l/s

41
stream ward)
49 DAE LTD Mandita
stream
Kibanga
village(Mbuji
ward)
5.3 l/s 1.3 l/s Was not on
list but they
applied it
50 Tacri Mbinga-
Ugano
Kihuka
stream
Myangayanga
village
1.975 l/s 1.58 l/s
51 Twiga Care for you Kipera
stream
Lulambo village 0.017 L/S 0.017 l/s The source
is in danger
to dry up
52 Alfrida Odo
Komba
Kitunda
stream
Myangayanga
village
0.48 l/s 0.12 l/s
53 Kikundi cha
muungano
Mshangano
stream
Myangayanga
village
0.63 l/s 0.279 l/s
54 Umoja wa
umwagiliaji
Ngingama
Muhulasi
river
Ngingama village 6 l/s 4 l/s
55 Makarius Syprian
Hyera
Sasawala
spring
Mtama
village(Utiri ward)
0.074 l/s 0.037 l/s
56 Christian B.
Kinunda
Wogawoga
river
Mikalanga village 104 l/s or
0.104m3/s
104 l/s Dam site for
Hydropower
57 Ngaka Amcos Makukila
stream
Kindimba village 2.428 l/s 1.714 l/s New
Customers
2013/ 2014
58 Filbert Kapinga Malundo
stream
Mbambi
village(London
street)
0.05 l/s 0.101 l/s
59 Bernard E.Turuka Mitomoni
spring
Mahande village 0.8 l/s 0.267 l/s
60 Philo Makarius
Nduguru
Mshangano
river
Myagayanga
village
0.63 l/s 0.21 l/s
61 Kikundi cha maji
maweni
Maweni
spring
Liwihi village 0.02 l/s 0.02 l/s
62 Augustivo High
School
Tope
stream
Mhekela village 1.14 l/s 0.571 l/s
63 ST.Luice Mbinga Mibugubug Kibandai A Village 1.5 l/s 1 l/s

42
Girls Sec.School u spring
64 Sixmund Mchael
Nombo
Limbiko
stream
Myangayanga
village
0.615 l/s 0.308 l/s
65 Mradi wa maji
Lituhi
Lukale
stream
Lituhi village 1.3 l/s 1 l/s
66 Buruma sec.School Matui
stream
Buruma village 2.48 l/s 0.48 l/s
67 Kihwili Hydromill
Project
Ruhekei
river
Mkalole village 455 l/s 152 l/s
68 Bio Camp Bio spring Ndengele village 0.672 l/s 0.272 l/s
69 Komba Lake View Chihihila
spring
Mbambabay
village
1.917 l/s 0.917 l/s
70 Fr Cino Thenkkara
–Depaul Hostel
Bore well-1 Msamala village 1300 l/h 1300 l/h
71 Fr Cino
Thenkkara-Depaul
Hostel
Bore well Msamala village 1500 l/h 1500 l/h
72 Sister M.Rosita Bore well Msamala village 1650 l/h 1650 l/h
73 Jitegemee Maji ni
uhai
Mwinyu
stream
Maguu Kibandai
asili A Village
1.2 l/s
74 Tutunze kahawa
Limited
Kitesa
forest
spring
Ilela village(
Mikalanga ward)
4.8 l/s 1.2 l/s CPU
75 Tutunze Kahawa
Limited
Mahilo
stream
Kingirikiti
(Kingirikiti ward)
2 l/s 1 l/s CPU
76 Thomas / Kandidus
group
Likwela
stream
Matekela village
(Kambarage ward)
0.686 l/s 0.343 l/s
77 Makatani group Yeha
stream
Matekela village 0.6 l/s 0.2 l/s
78 Kikundi cha
sngambele
Mshangano
river
Myangayanga
village
0.726 l/s 0.226 l/s
79 Tancoal Energy Bore well Ruanda village 417 l/h 417 l/h
80 Muungano Buruma Buruma
stream
Buruma village 0.6 l/s 0.2 l/s CPU

43
81 Luwaita A CPU Mkangazu
stream
Luwaita village 0.9 l/s 0.3 l/s CPU
82 Mwanzo mgumu
CPU
Kihangi
mauka
stream
Kihangi mauka
village
0.52 l/s 0.211 l/s
83 Mapera CPU Mapera
stream
Mapera village
(Maguu ward)
2.5 l/s 0.5 l/s CPU
84 Kilanga juu CPU Mipulu
stream
Kilanga juu village 1.5 l/s 1 l/s CPU
85 Luwaita B CPU Makina
stream
Luwaita village 0.63 l/s 0.316 l/s CPU
86 Akina mama na
maji mpendo
Mpendo
spring
Mtama village
(uteri ward)
0.4 l/s 0.1 l/s To be
registered
(new)

44
Annex 4: Water Quality Data Summary
Annex 4(a): Analytical Results
WATER SOURCE River River Lake River River Stream
SAMPLE LOCATION Songwe
(Kasumulu)
Kiwira
(Ipyana)
Itungi
port (Lake
Nyasa)
Lufilyo
(Ipinda)
Mbaka
(Mwaya)
Mambwe at
Mbambo
intake
DATE OF SAMPLING 26/07/2013 26/07/2013 26/07/2013 26/07/20
13
26/07/2013 26/07/2013
LABORATORY
NUMBER
Total Hardness 68 95.48 24 83.5 96.14 42
Total alkalinity 62 130 80 62 65 58
Settleable Matter 2.0 1.5 NIL 2.0 1.5 0.5
Calcium 13.6 18.2 7.2 16.4 19 10.8
Iron (Fe) 1.009 0.08 0.04 0.153 0.021 1.021
Dissolved Oxygen (DO) 52 78 47 45 60 70
Electrical Conductivity 140 300 180 180 180 140
Turbidity (NTU) 15.9 16.9 3.13 12.7 17.3 4.91
pH 8.4 8.2 7.9 8.1 7.9 7.9
Nitrates 1.009 0.013 0.118 ND 0.066 0.011
Phosphates 0.09 0.08 0.05 0.7 0.65 0.052
Chloride 7.922 18.02 9.451 16.765 16.01
1
9.051
Fluoride 0.97 0.38 0.022 0.33 0.24 0.88
Ammonia 0.70 0.006 0.015 ND ND ND
Nitrites 0.251 0.003 0.024 ND 0.017 ND
Water Temperature (°C) 25 25 25 25 25 25
Manganese 0.2 0.016 0.011 0.031 0.005 0.23
Total coli counts/100ml 17 28 12 47 10 3
Fecal coli counts/100ml 6 8 2 20 7 1
Total Dissolved Solids 82.8 179 107.8 106.7 106 84.1
Sulphates 1.5 0.23 0.17 2 1.9 0.04
Magnesium 8.31 11.09 1.46 10 11.58 3.65
Permanganate Value 1.8 1.85 1.6 1.95 2.75 2

45
Note: The unit for Electrical Conductivity is μS/cm). Other parameters without units should read as
mg/L: ND = Not detected
Parameters SI Units Results Tanzania Std Remarks
Colour Pt/Co 286 <50 Colored Water
E, Cond. µs/cm 145.2 2000 -
PH - 7.34 6.5-9.2 Alkaline Water
TDS Mg/l 71 500 -2000
SS Mg/l 17 Not Specified -
DO Mg/l 5.3 4 - 6.0 Normal
Temp. Oc 24.4 Not specified
T. Alkalinity Mg/l 52.8 200-600 Normal
T. Hardness Mg/l 40 200-600 very soft water
Sulphate Mg/l Nil <600 Normal
Nitrite Mg/l 0.008 <1.0 Normal
E. Coli Count/100mls <300 0
T. Coliform Count/100mls >2000 < 3
Village Lugali Myangayanga Ntunduwalo Ndumbi
DISTRICT Mbinga Mbinga Mbinga Mbinga
REGION Ruvuma Ruvuma Ruvuma Ruvuma
SOURCE Namuda Stream Lufyoto Stream Local well Lake-Nyasa
Coordinates S.100 52.703'' S.10
0 58.500'' S.10
o14.450
// S.10
o36.674
//
E.0340.51.330'' E.034
0.55.290'' E.035
o39.357
/ E.034
o37.382
/
S.DATE 23/8/2013 23/8/2013 10/09 2013 10/09 2013
Colour NIL 83 Not analysed Not analysed
PH
7.1 6.27 6.21 8.4
E.C 76 21.6 50.4 219.8
TDS 36.5 11 25 108
TSS 2 27 Not analysed Not analysed
NH3 NIL 0.09 0.01 0.01
E.COL NIL 5 Not analysed Not analysed
T,Coli Not analysed 67 Not analysed Not analysed
BOD Not analysed 2 Not analysed Not analysed
COD Not analysed 4 Not analysed Not analysed

46
Annex 4(b) Table of Water Sample Results (Lake Nyasa Basin)
VILLAGE MKALI LITUHI NDOLEL
A
KIPULILO LUILO KIPENGERE
DISTRICT NYASA NYASA SONGEA LUDEWA LUDEWA NJOMBE
REGION RUVUMA RUVU
MA
RUVUM
A
RUVUMA RUVUMA NJOMBE
SOURCE Mbawa
river
Ruhuhu
river
Ruhuhu
river
Mchuchuma
river
Mchuchuma river NKIWE river
SAMPLING POINT
AT
Bridge
At
Panton
At
Bridge
At
Bridge
At
Kipangala
At Mafinga
SAMPLING DATE
16/4/201
3
16/4/2
013
17/4/20
13
18/4/2013 18/4/2013 18/4/2013
LAB.NO. 84/2013 85/201
3
86/2013 87/2013 88/2013 89/2013
REQUESTED BY SMEC SMEC SMEC SMEC SMEC SMEC
PARAMETERE SI UNIT
PH 6.14 6.92 7.63 7.63 7.72 6.1
E.C µs/cm 33.9 71.25 28.75 165.2 172.6 11.4
TDS Mg/l 16.9 35.6 14.7 82.7 88.1 5.8
SULPHATE Mg/l 1.0 NIL 4.0 15.0 1.0 22.0
IRON Mg/l 0.03 0.14 0.18 0.19 0.2 0.21
E.COLI Counts/10
0mls
96 83 45 6 - 53
TEPMPERATURE Ċ 21.1 24.4 23.9 24 21.9 18.3
SEDIMENTS mg/l 0.05 0.8 0.1 0.04 0.5 0.02
TOTAL
PHOSPHORUS
Mg/l
0.93 1.09 0.5 20.0 0.5 37.28

47
TABLE OF RESULTS-cont.
VILLAGE LUPALILO BULONGWA KITULO Farm KITULO Farm ISAKA
KIWIRA
MWAKALELI
DISTRICT MAKETE MAKETE MAKETE MAKETE RUNGWE RUNGWE
REGION NJOMBE NJOMBE NJOMBE NJOMBE MBEYA MBEYA
SOURCE LUMBIRA
river
Lumakali river Mkali river Mkali rivre KIWIRA
river
Lufirio river
SAMPLING POINT
AT
Lupalilo
At
Bridge
S09007.630
E033054.361
S09007.630
E033054.361
S09010.279
033032.04
S09009.172
E033032.046
SAMPLING DATE
19/4/201
3
19/4/2013 19/4/2013 19/4/2013 19/4/2013 20/4/2013
LAB.NO. 90/2013 91/2013 92/2013 93/2013 94/2013 95/2013
REQUESTED BY SMEC SMEC SMEC SMEC SMEC SMEC
PARAMETERE SI UNIT
PH 6.54 6.81 7.02 7.24 7.77 7.05
E.C µs/cm 13.1 24.0 42.7 45.9 125.5 79.3
TDS Mg/l 6.95 12.7 26.8 25.9 65.5 43.2
SULPHATE Mg/l 9.0 4.0 54.0 NIL 1.0 2.0
IRON Mg/l 0.2 0.19 0.23 0.22 0.28 0.24
E.COLI Counts/100
mls
56 34 1 NIL 5 13
TEPMPERATUR. Ċ 15.1 16.8 15.4 17.4 19.9 16.9
SEDIMENTS mg/l 0.04 1.6 0.02 0.02 2.0 1.0
TOTAL
PHOSPHORUS
Mg/l
9.92 22.56 4.38 33.12 28.36 1.75

48
TABLE OF RESULTS-cont.
VILLAGE KIPAPA MBAMBO BWATO MASABE KIWIRA
port
KASUMULU
DISTRICT RUNGWE BUSOKELO KYELA KYELA KYELA KYELA
REGION MBEYA MBEYA MBEYA MBEYA MBEYA MBEYA
SOURCE Lufirio river Mbaka river Lufirio river Mbaka river LAKE
NYASA
Kiwira river
SAMPLING POINT
S09017.424
033053.993
S09020.447
E033047.082
S09028.782
E033054.371
S09032.561
E033053.224
S09037.112
033067.929
At Bridge
SAMPLING DATE
20/4/2013 20/4/2013 20/4/2013 20/4/2013 21/4/2013 21/4/2013
LAB.NO. 96/2013 97/2013 98/2013 99/2013 100/2013 101/2013
REQUESTED BY SMEC SMEC SMEC SMEC SMEC SMEC
PARAMETERE SI UNIT
PH 7.5 7.53 7.07 6.86 8.26 7.58
E.C µs/cm 91.6 112.7 83.3 111.8 259.0 119.5
TDS Mg/l 47.5 56.15 41.1 52.9 115.1 57.7
SULPHATE Mg/l NIL 6.0 NIL 1.0 1.0 NIL
IRON Mg/l 0.1 0.17 0.29 0.16 0.06 0.04
E.COLI Counts/100mls 19 20 25 35 8 25
TEPMPERATUR. Ċ 21.3 23.3 22.3 25.2 28.7 24.6
SEDIMENTS mg/l 1.4 0.1 0.8 0.4 0.002 0.4
TOTAL PHOSPHATE Mg/l
1.97 2.16 1.44 1.77 0.05 1.27

49
TABLE OF RESULTS-cont.
VILLAGE KASUMULU IKUMBILO
DISTRICT KYELA ILEJE
REGION MBEYA MBEYA
SOURCE Songwe river Songwe
river
SAMPLING POINT
S09035.368
E033046.586
S09029.116
E033042.056
SAMPLING DATE
21/4/2013 21/4/2013
LAB.NO. 102/2013 103/2013
REQUESTED BY SMEC SMEC
PARAMETERE SI UNIT
PH 7.08 7.28
E.C µs/cm 100.8 76.0
TDS Mg/l 47.1 36.7
SULPHATE Mg/l NIL 1.0
IRON Mg/l 0.08 0.10
E.COLI Counts/100mls 25 15
TEPMPERATURE Ċ 25.7 24.4
SEDIMENTS mg/l 1.6 2.3
TOTAL PHOSPHATE Mg/l
NIL 0.66

50
Annex 4(c): The Results of Water Analysis from Ngaka River at Tancoal Mining Company-Luanda
PARAMETERS SI UNIT RESULTS OBSERVED
Village Ngaka Ngaka Ngaka Ngaka
District Mbinga Mbinga Mbinga Mbinga
Source POND-1 POND-2 River Traditional well
Date of sampling 08/03/2013 08/03/2013 08/03/2013 08/03/2013
Date of analysis 11/03/2013 11/03/2013 11/03/2013 11/03/2013
Sampling point At down Fish
Pond
At upper Fish
Ponds
At Nyamaviva
river
Traditional well
near Nyamaviva
river
Laboratory number 70/2013 71/2013 72/2013 73/2013
Turbidity NTU 29.20 10.20 136.00 61.70
PH 4.02 6.47 7.09 6.55
Electric conductivity µs/cm 147.60 42.10 103.40 43.60
Total dissolved
solids(mg/l)
mg/l 73.40 21.00 51.00 21.00
Dissolved oxygen(mg/l) mg/l 1.12 3.95 4.80 4.50
Total Alkalinity (mg/las
CaCO3)
mg/l
18.00 32.00 54.00 28.00
Total hardness(mg/las
CaCO3)
mg/l 55.00 6.00 42.00 6.00
Sulfate (mg/l SO4) mg/l 138.00 Nil 12.00 8.00
Iron(mg/l Fe) mg/l 0.05 0.04 0.23 Nil

51
Annex 4 (d) Water pollution control and enforcement
NA. AREA OF WATER
SAMPLE COLLECTED
SOURCE RESULTS
(COUNTS/
100mls)
No. OF
SAMPLES
REMARKS
1 Seedfarm S/W Nil 2 Satisfactory
2 Masigira B/H 8 2 Unsatisfactory
3 Masigira B/H 4 2 Unsatisfactory
4 Bombambili Local well (dry
well)
19 2 Unsatisfactory
5 Ndengu Lupembe Stream 35 2 Unsatisfactory
6 Ndengu Stream 2 2 Unsatisfactory
7 St. Augustino High
School
Stream 5 2 Unsatisfactory
8 Makita Sec. School DP Nil 2 Satisfactory
9 At Market Mbinga DP Nil 2 Satisfactory
10 Jimboni Mbinga DP Nil 2 Satisfactory
11 Peramiho Mission B/H 6 2 Unsatisfactory
12 Shule ya Tanga Lukala B/H 6 2 Unsatisfactory
13 Shule ya Tanga Near
Dispensary
B/H 35
2
Unsatisfactory
14 Mbambi Mbinga Spring 1 Satisfactory
15 Puguru Mbinga Spring 1 Satisfactory
16 Puguru Mbinga At Intake 1 Satisfactory
NB: SI Units:
E.Coli = (Counts/100mls)
Results obtained for Physical/Chemical lies within the allowable Tanzania Standards
for analysed parameters.

52
Annex 4(e): Water Quality Sampling Pictures
Songwe River at Kasumulu Gauging station
Kiwira River at Ipyana Gauging station

53
Lake Nyasa at Itungi Port
Water sampling at Mbaka River
Water sampling at Lufilyo River

54
Sampling at Mbambo intake Mambwe stream(Kyela district)
Part of Mbeya zonal water quality laboratory
Annex 5: Installation and Configuration of Automatic Rainfall Stations
Tenende Met station (Kyela)