Embed Size (px)
Citation preview
88th Session JOINT COMITTEE PRINT
THE UNITED STATES BALANCE OF
PAYMENTS-PERSPECTIVES AND POLICIES
STAFF MATERIALS AND OTHER SUBMISSIONS
PREPARED FOR THE USE OF THE
JOINT ECONOMIC COMMITTEECONGRESS OF THE UNITED STATES
24-974
Printed for the use of the Joint Economn; Committee
U.S. GOVERNMENT PRINTINGOFFICE3
WASHINGTON: 1967
For sale by the Superintendent of Documents, US. Government Printing OffieeWashington 25, D.C. - pre 45 cents
JOINT ECONOMIC COMMITTEE(Created pursuant to see. 6(n) of Public Law 304. 79th Cong.)
PAUL H. DOUGLAS, Illinois, ChairmanRICHARD BOLLING, Missouri, Vice Chairman
SENATE HOUSE OF REPRESENTATIVESJOHN SPARKMAN, Alabama WRIGHT PATMAN, TexasJ. W. FULBRIGHT, Arkansas HALE BOGGS, LouisianaWILLIAM PROXMIRE, Wisconsin HENRY S. REUSS, WisconsinCLAIBORNE PELL, Rhode Island MARTHA W. GRIFFITHS, MichiganJACOB K. JAVITS, New York THOMAS B. CURTIS, MissouriJACK MILLER, Iowa CLARENCE E. KILBURN, New YorkLEN B. JORDAN, Idaho WILLIAM B. WIDNALL, New Jersey
JAMES W. KNowLEs, Executive DirectorMARIAN T. TRACY, Financial Clerk
HAMILTON D. GEWEER, Adminietrative Clerk
ECONOMISTSWILLIAM H. MOORE THOMAS H. BoGGs, Jr.UEBALD A. POLLACx ALAN P. MURRAY
DONALD A. WEBSTER (Minority)
lI
I
LETTER OF TRANSMITTAL
NOVEMBER,12, 1963.To the Members of the Joint Economic Committee:
Transmitted herewith for the use of the Joint Economic Committeeand other Members of Congress is a collection of five statementsconcerning various aspects of the U.S. balance of payments.
The first was prepared by the committee's international economist,Dr. Gerald A. Pollack. It outlines the U.S. international paymentsand financial position, the policies of the United States and othernations affecting the U.S. balance of payments, and certain proposalsfor reforming the international monetary system.
The second was prepared by the program coordination staff of theAgency for International Development. This paper relates thebalance-of-payments impact of aid to the function that aid serves inour foreign policy. It assesses the magnitude of that impact in relationto aid expenditures, and discusses policies that have been adopted toreduce the unfavorable balance-of-payments effects of aid.
The third, contributed by the Department of Defense, relates theU.S. balance-of-payments costs on military account to our overallstrategic objectives and requirements. It explains why, with Europeenjoying new heights of prosperity, we continue to maintain largeforces there. It also discusses the relative contributions of the UnitedStates and its allies to the common defense effort, and details newdevelopments in the Defense Department's program to reduce theadverse effect on the balance of payments of its overseas program.
The fourth statement, by Dr. A. B. Hersey, of the Board of Gov-ernors of the Federal Reserve System, discusses the behavior of Ameri-can imports and exports, and changes in capital movement duringbusiness cycles here and abroad.
The fifth statement, by Dr. Jack C. Rothwell, of the Federal ReserveBank of Philadelphia, examines the impact of economic growth on thebalance of payments.
The collection includes also as an appendix a compilation by the De-partment of State of quantitative restrictions maintained on imports.by certain foreign countries. I have been advised by the Departmentof State that some of the quantitative restrictions maintained byAustria, Belgium, Luxembourg, Canada, France, Germany, Italy,Japan, the Netherlands, Sweden, and the United Kingdom may not becompatible with the obligations of these countries under the GeneralAgreement on Tariffs and Trade.
The views expressed in this collection of statements are the corf-tributors' and not necessarily those of the Joint Econmoic Commninttee.or its individual members.
Faithfully,PAUL H. DO0YGLAS,. Chairmaman
mu
CONTENTS
PartI. Perspectives on the U.S. International Financial Position, by Gerald Page
A. Pollack, international economist, Joint Economic Committee_II. Foreign Assistance Criteria and Balance-of-Payments Problems, by
the program coordination staff, Agency for International Develop-ment - 6 L
III. Defense Programs and the Balance of Payments, by the Departmentof Defense ---------------------- 75
IV. Business Cycle Influences in the United States Balance of Payments,by A. B. Hersey, adviser, Division of International Finance, Boardof Governors of the Federal Reserve System -_-_10-- -
V. Will Growth End the Payments Deficit: The Lessons of Past Experi-ence, by Jack C. Rothwell, economist, Federal Reserve Bank ofPhiladelphia -------- 1-------------- 117
APPENDIX
Quantitive Restrictions Maintained on Imports by Certain ForeignCountries, by the Bureau of Economic Affairs, Department of State---- 127
V
PART I
PERSPECTIVES ON THE UNITED STATESINTERNATIONAL FINANCIAL POSITION
ByGERALD A. POLLACK, International Economist,
Joint Economic Committee
1
TABLE OF CONTENTS
Part pageI. The meaning of the balance-of-payments deficit - - 3
II. The nature of the international monetary system - - 6III. The U.S. international liquidity positions - - 8IV. The United States as international banker - -13V. The U.S. international asset position -14
VI. U.S. experience in the postwar period -17VII. Causes of the payments deficit -19
VIII. Balance-of-payments policies of the United States -33A. Export expansion -35B. Tourism- 36C. Federalexpendituresabroad- 36D. Capital flows -------------------- 37E. Special measures to finance the deficit - - - - 37F. Cooperative policies with other countries - - - 38
IX. The policies of other countries - - - -381. Quantitative restrictions on imports - - -402. The Common Market agricultural policy - - - 413. Capital market controls by the surplus countries --- 414. Restrictions on tourism by foreign countries - - - 465. Export subsidies ------------ 476. The remission on exports of direct and indirect taxes --- 487. Discrimination against U.S. exports for balance-of-payments
reasons by members of regional economic groups --- 498. Sharing the burdens of economic assistance and military
defense ---------------------------- 499. Cooperation in international monetary affairs - - - 51
(a) The Treasury's new nonmarketable foreign currencyseries bonds - - 51
(b) Monetary and fiscal policies -_-_ 51(c) Commercial policies- 52(d) Conversions of dollars into gold -52
X. International liquidity and proposals for reform - - - - 53(1) Devaluation of the dollar relative to other currencies, or in
concert with other countries - - 55(2) Flexible exchange rates - -56(3) The establishment of a credit-creating international central
bank- 57(4) Multiple key currency system - -58
2
PERSPECTIVES ON THE UNITED STATESINTERNATIONAL FINANCIAL POSITION
GERALD A. POLLACK, INTERNATIONAL ECONOMIST, JOINT ECONOMICCOMMITTEE
I. THE MEANING OF THE BALANCE-OF-PAYMENTS DEFICIT
The U.S. balance of payments has been in deficit every year since1949, except 1957. The deficits were welcomed in the early postwaryears because they helped the rest of the world to rebuild reservesthat had been depleted by the distortions of war and the needs ofreconstruction. It became apparent after 1958, however, that U.S.deficits were adding dollars to the reserves of other countries at arate faster than those countries desired. The persistence of U.S.balance-of-payments deficits has, in recent years, caused widespreadconcern regarding the future international role and stability of thedollar, and the future of the international monetary system. Beforeconsidering the elements contributing to this deficit, it is well to beginby examining precisely what is meant by the U.S. balance-of-paymentsdeficit.
The deficit under the official U.S. definition, measures the reduc-tion m UTfS. monetary reserve asse s (dtieflyWgold) and the increase inliquid liabilities. Stated another way, it measures the decline,during the period covered, in the U.S. ability to defend the exchangevalue of the dollar with liquid resources owned by or automaticallyavailable to the monetary authorities.' This definition is heavilyqualified with respect to the liquid resources it takes into account.But a less qualified definition of the deficit would not be measurablewith statistical means, no matter how refined the available data. Wewould, of course, like to know the overall capacity, or change in overallcapacity, of the United States to defend the value of the dollar. Yetthe means available for this defense include not only the U.S. goldstock, U.S. holdings of foreign currency, and U.S. automatic drawingrights at the IMF, all of which are measurable, but also the U.S.capacity to borrow abroad which, though large, is not measurable.Moreover, this ability will presumably vary with the circumstances ofthe United States and of the creditor countries at the time, credit issought.
The definition does not take into account liquid international assetsowned by American residents which, though measurable, are notcontrolled by the monetary authorities in the absence of extraordinarylegislation. A U.S. resident contributes to the reported deficit if hedraws down his balance in an American bank to open a demanddeposit. abroad. The increased dollar holdings of the foreign bankare an indirect claim against the U.S. monetary authorities, whilethe corresponding increase in privately owned liquid claims on
I For a comprehensive discussion of the definition and measurement of the deficit, see Walther Lederer,"The Balance on Foreign Transactions: Problems of Definition and Measurement" (Princeton University,International Finance Section Special Papers in International Economics No. 5, September 1963.)
3
PERSPECTIVES AND POLICIES
foreigners is not directly within their reach. The recorded deficit isthus a limited measure, which focuses generally on the relationshipbetween certain conventionally defined short-term assets and liabili-ties, and, in these terms, measures the deterioration in the U.S.liquidity position from year to year.
The present measure of the deficit counts as equally significant theloss of a dollar of U.S. gold reserves and a dollar increase in liquidliabilities to foreigners. From a number of viewpoints, however, theloss of gold is more serious than an equal increase in liquid liabilities.As a simple matter of arithmetic, U.S. gold reserves decline more as apercentage of U.S. liquid liabilities to foreigners when the deficit isfinanced through gold sales than when it is financed through increaseddollar holdings by foreigners. Moreover, the implications for thedefense of the dollar of increases in liquid liabilities to foreigners varysubstantially according to the countries acquiring the liquid dollarholdings. Canada and Japan, for example, tend to hold their inter-national reserves largely in U.S. dollars, while the British monetaryauthorities, who also manage a reserve currency, tend to convert almostall of their dollar acquisitions into gold. The seriousness to the U.S.monetary authorities of a given volume of outstanding liquid liabilitiesrelative to the U.S. gold stock thus depends on the identity of thecountries in which such holdings are concentrated.
The distinction between liquid and nonliquid claims and liabilities,which is a necessary aspect of the official measure of the paymentsdeficit, must be arbitrary, for liquidity is not a matter of absolutes,but of degree along a continuous spectrum. The problem of distin-guishing usefully between short- and long-term assets and liabilitiesis, of course, inherent in the preparation of all statements indicatingfinancial condition, and arises in a number of other applications in-cluding the definition of the money supply. In measuring the balance-of-payments deficit, not all changes in short-term assets and liabilitiesare included. Changes in the amount of U.S. currency held abroadcannot be determined from available sources of data; and short-termliabilities of U.S. nonfinancial concerns to foreigners, such as accountspayable, are not classified as liquid liabilities because they are nottransferable and are not considered monetary assets or close substi-tutes. Claims of this type are not payable on demand, but areterminated or renewed according to the terms of commercial contracts.
Moreover, the necessity of maintaining a sharp distinction betweenliquid and nonliquid assets and liabilities has, on occasion, poseddifficulties for the authorities. The United States, late in 1962,began to sell to official institutions of foreign countries nonmarketablebonds denominated in their currencies. These bonds typically havematurities of 15 months to 2 years and would normally all be classifiedas long-term liabilities. However, some of these bonds are sold onterms which permit the lender to convert them into the specifiedcurrencies on several days' notice. This provision was incorporatedto accommodate certain foreign central banks which, despite theirstated intention of holding the bonds until maturity, wished or wererequired to reserve their legal right to earlier repayment. The classi-fication of these bonds in the official balance-of-payments statisticsis equivocal. Formally speaking, given a choice between the liquidand nonliquid categories, a bond which may be converted on a fewdays' notice at the lender's option would have to be regarded as aliquid liability by the borrower.
4
PERSPECTIVES AND POLICIES 5
There has, however, been some difference of opinion as to theliquidity of these bonds from the economic point of view. Someobservers have noted that the bonds are regarded by their holdersas a part, not materially different from other parts, of their inter-national reserve assets, which they maintain for use in emergenciesas well as to finance ordinary payments deficits.2 The original inten-tion of the bondholders to retain the bonds until maturity might haveto be revised under crisis circumstances that cannot be anticipated.This line of reasoning has led some observers to conclude that thebonds should be regarded as liquid liabilities to the United Stateson economic as well as formal grounds.
However, other observers have concluded that, considering thestated intentions of the lenders and the inherent advantages ofholding these bonds to maturity, the liquidity of the convertible bondsfrom the economic viewpoint may be regarded as much closer tononconvertible bonds of the same maturity than it is to the foreignholdings of U.S. Treasury bills and demand deposits. This exampleillustrates that the economic distinction between liquid and nonliquidassets and liabilities may in some instances be less clear cut than theformal distinction.
Sometimes difficulties of classification arise from inadequacies ofavailable data. For example, the reporting authorities recognize thatforeign holdings of marketable Treasury bonds and notes should beclassified as liquid or nonliquid liabilities depending on whether theparticular bonds and notes purchased or sold by foreigners have lessor more than 1 year before their due dates. But available informationdoes not suffice to sort out foreign holdings into these two groups.It is known, however, that the bulk of foreign-held Treasury bondsand notes are in the possession of foreign monetary authorities, andacquired when, regardless of their original maturities, these obliga-tions are nearly due.3 Therefore, all Treasury bonds and notes heldby foreigners are classified as liquid liabilities, even though some smallpart which cannot be measured is known to consist of obligationswith more than 1 year remaining to maturity.
The same difficulties of measurement affect the classification offoreign holdings of U.S. State, local, and corporate bonds. Here,also, the authorities cannot determine what part of foreign holdingsmatures in less than 1 year and what part in more. But there isreason to believe that foreign holdings of such obligations are concen-trated in the long-term maturity range. Therefore, all holdings ofthese types of bonds are classified as nonliquid.
This exploration of the meaning of the U.S. balance-of-paymentsdeficit has outlined some of the difficulties of measuring changes inthe U.S. ability to defend the exchange value of the dollar, and hasdescribed some of the difficult decisions that must be made in com-puting the reported deficits. Yet the deterioration in the U.S. inter-national liquidity position is a real phenomenon, not an optical illusion
I Countries may regard the convertible bonds issued by the United States as reserve assets, while theUnited States continues in balance of payments deficit, even if they are denominated in their own
currencies. For while the United States is in deficit, it is unlikely to hold sufficient amounts of the lenders'currencies to convert the bonds, and would therefore be obliged to buy such currencies with dollars orgold, thereby increasing the lenders' reserves.
* The monetary authorities of other countries regard Treasury obligations as a useful medium for holdingtheir dollar reserves, because they are able to earn interest without sacrificing significant liquidity. Mar-ketable Treasury bonds nearing maturity are free, to a major extent, of the risk of capital loss if their holdersshould need to sell them.
PERSPECTIVES AND POLICIES
which could be changed by using different bookkeeping principles.Other definitions of the deficit would alter the numbers for some years,but would probably not paint a very different picture of the U.S.experience over the long run. A committee appointed by the Directorof the Bureau of the Budget and headed by Dr. Edward M. Bernsteinis currently reviewing possible alternatives to determine what changes,if any, are desirable.
II. THE NATURE OF THE INTERNATIONAL MONETARY SYSTEM
The importance of measuring changes in the ability of the monetaryauthorities to defend the dollar stems directly from the nature of theexisting international monetary system, in which exchange rates aremaintained at stable levels. Under the Articles of Agreement of theInternational Monetary Fund (IMF), member countries have com-mitted themselves to preventing variations in the spot exchange ratesof their currencies from exceeding 1 percent of par. The preferencefor exchange rate stability among countries did not, of course, originatein these Articles of Agreement, but only found expression there.
If foreign exchange markets were free from governmental controlor intervention, exchange rates would fluctuate freely, in response tosupply and demand pressures. The demand for foreign exchangestems from all transactions involving payments to foreign residents forpurchases from them of goods, services, securities, and other financialassets, and transfers to them of gifts, pensions, debt repayments, andso forth. The supply of foreign exchange stems from foreigners' com-parable transactions with U.S. residents. The balance between thefree market forces of supply and demand normally changes over timeand, in the absence of official intervention, such changes would resultin variations in exchange rates.
If exchange relationships were widely believed to be in basic equilib-rium, small variations in exchange rates would induce private trans-actions of an offsetting nature, motivated by the desire to profit fromthe anticipated return of the exchange rate to its equilibrium level.Under such circumstances, exchange rates could be stable, even if themonetary authorities did not intervene. If, however, confidence inthe underlying stability of exchange rates were low, exchange ratefluctuations could be large, and pressures could arise for exchangerates to move persistently in one direction.
To permit exchange rate variations to the range permitted by theIMF Articles of Agreement, monetary authorities enter the market asbuyers or sellers of foreign exchange to the degree necessary to main-tain stability. When the demand for their own currency causes thatcurrency to increase in international value, the authorities add to theavailable supply by selling it in return for foreign exchange; and whenthe demand for their currency is weak and it falls in internationalvalue, they buy it, offering foreign exchange or gold in payment. Acountry's ability to keep its exchange rate from rising is greater thanits ability to prevent a change in the opposite direction, because it willalmost certainly exhaust its available stock of gold and foreign ex-change, and its capacity to borrow foreign exchange, before it findsitself unable to generate sufficient quantities of its own currency tokeep its exchange rate from appreciating.
Other countries have generally bought or sold dollars in conductingtheir stabilization operations. The supply of dollars available to
6
PERSPECTIVES AND POLICIES
these countries had its origin principally in the postwar balance-of-payments deficits 'of the United States. Their desire to acquire andwillingness to hold dollars has depended to an important degree onthe U.S. policy of selling gold to foreign governments and centralbanks at the fixed price of $35 per ounce. The foreign authorities,having acquired dollars in the course of their foreign exchange-activities, have from time to time reduced dollar holdings which they-regarded as excessive by selling dollars to the United States for gold.Until 1962, the United States left the day-to-day task of interveningin foreign exchange markets to the monetary authorities of othercountries and confined itself, in fulfilling its International MonetaryFund obligations, to buying or selling gold on demand. However, in1962, the United States also began to operate directly in the foreignexchange markets, using foreign exchange from debt repayments,foreign borrowings, and currency swaps.
The policy of standing ready to buy all gold offered to it at $35an ounce is important, even though the United States is, and has forsome time been, a net seller of gold. The U.S. commitment to buyback gold at the selling price, less a nominal service charge, assurespresent purchasers that the money value of their acquisitions will bepreserved, and contributes importantly to making gold a universalcurrency.
The problem of international liquidity is directly linked to themaintenance of fixed exchange rates. If the monetary authoritiesleft the determination of exchange relationships to free market forces,they would require no extensive international reserves. They would,however, still need international reserves to safeguard the nationalsecurity and cope with emergency situations. And they might, fromtime to time, wish to intervene in foreign exchange markets to preventviolent exchange rate fluctuations which could disrupt normal inter-national economic relationships and threaten the stability of domesticprice and cost levels. The amount of gold or foreign exchangeneeded to maintain stability in foreign exchange markets dependson the desired degree of stability, and on the strength, direction, andpersistence of the forces tending to change the exchange rate. Ifcountries were required to maintain exchange rates at perpetuallyfixed levels, and if nothing were done to improve and acceleratethe internal economic adjustment mechanism, some would probablyneed international liquidity in amounts which would be consideredvast by present-day standards, while others would be faced with theprospect of providing large amounts of credit or gaining massivereserves. Changes in the economic circumstances of the world'strading countries, however, need not produce changes in equilibriumexchange rate relationships, particularly if countries coordinatenational policies with a view to maintaining international equilibrium.But experience has shown that currency revaluations, at least fornonreserve currencies, are made necessary from time to time bychanging circumstances and existing limits to the internationalliquidity available to the deficit countries.
The IMF rules fall substantially short of requiring rigidly fixedexchange rates. Indeed, the Fund recognizes that changes in ex-change rates may be necessary if international equilibrium is to bemaintained. The Fund's Articles of Agreement provide that membersmay propose changes in their exchange rates "to correct a fundamental
7
8 PERSPECTIVES ANTD POLICIES
disequilibrium," although the Articles do not define what constitutessuch a disequilibrium.
Moreover, the Fund's rules permit some day-to-day economies inthe use of international reserves through the provision that membercountries may allow their spot exchange rates to vary within 1 percentof par in either direction. Deviations in the case of forward exchangerates are permitted up to limits that "the Fund considers reasonable."Modest changes in relative international price levels resulting fromthese limited exchange rate variations may promote equilibrating
:adjustments in private international transactions and thus reducethe volume of necessary reserves.
The significance of exchange rate stability varies greatly from coun-try to country, and is generally proportional to the internationaleconomic importance of the particular country concerned. Changesin the par values of small countries frequently go unnoticed by out-siders, except by specialists, while even modest changes in the rates ofindustrial countries, such as the 5-percent appreciation of the Germanmark and the Dutch guilder in 1961, generally provoke widespreadinterest and may, as in the case of the two currencies mentioned,induce substantial and destabilizing speculation if further currencyrevaluations are anticipated.
Changes in the par values of the two reserve currencies-the dollarand pound sterling-would differ in significance not only quantita-tively but qualitatively from changes in the value of any othercurrency. The reason is that these currencies are used to settle thebulk of all international transactions and to supplement gold in theinternational reserves of other countries. They thus contribute anelement of international liquidity without which the internationalmonetary system could not continue to function in its present form.
The countries that hold dollars do so voluntarily, and each decidesfor itself the quantities to be held, in absolute terms or in relation togold. Membership in the sterling area is optional, but implies cer-tain responsibilities with respect to reserve management. Holdingsof reserve currencies are an attractive alternative to gold because theyearn interest. On the other hand, they expose the holding countriesto the possibility of loss if the reserve currencies are devalued. Suchdevaluation could therefore seriously disrupt the international mone-tary system, for afterward the reserve currencies might no longer betrusted as a store of international value. The loss of reserve statusby the dollar and pound could force a dramatic contraction of inter-national liquidity, since reserve currency holdings presently constitutea large part, 36 percent, of total international reserves, as well asvirtually all of international working balances.
III. THE U.S. INTERNATIONAL LIQUIDITY POSITION
These comments on the role of reserve currencies emphasize thatthe ability of the United States to defend the value of the dollar is ofvital importance, not only from the national point of view, but fromthe viewpoint of the international monetary system. Suppose thatwe examine this ability in terms of the relationship between outstand-ing claims against the dollar and the liquid resources controlled by orautomatically available to the monetary authorities-the terms ofreference applied to the measurement of the U.S. balance of payments.
PERSPECTIVES AND POLICIES
On the side of the claims which may be brought to bear on thedollar, it is possible, of course, to indicate the claims which existed asof a given point in time, the change in their magnitude during a givenperiod, and to analyze their composition and the likelihood that theywill be presented for redemption into foreign exchange or gold. Butthe potential foreign claims against the dollar far exceed those out-standing at any moment in time, for, in the event that confidence inthe dollar were severely impaired, American residents owning dollarassets could sell such assets for foreign exchange and thus increaseforeign monetary authorities' holdings of dollars. The importance ofthis consideration is evident when we compare liquid liabilities toforeigners amounting to $26.7 billion at the end of June 1963 (seetable 1), with the U.S. domestic money supply of $148.2 billion andtime deposits of $105 billion also outstanding at the end of June 1963.In the event of a capital flight from the United States, some of theseand other domestic assets could theoretically be translated intoforeign exchange and, in the process, become claims against U.S.international assets. In practice, however, no massive conversionof domestic into international assets is likely to occur. In the past,even during periods of rapid inflation and currency devaluation,residents of the countries affected tended to flee from their owncurrencies into real assets, such as goods and real estate, rather thaninto foreign currencies.
The likelihood of an exchange crisis that would result in massivecapital flight from the United States depends not only on the Dresentrelationship between liquid assets and liquid liabilities, although that isprobably an important element in most cases. Fear of the outbreakof nuclear war, in which the productive assets of the United Statescould suffer grave damage, might provoke capital flight from theUnited States even if U.S. liquid assets significantly exceed liquidliabilities. On this score, however, the expanding network of inter-national monetary cooperation of the past few years has enhancedthe free world's capacity to cope with capital flight. It may also havecontributed to a calming of speculators' nerves; the crisis atmospheresurrounding the United States-Soviet showdown over Cuba in October1962 resulted in far less speculative capital outflow than the Berlincrisis 2 years earlier. Moreover, speculators might find some diffi-culty, if they anticipated the outbreak of nuclear war, in decidingwhat would be a safe haven for their funds.
Under conditions in which the basic health and viability of aneconomy are not widely questioned, the existing relationship betweenliquid assets and liabilities is less likely to undergo sharp and suddenchange, and is therefore a more useful indicator of a country's abilityto defend the value of its currency than it would otherwise be. Sup-pose that we examine the amount and composition of U.S. interna-tional reserve assets and the liquid claims against these assets, witha view to assessing the degree of vulnerability of the U.S. position.
A
9
10 PERSPECTIVES AND POLICIES
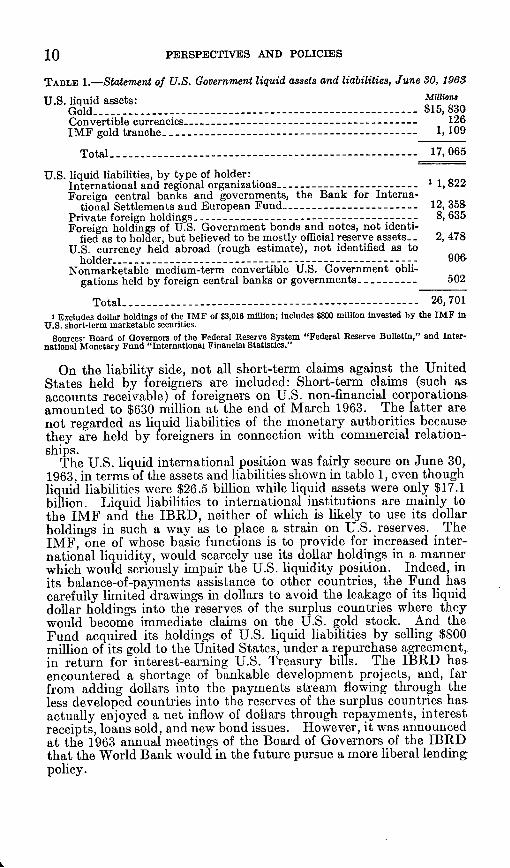
TABLE 1.-Statement of U.S. Government liquid assets and liabilities, June 30, 1963
U.S. liquid assets: MillionsGold - $15,830Convertible currencies - _----- ----- _ 126IMF gold tranche -_---- --- 1,109
Total- - 17,065
U.S. liquid liabilities, by type of holder:International and regional organizations - 1 1, 822Foreign central banks and governments, the Bank for Interna-
tional Settlements and European Fund - 12, 358Private foreign holdings -8, 635Foreign holdings of U.S. Government bonds and notes, not identi-
fied as to holder, but believed to be mostly official reserve assets - 2, 478U.S. currency held abroad (rough estimate), not identified as to
holder ------------------------------ 906Nonmarketable medium-term convertible U.S. Government obli-
gations held by foreign central banks or governments -502
Total ----------------------------------- 26, 701X Excludes dollar holdings of the IMF of $3,016 million; includes $800 million invested by the IMF in
U.S. short-term marketable securities.
Sources! Board of Governors of the Federal Reserve System "Federal Reserve Bulletin," and Inter-national Monetary Fund "International Financial Statistics."
On the liability side, not all short-term claims against the UnitedStates held by foreigners are included: Short-term claims (such asaccounts receivable) of foreigners on U.S. non-financial corporationsamounted to $630 million at the end of March 1963. The latter arenot regarded as liquid liabilities of the monetary authorities becausethey are held by foreigners in connection with commercial relation-ships.
The U.S. liquid international position was fairly secure on June 30,1963, in terms of the assets and liabilities shown in table 1, even thoughliquid liabilities were $26.5 billion while liquid assets were only $17.1billion. Liquid liabilities to international institutions are mainly tothe IMF and the IBRD, neither of which is likely to use its dollarholdings in such a way as to place a strain on U.S. reserves. TheIMF, one of whose basic functions is to provide for increased inter-national liquidity, would scarcely use its dollar holdings in a mannerwhich would seriously impair the U.S. liquidity position. Indeed, inits balance-of-payments assistance to other countries, the Fund hascarefully limited drawings in dollars to avoid the leakage of its liquiddollar holdings into the reserves of the surplus countries where theywould become immediate claims on the U.S. gold stock. And theFund acquired its holdings of U.S. liquid liabilities by selling $800million of its gold to the United States, under a repurchase agreement,in return for interest-earning U.S. Treasury bills. The IBRD hasencountered a shortage of bankable development projects, and, farfrom adding dollars into the payments stream flowing through theless developed countries into the reserves of the surplus countries hasactually enjoyed a net inflow of dollars through repayments, interestreceipts, loans sold, and new bond issues. However, it was announcedat the 1963 annual meetings of the Board of Governors of the IBRDthat the World Bank would in the future pursue a more liberal lendingpolicy.
PERSPECTIVES AND POLICIES 11
Central bank and private foreign holdings of dollars probablyconsist to a large degree of working balances for international trans-actions. Central bank dollar holdings are a direct claim on the U.S.gold reserve, but international monetary cooperation has reduced thedanger of widespread sales of dollars for gold. Of the dollar balancesrecorded as privately held, a large part are either deposits of foreignmonetary authorities with foreign private banks, or holdings ofprivate banks under contracts with their central banks for the ex-change of dollars for national currencies at specified future dates andexchange rates. Under U.S. reporting procedures, the ultimate ownerof foreign dollar deposits cannot always be identified.
Foreign private dollar holdings can readily be converted into officialholdings. If private holders sold their dollars on the foreign exchangemarkets, the exchange rate would tend to fall to the support level,and the monetary authorities would intervene by buying the dollarswith their national currencies. The monetary authorities would thusabsorb the excess of privately supplied over privately demandeddollars at the support level exchange rate. In this way foreign privatedollar holdings, which are not a direct claim against U.S. gold reserves,could quickly become such a claim if private holders lost confidencein the dollar. Indeed, foreign private dollar holders may be moreresponsive to changes in market psychology than cooperating centralbanks, and may thus pose a greater potential threat to U.S. reserves.
On the asset side, a large portion of the U.S. gold stock is requiredby law as reserve against the domestic currency. The FederalReserve Act provides that every Federal Reserve bank must main-tain reserves in gold certificates of no less than 25 percent against itsdeposits and its Federal Reserve notes in actual circulation. Inaddition, the U.S. Treasury must also maintain a gold reserve againstU.S. notes outstanding. The free gold reserves of the United Statesare then computed by subtracting the sum of the Federal Reserve andTreasury reserve requirements from the total gold stock of the UnitedStates.
On August 31, 1963, the Federal Reserve's cover requirement was$12,260 million, and the Treasury's, $156 million. Since the U.S. goldstock was $15,634 million on that date, the free gold stock was $3,218million. The free reserves have diminished rapidly, on the one hand,because Federal Reserve note and deposit liabilities have increasedand, on the other hand, because gold has been drained from U.S.stocks by sales to foreigners and to qualified domestic buyers. Be-tween August 31, 1962, and August 31, 1963, gold required as reservesincreased $405 million, while $506 million of gold was lost fromTreasury stocks to foreigners and qualified domestic buyers.
In his balance-of-payments message on February 6, 1961, thePresident stated that gold can be freed from the existing FederalReserve regulations, and he pledged that "the full strength of our totalgold stocks and other international reserves stands behind the value ofthe dollar for use if needed."
Under the Federal Reserve Act, the Board of Governors is author-ized (sec. 11, par. 4) to suspend gold reserve requirements "for aperiod not exceeding 30 days, and from time to time to renew suchsuspension for periods not exceeding 15 days * * *." There is nostated limit on the number of such renewals which may be permitted.Upon suspending the requirements, however, the Board must establisha tax graduated upward with the amount of the deficiencies.
24-974-63-2
12 PERSPECTIVES AND POLICIES
Chairman Martin of the Board of Governors has summarized pro-visions for this penalty tax as follows:
The tax could be very small for as long as the reserve deficiencies were confinedto the reserves against deposits and the first 5 percentage points of any deficienciesagainst Federal Reserve notes. If the reserve deficiencies should penetratebelow 20 percent of Federal Reserve notes outstanding, the tax would undergoa fairly steep graduation in accordance with statutory specifications.
The Federal Reserve Act further specifies that, should the reserve deficienciesfall below the 25-percent requirement against notes, the amount of the tax mustbe added to Reserve bank discount rates. But if the reserve deficiencies wereconfined to reserves against Reserve bank deposits, the required penalty tax couldbe nominal and no addition to Reserve bank discount rates would be necessary.4
The gold reserve requirement has become a controversial publicpolicy. It is generally acknowledged that the requirement servesno function in limiting the domestic money supply that could notequally well be provided by alternative means. But some feel thatit serves a useful purpose in restraining expansionary policies by theFederal Government and in disciplining the Government to followpolicies to restore and maintain balance-of-payments equilibrium.They believe that public officials would be reluctant to bring thingsto such a pass that the suspension machinery of the Federal Reserve,with all of its attendant publicity, would have to be set in motion.
Perhaps this attitude inadequately weighs the possibility thatgold losses to foreigners could continue at a substantial rate evenunder conditions of a balanced budget and even if the objective ofinternational payments balance were realized more rapidly than isnow anticipated. The existing dollar holdings of other countries arelarge, and there is reason to believe that some countries, not wishingto place pressure on the dollar while the United States is in balance-of-payments deficit, are holding somewhat greater dollar balances thanthey might otherwise desire. If the U.S. payments deficit wereeliminated and the position of the dollar strengthened, such countriesmight make the gold purchases that they had deferred. Thus,elimination of the U.S. payments deficit could temporarily acceleratethe gold outflow.
It would seem to be only prudent, in view of the rate at which theso-called free reserves have been shrinking, to allow for the possibilitythat they will be eliminated altogether in the next 2 to 3 years. Onthe basis of such short-term projections, some feel that it would beadvisable to reduce the statutory reserve requirement now rather thanwait for the seemingly inevitable action of the Board of Governors.Others favor reduction of the reserve requirement, but recommenddelay until confidence in the dollar is high. However, many expertshave concluded that the continuing decline in free gold reserves, quiteapart from the accompanying growth of liquid claims against thedollar, makes it appear questionable whether confidence will improverapidly enough to justify delay. Indeed, delay itself could at somepoint foster a decline in confidence, if official foreign dollar holdersshould become anxious concerning their continuing ability to buyU.S. gold at $35 an ounce.
In terms of the balance sheet of June 30, 1963, the U.S. net liquidityposition was negative, but examination of the various categories ofU.S. liquid liabilities is reassuring with respect to the ability of theUnited States to defend the dollar against the liquid liabilities that
dRemarks before the American Economic Association and American Finance Association, Dec. 2%, 1962.
12
PERSPECTIVES AND POLICIES
are the most immediate claims against U.S. reserves. Yet there is noroom for complacency. The U.S. international liquidity position isno longer as strong as it was in earlier years, and the achievement ofa better balance in the U.S. international accounts has become animportant objective of national policy
IV. THE UNITED STATES AS INTERNATIONAL BANKER
The United States performs in the international monetary systemsome of the functions that are provided within domestic economiesby commercial banks. Such banks typically have greater liquidliabilities than liquid assets and would not be regarded efficient asbusinesses if they did not. Thus, by analogy with commercial banks,the U.S. international liquidity position is normal. And the U.S.position appears favorable in comparison with that of the Britishwho manage the only other reserve currency. On June 30, 1963, theliquid assets, including the IMF gold tranche position, of the Britishmonetary authorities were 40 percent of liquid sterling liabilities toforeigners, while the comparable U.S. ratio was 64 percent.
Unfortunately, the analogy between the monetary authorities of areserve currency and a commercial bank is imperfect in certain impor-tant respects. The ability of a commercial bank in the United Statesto increase its liquidity is relatively much greater than the correspond-ing capacity of monetary authorities to increase their internationalliquidity. Commercial banks, as do all businesses, have assets tocorrespond to their liabilities. And they are able to arrange thecomposition of their assets in such a way that these assets fall alonga nearly continuous spectrum of liquidity-ranging from cash, toTreasury bills, Government bonds of increasing maturity, State, local,and corporate bonds, and commercial, industrial, and agriculturalloans. Broad national markets exist where, if need be, many of thesetypes of assets may normally be sold quickly and with little, if any,capital loss.
In the past, during national crises of confidence, when the bankingsystem as a whole attempted to liquidate its portfolio of securities, thenational securities markets could not serve as a means of increasingthe liquidity of the entire banking system. For, under such circum-stances, one bank's liquidity gain was another bank's loss. Experi-ence with numerous banking crises led the United States to establishthe Federal Reserve System-with authority to buy certain assetsfrom the commercial banks or to lend against such assets, and theNation thereby made great progress toward overcoming the maindefect of the previous system-that in times of emergency the bankingsystem as a whole could not convert illiquid assets into cash. Ofcourse, the experience of the early 1930's demonstrated that furtherprogress was needed along these lines, and resulted in a strength-ening of the Federal Reserve System. Other countries have estab-lished central banks which perform the same functions as the FederalReserve System.
But unlike commercial banks, the U.S. monetary authorities lackinternational assets to correspond in amount to their liquid liabilities,and while they can turn to the IMF as an international lender of lastresort, the Fulnd can only transfer limited resources while central banks,the national lenders of last resort, can create money. Had the United
13

PERSPECTIVES AND POLICIES
States generated its liquid liabilities to foreigners exclusively by im-porting more goods and services than were exported, the country as awhole-the private sector as well as the Government-would lackinternational assets to correspond to its liquid liabilities. But, as amatter of fact, U.S. investments abroad have been so large that theinternational assets of the United States as a whole grew even fasterthan liquid liabilities. The difficulty is that the monetary authoritesmust stand ready to meet the liquid claims against the dollar, while theassets belong chiefly to private parties in the United States who couldnot, under normal circumstances, be compelled or induced to turnthem over to the authorities. Moreover, financial institutions hold arelatively small share of the privately owned international assets, sothat the very institutions which might, in the normal conduct of theirbusiness, sell international assets to finance capital outflows are not ina position to do so on a material scale.
While the IMF provides valuable credit facilities to nations withbalance-of-payments deficits, these facilities are modest in terms of thedemands for liquidity which might result from a crisis of confidencein one or both of the key currencies. The IMF plays an importantrole in international finance, but does not do for the world what anational central bank does for its country.
Thus, the position of the United States as an international bankermust be carefully distinguished from that of a commercial bank. TheUnited States may well be in stable equilibrium with outstandingliquid liabilities exceeding liquid assets. But, lacking access toliquidity on a scale comparable to that available to commercial banks,the liquidity problem of the U.S. monetary authorities may becomemore urgent and serious than that of commercial banks which have thesame relationship between liquid assets and liabilities, if the U.S.payments deficit is not brought under control.
V. THE U.S. INTERNATIONAL ASSET POSITION
In contrast to its international liquidity position, the U.S. overallinternational asset position has improved steadily in the postwar years.The United States has borrowed short, as it were, and invested long.The popular characterization of the balance-of-payments deficit ismisleading when it suggests that the United States is living beyondits means and spending more than it earns. For these terms conjureup the vision of a spendthrift, who goes into debt to satisfy his desireto consume. Yet the United States has exported more goods andservices than it has imported in every one of its deficit years.
The flow of funds abroad for investment, while adding to U.S. long-term international assets, has contributed to the channeling of dollarsinto the reserves of the surplus countries, and the consequent deterio-ration of the U.S. liquidity position. If dollars for investment or otherpurposes flow abroad when the supply of dollars in exchange markets isalready abundant, the dollar exchange rate may decline to the supportlevel where the central bank of the country involved will intervene andbuy dollars with its own currency. An investor would thus obtain theforeign currency he needs to carry out his investment activities, butthe liquidity position of the United States would deteriorate.
In this chain of events, the ultimate credit is provided by the foreigncountry, which enables the investor to command its goods and services
14
PERSPECTIVES AND POLICIES 15
or financial assets in return for increases in its liquid claims againstthe U.S. monetary authorities. The foriegn government takes theplace of a U.S. resident as creditor of the United States with respect tothe dollar balances involved, and the United States may be called onto make good on its liabilities by redeeming those dollar balances ingold or foreign exchange instead of in dollars. In this way, Americaninvestors placing their funds abroad may contribute to the interna-tional liquidity problem of the United States. Paradoxically, if thesefunds are raised through borrowings in the U.S. long-term capitalmarket, as is frequently done, the liquidity position of the individualinvestor is protected even while that of the country itself may beeroded.
The flow of funds abroad for investment, while contributing to theannual balance-of-payments deficits, provides a source of strength forthe balance of payments in future years through the return flows ofinterest, dividends, and profit remittances, provided that the higherincome on investments is not more than offset by income losses result-ing from the substitution of production from overseas subsidiaries forU.S. exports. In 1962, alone, the inflow of these returns, stemmingfrom all private U.S. investments abroad made up to that time,totaled $3,850 million. Of course, only an extremely small part ofthese returns can be attributed to the new capital outflows of 1962.The foreign exchange payback period of an investment abroad isalmost always longer than 1 year. It would be erroneous, therefore,to calculate the balance-of-payments impact of 1962 investmentabroad by subtracting 1962 returns from 1962 outflows.
U.S. private long-term investments abroad, which stood at $12.3billion in 1946, exceeded foreign long-term investments in the UnitedStates by $5.3 billion in that year. In 1962, they reached $52.6billion, $32.4 billion greater than the comparable amount of foreigninvestment in the United States. The rapid growth of these long-term investments benefited to a large degree from the reinvestmentabroad of the earnings resulting from foreign direct investments. In1962, this amount of retained earnings totaled $1.2 billion (see table 2).The accumulation of assets abroad through the reinvestment of over-seas earnings does not appear in the balance-of-payments accounts asa capital outflow, since it involves no movement of dollars abroad.
TABLE 2.-Undistributed subsidiary earnings of U.S. direct investments abroad,1950-62
[Millions of dollars]
1950 - 475 1957 - 1,3631951 - 751 1958 -945---------- --1952 -923 1959 -1,0891953 -826 1960 - 1, 2661954 -702 1961 - 1,0541955 - 962 1962 - 1, 2021956 - 1,175
Sources: Department of Commerce "Balance of Payments Statistical Supplement Revised Edition"; and"Survey of Current Business," August 1963.
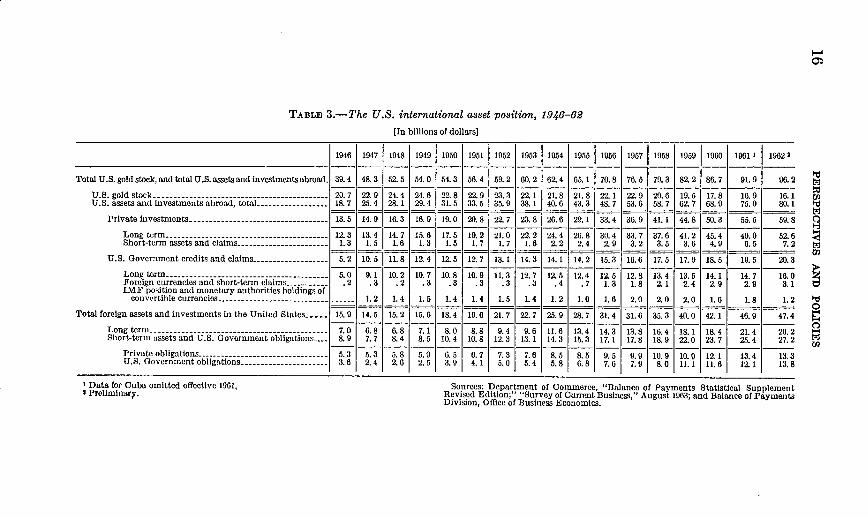
Table 3 shows the U.S. international asset position in each of thepostwar years. In a loose way we could speak of the international"net worth" of the United States, the difference between all inter-national assets and liabilities, as having risen from $23.5 billion in1946 to $48.8 billion in 1962. But differences in the quality and com-parability of the various assets and liabilities which enter into the
I-'
TABLE 3.-The U.S. international asset position, 1946-62[In billions of dollars]
1946 1947 1948 1949 1950 1951 1952 1953 1954 1955 1956 1957 1958 1919 1960 1961 1 19622
Total U.S. gold stock, and total U.S. assets and investments abroad. 39. 4 48. 3 52. 5 54. 0 54.3 56. 4 59. 2 60. 2 62. 4 65. 1 70. 8 76. 5 79. 3 82. 2 86. 7 91. 9 96. 2
U.S.goldstock -20.7 22.9 24.4 24.6 22.8 22.9 23.3 22.1 21.8 21.8 22.1 22.9 20.6 19.5 17.8 16.9 16.1U.S. assets and investments abroad, total -18. 7 25.4 28.1 29.4 31. 5 33. 5 35. 9 38.1 40. 6 43. 3 48. 7 53. 6 58.7 62. 7 68. 9 75. 0 80.1
Private investments -13. 5 14.9 16.3 16.9 19.0 20.8 22.7 23.8 26.6 29.1 33.4 36.9 41.1 44.8 50. 3 95.5 59. 8
Long term -12.3 13.4 14. 7 15. 6 17. 5 19.2 21.0 22.2 24.4 26.8 30.4 33. 7 37.6 41.2 45.4 49.0 92.6Short-termassetsandclaims -1.3 1.5 1.6 1.3 1.5 1.7 1.7 1.6 2.2 2.4 2.9 3.2 3.5 3.6 4.9 6.5 7.2
U.S. Government credits and claims -5. 2 10. 5 11. 8 12. 4 12. 5 12. 7 13.1 14. 3 14.1 14. 2 15. 3 16.6 17. 5 17. 9 18. 9 19. 9 20.3
Longterm -. 0 9.1 10.2 10.7 10.8 10.9 11.3 12.7 12.5 12.4 12.5 12.8 13.4 13.5 14.1 14.7 16.0Foreign currencies and short-term claims- .2 .3 .2 .3 .3 .3 .3 .3 .4 .7 1.3 1.8 2.1 2.4 2.9 2.9 3.1IMF position and monetary authorities holdings of
convertible currencies - -1.2 1.4 1. 9 1.4 1.4 1. 5 1.4 1.2 1.0 1.6 2.0 2.0 2.0 1.6 1.8 1. 2
Total foreign assets and investments in the United States 15. 9 14.5 15. 2 15. 6 18.4 19.6 21. 7 22. 7 25.9 28.7 31. 4 31. 6 35.3 40.0 42.1 46.9 47.4
Longtern- -7.0 6.8 6.8 7.1 8.0 8.8 9.4 9. 6 11.6 13.4 14.3 13.8 16.4 18.1 18.4 21.4 20.2Short-term assets and U.S. Government obligations -- 8.9 7. 7 8.4 8.5 10.4 10.8 12.3 13.1 14.3 15. 3 17.1 17.8 18.9 22.0 23.7 25.4 27. 2
Private obligations -9 5.3 5.3 5.8 5.9 6.5 6.7 7.3 7.6 8.5 8.5 9. 5 9. 9 10.9 10.9 12.1 13.4 13.3U.S. Government obligations -3.6 2.4 2.6 2. 5 3.9 4.1 5. 0 5.4 5.8 6.8 7.6 7.9 8.0 11.1 11.6 12 1 13. 8
I Data for Cuba omitted effective 1961,* Preliminary.
0
we
02
0I-3
02
Sources: Department of Commerce, "Balance of Payments Statistical Supplement,Revised Edition;' "Survey of Current Business," August 1963; and Balance of PaymentsDivision, Office of Business Economics.
PERSPECTIVES AND POLICIES
totals detract from the usefulness of a "net worth" concept in thisconnection. In 1962, for example, of $16 billion of U.S. Governmentlong-term claims against foreigners, roughly $3 billion were denomi-nated in nonconvertible currencies; and almost all of the $3.1 billionof U.S. Government holdings of foreign currencies and short-termclaims against foreigners were in inconvertible currencies. Theseassets could not well assist the U.S. authorities in defending the dollar.
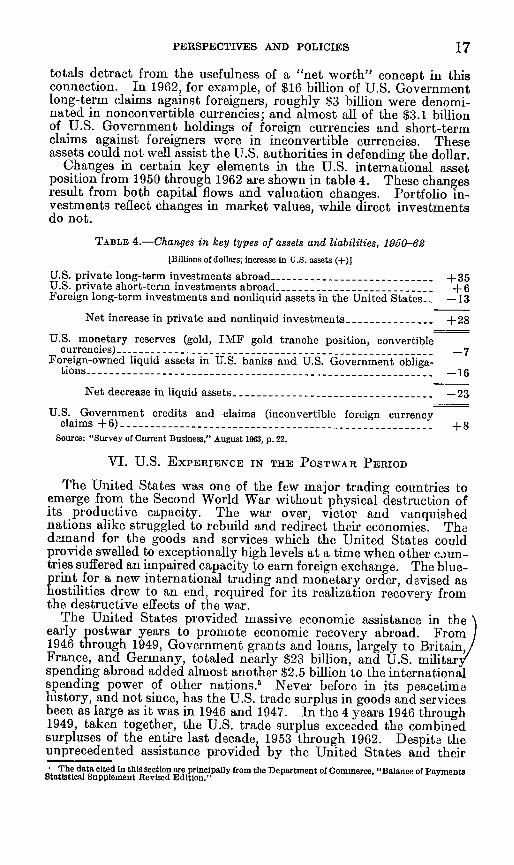
Changes in certain key elements in the U.S. international assetposition from 1950 through 1962 are shown in table 4. These changesresult from both capital flows and valuation changes. Portfolio in-vestments reflect changes in market values, while direct investmentsdo not.
TABLE 4.-Changes in key types of assets and liabilities, 1950-62[Billions of dollars; increase in U.S. assets (+)]
U.S. private long-term investments abroad -+35U.S. private short-term investments abroad- +6Foreign long-term investments and nonliquid assets in the United States- -13
Net increase in private and nonliquid investments -+28
U.S. monetary reserves (gold, IMF gold tranche position, convertiblecurrencies)- -7
Foreign-owned liquid assets in U.S. banks and U.S. Government obliga-tions -- 16
Net decrease in liquid assets -- 23
U.S. Government credits and claims (inconvertible foreign currencyclaims +6)- +8
Source: "Survey of Current Business," August 1963, p. 22.
VI. U.S. EXPERIENCE IN THE POSTWAR PERIOD
The United States was one of the few major trading countries toemerge from the Second World War without physical destruction ofits productive capacity. The war over, victor and vanquishednations alike struggled to rebuild and redirect their economies. Thedemand for the goods and services which the United States couldprovide swelled to exceptionally high levels at a time when other coun-tries suffered an impaired capacity to earn foreign exchange. The blue-print for a new international trading and monetary order, devised ashostilities drew to an end, required for its realization recovery fromthe destructive effects of the war.
The United States provided massive economic assistance in theearly postwar years to promote economic recovery abroad. From1946 through 1949, Government grants and loans, largely to Britain,France, and Germany, totaled nearly $23 billion, and U.S. militarspending abroad added almost another $2.5 billion to the internationalspending power of other nations.5 Never before in its peacetimehistory, and not since, has the U.S. trade surplus in goods and servicesbeen as large as it was in 1946 and 1947. In the 4 years 1946 through1949, taken together, the U.S. trade surplus exceeded the combinedsurpluses of the entire last decade, 1953 through 1962. Despite theunprecedented assistance provided by the United States and theiri The data cited in this section are principally from the Department of commerce, "Balance of PaymentsStatistical Supplement Revised Edition."
17
PERSPECTIVES AND POLICIES
own resort to exchange controls and import restrictions, other coun-tries depleted their foreign exchange and gold reserves to finance theiroverseas purchases. Their problem was intensified by substantial flowsof capital to the United States, appearing chiefly as unrecorded trans-actions in the U.S. accounts, seeking protection against devaluationor escape from exchange controls. U.S. gold reserves, which were$20.1 billion at the end of 1945, rose to a high point of nearly $24.8billion in 1949, while the dollar holdings of other countries fell nearly$1 billion during the same period and their gold reserves fell almost$3.5 billion, not counting their gold contributions to the IMF.
As Europe's economic recovery proceeded at a disappointinglyslow pace and difficulties with the Soviet Union multiplied, theUnited States changed the character of its assistance programs. Withthe implementation of the Marshall plan in 1948, emphasis wasshitted from loans to grants. In the decade 1946-55, U.S. Govern-ment nonmilitary grants, net, to certain leading European countrieswere, in millions of dollars: France, $3,725; Germany, $3,692; Italy,$2,491; the Netherlands, $838; and the United Kingdom, $3,741;U.S. Government long-term loans were: France, $2,461; Germany,$346; Italy, $414; the Netherlands, $388; and the United Kingdom,$4,783.In 1949, the alinement of exchange rates was altered on an importantscale for the first time since the end of the war. In September ofthat year, the United Kingdom, most overseas members of the sterlingarea, Sweden, Norway, Denmark, and the Netherlands devalued30.5 percent; France, 21.8 percent; West Germany, 20.6 percent;Italy, 8 percent; and Belgium, 12.3 percent. Austria devalued sub-stantially in November 1949, and adopted a multiple exchange ratesystem.
This series of devaluations was followed by a sharp decline in U.S.receipts from unrecorded transactions and errors and omissions,suggesting that speculation against their own currencies by Europeansmay have abated. Gains in the competitive positions of the devaluingcountries resulting from their new exchange rates and extraordinarydemands arising from the outbreak of the Korean war in 1950 jointlycontributed to a sharp increase in U.S. imports relative to exports.At the same time, American military spending abroad increaseddramatically. The U.S. trade surplus in goods and services fellseverely to an average level in the 4 years 1950 through 1953 onlyone-third of the 1948-49 level; and in 1950 the United States sufferedits first large postwar balance-of-payments deficit, nearly $3.6 billion,and lost more than $1.7 billion of its gold reserves.
Despite the beginning in 1950 of an almost uninterrupted series ofannual deficits in the U.S. balance of payments, little concern over thestability of the dollar was apparent until the late 1950's. Indeed, thegreater part of the decade of the 1950's echoed with prophecies thatthe world faced a chronic dollar shortage. Other countries, stillstruggling to rebuild their reserves, were glad to hold most of the dollarsthey were able to earn. Although conversions of dollars into gold wereby no means uncommon in the early 1950's, gold losses tended to befollowed by gains, and no continung trend of losses was evident. Inthe period 1950 through 1957, the U.S. gold stock declined only $1.7billion. The abnormal conditions of the Korean war which contributedto the first large postwar deficits were recognized as nonrecurring.And it was not anticipated that the large outflows of funds under the
18

PERSPECTIVES AND POLICIES 19
Government's aid and military programs would be as durable as theylater proved to be. Moreover, in all but two of the postwar deficityears before 1958, the year-to-year changes in the U.S. internationalliquidity position were modest. Had U.S. deficits continued at yearlylevels ranging around $1 billion to $1.5 billion, it seems reasonable tosuppose that the stability of the dollar would not have been broughtinto question. Increases in the dollar reserves of other countries at arate of this general magnitude would probably be appropriate in viewof the growth of international transactions.
But 1958 witnessed a dramatic deterioration in the U.S. interna-tional accounts. The favorable balance on goods and services account,which in 1957 had nearly regained the high levels of the late 1940's,fell sharply in 1958 and almost disappeared in 1959. The overallU.S. deficit in 1958 exceeded $3.5 billion and, following 2 years ofincrease, gold reserves declined nearly $2.3 billion, the largest annualgold outflow in American history. The deficit increased further in1959, while the trade surplus fell by more than $2 billion. In thatyear, tje United States lost more than $700 million in gold. Whenthe U.S. deficit rose still further in 1960 to the highest level everrecorded for the United States, it became evident for all to see thatmarket attitudes toward the dollar had changed. This change wasdramatized in the fall of 1960 by an outbreak of gold speculationwhich, for a brief period, raised gold prices on the London marketabove $40 an ounce.
Concerned over continuing deficits, the United States has takensteps in a large number of ways to promote equilibrium in the balanceof payments. These measures, which will be discussed below, helpedto bring about reductions in the recorded deficits of 1961 and 1962,although, if allowance is made for special Government transactions,no decisive improvement in the balance of payments has yet becomeevident. And it now appears tbat the deficit in 1963 will not be much,if at all, smaller than that of 1962. Improvement in the U.S. interna-tional economic position must therefore continue as a prime objectiveof public policy.
VII. CAUSES OF THE PAYMENTS DEFICIT
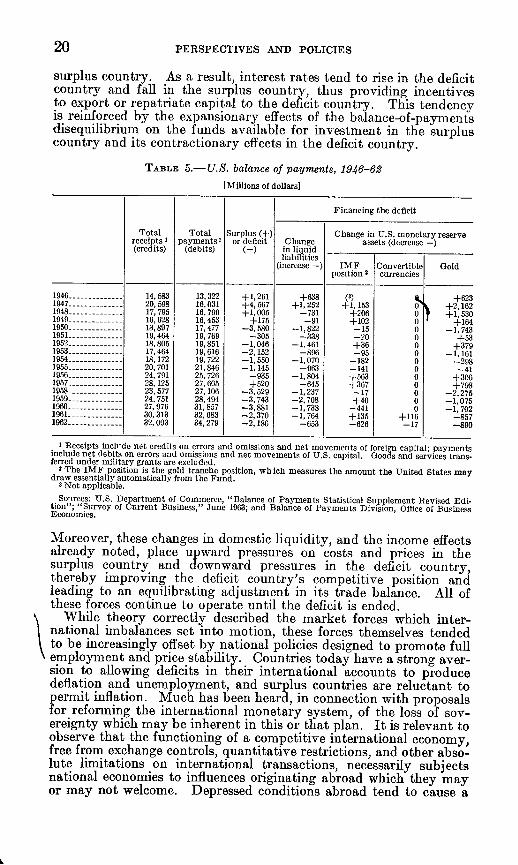
In 1950, when the United States suffered its first large balance-of-payments deficit of $3.6 billion, total U.S. receipts from all inter-national transactions were $13.9 billion. In 1962, U.S. receipts weremore than double the 1950 level; they reached $32.1 billion, the high-est level on record. But the deficit continued to exceed $2 billion.(See table 5.) Clearly the difficulty has not been that receipts havefailed to rise rapidly but rather that, however rapid their increase,payments have risen even quicker. In relation to total U.S. inter-national payments or receipts, the balance-of-payments deficits aresmall. Why have they failed to respond more promptly to therapy?
In theory, balance-of-payments deficits should be eliminatedthrough the operation of market forces set in motion by the deficitsthemselves. Deficits tend to have adverse effects on income levelsin the country losing liquidity and surpluses have opposite effects in thecountry gaining it; the deficit country therefore tends to import less,while the surplus country tends to import more. The decline in theinternational liquidity of the deficit country tends to be accompaniedby a shrinkage in its domestic liquidity. Opposite changes occur in the
20 PERSPECTIVES AND POLICIES
surplus country. As a result, interest rates tend to rise in the deficitcountry and fall in the surplus country, thus providing incentivesto export or repatriate capital to the deficit country. This tendencyis reinforced by the expansionary effects of the balance-of-paymentsdisequilibrium on the funds available for investment in the surpluscountry and its contractionary effects in the deficit country.
TABLE 5.-U.S. balance of payments, 1946-62
[Millions of dollars]
Financing the deficit
Total Total Surplus (+) Change in U.S. monetary reservereceipts I payments' or deficit Change assets (decrease-)(credits) (debits) (-) in liquid- _
liabilities(increase -) IMF Convertible Gold
position 2 currencies
1946 -14, 583 13,322 +1,261 +638 (3) iL+6231947 -20, 198 16,031 +4,567 +1, 252 +1, 153 0 +2,1621948 ---- ---- 17, 795 16, 790 +1,005 -731 +206 0 +1,5301949 16, 628 16, 453 +175 -91 +102 0 +1641950 -13,897 17,477 -3,580 -1,822 -15 0 -1,7431951 -19,464 19,769 -305 -338 -20 0 +531952 -18,805 19,851 -1,046 -1,461 +36 0 +3791953 -17, 464 19,616 -2,1552 -89 -915 0 -1,1611954 -------- 18,172 19,722 -1,110 -1,070 -182 0 -2981915 -------- 20,701 21,846 -1,141 -963 -141 0 -411956 -24, 791 25, 726 -931 -1,804 +563 0 +3061957 -28,125 27. 605 +520 -645 +367 0 +7981958 -23,577 27, 106 -3,529 -1,237 -17 0 -2,2751959 -24, 751 28,494 -3, 743 -2, 708 +40 0 -1,0751960 -27,976 31,857 -3,881 -1,738 -441 0 -1,7021961 -30, 313 32, 683 -2,370 -1,764 +135 +116 -8571962 -32, 093 34, 279 -2,186 -653 -626 -17 -890
X Receipts include net credits on errors and omissions and net movements of foreign capital; paymentsinclude net debits on errors and omissions and net movements of U.S. capital. Goods and services trans-ferred under military grants are excluded.
l The IMF position is the gold tranche position, which measures the amount the United States maydraw essentially automatically from the Fund.
3 Not applicable.
Sources: U.S. Department of Commerce, "Balance of Payments Statistical Supplement Revised Edi-tion"; "Survey of Current Business," June 1963; and Balance of Payments Division, Office of BusinessEconomics.
Moreover, these changes in domestic liquidity, and the income effectsalready noted, place upward pressures on costs and prices in thesurplus country and downward pressures in the deficit country,thereby improving the deficit country's competitive position andleading to an equilibrating adjustment in its trade balance. All ofthese forces continue to operate until the deficit is ended.
While theory correctly described the market forces which inter-national imbalances set into motion, these forces themselves tendedto be increasingly offset by national policies designed to promote fullemployment and price stability. Countries today have a strong aver-sion to allowing deficits in their international accounts to producedeflation and unemployment, and surplus countries are reluctant topermit inflation. Much has been heard, in connection with proposalsfor reforming the international monetary system, of the loss of sov-ereignty which may be inherent in this or that plan. It is relevant toobserve that the functioning of a competitive international economy,free from exchange controls, quantitative restrictions, and other abso-lute limitations on international transactions, necessarily subj ectsnational economies to influences originating abroad which they mayor may not welcome. Depressed conditions abroad tend to cause a
PERSPECTIVES AND POLICIES
decline in exports, a deficit in the balance of payments, and a sequenceof deflationary developments in the domestic economy. Conversely,inflation abroad induces expansion at home. It is perhaps not un-natural that governments should wish to achieve a greater measureof independence from economic forces arising from circumstancesbeyond their control and outside the territorial limits of theirauthority.
Whatever may be said for insulating the domestic economy fromoutside influences, the use of monetary and fiscal policies to preservedomestic stability has weakened the self-correcting tendencies ofinternational payments disequilibrium. It would be a mistake, how-ever, to believe that such tendencies have been completely nullified.They could be, in principle, although with difficulty. But in practice,deficit- and surplus-induced equilibrating forces appear to have beendamped, not eliminated. Indeed, while pursuing its own program forachieving a better international balance, the United States may alsobenefit from a continuation of cost and price increases in the surpluscountries which have their origin, in large part, in the growth of theirinternational reserves.
In general, it is obvious that any balance-of-payments deficit isfundamentally caused by a failure of market adjustments and policymeasures. But what are the particular causes of the U.S. postwardeficits? For an answer to this question, we must turn to the majoritems in the U.S. international accounts and attempt to determinetheir respective contributions to the overall deficit.
It is an unfortunate aspect of the structuring of accounting state-ments that they easily lend themselves to the mistaken interpretationthat the various categories of payments and receipts are independentof each other. Just as a business could not generally expect that theelimination of its advertising expenditures would increase pretaxprofits by the amount of the elimination, so the United States couldnot hope to accomplish overall balance-of-payments savings equal tothe reductions that might be achieved in any particular paymentsaccount. Expenditures have their counterparts in receipts through aseries of so-called feedback effects. Sometimes these effects are im-mediate and direct. Certain U.S. private investments abroad and alarge portion of the Government's grants and loans never take theform of cash outflows, but directly involve exports of goods. Evenwhen outflows of liquid funds take place, they may be closely linkedwith exports of goods and services. Short-term capital outflows, forexample, often serve to finance exports which could not have beensold in the absence of the financing. On the other hand, some formsof payments quickly find their way into the reserves of the surpluscountries and result in little, if any, counterbalancing effect on exports.
Ideally, we would be able to measure the net adverse effect of thevarious expenditure items in the balance of payments, taking intoaccount all feedback effects. But precise measurement in this area isimpossible. In the case of direct investment, for example, the feed-back effects themselves are multiple and conflicting. A particulardirect investment appears in the balance-of-payments accounts asan outflow of capital, and it usually gives rise to a return flow ofprofits, dividends, or interest. It may result in higher exports, ini-tially through shipments abroad of machinery and equipment to con-.struct overseas facilities, and later through exports of raw materials,
21

PERSPECTIVES AND POLICIES
components, and parts for processing and assembly in the new facili-ties. Moreover, subsidiaries abroad may assist an American corpora-tion in marketing finished products complementary with, but differentfrom, the products manufactured abroad. These favorable effects,however, may be offset, or even more than offset, by the loss of foreignmarkets for U.S. finished products as a consequence of the productionand sale abroad by American subsidiaries of goods that might other-wise have been exported from the United States. And Americanexports to third countries may suffer if such markets are served by thenew overseas subsidiaries instead of by the parent companies. More-over, American companies may find it profitable to supply domesticmarkets from their subsidiaries abroad instead of from domestic pro-duction, thereby swelling imports. These examples of displacementdo not necessarily indicate balance-of-payments losses to the UnitedStates equal to the amount of the displacements, for in each case it ispossible that, had American capital not taken advantage of availableopportunities abroad, foreign capital would have done so. And inthat event, the United States wouild not enjoy the offsetting benefits ofprofit and interest remittances.
It follows that the capital outflows reported in each balance-of-payments statement under "direct investments" are an inadequatemeasure of the actual overall balance-of-payments impact of suchinvestments. The accompanying adverse or beneficial effects of directinvestments, however, appear in the service and merchandise accounts,where they cannot be linked with the investment with which they areassociated, or they may not appear in the data at all if exports arekept from expanding to levels they would otherwise have reached.
The Government's economic assistance programs provide anotherillustration of the difficulties of measuring the adverse balance-of-payments effects of certain payments elements. Some aid programs,such as the disposal of surplus food under Public Law 480, take theform of transfers in kind rather than cash. Such transfers are nowrecorded in the U.S. balance-of-payments accounts as transactionsinvolving no immediate dollar outflow from the United States. Butsome part of the products distributed under these aid programswould probably have been sold on a commercial basis in the absenceof the Government's programs. Thus, even when aid programs in-volve no flows of liquid funds, they are likely to have some adverseimpact on the balance of payments. On the other hand, when aiddoes take the form of cash transfers, the actual balance-of-paymentseffects are probably less than would appear to be indicated by the sizeof the outflows, because some of the funds are returned to the UnitedStates through normal commercial and financial channels. Becauseof these complexities, the balance-of-payments advantages of tyingaid to purchases of American goods and services may be less than issuggested by the proportion of aid funds tied. If countries normallyspend the bulk of their foreign exchange earnings in the United States,as do the Latin American countries, the requirement that particulardollar balances be used in the United States may result in the diver-sion to third countries of dollars which would otherwise have beenspent here, without any balance-of-payments advantages to theUnited States as a result of the tying. In practice, however, tying islikely to have some favorable impact on the balance of payments.
As is the case with private investments, the adverse balance-of-pay-ments effect of a given dollar outflow for aid is less when it is directed
22
PERSPECTIVES AND POLICIES
to countries which normally trade chiefly with the United States. Arecent study by the Brookings Institution investigated the problemsof measurement in this area.' Its estimates suggest that, of expendi-tures by the Agency for International Development in 1961, approx-imately 64 cents of every dollar directed to Latin America returnedto the United States, in contrast to only 44 cents of every such dollardestined for Africa.
These examples give some indication of the difficulties of attemptinga quantification of the actual balance-of-payments consequences ofparticular payments items. But even if no exact measurement ispossible, it seems likely that each major payments category contrib-utes something to the deficit. It does not follow, however, that allincreases in payments of the same type result in greater balance-of-payments pressures. For example, the adverse balance-of-paymentsimpact of aid programs, following an overall increase in expenditures,may actually be less than before if aid programs are curtailed incountries trading principally with Europe and expanded in countriestrading principally with the United States. And it does not followthat equal expenditures in the same places for different purposes havethe same balance-of-payments repercussions. Expenditures for thesupport of military forces in Europe probably have a greater adverseimpact on the balance of payments than equal sums invested inmanufacturing subsidiaries there.
Bearing in mind these complications, let us examine some of themajor elements in the U.S. balance-of-payments accounts which haveexhibited important changes in recent years (see table 6). The travelaccount is perhaps most noteworthy for its persistent year to yearincrease (see table 7). The immediate dollar outflow from travelreached more than $1.4 billion in 1962, the highest level in history,having virtually doubled since 1955 and quadrupled since 1949.Military spending abroad, net of receipts from military sales, trendedupward from the end of the Second World War to a peak of $3.1billion in 1958 (see table 8). Thereafter, it declined somewhat andmilitary receipts increased substantially. As a result, net militaryspending fell each successive year to $2.4 billion in 1962, the lowestlevel in a decade and nearly 25 percent below the 1958 peak.
6 Walter S. Salant et al., "The United States Balance of Payments in 1968" (Washington: The BrookingsInstitution, 1963), pp. 155-190.
23
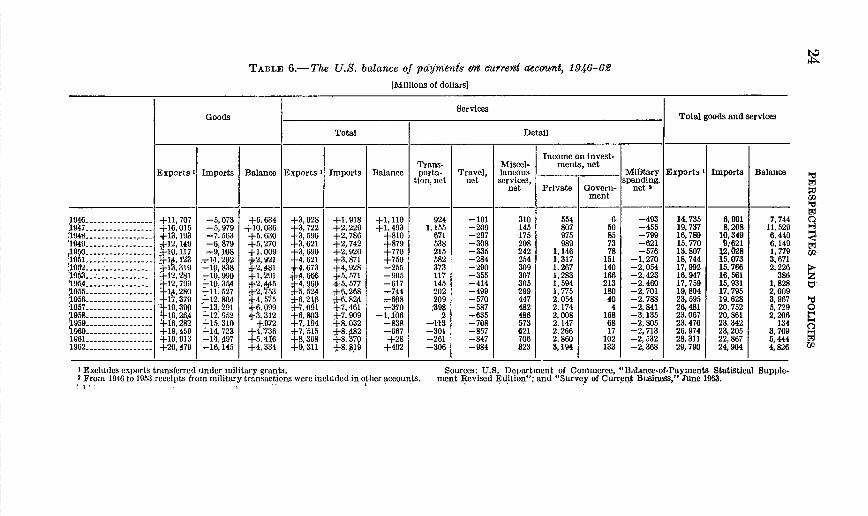
TABLE 6.-The U.S. balance of pdyrnMs oW current acctmnt, 1946-62
[Millions of dollars]
ServicesGoods . Total goods and services
Total Detail
Income on invest-Trans- Miscel- ments, net
Exports I Imports Balance Exports I Imports Balance porta- Travel, laneous ,lansMilItary Exports IBmports Balance Ition, net net services, spending, =
net Private Govern- net cment I
1946 - - +11,707 -5,073 +6,634 +3, 028 +1,918 +1, 110 924 -191 310 554 6 -493 14, 735 6, 991 7,744 c19'47-----------+16,018 -5,979 +10,036 +3,722 +2,229 +1,493 1,135 -209 145 807 30 -455 19,737 8,208 11,5291948 ------------------ +13,193 -7,563 +1. 630 +3,596 +2,786 +810 671 -297 175 975 85 -799 16,789 10,349 6,440 5
1949 -- - -12,149 -6,879 +5,270 +3,621 +2, 742 +879 538 -308 208 989 73 -621 15,770 '9,621 6, 149 99-19-0- - +1p,117 -9, ,108 +1,009 +3,690 +2, 920 +770 215 -335 242 1,146 78 -576 13,807 12, 028 1, 779 rj2
1951 '---4, 1-3 ,1- 202 +2, 921 +4,621 +3, 871 +750 582 -284 254 1,317 151 -1,270 18, 744 15, 073 3, 6711952 +13,319 -p, 838 *2, !81 *4,673 +4,928 -255 373 -290 309 1,267 140 -2,054 17, 992 15,766 2,2261933 .+- 12, 281 '-10, 990 +1,291 #4,6 +5,571 -905 117 -335 307 1,283 166 -2,423 16.947 16,561 386 z
12 799 -10,354 +2,4f5 4 960 +5, 5737 -617 145 -414 305 1, 594 213 -2. 460 17, 759 15,931 1,828 U'55----------+14,280 -11, 527 +2,-753 +5,524 +6.268 -744 202 -499 299 1,773 189 -2,701 19, 894 17,793 2,009
956 --- - - 17, 379 -12.804 +4,375 +6,256 +6,824 -608 209 -570 447 2,054 40 -2.788 23,5395 19.628 3, 967 I'*1967 ---------------- :-19, 390 -13, 291 +0, 099 +7, 091 +7,461 -370 ,898 -587 482 2,174 4 -2,841 26,481 20, 752 5,729 01958 -- -------- 1.-16,26, -12,952 +3.312 +6,8p3 +7,909 -1,106 2 -635 486 2,008 168 -3,135 23.067 20, 861 2,206 t
4
)959 .- - f6,282 -15.310 +972 +7,194 +8,032 -838 -11S -708 573 2.147 68 -2,805 23.476 23. 342 1341960 ---------------.- +19, 459 . 14,7 2 3 +4,736 +7, 515 +8. 482 -967 -301 -857 021 2,266 17 -2,713 26.974 23,205 3,769 -1961 -+19,913 -14,497 +5,'46 +8,398 +8,370 +28 -261 -847 706 2,860 102 -2,532 28.311 22, 867 5, 444 91962 -+20, 479 -16,145 +4, 334 +0, 311 +8,8,19 +492 -306 -984 823 3, 194 133 -2,368 29, 790 24, 964 4,826 Go
I Excludes exports transferred under military grants. Sources: U.S. Department of Commerce, "Balance-of-Payments Statistical Supple-2 From 1946 to 1953 receipts from military transactions were included in other accounts. ment Revised Edition"; and "Survey of Current Business," June 1963.
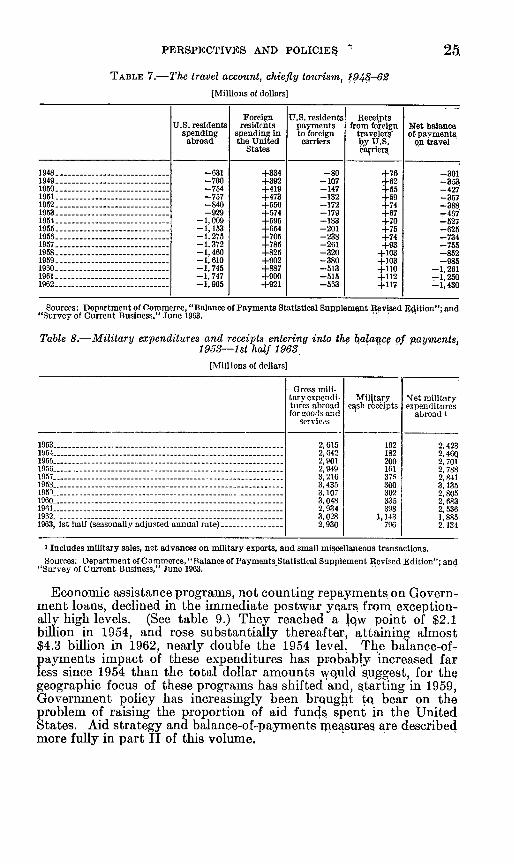
PERSPECTIVES AND POLICIE* 25
TABLE 7.-The travel account, chiefly tourism, 1948-62
[Millions of dollars]
Foreign U.S. residents ReceiptsU.S. residents residents payments from foreign Net balance
spending spending in to foreign travelers of paymentsabroad the United carriers by U.S.' on travel
States Harrners
1948 -- 631 +334 -80 +76 -3011949 -- 700 +392 -107 +62 -3531950 - --------------------- -754 +419 -147 +55 -4271951 -- 757 +473 -132 +59 -3571952 -- 840 +550 -172 +74 -3881953 -- 929 +574 -179 +67 -4671951 -- 1, 009 +595 -183 +70 -5271955 -- 1,153 +654 -201 +75 -625195 -- 1,275 +705 -238 +74 -7341957 -- 1,372 +785 -261 +93 -75a1958 - ---------------------- -1,460 +825 -320 +103 -8521959 -- 1,610 +902 -380 +103 -985190 -- 1,745 +887 -513 +110 -1,2611961 -- 1, 747 +900 -515 +112 -1,2501962- -1,905 +921 -563 +117 -1,430
Sources: Department of Commerce, "Balance of Payments Statistical Supplement R~evised Edition"; and"Survey of Current Business." June 1963.
Table 8.-Military expenditures and receipts entering into the balace of payments,1953-1st half 1963
[Millions of dollars]
Gross mili-taryoxpendi- Military 'Jet muilitarytures abroad cash receipts expendituresfor goods and abroad I
services
1953 -2,615 192 2,423195 - 2, 042 182 2,4601955 -2,901 200 2. 7011956 6-2,949 161 2.78$1957 - 3, 216 375 2, 411953 -3,435 300 3.135195- - 3,107 30? 2,8051960 ------------------------------------ --- 3,048 335 2,6831961 -2,934 398 2, 5361962 - 3,028 1,143 1,8851963, 1st half (seasonally adjusted annual rate) -2,930 796 2. 124
X Includes military sales, net advances on military exports, and small miscellaneous transactions.
Sources: Department of Commmerce,"Btalance of Payments Statistical Supplement lRevised Edition"; and"Survey of Current Business," June 1963.
Economic assistance programs, not counting repayments on Govern-ment loans, declined in the immediate postwar years from exception-ally high levels. (See table 9.) They reached a lw point of $2.1billion in 1954, and rose substantially thereafter, attaining almost$4.3 billion in 1962, nearly double the 1954 level. The balance-of-payments impact of these expenditures has probably increased farless since 1954 than the total dollar amounts wculd suggest, for thegeographic focus of these programs has shifted and, starting in 1959,Government policy has increasingly been brought to bear on theproblem of raising the proportion of aid funds spent in the UnitedStates. Aid strategy and balance-of-payments qieqsures are describedmore fully in part II of this volume.
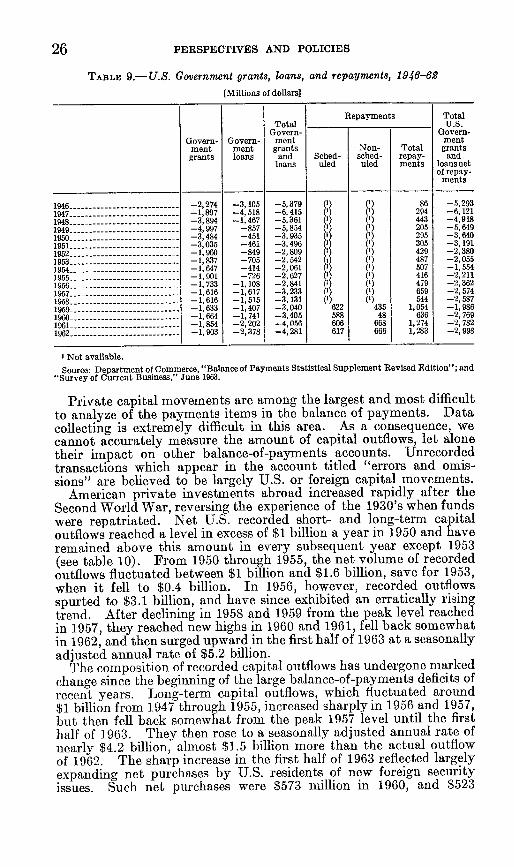
26 PERSPECTIVES AND POLICIES
TABLE 9.-U.S. Government grants, loans, and repayments, 1946-62[Millions of dollars]
Repayments TotalTotal __ U.S.
Govern- Govern.Govern- Govern- ment ment
ment ment grants Non- Total grantsgrants loans and Sched- sched- repay- and
loans uled uled ments loans netof repay-
ments
1946 ----- - -2,274 -3,105 -5,379 (1) ( ) 86 -5,2931947 -- 1,897 -4,518 -6, 415 (1) (') 294 -6,1211948 -- 3,894 -1,467 -5,361 (') (') 443 -4,9181949 -- 4,997 -857 -5,854 ( ') (') 205 -5 6491950 -- 3,484 -451 -3,935 ( I) 295 -3,6401951 -- 3,035 -461 -3,496 (1) (') 305 -3,1911932 ---------------- 1,960 -849 -2,809 () () 429 -2,3801953 -- 1,37 -705 -2,542 (2 ) (') 487 -2,0551954 -- 1, 47 -414 -2,061 (l) (') 507 -1, 554
195 -- 1 901 -726 -2,627 (1) (1) 416 -2,21119564----------------1,733 -3,5108 -2,841 () () 479 -2,3621957 -- 1,616 -1,617 -3,233 (X) (1) 659 -2,5741938 --------------- 3-,616 -1,315 -3, 131 () () 544 -2,5871959 -- 1,633 -1,407 -3,040 622 435 1,054 -1,9861960 ---------------- 1,664 -1,741 -3,405 588 48 636 -2,7691961 -- 1,854 -2,202 -4,056 606 668 1,274 -2,7821962 -- 1,903 -2,378 -4,281 617 666 1,283 -2,998
3 Not available.
Source: Department of Commerce, "Balance of Payments Statistical Supplement Revised Edition"; and"Survey of Current Business," Juno 1963.
Private capital movements are among the largest and most difficultto analyze of the payments items in the balance of payments. Datacollecting is extremely difficult in this area. As a consequence, wecannot accurately measure the amount of capital outflows, let alonetheir impact on other balance-of-payments accounts. Unrecordedtransactions which appear in the account titled "errors and omis-sions" are believed to be largely U.S. or foreign capital movements.
American private investments abroad increased rapidly after theSecond World War, reversing the experience of the 1930's when fundswere repatriated. Net U.S. recorded short- and long-term capitaloutflows reached a level in excess of $1 billion a year in 1950 and haveremained above this amount in every subsequent year except 1953(see table 10). From 1950 through 1955, the net volume of recordedoutflows fluctuated between $1 billion and $1.6 billion, save for 1953,when it fell to $0.4 billion. In 1956, however, recorded outflowsspurted to $3.1 billion, and have since exhibited an erratically risingtrend. After declining in 1958 and 1959 from the peak level reachedin 1957, they reached new highs in 1960 and 1961, fell back somewhatin 1962, and then surged upward in the first half of 1963 at a seasonallyadjusted annual rate of $5.2 billion.
The composition of recorded capital outflows has undergone markedchange since the beginning of the large balance-of-payments deficits ofrecent years. Long-term capital outflows, which fluctuated around$1 billion from 1947 through 1955, increased sharply in 1956 and 1957,but then fell back somewhat from the peak 1957 level until the firsthalf of 1963. They then rose to a seasonally adjusted annual rate ofnearly $4.2 billion, almost $1.5 billion more than the actual outflowof 1962. The sharp increase in the first half of 1963 reflected largelyexpanding net purchases by U.S. residents of new foreign securityissues. Such net purchases were $573 million in 1960, and $523
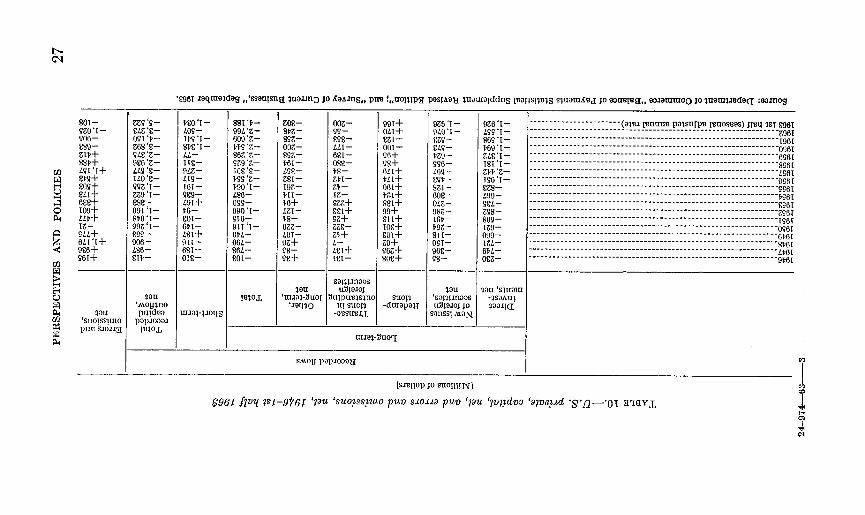
'£961 JaaqlOdag ,O'ssauSsn1 1 ;uoannj jo £azS9,, pue !,,uoI;p ppos1au luamolddnS 11oIls191S sluomueJ jo Joruelul,, oOnammoo Jo Iuamevdaa :9amOS
1g '6-uzZ -O9I '-Z68'£-9a±1-96 'Z-±g £-1±0£-9z91-
ZZ9'1-8£9-
091 'I-9l0 '-g99Z'-199-
906-L±6-£i1-
teo 'I±09-
L4-11£-9PZ-±19-161-119-±91+16-101-
601-±91+
911-681-01£-
881 '1-994 'Z-609 'Z-
9 'Z-86 'Z-S91'Z-1011£-m91 'Z-901- I-
±96-019-990'1 -916-
911 '1-OK1-06L-S6U-£01-
ZOE-91z-
891-00-9gz-61 -
±01-811-
19z-MI'-t6+
ZI -t8-OZZ-401 -9z+98-
S£+
061-99-£S£-
691-
08£-UT-Z1-1Z-
191+£Z+911-
££1+
491+111-
991+0±1+£ZI+
001+
986+611+
061+111+891+99+£11+10£+901+Z9+96Z+80£+
9 1 6 1-9±9 '1-
1±9-
996-±60g-191-
8iI-60£-O±-99Z-16p-t,99-811-091-9G6-98-
9Z6 '1-L99 'I-861 '1-169 '1-ZL±'I-11 'I-1'z1 '1-1961-£Z8-±99-
91±-998-
809-119-099-19±-61-O0Z-
I I ~~~~~safignboos_ _IOU u;loiOJ IOU IoU 's91110
lOU MOIL 'mna l-SuOj Om1!puuISillO s90o1 'sll0n9as -ISOAUI1mo)1o '9J011 Ul SUOI -di9 apa9 11210oJ Jo 10a0l_ _
IOU jle~dv so mlaj-poqS -Ousu,3iL, SOIIssl mAV ,'SIIOISSIIUO popiooa0 .1-pure siola
1 ))oJL0_
SMtOU papionod
---------------------- (alu o junu palsnrpa 19uos0s9) 9l0)1 111 £961-1---------------------------------- Z961
--- - - - - - - - - - - - - - -- - - - - - - - - - - - - - - -0961
-±~~~~~~~~~~~~~~~~~9610101
-11~~~~~~~~~~~~~~~861
- - -- ---- - - - - - - - - - - - - - - - - - - - - - ------ Ig6 1
-6~~~~~~~~~~~~~~~~561
±1 ~~~~~ £61-9------------1-------------------------------------_---------- P1961-- - -- -- ---- - - - - - - - - - -- - - - - - - - ---- 1961
------- ------ --- --- ------ ------- ------ ------ ------ ----- 9e6 1
[Sl.llop Jo SUOIIITIA)]
S961 fJ2' 7?1-9t6T '(9U 'SUO29sVUO PUD S90o0u puD '7lu '2)Vdvo '9ovaud -Sn-o0 ravl'
801-
S06-£90-114+
CD ±91 1+
" Fog+
0 10'3+
IZ-
,M,
9 611+oI 09
E-(
M1-4
Iul
r4
P4
co
1
C
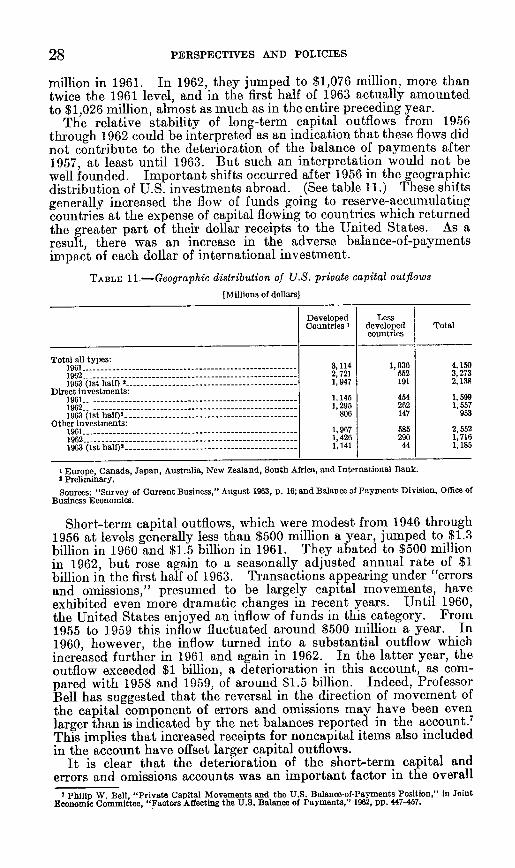
28 PERSPECTIVES AND POLICIES
million in 1961. In 1962, they jumped to $1,076 million, more thantwice the 1961 level, and in the first half of 1963 actually amountedto $1,026 million, almost as much as in the entire preceding year.
The relative stability of long-term capital outflows from 1956through 1962 could be interpreted as an indication that these flows didnot contribute to the deterioration of the balance of payments after1957, at least until 1963. But such an interpretation would not bewell founded. Important shifts occurred after 1956 in the geographicdistribution of U.S. investments abroad. (See table 11.) These shiftsgenerally increased the flow of funds going to reserve-accumulatingcountries at the expense of capital flowing to countries which returnedthe greater part of their dollar receipts to the United States. As aresult, there was an increase in the adverse balance-of-paymentsimpact of each dollar of international investment.
TABLE 11.-Geographic distribution of U.S. private capital outflows
[Millions of dollars]
Developed LessCountries I developed Total
countries
Total all types:1961 -------------------------- 3,114 1,036 4,1501962- 2,721 552 3,2731963 (lsthalfX-1,947 191 2,138
Direct investments:1961 ----- 1,145 454 1,5991962- 1,295 262 1,5571963 (1st half)
2 806 147 953Other investments:
1961 -1, 967 585 2,5521962- 1,426 290 1,7161963 (st half)'1141 44 1,185
I Europe, Canada, Japan, Australia, New Zealand, South Africa, and International Bank.I Preliminary.
Sources: "Survey of Current Business," August 1963, p. 16; and Balance of Payments Division, Office ofBusiness Economics.
Short-term capital outflows, which were modest from 1946 through1956 at levels generally less than $500 million a year, jumped to $1.3billion in 1960 and $1.5 billion in 1961. They abated to $500 millionin 1962, but rose again to a seasonally adjusted annual rate of $1billion in the first half of 1963. Transactions appearing under "errorsand omissions," presumed to be largely capital movements, haveexhibited even more dramatic changes in recent years. Until 1960,the United States enjoyed an inflow of funds in this category. From1955 to 1959 this inflow fluctuated around $500 million a year. In1960, however, the inflow turned into a substantial outflow whichincreased further in 1961 and again in 1962. In the latter year, theoutflow exceeded $1 billion, a deterioration in this account, as com-pared with 1958 and 1959, of around $1.5 billion. Indeed, ProfessorBell has suggested that the reversal in the direction of movement ofthe capital component of errors and omissions may have been evenlarger than is indicated by the net balances reported in the account.7
This implies that increased receipts for noncapital items also includedin the account have offset larger capital outflows.
It is clear that the deterioration of the short-term capital anderrors and omissions accounts was an important factor in the overall
7 Philip W. Bell, "Private Capital Movements and the U.S. Balance-of-Payments Position," in JointEconomic Committee, "Factors Affecting the U.S. Balance of Payments," 1962, pp. 447-457.
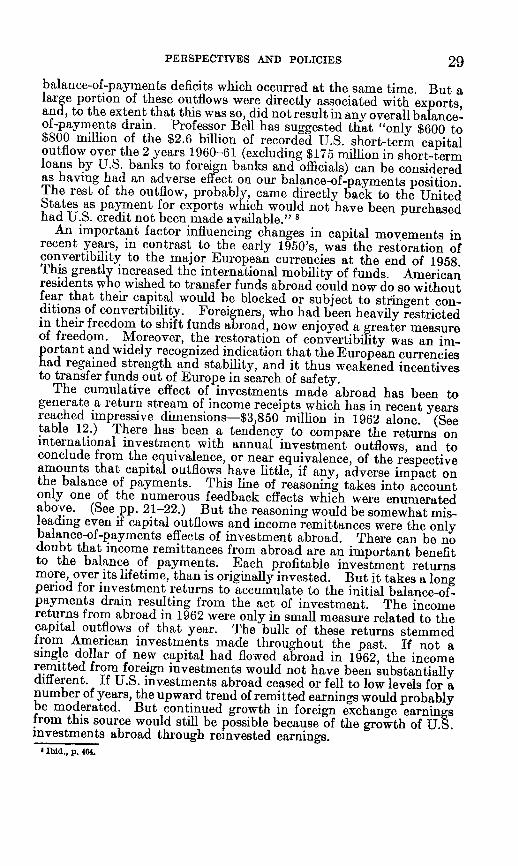
PERSPECTIVES AND POLICIES 29balance-of-payments deficits which occurred at the same time. But alarge portion of these outflows were directly associated with exports,and, to the extent that this was so, did not result in any overall balance-of-payments drain. Professor Bell has suggested that "only $600 to$800 million of the $2.6 billion of recorded U.S. short-term capitaloutflow over the 2 years 1960-61 (excluding $175 million in short-termloans by U.S. banks to foreign banks and officials) can be consideredas having had an adverse effect on our balance-of-payments position.The rest of the outflow, probably, came directly back to the UnitedStates as payment for exports which would not have been purchasedhad U.S. credit not been made available." 8
An important factor influencing changes in capital movements inrecent years, in contrast to the early 1950's, was the restoration ofconvertibility to the major European currencies at the end of 1958.This greatly increased the international mobility of funds. Americanresidents who wished to transfer funds abroad could now do so withoutfear that their capital would be blocked or subject to stringent con-ditions of convertibility. Foreigners, who had been heavily restrictedin their freedom to shift funds abroad, now enjoyed a greater measureof freedom. Moreover, the restoration of convertibility was an im-portant and widely recognized indication that the European currencieshad regained strength and stability, and it thus weakened incentivesto transfer funds out of Europe in search of safety.
The cumulative effect of investments made abroad has been togenerate a return stream of income receipts which has in recent yearsreached impressive dimensions-$3,850 million in 1962 alone. (Seetable 12.) There has been a tendency to compare the returns oninternational investment with annual investment outflows, and toconclude from the equivalence, or near equivalence, of the respectiveamounts that capital outflows have little, if any, adverse impact onthe balance of payments. This line of reasoning takes into accountonly one of the numerous feedback effects which were enumeratedabove. (See pp. 2 1-22.) But the reasoning would be somewhat mis-leading even if capital outflows and income remittances were the onlybalance-of-payments effects of investment abroad. There can be nodoubt that income remittances from abroad are an important benefitto the balance of payments. Each profitable investment returnsmore, over its lifetime, than is originally invested. But it takes a longperiod for investment returns to accumulate to the initial balance-of-payments drain resulting from the act of investment. The incomereturns from abroad in 1962 were only in small measure related to thecapital outflows of that year. The bulk of these returns stemmedfrom American investments made throughout the past. If not asingle dollar of new capital had flowed abroad in 1962, the incomeremitted from foreign investments would not have been substantiallydifferent. If U.S. investments abroad ceased or fell to low levels for anumber of years, the upward trend of remitted earnings would probablybe moderated. But continued growth in foreign exchange earningsfrom this source would still be possible because of the growth of U.S.investments abroad through reinvested earnings.I Ibid., p. 464.
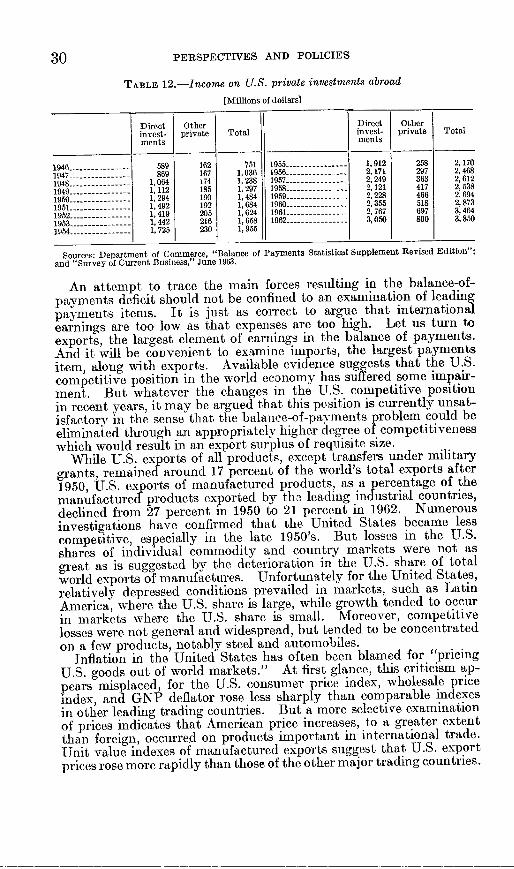
30 PERSPECTIVES AND POLICIES
TABLE 12.-Income on U.S. private investments abroad
[Millions of dollars]
Direct Other Direct Otherinvest- private Total invest- private Totalments ments
1946 -589 162 751 1955 -1,912 258 2,1701947:- 869 167 1,036 1956 -2, 171 297 2,468194S -1, 10 174 1,238 1957 2, 249 363 2,6121949 --------- 1,112 185 1, 297 1958--2, 121 417 2, 5381950 -1, 294 190 1,484 1950 - 2,228 466 2, 69419051 - ------ 1,492 192 1,684 1960 -2,355 518 2, 8731952 - ------ 1 419 205 1,624 1961- 2, 767 697 3,4641953 -1442 216 1,658 1962 -_ 3,050 800 3,8501954 -- 1,725 230 1,955
Sources: Department of Commerce, "Balance of Payments Statistical Supplement Revised Edition";and "Survey of Current Business," June 1963.
An attempt to trace the main forces resulting in the balance-of-payments deficit should not be confined to an examination of leadingpayments items. It is just as correct to argue that internationalearnings are too low as that expenses are too high. Let us turn toexports, the largest element of earnings in the balance of payments.And it will be convenient to examine imports, the largest paymentsitem, along with exports. Available evidence suggests that the U.S.competitive position in the world economy has suffered some impair-ment. But whatever the changes in the U.S. competitive positionin recent years, it may be argued that this position is currently unsat-isfactory in the sense that the balance-of-payments problem could beeliminated through an appropriately higher degree of competitivenesswhich would result in an export surplus of requisite size.
While U.S. exports of all products, except transfers under militarygrants, remained around 17 percent of the world's total exports after1950, U.S. exports of manufactured products, as a percentage of themanufactured products exported by the leading industrial countries,declined from 27 percent in 1950 to 21 percent in 1962. Numerousinvestigations have confirmed that the United States became lesscompetitive, especially in the late 1950's. But losses in the U.S.shares of individual commodity and country markets were not asgreat as is suggested by the deterioration in the U.S. share of totalworld exports of manufactures. Unfortunately for the United States,relatively depressed conditions prevailed in markets, such as LatinAmerica, where the U.S. share is large, while growth tended to occurin markets where the U.S. share is small. Moreover, competitivelosses were not general and widespread, but tended to be concentratedon a few products, notably steel and automobiles.
Inflation in the United States has often been blamed for "pricing
U.S. goods out of world markets." At first glance, this criticism ap-pears misplaced, for the U.S. consumer price index, wholesale priceindex, and GNP deflator rose less sharply than comparable indexesin other leading trading countries. But a more selective examinationof prices indicates that American price increases, to a greater extentthan foreign, occurred on products important in international trade.Unit value indexes of manufactured exports suggest that U.S. exportprices rose more rapidly than those of the other major trading countries.
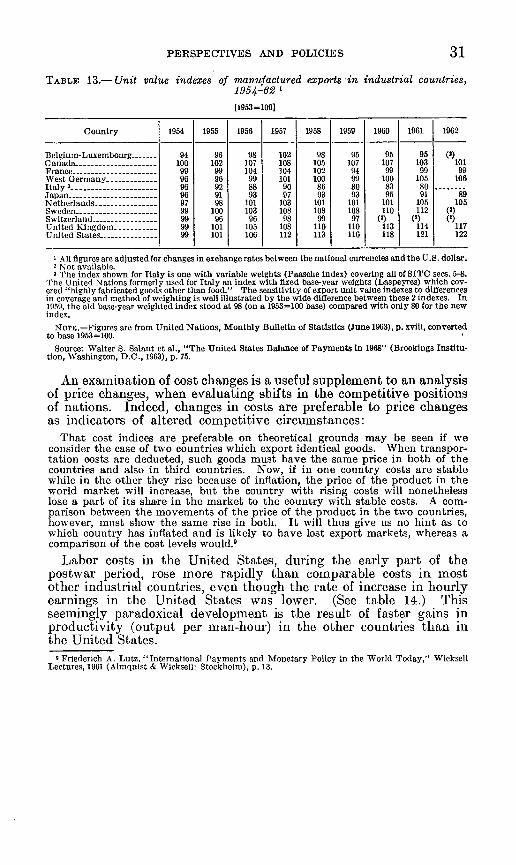
PERSPECTIVES AND POLICIES 31
TABLE 13.- Unit value indexes of manufactured exports in industrial countries,1954-62 1[1953=100]
Country 1954 1955 1956 1957 1958 1959 1960 1961 1962
Belgium-Luxembourg 94 96 98 102 98 95 95 95 (2)C anada.--100 102 107 108 105 107 107 103 101France -99 99 104 104 102 94 99 99 99West Germany -96 96 99 101 100 99 100 105 106Italy 3...................... 96 92 88 90 86 80 83 80.- - -Japan-96 91 93 97 93 93 95 91 89Netherlands -97 98 101 103 101 101 101 105 105Sweden -99 100 103 108 108 108 110 112 (X)Switzerland -99 96 96 98 99 97 (2) (2) (2)United Kingdom-99 101 105 108 110 110 113 114 117United States -99 101 106 112 113 116 118 121 122
I All figures are adjusted for changes in exchange rates between the national currencies and the U.S. dollar.2 Not available.3 The index shown for Italy is one with variable weights (Paasche index) covering all of SITC sees. 5-8.
The Umited Nations formerly used for Italy an index with fixed base-year weights (Laspeyres) which cov-ered "highly fabricated goods other than food." The sensitivity of export u1it value indexes to differencesin coverage and method of weighting is well illustrated by the wide difference between these 2 indexes. In1959, the old base-year weighted index stood at 98 (on a 1953=100 base) compared with only 80 for the newindex.
NOTE.-Figures are from United Nations, Monthly Bulletin of Statistics (June 1963), p. xviii, convertedto base 1953=100.
Source: Walter S. Salant et al., "The United States Balance of Payments in 1968" (Brookings Institu-tion, Washington, D.C., 1963), p. 75.
An examination of cost changes is a useful supplement to an analysisof price changes, when evaluating shifts in the competitive positionsof nations. Indeed, changes in costs are preferable to price changesas indicators of altered competitive circumstances:
That cost indices are preferable on theoretical grounds may be seen if weconsider the case of two countries which export identical goods. When transpor-tation costs are deducted, such goods must have the same price in both of thecountries and also in third countries. Now, if in one country costs are stablewhile in the other they rise because of inflation, the price of the product in theworld market will increase, but the country with rising costs will nonethelesslose a part of its share in the market to the country with stable costs. A com-parison between the movements of the price of the product in the two countries,however, must show the same rise in both. It will thus give us no hint as towhich country has inflated and is likely to have lost export markets, whereas acomparison of the cost levels would. 9
Labor costs in the United States, during the early part of thepostwar period, rose more rapidly than comparable costs in mostother industrial countries, even though the rate of increase in hourlyearnings in the United States was lower. (See table 14.) Thisseemingly paradoxical development is the result of faster gains inproductivity (output per man-hour) in the other countries than inthe United States.
0 Friederich A. Lutz, "International Payments and Monetary Policy in the World Today," WicksellLectures, 1961 (Almquist & Wicksell: Stockholm), p. 13.
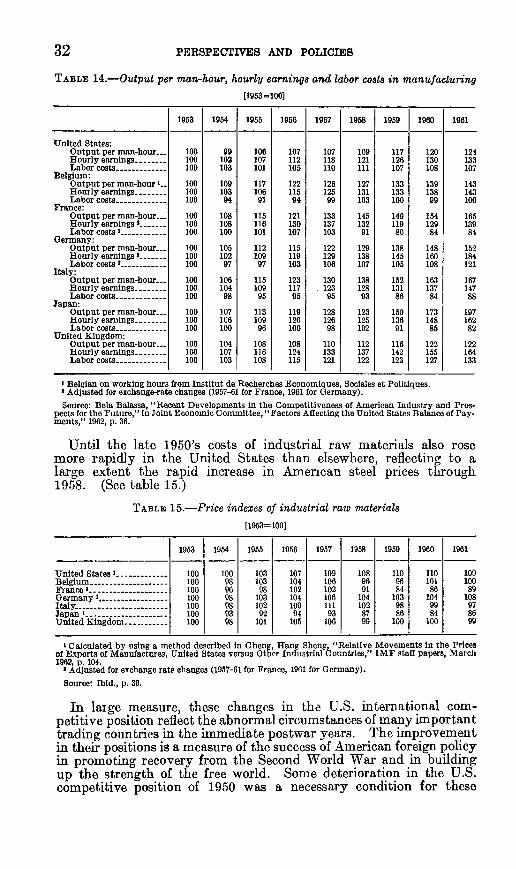
32 PERSPECTIVES AND POLICIES
TABLE 14.-Output per man-hour, hourly earnings and labor costs in manufacturing
[1953 =100]
1953 1954 1955 1956 1957 1958 1959 1960 1961
United States:Output per man-hour.-- 100 99 106 107 107 109 117 120 124Hourly earnings -100 102 107 112 118 121 126 130 133Labor costs-100 103 101 105 110 111 107 108 107
Belgium:Output per man-hour I 100 109 117 122 126 127 133 139 143Hourly earnings ------- 100 103 106 115 125 131 133 138 143Labor costs-100 94 91 94 99 103 100 99 100
France:Output per man-hour- 100 108 115 121 133 145 149 154 165Hourly earnings - 100 108 116 130 137 132 119 129 139Labor costs 2 -100 100 101 107 103 91 80 84 84
Germany:Output per man-hour... 100 105 112 115 122 129 138 148 152Hourly earnings 2 - 100 102 109 119 129 138 145 160 184Labor costs 2 -100 97 97 103 106 107 105 108 121
Italy:Output per man-hour --- 100 106 115 123 130 138 152 163 167Hourly earnings -100 104 109 117 123 128 131 137 147Labor costs-100 98 95 95 95 93 86 84 88
Japan:Output per man-hour... 100 107 113 119 128 123 150 173 197Hourly earnings -100 106 109 120 126 125 136 148 162Labor costs-100 100 96 100 98 102 91 85 82
United Kingdom:Output per man-homu.. 100 104 108 108 110 112 116 122 122Hourly earnings -100 107 116 124 133 137 142 155 164Labor costs-100 103 108 115 121 122 123 127 133
1 Belgian on working hours from Institut de Recherches Economiques, Sociales et Politiques.I Adjusted for exchange-rate changes (1957-61 for France, 1961 for Germany).
Source: Bela Balassa, "Recent Developments in the Competitiveness of American Industry and Pros-pects for the Future," in Joint Economic Committee, " Factors Affecting the United States Balance of Pay-ments," 1962, p. 36.
Until the late 1950's costs of industrial raw materials also rosemore rapidly in the United States than elsewhere, reflecting to alarge extent the rapid increase in American steel prices through1958. (See table 15.)
TABLE 15.-Price indexes of industrial raw materials[1953=100]
1953 1954 1955 1956 1957 1958 1959 1960 1961
United States I -100 100 103 107 109 108 110 110 109Belgium -100 98 103 104 106 96 96 101 100France 2 -100 96 98 102 102 91 84 86 89Germany 2 . 100 98 103 104 106 104 103 104 108Italy ------ ------- 100 98 102 109 111 102 98 99 97Japan -100 93 92 94 93 87 86 84 86United Kingdom - 100 98 101 105 106 99 100 100 99
I Calculated by using a method described in Cheng, Hang Sheng, "Relative Movements in the Pricesof Exports of Manufactures, United States versus Other Industrial Countries," IMF staff papers, March1962, p. 104.
2 Adjusted for exchange rate ehanges (1957-61 for France, 1901 for Germany).
Source: Ibid., p. 39.
In laige measure, these changes in the U.S. international com-petitive position reflect the abnormal circumstances of many importanttrading countries in the immediate postwar years. The improvementin their positions is a measure of the success of American foreign policyin promoting recovery from the Second World War and in buildingup the strength of the free world. Some deterioration in the U.S.competitive position of 1950 was a necessary condition for these
PERSPECTIVES AND POLICIES 33
objectives to be realized. Hal B. Lary has suggested that thebalance-of-payments deficits incurred prior to the Suez crisis of 1956-57"could scarcely be regarded, even now, as early evidence of somecompetitive inadequacy," in view of their important role in "enablingother countries to rebuild their monetary reserve assets and in layingthe basis for the subsequent restoration of currency convertibility." 10
The large gains in productivity in Europe and Japan relative to theUnited States are, at least in major part, a result of the rapid rebuild-ing of industrial capacity in these countries with the benefit of the mostmodern technology available, while the United States, with its indus-trial plant unimpaired by war, modernized and expanded its produc-tive assets more gradually.
The substantial devaluations of the leading European currenciesin 1949 also played a major role in improving the competitive positionsof Europe vis-a-vis the United States. Indeed, the continuingsurplus positions of these countries suggest that the devaluations,while appropriate at the time, may have been excessive over thelong term.
While international competitive pressures have intensified, U.S.exports benefited from the progressive liberalization or elimination ofquantitative restrictions which the European countries and Japanhad imposed against imports to safeguard and build up their reservesin the early years of reconstruction. Unfortunately, a number ofcountries continue to maintain quantitative restrictions which wereoriginally imposed for balance-of-payment reasons, even though suchreasons are no longer applicable. These countries are impeding thesolution of the U.S. balance-of-payments problem, and, if they areGATT members, may be violating their express international com-mitments.
The postwar behavior of imports also provides some evidence ofdecline in competitive position. For example, imports of finishedmanufactured products rose 133 percent from 1953-55 to 1960-62,while the U.S. GNP rose only 40 percent in the same period; andimports of "research intensive" products rose 226 percent from 1953-55 to 1962, while GNP increased only 48 percent.1 This deteriorationin competitive position is not apparent from an examination of therelationship of total imports to GNP. Imports have been a fairlystable percentage of GNP partly because declining prices for food-stuffs and raw material imports, which play a large role in Americanforeign trade, have offset increases in other import categories.
VIII. BALANCE-OF-PAYMENTS POLICIES OF THE UNITED STATES
Although deficits in the postwar U.S. balance of payments beganin 1950 and continued every year until 1957, restoration of balancewas not recognized as an important policy objective until 1959.Before that time, the U.S. deficits were not regarded with concernbecause they permitted other countries to rebuild their internationalreserves and thus contributed to the dismantling of exchange controlsand quantitative restrictions, and because they were not disturbinglylarge.
1 Hal B. Lary, "Problems of the United States as world Trader and Banker" (National Bureau of Eco-nomic Research, 1963), p. 19.
II Hal B. Lary, Joint Economic Committee bearings on the "U.S. Balance of Payments," pt. 2, 1963,pp. 305, 307, and Joint Economic Committee. "Economic Indicators."
PERSPECTIVES AND POLICIES
In 1959, however, the Government became concerned about theU.S. international payments position and began a program to restorebalance. The first steps were taken in the Government's own domain,through tying of aid in 1959. During the recession which beganaround May 1960, Treasury and Federal Reserve policy sought todiscourage capital outflows by preventing short-term interest ratesfrom declining as much as in earlier periods of depressed business con-ditions. In 1960, also, the first steps were taken to reduce thebalance-of-payments impact of military spending overseas. But theneed for more intensified efforts became evident in a spectacular waywhen, in the fall of 1960, a burst of speculation on the London goldmarket pushed the price of gold above $40 an ounce for a brief periodand dramatized for all to see that the strength of the dollar was nolonger beyond question.
The steps begun in 1959 have subsequently evolved into a broadlybased, multifaceted program. In selecting its policies, the Govern-ment has been mindful of its domestic and international responsibili-ties, and it has declined to adopt certain measures which, althoughconceivably helpful to the balance of payments, could also haveimportant undesirable consequences. The following have been ex-pressly excluded:
1. Devaluation;2. Deflation;3. Exchange controls;4. Quantitative restrictions to safeguard the balance of pay-
ments;5. Travel restrictions; and6. Export subsidies for other than agricultural products.
And the United States has been unwilling to withdraw from its com-mitments toward the less-developed countries and its military allies,although U.S. programs have been restructured, to the extent com-patible with these commitments, to reduce their adverse balance-of-payments impact.
Several policies adopted or advocated primarily for domesticreasons also have important implications for the balance of payments.Two are especially noteworthy. The first is the general policy ofprice stability which has been pursued in a number of ways andfound important new expression in the wage-price policy advocatedfor business and labor in the 1962 Annual Report of the Council ofEconomic Advisers.
This wage-price policy is intended to foster domestic price stabilityby establishing as a general guidepost the principle that the rate ofincrease in wage rates (including fringe benefits) in particular indus-tries should be equal to the trend rate of overall productivity increase.This clearly has important implications for the U.S. internationalcompetitive position. The continuing balance-of-payments deficitsand the growing urgency of controlling them have added strong reasonsfor assuring the policy's success.
The second policy consists of cutting taxes. To stimulate invest-ment in the United States, an investment tax credit was enactedin 1962, and the Treasury Department revised its depreciation guide-lines so as to increase the cash flow to business. The administrationhas now proposed that Congress enact a broadly based program oftax reduction and reform, applicable both to individuals and busi-
34
PERSPECTIVES AND POLICIES
nesses. The administration advocates these tax measures in theexpectation that they would stimulate the domestic economy, increasethe rate of economic growth, reduce unemployment, and more nearlyrealize the full economic potential of the United States. The adminis-tration has also strongly emphasized that it relies in part upon enact-ment of the tax cut to improve the balance of payments. The essenceof its case is that economic growth will induce foreign capital to seekinvestment in the United States and keep at home American funds thatwould otherwise have been invested abroad; that expanded outputwill lead to more efficient utilization of existing plant and lowercosts in the short run, thereby improving the U.S. international com-petitive position; and that the short-run effect will be reinforced inthe long run, as expanding markets stimulate research and develop-ment, modernization, and innovation. Proponents of the tax cutrecognize that such a cut would also involve certain unfavorableeffects, at least in the short run. Most importantly, it would result inan expansion of domestic demand for imports and for goods of the typeexported, with a resulting tendency to reduce the U.S. trade surplus.And despite lower costs of production at higher levels of plant utiliza-tion, an expansion of demand is more likely to result in higher ratherthan lower prices. Also, increased savings, especially for high-incomegroups, could tend to increase capital exports. But these adverseconsiderations are believed by tax-cut proponents to be heavily out-weighed by the anticipated favorable effects.
This volume contains two statements which examine the actualU.S. balance-of-payments experience during periods of slack andprosperity and provide some basis for judgment concerning thebalance-of-payments case for the tax cut. (See pts. IV and V, pp.105-126.)
We turn now to an enumeration of policies which have been im-plemented or proposed for the primary purpose of improving thebalance of payments.
A. EXPORT EXPANSION
1. Enactment of the Trade Expansion Act of 1962 to enableAmerican negotiators to broaden U.S. export markets in general, andin particular to mitigate the adverse effects on U.S. exports of tariffdiscrimination arising from the Common Market.
2. Expansion and improvement of the export credit facilities of theExport-Import Bank and provision of export insurance facilitiesthrough the Federal Credit Insurance Association covering bothcredit and political risks.
3. Intensification of the promotional work of U.S. embassies abroadthrough stepped-up market research, information services, andrepresentational activities.
4. Establishment of overseas trade centers.5. Increases in the number and activity of U.S. trade missions
abroad.6. Increased U.S. participation in trade fairs abroad.7. Establishment of the position of National Export Expansion
'-Coordinator in the Department of Commerce, and 34 regional exportexpansion councils to increase American industry's interest in servingforeign markets.
35
36 PERSPECTIVES AND POLICIES
8. Improvement of the Agriculture Department's cotton auctionprocedures to ensure competitive pricing for U.S. cotton in foreignmarkets, and other measures to promote agricultural exports.
9. Elimination of unjustifiable differentials between inbound andoutbound ocean freight rates applicable to comparable productstraveling the same trade routes. And elimination of unjustifiableocean freight rate advantages to foreign suppliers competing withAmerican exporters in third country markets.
10. Exertion of pressures on other countries in GATT, the OECD,and elsewhere to eliminate nontariff barriers against U.S. exports.
B. TOURISM
1. Establishment of the U.S. Travel Office in the Department ofCommerce to promote travel to the United States.
2. Implementation of a 'See America Now" program to encourageAmericans to vacation at home and induce foreigners to visit theUnited States.
3. Exertion of diplomatic pressure on other countries for theremoval of their remaining restrictions on tourism.
4. Reduction of the duty-free allowance for returning travelers from$500 to $100.
C. FEDERAL EXPENDITURES ABROAD
a. Economic assistance programs (subject to exception only underrigidly restricted circumstances)
1. Tying of loan-financed commodity procurement exclusively tothe United States.
2. Prohibition of grant-financed commodity procurement in 19 in-dustrial countries, mainly in Europe and Japan, to reduce the flow ofaid funds into the reserves of the surplus countries.
3. Restriction of dollar transfers to purchases in the United Statesthrough the use of such techniques as segregated accounts andirrevocable letters of credit.
4. Discontinued financing of commodities of which the UnitedStates is a net importer.
b. Military1. Increased procurement of goods in the United States for use
overseas through the general requirement that purchases be made inthe United States if the cost, including transportation and handling,is not more than 50 percent higher than the comparable foreign cost.
2. Reduced procurement abroad of goods for use in the UnitedStates by requiring that the Secretary of Defense review each casewhere application of the relevant regulations (the Buy America Actand Executive Order 10582) would normally result in purchase abroad.
3. Review and reduction of overseas construction programs.4. Review of the balance-of-payments effect of using foreign na-
tionals as employees at U.S. overseas military installations.5. Development of means to reduce expenditures abroad for con-
tractual services.6. Review of expenditures abroad associated with the military
assistance program.7. Rotation of certain deployed air units without dependents.
PERSPECTIVES AND POLICIES
8. Encouragement of voluntary savings programs by Americanpersonnel abroad.
9. Changes in the pricing and procurement policies of overseas PX'sand commissaries to encourage purchases in these facilities instead ofon the local foreign economies concerned.
10. Increased military receipts through offset agreements, such aswith Germany and Italy, for countries to increase their militaryprocurement in the United States.
11. Development of means for expanding credit sales of U.S.military supplies and services to facilitate the negotiation of offsetagreements with other countries.e. Other
Implementation of the "Gold Budget Review" by the Bureau of theBudget to screen and reduce the expenditures abroad of Federaldepartments and agencies.
D. CAPITAL FLOWS
1. Elimination of the right of Americans to own gold abroad.2. Elimination, in the Revenue Act of 1962, of incentives to abuse
foreign "tax havens" as a means of tax avoidance.3. Efforts by the Federal Reserve and Treasury to keep short-term
interest rates high enough to discourage short-term capital outflows,without placing upward pressure on long-term rates and therebydamping economic growth.
4. Recommendation by the President that Congress enact aninterest-equalization tax, in effect a tariff on imports of certainforeign securities, to help equalize the costs here and abroad of longerterm foreign borrowing.
5. Exemption of official foreign time deposits from interest rateceilings applicable to domestic accounts.
6. Increase in interest rate ceilings applicable to time depositsin with commercial banks and certificates of deposit maturing in 90days to 1 year.
7. Application of pressures for the reduction or elimination byforeign countries of their restrictions on capital outflows.
8. Establishment of a Government-financial community committee,headed by Henry H. Fowler, Under Secretary of the Treasury, tomarket securities of U.S. private companies to foreign investors andincrease the availability of foreign financing for U.S. business operatingabroad.
9. Encouragement of foreign investments in the United Statesthrough the establishment of an Office of International Investment inthe Department of Commerce to work together with the AreaRedevelopment Administration.
10. Intervention by the Treasury stabilization fund in forwardexchange markets to reduce incentives for short-term capital exports.
E. SPECIAL MEASURES TO FINANCE THE DEFICIT
1. Negotiation of advance repayments of debts owed to the UnitedStates.
2. Sales to foreign monetary authorities or governments of non-marketable medium-term Treasury bonds denominated either in dol-lars or in their own currencies.
37
38 PERSPECTIVES AND POLICIES
F. COOPERATIVE POLICIES WITH OTHER COUNTRIES
1. U.S. initiative and support for enlargement of IMF quotas.2. Participation in the "group of 10" supplementary IMF borrow-
ing arrangement, under which the 10 countries agree under certaincircumstances to lend the IMF up to $6 billion to increase its holdingsof convertible currencies.
3. Participation in a gold pool arrangement with the leadingEuropean countries to stabilize gold prices on the London market andthereby maintain confidence in the smooth functioning of the inter-national monetary system.
4. Discussion and coordination of domestic and international eco-nomic policies through the monthly meetings of Working Party 3 ofthe OECD's Economic Policy Committee.
5. Conclusion by the Federal Reserve of swap arrangements withother countries, providing for the exchange of dollars for equivalentamounts of foreign currency, to provide the United States with meansfor conducting stabilization operations in foreign exchange marketsand, more generally, for preventing disruptive movements of short-term funds and a depletion of U.S. gold reserves. At the end ofOctober 1963, the United States had arranged swaps totaling $1.95billion.
6. Conclusion of a $500 million standby arrangement with the IMFto be drawn upon as necessary to permit continued IMF repurchasesin dollars.
7. U.S. participation through an observer at the monthly meetingsof central bankers at the Bank for International Settlements at Basle.
8. Annual Cabinet-level discussions with Canada and Japan oneconomic problems of mutual concern.
IX. THE POLICIES OF OTHER COUNTRIES
International monetary cooperation has evolved to a high levelnever before attained among nations, The situation today is a farcry from the chaos that existed during the interwar period. Yetaspirations have moved forward with accomplishments, and furtherprogress appears necessary.
The situation of deficit and surplus countries is inherently un-symmetrical because the former must sooner or later exhaust theirreserves and capacity to borrow while the latter have no comparablelimit on their ability to absorb reserves. The situation of a deficitcountry which also manages a reserve currency is especially difficult,because such a country's freedom of action is more narrowly con-strained than that of other countries. The United States, for example,has ruled out devaluation as a solution to its problem because sucha move could impair the future status of the dollar as a store ofinternational value and might result in the collapse of the present inter-national monetary order. On the other hand, most of the surpluscountries devalued substantially in the postwar years. France alonedevalued its currency 22 percent in 1949, 17 percent in 1957, andagain 15 percent in 1958. Table 16 shows the extent to which exchangerate relationships have altered, to the detriment of the United States.
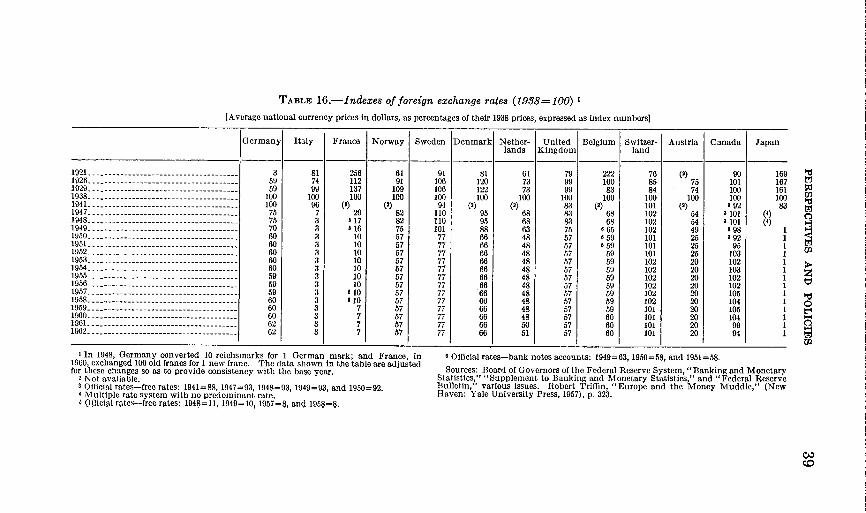
TABLE 16.-Indexes of foreign exchange rates (1988=100) 1[Average national currency prices in dollars, as percentages of their 1938 prices, expressed as index numbers]
Germany Italy France Norway Sweden Denmark Nether- United Belgium Switzer- Austria Canada Japanlands Kingdom land
1921 -3 81 256 61 91 81 61 79 222 76 (2) 90 169 'd1926- 59 74 112 91 106 120 73 99 100 895 75 101 1671929 -9 99 137 109 106 122 73 99 83 84 74 100 1611938 ------------------------------------ 100 100 100 100 100 100 100 100 100 100 100 100 1001941 -100 96 (2) (2) 94 (2) (2) 83 (2) 101 (2) 3 92 831947- 75 7 29 82 110 95 68 83 68 102 54 3 101 (4)1948 -------------------- 75 3 '17 82 110 95 68 83 68 102 54 ' 101 (') .1949 -70 3 16 758 101 88 63 75 665 102 49 a098 11950 1------------------------------------ 60 3 10 57 77 66 48 57 a 59 101 25 3 92 11951 -60 3 10 57 77 66 48 57 6 59 101 25 91 1 td1952 -60 3 10 57 77 66 48 57 19 101 25 103 11953 -60 3 10 57 77 66 48 57 59 102 20 102 11954 -60 3 10 67 77 66 48 57 59 102 20 103 11955 -59 3 10 57 77 66 48 57 59 102 20 102 11956 --------- 59 3 10 67 77 66 48 57 19 102 20 102 11957 -9 3 *10 57 77 66 48 57 59 102 20 101 11918 -------------------- 60 3 810 17 77 66 48 17 19 102 20 104 1 01959 -60 3 7 57 77 66 48 57 59 101 20 105 1 r'1960 -60 3 7 57 77 66 48 17 60 101 20 104 1 w1961 -62 3 7 57 77 66 50 17 60 101 20 99 11962 -62 3 7 57 77 66 51 17 60 101 20 94 1
I In 1948, Germany converted 10 rcicbsmarks for 1 German mark; and France, in ' Official rates-bank notes accounts: 1949=63, 1950=58, and 1951=58.1960, exchanged 100 old francs for 1 new franc. The data shown in the table are adjustedfor these changes so as to provide consistency with the base year. Sources: Board of Governors of the Federal Reserve System " Banking and Monetary
2 Not available. Statistics," "Supplement to Banking and Monetary Statistics," and "Federal Reserve3 Oflicial rates-free rates: 1941=88, 1947=93 1948=93, 1949=93, and 1950=92. Bulletin," various issues. Robert Triflin, "Europe and the Money Muddle," (New4 Multiple rate system with no predominant rate. Haven: Yale University Press, 1957), p. 323.I Olficipl rites-frce rates: 1948=11, 1949=10, 1957=8 and 1958=8.
40 PERSPECTIVES AND POLICIES
Officials seldom question the appropriateness of resent exchangerate relationships, at least in public. This is scarcely surprising, for,aside from any advantages which some countries might perceive intheir existing rates, the authorities fear the speculative capital move-ments which could be triggered by uncertainty as to the stability ofexchange relationships. The appreciation in 1961 of the Germanmark and Netherlands guilder was accompanied by destabilizingspeculation on a substantial scale, and drove home the lesson thatchanges in the par values of leading currencies, even nonreservecurrencies, nowadays take place in an atmosphere that is difficult tocontrol.
While recognizing these difficulties, it is also pertinent to observethat the German and Netherlands revaluations, for all of the attendantdisruptions, were successfully implemented. Perhaps exchange rateadjustments for non-reserve-currency countries merit more considera-tion than they have received.
The initial par values adopted under the Articles of Agreement ofthe International Monetary Fund in December 1946 were, for mostcountries, the exchange rates existing at the time. It would havebeen surprising if these rates were equilibrium rates after a major warwhich changed international trading patterns, debtor-creditor rela-tionships, and cost-price relationships. But the currency revalua-tions of 1949 were of major dimensions. Most of the European cur-rencies devalued by 30.5 percent. France and Austria devaluedseveral times since the end of the war. Switzerland is the onlyEuropean country which has not devalued in the postwar period.Given the profound structural changes which have taken place in theworld in the last 15 years, it is at least arguable that the continuedbalance-of-payments surpluses of the European countries result froman undervaluation of their currencies in today's circumstances.Germany and the Netherlands recognized this when they appreciatedtheir currencies 5 percent in 1961. But this change was small inrelation to their 1949 devaluations of 20.6 and 30.2 percent, respectively.
In its efforts to restore equilibrium to the balance of payments inthe context of existing exchange rate relationships, the United Statesis handicapped by certain policies of other countries. Some of thesepolicies are enumerated below:
1. Quantitative restrictions on importsMany of the quantitative restrictions (QR's), i.e., quotas, pro-
hibitions, import licensing systems, now in existence were originallyadopted for balance-of-payments reasons. But when the balance-of-payments justification disappeared a substantial number remained.Contracting Parties (CP's) to the GATT are permitted to maintainQR's for certain reasons unrelated to the condition of their balanceof payments, subject to carefully specified conditions. Therefore,the continued use of QR's by CP's to whom the GATT balance-of-payments justification is no longer applicable need not be inconsistentwith the GATT.
CP's who originally justified QR's on balance-of-payments groundsand who no longer do so include Austria, Belgium, Luxembourg,Canada, France, Germany, Italy, Japan, Netherlands, Sweden,and the United Kingdom. Some of the remaining QR's may be in-
PERSPECTIVES AND POLICIES
consistent with their international commitments under the GATT.However, it is difficult to sort out those QR's which are consistentwith the GATT and those which are not.
As nearly complete a list of the remaining QR's in use by these andcertain other countries as it has been possible to obtain is shown inthis volume as an appendix. (See pp. 129-164.)
Most of the products affected by these QR's are agricultural, andthe problem they pose for the United States is only a part of the moregeneral problem of agriculture in world trade. The United Statesalso maintains numerous QR's on agricultural imports, but receiveda GATT waiver in 1955 of its obligations insofar as these might beinconsistent with action under section 22 of the Agricultural Adjust-ment Act, as amended. While some other countries have receivedwaivers for particular circumstances, usually of a temporary nature,none is as broad as that granted to the United States. In additionto its QR's on agricultural products, the United States maintainssuch restrictions on petroleum and lead and zinc.2. The Common Market agricultural policy '
-The common agricultural policy (CAP) of the EEC, which is toreplace the different national systems of agricultural support in theconstituent states, threatens seriously to impede American agricul-tural exports to the EEC. In 1961, such exports were nearly $1.2billion. It is too early to know the exact form the CAP will take,but indications are that the EEC members will generally strive forhigh internal support price levels, with the probable result that internalproduction will expand and shut out or severely limit imports. TheUnited States has a strong balance-of-payments interest in seeing theCAP develop along liberal, rather than protective lines.3. Capital market controls by the surplus countries
The surplus European countries have been channeling nationalsavings into gold and dollar reserves while at the same time largeamounts of capital were obtained from the United States. Thisparadoxical situation is detrimental to the U.S. balance of payments.Most European countries maintain controls to limit foreign borrowingin their capital markets. In addition, certain structural and institu-tional conditions impede the flow of savings directly into productiveinvestments within their own countries. Both factors swell thedemand for U.S. funds.
Progress has been made in achieving liberalization of the capitalcontrols of other countries. Codes of liberalization, negotiated withinthe OEEC and revised when the United States joined the OECD, havecodified the progress to date. Many restrictions remain, however.
In response to a request from the Joint Economic Committee, theTreasury Department presented a summary of the controls overcapital movements exercised by major industrial countries. Thissummary, which was made a part of the committee's printed record ofthe July 8 and 9, 1963, hearings on the U.S. balance of payments, isreproduced on pages 42 and 43.
41
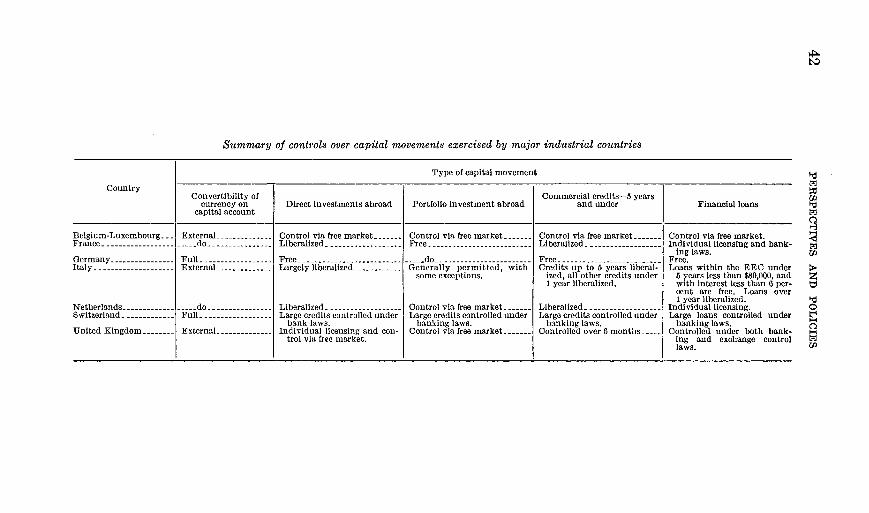
Summary of controls over capital movements exercised by major industrial countries
Type of capital movement
CountryConvertibility of Commercial credits-5 years
currency on Direct investments abroad Portfolio investment abroad and under Financial loanscapital account
Belgium-Luxembourg-.. External -Control via free market - Control via free market - Control via free market - Control via free market.France-do -Liberalized -Free ----------------- Liberalized -Individual licensing and bank-
ing laws.Germany- Full ----------------- Free -do -------------- Free -- Free.Italy -External -Largely liberalized -Generally permitted, with Credits up to 5 years liberal- Loans within the EEC under
some exceptions. ized, all other credits under 5 years less than $80,000, and1 year liberalized. with interest less than 6 per-
cent are free. Loans over1 year liberalized.
Netherlands -do -Liberalized -Control via free market - Liberalized - Individual licensing.Switzerland - Full - ----------- Large credits controlled under Large credits controlled under Large credits controlled under Large loans controlled under
bank laws. banking laws. banking laws. banking laws.United Kingdom - External -Individual licensing and con- Control via free market - Controlled over 6 months --- Controlled under both bank-
trol via free market. ing and exchange controllaws.
10'-
0LtI11
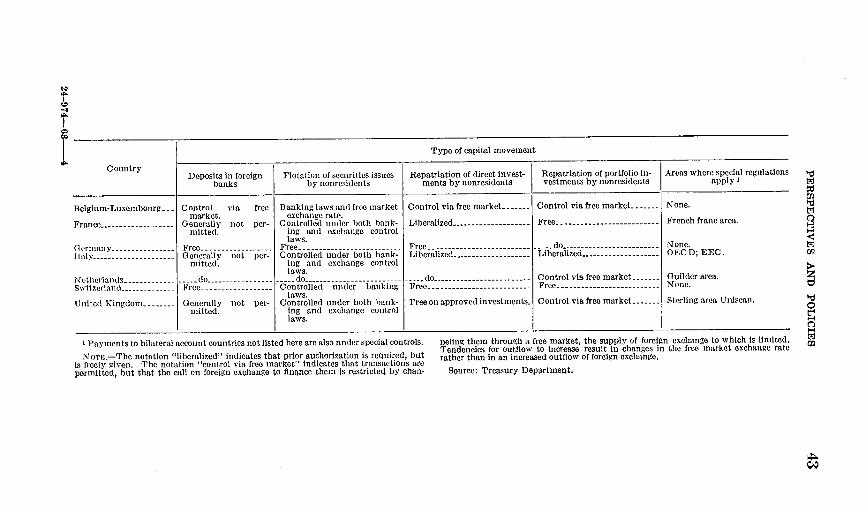
Type of capital movement
Country Deposits in foreign Flotation of securities issues Repatriation of direct invest- Repatriation of portfolio in- Areas where special regulationsbanks by nonresidents ments by nonresidents vestments by nonresidents apply I
Belgium-Luxembourg --- Control via free Banking laws and free market Control via free market - Control via free market - None.market. exchange rate.
France -- - Generally not per- Controlled under both bank- Liberalized -Free-French franc area.mitted. ing and exchange control
laws.Germany -- Free --- Free -Free -------------------- do -None.Italy - - - Generally not per- Controlled under both bank- Liberalized -Liberalized -OEC D; EEC.
mitted. ing and exchange controllaws.
Netherlands --- (o ----- do do- d - Control via free market - Guilder area.Switzerland --- Free --- Controlled under banking ---- Free- None.
laws.United Kingdom -- Generally not per- Controlled under both bank- Freeonapprovedinvestments- Control via free market - Sterling area Uniscats.
mitted. Ing and exchange controllaws.
I Payments to bilateral account countries not listed here are also under special controls. neling them through a free market, the supply of foreign exchange to which is limited.
NOTE.-The notation "liberalized" indicates that prior authorization is required, but rathere than ifn an itncreased outrowe of foretign exchange rateis freely given. The notation "control via free market" indicates that transactions arepermitted, but that the call on foreign exchange to finance them is restrlete4 by chan- Source: Treasury Department.
ed
Mo0
44 PERSPECTIVES AND POLICIES
LONDON CAPITAL MARKET
The United Kingdom capital market is one of the oldest and best developed inthe world. Before World War II it was a major supplier of capital for theworld, and the pound sterling was the most widely held reserve currency. Dur-ing most of the postwar period there was not a sufficient volume of capitalgenerated within the United Kingdom economy to meet domestic requirementsplus the amounts which all oversea borrowers would have wished to obtain.Consequently, access to the market has been limited to resident and Common-wealth borrowers, and even these have been regulated in an attempt to preventexcessive demand.
Transactions in foreign currency denominated securities are controlled by ex-change regulations administered by the Bank of England for the United KingdomTreasury. Residents who acquire certain foreign currencies (including U.S.dollars) as a result of capital transactions may, with permission, use themfor the purchase abroad of marketable foreign currency securities. Otherwisethey must offer them for sale to an authorized bank. Thus there is only alimited supply of foreign currencies available to British residents for foreigninvestment and the amount is controlled by the authorities. Individual resi-dents, who wish to invest abroad in the specified currencies, may bid for them inthis restricted market where the rate is generally above the commercial sterling-dollar rate.
This year there have been several developments which may lead to increaseduse of the London capital market by foreigners. A 5-percent 3-year loan for $20million was made to Belgium; this was the first foreign currency loan in Londonsince the war. In later actions, a British investment trust was allowed toborrow $10 million in New York, and the market was opened to all EFTAcountries.
GERMAN CAPITAL MARKET
The German Government does not impose exchange restrictions on move-ments of capital into and out of Germany and occasionally a foreign issue isfloated on the German market. On a net basis, however, Germany tends to bea borrower rather than a lender because of the high bond rate which currentlyaverages roughly 6 percent. One of the prime causes of the relative scarcity offunds for industrial investment, which is reflected in the high bond rate, is ahousing boom which, spurred by government concessions and subsidies, drainsoff into housing a large part of the savings available. Mortgage and communalbonds comprise as much as 70 percent of the total bonds issued in the Germanmarket.
The thinness of the market impedes the development of efficient institutions,limits competition, and contributes to high issue costs. The small volume ofsecurities in circulation which contributes to this thinness is the result of severalfactors. The outstanding debt of the Federal, State, and municipal govern-ments is relatively small and therefore the large refunding operations which areundertaken in countries like the United States are unnecessary in Germany. A2% percent tax on the issue of debt certificates as well as administrative obstaclesto the placing of shares through the German stock exchanges, such as listing re-quirements, are additional factors which reduce the volume of securities incirculation.
FRENCH CAPITAL MARKET
Foreign companies wishing to issue securities in France must comply with theregulations governing all issues of securities and also with the exchange regu-ations.
Canvassing in connection with operations on securities issued by foreigncompanies without the guarantee of the governments concerned is prohibitedunder a decree of August 8, 1935. The latter limits possibilities of selling foreignshares and bonds, whether new or old issues.
No foreign securities from outside the franc zone have been offered in Francesince World War II.
The French capital market is underdeveloped in relation to other Europeancapital markets. It is characterized by controls and timetables for issuing newflotations. Interest rates and issuing expenses are high. The supply of fundsdoes not normally meet the existing demand, although in recent years the volumeof total savings has been increasing.
In June 1963. the committee of experts which had been set up by the FrenchGovernment in June 1962, to examine the functioning of the capital market in
PERSPECTIVES AND POLICIES 45
France and to suggest possible methods to improve it, submitted its report.The main improvements advocated by the committee were the introduction inFrance of open-end investment trusts and the issue of so-called participatingbonds, the yield of which would be in part fixed, in part fluctuating with turn-over or profits. It proposed also that measures should be taken to facilitate theissue of convertible bonds. In recent years a number of French enterpriseshave been rather reluctant to make new issues on the share market, as largeshareholders have been afraid of diluting their control. For this reason thecommittee also suggested issues of preferred shares, which until now have beenforbidden in France. In commenting on the report, the Minister of Financedeclared that the Government had not yet decided which of the various suggestionsit would accept.
Since February 1962, French residents may freely acquire foreign securitieslisted on a recognized stock exchange, but the portfolio must be deposited withan authorized French bank. Direct foreign investment is subject to FinanceMinistry approval, but such approval is considered only a formality.
The total absence of foreign securities issues in France since World War II,in addition to the unfavorable factors mentioned above, may also be due to thedesire to insure that the market will meet French domestic requirements.Whether the French market is opened to foreign issues will depend primarilyon an improvement in borrowing conditions on the market and also on a changein the attitude of the authorities. If the French balance of payments continues ina surplus condition, there may be some possibility of liberalization of the Frenchcapital market.
ITALIAN CAPITAL MARKET
In July 1961, the Italian authorities permitted the first flotation on theItalian market by a non-Italian issuer in more than 25 years. Since that timea total of four issues have been allowed, each for $24 million, to the InternationalBank for Reconstruction and Development, the European Investment Bank, theInter-American Development Bank, and the European Coal and Steel Com-munity. Actually these issues were not too well received in the market sincethey offered only 5 percent when the rate on Italian Government securities was5½ percent.
All loans to foreigners, as well as the issue of foreign securities on the Italianmarket, are still subject to official approval. Two April 1963 exchange officerulings now permit Italian residents to grant loans freely (within the EEC),providing that the repayment period does not exceed 5 years, nor the amount5 million lire ($80,000), and to buy foreign securities issued or payable abroadand listed on foreign exchanges. These decisions will help to bring the Italiancapital market into closer contact with those of other countries.
In July the city of Milan offered a $20 million bond issue in New York. Thisaction on the part of a leading Italian city is probably due to a combination oftwo factors: the thinness and high cost of borrowing in the Italian capital market,and the lower cost and readier availability of the funds in New York.
Furthermore, Government tax policies have tended to make it worth while forinvestors to try to export capital. This has been done by smuggling banknotesinto neighboring countries thus making the Italian capital market a much smallerone than basic Italian resources would otherwise support. Recent reports indicategreater attempts on the part of the authorities to halt the smuggling traffic sothat future trends on this are uncertain.
SWISS CAPITAL MARKET
The Swiss capital market is second only to New York in the amount of newforeign bond issues floated since World War II. Although the Swiss market hasbeen and will continue to be a good source of capital for international borrowers,the volume of funds available has varied and will vary from year to year depend-ing mainly on the Swiss balance of payments and domestic needs for capital.
The large increase in capital issues in the last 2 years has been in part a responseto the large volume of capital inflow in that period which was related to variouspolitical and economic crises around the world. The national bank, as part ofits anti-inflationary policy, opened the market to foreign borrowers, particularlyin 1961, to relieve the pressure on the domestic economy. As a matter of policythe bank carefully controls the volume of new foreign bond issues with a viewto preserving the major share of available funds for Swiss borrowers and toprevent a rise in the traditionally low interest rates which for political reasonsmust be kept low. Approval of the national bank is required, under Swiss banking
PERSPECTIVES AND POLICIES
law, for all foreign loans, purchases of shares of foreign companies, and invest.ments abroad amounting to Swiss francs 10 million ($2.3 million) or more thathave terms of 1 year or longer.
As a matter of policy the national bank is in principle prepared, under normalcircumstances, to export any balance-of-payments surplus accruing to Switzer-land. As long as the balance of payments is in substantial surplus it can be ex-pected that the Swiss National Bank will take a liberal attitude toward capitalexports. The current account in the balance of payments is presently in deficitbut the continued large inflow of capital which more than offsets that deficit haspermitted the national bank to continue its liberal attitude toward capital ex-ports. The bank feels that the capital market should be kept as free as possiblesubject to domestic needs for capital and the balance-of-payments situation.
NETHERLANDS CAPITAL MARKET
Issues on the Dutch capital market offered by Dutch and foreign enterprisesmust be cleared with the Netherlands Bank. The Netherlands market was closedto foreign flotations from 1955 until May 1, 1961, primarily because of thedomestic need for capital and the tightness of money. In April 1961 the Nether-lands Bank announced it would begin to grant licenses for foreign issues, atleast for foreign bonds, on the Dutch capital market. The bankds announce-ment emphasized that licenses would be granted only on a limited and gradualscale. The foreign issues in 1961 totaled $149 million and $63 million in 1962.This foreign borrowing largely took the place of Netherlands Government issues-which would have absorbed excess domestic liquidity. The primary purpose ofthe authorities in granting permission for these foreign issues appears to havebeen the maintenance of a given level of Dutch international reserves. Thus.the availability of the Dutch capital market to foreigners appears to dependupon trends in the Netherlands international balance of payments.
4. Restrictions on tourism by foreign countriesA number of countries continue to restrict foreign exchange avail-
able for foreign travel. Table 17 on page 48, prepared by the rfreasuiryDepartment and originally printed in the Joint Economic Committeehearings mentioned above, summarizes the practices of variouscountries. Of the countries listed, Norway and Japan appear tohave the most restrictive regulations. Norway imposes a fairly lowallowance of $550 per year, of which $50 cannot be spent except onNorwegian carriers. Japan provides no automatic travel allowance.
Most countries which place limits on the amount of foreign exchangepermitted travelers provide additional amounts on justification. This.procedure has generally been accepted by the IMF as meeting therequirements of Article VIII, which provides for the avoidance ofrestrictions on current payments. In most cases, the practice is togive additional amounts on request. But in some instances, theavailability of additional foreign exchange is not well publicized, andmay therefore not be known to potential travelers. In such cases,foreign travel may be discouraged.
Countries maintaining restrictions on capital exports argue thatlimitations on foreign exchange for travel are necessary to preventevasion of their capital controls. The further liberalization of capitalcontrols would diminish this justification for travel restrictions.
46
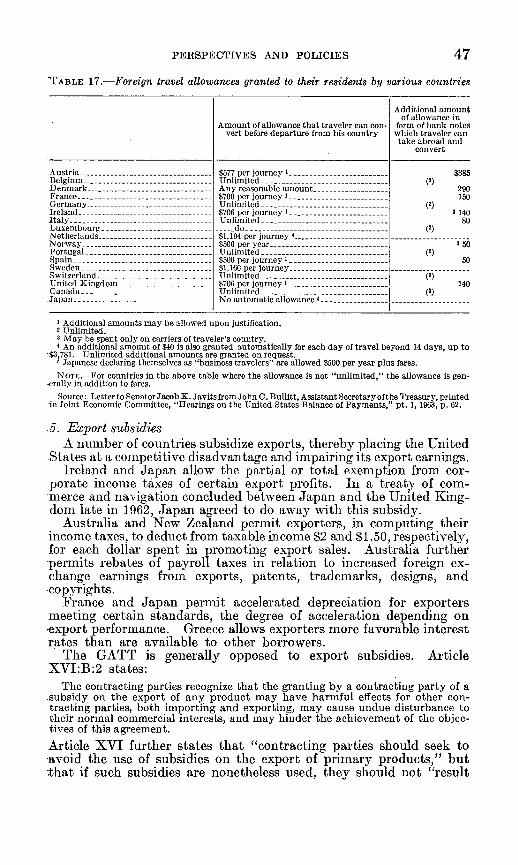
PERSPECTIVES AND POLICIES 47
TABLE 17.-Foreign travel allowances granted to their residents by various countries
Additional amountof allowance in
Amount of allowance that traveler can con- form of bank notesvert before departure from his country which traveler can
take abroad andconvert
Austria-----$577 per journey 1 $385Belgium ---- ---- - Unlimited ---- (2)Denmark ----- - Any reasonable amount - 290France ----- $700 per journey ' --- 150Germany Unlimited ------------------ (2)Ireland -- $706 per journey I 3140Italy Unlimited 80Luxem bourg d- o --------- ----- ------ ----- --- (2)Netherlands ---- ------- --- $1,194 per journey' --Norway $500 per year 3 50Portugal Unlimited ----------------------------- (2)Spain $500 per journey - 50Sweden - - - - $1,160 per journeySwitzerland - -- - Unlimited ------------------- (2)United Kingdom - $706 per journey l 140Canada .- --------------- - Unlimited --------- (2)Japan No automatic allowance - - -
I Additional amounts may be allowed upon justification.2 Unlimited.3 May be spent only on carriers of traveler's country.4 An additional amount of $40 is also granted automatically for each day of travel beyond 14 days, up to
:$3,781. Unlimited additional amounts are granted on request.2 Japanese declaring themselves as "business travelers" are allowed $500 per year plus fares.NOTE.-For countries in the above table where the allowance is not "unlimited," the allowance is gen-
erally in addition to fares.Source: Letterto SenatorJacob K. Javits from John C. Bullitt, Assistant Secretaryofthe Treasury, printed
in Joint Economic Committee, "Bearings on the United States Balance of Payments," pt. 1, 1963, p. 62.
5. Export subsidiesA number of countries subsidize exports, thereby placing the United
States at a competitive disadvantage and impairing its export earnings.Ireland and Japan allow the partial or total exemption from cor-
porate income taxes of certain export profits. In a treaty of com-merce and navigation concluded between Japan and the United King-dom late in 1962, Japan agreed to do away with this subsidy.
Australia and New Zealand permit exporters, in computing theirincome taxes, to deduct from taxable income $2 and $1.50, respectively,for each dollar spent in promoting export sales. Australia furtherpermits rebates of payroll taxes in relation to increased foreign ex-change earnings from exports, patents, trademarks, designs, andcopyrights.
Prance and Japan permit accelerated depreciation for exportersmeeting certain standards, the degree of acceleration depending onexport performance. Greece allows exporters more favorable interestrates than are available to other borrowers.
The GATT is generally opposed to export subsidies. ArticleXVI:B:2 states:
The contracting parties recognize that the granting by a contracting party of asubsidy on the export of any product may have harmful effects for other con-tracting parties, both importing and exporting, may cause undue disturbance totheir normal commercial interests, and may hinder the achievement of the objec-tives of this agreement.
Article XVI further states that "contracting parties should seek toavoid the use of subsidies on the export of primary products," butthat if such subsidies are nonetheless used, they should not "result
48 PERSPECTIVES AND POLICIES
in obtaining for the subsidizing country more than an equitable shareof the world export trade in the product concerned." In the case ofother-than-primary products, subsidies are prohibited under a declara-tion which became effective in November 1962 if they result in a lowerexport price than domestic price for the same product. Moreover,GATT imposes certain reporting requirements on countries withsubsidies.
6. The remission on exports of direct and indirect taxesThis area is closely related to the above discussion of subsidies.
The remission of indirect taxes, such as sales and excise taxes, on ex-ports is not regarded as subsidization, even though it results in lowerexport than domestic prices. Countries generally remit indirect taxeson exports, and apply to imports indirect taxes intended to be equiva-lent to those levied on domestically produced goods. The underlyingassumption is that indirect taxes are fully passed on to buyers, or inother words, result in prices which exceed by the full amount of suchtaxes the price level that would exist in the absence of the taxes. Onthis assumption, unless indirect taxes were remitted on foreign sales,exporters would be placed at a competitive disadvantage in the mar-kets of importing countries relative to domestic sellers in those mar-kets and relative to competitors from other exporting countries withlower indirect taxes.
On the other hand, direct taxes, such as corporate income taxes,are not generally remitted on exports, and there is little doubt thatany such remission would be regarded as a subsidy within the meaningof GATT. The underlying assumption here is that direct taxes arenot passed on to buyers and that a remission of such taxes on exportsis therefore unnecessary to preserve a country's competitive position.
The United States, to a much greater extent than most Europeancountries, emphasizes direct rather than indirect taxes. If the assump-tions underlying the different treatment of exports under the twotypes of taxes proved false, existing practice would place the UnitedStates at a serious competitive disadvantage relative to foreign sellers.Suppose, for example, that direct and indirect taxes were both reflectedin higher prices. Under such circumstances, American exports to,say, Britain, with a high U.S. tax component in their prices, wouldbe subject, in addition to any applicable tariffs, to British indirecttaxes designed to equalize the treatment of imports and domesticallyproduced British goods; and they would have to compete, with littleor no benefit from U.S. tax remittances, with continental Europeangoods enjoying tax rebates which range generally from 10 to 25percent of tax-free prices.
There are reasons to question the validity of the underlying as-sumptions that indirect taxes are passed on to consumers while directtaxes are not. Studies are now underway within the U.S. Governmentto determine whether, and to what extent, the U.S. competitiveposition is impaired by existing practices in this area.
PERSPECTIVES AND POLICIES 49
7. Discrimination against U.S. exports for balance-of-payments reasonsby members of regional economic groups
When the Latin American Free Trade Association (LAFTA) wasformed, its members exempted imports from each other from theapplication of restrictions imposed to conserve foreign exchange, butmaintained such restrictions on imports from outside the new associa-tion. As a result, U.S. exports, particularly of sulfur, were adverselyaffected.
This discrimination by the LAFTA countries is counterproductivefrom the point of view of improving their balance-of-paymentspositions-the consideration that led to the adoption of the restrictionsin the first place. Presumably the LAFTA countries bought in theUnited States before their association because U.S. products werecheaper or available on better terms than the comparable goods ofother LAFTA countries. Since the LAFTA countries use dollars tosettle transactions with each other, the diversion of purchases from theUnited States to other LAFTA countries probably requires an evengreater expenditure of dollars than was necessary before.
Despite acknowledgment that their discrimination in the applica-tion of balance-of-payments restrictions is detrimental to their inter-national payments positions, the LAFTA countries have declined tochange their practice. The contribution of such restrictions to greaterpolitical and economic cohesiveness is cited as an overriding merit ofthe discriminatory system.8. Sharing the burdens of economic assistance and military defense
U.S. expenditures abroad for economic assistance and militaryprograms contribute to the balance-of-payments deficit, and havebeen higher in relation to GNP than the contributions of othercountries. A greater effort by the allied countries would not onlybe equitable, but would improve the U.S. balance of payments andstrengthen the international payments system. Expanded and untiedaid expenditures by the surplus countries would result in an expansionof U.S. exports as the recipient countries generally enlarged theirpurchases. Unfortunately, most of the surplus countries tie or other-wise assure that their contributions take the form of their own goodsand services, even though, unlike the United States, they lack balance-of-payments reasons for doing so.
Enlarged military spending by allied countries would benefit thebalance of payments by leading to greater U.S. exports of militaryand related products and by possibly permitting the United States tomake some reductions in its military payments overseas. Moreover,diversion of foreign manpower into military uses could lead to in-creased demands for the goods and services of outside countries,including those of the United States.
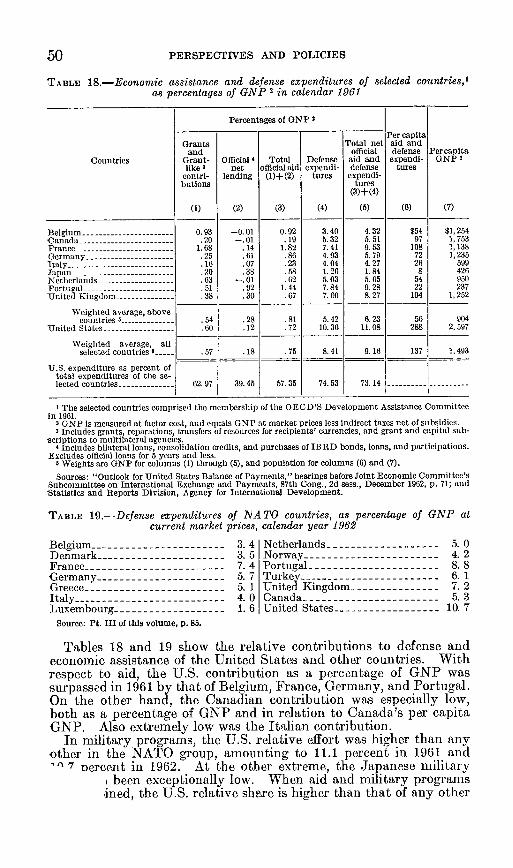
50 PERSPECTIVES AND POLICIES
TABLE 18.-Economic assistance and defense expenditures of selected countries,'as percentages of GNP 2 in calendar 1961
Percentages of GNP 3
Per capitaGrants Total net aid and
and official defense PercapitaCountries Grant- Official 4 Total Defense aid and expendi- GNP 2
like 3 net official aid expendi- defense turescontri- lending (1)+(2) tures expendi-
butions tures(3)+(4)
(1) (2) (3) (4) (5) (6) (7)
Belgium-0.93 -0.01 0.92 3.40 4.32 $54 $1,254Canada -. 20 -. 01 .19 5.32 5.51 97 1,753France -1.68 .14 1.82 7.41 9.53 108 1,138Germany -. 25 .61 .86 4.93 5.79 72 1,235Italy -. 16 .07 .23 4.04 4.27 26 599Japan -. 20 .38 .58 1.26 1.84 8 426Netherlands -. 63 -. 01 .62 5.03 5.65 54 950Portugal -. 51 .92 1.44 7.84 9.28 22 237United Kingdom -. 38 .30 .67 7.60 8.27 104 1,252
Weighted average, abovecountries 5- .54 .28 .81 5.42 6.23 56 904
United States- .60 .12 .72 10.36 11.08 288 2.597
Weighted average, allselected countries a --- .57 .18 .75 8.41 9.16 137 1.493
U.S. expenditure as percent oftotal expenditures of the se-lected countries- 62.97 39.45 57.35 74.53 73.14
I The selected countries comprised the membership of the OECD'S Development Assistance Committeein 1961.
2 GNP is measured at factor cost, and equals GNP at market prices less indirect taxes net of subsidies.3 Includes grants, reparations, transfers of resources for recipients' currencies, and grant and capital sub-
scriptions to multilateral agencies.4 Includes bilateral loans, consolidation credits, and purchases of IBRD bonds, loans, and participations.
Excludes official loans for 5 years and less.5 Weights are GNP for columns (1) through (5), and population for columns (6) and (7).
Sources: "Outlook for United States Balance of Payments," hearings before Joint Economic Committee'sSubcommittee on International Exchange and Payments, 87th Cong., 2d sess., December 1962, p. 71; andStatistics and Reports Division, Agency for International Development.
TABLE 19.-Defense expenditures of NATO countries, as percentage of GNP atcurrent market prices, calendar year 1962
Belgium.Denmark-France-GermanyGreece-Italy-Luxembourg-
Source: Pt. III of this volume, p. 85.
3. 4 Netherlands - -3. 5 Norway - -----------7. 4 Portugal-5. 7 Turkey.5. 1 United Kingdom4. 0 Canada-1. 6 United States
Tables 18 and 19 show the relative contributions to defense andeconomic assistance of the United States and other countries. Withrespect to aid, the U.S. contribution as a percentage of GNP wassurpassed in 1961 by that of Belgium, France, Germany, and Portugal.On the other hand, the Canadian contribution was especially low,both as a percentage of GNP and in relation to Canada's per capitaGNP. Also extremely low was the Italian contribution.
In military programs, the U.S. relative effort was higher than anyother in the NATO group, amounting to 11.1 percent in 1961 and
'7 nercent in 1962. At the other extreme, the Japanese military; been exceptionally low. When aid and military programsined, the U.S. relative shire is higher than that of any other
5. 04. 28. 86. 17. 25. 3
10. 7
PERSPECTIVES AND POLICIES
country. In its statement on military strategy and the balance ofpayments, part III, p. 84. of this volume, the Defense Departmentnoted that "our NATO Allies have consistently fallen short of statedmilitary force level requirements."9. Cooperation in international monetary affairs
International monetary cooperation has reached high levels, but ithas not been equally forthcoming from all quarters, and could, insome respects, be improved upon. It rests on more than goodwill.All the world's central bankers have seen David Low's famous cartoonof 1934 showing France, Britain, and the United States sitting aloofin the prow of a small boat, named "World Money Problem," instormy waters, with its stern flooding and sinking despite feverishbailing by a group labeled "middle Europe." The caption was"Phew! That's a nasty leak. Thank goodness it's not our end ofthe boat."
(a) The Treasury's new nonmarketable foreign currency seriesbonds
In October 1962, the U.S. Treasury introduced a new type of bondto help finance the deficit. The new instrument is of fairly shortmaturity-ranging from 15 months to 2 years-pays interest at ratesnot in excess of prevailing yields on U.S. marketable bonds with com-parable maturities on the date of issue, is nontransferable, and isdenominated in the foreign currency of the lending country. To theforeign lender such bonds provide an investment alternative to goldor dollars with the added attraction of an exchange guarantee becauseit is repayable in the lender's currency.
As of the end of September 1963, five European nations had bought$705 million of such bonds as follows: Austria, $25 million; Belgium,$30 million; Germany, $275 million; Italy, $200 million; and Switzer-land, $175 million. But France with total reserves of $4.7 billion andliquid dollar holdings of $1.4 billion at the end of June 1963, hadbought none, nor had the Netherlands, holding in gold nearly $1.6billion of its $2 billion international reserves.
(b) Monetary andfiscal policiesAdjustment to international imbalance implies responsibilities for
surplus as well as for deficit countries. The latter must restraininflationary forces, reduce costs, and endeavor in other ways to becomemore competitive in international markets. Surplus countries, on theother hand, should permit their increased reserves to exert some up-ward pressures on wages and incomes, thereby increasing imports,and downward pressure on interest rates, thus promoting capitalexports. The United States itself experienced international pressuresin the early postwar years, in part resulting from its financing of alarge volume of exports under the Marshall plan and other aid [pro-grams.
The European countries have attempted, in recent years, to moder-ate inflationary pressures originating in part from their favorableinternational accounts. The character of their policies has had im-portant balance-of-payments implications for the United States.
To avoid drawing capital from the United States, the surplus coun-tries might reasonably be expected to attack their problem of inflationwith a restrictive fiscal policy, without placing upward pressures on
51
PERSPECTIVES AND POLICIES
their interest rates. This would be consistent with the policies urgedupon the United States by these countries. They have advocated thatthe United States pursue domestic growth with an expansionaryfiscal policy moderated somewhat by a restrictive monetary policy.And the United States has already moved to tighten short-term creditconditions, even though no tax cut has yet been enacted.
Instead of applying the logic of their arguments to their own cir-cumstances, a number of surplus countries have tightened credit.France, in particular, has adopted an active policy of credit restriction.Its open market rates increased from 3.51 percent at the end ofDecember 1962 to 5.26 percent at the end of July 1963. Belgium hastwice raised its discount rate since the Federal Reserve increased itsown rate in July 1963. Swiss money markets have been understrain, and interest rates have risen in all sectors. German long-termrates continue under pressure. These conditions intensify the diffi-culties confronting the United States in its efforts to move towardinternational equilibrium.
(c) Commercial policiesCommercial policy offers another opportunity for the surplus
countries to fight inflation while at the same time promoting inter-national equilibrium. Countries enjoying a favorable balance ofpayments and anxious to moderate price increases could unilaterallyreduce trade barriers, thereby increasing competition within theirhome markets and permitting the deficit countries to improve theirexport earnings. In effect, the United States followed this policy inthe early postwar years. In the important tariff negotiations atGeneva in 1947, Annecy in 1949, and Torquay in 1950-51, tariffreductions granted by the United States were put into effect, whilethose of the countries which are now in surplus were largely or whollymade ineffective by quantitative restrictions and exchange controlsimposed to protect their balance-of-payments positions.
Other countries have made only limited use of commercial policy asa counterinfiationary tool. Germany did so, before its commercialpolicy became integrated with that of the Common Market. AndFrance and Austria have also reduced tariffs to combat inflation.Unfortunately, it now appears that protectionism rather than liberal-ism in commercial matters is gaining headway in Europe.
(d) Conversions of dollars into goldCertain countries continue to convert dollars into gold, even though
they are aware that this weakens the stability of the entire inter-national monetary system.
Table 20 shows the international reserves and gold ratios of variousregions and countries. It is evident that countries have very differentinterpretations of what constitutes an appropriate gold ratio. TheUnited Kingdom, which also manages a reserve currency, takes theposition that it must maintain a high reserve ratio. On the otherhand, the Netherlands, with no reserve currency, has the highest ratioin Continental Europe-around 90 percent. Perhaps the Netherlandsauthorities have not forgotten that, as a result of the depreciation ofthe pound in 1931, they suffered losses exceeding the entire capital oftheir central bank.
52
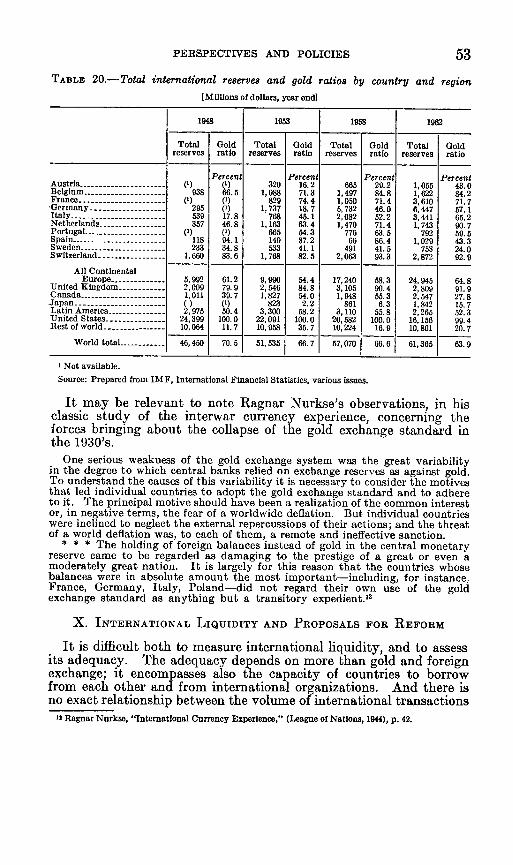
PERSPECTIVES AND POLICIES 53
TABLE 20.-Total international reserves and gold ratios by country and region[Millions of dollars, year end]
1948 1953 1958 1962
Total Gold Total Gold Total Gold Total Goldreserves ratio reserves ratio reserves ratio reserves ratio
Percent Percent Percent PercentAustria -(1) (1) 320 16.2 665 29.2 1,055 43.0Belgium -938 66.5 1,088 71.3 1,497 84.8 1,622 84.2France- () (') 829 74.4 1,050 71.4 3,610 71.7,Germany -- 295 (') 1,737 18.7 5,732 46.0 6,447 57.1Italy -539 17.8 768 45.1 2,082 52.2 3,441 65.2Netberlands- 37 46.8 1,163 63.4 1,470 71.4 1,743 90.7Portugal- (1) (') 665 54.3 776 63.5 792 59.5Spain -118 94.1 149 87.2 66 86.4 1,029 43.3Sweden -233 34.8 533 41.1 491 41.5 753 24.0Switzerland-1,660 83.6 1,768 82.5 2,063 93.3 2,872 92.9
All ContinentalEurope - ----- 5,992 61.2 9, 990 54.4 17,240 58.3 24,945 64.8United Kingdom -2,009 79.9 2,546 84.8 3,105 90.4 2,809 91.9
Canada 1 011 39.7 1,827 54.0 1,948 55.3 2.547 27.8Japan- () (') 823 2.2 861 6.3 1,842 15.7Latin America------ 2,975 50.4 3,300 58.2 3,110 55.8 2,265 52.3United States 24, 399 100.0 22,091 100.0 20,582 100.0 16, 156 99.4Rest of world -- ----- 10,064 11. 7 10,958 35. 7 10,224 16.9 10,801 20.7
World total -46,450 70. 5 51,535 66.7 57,070 66. 6 61,365 63.9
] Not available.Source: Prepared from IMF, International Financial Statistics, various issues.
It may be relevant to note Ragnar Nurkse's observations, in hisclassic study of the interwar currency experience, concerning theforces bringing about the collapse of the gold exchange standard inthe 1930's.
One serious weakness of the gold exchange system was the great variabilityin the degree to which central banks relied on exchange reserves as against gold.To understand the causes of this variability it is necessary to consider the motivesthat led individual countries to adopt the gold exchange standard and to adhereto it. The principal motive should have been a realization of the common interestor, in negative terms, the fear of a worldwide deflation. But individual countrieswere inclined to neglect the external repercussions of their actions; and the threatof a world deflation was, to each of them, a remote and ineffective sanction.
* * * The holding of foreign balances instead of gold in the central monetaryreserve came to be regarded as damaging to the prestige of a great or even amoderately great nation. It is largely for this reason that the countries whosebalances were in absolute amount the most important-including, for instance.France, Germany, Italy, Poland-did not regard their own use of the goldexchange standard as anything but a transitory expedients
X. INTERNATIONAL LIQUIDITY AND PROPOSALS FOR REFORM
It is difficult both to measure international liquidity, and to assessits adequacy. The adequacy depends on more than gold and foreignexchange; it encompasses also the capacity of countries to borrowfrom each other and from international organizations. And there isno exact relationship between the volume of international transactions
It Ragnar Nurkse, "International Currency Experience," (League of Nations, 1944), p. 42.
PERSPECTIVES AND POLICIES
and the level of needed reserves; reserves are necessary to finance im-balances between international payments and receipts, not inter-
national transactions as such.Despite the difficulty of measuring the adequacy of liquidity, it
appears that the growth of gold reserves is too small in relation to
the increase in international transactions to permit gold, at presentprices, to provide the answer to the world's future needs. In 1962,
free world exports were nearly 70 percent higher than in 1952, but
gold reserves at the end of 1962 were only 16 percent above the 1952
yearend level. Particularly disturbing is the diminishing proportion
of the free world's gold production which, over the years, has found
its way into official reserves. In the 5 years following 1952, 63 per-
cent of gold production went into official reserves. In the next 5 years
the proportion fell to 45 percent. And in 1962, less than 25 percent of
gold production became available for international reserve purposes.13.But even if all of the free world's gold production had gone into
official reserves after 1952, gold reserves would have increased only29 percent.
It has long been recognized that the expansion of the world's gold
reserves might be inadequate to cope with the world's growing liquid-ity needs. A Genoa Conference in 1922 recommended the widespread-
adoption of the gold exchange standard as a solution to the problem.
And a specially designated gold delegation of the League of Nations
recommended in 1930 and again in 1932 that countries act in concert
to change their legal gold reserve requirements against domestic money
so as to regulate the volume of gold freely available for international'purposes. But the abnormal circumstances of the late 1920's and
1930's eliminated, bor the time being, the threat of a worldwide goldlshortage.
There has been considerable discussion in recent years of the ques-tion whether or not there is currently an international liquidity short-age. The consensus of expert opinion is that there is no such shortage-today, although many believe that such a shortage is likely to occur in
the future. The United States had, in mid-1963, gold reserves of $15.8.
billion, 40.2 percent of the gold reserves of all free world countries.And its total reserves, including the IMF gold tranche position, were
$17.1 billion at that time. Yet, however large these reserves in abso--
lute amount, they are by no means excessive in relation to U.S. liquidliabilities. On the other hand, the other industrial countries generallyhave large or at least adequate reserves. The less developed countrieshave a shortage of international liquidity, but this is only a symptomof a more basic and serious capital shortage. Increases in world
liquidity would not, in present circumstances, be of lasting benefit to
the reserves of these countries; they tend to spend incremental foreignexchange receipts rather than add to their reserves. The problems of
the less developed countries must be, and are being, approachedthrough grants, long-term loans, technical assistance, selective com-
modity stabilization programs, and efforts to broaden markets for theirproducts, and, in the case of financial emergencies, through balance-of-payments assistance.
The immediate problem is the achievement of a better balance in
American international payments, not an inadequacy of internationalliquidity in the monetary system as a whole. But the outlines of thefuture liquidity problem are already clear. In essence, the problem.
IS International Monetary Fund, International Financial Statistics.
54
PERSPECTIVES AND POLICIES 55
is that, with increases in the monetary gold stock lagging behindliquidity needs, national currency holdings must form an ever-increasing part of total international reserves. This implies anincrease in relation to their gold stocks of the liquid liabilities of thecountries whose currencies are held as reserves by other countries.But when these liquid liabilities grow substantially beyond the reserve-currency countries' own gold reserves, confidence may be diminishedin their continuing ability to maintain the par values of their cur-rencies, and the stability of the entire monetary system may beundermined. To be sure, this way of putting the problem is anoversimplification. The need for additional international liquiditydoes not grow in direct proportion to the volume of internationaltransactions, and there is no precise relationship between the mag-nitude of liquid claims against a country's gold reserves and the degreeof confidence in its currency. But increases in international trans-actions tend to raise the need for international reserves, and theremay be limits to the volume of international liquid liabilities whicha given volume of gold reserves can support without an underminingof confidence in the currency concerned.
To remedy the defects and dangers of the present system, a number-of proposals have been made. Not all can be examined or even men-tioned here, but a few of the leading proposals are touched upon.
(1) Devaluation of the dollar relative to other currencies, or in concertwith other countries
While the United States would benefit if it could reduce its pricelevels in foreign markets, it seems unlikely that devaluation by theUnited States could lead to this result. Other countries would prob-ably devalue along with the dollar to maintain existing exchangerelationships and to prevent the United States from gaining a com-petitive advantage at their expense. A leading argument againstdevaluation by the United States is that any such attempt wouldresult in an international monetary crisis. Other countries, acting inreliance on U.S. promises that the dollar would not be devalued, haveacquired over $23 billion of liquid dollar assets, of which more than $12billion are held as official monetary reserves. If the dollar were de-valued, other countries might be reluctant again to trust it as a storeof international value, and international liquidity could be correspond-ingly reduced.
It is sometimes suggested that this difficulty could be overcome ifthe United States, acting in concert with other countries, were todevalue to such a degree that the increase in the value of gold stockswould more than offset the decline in international liquidity resultingfrom the conversion of all foreign-held dollar balances into gold.Such devaluation could result in increased international liquidity byincreasing the value of existing gold stocks and by encouraging anexpansion of gold mining. But there remain substantial, if notinsuperable, difficulties with such a plan. Changes in the par valueof the dollar would require legislative action by Congress and con-sultation with the IMF. The publicity attendant upon congressionalproceedings would probably result in massive speculation which couldexceed the resources available to defend the system. Moreover,devaluation would reward and provide new incentives for gold specu-lators and hoarders, and would thus tend to diminish the proportion
56 PERSPECTIVES AND POLICIES
of newly produced gold going into official reserves. The way wouldthus be paved for another liquidity crisis in the future.
Finally, the benefits of devaluation would accrue to countries inproportion to their existing gold holdings. Countries with lowreserves, in need of greater liquidity, would receive little benefit.Countries which had cooperated with the U.S. and held a large pro-portion of their reserves in dollars would be penalized in relation toless cooperative (ountries with higher gold ratios. And devaluationwould give a continuing reward to the major gold producers, SouthAfrica and the U.S.S.R. Finally, the profits resulting from devalua-tion might generate inflationary pressures which would raise the valueof international transactions and increase the need for internationalreserves, thereby absorbing all or a part of the increased reservesresulting from the devaluation.(2) Flexible exchange rates
Flexible exchange rates equilibrate the demand for and supply offoreign exchange by moving with the pressures of imbalance, and inthis way they dispense with or greatly reduce the need for interna-tional reserves. Determination of the prices of foreign currenciesthrough the forces of supply and demand has not found favor withcentral bankers and monetary authorities who might, in other mat-ters, advocate establishment of prices by free market forces. Manyacademic economists, on the other hand, endorse flexible exchangerates. The present system, itself, is a compromise between fixed andflexible rates, in that the IMF articles of agreement provide for changesin exchange rates in cases of "fundamental disequilibrium." Rateswhich move from one fixed level to another under this system are,in reality, not fixed, but sporadically adjustable. In descriptions ofthe present system, it is the fixity rather than adjustability of rateswhich is most often emphasized, for experience has shown that doubtsconcerning the stability of existing rates frequently lead to disturbingcurrency speculation which can tax all of the resources of the inter-national monetary system, even if rates are not in fundamentaldisequilibrium.
It is argued on behalf of fixed exchange rates that, by eliminatinguncertainty, they increase international flows of goods, services, andcapital. On the other hand, it may be said that the optimizing,rather than maximizing of international transactions should be thegoal, and optimizing implies that the international sector as wellas the domestic should bear the burden of adjustment to internationalimbalance. Under fixed exchange rates the burden falls dispropor-tionately on the domestic sector.
The world's practical experience with flexible exchange rates hasnot been reassuring. In the period between the two world wars,.a number of countries had flexible rates for various periods of time.The French experience from 1919 to 1926 is perhaps most striking.The French franc suffered large fluctuations as a result of speculationconcerning its future value. Psychological factors often resulted inlarge cumulative and self-aggravating movements of the exchangerate, with destabilizing rather than equilibrating effects. Canada's.postwar experience with its "floating" dollar has often been cited asa successful example of a flexible exchange rate system. However,Canada was forced to abandon this system and to adopt a fixed value
PERSPECTIVES AND POLICIES 57
for its currency in 1962. After several years of reduced capital im-ports, substantial doubt arose concerning the future value of theCanadian dollar, and heavy speculation against that currency severelydepleted Canada's reserves.
It would be difficult to forecast how flexible exchange rates mightoperate in present-day circumstances. Perhaps actual experience hasbeen too limited and confined to periods of disturbed conditions toprovide an adequate basis for judgment. Advocates of flexible ratesmay have underestimated the disruptive potential of speculative capi-tal movements. Yet the present system is not speculation proof.Indeed, it is sometimes accused of encouraging speculation by limitingthe possibility of loss through the small margin of rate fluctuationsaround par while providing the possibility of substantial gain in case ofdevaluation.(3) The establishment of a credit-creating international central bank.
In establishing international credit facilities, two questions areparamount:
1. How much lending should be compulsory for surplus countries?2. To how much credit should deficit countries be entitled?The importance of these questions may perhaps be best understood
by considering the International Monetary Fund, as it functions today.Under the present arrangements, the commitments of countries to lendare defined by the sizes of their respective quotas. These quotas alsoare relevant, but not decisive, in determining the borrowing limits ofdeficit countries. A deficit country, normally entitled to draw up to125 percent of its quota, would not be able to do so if the Fund hadan inadequate supply of the surplus countries' currencies.
* * * prospective surplus members of the Fund did not promise to extendcredit to the amount of the aggregate of quotas of the deficit countries, but onlyto the extent of their own contributions to the Fund. Since the sum of quotasof the potential deficit countries was at the time [of the Fund's inception] largerthan the sum of the quotas of the potential surplus countries the Fund agreementwas marred from the beginning by an insufficiency of the Fiund's resources andby the necessity of bolstering the Fund's asymetrical structure through repur-chase and scarce currency provisions (the latter even implying exchange controlmeasures) .14
The supplementary borrowing arrangement of the IMF, recentlynegotiated with 10 leading convertible currency countries, redressesthis asymetry to some extent. But under the Fund's Articles ofAgreement, the surplus countries' contractual responsibilities toprovide credit are rigidly defined, while the rights of debtor countriesare indeterminate within the outside limits set in relation to theirquotas.
Contrast this situation with the one that would result if the IMFcould create international legal tender. Suppose that the Fund weredetermined to increase international liquidity 3 percent a year-aseemingly modest amount-by engaging in open market purchases ofthe domestic financial assets of deficit countries. If the surplusescorresponding to the deficits mainly accrued to one or a small numberof countries, what might appear as a modest increase in total inter-national liquidity could entail heavy responsibilities for a few countriesto provide credit by accepting the IMF's currency in exchange forgoods and services. Under this system, where, in the limiting case,
,I George N. Halm, "Special Problems of a Key Currency in Balance-of-Payments Deficit," in JointEconomic Committee, "Factors Affecting the U.S. Balance of Payments," 1962, p. 548.
58 PERSPECTIVES AND POLICIES
the entire increase in the world's liquidity could find its way into thereserves of one creditor country, the balance of advantage is clearlyshifted from surplus to deficit nations. Surplus countries would beunable to determine how much of the credit resulting from the IMF'sinternational money creation would ultimately have to be providedby them. Of course, their responsibility could be controlled by limit-ing the rate at which the IMF could create international currency,but a low rate of growth would limit the usefulness of the plan todeficit countries.
We cannot here explore in depth the questions raised by the conceptof an international credit-creating bank. The important thing tobear in mind is that, beneath the veil of institutional procedures andpractices, credit would ultimately be provided by the surplus countriesor by countries with large reserves to the deficit countries. Any inter-national monetary arrangement must provide for some balance be-tween the rights of those with deficits and the responsibilities of thosewith surpluses. The mechanics of various plans, which often arebewildering in their complexity, must not be allowed to obscure theunderlying debtor-creditor relationships which are involved.
It has often been pointed out that the establishment of a money-creating international bank would imply some potential conflictbetween the measures adopted by the bank and the national policiesof member countries. The open-market operations of such an insti-tution might be inconsistent with the monetary policies being pursuedby the countries in which such operations take place. And theultimate result of credit creation might be large demands for thegoods and services of countries which are endeavoring to restraininflationary pressures.
The problem of possibily conflicting policies is often raised in termsof the loss of monetary sovereignty on the part of countries affectedby the credit-creating bank. But this is somewhat misleading, forinternational considerations must play a role in national policiesunder any system. For example, even under the present system, thebalance-of-payments difficulties of the United States have placedlimitations on its freedom of action. The United States has beenobliged to adopt a host of measures, such as tying aid, procuringmilitary supplies at home despite greater budget costs, and raisinginterest rates at a time of substantial unemployment, all of which areundesirable in themselves and justifiable only in terms of the exi-gencies of the balance of payments.
(4) Multiple key currency systemThe possibility that this system might evolve from the present order
was first raised at the official level by the Under Secretary of theTreasury Robert V. Roosa in his article "Assuring the Free World'sLiquidity" published by the Federal Reserve Bank of Philadelphiain September 1962. Mr. Roosa suggested that a return to surplusesin the U.S. balance of payments need not result in a depletion of theinternational reserves of other countries, as the United States couldacquire foreign currencies in its reserves, thus extending credit toother countries in the same way that credit has been provided to theUnited States by countries holding dollars. Indeed, the United
PERSPECTIVES AND POLICIES
States has already found it useful to hold foreign currencies in itsreserves for the purpose of operating in foreign exchange markets.
To the extent that surplus countries generally accepted a deficitcountry's currency instead of requiring it to pay in gold or in thecurrency of another country, deficits would lead to an increase ininternational liquidity. Of course. the world's net reserves wouldremain unchanged.
The increase in the world's effective liquidity would probably besomewhat less than the increase in foreign exchange held as reserves.To an important degree, liquidity is psychological. Its limits aredefined by how far countries are willing to go in pursuing policiesthat could require them to use their reserve assets and seek credit.To the extent that countries tend to focus on their net reserve posi-tions the acquisition of their currencies in times of deficit by surpluscountries would be experienced as a loss of liquidity. On the otherhand, an unlimited willingness of surplus countries to accumulate thecurrencies of deficit countries would eliminate the possibility of aninternational liquidity shortage and the necessity for a deficit countryto bring its balance of payments into equilibrium.
Proponents of the multiple key currency system see as one of itsprincipal advantages the absence of any compulsion to lend. Asurplus country would be free to decide for itself what amounts, ifany, it wished to acquire of a deficit country's currency. If surpluscountries were no longer willing to add to their holdings of a deficitcountry's currency, that currency's exchange rate would fall untilthe deficit country had to support it by selling its gold or holdings ofthe currencies of other countries. The absence of a commitment toacquire the foreign exchange of other countries is, of course, an advan-tage to the surplus countries, who retain complete freedom of action,but a disadvantage to the deficit countries who cannot be assured ofcredit. Another advantage of the multiple reserve currency systemis that it could tend over time to equalize the ratios between goldand liquid liabilities of the participating countries.
However, a number of important problems are raised by the conceptof a multiple key currency system. What currencies would be heldand in what amounts? The French franc is now strong, but it wasdevalued three times in the postwar period. Would such a currencybe a suitable reserve asset for other countries? Inasmuch as the planprovides for the accumulation of other countries' currencies preciselyduring periods when they are in deficit, i.e., when their currencies areweak, is it likely that these currencies would be regarded as attractivestores of international value? How could creditor countries be pro-tected against losses resulting from the devaluation of currencies theyhold? What would be the role, if any, of exchange guarantees?
If participation in the plan were entirely optional, wouldn't theentire system be vulnerable to crises of confidence, made more danger-ous and potentially disruptive by the pyramiding of credit on a slowlygrowing gold base? Wouldn't the system require certain commit-ments as a minimum-perhaps concerning the percentages of gold inthe reserves of participating countries, and the composition of foreigncurrency holdings other than dollars?
The evolution of a multiple reserve currency standard could providefor the growth of international liquidity, but, because participation isoutional, it is not clear that such growth would actually come about.
24-974-63-5
59
60 PERSPECTIVES AND POLICIES
But whatever its difficulties, the international monetary systemappears to be evolving toward a multiple key currency system. Theplan merits further study and public discussions so that its implica-tions may be better understood.
In reviewing these plans and proposals, it is clear that ideas forbasic reforms of the international monetary system have so far out-stripped actual accomplishments, considerable as these have been.The major accomplishments of the past few years include the negotia-tion by the United States and nine other countries of an agreement tolend the IMF up to $6 billion subject to certain conditions; thecreation of a network of currency swaps which may be activated inthe event of international monetary disturbances; the formation of agold pool to prevent destablizing price movements in the London goldmarket; and, in general, the development of an unprecedented degreeof cooperation among the central bankers and monetary authoritiesof the free world.
At the 1963 annual meeting of the Board of Governors of the IMF,the group of 10 nations participating in the Fund supplementaryborrowing arrangement announced that they would begin a thoroughexamination of the prospective functioning of the internationalmonetary system and improvements that might be necessary toensure adequate liquidity. It is understood that this examinationwill not cover devaluation and flexible exchange rates. During thesame meetings, the IMF announced that it, too, would undertake afar-ranging study of international liquidity and the functioning ofthe international monetary system. Both studies are expected to becompleted sometime in 1964, and both will play an important role inshaping the further evolution of the international monetary system.
PART II
FOREIGN ASSISTANCE CRITERIA ANDBALANCE-OF-PAYMENTS PROBLEMS
By theProgram Coordination Staff, Agency for
International Development
el
FOREIGN ASSISTANCE CRITERIA AND BALANCE&OF-PAYMENTS PROBLEMS
PROGRAM COORDINATION STAFF, AGENCY FOR INTERNATIONAL DEVELOPMENT
Current concern about the U.S. balance-of-payments position hasfocused attention on the following basic question: What balanceshould be sought among the several objectives of maintaining anadequate foreign assistance program, providing that assistance in themost efficient form and at the same time minimizing adverse balance-of-payments effects?
The balance-of-payments impact of foreign assistance can be re-I,duced either by reducing the amount of assistance, or by altering thecomposition and techniques of administering the assistance programsjfor by a combination of these approaches. Adjustments in the level 1 -of economic assistance on balance-of-payments grounds must beconsidered in the broader context of the total costs of and benefitsderived from that assistance. Changing the composition of assistancein order to reduce adverse payments effects may reduce itseffectiveness.
This paper describes the criteria which are currently applied bythe U.S. Government in allocating foreign economic assistance as wellas the relationships between assistance and the balance of payments.The purpose is to provide more adequate background on the issueswhich are involved.
1. THE PURPOSE OF FOREIGN ASSISTANCE
The major objective of the U.S. foreign assistance program is toassist other countries that seek to maintain their independence anddevelop into self-supporting nations. This objective is predicated onthe belief that the resulting community of free nations, cooperatingon matters of mutual concern, offers the best long-run prospect ofsecurity and peace for the United States.
This community will grow in strength as the less-developed countriesattain social justice and rising standards of living. At present, theirhuman skills, institutional framework, and capital resources areinadequate to meet rising internal demands for such progress. Weseek to help the less-developed countries realize their hopes by aprocess of economic and social development compatible with ourbasic objectives.
In countries facing immediate internal or external threats to theirsecurity and independence, military assistance and supportingeconomic aid are used to help avert or defeat the threat. In countrieslacking basic law and order, administrative services, and politicalcontinuity to launch a serious development effort, U.S. assistancemay help to establish these preconditions for growth. In many morecountries, U.S. capital and technical assistance are used to speeddevelopment efforts already underway. In some of these countries,
63
64 PERSPECTIVES AND POLICIES
the United States carries the major burden of external aid; in others,our aid is small and supplements that of other donors who bearprimary responsibility for extending assistance.
Clearly, a central objective of extending aid is to help each countryreach the point at which its own resources and its ability to attractinvestment and credit on commercial terms are adequate to sustainsatisfactory growth.
In each country to which the United States extends aid, the assist-ance program usually serves several foreign policy objectives. How-ever, in most programs one major objective is dominant. Countryprograms, therefore, may be grouped into three general categoriesaccording to the nature of our objectives and the extent of our partici-pation: (1) substantial programs directed to long-term economic andsocial development; (2) substantial programs dominated for the imme-diate present by the need to maintain external and internal security,but aiming at economic development in the long-run; and (3) limitedprograms with more restricted objectives.(a) Substantial programs for long-term development
About 30 countries receive substantial assistance for long-term de-velopment and are judged to have good prospects of attaining self-sustaining growth within a reasonable period of time if they makeeffective use of the internal and external resources available to them.These countries receive almost 90 percent of all U.S. developmentlending. They fall into three groups:
Countries which are approaching self-sustaining growth andin which needs for further assistance on favorable terms are rela-tively limited. This group includes Venezuela, Mexico, Jamaica,Israel, Greece, and Taiwan.
Countries following relatively effective development policiesand making reasonable progress toward self-sustaining growth.This group includes India, Pakistan, Turkey, and Nigeria.
Countries with potential for development but in which ade-quate self-help measures are not now being demonstrated.
In the first two groups the United States is in substantial agreementwith the country's internal development objectives and with themanner in which they are being pursued. In most of these countries,there have also been substantial increases in investment and in privateand public saving; dependence on external assistance is not excessivegiven their present stage of development
In the third group of countries, where the adequacy of developmentpolicies has yet to be demonstrated, U.S. aid is related to the adoptionof self-help measures. The U.S. approach may take a variety offorms. The general procedure is to agree with a government on aset of key policies and to condition the amount of aid upon thecountry's performance. In these countries, the United States isinterested in increasing the domestic financing of development and inencouraging policies which alleviate balance-of-payments deficits andutilize total resources more effectively.
U.S. assistance to these 30 countries, combined with other externalsources, can make the difference between sustained increases in percapita income and economic stagnation. It is reasonable to hopethat, over the next decade, as many as half of these countries willhave reached a stage of self-sustaining growth in which they can meet
PERSPECTIVES AND POLICIES
their needs for foreign capital through private foreign investment,loans from international institutions, and other similar sources.(b) Substantial programs to promote security and development
In a small number of critical countries, it is necessary for theUnited States to help establish external and internal security beforeturning to long-term economic and social development. Some ofthese countries border on the Communist world and, in these, economicaid may be limited in comparison to the military assistance beinggiven. Such military aid provides support to friendly countries forthe maintenance or restoration of their internal security and self-defense.
The general objectives of aid in these circumstances are to movefrom stabilization programs to setting the stage for economic andsocial progress. A mixture of military aid and supporting assistanceis usually provided in the early stages of this sequence, with a gradualshift to development assistance and an increasing proportion of loansas economic conditions improve.
Looking over the past decade, one can observe three phases throughwhich a number of countries have moved in recovering from politicalor military upheavals with external help. In the first phase, externalsecurity and a minimum of internal law and order are established.In the second, political and economic instutions are strengthened andthe economy is stabilized. In the third, economic growth is resumedand dependence on extraordinary grant assistance is steadily reducedand then eliminated.
Some countries, such as Greece and Taiwan, have moved to thelast of these phases in a period of 8 to 10 years. Others seem likelyto complete the cycle in even less time; but some may take longer.U.S. aid strategy in all these countries is to help them to mobilizetheir domestic resources and to steadily reduce their reliance upon anyform of external support through development of their economicstrength.(c) Limited aid programs
In more than half of the countries receiving economic aid, U.S.objectives are considerably more limited in nature, and involve cor-respondingly limited commitments and expenditures. Planned U.S.aid to these countries in fiscal year 1964 amounts to less than 12 per-cent of total economic aid funds.
Many of these programs are in African countries which rely pri-marily on Western European assistance to speed their development.In these countries modest U.S. assistance is designed to demonstrateinterest in and support for the country's efforts without assumingsubstantial commitments. In some cases this marginal assistancemay make it politically possible for recipient governments to continueto rely primarily on Western European assistance, by heading off thecharge of total dependence on the former metropole. U.S. assistancein these countries is almost entirely technical assistance, but occa-sional development loans may be made for selected projects whichare economically sound and will contribute substantially to growth.
Some countries receiving limited aid from the United States aredependent on the Communist bloc for substantial amounts of assist-ance. If alternative sources of aid are lacking, the long-term Com-
65
66 PERSPECTIVES AND POLICIES
munist objective of achieving increased influence in key economic andpolitical sectors in these countries may be furthered. Although theUnited States does not seek to outbid Communist offers, it is in ourinterest to prevent excessive dependence on bloc assistance in stra-tegic countries.
In these and other limited assistance efforts, the choice of aidactivities represents a compromise between the requirements of thespecific objective and the general aim of providing aid in as useful andefficient a way as possible.
2. THE AMOUNT OF U.S. ECONOMIC ASSISTANCE TO DEVELOPING
COUNTRIES
The appropriate level of U.S. foreign economic assistance may beapproached in three ways:
(a) In the international context, as a fair share of the totali amount of assistance provided from all sources to all developing
countries;>': (b) In the domestic budgeting context, balancing the benefits
of the program for the United States against its costs and thealternative uses to which aid funds might be put; and
(c) In terms of the appropriate level of U.S. aid programs inparticular countries which taken together comprise the total U.S.program.
(a) The U.S. share of worldwide economic assistanceIn the international context, the United States has a major interest
in assuring a flow of resources from all donors to the developingcountries adequate to meet their requirements. We are willing tocarry a fair share of the total burden, but are concerned to avoid anundue share.
Total capital receipts by developing countries from all sources in1960 were approximately $7.6 billion, and in 1961 reached roughly$8.8 billion.' Fully comparable figures for 1962 are not available, butdisbursements by DAC members remained at about the same levelas in 1961.
By what standards can we judge whether this flow is adequate tomeet the requirements of the developing countries? Several standardshave been proposed, but none is very satisfactory. One approach isto estimate the total external assistance required by all less developedcountries in order to raise their rates of growth of per capita income tosome specified level. Having thus determined the "requirements"for external assistance, the burden of providing this assistance couldbe divided among the developed countries on the basis of their nationalincome or some similar formula. This approach has several defects.It assumes that all developing countries are capable of achieving thesame rate of growth. It ignores the differential abilities of the develop-ing countries to utilize external assistance efficiently. Furthermore,it would require general acceptance by the developed countries to beeffective. A modified version of this proposed standard would bebased on an estimate of the total external assistance which could beeffectively absorbed by all of the developing countries, given their
I Includes net bilateral disbursements, public and private, from the OECD countries, Japan, Australia,New Zealand, and the Sino-Soviet bloc and from multilateral agencies. Source: "The Flow of FinancialResources to Developing Countrics in 1961," OECD.
PERSPECTIVES AND POLICIES
present limits of administrative and technical personnel, institutionalorganization, and development policies. This criterion is in fact usedby AID in determining the level of aid for countries where our aid issubstantial relative to their resources. However, the criterion yieldsno automatic formula: there are both conceptual and technical prob-lems in applying it. Even if there were some simple measure of the"efficiency" with which assistance is used, a judgment would still beneeded as to what level of efficiencv should be regarded as adequate.Moreover, the amount of aid which a country can utilize effectively isnot fixed. One of the most important functions of external assistanceis to increase the developing countries' ability to use their own andothers' resources effectively bv training administrative and technicalpersonnel, helping to strengthen institutional organization, and induc-ing improved development policies.
As an alternative approach, it has been suggested that all developedcountries should devote up to 1 percent of their gross national productto foreign assistance. This is obviously an arbitrary criterion bearingno direct relation to the needs of the developing countries, and is morerelevant as a burden-sharing formula than as a standard for the totalflow of aid.
In both 1960 and 1961, U.S. disbursements of public and privategrants and loans were roughly half of the total resources made avail-able to developing countries. In terms of aid as a proportion of thedonor's national income, however, the United States ranked behindFrance and Portugal in 1961. U.S. aid terms are more favorablethan those offered by many donors, but even if all the various formsin which different donors make aid available are reduced to their grantequivalents,2 France was still contributing a much higher proportionof GNP than was the United States. To the extent that the pro-portion of the donor's GNP taken by aid is a valid index of the aidburden, the United States carries a heavier-than-average share ofthe burden but is not dramatically "out of line."
(b) The amount of U.S. economic assistance as a domestic budgetingproblem
Moving from the international burden sharing context to thedomestic context of allocating U.S. resources among alternative uses,determining the appropriate level of U.S. foreign assistance becomesan aspect of the general governmental budget formulation processwhich is conducted jointly by the executive branch and the Congress.The benefits to be derived for the United States from spending oneadditional dollar on foreign assistance must be weighed against theother uses, public and private, to which that dollar might be put.
(i) Benefits.-It is impossible to measure with precision the benefitsof U.S. development assistance, in terms of the goals stated earlierin this essay. However, it is possible to survey the records of thecountries to which the United States has given substantial assistanceover several years, and judge whethler progress has been substantial,moderate, or absent.
2 This can be done by subtracting the discounted present value of loans from their nominal total value.Different discount rates of course yield different grant equivalents. Statement in text based on a studyby John Pincus, Rand Corp., using discount rates of 5.75 percent, the international lending rate, and 7percent, the marginal DAC lending rate.
67
68 PERSPECTIVES AND POLICIES
The 10 developing countries which have received the largestamounts of U.S. assistance since World War II are Korea, China,the Philippines, Vietnam, India, Pakistan, Israel, Turkey, Greece, andBrazil. On a per capita basis, American aid has been relatively smallin India, Pakistan, and Brazil.
Together these 10 countries have accounted for about 60 percentof total economic and 70 percent of total military assistance to allcountries outside Western Europe and Japan.
Three of these countries-Taiwan, Israel, and Greece-haveachieved exceptionally high rates of economic growth over the pastdecade, despite serious international threats and the need to maintainlarge armed forces.
The average annual increase in real gross national product from1950 through 1961 was 6 percent for Greece, 7.5 percent for Taiwan,and 10 percent for Israel. These countries are now on the road tocontinuing economic progress with a diminishing need for externaleconomic aid. Assistance programs will be terminated in the nextfew years.
The Philippines and Brazil have had satisfactory growth rates-about 5 to 6 percent annually. Growth has been less satisfactory inTurkey, particularly in the latter part of the decade. None of thesecountries has yet approached the rate of progress their natural andhuman resources would seem to permit. Recent changes in govern-mental and economic policy in all three countries provide grounds forhope they will develop more effectively in the current decade andhave less need for external assistance.
Considering the base from which they started 10 years ago, bothIndia and Pakistan have made very substantial progress.
A larger supply of skilled and professional manpower and a morestable government made it possible for India to undertake seriousdevelopment efforts at an earlier date than Pakistan, and India'sannual rate of growth-4 percent-between 1950 and 1961 was appre-ciably higher than that of Pakistan. Since 1959, however, the rateof economic growth in Pakistan has apparently exceeded that in India.
Both countries have invested heavily in basic utilities-trans-portation, power, and irrigation-which should contribute to higherrates of growth in the coming decade.
The two remaining countries which have received large-scaleassistance from the United States are Korea and Vietnam. The3-year war in Korea and current fighting in Vietnam have requiredlarge-scale military aid and commodity shipments to prevent economicco apse.
Korea has largely recovered from the war and is laying foundationsfor future development, but the need to maintain large defense forcescontinues to drain its economy. In Vietnam, economic developmentwas impressive during the peaceful 5 years between 1954 and 1959,but it is currently arrested and V.S. assistance is focused on restoringinternal security.
Although U.S. aid was only one of the many factors affecting theoutcome in these countries, it contributed a substantial part of thefunds available for gross investment and, in most cases, a much largershare of foreign capital available for financing needed developmentimports. Sample figures are shown in the following table.
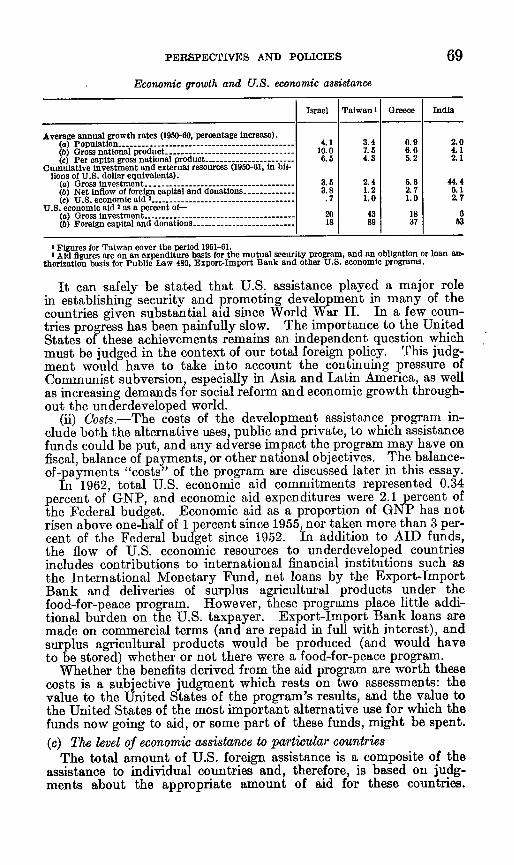
PERSPECTIVES AND POLICIES 69
Economic growth and U.S. economic assistance
Israel Taiwan ' Greece India
Averge annual growth rates (1950-60, percentage increase).(a) Population- 4.1 3.4 0.9 2.0(b) Gross national product -10.0 7.5 6.0 4.1(c) Per capita gross national product 6 6 4.3 5.2 2.1
Cumulative investment and external resources (1950-61, in bi4-lions of U.S. dollar equivalents).
(a) Gross investment -3.5 2.4 5.6 44.4(b) Net inflow of foreign capital and donations -3.8 1.2 2.7 5.1(c) U.S. economic aid 2 -. 7 1.0 1.0 2. 7
U.S. economic aid 2 as a percent of-(a) Gross investment -20 43 18 6b) Foreign capital and donations -18 89 37 53
' Figures for Taiwan cover the period 1951-61.' Aid figures are on an expenditure basis for the mutual security program, and an obligation or loan an.
tborization basis for Public Law 480, Export-Import Bank and other U.S. economic programs.
It can safely be stated that U.S. assistance played a major rolein establishing security and promoting development in many of thecountries given substantial aid since World War II. In a few coun-tries progress has been painfully slow. The importance to the UnitedStates of these achievements remains an independent question whichmust be judged in the context of our total foreign policy. This judg-ment would have to take into account the continuing pressure ofCommunist subversion, especially in Asia and Latin America, as wellas increasing demands for social reform and economic growth through-out the underdeveloped world.
(ii) Costs.-The costs of the development assistance program in-clude both the alternative uses, public and private, to which assistancefunds could be put, and any adverse impact the program may have onfiscal, balance of payments, or other national objectives. The balance-of-payments "costs" of the program are discussed later in this essay.
In 1962, total U.S. economic aid commitments represented 0.34percent of GNP, and economic aid expenditures were 2.1 percent ofthe Federal budget. Economic aid as a proportion of GNP has notrisen above one-half of 1 percent since 1955, nor taken more than 3 per-cent of the Federal budget since 1952. In addition to AID funds,the flow of U.S. economic resources to underdeveloped countriesincludes contributions to international financial institutions such asthe International Monetary Fund, net loans by the Export-ImportBank and deliveries of surplus agricultural products under thefood-for-peace program. However, these programs place little addi-tional burden on the U.S. taxpayer. Export-Import Bank loans aremade on commercial terms (and are repaid in full with interest), andsurplus agricultural products would be produced (and would haveto be stored) whether or not there were a food-for-peace program.
Whether the benefits derived from the aid program are worth thesecosts is a subjective judgment which rests on two assessments: thevalue to the United States of the program's results, and the value tothe United States of the most important alternative use for which thefunds now going to aid, or some part of these funds, might be spent.
(c) The level of economic assistance to particular countriesThe total amount of U.S. foreign assistance is a composite of the
assistance to individual countries and, therefore, is based on judg-ments about the appropriate amount of aid for these countries.
PERSPECTIVES AND POLICIES
Three basic principles determine the countries to which the UnitedStates offers development aid and the amounts and kinds of aid whichthey receive:
(i) The effectiveness with which the country can use availableresources-both internal and external-to promote economic andsocial development;
(ii) The importance to the United States of sustaining oraccelerating the economic growth of the country;
(iii) The availability to the country of other external resourcesin a suitable form.
(i) Ability to utilize assistance.-A country's ability to utilize exter-nal assistance not only reflects the determination with which itsgovernment and people seek to progress, but also the current stage ofdevelopment of its human and institutional resources. Aid tocountries in early stages of development normally must concentrateon technical assistance to train personnel and develop administrativeservices, educational institutions, savings, credit and trade associa-tions, and other institutions needed to support growth. Assistanceof this kind is complex and difficult, but it does not require heavyexpenditures. Such aid is aften accompanied by some capital assist-ance projects, directed to building roads, ports, power, and otherinfrastructure. Greater capital assistance will be required as thecountry's ability to undertake more varied productive capital projectsgrows. Meanwhile, the need for technical assistance is likely tocontinue, but its emphasis will probably shift from more generaltraining and institution building activities to more specific bottleneck-breaking efforts. Later, the expanding economy should graduallygenerate greater domestic savings and investment and attract growingprivate foreign investment and increased support from sources suchas the World Bank. In this way the need for foreign grants orloans on concessional terms will be progressively reduced.
The normal pattern of aid to a developing country-whethersupplied primarily by the United States or by another donor ordonors-therefore may require that the volumne of aid increase beforeit is giradually phased out. The length of time required to completethe pat-.ern will depend on the country's initial stage of developmentand on the vigor of its own efforts. Some countries may also berelatively advanced when aid is started and may not need the firststages of the sequence. Under the Marshall plan in Europe, theEuropeans organized their own skills and energies to the task ofrebuilding their war-devastated economies. The United States pro-vided the crucial margin of resources which enabled the countries ofEurope to overcome the need for outside economic aid within 5 years-from 1948 to 1953. In the less developed economies, the capacity toutilize outside help effectively is understandably much less than itwas in Europe, and the period required to achieve self-supportinggrowth is likely to be substantially longer. Countries such as Israel,Greece, and Taiwan have achieved rapid development and increasingself-reliance over a period of 10 to 15 years. A similar period shouldbe sufficient in many Latin American countries, but in many of thepoorer countries of Asia and Africa the timetable will be considerablylonger.
(ii) Importance to the United States.-In allocating developmentassistance, the importance to the United States of sustaining or
70
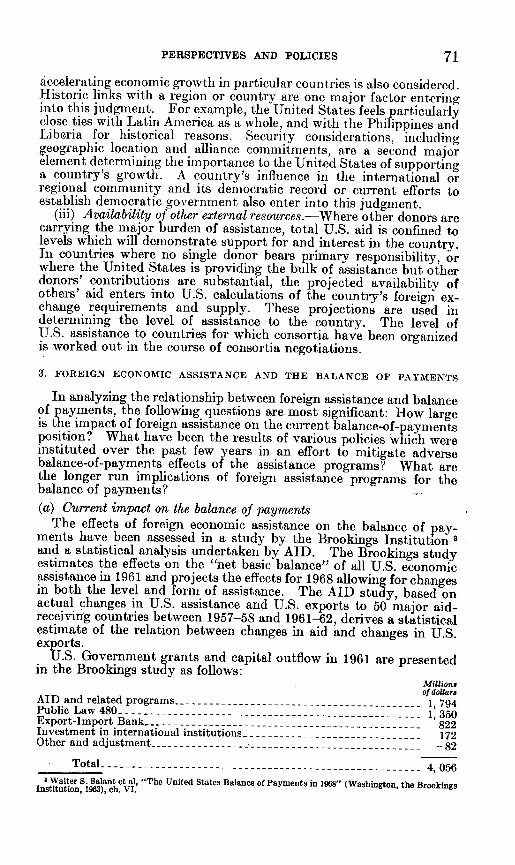
PERSPECTIVES AND POLICIES 71
accelerating economic growth in particular countries is also considered.Historic links with a region or country are one major factor enteringinto this judgment. For example, the United States feels particularlyclose ties with Latin America as a whole, and with the Philippines andLiberia for historical reasons. Security considerations, includinggeographic location and alliance commitments, are a second majorelement determining the importance to the United States of supportinga country's growth. A country's influence in the international orregional community and its democratic record or current efforts toestablish democratic government also enter into this judgment.
(iii) Availability of other external resources.-Where other donors arecarrying the major burden of assistance, total U.S. aid is confined tolevels which will demonstrate support for and interest in the country.In countries where no single donor bears primary responsibility, orwhere the United States is providing the bulk of assistance but otherdonors' contributions are substantial, the projected availability ofothers' aid enters into U.S. calculations of the country's foreign ex-change requirements and supply. These projections are used indetermining the level of assistance to the country. The level ofU.S. assistance to countries for which consortia have been organizedis worked out in the course of consortia negotiations.
3. FOREIGN ECONOMIC ASSISTANCE AND THE BALANCE OF PAYMENTS
In analyzing the relationship between foreign assistance and balanceof payments, the following questions are most significant: 1low largeis the impact of foreign assistance on the current balance-of-paymentsposition? What have been the results of various policies which wereinstituted over the past few years in an effort to mitigate adversebalance-of-payments effects of the assistance programs? What arethe longer run implications of foreign assistance programs for thebalance of payments?(a) Current impact on the balance of payments
The effects of foreign economic assistance on the balance of pay-ments have been assessed in a study by the Brookings Institution Iand a statistical analysis undertaken by AID. The Brookings studyestimates the effects on the "net basic balance" of all U.S. economicassistance in 1961 and projects the effects for 1968 allowing for changesin both the level and form of assistance. The AID study, based onactual changes in U.S. assistance and U.S. exports to 50 major aid-receivinlg countries between 1957-58 and 1961-62, derives a statisticalestimate of the relation between changes in aid and changes in U.S.exports.
U.S. Government grants and capital outflow in 1961 are presentedin the Brookings study as follows:
Millionsof dollars
AID and related programs -1,794Public Law 480 _--------------------------------------__1,350Export-Import Bank -822Investment in international institutions -172Other and adjustment- -82
Total -4, 056* Walter S. Salant et al, "The United States Balance of Payments in I96S" (Washington, the BrookingsInstitution, i963), ch. VI.
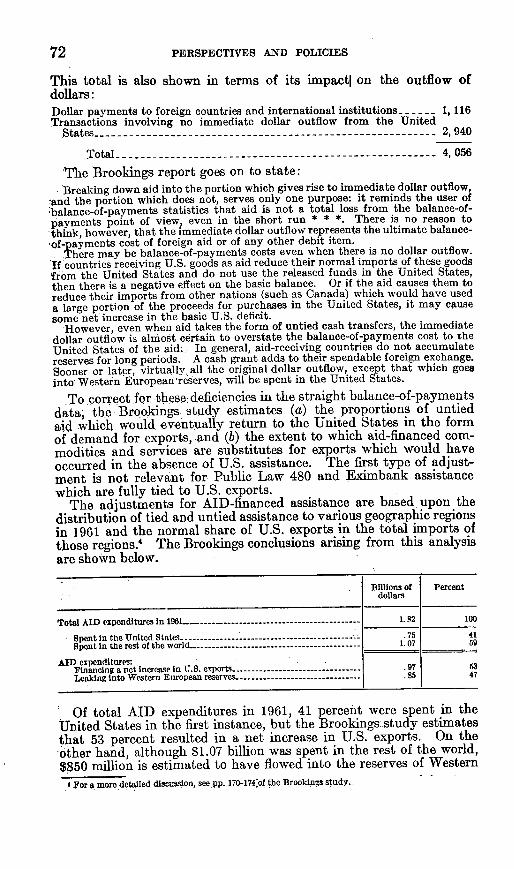
72 PERSPECTIVES AND POLICIES
This total is also shown in terms of its impact on the outflow ofdollars:Dollar payments to foreign countries and international institutions - , 116Transactions involving no immediate dollar outflow from the United
States - 2, 940
Total -4, 056
The Brookings report goes on to state:Breaking down aid into the portion which gives rise to immediate dollar outflow,
-and the portion which does not, serves only one purpose: it reminds the user of~balance-of-payments statistics that aid is not a total loss from the balance-of-payments point of view, even in the short run * * *. There is no reason tothink, however, that the immediate dollar outflow represents the ultimate balance--of-payments cost of foreign aid or of any other debit item.
There may be balance-of-payments costs even when there is no dollar outflow.If countries receiving U.S. goods as aid reduce their normal imports of these goodsifrom the United States and do not use the released funds in the United States,then there is a negative effect on the basic balance. Or if the aid causes them toreduce their imports from other nations (such as Canada) which would have useda large portion of the proceeds for purchases in the United States, it may causesome net increase in the basic U.S. deficit.
However, even when aid takes the form of untied cash transfers, the immediatedollar outflow is almost certain to overstate the balance-of-payments cost to theUnited States of the aid. In general, aid-receiving countries do not accumulatereserves for long periods. A cash grant adds to their spendable foreign exchange.Sooner or later, virtually all the original dollar outflow, except that which goesinto Western European'reserves, will be spent in the United States.
. To correct for these: deficiencies in the straight balance-of-paymentsdata, the Brookings study estimates (a) the proportions of untiedaid which would eventually return to the United States in the formof demand for exports, and (b) the extent to which aid-financed com-modities and services are substitutes for exports which would haveoccurred in the absence of U.S. assistance. The first type of adjust-ment is not relevant for Public Law 480 and Eximbank assistancewhich are fully tied to U.S. exports.
The adjustments for AID-financed assistance are based upon thedistribution of tied and untied assistance to various geographic regionsin 1961 and the normal share of U.S. exports in the total imports ofthose regions.4 The Brookings conclusions arising from this analysisare shown below.
Billions of Percentdollars
Total AID expenditures In 1961- _- 1.52 100
Spent in the United States -- .75 41Spont in the rest of the world-1.07 59
AID expenditures:Financing a net increase In 1T.S. exports - 97 53
Leaking into Western European reserves .-- -5- 47
Of total AID expenditures in 1961, 41 percent were spent in theUnited States in the first instance, but the Brookings study estimatesthat 53 percent resulted in a net increase in U.S. exports. On theother hand, although $1.07 billion was spent in the rest of the world,$850 million is estimated to have flowed into the reserves of Western
' For a more detailed discussion, see pp. 170-174.of the Brookings study.
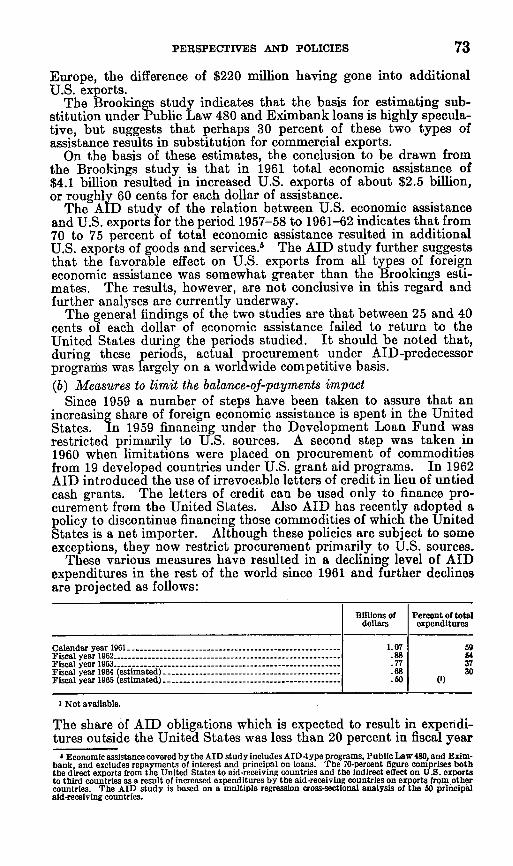
PERSPECTIVES AND POLICIES 73
Europe, the difference of $220 million having gone into additionalU.S. exports.
The Brookings study indicates that the basis for estimating sub-stitution under Public Law 480 and Eximbank loans is highly specula-tive, but suggests that perhaps 30 percent of these two types ofassistance results in substitution for commercial exports.
On the basis of these estimates, the conclusion to be drawn fromthe Brookings study is that in 1961 total economic assistance of$4.1 billion resulted in increased U.S. exports of about $2.5 billion,or roughly 60 cents for each dollar of assistance.
The AID study of the relation between U.S. economic assistanceand U.S. exports for the period 1957-58 to 1961-62 indicates that from70 to 75 percent of total economic assistance resulted in additionalU.S. exports of goods and services., The AID study further suggeststhat the favorable effect on U.S. exports from all types of foreigneconomic assistance was somewhat greater than the Brookings esti-mates. The results, however, are not conclusive in this regard andfurther analyses are currently underway.
The general findings of the two studies are that between 25 and 40cents of each dollar of economic assistance failed to return to theUnited States during the periods studied. It should be noted that,during these periods, actual procurement under AID-predecessorprograms was largely on a worldwide competitive basis.(b) Measures to limit the balance-of-payments impact
Since 1959 a number of steps have been taken to assure that anincreasing share of foreign economic assistance is spent in the UnitedStates. In 1959 financing under the Development Loan Fund wasrestricted primarily to U.S. sources. A second step was taken in1960 when limitations were placed on procurement of commoditiesfrom 19 developed countries under U.S. grant aid programs. In 1962AID introduced the use of irrevocable letters of credit in lieu of untiedcash grants. The letters of credit can be used only to finance pro-curement from the United States. Also AID has recently adopted apolicy to discontinue financing those commodities of which the UnitedStates is a net importer. Although these policies are subject to someexceptions, they now restrict procurement primarily to U.S. sources.
These various measures have resulted in a declining level of AIDexpenditures in the rest of the world since 1961 and further declinesare projected as follows:
Billions of Percent of totaldollars expenditures
calendar year 1961 - 1.07 69Fiscal year 1962- .88 84Fiscal year 1963 -. 77 37Fiscal year 1964 (estimated) -. 68 30Fiscal year 1965 (estimated) -_.60 (-)
I Not available.
The share of AID obligations which is expected to result in expendi-tures outside the United States was less than 20 percent in fiscal year
I Economic assistance covered bythe AID study includes AID-type programs, Public Law 480, and Exim-bank, and excludes repayments of interest and principal on loans. The 70-percent figure comprises boththe direct exports from the United States to aid-receiving countries and the indirect efect on U.S. exportsto third countries as a result of increased expenditures by the aid-receiving countries on exports frQm,othbrcountries. The AID study is based on a multiple regression cross-sectional analysis of the 50 principalaid-receiving countries.
PERSPECTIVES AND POLICIES
1963 and is estimated at 17 percent in fiscal year 1964. As theseobligations are expended in subsequent years, the result will be furtherreductions in the share of non-U.S. expenditures.
The Brookings study estimated that, given the procurement policiesat the time of the study 6 and the use of irrevocable letters of credit,the effect would be to raise the share of AID expenditure which wouldreturn directly or indirectly to the United States to 70 percent.
AID estimates are that by raising the share of its expenditureswhich result in direct U.S. procurement to 80 to 83 percent, the neteffect on exports will be of about the same magnitude. Thus AIDestimates of the program's adverse balance-of-payments effect areslightly more optimistic than those of the Brookings group. Aspointed out in the Brookings study, "the higher the proportion ofAID expenditures that are tied to U.S. procurement, the greater therecipient country's incentive to use AID funds to finance normalimports from the United States." It is largely a matter of judgmentand speculation as to the point at which this substitution effect willoffset the gains from increased tying of U.S. assistance.
(c) Longrun effects on the balance of paymentsIn addition to its shortrun costs, foreign economic assistance has
longer run implications for the U.S. balance of payments. Theselonger run effects are both positive and negative and no reliable judg-ment can be reached as to what the net effect on the United Stateswill be.
The positive longrun payments effects of economic assistance derivemainly from the contribution such assistance makes to the growth inincome of the recipient countries. This income growth wil[ result inincreased demand for imports, part of which will come from theUnited States. Other positive effects should result from increasedawareness of U.S. products as a consequence of having obtained suchproducts through the economic assistance program. Also someaspects of the Public Law 480 programs are specifically intended todevelop commercial markets for U.S. agricultural commodities.
The return flow of payments under foreign assistance loans willproduce a direct benefit for the U.S. balance of payments. At thesame time these payments will result in some offsetting loss in U.S.exports because of the reduced importing capacities of the countriesmaking repayment.
Negative effects on the U.S. balance of payments in future yearscan be expected from the increased efficiency of production in thecountries now receiving U.S. assistance. More efficient productionof import substitutes and potential exports will result in increasedcompetition for American producers both in world markets andwithin the United States.
It is important to remember, however, that the economic growthand the increase in efficiency of production which do occur in countriesreceiving assistance will depend on many factors other than theamount of assistance which the United States provides. The relativerates of growth of the United States vis-a-vis other countries, changesin technology and tastes in the United States and the rest of the world,internal monetary and fiscal policies-these are the critical elementswhich will dominate the evolution of the U.S. balance of paymentsover the coming years.
I The policy of not financing those commodities of which the United States is a net Importer had notyet gone Into effect when the Brookings study was completed.
74
PART III
DEFENSE PROGRAMS AND THE BALANCE OF
PAYMENTS
By theDepartment of Defense
24-974-63-6
TABLE OF CONTENTS
Part Pag.I. Introduction - _---- _-------- 77
II. U.S. defense budgets and manpower - 80Table I-Federal Government expenditures and GNP com-
parisons with national defense programs and military func-tions expenditures, fiscal years 1939-64 - 81
Table II-Total active duty military personnel, 1939-63, andpercentage of U.S. population in active military service 81
III. Deployment abroad -_--_-------- _----_ 82TV. The European defense effort - 84
Table III-Comparative defense efforts, NATO nations - 85V. Recent developments in U.S. defense programs - 85
Table IV-Financial summary, military programs -_- _-__ 89VI. The military assistance program -_- _-_-_- __- _ 89
Table V-Distribution of military assistance programs (grantaid), fiscal years 1950-64 - _- ------ _- _ 91
Table VI-Grant aid program-Chargeable to appropriations,deliveries by fiscal years 1952-63 - _-__ - __ 92
Table VII-NATO defense expenditures and U.S. militaryassistance, calendar years 1950-60 -_- _- __- _-_- _ 94
Table VIII-Major U.S. national security expenditures inrelation to MAP, fiscal years 1953-64 -__-_- _- ___ 94
VII. National defense expenditures and the balance-of-payments prob-lem ---------- ---------- ---------- ---------- --------- 94
Table IX-U.S. defense expenditures and receipts entering theinternational balance of payments, fiscal year 1963 - 100
Table X-U.S. defense expenditures and receipts enteringinternational balance of payments in Western EuropeanNATO countries, and elsewhere, fiscal year 1963_---------- 100
VIII. Conclusion- - _----_---------- __-- __-- ___-- ______________ 10176
DEFENSE PROGRAMS AND THE BALANCE OF PAYMENTS
DEPARTMENT OF DEFENSE
PART I
INTRODUCTION
The relationship between our national defense and our nationalbalance of payments can best be understood by looking first at thebroad context in which today's military needs have arisen. It seemsparadoxical that the United States-which has sought to avoidentanglement in foreign political and power struggles during the bulkof its history as an independent nation-today provides the core of thecollective military, economic, and political strength of the entirenon-Communist world. We have political and security interests,allies, and military forces spread widely over the non-Communistworld. The shift of American interests and commitments from theperiphery to the center of the world scene has carried with it a con-comitant increase in the size and overseas deployment of the ArmedForces necessary to provide for the common defense and support theforeign policy of the United States. As a result, U.S. defense expendi-tures accounted for over half of the national budget, almost 10 percentof the gross national product, and a net adverse impact on U.S.balance of payments of nearly $1,700 million in fiscal year 1963.
In the days when our military needs could be met with a stoutdefense on the seas and a citizens' army, we lived in a world systemcompatible with our primary national interests. It was based on thenation-state and presided over by British power. The 20th centuryhas seen the old order disintegrate under the impact of two WorldWars the rise of communism supported by a significant power base inboth )urope and Asia, the end of the colonial era leading to the crea-tion of a multitude of weak but strident and nationalistic new nations,and rapid technological change-particularly the development ofnuclear weapons. During the same period, the United States and theSoviet Union began to emerge as the two leading powers. Onemajor long-term implication of these events was that U.S. nationalinterests would require us to accept and discharge the broad responsi-bilities of a world power. A second major implication was that themost pressing of our international interests has become the re-creationof a relatively stable world environment-a new equilibrium to replacethe one destroyed by the events of the four decades following WorldWar I.
Our conception of the desired world order has been defined byPresident Kennedy as a peaceful world community of free and inde-pendent states, each free to choose its own future and its own systemas long as it does not threaten the freedom of others. This would bean environment conducive to our own best national interests and alsocoincident with the aspirations of every non-Communist country,
77
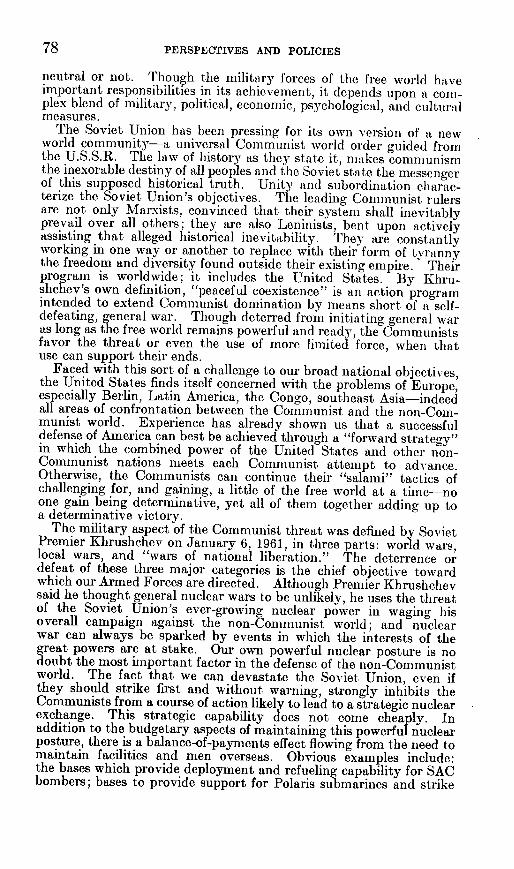
PERSPECTIVES AND POLICIES
neutral or not. Though the military forces of the free world haveimportant responsibilities in its achievement, it depends upon a com-plex blend of military, political, economic, psychological, and culturalmeasures.
The Soviet Union has been pressing for its own version of a newworld community-a universal Communist world order guided fromthe U.S.S.R. The law of history as they state it, makes communismthe inexorable destiny of all peoples and the Soviet state the messengerof this supposed historical truth. Unity and subordination charac-terize the Soviet Union's objectives. The leading Communist rulersare not only Marxists, convinced that their system shall inevitablyprevail over all others; they are also Leninists, bent upon activelyassisting that alleged historical inevitability. They are constantlyworking in one way or another to replace with their form of tyrannythe freedom and diversity found outside their existing empire. Theirprogram is worldwide; it includes the United States. By Khru-shchev's own definition, "peaceful coexistence" is an action programintended to extend Communist domination by means short of a self-defeating, general war. Though deterred from initiating general waras long as the free world remains powerful and ready, the Communistsfavor the threat or even the use of more limited force, when thatuse can support their ends.
Faced with this sort of a challenge to our broad national objectives,the United States finds itself concerned with the problems of Europe,especially Berlin, Latin America, the Congo, southeast Asia-indeedall areas of confrontation between the Communist and the non-Com-munist world. Experience has already shown us that a successfuldefense of America can best be achieved through a "forward strategy"in which the combined power of the United States and other non-Communist nations meets each Communist attempt to advance.Otherwise, the Communists can continue their "salami" tactics ofchallenging for, and gaining, a little of the free world at a time-noone gain being determinative, yet all of them together adding up toa determinative victory.
The military aspect of the Communist threat was defined by SovietPremier Khrushchev on January 6, 1961, in three parts: world wars,local wars, and "wars of national liberation." The deterrence ordefeat of these three major categories is the chief objective towardwhich our Armed Forces are directed. Although Premier Khrushchevsaid he thought general nuclear wars to be unlikely, he uses the threatof the Soviet Union's ever-growing nuclear power in waging hisoverall campaign against the non-Communist world; and nuclearwar can always be sparked by events in which the interests of thegreat powers are at stake. Our own powerful nuclear posture is nodoubt the most important factor in the defense of the non-Communistworld. The fact that we can devastate the Soviet Union, even ifthey should strike first and without warning, strongly inhibits theCommunists from a course of action likely to lead to a strategic nuclearexchange. This strategic capability does not come cheaply. Inaddition to the budgetary aspects of maintaining this powerful nuclearposture, there is a balance-of-payments effect flowing from the need tomaintain facilities and men overseas. Obvious examples include:the bases which provide deployment and refueling capability for SACbombers; bases to provide support for Polaris submarines and strike
78
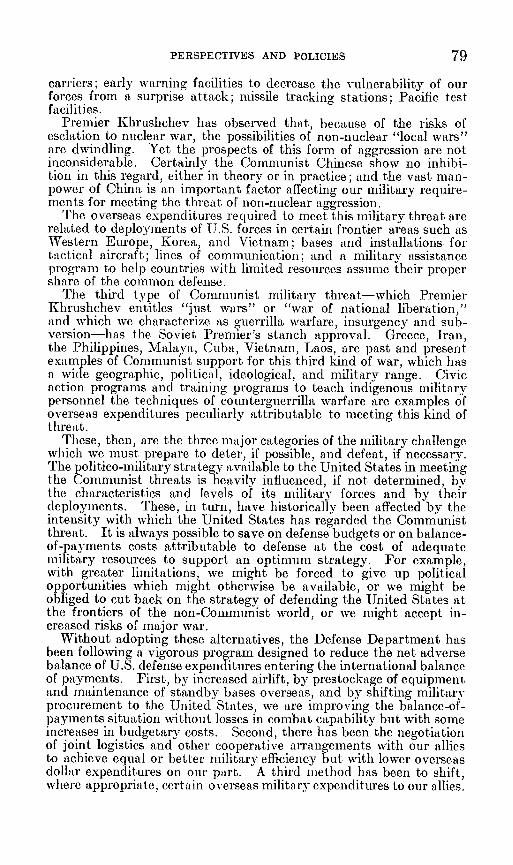
PERSPECTIVES AND POLICIES
carriers; early warning facilities to decrease the vulnerability of ourforces from a surprise attack; missile tracking stations; Pacific testfacilities.
Premier Khrushchev has observed that, because of the risks ofesclation to nuclear war, the possibilities of non-nuclear "local wars"are dwindling. Yet the prospects of this form of aggression are notinconsiderable. Certainly the Communist Chinese show no inhibi-tion in this regard, either in theory or in practice; and the vast man-power of China is an important factor affecting our military require-ments for meeting the threat of non-nuclear aggression.
The overseas expenditures required to meet this military threat arerelated to deployments of U.S. forces in certain frontier areas such asWestern Europe, Korea, and Vietnam; bases and installations fortactical aircraft; lines of communication; and a military assistanceprogram to help countries with limited resources assume their propershare of the common defense.
The third type of Communist military threat-which PremierKhrushchev entitles "just wars" or "war of national liberation,"and which we characterize as guerrilla warfare, insurgency and sub-version-has the Soviet Premier's stanch approval. Greece, Iran,the Philippines, Malaya, Cuba, Vietnam, Laos, are past and presentexamples of Communist support for this third kind of war, which hasa wide geographic, political, ideological, and military range. Civicaction programs and training programs to teach indigenous militarypersonnel the techniques of counterguerrilla warfare are examples ofoverseas expenditures peculiarly attributable to meeting this kind ofthreat.
These, then, are the three major categories of the military challengewhich we must prepare to deter, if possible, and defeat, if necessary.The politico-military strategy available to the United States in meetingthe Communist threats is heavily influenced, if not determined, bythe characteristics and levels of its militarv forces and by theirdeployments. These, in turn, have historically been affected by theintensity with which the United States has regarded the Communistthreat. It is always possible to save on defense budgets or on balance-of-payments costs attributable to defense at the cost of adequatemilitary resources to support an optimum strategy. For example,with greater limitations, we might be forced to give up politicalopportunities which might otherwise be available, or we might beobliged to cut back on the strategy of defending the United States atthe frontiers of the non-Communist world, or we might accept in-creased risks of major war.
Without adopting these alternatives, the Defense Department hasbeen following a vigorous program designed to reduce the net adversebalance of U.S. defense expenditures entering the international balanceof payments. First, by increased airlift, by prestockage of equipment.and maintenance of standby bases overseas, and by shifting militaryprocurement to the United States, we are improving the balance-of-payments situation without losses in combat capability but with someincreases in budgetary costs. Second, there has been the negotiationof joint logistics and other cooperative arrangements with our alliesto achieve equal or better military efficiency but with lower overseasdollar expenditures on our part. A third method has been to shift,where appropriate, certain overseas military expenditures to our allies.
79
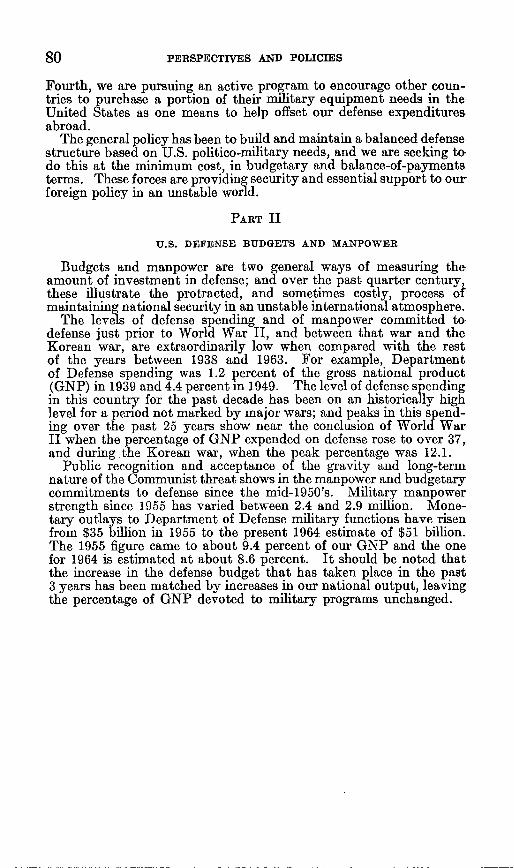
80 PERSPECTIVES AND POLICIES
Fourth, we are pursuing an active program to encourage other coun-tries to purchase a portion of their military equipment needs in theUnited States as one means to help offset our defense expendituresabroad.
The general policy has been to build and maintain a balanced defensestructure based on U.S. politico-military needs, and we are seeking todo this at the minimum cost, in budgetary and balance-of-paymentsterms. These forces are providing security and essential support to our-foreign policy in an unstable world.
PART II
U.S. DEFENSE BUDGETS AND MANPOWER
Budgets and manpower are two general ways of measuring theamount of investment in defense; and over the past quarter century,these illustrate the protracted, and sometimes costly, process ofmaintaining national security in an unstable international atmosphere.
The levels of defense spending and of manpower committed to-defense just prior to World War II, and between that war and theKorean war, are extraordinarily low when compared with the restof the years between 1938 and 1963. For example, Departmentof Defense spending was 1.2 percent of the gross national product(GNP) in 1939 and 4.4 percent in 1949. The level of defense spendingin this country for the past decade has been on an historically highlevel for a period not marked by major wars; and peaks in this spend-ing over the past 25 years show near the conclusion of World WarII when the percentage of GNP expended on defense rose to over 37,and during the Korean war, when the peak percentage was 12.1.
Public recognition and acceptance of the gravity and long-termnature of the Communist threat shows in the manpower and budgetarycommitments to defense since the mid-1950's. Military manpowerstrength since 1955 has varied between 2.4 and 2.9 million. Mone-tary outlays to Department of Defense military functions have risenfrom $35 billion in 1955 to the present 1964 estimate of $51 billion.The 1955 figure came to about 9.4 percent of our GNP and the onefor 1964 is estimated at about 8.6 percent. It should be noted thatthe increase in the defense budget that has taken place in the past3 years has been matched by increases in our national output, leavingthe percentage of GNP devoted to military programs unchanged.
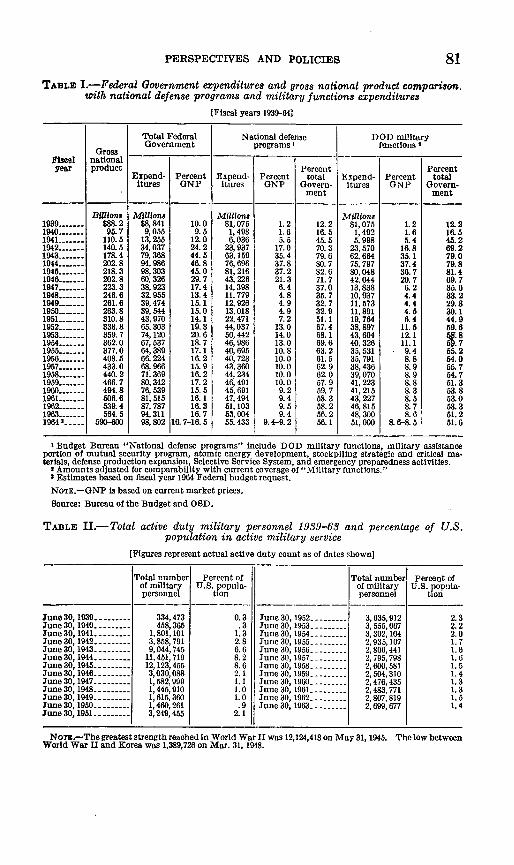
PERSPECTIVES AND POLICIES 81
TABLE I.-Federal Government expenditures and gross national product comparison.with national defense programs and military functions expenditures
[Fiscal years 1939-64]
Total Federal National defense DOD militaryGovernment programs I functions '
G ross __ _ _ _ I _ _ _ _ _ _ _ _ _ _ _ _ _ _ _ _
Fisc9l nationalyear product Percent Percent
Expend- Percent Expend- Percent total Expend- Percent totalitures GNP itures GNP Govern- itures GNP Govern-
.ment ment
Biloens Millions Millions Millions1939 - $88.2 $8,841 10.0 $1, 075 1. 2 12. 2 $1, 075 1.2 12. 21940----- 95.7 9,011 9.15 1,498 1.6 16. 5 1,492 1.6 16.11941 - 110.5 13,255 12.0 6,036 5. 5 45.5 5, 998 5.4 45. 21942 - 140.5 34,037 24.2 23, 937 17.0 70. 3 23,570 16.8 69.21943 - 178.4 79, 368 44. 5 63, 159 35.4 79. 6 62, 664 35. 1 79.01944 - 202.8 94,986 46. 8 76, 696 37.8 80. 7 75, 797 37.4 79.81945 - 218. 3 98,303 45.0 81, 216 37.2 82. 6 80,048 36.7 81.41946 - 202.8 60, 326 29.7 43, 226 21.3 71.7 42,044 20.7 69. 71947 - 223.3 38,923 17.4 14,398 6.4 37.0 13,838 6. 2 35.61948 - 246.6 32, 955 13.4 11, 779 4. 8 35 7 10,937 4.4 33.21949----- 261.6 39,474 11. 1 12,926 4. 9 32.7 11,5173 4.4 29.31910------ 263.8 39, 544 15.0 13,018 4.9 32. 9 11,891 4. 5 30.11951 - 310.8 43,970 14.1 22, 471 7. 2 51. 1 19, 764 6.4 44.91952 - 338.8 65, 303 19.3 44, 037 13.0 67.4 38, 897 11. 5 59.61953 - 359. 7 74,120 20.6 50,442 14.0 68.1 43, 604 12.1 5a81954 - 362.0 67, 537 18. 7 46,986 13.0 69.6 40, 326 11. 1 71955 - 377.0 64, 389 17. 1 40, 695 10.8 63. 2 35, 531 9.4 65. 21956 - 408. 5 66. 224 16. 2 40, 723 10.0 61. 5 35, 791 8.8 54. 01957 - 433.0 68, 966 15. 9 43,360 10.0 62. 9 38,436 8.9 85.71958 - - 440.2 71,369 16. 2 44, 234 10. 0 62.0 39,070 8. 9 54.71959 - 466.7 80, 342 17. 2 46,491 10.0 57. 9 41, 223 8.8 61. 31960 - 494.8 76, 539 15. 5 45, 691 9.2 59.7 41, 215 8.3 53.81961- 506.6 81, 515 16.1 47, 494 9.4 58.3 43, 227 8. 5 53.01962- 539.4 87, 787 16.3 51,103 9. 5 58.2 46, 815 8. 7 53.31963- 564. 5 94, 311 16. 7 63, 004 9.4 56. 2 48, 300 8. 6 51. 21964 - 590-00 98,802 16.7-16. 5 55,433 9.4-9. 2 56.1 51,000 8.6-8. 5 51.6
X Budget Bureau "National defense programs" include DOD military functions, military assistanceportion of mutual security program, atomic energy development, stockpiling strategic and critical ma-terials, defense production expansion, Selective Service System, and emergency preparedness activities.
t Amounts adjusted for comparability with current coverage of "Military functions."3 Estimates based on fiscal year 1964 Federal budget request.
NOTE.-GNP Is based on current market prices.
Source: Bureau of the Budget and OSD.
TABLE II.-Total active duty military personnel 1939-63 and percentage of U.S.population in active military service
[Figures represent actual active duty count as of dates shown]
Total number Percent of Total number Percent ofof military U.. popula- of military U.S. popula-personnel tion personnel tion
June30,1939 -334,473 0.3 June 30, 1952 -3,635,912 2.3June 30, 1940- 458,365 .3 June 30, 1953 -3, 551,067 2.2June 30, 1941 -1,801,101 1.3 June 30, 1954 -3,302,104 2. 0June 30, 1942 -3,858,791 2.8 June 30, 1955 -2,935,107 1.7June 30, 1943 9,044,745 6.6 June 30, 1956 -2, 806, 441 1. 6June 30,1944 - 11,451,719 8. 2 June 30, 1957 -2, 795,798 1.6June 30, 1945 - 12,123,455 8.6 June 30, 1958 -2,600,581 1.5June 30, 1946- 3,030,088 2.1 June 30, 1959- 2, 504,310 1.4June 30, 1947 -1,582,999 1.1 June 30, 1960 -2,476,435 1.3June 30, 1948 -1,445,910 1.0 June 30, 1961 -2,483,771 1.3June 30, 1949 -1,615,360 1.0 June 30, 1962 -2,807,819 1. 5June 30, 1950 -1,460,261 .9 June 30, 1963- 2,699,677 1.4June 30, 1951- 3,249,455 2.1
NoTEL-The greatest strength reached in World War It was 12,124,418 on May 31,1945. The low betweenWorld War II and Korea was 1,389,726 on Mar. 31, 1948.
PERSPECTIVES AND POLICIES
PART III
DEPLOYMENT ABROAD
History shows a correlation between our recognition of the intensityof external threats to our national interests and the number of U.S.military personnel deployed overseas.
In 1938, the American Defense Establishment in uniform amountedto slightly more than 300,000 men and women, most of whom werebased in the United States. In ]ess than 7 years it grew by a factorof nearly 40, to a peak of 12,124,418 on May 31, 1945. This massivecombat force, deployed across the seas and coupled with those ofour Allies, defeated the Axis Powers in the greatest war of history.
Following World War II, these forces were rapidly demobilized toless than 1.4 million men and women by March 31, 1948. In Europeand the Far East, the Armed Forces provided security and adminis-trative services in former enemy territory and in liberated countries,until civil authority could be legally constituted. In June 1946, theArmy and Air Corps in the European theater amounted to 340,000,the vast majority of whom were engaged in occupation duties inGermany and Austria. By midyear 1949, 3 months before theFederal Republic of Germany was established, forces in Germanyhad dropped to 82,000 and less than 10,000 in Austria. In Japan,similar occupation functions were the responsibility of 155,000 Armyand Air Corps troops in June 1946, as well as the 23,000 troops in theRyukyus. Twenty-four thousand marines were deployed in NorthChina during this same period.
At the outbreak of the Korean war in June 1950, Army forces inJapan totaled about 83,000. Total U.S. Army forces in the Far Eastamounted to slightly over 111,000, including those in Korea, thePhilippines, and the Marianas. Part of the 7th Fleet was at Okinawaand the remainder was in the Philippines. The Air Force in thePacific consisted of nine wings, with a strength of about 35,000 officersand men on June 30, 1950, and was the largest U.S. Air Force aggre-gation outside the continental United States.
To meet the Korean attack, it was necessary to draw the occupationforces from Japan and eventually to deploy large forces from thecontinental United States. By September 1950, the four divisionsin Japan had been dispatched to Korea, along with the 1st MarineDivision and the 2d Infantry Division from the United States. Newlyactivated National Guard divisions were deployed to Japan to replaceunits sent to Korea.
By the time of the Korean truce on July 27, 1953, Army forces inthe Far East totaled 373,933, and the Far East Air Force had morethan tripled, with a strength of 105,000 officers and men and a unitcount of 19 wings composed of 69 squadrons. The 3d Marine Divi-sion had been brought to full strength by this time and was deployedin the Far East. An additional division (3d Infantry) and a regi-mental combat team from the 11th Airborne had been deployed toKorea from the United States. The 7th Fleet, with 125 combatantvessels, including 6 aircraft carriers, was deployed in the Far East.
Our military commitments in Europe following World War II arethe outgrowth of deteriorating relations with the Soviet Union.Soviet reluctance after World War II to withdraw from Azerbaijan,
82
PERSPECTIVES AiN'D POLICIES 83
followed by the Greek civil war of 1945, the Communist takeoversin Eastern Europe in the next 3 years and the Berlin blockade of 194Sprovided cumulating proof that resistance to the aggressive purposesof the Communists required a collective military capability. OnApril 4, 1949, 12 nations from Western Europe and North America(later to be joined by 3 others) entered into the North Atlantic Treatyfor their common defense.
The bulk of the American forces in Europe at the time of signatureof the pact were earmarked for NATO purposes. The number ofArmy divisions so designated has remained at five since late 1951.1The U.S. Army combat and supporting forces strengths in Europevaried generally downward from 267,662 on June 30, 1954, to 230,116on June 30, 1961. Deployments from the continental United Statesas a result of the Berlin crisis commencing in late 1961 raised Armystrength in Europe to more than 270,000 by the end of June 1969.The U.S. 6th Fleet, with Marine forces embarked, has been deployedin the Mediterranean since shortly after World War II.
Meanwhile, the number of major ground force units deployed in theFar East underwent a marked decrease following the end of hostilitiesin Korea. The level of U.S. Army divisions in Korea after thearmistice was reduced from seven to two, the present level. Thelast Army combat division was returned from Japan in 1957. OneMarine division and one Marine aircraft wing and an airborne battlegroup remain deployed in the Far East, and an Army division and aMarine brigade are based in Hawaii.
The threat of Communist aggression over the past 18 years and thespecific crises associated therewith-Iran, Greece, Turkey, the Berlinblockade, Korea, Lebanon, Quemoy-Matsu, Vietnam, the Congo. theBerlin wall, Thailand, and Cuba-have demanded the deployment ofU.S. forces in many parts of the globe, sometimes to stabilize, some-times to fight. In the broadest sense, these deployments have re-sulted from U.S. efforts to develop a free international community de-pendent on a hard core of strong and developed nations, willing toorchestrate their resources in defensive and constructive tasks beyondtheir borders, and to draw, along with the less developed nations,common ties for the common good.
The strategic rationale behind present overseas deployments islinked in a quite specific sense to the regional interests and objectivesof the United States and to areas where free societies may be injeopardy.
Western Europe has continued to be an area of extraordinary im-portance to our national interest, and we are committed to help defendthat area virtually on the same terms as U.S. territory. BecauseWestern Europe represents the most important center of free worldresources, its loss would gravely endanger U.S. security and woulddrastically alter the power equilibrium in the world.
The arc from Iran to Korea represents an area where the elementsof power are in precarious balance. Here, the rising threat is RedChina, whose power will be a source of danger for many years to come.And this power may grow-especially when Communist China comesinto possession of nuclear weapons. The loss in this area of one or
I The figure of six instead of five divisions is sometimes used as a matter of convenience in order to includethe additional combat units which are the approximate equivalent of a division.
PERSPECTIVES AND POLICIES
more nations belonging to the free community would have seriouseffects not only in terms of the country immediately affected but foran entire region. The loss of South Korea, for example, would en-danger Japan. The loss of Vietnam or Thailand could threaten thewhole of southeast Asia and the independence of India. The loss ofIran similarly would jeopardize the Middle East.
Also, although not so directly exposed to aggression, the security ofthe United States is affected by what happens in Africa and LatinAmerica. Our sensitivity to, and the dangers stemming from aggres-sion in Latin America have been demonstrated in the case of Cuba.Geographic proximity, historical association and economic interest alldemand strong support for the security of these areas. The inde-pendence of the region and the development of conditions conduciveto progress are vital to U.S. security.
The nature and breadth of our security interests and deploymentsabroad are illustrated by the series of alliances in which the UnitedStates holds membership or to which it lends support. These includeNATO in Europe, the Central Treaty Organization in the MiddleEast, the Southeast Asia Treaty Organization, the Australia-NewZealand-United States pact, and bilateral security pacts with Japanand the Republics of Korea, China, and the Philippines, and the RioTreaty with our Latin American neighbors.
Forward deployments provide the clearest possible indication, bothto the Allies and to potential antagonists, of the determination of theUnited States to defend its own national security at the frontiers ofthe non-Communist world, to honor its commitments, and to respondappropriately to aggression.
PART IV
THE EUROPEAN DEFENSE EFFORT
In the course of their rapid economic recovery following World WarII, the European Allies of the United States have increased theirdefense expenditures. Yet, in many cases, the percentage of theirGNP flowing into defense has remained at a relatively low level orhas declined. And our NATO Allies have consistently fallen shortof stated military force level requirements. The United States, onthe other hand, has not only increased its absolute investment in de-fense over the last 8 years but has also devoted a percentage of GNPto national defense programs which has remained significantly higherthan that of any other member of NATO.
There is, of course, no pat formula by which any military alliancecan determine who contributes what and how much. While there isa general acceptance of the proposition that the wealthier membersof the alliance should contribute a larger share than the poorer, thereis no agreed formula for defense efforts in NATO, nor is there likelyto be. This has been part of the dialog among NATO membersfor some time, and the problem of burden sharing is, though perhapsunderstood, not likely to be solved in the foreseeable future.
There are several ways to measure comparative efforts. Onemeasure of U.S. and European contributions to NATO is the percent-ages of GNP which are devoted to defense. In 1962, the GNP ofNATO members (other than the United states) totaled, at factor
84
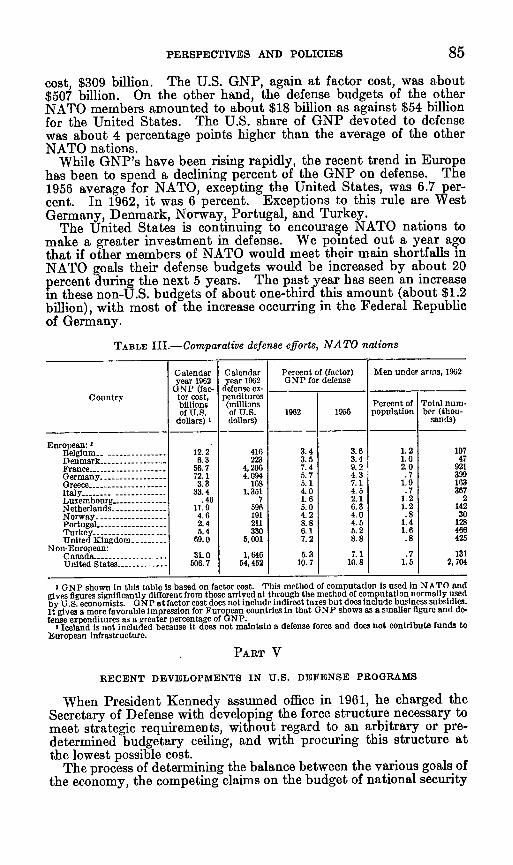
PERSPECTIVES AND POLICIES 85
cost, $309 billion. The U.S. GNP, again at factor cost, was about$507 billion. On the other hand, the defense budgets of the otherNATO members amounted to about $18 billion as against $54 billionfor the United States. The U.S. share of GNP devoted to defensewas about 4 percentage points higher than the average of the otherNATO nations.
While GNP's have been rising rapidly, the recent trend in Europehas been to spend a declining percent of the GNP on defense. The1956 average for NATO, excepting the United States, was 6.7 per-cent. In 1962, it was 6 percent. Exceptions to this rule are WestGermany, Denmark, Norway, Portugal, and Turkey.
The United States is continuing to encourage NATO nations tomake a greater investment in defense. We pointed out a year agothat if other members of NATO would meet their main shortfalls inNATO goals their defense budgets would be increased by about 20percent during the next 5 years. The past year has seen an increasein these non-U.S. budgets of about one-third this amount (about $1.2billion), with most of the increase occurring in the Federal Republicof Germany.
TABLE III.-Comparative defense efforts, NATO nations
Calendar Calendar Percent of (factor) Men under arms, 1962year 1962 year 1962 GNP for defense
GNP (fac- defense ex- _ ICountry tor cost, penditures
bilin (millions Percent of Total num-of U.S. of U.S. 1962 1956 population ber (thou-
dollars) I dollars) sands)
Enropean: 2Belgium -12.2 416 3. 4 3.6 1.2 107Denmark- 6.3 223 3. 5 3.4 1.0 47France -- ---------- 56.7 4,206 7. 4 9. 2 2.0 921Germany -72.1 4,094 6 7 4. 3 .7 399Greece -------- ----- 3.3 168 5.1 7.1 1.9 163Italy -------- 33.4 1.351 4. 0 4. 7 367Luxembourg-.46 7 1. 6 2.1 1.2 2Netherlands -------- 11.9 596 5.0 6.3 1. 2 142Norway- 14.6 191 4.2 4.0 .8 30Portugal- --------- 2.4 211 8.8 4.5 1.4 128Turkey--. 54 330 6.1 5.2 1. 6 466United Kingdom -69.0 5,001 7. 2 8.8 8 426
Non-European:Canada.-31.0 1,646 5. 3 7.1 7 131United States - - 06.7 14,412 10.7 10.8 15 2, 704
I GNP shown in this table is based on factor cost. This method of computation is used in NATO andgives figures significantly different from those arrived at through the method of computation normally usedby U.S. economists. GNP at factor cost does not include indirect taxes but does include business subsidies.It gives a more favorable impression for European countries in that GNP shows as a smaller figure and de-fense es pendiures as a greater percentage of G}NP.
Iteland is not included because it does not maintain a defense force and does not contribute funds toEuropean infrastructure.
PART V
RECENT DEVELOPMENTS IN U.S. DEFENSE PROGRAMS
When President Kennedy assumed office in 1961, he charged theSecretary of Defense with developing the force structure necessary tomeet strategic requirements, without regard to an arbitrary or pre-determined budgetary ceiling, and with procuring this structure atthe lowest possible cost.
The process of determining the balance between the various goals ofthe economy, the competing claims on the budget of national security

86 PERSPECTIVES AND POLICIES
and other Government programs is based on a broad and searchinganalysis of strategic requirements, and provision of these forces withinthe resources and growth interests of the national economy. TheUnited States has limited resources. It cannot do everything in asecurity sense that is desirable, and, for technological reasons cannotdo some things at all.
Nevertheless, the result of this process is an Armed Force whichenables the President to employ a strategy of great flexibility againstthreats ranging from local subversion to nuclear world war. One of theprime purposes of this strategy is to avoid a course of action thatwould lead to general war, and yet achieve all important U.S. objec-tives. The Department of Defense expenditure estimate for thisforce (military functions only) as included in the 1964 budget request,was about $51 billion, or about 8.6 percent of the GNP.
The aim over the past 3 years has been to build a force structurepermitting a wider range of options, but not obliging the United Statesto choose in advance which option would be exercised. The approachto this strategy is illustrated by Secretary McNamara's remarks beforethe fellows of the American Bar Foundation in February 1962:
Nuclear and non-nuclear power complement each other in our military forcesand within the NATO alliance, just as together they complement the nonmilitaryinstruments of policy. Either without the other is, overall, not fully effective* * * if we strengthen one and not the other, part of the effort is wasted. Ourpolicy is aimed at achieving the best balance of military capabilities over the entirerange of potential conflict, in the various areas of the globe where the free worldhas vital interests, and over the years as far ahead as we can reasonably plan. Ifirmly believe that the non-nuclear buildup will, by improving and expanding thealternatives open to the free world, reduce the pressures to make concessions inthe face of Soviet threats.
An appropriate way to summarize the present and planned forcestructure and the financial requirements supporting a strategy ofmultiple options is to review several of the pertinent parts of the U.S.military program as it was described in connection with the presenta-tion of the 1964 defense budget. In the course of developing thisforce structure, a new and more effective means of determining require-ments and allocating resources to specific defense goals was intro-duced. Sometimes known as the program package approach, theforces and the budget are divided into nine major military programs,as follows: (1) Strategic Retaliatory Forces, (2) Continental Air andMissile Defense Forces, (3) General Purpose Forces, (4) Airlift-SealiftForces, (5) Reserve and Guard Forces, (6) Research and Develop-ment, (7) General Support, (8) Civil Defense, and (9) MilitaryAssistance. Several of these programs are discussed below.
The strategic retaliatory forces are designed to carry out the long-range strategic mission and to carry the burden in general nuclearwar. In this force in August 1963, there were more than 500 missiles(including Titan, Atlas, Minuteman, and Polaris), SAC bombers onair alert and over 500 SAC bombers on quick reaction alert. Arapidly increasing portion of this force will consist of hardened anddispersed ICBM's and submarine-based Polaris missiles, all with ahigh probability of survival under nuclear attack. The program costof the strategic retaliatory forces currently is estimated at $7.2billion for fiscal vear 1964, compared with $8.5 billion for fiscal year1963 and $9.1 billion for fiscal year 1962.
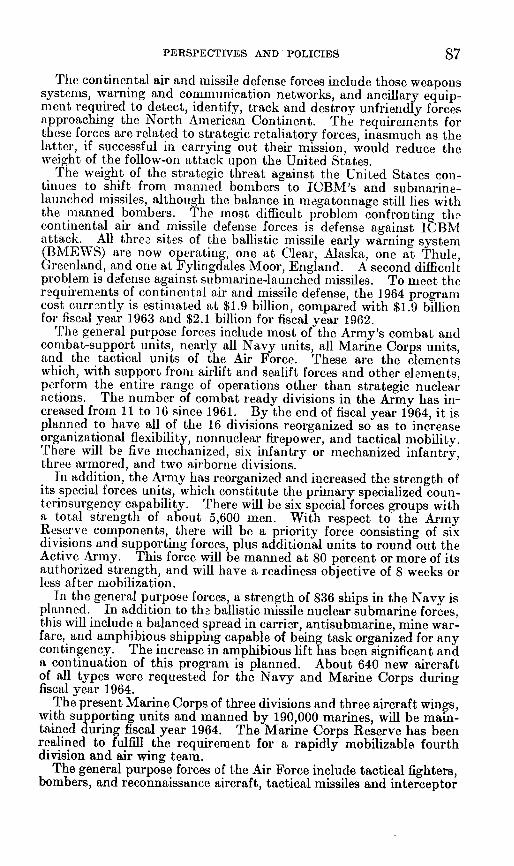
PERSPECTIVES AND POLICIES
The continental air and missile defense forces include those weaponssystems, warning and communication networks, and ancillary equip-ment required to detect, identify, track and destrov unfriendly forcesapproaching the North American Continent. The requirements forthese forces are related to strategic retaliatory forces, inasmuch as thelatter, if successful in carrying out their mission, would reduce theweight of the follow-on attack upon the United States.
The weight of the strategic threat against the United States con-tinues to shift from manned. bombers to ICBM's and submarine-launched missiles, although the balance in megatonnage still lies withthe manned bombers. The most difficult problem confronting thecontinental air and missile defense forces is defense against ICBMattack. All three sites of the ballistic missile early warning system(BMEWS) are now operating, one at Clear, Alaska, one at Thule,Greenland, and one at Fylingdales Moor, England. A second difficultproblem is defense against submarine-launched missiles. To meet therequirements of continental air and missile defense, the 1964 programcost currently is estimated at $1.9 billion, compared with $1.9 billionfor fiscal year 1963 and $2.1 billion for fiscal year 1962.
The general purpose forces include most of the Army's combat andconmbat-support units, nearly all Navy units, all Marine Corps units,and the tactical units of the Air Force. These are the elementswhich, with support from airlift and sealift forces and other elements,perform the entire range of operations other than strategic nuclearactions. The number of combat ready divisions in the Army has in-creased from 11 to 16 since 1961. By the end of fiscal year 1964, it isplanned to have all of the 16 divisions reorganized so as to increaseorganizational flexibility, nonnuclear firepower, and tactical mobility.There will be five mechanized, six infantry or mechanized infantry,three armored, and two airborne divisions.
In addition, the Army has reorganized and increased the strength ofits special forces units, which constitute the primary specialized coun-terinsurgency capability. There will be six special forces groups witha total strength of about 5,600 men. With respect to the ArmyReserve components, there will be a priority force consisting of sixdivisions and supporting forces, plus additional units to round out theActive Army. This force will be manned at 80 percent or more of itsauthorized strength, and will have a readiness objective of 8 weeks orless after mobilization.
In the general purpose forces, a strength of 836 ships in the Navy isplanned. In addition to the ballistic missile nuclear submarine forces,this will include a balanced spread in carrier, antisubmarine, mine war-fare, and amphibious shipping capable of being task organized for anycontingency. The increase in amphibious lift has been significant anda continuation of this program is planned. About 640 new aircraftof all types were requested for the Navy and Marine Corps duringfiscal year 1964.
The present Marine Corps of three divisions and three aircraft wings,with supporting units and manned by 190,000 marines, will be main-tained during fiscal year 1964. The Marine Corps Reserve has beenrealined to fulfill the requirement for a rapidly mobilizable fourthdivision and air wing team.
The general purpose forces of the Air Force include tactical fighters,bombers, and reconnaissance aircraft, tactical missiles and interceptor
87
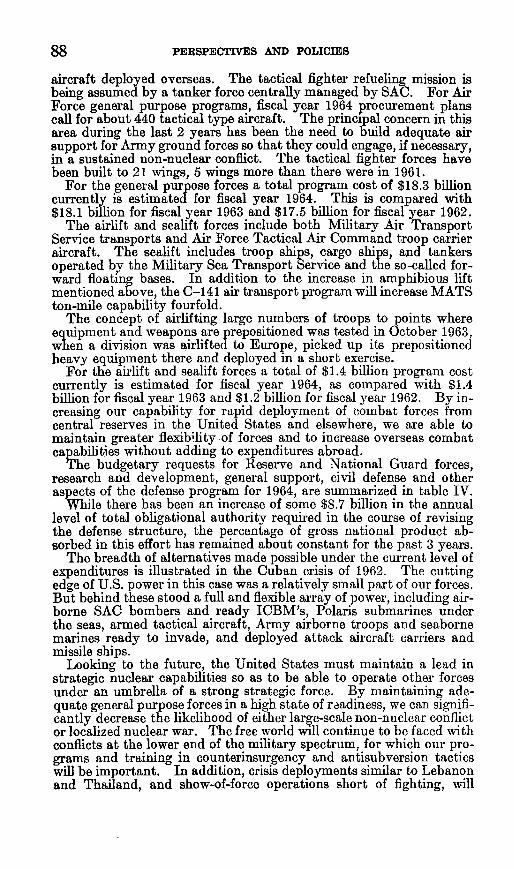
88 PERSPECTIVES AND POLICIES
aircraft deployed overseas. The tactical fighter refueling mission isbeing assumed by a tanker force centrally managed by SAC. For AirForce general purpose programs, fiscal year 1964 procurement planscall for about 440 tactical type aircraft. The principal concern in thisarea during the last 2 years has been the need to build adequate airsupport for Army ground forces so that they could engage, if necessary,in a sustained non-nuclear conflict. The tactical fighter forces havebeen built to 21 wings, 5 wings more than there were in 1961.
For the general purpose forces a total program cost of $18.3 billioncurrently is estimated for fiscal year 1964. This is compared with$18.1 billion for fiscal year 1963 and $17.5 billion for fiscal year 1962.
The airlift and sealift forces include both Military Air TransportService transports and Air Force Tactical Air Command troop carrieraircraft. The sealift includes troop ships, cargo ships, and tankersoperated by the Military Sea Transport Service and the so-called for-ward floating bases. In addition to the increase in amphibious liftmentioned above, the C-141 air transport program will increase MATSton-mile capability fourfold.
The concept of airlifting large numbers of troops to points whereequipment and weapons are prepositioned was tested in October 1963,when a division was airlifted to Europe, picked up its prepositionedheavy equipment there and deployed in a short exercise.
For the airlift and sealift forces a total of $1.4 billion program costcurrently is estimated for fiscal year 1964, as compared with $1.4billion for fiscal year 1963 and $1.2 billion for fiscal year 1962. By in-creasing our capability for rapid deployment of combat forces fromcentral reserves in the United States and elsewhere, we are able tomaintain greater flexibility of forces and to increase overseas combatcapabilities without adding to expenditures abroad.
The budgetary requests for Reserve and National Guard forces,research and development, general support, civil defense and otheraspects of the defense program for 1964, are summarized in table IV.
While there has been an increase of some $8.7 billion in the annuallevel of total obligational authority required in the course of revisingthe defense structure, the percentage of gross national product ab-sorbed in this effort has remained about constant for the past 3 years.
The breadth of alternatives made possible under the current level ofexpenditures is illustrated in the Cuban crisis of 1962. The cuttingedge of U.S. power in this case was a relatively small part of our forces.But behind these stood a full and flexible array of power, including air-borne SAC bombers and ready ICBM's, Polaris submarines underthe seas, armed tactical aircraft, Army airborne troops and seabornemarines ready to invade, and deployed attack aircraft carriers andmissile ships.
Looking to the future, the United States must maintain a lead instrategic nuclear capabilities so as to be able to operate other forcesunder an umbrella of a strong strategic force. By maintaining ade-quate general purpose forces in a high state of readiness, we can signifi-cantly decrease the likelihood of either large-scale non-nuclear conflictor localized nuclear war. The free world will continue to be faced withconflicts at the lower end of the military spectrum, for which our pro-grams and training in counterinsurgency and antisubversion tacticswill be important. In addition, crisis deployments similar to Lebanonand Thailand, and show-of-force operations short of fighting, will
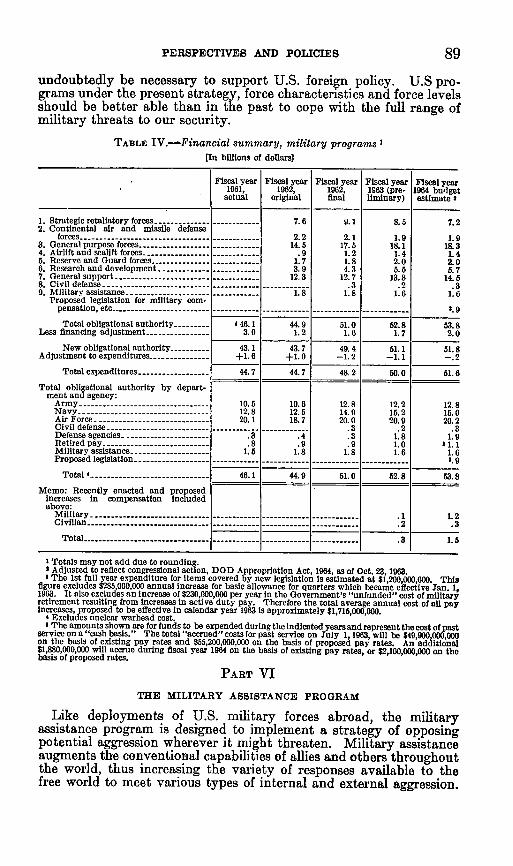
PERSPECTIVES AND POLICIES 89
undoubtedly be necessary to support U.S. foreign policy. U.S pro-grams under the present strategy, force characteristics and force levelsshould be better able than in the past to cope with the full range ofmilitary threats to our security.
TABLE IV.-Financial summary, military programs I[In billions of dollarsl
Fiscal year Fiscal year Fiscal year Fiscal year Fiscal year1961, 1962, 1962, 1863 (pre- 1964 budget
actual original final liminary) estimate 2
1 St rategic retaliatory forces-7.6 9. 1 8. 5 7.22. Continental air and missile defense
forces- 2.2 2.1 1. 9 1.93. General purpose forces -14.5 17.5 18 1 18.34. Airlift and sealift forces -. 9 1.2 1.4 1.45. Reserve and Guard forces- 1.7 1.8 2.0 2.06. Research and development- 3.9 4.3 5.5 5.77. General support -12.3 12. 7 13.8 14.58. Civil defense - - -. 3 .2 .39. Military assistance -1 8 18 1.6 1.6
Proposed legislation for military corm-pensation, etc------ - - 39
Total obligational authorityLess financing adjustment
New obligational authorityAdjustment to expenditures
Total expenditures
Total obligational authority by depart-ment an agency:
Army ----------------------------Navy-Air Force -----Civil defenseDefense agenciesRetired payMilitary assistanceProposed legislation
Total 4
Memo: Recently enacted and proposedincreases In compensation includedabove:
Military.Civilian.
'46.1 44.9 51.0 52.8 53.83.0 1.2 1.6 1.7 2.0
43.1 43.7 49. 4 51.1 51.8+1.6 +1.0 -1.2 -1.1 -.2
44.7 44.7 48.2 10.0 51.6
10.5 10.6 12.8 12.2 12.812.8 12.6 14.9 15.2 15.020.1 18.7 20.0 20.9 20.2
- -- ---- ---- 3 .2 .33 .4 .3 1.8 1.98 .9 9 1.0 1. 1
16 1.8 1.8 1.6 1.6------------------- ------------ ------------ S. 9
46.1 44.9 51.0 52.8 53.8
1 1.2------------ ------------.------------ 2 .3
Total -I- I-I-- .3 1.5
I Totals may not add due to roundingAdjusted to refect congressional action, DOD Appropriation Act, 1964, as of Oct. 23 1963
a The 1st full year expenditure for Items covered by new legislation is estimated at $1,200,000,000. Thisfigure excludes $285 000,000 annual increase for basde allowance for quarters which became effective Jan. 1,1963. It also excludes an increase of $230,000,000 per year In the Government's "unfunded" cost of militaryretirement resulting from increases in active duty pay. Therefore the total average annual cost of all payincreases, proposed to be effective In calendar year 1963 is approximately $1,715,000,000.
4 Excludes nuclear warhead cost.*The amounts shown are for funds to be expended duringtheindIcated yearsand represent the cost ofpast
service on a "cash basis." The total "accrued" costs for past service on July 1 1963 will be $49 900 000,000on the basis of existing pay rates and $55,200,000,000 on the basis of proposed paj rates. An'additional$1,880,000,000 will accrue during fiscal year 1964 on the basis of existing pay rates, or $2,100,000,000 on thebasis of proposed rates.
PART VI
THE MILITARY ASSISTANCE PROGRAM
Like deployments of U.S. military forces abroad, the militaryassistance program is designed to implement a strategy of opposingpotential aggression wherever it might threaten. Military assistanceaugments the conventional capabilities of allies and others throughoutthe world, thus increasing the variety of responses available to thefree world to meet various types of internal and external aggression.
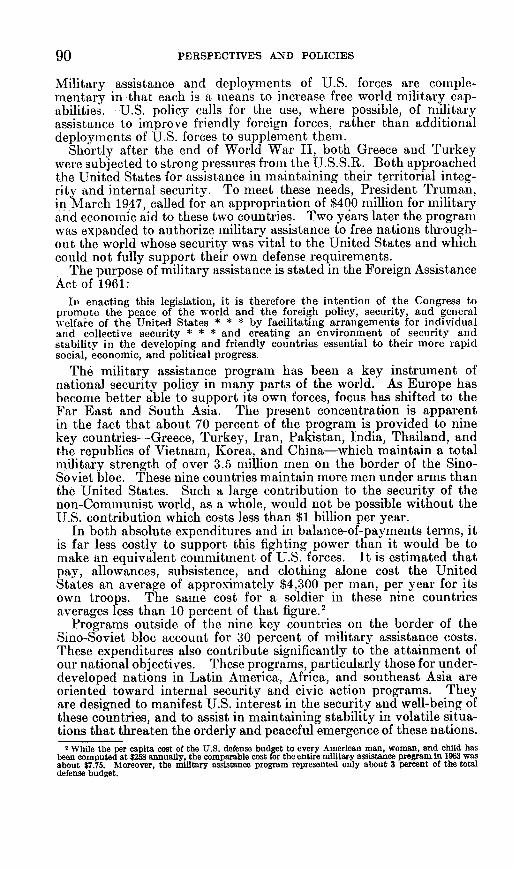
PERSPECTIVES AND POLICIES
Military assistance and deployments of U.S. forces are comple-mentary in that each is a means to increase free world military cap-abilities. -U.S. policy calls for the use, where possible, of militaryassistance to improve friendly foreign forces, rather than additionaldeployments of U.S. forces to supplement them.
Shortly after the end of World War II, both Greece and Turkeywere subjected to strong pressures from the U.S.S.R. Both approachedthe United States for assistance in maintaining their territorial integ-rity and internal security. To meet these needs, President Truman,in March 1947, called for an appropriation of $400 million for militaryand economic aid to these two countries. Two years later the programwas expanded to authorize military assistance to free nations through-out the world whose security was vital to the United States and whichcould not fully support their own defense requirements.
The purpose of military assistance is stated in the Foreign AssistanceAct of 1961:
In enacting this legislation, it is therefore the intention of the Congress topromote the peace of the world and the foreigh policy, security, and generalwelfare of the United States * * * by facilitating arrangements for individualand collective security * * * and creating an environment of security andstability in the developing and friendly countries essential to their more rapidsocial, economic, and political progress.
The military assistance program has been a key instrument ofnational security policy in many parts of the world. As Europe hasbecome better able to support its own forces, focus has shifted to theFar East and South Asia. The present concentration is apparentin the fact that about 70 percent of the program is provided to ninekey countries-Greece, Turkey, Iran, Pakistan, India, Thailand, andthe republics of Vietnam, Korea, and China-which maintain a totalmilitary strength of over 3.5 million men on the border of the Sino-Soviet bloc. These nine countries maintain more men under arms thanthe United States. Such a large contribution to the security of thenon-Communist world, as a whole, would not be possible without theU.S. contribution which costs less than $1 billion per year.
In both absolute expenditures and in balance-of-payments terms, itis far less costly to support this fighting power than it would be tomake an equivalent commitment of U.S. forces. It is estimated thatpay, allowances, subsistence, and clothing alone cost the UnitedStates an average of approximately $4,300 per man, per year for itsown troops. The same cost for a soldier in these nine countriesaverages less than 10 percent of that figure.2
Programs outside of the nine key countries on the border of theSino-Soviet bloc account for 30 percent of military assistance costs.These expenditures also contribute significantly to the attainment ofour national objectives. These programs, particularly those for under-developed nations in Latin America, Africa, and southeast Asia areoriented toward internal security and civic action programs. Theyare designed to manifest U.S. interest in the security and well-being ofthese countries, and to assist in maintaining stability in volatile situa-tions that threaten the orderly and peaceful emergence of these nations.
2 While the per capita cost of the U.S. defense budget to every American man, woman, and child hasbeen computed at $258 annually, the comparable cost for the entire military assistance program in 1963 wasabout $7.75. Moreover, the military assistance program represented only about 3 percent of the totaldefense budget.
90
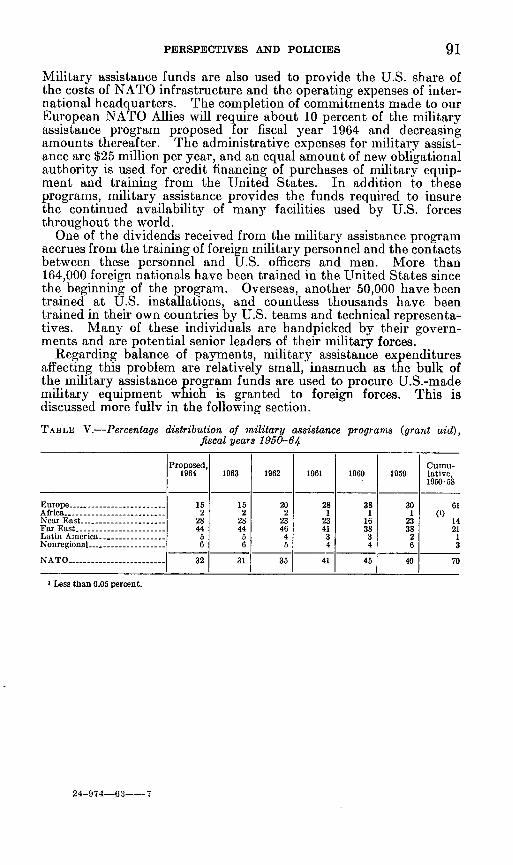
PERSPECTIVES AND POLICIES 91
Military assistance funds are also used to provide the U.S. share ofthe costs of NATO infrastructure and the operating expenses of inter-national headquarters. The completion of commitments made to ourEuropean NATO Allies will require about 10 percent of the militaryassistance program proposed for fiscal year 1964 and decreasingamounts thereafter. The administrative expenses for military assist-ance are $25 million per year, and an equal amount of new obligationalauthority is used for credit financing of purchases of military equip-ment and training from the United States. In addition to theseprograms, military assistance provides the funds required to insurethe continued availability of many facilities used by U.S. forcesthroughout the world.
One of the dividends received from the military assistance programaccrues from the training of foreign military personnel and the contactsbetween these personnel and U.S. officers and men. More than164,000 foreign nationals have been trained in the United States sincethe beginning of the program. Overseas, another 50,000 have beentrained at U.S. installations, and countless thousands have beentrained in their own countries by U.S. teams and technical representa-tives. Many of these individuals are handpicked by their govern-ments and are potential senior leaders of their military forces.
Regarding balance of payments, military assistance expendituresaffecting this problem are relatively small, inasmuch as the bulk ofthe military assistance program funds are used to procure U.S.-mademilitary equipment which is granted to foreign forces. This isdiscussed more fullv in the following section.
TABLE V.-Percentage distribution of military assistance programs (grant aid),fiscal years 1950-64
Proposed, Cumu-1964 1963 1962 1961 1960 1959 lative,
1910-18
Europe - ---- ------ 16 16 20 28 38 30 61Africa - 2 2 2 1 1 1 (I)Near East --- 28 28 23 23 16 23 14Far East- 44 44 46 41 38 38 21Latin America-- 6 4 3 3 2 1Nonregional -6 6 4 4 6 3
NATO -------------------- 32 31 35 41 45 40 70
I Less than 0.06 percent.
24-974- 63--T
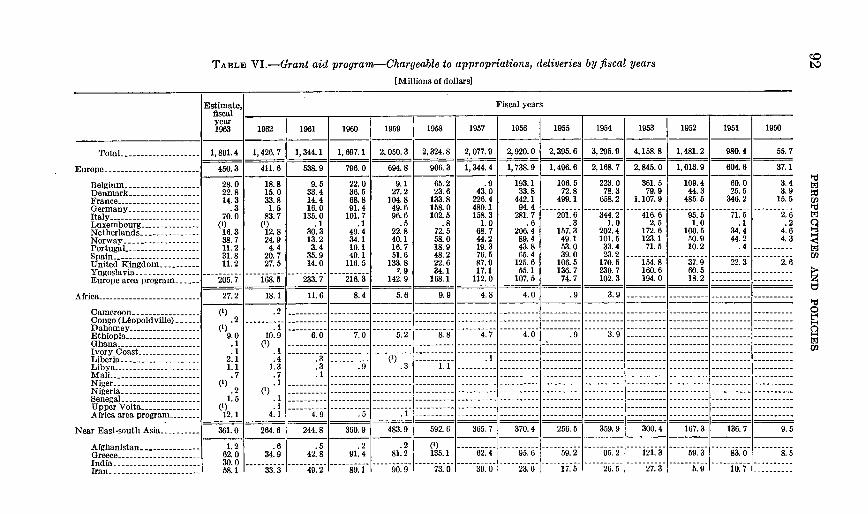
TABLE VI.-Grant aid program-Chargeable to appropriations, deliveries by fiscal years[Millions of dollars]
Estimate, Fiscal yearsfiscal | 1 9 6 1 |_1960 _| 1 | 1 | 19 5 7 | 195 6 | 1 159 9 2 59year 199 15 197 15I1963 1962 19 601 -- 57 19655 194 15 92 1951 1950
Total ----------- 11,801.4 1 1,426.7
Europe-
BelgiumDenmark-France-GermanyItaly .Luxembourg-Netherlands-Norway-PortugalSpain -- ------------United KingdomYugoslavia -- -----Europe area program
Africa
CameroonCongo (LMopoldvillo)Dahomey -- ----EthiopiaGhanaIvory CoastLiberia -----------------Libya - ----- -------M ali - .-.---.-.----Niger .Nigeria .SenegalUpper VoltaAfrica area program
Near East-south Asia
Afghanistan ----------Greece - --- ----------India-Iran ----------------------
1,344.1 1 1,697.1 1 2,050.3 2,324.8 1 2,077.9 1 2,920.01 2,395.6 1 3,295.9 1 4,158.8 1 1,481.2 980. 4
460.3 411. 6 538. 9 796. 0 694.8 906. 3 1,344. 4 1, 738.9 1,496. 6 2,168. 7 2,845. 0 1,013. 9 604. 6 37. 1
28.0 18.8 9. 6 22.0 9.1 65.2 .9 193.1 106. 5 223.0 361. 5 109.4 60.0 3.422.8 15.0 33.4 36.5 27.2 23.6 43.0 33.8 72.8 78.3 79.9 44.3 25.5 3.914.3 33.8 14.4 68.8 104.8 133.8 226.4 442.1 499.1 658.2 1,107.9 485. 5 346.2 16.5
.3 1.5 16.0 91.4 49.6 168. 0 489.1 94.470.0 83.7 135.0 101.7 96.6 102.5 158.3 281. 7 201.6 344.2 416. 6 95.5 71.6 2.6
(1) (1) .1 .1 .5 .8 1.0 .6 .3 1.0 2.5 1.0 .1 .216.3 12. 8 30.3 49.4 22.8 72.5 68. 7 206.4 157.3 202.4 172.6 100.5 34.4 4.638.7 24.9 13.2 34.1 40.1 58.0 44.2 89.4 49.1 101.5 123.1 .50.9 44.2 4.311.2 4.4 3.4 10.1 16.7 18.9 19.3 43.8 53.0 33.4 71.5 10.2 .431.8 20. 7 35.9 49.1 51. 6 48.2 76. 5 65. 4 39. 0 23.211.2 27. 5 14. 0 116. 5 133. 8 22.6 87.9 125. 6 106. 5 170.5 154. 8 37. 9 22.3 2.6
-9 34.1 17.1 55.1 136.7 230.7 160.6 60.5205. 7 168.5 233.7 216.3 142.9 168.1 112.0 107. 5 74.7 102.3 194. 0 18.2
27.2 18.1 11.6 8.4 5.6 9.9 4.8 4.0 .9 3.9
(I) .2
.2-(1) .1.
9.0 10.9 6.0 7.0 5.2 8.8 4.7 4.0 .9 3.9.1 (1):
1.1 1.73 .3 --------- ---------- 11-- -- - --- - -- -- - - -- - - -- - -
°2 .1 - ----- - - -
1.5-i - - -- - - -- - - -
12. 1 . 4.9 .5 .1
361. 0 264. 6 244. 8 5 60. 9 483.9 592. 6 365. 7 370. 4 256. 5 359. 9 300. 4 167. 3 136. 7 9. 5
7 6 7 .5 - - - - - - - - - - - - - - - - - - - - - - - - - - -- - - - - - - - - - - - - - - - - - - - - - - - - - - - --- --- - -- - - -- - - -- - - -- - - -- - -- - - - - - -- - - -- - --2- - - - -- - --2- - -- - - -- - - -- - -- - -
1.262. 030 0
34.9
33.3-
42. 8
49.2
.291. 4
89. i
.2 (13)81.2 135.1
90.9- - ----- 73. 0
-__ - -5 ------- --62.4 95.6
390 23. 659.-- 28 9 121.3 59.3 83.i0 i 8. 517. 51 26.5 1 2 5.9 10. 7
55. 7
969t02
02' e
0
t:1c
002
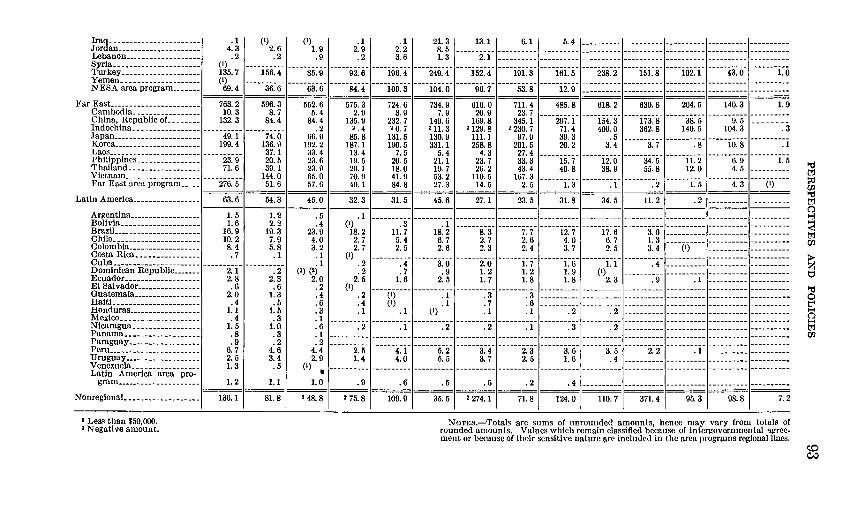
IraqJorda-n - ------ ------------
LebanonSyria
Yemen - --------NESA area program----
Far EastCambodiaChina, Republic of .Indochina .Japan .Korea .-----------Laos --Philippines .Thailand -- --------VietnamFar East area program
Latin America
ArgentinaBoliviaBrazilChile -ColombiaCosta Rica .CubaDominican RepublicEcuadorEl SalvadorGuatemalaBaitiHondurasMexico . . .NicaraguaPanamaParaguayPeru --UruguayVenezuelaLatin America area pro-
grain
Nonregional
.14.3.2
(I)135. 7(I)
69.4
(1)2.6.2
116. 4
36. 6
(1)1.9.9
63.- 6C
.12. 9.2
92. 6
84. 4
.12.23. 6
196. 4
109. 3
21.38.51.3
249. 4
104.0
13.1
2.1
112.4
96. 7
6.1
191. 3
53.8
1.4
161.51
12. 9
--- -- -- -- -
238. 2------ i.- W--
isi. 8--
-- -- ----_ _ _ __ _ _
----- 0-6--- -- --- --
763. 2 596. 3 552. 6 575. 3 724. 6 734. 9 610. 0 711. 4 485. 8 618. 2 630. 8 204. 5 140.3 1. 910.3 8.7 5.4 2.9 3.9 7.9 20.9 23. 7132.3 84.4 84.4 135.9 232.7 149.6 169.8 345.1 297.1 154. 3 173. 8 38.5 9.5-.2 2 4 26 7 211.3 2129.8 2230.7 71.4 409.0 362.8 140.5 104.3 .349.1 74.0 66.9 85.8 131.5 130.9 111.1 97.9 39.3 .5-199.4 136.9 192.2 187.1 190.5 331.1 258.8 201.5 20.2 3.4 3.7 .8 10.8 .137.1 33. 4 13. 4 7. 5 5. 4 4. 3 27. 423.9 20.5 23.6 19.1 20.5 21.1 23.7 33.3 15.7 12.0 34.5 11.2 6.9 1.571.6 39.1 23.9 20.1 18.0 19.7 26.2 43.4 40.8 38.9 55.8 12.0 4.5144.0 65.0 70. 9 41.9 53.2 110.5 167. 3276.1 51.6 57.6 40.1 84.8 27.3 14.5 2. 1 .1 .2 1.5 4.3 ---(-)
63.6 54.3 45.0 32.3 31.5 45.6 27.1 23.5 31.8 34.5 11.2 .-2-
1. 5 1. 2 .5 .I ----1.6 2. 2 .4 (2) .3 .I16.9 19.3 23.9 18.2 11.7 18.2 8.3 7.7 12.7 17.6 3.0 _10.2 7.9 4.0 2.7 5.4 6.7 2.7 2.6 4.0 6.7 1.3.8.4 5.8 3.2 2.7 2.5 2.6 2.3 2.4 3. 7 2. 5 3.4 (1).7 .1 .1 (2)..
. ._ __1 .2 .4 3. 0 2.0 1. 7 1. 6 1.1 .4.2.1 - .2 ~(2) (2) .2 .7 .9 1.2 1. 2 1. 9 -- - - - -- -- - - -- ---)-- - - - -2 8 2.3 2.0 2. 5 1. 6 2. 5 1. 7 1. 8 1.8 2.3 .9 .1-.6 .6 .2 -- - - - - - - - --(- - - - -- -- - - - - - - - - - - - - - - - - -- - - - - --)- - - - - - - - - -2.0 1.3 .4 .2 .1 .3 .3.------- ---.------ -------- - - ----------.4 .5 .6 .4 (2) .1 .7 .6 _1. 1 1.6 .3 .1 .1 (1) .1 .1 .2 .2 _. 4 .3 .11.5 1.0 .6 .2 .1 .2 .2 .1 .3 .2
.8 .3 .1 ___6.7 4.6 4.4 2.5 4.1 5.2 3. 4 2.3 3.6 3.5 2.2 . ---------2.5 3.4 2.9 1.4 4.0 5.5 3.7 2.5 1.6 .4 _1. 3 .5 ( ) -_
_1.2 1.1 1.0 .9 .6 .5 .5 .2 .4 .. _
136. I | 81.8 1 2 48.8 2 75.8 1 109. 9 1 31.5 12 274.1
I Less than $50,000.X Negative amount.
1 71.8 124.0 1 110.7 1 371.4 1 95.3 1 98.8
"4
02
0'-9
0402
z
0
20
02
7. 2
NOTEs.-Totals are sums of unrounded amounts, hence may vary from totals ofrounded amounts. Values which remain classified because of intergovernmental agree-ment or because of their sensitive nature are included in the area programs regional lines.
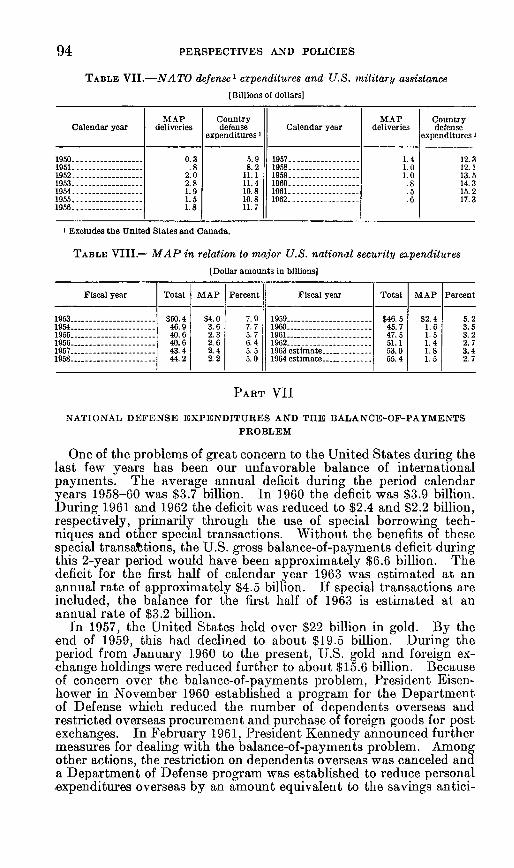
PERSPECTIVES AND POLICIES
TABLE VII.-NATO defense I expenditures and U.S. military assistance
[Billions of dollars]
MAP Country MAP CountryCalendar year deliveries defense Calendar year deliveries defense
expenditures I expenditures I
1950 - 0.3 5.9 1957 - 1.4 12.31951 -. 8 8.2 1958 -1.0 12.11952 -2.0 11.1 1959 -1.0 13.51953 -2.8 11.4 1960 - ------- .8 14.31954 -_ 1.9 10.8 1961- .5 15.21955 -1.5 10.8 1962 - ------------- .6 17.31956 -1.8 11.7
I Excludes the United States and Canada.
TABLE VIII.- MAP in relation to major U.S. national security expenditures
[Dollar amounts in billions]
Fiscal year Total MAP Percent Fiscal year Total MAP Percent
1953 -$50.4 $4.0 7.9 1959 -$46.5 $2.4 5. 21954 -46.9 3.6 7. 7 1960 -- _-_-__- 45.7 1. 6 3.51955 -40.6 2.3 5. 7 1961 -47.5 1.5 3. 21956 -40.6 2.6 6.4 1962 -51.1 1.4 2. 71957 -43.4 2. 4 5. 5 1963 estimate - -- 53.0 1.8 3.41958 -44.2 2.2 5. 0 1964 estimate -55.4 1. 5 2. 7
PART VII
NATIONAL DEFENSE EXPENDITURES AND THE BALANCE-OF-PAYMENTS
PROBLEM
One of the problems of great concern to the United States during thelast few years has been our unfavorable balance of internationalpayments. The average annual deficit during the period calendaryears 1958-60 was $3.7 billion. In 1960 the deficit was $3.9 billion.During 1961 and 1962 the deficit was reduced to $2.4 and $2.2 billion,respectively, primarily through the use of special borrowing tech-niques and other special transactions. Without the benefits of thesespecial transactions, the U.S. gross balance-of-payments deficit duringthis 2-year period would have been approximately $6.6 billion. Thedeficit for the first half of calendar year 1963 was estimated at anannual rate of approximately $4.5 billion. If special transactions areincluded, the balance for the first half of 1963 is estimated at anannual rate of $3.2 billion.
In 1957, the United States held over $22 billion in gold. By theend of 1959, this had declined to about $19.5 billion. During theperiod from January 1960 to the present, U.S. gold and foreign ex-change holdings were reduced further to about $15.6 billion. Becauseof concern over the balance-of-payments problem, President Eisen-hower in November 1960 established a program for the Departmentof Defense which reduced the number of dependents overseas andrestricted overseas procurement and purchase of foreign goods for postexchanges. In February 1961, President Kennedy announced furthermeasures for dealing with the balance-of-payments problem. Amongother actions, the restriction on dependents overseas was canceled anda Department of Defense program was established to reduce personal,expenditures overseas by an amount equivalent to the savings antici-
94
PERSPECTIVES AND POLICIES 95
pated for the previous limitation on the number of dependents over-seas.
President Kennedy, in his message to Congress on balance of pay-ments in July 1963, announced a series of additional actions to reducethe U.S. deficit. One of these was a projected reduction in the annualrate of expenditures abroad by the Department of Defense of morethan $300 million below the calendar year 1962 level by measures tobe put into effect before the end of calendar year 1964.
The emphasis on this further reduction should not, however, obscurethe substantial reduction in net military expenditures abroad whichalready has been achieved. In July 1962, Secretary McNamaraannounced as a primary objective a reduction of $1 billion (from$2.7 to $1.7 billion) in the net adverse dollar balance between fiscalyear 1961 and fiscal year 1963. This goal has been achieved.
One of the complications in attempting to reduce the balance-of-payments deficit on the "military" account has been the increase inworld price levels. During the past few years there has been anaverage annual price increase in Western Europe of 3 to 4 percentper year. Such price increases may be helpful to the competitiveposition of the United States, but from the point of view of Defenseexpenditures, they simply represent rising foreign exchange costs.
The principal ways in which the Department of Defense is attempt-ing to reduce overseas defense expenditures are:
(1) A voluntary savings program by reduction of individual expen-ditures. Military and civilian personnel and their dependents havebeen urged to reduce personal expenditures in overseas areas and tochannel their family expenditures to U.S. sources, and their savingsto U.S. savings bonds, U.S. securities and institutions. It is difficultto measure results in this area but it is estimated that foreign exchangesavings of about $50 million were achieved in fiscal year 1962. Thesuccess of this voluntary program is indicated by a 9-percent increasein the number of overseas military personnel purchasing savings bondsthrough payroll deductions, and 31 percent decrease in parcel postshipments from Army post offices. The latter is evidence of a reduc-tion in purchases of foreign products for shipment.
(2) A program to increase procurement of goods in the UnitedStates for use overseas. In general, when it is estimated that thecost of U.S. supplies and services, including transportation and hand-ling costs, will not exceed the cost of foreign supplies and services bymore than 50 percent the procurement is made in the United States.During calendar year 1961 and the first 6 months of calendar year1962, when a 25 percent differential was in effect, we returned approxi-mately $77.6 million of procurement, which normally would have beenmade overseas, at an increased cost of approximately $13.4 million, oran average increase of about 17 percent. During fiscal year 1963, wereturned approximately $75 million of procurements to U.S. sourcesat an additional cost of approximately $21 million. Under this pro-gram, in the past 2' years, we have returned approximately $153million of procurements, which would normally have been made over-seas, at an additional cost of approximately $34.4 million or about22.5 percent.
(3) Special reviews of overseas construction programs. By such areview in January 1963 foreign exchange costs in the fiscal year 1963
PERSPECTIVES AND POLICIES
construction program were reduced by about 50 percent, with a for-eign exchange savings of approximately $97 million over the next 2 to3 years. The increased budgetary costs will be about $15 million.This particular reduction will be achieved by eliminating or deferringprojects not considered operationally essential and use of revised con-struction procedures for those necessary projects, as a result of whichU.S. labor and material (including prefabs) will be utilized to thegreatest extent practicable.
(4) Raising the level of U.S. receipts by encouraging increased pro-curement of U.S. military equipment by the allies.
(5) Continuing review of employment of foreign nationals at over-seas military installations. During fiscal year 1963, the number offoreign nationals employed in overseas areas was reduced.
(6) Reduction of expenditures for contractual services overseas, in-cluding expenditures for repairs, alterations, maintenance, etc. Aprogram of directed reductions is now being placed in effect which willassist in stemming the dollar outflow.
(7) Continuing review of dollar expenditures associated with themilitary assistance program and investigation of ways in which theseoverseas expenditures may be reduced.
(8) Rotation (without dependents) of certain deployed air units.During the period 1961-63, defense expenditures abroad were held
relatively constant, in spite of increased deployments during the Berlincrisis, a general increase in the defense budget, and increased price andwage levels in certain overseas areas. Moreover, receipts approxi-mately tripled.
The improvement in receipts was achieved in part because of anintensive worldwide sales effort undertaken by the Department ofDefense in cooperation with U.S. industry. The Federal Republicof Germany agreed to increase purchases in order to offset U.S. defensedollar outlays, which in West Germany currently amount to about$700 million per year, the largest single foreign exchange drain.This agreement was extended to cover the period through calendaryear 1964. Among other things, the agreement provides for a co-operative logistics system for the armed forces of both countries.The Federal Republic of Germany has agreed to increase its militaryprocurement in the United States and utilize American supply lines,depots, and maintenance and support facilities. Italy similarly hasagreed to purchase over $100 million in military equipment from theUnited States as the first step toward offsetting foreign exchangecosts in that country. Negotiations with other nations along thesame lines are continuing.
With respect to defense purchases overseas for use in the UnitedStates, the provisions of the Buy American Act and Executive Order10582 apply. The Buy American Act requires that we buy onlyfrom domestic sources end products to be used in the United States,except where the price of such end products is unreasonable or theiracquisition would be inconsistent with the public interest. ExecutiveOrder 10582 establishes 6 percent, plus duty, as the price differentialbeyond which the price of domestic products will normally be con-sidered unreasonable. It also provides that the head of an agencymay deviate from the general rule on a case-by-case basis when hedeems it in the public interest to do so.
96
PERSPECTIVES AND POLICIES
The Secretary of Defense has directed that procuring activitiesbuying for use in the United States should continue to evaluate bids inaccordance with the provisions of Executive Order 10582. However,when such evaluation indicates that under the prevailing criteria, thereshould be an award for supplies of foreign origin, the case is first re-ferred to the Secretary for decision. This procedure is continuing,pending the results of a Bureau of the Budget study on Governmentprocurement overseas. During fiscal year 1963, approximately $8.3million of procurement normally made overseas was returned to theUnited States at an additional cost of about $2.4 million, or approxi-mately 29 percent.
In the case of military assistance, one of the significant advantagesis that, while this program helps increase the strength of the freeworld, it involves relatively small expenditures affecting balance ofpayments. Within the military assistance program a number of stepshave been taken to reduce further the impact on the U.S. balance ofpayments. Basically, military assistance consists of procurement inthe United States of equipment to be delivered to foreign governments.That procurement, which constitutes the bulk of the military assist-ance program, has no adverse impact on the balance of payments.Therefore, expenditures which enter the balance of payments as aresult of military assistance program activities come from only threesources: (1) equipment procured offshore, (2) the NATO infrastructureprogram, and (3) other expenditures connected with the overseasadministration and operation of the program.
NATO infrastructure is a program for the construction of neededmilitary facilities in the NATO area to which all NATO countries(except Iceland) contribute a share of the costs. Facilities constructedby this program are used by U.S. forces assigned in the NATO areaas well as by other NATO forces. Successful steps have been takento reduce the U.S. share of the cost of these facilities. Since thebeginning of the infrastructure program the U.S. share has droppedfrom 48.10 percent to the present 30.85 percent. It is hoped that theU.S. share will be reduced further during the next round of negotia-itions concerning the cost-sharing formula. In addition, efforts arebeing made to insure the increased participation of U.S. contractorsin bidding for infrastructure contracts.
Including the commitment to infrastructure, expenditures enteringthe balance of payments resulting from military assistance have beendecreasing. If one considers purchases in the United States whichmay in turn be considered a result of "pump priming" from militaryassistance, the fiscal years 1963 and 1964 military assistance programswill be net dollar earners.
Two questions related to overseas expenditures are frequently asked:(1) Why is the United States continuing heavy overseas programs inareas where prosperity has reached new heights? (2) To what extenthas the United States incurred balance-of-payments costs becauseour allies have failed to meet commitments?
With respect to the first question, assistance programs in areassuch as Western Europe and Japan, which have reached new levelsof prosperity, are no longer heavy and constitute a declining percentagein the total military assistance program.
97
PERSPECTIVES AND POLICIES
The European program, as a percentage of the total military assist-ance program, has declined from 38 to 15 percent since 1960. Newcommitments of grant materiel military assistance to the well-devel-oped nations of Western Europe have been discontinued. Theresidual programs filling previously made commitments create orderswith private manufacturers in the United States which exceed thebalance-of-payments cost of fulfilling the U.S. commitments involved.Small training programs and orientation visits have continued in orderto promote the continued compatibility of allied weapons and militarydoctrine and to encourage the purchase of military equipment in theUnited States. These orientation and training programs conductedwith the well-developed nations of Western Europe cost less than 1percent of the orders received for U.S. produced military equipmentfrom these nations.
As for Japan, where the United States is making no new commit-ments to provide materiel as grant military assistance, the followingstatement by Secretary McNamara to the House Subcommittee onForeign Operations in May 1963 is relevant:
The remarkable economic progress made by Japan has made possible a rapidphaseout of military assistance. As recently as fiscal year 1961, the programfor Japan amounted to approximately $76 million; but we have now shifted entirelyto a cost-sharing basis and we are making no new grant aid commitments. Atthe same time, we are urging Japan to make every effort to strengthen the defensesof Japan which she contributes to the defense of the area. The program forfiscal year 1964 is restricted entirely to fulfillment of prior commitments and theseremaining commitments are the cost-sharing projects, mainly in the areas ofantisubmarine warfare and air defense.
In Korea, where the United States has an equally vital defenseinterest, but where resources are more limited, military assistanceresults in an annual balance-of-payments outflow of just over $4million. The main defense dollar outflow in that country is relatedto the maintenance of U.S. forces under the U.N. command. Totaldefense expenditures in Korea entering the international balance ofpayments for fiscal year 1963 amounted to approximately $95 million.
Further to the south, the Republic of China presents another slightlydifferent case. Her balance-of-payments position and general eco-nomic growth are significantly more favorable than Korea's. Defenseexpenditures in Taiwan entering the balance of payments amountedto slightly less than $17 million in fiscal year 1963. However, thisamount does not appear excessive when measured against the impor-tant military and political objectives served by the continuation ofthe U.S. presence and the aid programs in this critical area.
As to the second question posed above, the balance-of-paymentscosts at present are only in a small way attributable to the shortfallsof allies in their commitments to NATO planned force goals, and theUnited States has not, with minor exceptions, oversubscribed its ownforce goals. Requirements for military force contributions to Euro-pean defense have been established by the NATO Military Comn-mittee. These are coordinated by means of the annual review, andgoals are set by common consent.
The United States has subscribed to and met its share of thesegoals and has urged the European members to meet their goals. SomeU.S. combat and other units, excess to U.S. commitments, are sta-tioned in West Germany in direct support of some Federal Republic of
98
PERSPECTIVES AND POLICIES 99
Germany units. Their eventual replacement by Federal Republic ofGermany units, however, is anticipated and their balance-of-paymentscosts are offset in any case through the United States-Federal Republicof Germany offset arrangements referred to above. Deficienciesremaining in allied forces should gradually be rectified through theirown efforts.
With respect to deployments in general, technological developmentsare making possible a higher degree of mobility among all forces. Thelonger range and greater endurance of weapons systems such asPolaris, the range and capacity of new tactical and transport air-craft, the range, capacity, and staying power of the fleets and amphib-ious forces all contribute to a greater capacity to project power swiftlyand in the required degree.
Advances in tactical and transport aircraft design and in ship designare responsible for much added mobility. The increase in U.S. tacticalfighter wings has been matched with increased aerial refueling andferry range, and greater versatility and firepower of the aircraftthemselves. New, long-legged tactical aircraft have the capability oftransoceanic deployment on short notice.'
Another facet of expanding the mobility of U.S. based forces lies inthe projected quadrupling of the strategic airlift fleet capability fromwhat it was at the beginning of 1961. More than 700 LockheedC-130 jetprop transports are on hand or on order. These planes havea capability of carrying 92 men, or 36,000 pounds of cargo, over 2,000miles. It is planned that Lockheed will produce, under an acceleratedprogram based on fiscal year 1964 and prior years' funding, about 66strategic jet C-141 transports, capable of transporting 127 combat-equipped soldiers, or 63,000 pounds of cargo, more than 4,000 miles.The first prototype C-141 is expected to fly in December 1963.
By pre-positioning of heavy divisional equipment at selected sitesabroad, it becomes possible to conserve manpower, yet to deploy morerapidly and to reinforce with combat and service elements those unitson the ground or committed by amphibious means. At present, pre-positioned in Europe is the key equipment for 2 full divisions and 10combat support elements. Such measures will enhance the capacityto respond promptly to threatened aggression.
Greater mobility to the contrary notwithstanding, the Americanpresence in such areas as Western Europe and the Far East mustcontinue for an indefinite period.
3 In addition, the expanded development of foreign designs and the assistance provided under U.S.licensing of large F-104 production programs in Canada, Europe, and Japan make it possible to shift someof the weight and responsibility for local tactical fighters and air defense to our allies.
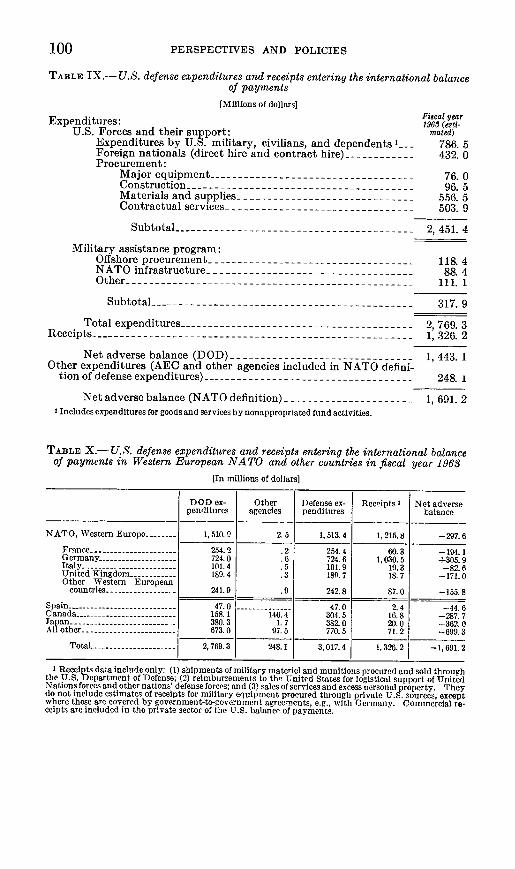
100 PERSPECTIVES AND POLICIES
TABLE IX.- U.S. defense expenditures and receipts entering the international balanceof payments
[Millions of dollars]Fiscal yearExpenditures: 1963 (ear-
U.S. Forces and their support: mated)Expenditures by U.S. military, civilians, and dependents 1 786. 5Foreign nationals (direct hire and contract hire) -432. 0Procurement:
Major equipment -76. 0Construction -96. 5Materials and supplies -556. 5Contractual services -503. 9
Subtotal -2, 451. 4
Military assistance program:Offshore procurement -118. 4NATO infrastructure- 88. 4Other-l i. 1
Subtotal -317. 9
Total expenditures -2, 769. 3Receipts -1, 326. 2
Net adverse balance (DOD)- 1 443. 1Other expenditures (AEC and other agencies included in NATO defini-
tion of defense expenditures) -248. l
Net adverse balance (NATO definition) -1, 691. 2l Includes expenditures for goods and services by nonappropriated fund activities.
TABLE X.-U.S. defense expenditures and receipts entering the international balanceof payments in Western European NATO and other countries in fiscal year 1968
[In millions of dollars]
DOD ex- Other Defense ex- Receipts I Net adversependitures agencies penditures balance
NATO, Western Europe 1, 510. 9 2.5 1,513.4 1,215.8 -297.6
France - - 254. 2 .2 254.4 60.3 -194.1Germany - -724.0 .6 724. 6 1,030. 5 +305. 9Italy - -101.4 .5 101.9 19.3 -82.6United Kingdom-189.4 .3 180 7 18.7 -171. 0Other Western European
countries - 241.9 .9 242.8 87.0 -155.8
Spain - 47.0 -- 47.0 2.4 -44. 6Canada 158.1 146.4 304. 5 16.8 -287. 7Japan -380.3 1. 7 382. 0 20.0 -362. 0All other -673. 0 97. 5 770. 5 71. 2 -699. 3
Total - 2,769.3 248. 1 3,017.4 1,326. 2 -1,691. 2
X Receipts data include only: (1) shipments of military materiel and munitions procured and sold throughthe U.S. Department of Defense; (2) reimbursements to the, United States for logistical support of UnitedNations forces and other nations' defense forces; and (3) sales of services and excess Dersonal property. Theydo not include estimates of receipts for military equip ment procured through private U.S. sources, exceptwhere these are covered by government-to-government agreements, e.g., wvith Germany. Commercial re-ceipts are included in the private sector of the U.S. balance of payments.
PERSPECTIVES AND POLICIES 101
PART VIII
CONCLUSION
In the final analysis, the underlying reason for the maintenance bythe United States of a large and costly defense establishment includingextensive overseas deployments and a substantial military assistanceprogram, is simply this: the most objective assessment that we havebeen able to bring to bear on this problem leads to the conclusionthat the national security self-interest of the United States requiressuch a program. Our experience in the years leading up to two worldwars, and the power of modern weapons, have made it all too clearthat a lack of military preparedness, and a failure to participate inand commit ourselves to the defense of vital overseas areas will almostcertainly be disastrous to our country.
Our forces are in Europe, the Far East and elsewhere not merelyout of a basic common interest in maintaining fundamental freedomsand safeguarding a way of life. They are there out of a sense of needto protect U.S. national interests. In the world of today, when timeand distance have been so compressed, it is almost literally the casethat any major action anywhere is certain to affect U.S. interestsfor good or ill. Thus, the security of the United States is threatenedwhen the independence and stability of distant countries are subjectedto pressures from the expansionist forces of communism.
The contribution of our forces overseas must be measured not merelyin military terms. The political value of the presence of some Ameri-can forces in Korea, in Berlin, and along the eastern borders of WestGermany is equally as important as their purely military value. Thephysical presence of U.S. forces in critical spots is convincing evidenceto our allies of our determination to stand with them in time of crisis.Equally, it warns our enemies, as no other action or series of actionscan, that transgression will meet with U.S. resistance. Our own inter-ests, as well as those of our allies, are served by standing together andmeeting the threat in forward areas rather than by permitting piece-meal nibbling, which would inevitably result in the collapse of the freeworld alliance.
In the latter connection, one point of vital significance is sometimesforgotten. Our national politico-military posture is basically designedto deter war. At the same time we must be prepared to meet aggres-sion at all levels should it occur. This is central to our policy.
Even though we do at times become discouraged with what we mayregard as inadequate contributions by some of our allies to the com-mon cause, there is simply no way for us prudently to evade the bur-dens of leadership, and there is no one else ready to assume theseburdens. We can and will insist upon an equitable sharing of these.The Department of Defense will continue to pursue efforts in conjunc-tion with other agencies to improve the balance-of-payments impactof defense spending. These efforts have been particularly successfulin the European area. We shall continue to seek greater efficiencyin our own organizations and operations, and we shall continue toexhort our allies to increase their efforts along these lines. But thefacts of life appear to leave no alternative to the prospect that the I a.United States must continue to carry the responsibility of free world 1'leadership for a long time to come.
PART IV
BUSINESS CYCLE INFLUENCES IN THE U.S.BALANCE OF PAYMENTS
A. B. HERSEY, Adviser, Division of International Finance,Board of Governors of the Federal Reserve System
103
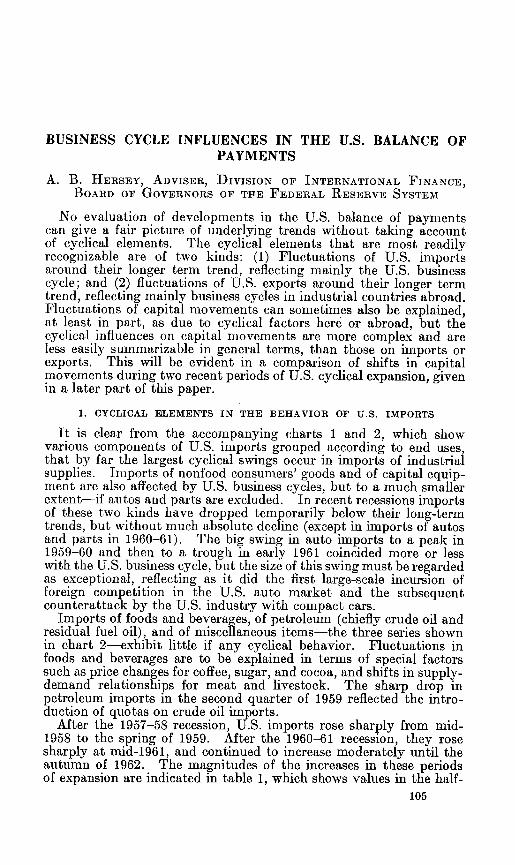
BUSINESS CYCLE INFLUENCES IN THE U.S. BALANCE OFPAYMENTS
A. B. HERSEY, ADVISER, DIVISION OF INTERNATIONAL FINANCE,BOARD OF GOVERNORS OF TFE FEDERAL RESERVE SYSTEM
No evaluation of developments in the U.S. balance of paymentscan give a fair picture of underlying trends without taking accountof cyclical elements. The cyclical elements that are most readilyrecognizable are of two kinds: (1) Fluctuations of U.S. importsaround their longer term trend, reflecting mainly the U.S. businesscycle; and (2) fluctuations of U.S. exports around their longer termtrend, reflecting mainly business cycles in industrial countries abroad.Fluctuations of capital movements can sometimes also be explained,at least in part, as due to cyclical factors here or abroad, but thecyclical influences on capital movements are more complex and areless easily summarizable in general terms, than those on imports orexports. This will be evident in a comparison of shifts in capitalmovements during two recent periods of U.S. cyclical expansion, givenin a later part of this paper.
1. CYCLICAL ELEMENTS IN THE BEHAVIOR OF U.S. IMPORTS
It is clear from the accompanying charts 1 and 2, which showvarious components of U.S. imports grouped according to end uses,that by far the largest cyclical swings occur in imports of industrialsupplies. Imports of nonfood consumers' goods and of capital equip-ment are also affected by U.S. business cycles, but to a much smallerextent-if autos and parts are excluded. In recent recessions importsof these two kinds have dropped temporarily below their long-termtrends, but without much absolute decline (except in imports of autosand parts in 1960-61). The big swing in auto imports to a peak in1959-60 and then to a trough in early 1961 coincided more or lesswith the U.S. business cycle, but the size of this swing must be regardedas exceptional, reflecting as it did the first large-scale incursion offoreign competition in the U.S. auto market and the subsequentcounterattack by the U.S. industry with compact cars.
Imports of foods and beverages, of petroleum (chiefly crude oil andresidual fuel oil), and of miscellaneous items-the three series shownin chart 2-exhibit little if any cyclical behavior. Fluctuations infoods and beverages are to be explained in terms of special factorssuch as price changes for coffee, sugar, and cocoa, and shifts in supply-demand relationships for meat and livestock. The sharp drop inpetroleum imports in the second quarter of 1959 reflected the intro-duction of quotas on crude oil imports.
After the 1957-58 recession, U.S. imports rose sharply from mid-1958 to the spring of 1959. After the 1960-61 recession, they rosesharply at mid-1961, and continued to increase moderately until theautumn of 1962. The magnitudes of the increases in these periodsof expansion are indicated in table 1, which shows values in the half-
105
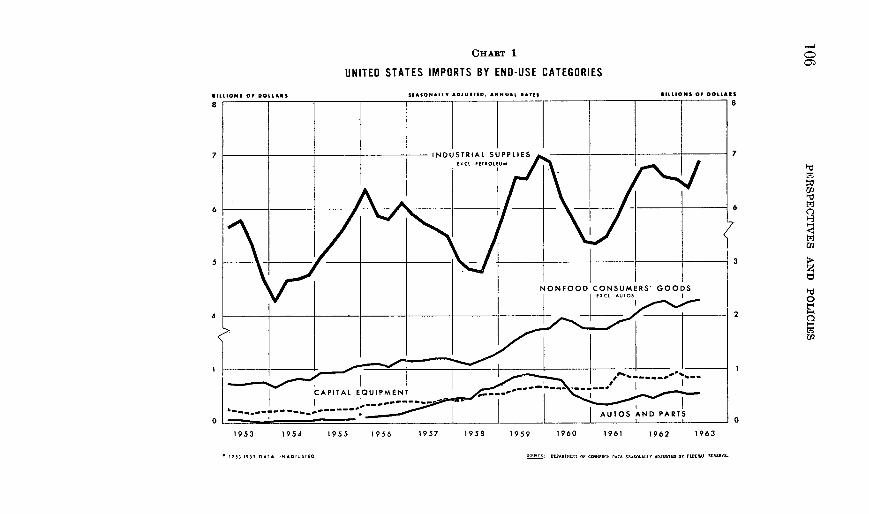
CHART 1
UNITED STATES IMPORTS BY END-USE CATEGORIES
-I*NONAYI A SJUDSTE. ANUAUL -AtES
1953 1954 1955 1956
I 33 I5143 o r UN. DIUSIT 0
1957 1958 1959 1960 1961 1962 1963
TITr-Dc 1 or CASERCI 4*1* sU501ALL A5Jsn1D 55 FDE- - an . - .ER
S11
8
4
Pd
10
-4
mn-Ii
~02
CHART 2
UNITED STATES IMPORTS BY END-USE CATEGORIES
SEAONLLIY ADJUSI... AINUAL -A1T5
I I
so
C,,
0Il4
BILLIONS Of DOLLARS
7 5
4
Pt0
'U00
'-4
b2C$
0
-'
1953 1954 1955 1956 1957 1958 1959 1960 1961 1962 1963
IPSO IFFY CAFA UN- O5USFYS SOL3d UE?*JII or CIIEECL SOYA SLASSOIULL\ A-JUSTID S -ELO. EAS AR-L.
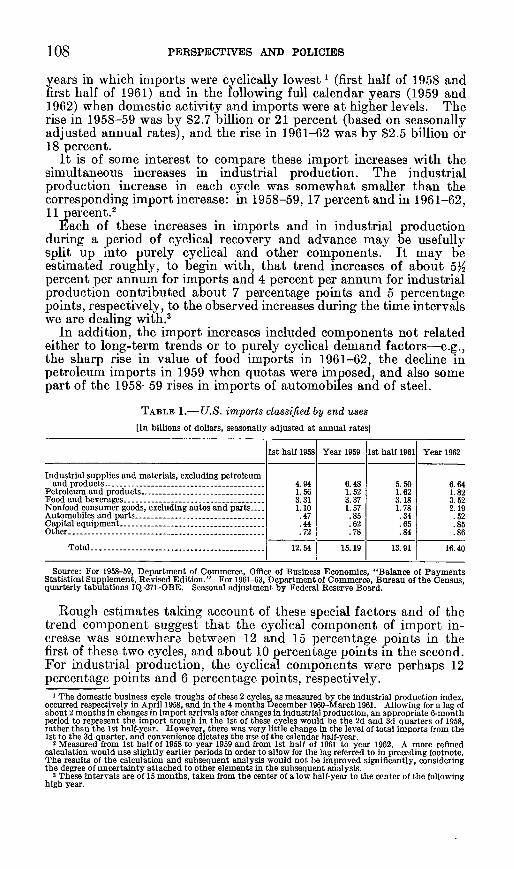
108 PERSPECTIVES AND POLICIES
years in which imports were cyclically lowest I (first half of 1958 andfirst half of 1961) and in the following full calendar years (1959 and1962) when domestic activity and imports were at higher levels. Therise in 1958-59 was by $2.7 billion or 21 percent (based on seasonallyadjusted annual rates), and the rise in 1961-62 was by $2.5 billion or18 percent.
It is of some interest to compare these import increases with thesimultaneous increases in industrial production. The industrialproduction increase in each cycle was somewhat smaller than thecorresponding import increase: in 1958-59, 17 percent and in 1961-62,11 percent.2
lEach of these increases in imports and in industrial productionduring a period of cyclical recovery and advance may be usefullysplit up into purely cyclical and other components. It may beestimated roughly, to begin with, that trend increases of about 5%percent per annum for imports and 4 percent per annum for industrialproduction contributed about 7 percentage points and 5 percentagepoints, respectively, to the observed increases during the time intervalswe are dealing with.'
In addition, the import increases included components not relatedeither to long-term trends or to purely cyclical demand factors-e.g.,the sharp rise in value of food imports in 1961-62, the decline inpetroleum imports in 1959 when quotas were imposed, and also somepart of the 1958-59 rises in imports of automobiles and of steel.
TABLE 1.-U.S. imports classified by end uses
[In billions of dollars, seasonally adjusted at annual rates]
1st half 1958 Year 1959 Ist half 1961 Year 1962
Industrial supplies and materials, excluding petroleumand products -4.94 6.48 5. 50 6.64
Petroleum and products -1. 56 1. 52 1.62 1.82Food and beverages -3.31 3.37 3.18 3.52Nonfood consumer goods, excluding autos and parts.- 1.10 1. 57 1.78 2.19Automobiles and parts -. 47 .85 .34 .52Capital equipment -. 44 .62 .65 .85Other -. 72 .78 .84 .86
Total -12.54 15.19 13.91 16.40
Source: For 1958-59, Department of Commerce, Office of Business Economics, "Balance of PaymentsStatistical Supplement, Revised Edition." For l961-63, Department of Commerce, Bureau of the Census,quarterly tabulations IQ-271-OBE. Seasonal adjustment by Federal Reserve Board.
Rough estimates talking account of these special factors and of thetrend component suggest that the cyclical component of import in-crease was somewhere between 12 and 15 percentage points in thefirst of these two cycles, and about 10 percentage points in the second.For industrial production, the cyclical components were perhaps 12percentage points and 6 percentage points, respectively.
I The domestic business cycle troughs of these 2 cycles as measured by the industrial production index,occurred respectively in April 1958, and in the 4 months December 1960-March 1961. Allowing for a lag ofabout 2 months in changes in import arrivals after changes in industrial production, an appropriate 6-monthperiod to represent the import trough in the 1st of these cycles would be the 2d and 3d quarters of 1958,rather than the 1st half-year. However, there was very little change in the level of total imports from the1st to the 3d quarter, and convenience dictates the use of the calendar half-year.
2 Measured from Ist half of 1958 to year 1959 and from 1st half of 1961 to year 1962. A more refinedcalculation would use slightly earlier periods in order to allow for the lag referred to in preceding footnote.The results of the calculation and subsequent analysis would not be improved significantly, consideringthe degree of uncertainty attached to other elements in the subsequent analysis.
3 These intervals are of 15 months, taken from the center of a low half-year to the center of the followinghigh year.
PERSPECTIVES AND POLICIES
All estimates of this sort, attempting to distinguish between theeffects of trend, cycle, and special factors, are necessarily somewhatarbitrary. First, it is difficult to establish meaningful trend rates ofgrowth over short periods of time. Second, it is difficult to distinguishsharply between cyclical changes in imports and those ascribable tospecial factors. Two examples of the second of these difficulties aregiven by the 1958-59 experience. First, some part of the rise inautomobile imports at that time, but not all of it, may be classifiedas special rather than cyclical, for reasons indicated earlier. Second,the $1.5 billion rise in the annual rate of imports of industrial suppliesexcluding petroleum from the first half of 1958 to the year 1959 in-cluded, besides a small trend component and an important cyclicalelement for materials other than steel, a rise of $0.4 billion in importsof steelmill products the classification of which as cyclical or as specialis almost impossible to settle, especially in the absence of any gooddata on domestic steel consumption and inventories. Clearly, somepart of the wave of steel imports in late 1958, 1959, and early 1960contributed to the net buildup of domestic steel inventories that cer-tainly occurred over that period, and to this extent should be regardedas cyclical. But some part took the place of domestic steel outputlost during the steel strike of 1959 and not fully made up for by highproduction before and after the strike; this element of the import waveshould be regarded as special. The difficulty of splitting 1959 steelimports into these two categories is the reason for estimating the 1958-59 cyclical element of import increase in terms of a wide range (12 to15 percentage points).
This analysis, imperfect as it is, leads to a tentative conclusionthat in the last two business cycle periods of recovery and advancethe purely cyclical elements of increase in total imports were some-what more than proportionate to the cyclical elements of increasein industrial production. When attention is directed to imports ofindustrial supplies excluding petroleum (chart 1), where the bulk ofthe cyclical rise in imports is to be found, it is immediately obviousthat in this sector the cyclical element of import increase, in each ofthe last two cycles, was much more than proportionate to the cyclicalelement of increase in industrial production, being of the order ofmagnitude of 20 to 25 percent in the 1958-59 period and again some-thing like 20 percent in the 1961-62 period.
The explanation of this pattern of behavior lies undoubtedly inthe behavior of inventories during U.S. business cycles, coupled withthe fact that imports of materials provide a quick way of supple-menting domestic production of materials, and so of maintainingsupply-demand equilibrium, at times when demand rises rapidlyeither for materials that will go to raise inventories or for materialsbeing consumed more rapidly, the domestic output of which cannotbe economically expanded quickly enough.
Inventory behavior, both in the cycle of U.S. industrial productionand in the cycle of imports, involves not only upswings but also down-swings. Each phase of the cycle conditions the subsequent one. Theobserved upswings in flows of production and imports in the past twocycles reflect not only the typically more-than-normal inventorybuildup during the later part of a recovery phase, but also the factthat around the trough of the cycle inventories were being run down.
109
PERSPECTIVES AND POLICIES
The greater the previous downswing, the more likely it was to havecarried production or imports on down below sustainable trend levelsof flow. Then in the subsequent recovery period production andimports have to rise enough to regain their trend levels and to bringto a halt the rundown of inventories, and then enough more to rees-tablish an equilibrium level of inventories, even if no fresh buildupof inventories to above-normal levels occurs.
These observations on the conditioning of an upswing by the down-swing that preceded it may have an important application in under-standing developments in 1963. Much of the 1961-62 upswing indomestic production and imports served to bring flows up to equilib-rium levels, without involving large inventory accumulation. Thisis reflected in the fact that the change in total nonfarm businessinventories during 1962, as measured in the GNP accounts, was only0.9 percent of 1962 GNP, whereas in 1959 the corresponding ratiowas over 1.3 percent and in 1955 about 1.4 percent. This favorablecomparison results in turn partly from the fact that in 1962 U.S.industrial production leveled out in the second half of the year, whilefinal sales continued to rise. Tendencies toward overexpansion ofinventories that had been beginning to develop in the first half of1962 were halted early enough to avoid the ripening of a cyclicalposition that might have led later to a full recession.
Thus the situation in the latter part of 1962 and early 1963 was thatthe earlier upswing was not continuing, but no recession was develop-ing. Inventory buildup was in general not far from long-term normalneeds. U.S. imports were relatively level (see charts 1 and 2), withcontinuing uptrends in several categories of imports, and with somenonsignificant though rather marked fluctuations in imports of foods.A new upswing in production and imports from such a position mightdiffer markedly from the upswings of 1958-59 and 1961-62, andmight conform much more closely with balanced rates of growth thanthose upswings did, and might include much less of a purely cyclicalcomponent.
If we turn away from the consideration of purely cyclical elements ofchange in imports to the broader matter of the total change in importsduring a period in which cyclical recovery and advance is superim-posed on longer term growth, the question of longer term growthrates assumes importance. In the changes from first half of 1958 toyear 1959 and from first half of 1961 to year 1962 (table 1), the trendelement of increase in imports appears to have been close to $1 billionin each instance (at a rate of say $750 million per annum, or about5~ percent per annum).
In percentage terms the trend increases for imports of industrialmaterials (table 1 and chart 1) were quite moderate, and were perhapseven smaller than the 4 percent per annum trend rate of increasewe have postulated for industrial production during those periods.In value terms, these trend increases were of the order of $200 millionin each of the two periods of upswing.
Other categories of imports rose in total by a little more than$1 billion in the 1958-59 advance, and by about $1% billion in 1961-62. These other categories are less cyclically sensitive than theimports of materials, but some of them do tend to rise more rapidlyduring a period of general expansion in the domestic economy thanat other times, so that a (minor) part of these total increases may be
110
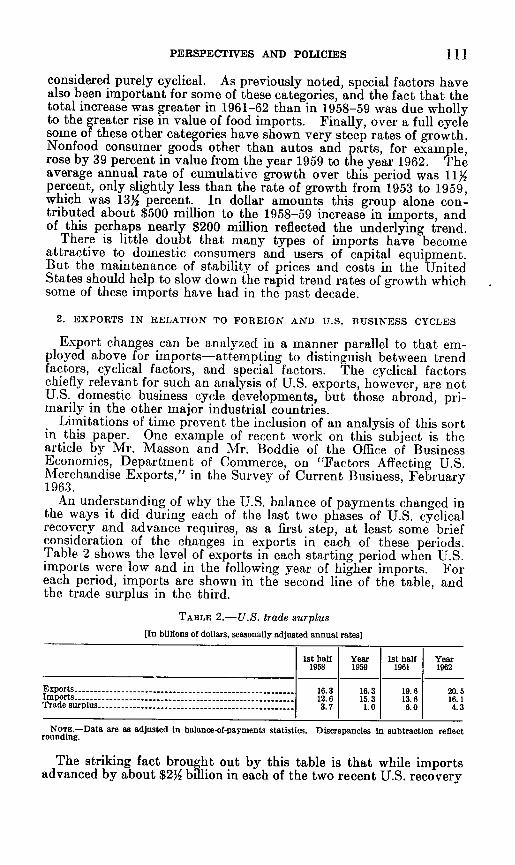
PERSPECTIVES AND POLICIES 111
considered purely cyclical. As previously noted, special factors havealso been important for some of these categories, and the fact that thetotal increase was greater in 1961-62 than in 1958-59 was due whollyto the greater rise in value of food imports. Finally, over a full cyclesome of these other categories have shown very steep rates of growth.Nonfood consumer goods other than autos and parts, for example,rose by 39 percent in value from the year 1959 to the year 1962. Theaverage annual rate of cumulative growth over this period was 11percent, only slightly less than the rate of growth from 1953 to 1959,which was 133 percent. In dollar amounts this group alone con-tributed about $500 million to the 1958-59 increase in imports, andof this perhaps nearly $200 million reflected the underlying trend.
There is little doubt that many types of imports have becomeattractive to domestic consumers and users of capital equipment.But the maintenance of stability of prices and costs in the UnitedStates should help to slow down the rapid trend rates of growth whichsome of these imports have had in the past decade.
2. EXPORTS IN RELATION TO FOREIGN AND U.S. BUSINESS CYCLES
Export changes can be analyzed in a manner parallel to that em-ployed above for imports-attempting to distinguish between trendfactors, cyclical factors, and special factors. The cyclical factorschiefly relevant for such an analysis of U.S. exports, however, are notU.S. domestic business cycle developments, but those abroad, pri-marily in the other major industrial countries.
Limitations of time prevent the inclusion of an analysis of this sortin this paper. One example of recent work on this subject is thearticle by Mr. Masson and Mr. Boddie of the Office of BusinessEconomics, Department of Commerce, on "Factors Affecting U.S.Merchandise Exports," in the Survey of Current Business, February1963.
An understanding of why the U.S. balance of payments changed inthe ways it did during each of the last two phases of U.S. cyclicalrecovery and advance requires, as a first step, at least some briefconsideration of the changes in exports in each of these periods.Table 2 shows the level of exports in each starting period when U.S.imports were low and in the following year of higher imports. Foreach period, imports are shown in the second line of the table, andthe trade surplus in the third.
TABLE 2.-U.S. trade surplus[In billions of dollars, seasonally adjusted annual rates]
1st half Year 1st half Year1958 1959 1961 1962
Exports -16.3 16.3 19.6 20.5Im ports -------------------------------------------- 12.6 15.3 13.6 16.1Trade surplus -3.7 1.0 6.0 4.3
NOTE.-Data are as adjusted in balance-of-payments statistics. Discrepancies in subtraction reflectrounding.
The striking fact brought out by this table is that while importsadvanced by about $2% billion in each of the two recent U.S. recovery
112 PERSPECTIVES AND POLICIES
phases, the trade balance deteriorated much more in 1958-59 (by $2.7billion) than it did in 1961-62 ($1.7 billion). This was because U.S.exports were virtually unchanged in the year 1959 from what theyhad been in the first half of 1958, whereas in 1962 they were almost$1 billion larger than they had been in the first half of 1961. (Thetable also shows that in the interval between 1959 and the first halfof 1961 U.S. exports advanced sharply while U.S. imports were de-clining, producing a sharp rise in the U.S. export surplus during thelast stage of the rising phase of the U.S. cycle and the subsequentrecession of 1960-61.)
In 1958-59, other industrial countries were in a phase of stable totaldemand, with clear signs of recession in certain industries such assteel and textiles until recovery began early in 1959. Europeanbusiness cycles were clearly out of phase with the U.S. cycle, withlags behind the U.S. cycle averaging about three-quarters of a year atthe point of upturn. For this reason U.S. exports reached a lowpoint in the early months of 1959. The subsequent recovery ledfinally to much higher U.S. exports in 1960, but the total for the year1959, as already noted, was no higher than the rate in the first half of1958.
In the next U.S. recovery phase, from the first half of 1961 to theyear 1962, U.S. exports were rising, though not as rapidly as in theinterval from 1959 to 1960.
British import demand was more or less level in 1961-62, after agreat bulge in British import buying in 1960. Japanese import de-mand, too, was diminishing temporarily after its very rapid expansionbetween mid-1959 and mid-1961. In these two countries the businesscycle was sharply out of phase with the U.S. cycle, with downturnssetting in in 1961 not very long after recovery started here. On theEuropean Continent, however, the long period of expansion of indus-trial activity that began in 1959 continued throughout 1961 and untilthe latter part of 1962. These developments, together with the Ca-nadian cyclical recovery in 1961-62, and also a rise in outflow of U.S.private and Government capital to countries other than those of West-ern Europe, Japan, and Canada, help to explain why U.S. exportscontinued to rise from early 1961 into 1962, though only moderately,and why much of this rise was concentrated in exports to the less indus-trialized countries.
Besides the foreign cyclical factors briefly touched on in the pre-ceding paragraphs, another factor affecting U.S. exports in 1958-59and 1961-62 deserves mention. This is the changing internationalcompetitive position. Unquestionably, over a period of several yearsup to 1959 the competitive position of the United States was weaken-ing, relative to the European countries and Japan. This was the wayrelative costs and prices were moving at the time of the severe dropin U.S. exports from 1957 to 1958, and it was still the way they weremoving during the 1958-59 cyclical recovery.
In contrast, since 1959 relative changes in money wage levels anddomestic price levels here and abroad have been in a direction favor-able for the U.S. position. However, productivity gains are beingachieved in foreign countries as well as in the United States, andparticularly in their exporting industries. Unfortunately there is nogood statistical basis for judging what the net effects have been oncosts for export-competing and import-competing goods here and
PERSPECTIVES AND POLICIES
abroad. Statistics on productivity gains are too broad in their cover-age, and statistics on export prices (or unit values) are in many casesvery imperfect and even when reliable they do not provide evidenceabout the profitability of production and the incentives to push exportsales efforts.
Finally, it is difficult to establish from the trade statistics them-selves that the United States has yet regained much of the groundthat had been lost by the worsening of relative cost levels up to 1959.This difficulty arises partly from the difficulty of establishing clearlywhat part of U.S. export changes should be ascribed to cyclical andspecial factors. Attempts at measuring cyclical changes are oftensimplified by assuming that the long-term trend is a straight line.But this simply begs the question, and takes the analysis round in acircle. The key question, to which no satisfactory answer is yetavailable, is whether the long-term trend line of U.S. exports has orhas not begun in recent years to tilt upward a little more than it wasdoing in the 1950's when the competitive position of the United Stateswas clearly worsening.
3. CAPITAL MOVEMENTS, THE TRADE BALANCE, AND PRESSURE ONU.S. GOLD RESERVES
It has been found in past years that when domestic business activityrises, the cyclical shrinkage in the trade surplus is sometimes ac-companied by a shrinkage in the net outflow of private capital forshort-term or long-term investment. Experience in the two latestU.S. cyclical recovery phases is shown in table 3. In each case,comparisons are made between annual rates of trade and capital flowbalances in the first half of a calendar year (1958 and 1961, respec-tively), when imports were cyclically depressed, and the correspondingbalances in the subsequent full year (1959-62) when domestic activityand imports had reached higher levels.
The 1958-59 expansion phase gives an excellent example of off-setting changes in trade and capital balances. The shrinkage ofthe trade balance, by $2.7 billion, between the first half of 1958(annual rate) and the year 1959 was counterbalanced to the extent of$1.8 billion by a decline in net outflow of private capital other thanforeign private liquid funds. If the increased inflow of foreignprivate liquid funds is also counted, the shrinkage of the trade balancewas fully offset.
But in the next cyclical recovery and expansion period, 1961-62the results were quite different. The trade balance declined by$1.7 billion, but there was no decline at all in the balance of long-term and short-term private capital excluding movements of foreignprivate liquid funds. And foreign private liquid funds, which hadbeen flowing in during the first half of 1961, showed no net movementover the full year 1962. The result of these changes in trade andprivate capital movements combined was to put a much greater poten-tial pressure on U.S. gold reserves in 1962 than in the first half of1961. This pressure was met, however, by special Governmenttransactions which held down the accumulation of foreign officialreserves that might have been converted to gold.
113
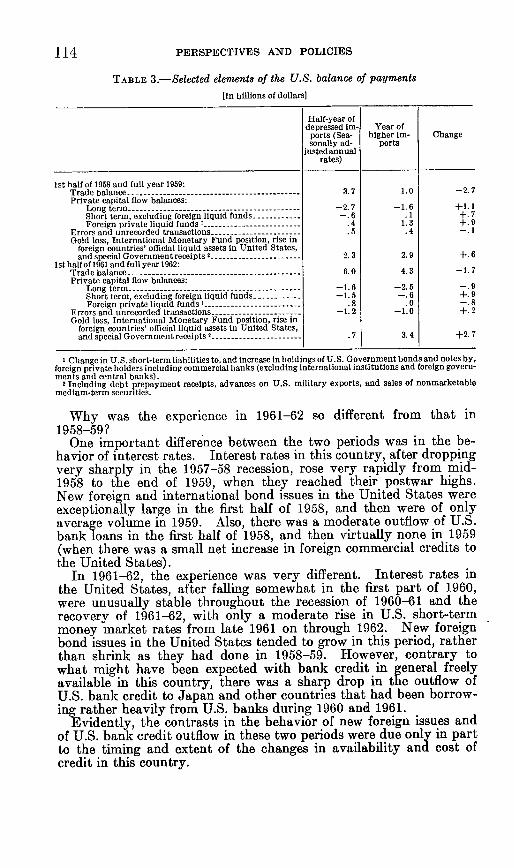
114 PERSPECTIVES AND POLICIES
TABLE 3.-Selected elements of the U.S. balance of payments
[In billions of dollars]
Half-year ofdepressed im- Year ofports (Sea- higher im- Changesonally ad- ports
justedannualrates)
Ist half of 1958 and full year 1959:Trade balance ------------------ 3.7 1.0 -2.7Private capital flow balances:
Long term -- 2. 7 -1.6 +1.1Short term, excluding foreign liquid funds --. 6 .1 +. 7Foreign private liquid funds -. 4 1.3 +. 9
Errors and unrecorded transactions -. 5 4 I.Gold loss, International Monetary Fund position, rise in
foreign countries' official liquid assets in United States,and special Government receipts 2_ _---------------------- 2. 3 2.9 +. 6
Ist half of 1961 and full year 1962:Trade balance -6.0 4. 3 -1. 7Private capital flow balances:
Long term -- 1.6 -2.5 -. 9Short term, excluding foreign liquid funds -- 1.5 -. 6 +. 9Foreign private liquid funds
1- .8 .0 -. 8Errors and unrecorded transactions -- 1. 2 -1.0 +.2Gold loss, International Monetary Fund position, rise in
foreign countries' official liquid assets in United States,and special Government receipts 2_ ....................... 7 3. 4 +2. 7
I Change in U.S. short-term liabilities to, and increase in holdings of U.S. Govemment bonds and notes by,foreign private holders including commercial banks (excluding international institutions and foreign govern-ments and central banks).
2 Including debt prepayment receipts, advances on U.S. military exports, and sales of nonmarketablemedium-term securities.
Why was the experience in 1961-62 so different from that in1958-59?
One important difference between the two periods was in the be-havior of interest rates. Interest rates in this country, after droppingvery sharply in the 1957-58 recession, rose very rapidly from mid-1958 to the end of 1959, when they reached their postwar highs.New foreign and international bond issues in the United States wereexceptionally large in the first half of 1958, and then were of onlyaverage volume in 1959. Also, there was a moderate outflow of U.S.bank loans in the first half of 1958, and then virtually none in 1959(when there was a small net increase in foreign commercial credits tothe United States).
In 1961-62, the experience was very different. Interest rates inthe United States, after falling somewhat in the first part of 1960,were unusually stable throughout the recession of 1960-61 and therecovery of 1961-62, with only a moderate rise in U.S. short-termmoney market rates from late 1961 on through 1962. New foreignbond issues in the United States tended to grow in this period, ratherthan shrink as they had done in 1958-59. However, contrary towhat might have been expected with bank credit in general freelyavailable in this country, there was a sharp drop in the outflow ofU.S. bank credit to Japan and other countries that had been borrow-ing rather heavily from U.S. banks during 1960 and 1961.
Evidently, the contrasts in the behavior of new foreign issues andof U.S. bank credit outflow in these two periods were due only in partto the timing and extent of the changes in availability and cost ofcredit in this country.
PERSPECTIVES AND POLICIES
Further effects of interest rates may be seen in movements ofliquid funds other than U.S. bank credit. In neither of the periodsbeing considered were the movements of U.S. corporation funds intoshort-term foreign currency assets particularly large or changingmuch; the principal outflow of this kind in recent years occurred inthe second half of 1960, after wide spreads had opened up for a whilebetween short-term money market rates abroad and those in thiscountry. But there was a sharp contrast between the two periods1958-59 and 1961-62 in the behavior of foreign private holdings ofliquid assets in the United States. In 1959, when some foreigncountries were encouraging their commercial banks to enlarge theirholdings of liquid dollar assets, there was a sharp inflow into foreignprivate short-term investments in the United States. In contrast,between the first half of 1961 and the year 1962 such inflows diminishedsharply, partly in consequence of a rising tendency of interest ratesin European centers on dollar deposits and loans in the so-calledEuro-dollar market.
Finally, contrasts between the two periods in the movements ofequity capital, included in table 3 in the figures for long-term capital,were also important. The outflow of U.S. direct investments abroaddid not vary much. But foreign purchases of U.S. common stockswere stimulated in 1959, when U.S. imports were high, by the sharprise in the U.S. stock market which at that time was still reflectingpersistent expectations of longrun inflation in the United States.In 1961-62, however, strength in the U.S. stock market in anticipationof economic recovery and expansion brought in relatively heavyforeign purchases in the first half of 1961 when U.S. imports werelow. In 1962, foreign purchases of U.S. common stocks were muchsmaller.
The complexity of factors influencing private capital movementsout of or into the United States indicates that we cannot count onhaving automatic offsets in the capital account of the balance ofpayments to each and every rise in U.S. imports or decline in the U.S.trade surplus. What will happen in a particular period depends onthe particular circumstances at the starting point and thereafter.Three features of the flows in the fourth quarter of 1962 and firstquarter of 1963 are now of particular interest.
First, new foreign security issues in the United States (net of foreignparticipations) were at a very high annual rate of nearly $2 billion inthese two recent quarters, mainly as a result of unusually largeCanadian borrowings. This rate of outflow was about three timesas large as the average annual outflow in 1957-61.
Second, foreign purchases of U.S. common stocks, and also foreigndirect investments in the United States, were at a very low level inthe two recent quarters, together less than $0.1 billion at an annualrate. This compares with an annual average inflow during 1959-61of over $0.4 billion, and heavier rates of inflow during some shorterperiods of time.
Third, net outflows of U.S. short-term and medium-term bankcredit were very low in this 6-month period, only about $0.2 billionat an annual rate. This compares with an outflow of more than $1billion in 1961.
l1a
PART V
WILL GROWTH END THE PAYMENTS DEFICIT:
THE LESSONS OF PAST EXPERIENCE
ByJACK C. ROTHWELL, Economist, Federal Reserve
Bank of Philadelphia
117
WILL GROWTH END THE PAYMENTS DEFICIT: THELESSONS OF PAST EXPERIENCE
JACK C. ROTHWELL, ECONOMIST, FEDERAL RESERVE BANK OFPHILADELPHIA I
During 12 of the past 13 years the United States has sustained adeficit in its international balance of payments. The deficits haveamounted to a total of $26 billion. To finance this sum we havetransferred $8 billion in gold to foreigners and have increased ourliquid liabilities by $18 billion.
The policies undertaken to relieve the deficit have ranged all theway from Government-sponsored programs to expand exports to adecrease in the dollar value of duty-free goods that American touristsmay bring in from abroad. Yet still the deficit has continued.
In recent months a relatively new balance-of-payments hypothesishas gained widespread acceptance: that the deficit can be relievedthrough an acceleration in the rate of economic growth in this Nation.In this paper we examine the degree of confidence which might beaccorded this hypothesis on the basis of past experience with growthand the balance of payments.
REASONING BEHIND THE GROWTH HYPOTHESIS
The rationale behind the growth proposition concerns both theinternational capital and trade transactions between this country andforeign nations. It is reasoned, first of all, that more rapid economicgrowth in the United States will make this Nation more attractive toforeign and domestic investors, more attractive because acceleratinggrowth will create a greater demand for capital and a rise in profitsand interest rates. Greater demand for capital and higher profitsand interest rates will cause both domestic and foreign investors tochannel more of their funds into U.S. investments-into new plantand equipment, purchases of stocks and bonds, and into short-terminvestments, such as Treasury bills. The increased investment athome, it is reasoned, will mean a reduction of investment fundsflowing abroad, funds that reached a $3.3 billion total last year.
It is also reasoned that accelerating economic growth would havefavorable effects on our trade position. A higher growth rate, theargument goes, would increase income and demand for goods. Greaterdemand for goods would increase production from present levels,thereby doing two things: (a) Cutting unit costs of production and(b) providing more profits so business could modernize plant andequipment, thus further cutting costs. This double-edged decrease incosts would help both our export industries and our import-threatenedindustries to compete with foreign goods.
It is recognized that the rise in incomes created by a hike in thegrowth rate will mean an increase in imports and thus an increasedoutflow of dollars for imported goods. But the growth proposition
I The views expressed here are solely those of the author. They do not necessarily reflect the thinking ofofficials within the Federal Reserve Bank of Philadelphia.
119
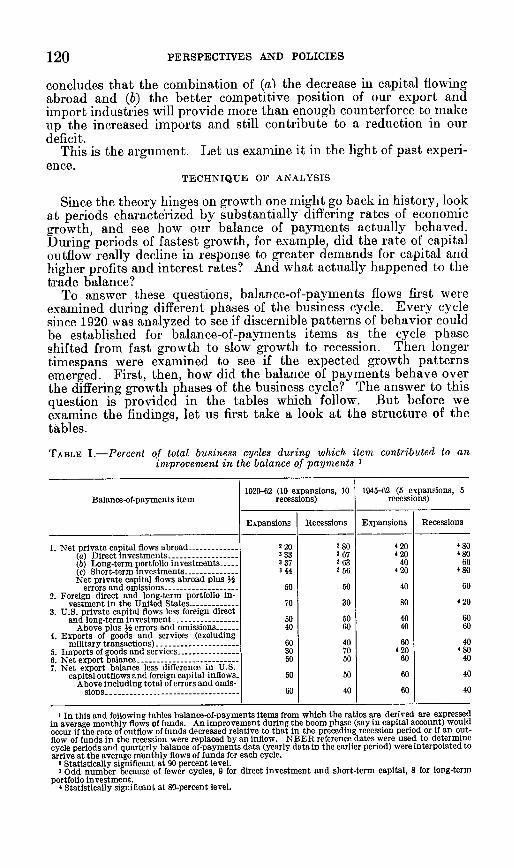
120 PERSPECTIVES AND POLICIES
concludes that the combination of (a) the decrease in capital flowingabroad and (b) the better competitive position of our export andimport industries will provide more than enough counterforce to makeup the increased imports and still contribute to a reduction in ourdeficit.
This is the argument. Let us examine it in the light of past experi-ence.
TECHNIQUE OF ANALYSIS
Since the theory hinges on growth one might go back in history, looka.t periods characterized by substantially differing rates of economicgrowth, and see how our balance of payments actually behaved.During periods of fastest growth, for example, did the rate of capitaloutflow really decline in response to greater demands for capital andhigher profits and interest rates? And what actually happened to thetrade balance?
To answer these questions, balance-of-payments flows first wereexamined during different phases of the business cycle. Every cyclesince 1920 was analyzed to see if discernible patterns of behavior couldbe established for balance-of-payments items as the cycle phaseshifted from fast growth to slow growth to recession. Then longertimespans were examined to see if the expected growth patternsemerged. First, then, how did the balance of payments behave overthe differing growth phases of the business cycle? The answer to thisquestion is provided in the tables which follow. But before weexamine the findings, let us first take a look at the structure of thetables.
TABLE I.-Percent of total business cycles during which item contributed to animprovement in the balance of payments 1
1920-62 (10 expansions, 10 1945-62 (5 expansions, 5Balance-of-payments item recessions) recessions)
Expansions Recessions Expansions Recessions
1. Net private capital flows abroad 2 20 2 80 4 20 4 80(a) Direct investments -3 33 3 67 4 20 4 80(b) Long-term portfolio investments 3 37 63 40 60(c) Short-term investments- 3 44 56 4 20 4 80Net private capital flows abroad plus 53
errors and omissions - - 50 50 40 602. Foreign direct and long-term portfolio in-
vestment in the United States.. 70 30 80 4 203. U.S. private capital flows less foreign direct
and long-term investment - - 50 50 40 60Above plus 3 errors and omissions 40 60 40 60
4. Exports of goods and services (excludingmilitary transactions) - -60 40 60 40
5. Imports of goods and services - -30 70 4 20 4 806. Net export balance - - 50 50 60 407. Net export balance less difference in U.S.
capital outflows and foreign capital inflows 50 10 60 40Above including total of errors and omis-
sions - -60 40 60 40
I In this and following tables balance-of-payments items from which the ratios are derived are expressedin average monthly flows of funds. An improvement during the boom phase (say in capital account) wouldoccur if the rate of outflow of funds decreased relative to that in the preceding recession period or if an out-flow of funds in the recession were replaced by an inflow. NBER reference dates were used to determinecycle periods and quarterly balance of-payments data (yearly data in the earlier period) were interpolated toarrive at the average monthly flows of funds for each cycle.
2 Statistically significant at 90 percent level.3 Odd number because of fewer cycles, 9 for direct investment and short-term capital, 8 for long-term
portfolio investment.4 Statistically significant at 80-percent level.
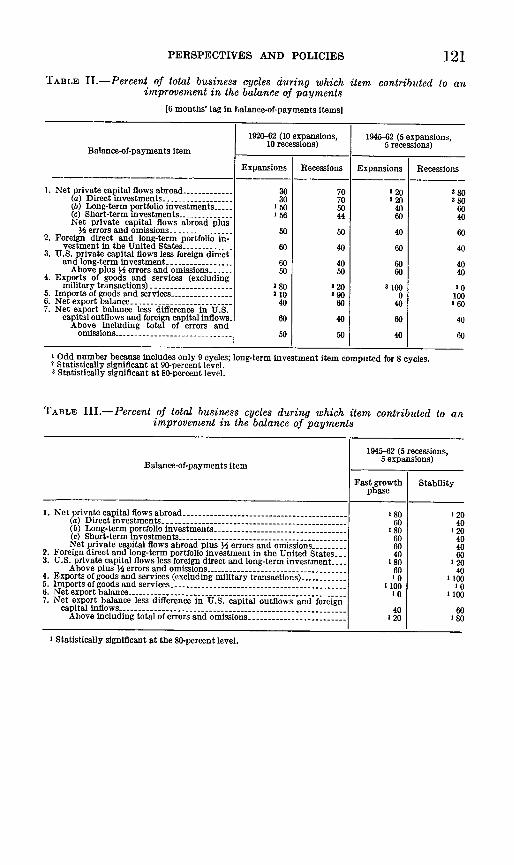
PERSPECTIVES AND POLICIES 121TABLE 11.-Percent of total business cycles during which item contributed to an
improvement in the balance of payments
16 months' lag in halance-of-payrnents items]
Balance-of-payments item
1. Net private capital flows abroad(a) Direct investments(b) Long-term portfolio investments.---(c) Short-term investments- - -Net private capital flows abroad plus
14 errors and omissions2. Foreign direct and long-term portfolio in-
vestment in the United States-3. U.S. private capital flows less foreign direct
and long-term investmentAbove plus 14 errors and omissions
4. Exports of goods and services (excludingmilitary transactions)
5. Imports of goods and services6. Net export balance-7. Net export balance less difference in U.S.
capital outflows and foreign capital inflowsAbove including total of errors and
omissions
1920-62 (10 expansions,10 recessions)
Expansions
3030
120'56
50
60
6050
2 80210
40
60
50
Recessions
707000
44
50
40
4050
220290
60
40
50
1945-62 (5 expansions,5 recessions)
Expansions
3203 20
4060
40
60
6060
3 1000
40
60
40
Recessions
8603 So
6040
60
40
4040
301003 60
40
60
I Odd number because includes only 9 cycles; long-term investment item computed for 8 cycles.2 Statistically significant at 90-percent level.a Statistically significant at 80-percent level.
TABLE III.-Percent of total business cycles during which item contributed to animprovement in the balance of payments
1945-62 (5 recessions,Balance-of-payments item 5 expansions)
Fast growth Stabilityphase
1. Net private capital flows abroad - - 180 20(a) Direct investments -60 40(b) Long-term portfolio investments -1 80 20(c) Short-term investments-60 40Net private capital flows abroad plus Zi errors and omissions 60 40
2. Foreign direct and long-term portfolio investment in the United States - 40 603. U.S. private capital fows less foreign direct and long-term investment . 1 80 1 20
Above plus 14 errors and omissions-60 404. Exports of goods and services (excluding military transactions) 10 11005. Imports-of goods-and services 1100 I 06. Net export balance 1007. Net export balance less difference in U.S. capital outflows and foreign
capital inflows -40 60Above including total of errors and omissions- 1 20 X so
I Statistically significant at the 80-percent level.
I
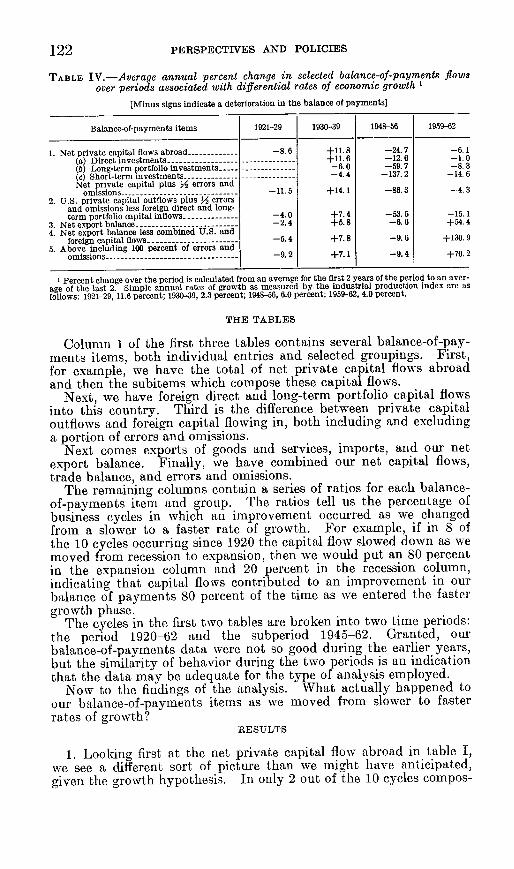
PERSPECTIVES AND POLICIES
TABLE IV.-Average annual percent change in selected balance-of-payments flowsover periods associated with differential rates of economic growth '
[Minus signs indicate a deterioration in the balance of payments]
Balance-of-payments items 1921-29 1930-39 1948-56 1959-62
1. Net private capital flows abroad - - -8.6 +11.8 -24. 7 -6.1(a) Direct investments- +11.6 -12. 6 -1. 0(b) Long-term portfolio investments -- 6.0 -59. 7 -8. 3(c) Short-term investments -- 4.4 -137. 2 -14. 6Net private capital plus A' errors and
omissions -- 11.5 +14.1 -86.3 -4.32. U.S. private capital outflows plus M errors
and omissions less foreign direct and long-term portfolio capital inflows -- 4.0 +7.4 -53. 5 -15.1
3. Net export balance -- 2.4 +5.8 -6. 6 +54. 44. Net export balance less combined U.S. and
foreign capital flows- -5.4 +7.8 -9.6 +130.95. Above including 100 percent of errors and
omissions -- 9.2 +7.1 -9.4 +70. 2
1 Percent change over the period is calculated from an average for the first 2 years of the period to an aver-age of the last 2. Simple annual rates of growth as measured by the industrial production index are asfollows: 1921-29, 11.6 percent; 1930-39, 2.3 percent; 1948-56, 6.0 percent; 1959-62, 4.0 percent.
THE TABLES
Column 1 of the first three tables contains several balance-of-pay-ments items, both individual entries and selected groupings. First,for example, we have the total of net private capital flows abroadand then the subitems which compose these capital flows.
Next, we have foreign direct and long-term portfolio capital flowsinto this country. Third is the difference between private capitaloutflows and foreign capital flowing in, both including and excludinga portion of errors and omissions.
Next comes exports of goods and services, imports, and our netexport balance. Finally, we have combined our net capital flows,trade balance, and errors and omissions.
The remaining columns contain a series of ratios for each balance-of-payments item and group. The ratios tell us the percentage ofbusiness cycles in which an improvement occurred as we changedfrom a slower to a faster rate of growth. For example, if in 8 ofthe 10 cycles occurring since 1920 the capital flow slowed down as wemoved from recession to expansion, then we would put an 80 percentin the expansion column and 20 percent in the recession column,indicating that capital flows contributed to an improvement in ourbalance of payments 80 percent of the time as we entered the fastergrowth phase.
The cycles in the first two tables are broken into two time periods:the period 1920-62 and the subperiod 1945-62. Granted, ou-balance-of-payments data were not so good during the earlier years,but the similarity of behavior during the two periods is an indicationthat the data may be adequate for the type of analysis employed.
Now to the findings of the analysis. What actually happened toour balance-of-payments items as we moved from slower to fasterrates of growth?
RESULTS
1. Looking first at the net private capital flow abroad in table I,we see a different sort of picture than we might have anticipated,given the growth hypothesis. In only 2 out of the 10 cycles compos-
122
PERSPECTIVES AND POLICIES
ing the 1920-62 period (and also in only 20 percent of the postwarcycles) was our balance of payments better off in the fast growth orexpansion phase than it was in the recession phase.
2. Looking next at the items composing our net private capital flowabroad, we see that all (including short-term capital flows) contrib-uted to an improvement more often in recessions than in the accom-panying expansion phase. The pattern is even more pronounced inthe postwar cycles than in the period as a whole.
3. When we add one-half of errors and omissions to the net privatecapital flow abroad we see a 50-50 pattern during the entire period1920-62, indicating no preponderance of improvement in expansionsor recessions. In the postwar period, however, there is still a slightedge in favor of improvements during recessions.
4. When we calculate the difference between U.S. capital outflowsand foreign capital inflows we once more see a 50-50 pattern duringthe 1920-62 period and a slight edge in favor of improvement duringrecessions for the postwar period.
Adding one-half of errors and omissions to the U.S. capital flowchanges the pattern only slightly. In both periods we are better off6 out of 10 recessions and 4 out of 10 booms.
5. Looking next at the trade picture, we see that exports tend toimprove our balance-of-payments position most often during theexpansion phase. This is true for both periods. Imports, however,help improve our balance-of-payments position only rarely duringexpansions. Calculating our net export balance, we see a 50-50pattern during the entire period, indicating no preponderance ofimprovements in expansions or recessions. In the postwar period aslight edge appears during the expansion phase.
6. The last entry in table I combines our capital flows, net exportbalance, and errors and omissions. As can be seen, this most com-prehensive measure of our balance-of-payments performance gives aslight edge to improvements during the expansion phase. This is trueboth for the 1920-62 period and the 1945-62 period.
Yet the margin is small. During 6 out of 10 cycles this combinationof items shows improvement as we move from slow to fast growth;during 4 out of 10 cycles it shows deterioration. Indeed, the test forstatistical significance (the footnotes on the table show which itemsmay be considered statistically significant), this test tells us that wecan have virtually no confidence that the 60-40 pattern did notevolve simply due to chance.'
In summary, then, private U.S. capital tends most often to causedeterioration rather than improvement as we move from recession toexpansion. But when corrected for errors and omissions and forforeign capital inflows, the total capital account shows little pre-ponderance for improvement during either the expansion or recessionphase. Similarly, our net export balance shows no marked tendencytoward improvement in either expansions or recessions. The samething is true when we group capital, the net export balance, and errors
l The Chi-square test was used to determine statistical significance. The hypothesis formulated was thatthe items contributed predominantly to neither improvement nor deterioration in our balance of paymentsduring either phase of the cycle. A rejection of this hypothesis on the basis of the test indicated that anitem did indeed contribute predominantly to improvement or deterioration. The percentage indicates thedegree of confidence (i.e., 80 percent, 90 percent) with which the hypothesis was rejected. This confidencedid not prove extremely high even for the items where the hypothesis was rejected.
24-974-63-9
123
PERSPECTIVES AND POLICIES
and omissions. One would thus be hard pressed to make a case forthe growth hypothesis on the basis of table I.
But let us go a step further. It is quite possible that the balance ofpayments responds to an increase in the rate of growth only after atime lag. One might reason, for example, (a) it takes time for in-creased growth to be reflected in rising profits and interest rates,(b) it takes time for investors to become aware of the increased growth,higher interest rates, and profits in this country and (c) time is requiredfor the physical arrangements necessary to direct a larger volume ofinvestment into the domestic economy.
Table II shows the recession-expansion comparison adjusted toinclude a 6-month lag in the payments items. Yet despite the lagadjustment, the main groups of items show a striking similarity tothose in table I.
The total U.S. private capital outflow tends to cause deteriorationin the balance of payments as we move from recession to expansionbut, after correcting for errors and omissions and also when coupledwith foreign capital inflows, the combined capital account once moreshows little preponderance for improvement during either the expan-sion or recession phase.'
Similarly, though both exports and imports show a higher concen-tration of improvements in the expansion and recession phases, respec-tively, the net export balance exhibits no significant preponderance ofimprovements in either phase. The same pattern holds true when wegroup together the combined capital, the net export balance, anderrors and omissions. Thus on the basis of table II one would alsobe hard pressed to make a case for the growth hypothesis.
Yet it is still possible that a very fast rate of cyclical growth mightresult in a balance-of-payments pattern more in keeping with thegrowth hypothesis. To test this possibility, a comparison was madeof the behavior of the post-World War II balance-of-payments itemswithin the expansion phase: as the cycle moved from the trough intothe very fast upward phase and then leveled off into the phase ofrelative stability or "bumping along the top" as it is sometimescalled. What, then, happened as the cycle moved from fast growthto stability? In fact, an interesting change occurred.
As shown in table III, we have a concentration of improvements incapital flows during the fast-growth phase. Both (a) U.S. privatenet capital and (b) the combined U.S. outflow and foreign inflowaccounts show improvement in 80 percent of the cycles during thefast-growth phase. When we include errors and omissions, however,both accounts drop down to a statistically insignificant level: growth-phase improvements during only 60 percent of the cycles.
The net export balance in every cycle shows deterioration in thefast-growth phase and improvement in the stability phase.
Finally, when we combine capital, the export balance, and errors.and omissions, we have improvement during the fast-growth phaseduring only one out of five cycles. The predominance of capitalaccount improvements during the upswing erodes under the pressureof the export balance and errors and omissions.
2 It should be noted, however, that short-term capital flows now show a predominance of improvementsas the cycle moves from recession to expansion (the postwar period).
124
PERSPECTIVES AND POLICIES
I Thus even though the growth hypothesis looks a little better oncapital account in the fast-growth/stability comparison, by no meansare we able to establish the proposition.
But so much for the cycle. Let us now look at the balance-of-payments items over longer time periods.
GROWTH AND THE BALANCE OF PAYMENTS OVER LONGER PERIODSOF TIME
Table IV shows average annual percentage changes in selectedbalance-of-payments items during two fast-growth periods, 1921-29and 1948-56 and two relatively slow-growth periods, 1930-39 and1959-62. Granted, the depression period is associated with ratherextraordinary events affecting the world economy, but since the yearsfor which we have balance-of-payments data are limited, the period isincluded with the obvious caveat.
oIn general, table IV suggests that fast-growth periods are associatedwith deterioration in the balance of payments (increases in outflowsof funds or decreases in inflows), and slow-growth periods with im-provement. The table should not be taken, however, as evidencethat the reverse of the growth hypothesis is true. The observationsare too few, data in the earlier period are not without question-tomention just two reservations. Rather one might say that the tableis not calculated to inspire confidence in the validity of the growthhypothesis.
As for the individual items in table ITV, percentage increases inprivate capital flowing abroad are greater during the fast-growthperiods (though this tendency is less evident when U.S. capitaloutflows are coupled with foreign capital inflows). The net exportbalance deteriorates during the fast-growth periods and improvesduring the slow-growth years, as does the grouping of capital, netexport balance, and errors and omissions.
CONCLUSIONS
One might be tempted to draw the conclusion from this analysisthat there is a slight edge in favor of the proposition that a faster rateof growth tends to promote disequilibrium in the balance of payments;~that imports tend to grow faster than exports during the fast-growthperiods, and that businessmen tend to invest more at home-butalso more abroad during expansions (e.g., "Profits look good so let'sexpand in Cincinnati, and while we're at it we might reconsider thesubsidiary in Milan" or "things look good the world over so let'sstretch out for an extra 1 percent on a Canadian issue").
Yet such a conclusion is probably unwarranted. After all (and aspreviously mentioned) the balance-of-payments observations arerelatively few; the results of all comparisons were not uniform inoutcome; the data may be questioned; there is some secular trend inthe cyclical comparisons (though from an examination of the data thisproblem is considered to be minimal).
To be on firmer ground one might conclude instead that the evidencepresented suggests that the growth hypothesis may be a case of over-simplification, that the behavior of our balance of payments is anextremely complex multivariate function which defies simple explana-
125
126 PERSPECTIVES AND POLICIES
tion, that there is simply no clear-cut tendency for an acceleration inthe rate of growth to bring about an improvement in our balance ofpayments.
Given this conclusion, then, what guidance might this study offerthe policymaker? Perhaps the following.
An increase in the rate of economic growth may help relieve ourbalance-of-payments deficit. Then again, it may not. Hence thewisdom which may be gained from this study is perhaps this: weshould not count too heavily on growth as an equilibrating force; weshould not put all our eggs in this basket; we should not even commithalf our eggs. Instead, we should continue to strive for balance-of-payments equilibrium across the entire broad spectrum of public andprivate policy. And perhaps we should intensify our efforts.
APPENDIX
QUANTITATIVE RESTRICTIONS MAINTAINED ON
IMPORTS BY CERTAIN FOREIGN COUNTRIES
By theBureau of Economic Affairs, Department of State
127
QUANTITATIVE RESTRICTIONS MAINTAINED ON IMPORTSBY CERTAIN FOREIGN COUNTRIES
BUREAU OF EcONOMIc AFFAIRS, DEPARTMENT OF STATE
This review of quantitative restrictions on imports covers themembers of the International Monetary Fund that have accepted infull their obligations to maintain convertible currencies in the sense ofarticle VIII of the Fund agreement. As provided in article VIIIthese countries may not introduce exchange restrictions on imports-or on other current payments without the approval of the Fund.Most of these countries are also contracting parties to the GeneralAgreement on Tariffs and Trade (GATT). All of them have givenup their resort to the provisions of the GATT that permit a con-tracting party to maintain quantitative restrictions on imports toprotect its balance of payments.
Sixteen countries have accepted the obligations of article VIII ofthe Fund agreement and are contracting parties to the GATT, asfollows: Austria, Belgium, Canada, Cuba, Dominican Republic,France, Germany, Haiti, Italy, Kuwait, Luxembourg, Netherlands,Peru, Sweden, United Kingdom, and United States.
Eight countries have accepted the obligations of article VIII ofthe Fund agreement but are not contracting parties to the GATT, asfollows: El Salvador, Guatemala, Honduras, Iceland, Jamaica,Mexico, Panama, and Saudi Arabia.
The- attached lists of commodities cover, in the main, quantitativeimport restrictions that take the form of specific quotas or prohibitions;they do not ordinarily cover commodities whose importation may be*subject to licensing on a case-by-case basis.
It should be noted that there are a number of reasons specified in theGATT and unrelated to the balance of payments that would justifythe maintenance of restrictions on imports; specifically essentialnational security interest, health, safety and sanitary regulations,protection of public morals, and to secure -compliance with laws orregulations which are not inconsistent with the provisions of theGATT, and so forth.
By and large the restrictions in the attached lists maintained bycontracting parties to the GATT were originally justified on balance-of-payments grounds. However, they have been retained for otherreasons, some of which may not be consistent with the provisions ofthe GATT, after balance-of-payments considerations were no longerrelevant.
Saudi Arabia, Jamaica, the Dominican Republic, Honduras, andHaiti do not impose quantitative restrictions on imports, per se, butuse licensing systems. Saudi Arabia has no general criteria establishedfor the issuance of import licenses; Jamaica and the DominicanRepublic use import licensing systems for certain items under nationaltrade laws; and Haiti uses import licenses on a case-by-case basis.Honduras applies both a consular and a customs surtax on all imports,with certain exceptions for imports from the Central American Com-mon Market countries. Peru and Kuwait do not maintain quanti-tative restrictions on imports. Peru uses surcharges in lieu of quantita-
129
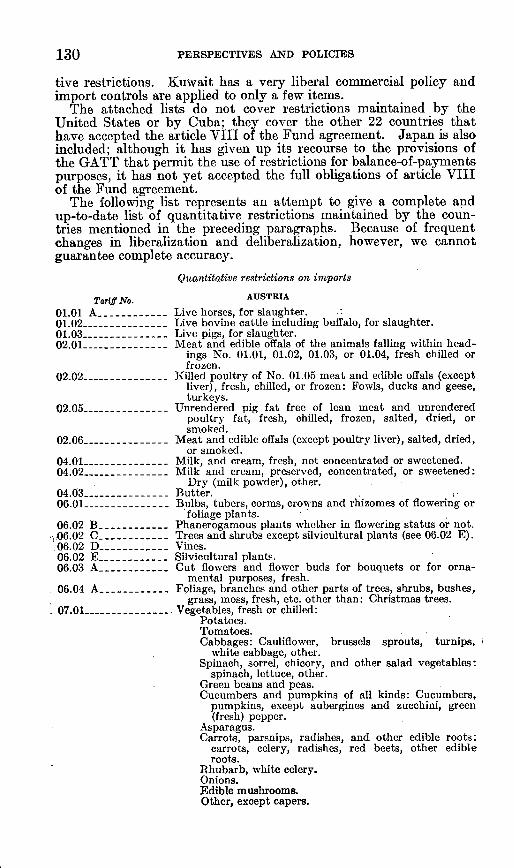
PERSPECTIVES AND POLICIES
tive restrictions. Kuwait has a very liberal commercial policy andimport controls are applied to only a few items.
The attached lists do not cover restrictions maintained by theUnited States or by Cuba; they cover the other 22 countries thathave accepted the article VIII of the Fund agreement. Japan is alsoincluded; although it has given up its recourse to the provisions ofthe GATT that permit the use of restrictions for balance-of-paymentspurposes, it has not yet accepted the full obligations of article VIIIof the Fund agreement.
The following list represents an attempt to give a complete andup-to-date list of quantitative restrictions maintained by the coun-tries mentioned in the preceding paragraphs. Because of frequentchanges in liberalization and deliberalization, however, we cannotguarantee complete accuracy.
Quantitative restrictions on imports
Tariff No.
01.01 A-01.0201.03-02.01-
02.02-
02.05
02.06
04.01-04.02-
04.03-06.01-
06.02* 06.02
06.0206.0206.03
B- _C - _ -_ - _D- _ -_EA- _
06.04 A
-07.01 -__---
AUSTRIA
Live horses, for slaughter.Live bovine cattle including buffalo, for slaughter.Live pigs, for slaughter.Meat and edible offals of the animals falling within head-
ings No. 01.01, 01.02, 01.03, or 01.04, fresh chilled orfrozen.
Killed poultry of No. 01.05 meat and edible offals (exceptliver), fresh, chilled, or frozen: Fowls, ducks and geese,turkeys.
Unrendered pig fat free of lean meat and unrenderedpoultry fat, fresh, chilled, frozen, salted, dried, orsmoked.
Meat and edible off als (except poultry liver), salted, dried,or smoked.
Milk, and cream, fresh, not concentrated or sweetened.Milk and cream, preserved, concentrated, or sweetened:
Dry (milk powder), other.Butter.Bulbs, tubers, corms, crowns and rhizomes of flowering or
foliage plants.Phanerogamous plants whether in flowering status or not.Trees and shrubs except silvicultural plants (see 06.02 E).Vines.Silvicultural plants.Cut flowers and flower buds for bouquets or for orna-
mental purposes, fresh.Foliage, branches and other parts of trees, shrubs, bushes,
grass, moss, fresh, etc. other than: Christmas trees.Vegetables, fresh or chilled:
Potatoes.Tomatoes.Cabbages: Cauliflower, brussels sprouts, turnips,
white cabbage, other.Spinach, sorrel, chicory, and other salad vegetables:
spinach, lettuce, other.Green beans and peas.Cucumbers and pumpkins of all kinds: Cucumbers,
pumpkins, except aubergines and zucchini, green(fresh) pepper.
Asparagus.Carrots, parsnips, radishes, and other edible roots:
carrots, celery, radishes, red beets, other edibleroots.
Rhubarb, white celery.Onions.Edible mushrooms.Other, except capers.
130
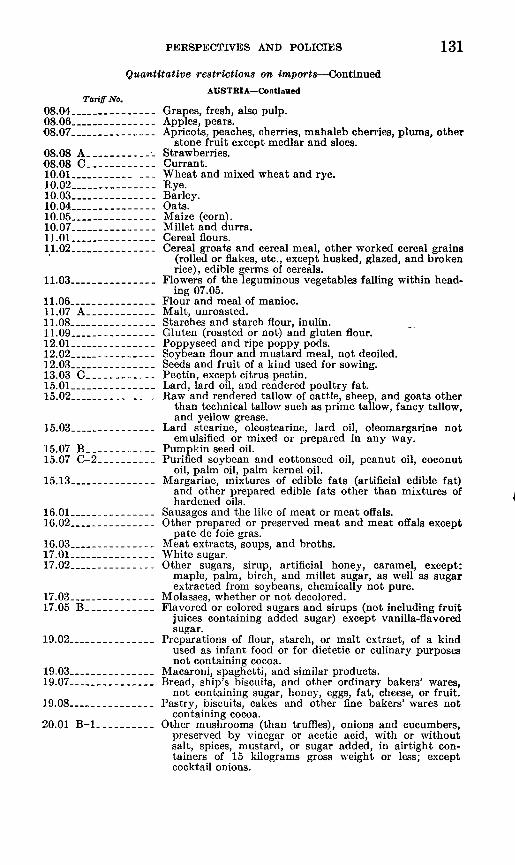
PERSPECTIVES AND POLICIES
Quantitative restrictions on imports-Continued
Tariff No.08.04 ------- -08.06-08.07-
08.08 A -08.08 C-10.01 -__ ---10.0210.03 -----------10.04 ------ ----10.05 -10.07 _----------11.01 …--------------11.02 -_---
11.03 ---------
11.0611.07 A11.08_____11.09-12.01-12.02 -12.03-13.03 C-15.01 -15.02
15.03
15.07 B15.07 C-2
15.13
16.0116.02 -
16.03 ------------17.0117.02
17.03 -----------17.05 B
19.02 _
19.0319.07 ---------
19.08 ----
20.01 B-1
AUSTRIA-Continued
Grapes, fresh, also pulp.Apples, pears.Apricots, peaches, cherries, mahaleb cherries, plums, other
stone fruit except medlar and sloes.Strawberries.Currant.Wheat and mixed wheat and rye.Rye.Barley.Oats.Maize (corn).Millet and durra.Cereal flours.Cereal groats and cereal meal, other worked cereal grains
(rolled or flakes, etc., except husked, glazed, and brokenrice), edible germs of cereals.
Flowers of the leguminous vegetables falling within head-ing 07.05.
Flour and meal of manioc.Malt, unroasted.Starches and starch flour, inulin.Gluten (roasted or not) and gluten flour.Poppyseed and ripe poppy pods.Soybean flour and mustard meal, not deoiled.Seeds and fruit of a kind used for sowing.Pectin, except citrus pectin.Lard, lard oil, and rendered poultry fat.Raw and rendered tallow of cattle, sheep, and goats other
than technical tallow such as prime tallow, fancy tallow,and yellow grease.
Lard stearine, oleostearine, lard oil, oleomargarine notemulsified or mixed or prepared in any way.
Pumpkin seed oil.Purified soybean and cottonseed oil, peanut oil, coconut
oil, palm oil, palm kernel oil.Margarine, mixtures of edible fats (artificial edible fat)
and other prepared edible fats other than mixtures ofhardened oils.
Sausages and the like of meat or meat offals.Other prepared or preserved meat and meat offals except
pate de foie gras.Meat extracts, soups, and broths.White sugar.Other sugars, sirup, artificial honey, caramel, except:
maple, palm, birch, and millet sugar, as well as sugarextracted from soybeans, chemically not pure.
Molasses, whether or not decolored.Flavored or colored sugars and sirups (not including fruit
juices containing added sugar) except vanilla-flavoredsugar.
Preparations of flour, starch, or malt extract, of a kindused as infant food or for dietetic or culinary purposesnot containing cocoa.
Macaroni, spaghetti, and similar products.Bread, ship's biscuits, and other ordinary bakers' wares,
not containing sugar, honey, eggs, fat, cheese, or fruit.Pastry, biscuits, cakes and other fine bakers' wares not
containing cocoa.Other mushrooms (than truffles), onions and cucumbers,
preserved by vinegar or acetic acid, with or withoutsalt, spices, mustard, or sugar added, in airtight con-tainers of 15 kilograms gross weight or less; exceptcocktail onions.
131
J

132 PERSPECTIVES AND POLICIES
Quantitative restrictions on imnport8-Continued
AUSTRIA-ContinuedTariff No.
20.01 B-2 -Other mushrooms (than truffles), onions, cucumbers,preserved by vinegar or acetic acid, with or withoutsalt, packed in airtight containers of more than 15kilograms as well as other mushrooms (than truffles),onions and cucumbers, preserved by vinegar or aceticacid, with spices, mustard, or sugar added.
20.01 C-1 -Vegetables preserved by vinegar or acetic acid, with orwithout salt, spices, mustard, or sugar added, packed inairtight containers of 15 kilograms gross weight or less.
20.01 C-2 -Vegetables preserved by vinegar or acetic acid, with orwithout salt, packed in airtight containers of more than15 kilograms as well as vegetables preserved by vinegaror acetic acid, with sugar, spices, or mustard added.
20.02 A- Vegetables preserved otherwise than by vinegar or aceticacid, packed in airtight containers of 15 kilograms grossweight or less except truffles, olives, and capers.
20.02 - -Tomatoes, sauerkraut, and other vegetables (excepttruffles, olives, and capers) preserved otherwise than byvinegar or acetic acid, in other than airtight containersof 15 kilograms of gross weight or less.
20.07 A -Thick juices of apples, pears, grapes, and vegetables,whether or not containing sugar, but unfermented andnot containing alcohol.
20.07 B -Juices of apples, pears, grapes, and tomatoes, whether ornot containing sugar, but unfermented and not contain-ing alcohol.
21.07 - -Food preparations not elsewhere specified or included:With a basis of milk and eggs.Others (than extracts or other basis and saccharine).
22.01 - -Mineral water.22.04 - -Grape must, infermentation or with fermentation arrested
otherwise than by addition of alcohol.22.05 - -Wine of fresh grapes, including grape must with added
alcohol.22.06 - -Vermouths and other wines flavored with aromatic
essences.22.07 - - Other fermented beverages such as cider, berry, and mead.23.02 -- Bran.23.05 A-1 -Wine lees, liquid.23.07 - -Animal food preparations other than of meat wastes.24.02 - - Manufactured tobacco; tobacco extracts and essences.25.15 - -Sawn slabs of marble stone of less than 16 cm. thickness.27.02 A- Lignite, except pitch coal.27.10 H- White oils (Vaseline oil, paraffin oil).27.10 I- Transformer oil.28.17 A- Caustic soda, except sodium hydroxide in aquatic solu-
tion.28.35 A- Sodium sulfide.28.37 A-1 -Potassium and sodium sulfites, bisulfites, and metasulfites
except sodium bisulfite.28.38 A-1 -Aluminum sulfate.28.38 A-2 -Copper sulfate.28.40 B-1 -Sodium orthophosphates.
B-2 -Sodium pyrophosphates, sodium polyphosphates, andsodium metaphosphates.
28.40 B-3 -Potassium phosphates.28.42 A-6a -Sodium carbonate, calcined.28.54 - -Hydrogen peroxide.29.02 A -Methyl chloride, ethyl chloride, trichloroethane, tet-
rachloroethane, trichloroethylene, tetrachloroethylene,hexachlorobutadiene, hexachlorobenzene, monochloro-napthalene.
29.02 C -Dichloro-diphenyl-trichloroethane (DDT).29.14 B-1 -Acetic acid.
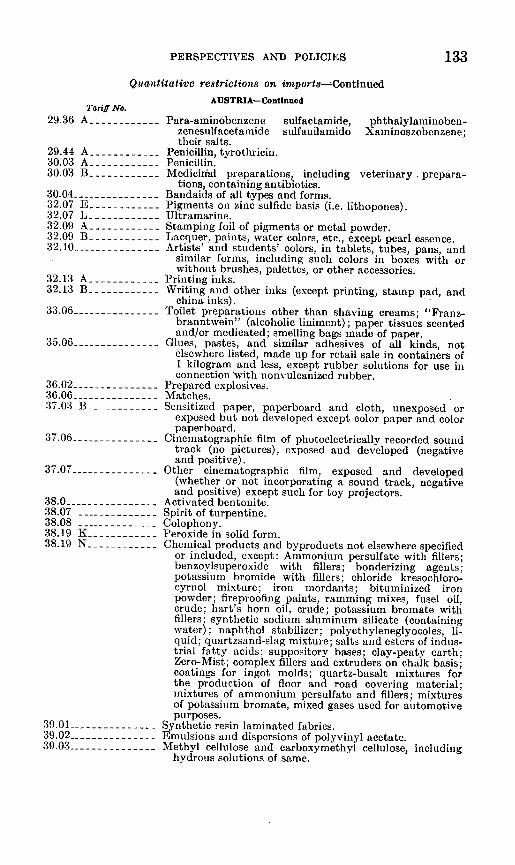
PERSPECTIVES AND POLICIES
Tariff29.36 A -_-
29.44M A- --
30.03 A.- ---30.03 It - -
30.04-- - -32.07 E____32.07 W - --
32.09 A ---.32.09 B__32.10-- - -
32.13 A --32.13 B_. --
33.06-- - -
35.06~ -----
3 6.02-- - -36.06 .--- -37.03 B --
37.06---
37.07 ----
38.0-----38.07 -38.08 - __38.19 K..----.38.19 N ---
39.01-- - -39.02-- - -39.03-- - -
133Quantitative restrictions on imports-Continued
AUSTRIA-ContinuedNo.*----- Para-aminobenzene sulfactamide, phithalylamiinoben-
zenesulfacetamide sulfanilamido Xaminoszobcnzene;their salts.
------ Penicillin, tyrotliricin.------ Penicillin.------ Medicidal preparations, including veterinary prepara-
tions, containing antibiotics.------ Bandaids of all types and forms.------ Pigments on zinc sulfide basis (i.e. lithopones).------ Ultramarine.
…-----Stamping foil of pigments or metal powder.------ Lacquer, paints, water colors, etc., except pearl esscnce.------ Artists' and students' colors, in tablets, tubes, pans, and
similar forms, including such colors in boxes with orwithout brushes, palettes, or other accessories.
…-----Printing inks.------ Writing and other inks (except printing, stamp pad, and
china inks).------ Toilet preparations other than shaving creams; "Franz-
branntwein" (alcoholic liniment); paper tissues scentedand/or medicated; smelling bags made of paper.
------ Glues, pastes, and similar adhesives of all kinds, notelsewhere listed, made up for retail sale in containers of1 kilogram and less, except rubber solutions for use inconnection with nonvulcanized rubber.
------ Prepared explosives.----- Matches.----- Sensitized paper, paperboard and cloth, unexposed or
exposed but not developed except color paper and colorpaperboard.
----- Cinematographic film of photoelectrically recorded soundtrack (no pictures), exposed and developed (negativeand positive).
----- Other cinematographic film, exposed and developed(whether or not incorporating a sound track, negativeand positive) except such for toy projectors.
----- Activated bentonite.----- Spirit of turpentine.
----- Colophony.----- Peroxide in solid form.----- Chemical products and byproducts not elsewhere specified
or included, except: Ammonium persulfate with fillers;benzoylsuperoxide with fillers; bonderizing agents;potassium bromide with fillers; chloride kresochloro-cyrnol mixture; iron mordants; bituminized ironpowder; fireproofing paints, ramming mixes, fusel oil,crude; hart's horn oil, crude; potassium bromate withfillers; synthetic sodium aluminum silicate (containingwater); naphthol stabilizer; polyethyleneglyocoles, li-quid; quartzsand-slag mixture; salts and esters of indus-trial fatty acids; suppository bases; clay-peaty earth;Zero-Mist; complex fillers and extruders on chalk basis;coatings for ingot molds; quartz-basalt mixtures forthe production of floor and road covering material;mixtures of ammonium persulfate and fillers; mixturesof potassium bromate, mixed gases used for automotivepurposes.
----- Synthetic resin laminated fabrics.----- Emulsions and dispersions of polyvinyl acetate.- ---- Methyl cellulose and carboxymethyl cellulose, including
hydrous solutions of same.
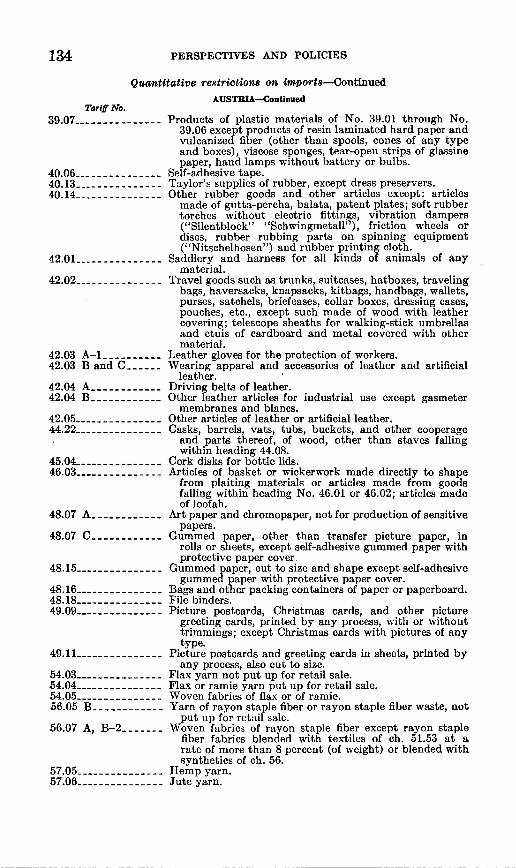
134 PERSPECTIVES AND POLICIES
Quantitative restrictions on imports-Continued
AUSTRIA-ContinuedTariff No.
39.07 - - Products of plastic materials of No. 39.01 through No.39.06 except products of resin laminated hard paper andvulcanized fiber (other than spools, cones of any typeand boxes), viscose sponges, tear-open strips of glassinepaper, hand lamps without battery or bulbs.
40.06 - - Self-adhesive tape.40.13 - - Taylor's supplies of rubber, except dress preservers.40.14 - - Other rubber goods and other articles except: articles
made of gutta-percha, balata, patent plates; soft rubbertorches without electric fittings, vibration dampers("Silentblock" "Schwingmetall"), friction wheels ordiscs, rubber rubbing parts on spinning equipment("Nitschelhosen") and rubber printing cloth.
42.01 - - Saddlery and harness for all kinds of animals of anymaterial.
42.02 - - Travel goods such as trunks, suitcases, hatboxes, travelingbags, haversacks, knapsacks, kitbags, handbags, wallets,purses, satchels, briefcases, collar boxes, dressing cases,pouches, etc., except such made of wood with leathercovering; telescope sheaths for walking-stick umbrellasand etuis of cardboard and metal covered with othermaterial.
42.03 A-1 i-- Leather gloves for the protection of workers.42.03 B and C - Wearing apparel and accessories of leather and artificial
leather.42.04 A -_ Driving belts of leather.42.04 B -_--__-_-__Other leather articles for industrial use except gasmeter
membranes and blancs.42.05 _--- - Other articles of leather or artificial leather.44.22 _--- - Casks, barrels, vats, tubs, buckets, and other cooperage
and parts thereof, of wood, other than staves fallingwithin heading 44.08.
45.04 -- - Cork disks for bottle lids.46.03 -------- Articles of basket or wickerwork made directly to shape
from plaiting materials or articles made from goodsfalling within heading No. 46.01 or 46.02; articles madeof loofah.
48.07 A -_--_---___Art paper and chromopaper, not for production of sensitivepapers.
48.07 C -Gummed paper, other than transfer picture paper, inrolls or sheets, except self-adhesive gummed paper withprotective paper cover.
48.15 -------- Gummed paper, cut to size and shape except self-adhesivegummed paper with protective paper cover.
48.16 ---------- Bags and other packing containers of paper or paperboard.48.18 -------- File binders.49.09 _- __- - Picture postcards, Christmas cards, and other picture
greeting cards, printed by any process, with or withouttrimmings; except Christmas cards with pictures of anytype.
49.11 _ _- - Picture postcards and greeting cards in sheets, printed byany process, also cut to size.
54.03 --------- Flax yarn not put up for retail sale.54.04 ___--_-___-_-Flax or ramie yarn put up for retail sale.54.05 --------- Woven fabrics of flax or of ramie.56.05 B --_ Yarn of rayon staple fiber or rayon staple fiber waste, not
put up for retail sale.56.07 A, B-2 - Woven fabrics of rayon staple fiber except rayon staple
fiber fabrics blended with textiles of ch. 51.53 at arate of more than 8 percent (of weight) or blended withsynthetics of ch. 56.
57.05 - Hemp yarn.57.06 - _--- - Jute yarn.
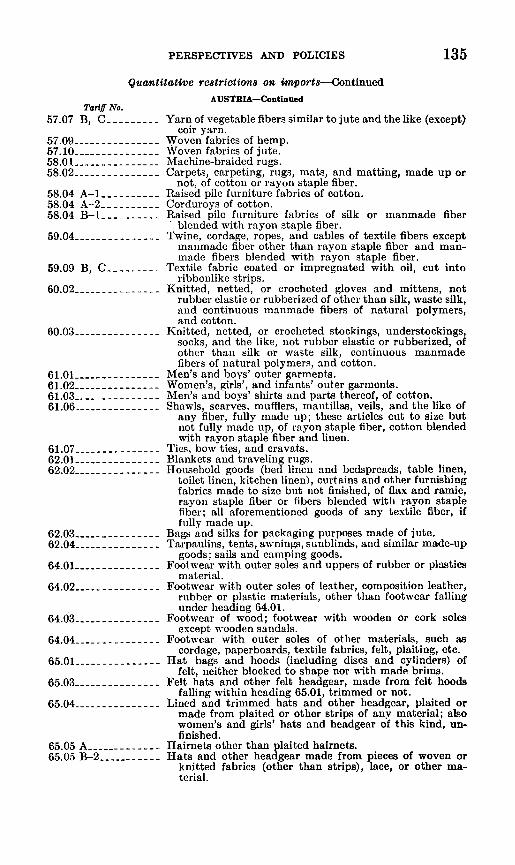
PERSPECTIVES AND POLICIES
Quantitative restrictions on import8-Continued
Tariff No.57.07 B, C
57.0957.10 _ - -58.0158.02
58.04 A-158.04 A-258.04 B-1-
59.04
59.09 B, C
60.02
60.03
61.01-61.02-61.03-61.06-
61.0762.01-62.02-
62.0362.04 -
64.01-
64.02-
64.03 ------------
64.04
65.01-
65.03-
65.04-
65.05 A-65.05 B-2
AUSTRIA-Continued
Yarn of vegetable fibers similar to jute and the like (except)coir yarn.
Woven fabrics of hemp.Woven fabrics of jute.Machine-braided rugs.Carpets, carpeting, rugs, mats, and matting, made up or
not, of cotton or rayon staple fiber.Raised pile furniture fabrics of cotton.Corduroys of cotton.Raised pile furniture fabrics of silk or manmade fiber
blended with rayon staple fiber.Twine, cordage, ropes, and cables of textile fibers except
manmade fiber other than rayon staple fiber and man-made fibers blended with rayon staple fiber.
Textile fabric coated or impregnated with oil, cut intoribbonlike strips.
Knitted, netted, or crocheted gloves and mittens, notrubber elastic or rubberized of other than silk, waste silk,and continuous manmade fibers of natural polymers,and cotton.
Knitted, netted, or crocheted stockings, understockings,socks, and the like, not rubber elastic or rubberized, ofother than silk or waste silk, continuous manmadefibers of natural polymers, and cotton.
Men's and boys' outer garments.Women's, girls', and infants' outer garments.Men's and boys' shirts and parts thereof, of cotton.Shawls, scarves, mufflers, mantillas, veils, and the like of
any fiber, fully made up; these articles cut to size butnot fully made up, of rayon staple fiber, cotton blendedwith rayon staple fiber and linen.
Ties, bow ties, and cravats.Blankets and traveling rugs.Household goods (bed linen and bedspreads, table linen,
toilet linen, kitchen linen), curtains and other furnishingfabrics made to size but not finished, of flax and ramie,rayon staple fiber or fibers blended with rayon staplefiber; all aforementioned goods of any textile fiber, iffully made up.
Bags and silks for packaging purposes made of jute.Tarpaulins, tents, awnings, sunblinds, and similar made-up
goods; sails and camping goods.Footwear with outer soles and uppers of rubber or plastics
material.Footwear with outer soles of leather, composition leather,
rubber or plastic materials, other than footwear fallingunder heading 64.01.
Footwear of wood; footwear with wooden or cork solesexcept wooden sandals.
Footwear with outer soles of other materials, such ascordage, paperboards, textile fabrics, felt, plaiting, etc.
Hat bags and hoods (including discs and cylinders) offelt, neither blocked to shape nor with made brims.
Felt hats and other felt headgear, made from felt hoodsfalling within heading 65.01, trimmed or not.
Lined and trimmed hats and other headgear, plaited ormade from plaited or other strips of any material; alsowomen's and girls' hats and headgear of this kind, un-finished.
Hairnets other than plaited hairnets.Hats and other headgear made from pieces of woven or
knitted fabrics (other than strips), lace, or other ma-terial.
135
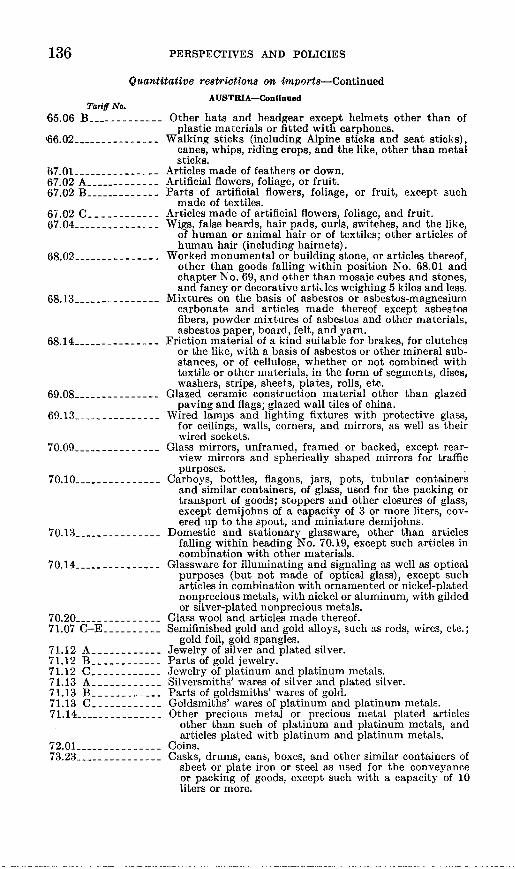
PERSPECTIVES AND POLICIES
Quantitative restrictions on imports-Continued
Tariff No.65.06 B
66.02-
67.01-67.02 A-67.02 B-
6W.02 C-67.04-
68.02
68.13 - .-
68.14-
69.08 ------------
69.13
70.09
70.10
70.13 _
70.14 _ - -
70.2071.07 C-E
71.12 A71.12 B71.12 C71.13 A71.13 B- -71.13 C71.14 _
72.0173.23
AUSTRIA-Continued
Other hats and headgear except helmets other than ofplastic materials or fitted with earphones.
Walking sticks (including Alpine sticks and seat sticks),canes, whips, riding crops, and the like, other than metalsticks.
Articles made of feathers or down.Artificial flowers, foliage, or fruit.Parts of artificial flowers, foliage, or fruit, except such
made of textiles.Articles made of artificial flowers, foliage, and fruit.Wigs, false beards, hair pads, curls, switches, and the like,
of human or animal hair or of textiles; other articles ofhuman hair (including hairnets).
Worked monumental or building stone, or articles thereof,other than goods falling within position No. 68.01 andchapter No. 69, and other than mosaic cubes and stones,and fancy or decorative articles weighing 5 kilos and less.
Mixtures on the basis of asbestos or asbestos-magnesiumcarbonate and articles made thereof except asbestosfibers, powder mixtures of asbestos and other materials,asbestos paper, board, felt, and yarn.
Friction material of a kind suitable for brakes, for clutchesor the like, with a basis of asbestos or other mineral sub-stances, or of cellulose, whether or not combined withtextile or other materials, in the form of segments, discs,washers, strips, sheets, plates, rolls, etc.
Glazed ceramic construction material other than glazedpaving and flags; glazed wall tiles of china.
Wired lamps and lighting fixtures with protective glass,for ceilings, walls, corners, and mirrors, as well as theirwired sockets.
Glass mirrors, unframed, framed or backed, except rear-view mirrors and spherically shaped mirrors for trafficpurposes.
Carboys, bottles, flagons, jars, pots, tubular containersand similar containers, of glass, used for the packing ortransport of goods; stoppers and other closures of glass,except demijohns of a capacity of 3 or more liters, cov-ered up to the spout, and miniature demijohns.
Domestic and stationary glassware, other than articlesfalling within heading No. 70.19, except such articles incombination with other materials.
Glassware for illuminating and signaling as well as opticalpurposes (but not made of optical glass), except sucharticles in combination with ornamented or nickel-platednonprecious metals, with nickel or aluminum, with gildedor silver-plated nonprecious metals.
Glass wool and articles made thereof.Semifinished gold and gold alloys, such as rods, wires, etc.;
gold foil, gold spangles.Jewelry of silver and plated silver.Parts of gold jewelry.Jewelry of platinum and platinum metals.Silversmiths' wares of silver and plated silver.Parts of goldsmiths' wares of gold.Goldsmiths' wares of platinum and platinum metals.Other precious metal or precious metal plated articles
other than such of platinum and platinum metals, andarticles plated with platinum and platinum metals.
Coins.Casks, drums, cans, boxes, and other similar containers of
sheet or plate iron or steel as used for the conveyanceor packing of goods, except such with a capacity of 10liters or more.
136
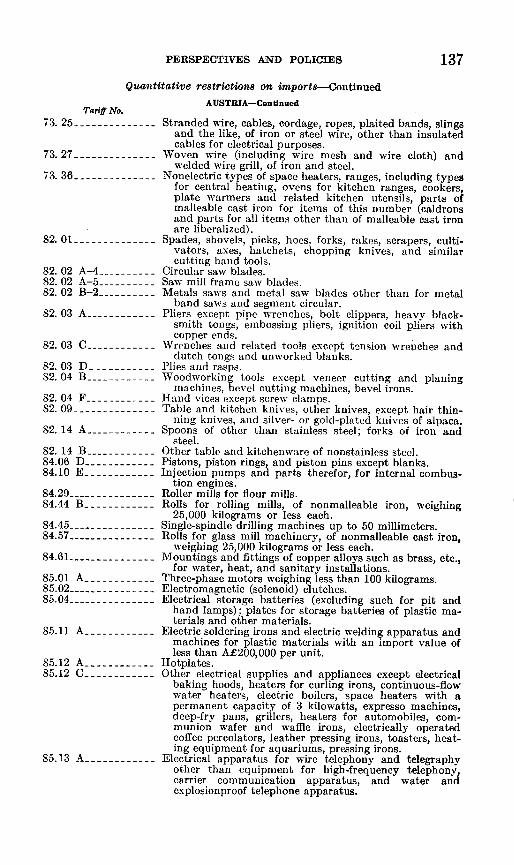
PERSPECTIVES AND POLICIES
Taiff No73. 25
73.27-
73.36-
82.1 -
82. 02 A-4 ----82. 02 A-5 ----82. 02 B-2 ----
82. 03 A-
82.03 C-
82.03 D _____82. 04 B-
82.04 F-82. 09-
82. 14 A .
82.14 B-84.06 D-84.10 E-
84.2984.44 B-
84.4584.57
84.61
85.01 A-85.0285.04
85.11 A-
85.12 A-85.12 C-
85.13 A-
Quantitative restrictions on imports-Continued
AUSTRIA-Conunued
------ Stranded wire, cables, cordage, ropes, plaited bands, slingsand the like, of iron or steel wire, other than insulatedcables for electrical purposes.
------ Woven wire (including wire mesh and wire cloth) andwelded wire grill, of iron and steel.
------ Nonelectric types of space heaters, ranges, including typesfor central heating, ovens for kitchen ranges, cookers,plate warmers and related kitchen utensils, parts ofmalleable cast iron for items of this number (caldronsand parts for all items other than of malleable cast ironare liberalized).
- - --- Spades, shovels, picks, hoes, forks, rakes, scrapers, culti-vators, axes, hatchets, chopping knives, and similarcutting hand tools.
------ Circular saw blades.----- Saw mill frame saw blades.-- --- Metals saws and metal saw blades other than for metal
band saws and segment circular.------ Pliers except pipe wrenches, bolt clippers, heavy black-
smith tongs, embossing pliers, ignition coil pliers withcopper ends.
------ Wrenches and related tools except tension wrenches anddutch tongs and unworked blanks.
----- Plies and rasps.----- Woodworking tools except veneer cutting and planing
machines, bevel cutting machines, bevel irons.----Hand vices except screw clamps.------ Table and kitchen knives, other knives, except hair thin-
ning knives, and silver- or gold-plated knives of alpaca.------ Spoons of other than stainless steel; forks of iron and
steel.------Other table and kitchenware of nonstainless steel.------ Pistons, piston rings, and piston pins except blanks.------ Injection pumps and parts therefor, for internal combus-
tion engines.----Roller mills for flour mills.------ Rolls for rolling mills, of nonmalleable iron, weighing
25,000 kilograms or less each.------ Single-spindle drilling machines up to 50 millimeters.------ Rolls for glass mill machinery, of nonmalleable cast iron,
weighing 25,000 kilograms or less each.------ Mountings and fittings of copper alloys such as brass, etc.,
for water, heat, and sanitary installations.Three-phase motors weighing less than 100 kilograms.
-Electromagnetic (solenoid) clutches.------ Electrical storage batteries (excluding such for pit and
hand lamps); plates for storage batteries of plastic ma-terials and other materials.
------ Electric soldering irons and electric welding apparatus andmachines for plastic materials with an import value ofless than AX200,000 per unit.
-Hotplates.------ Other electrical supplies and appliances except electrical
baking hoods, heaters for curling irons, continuous-flowwater heaters, electric boilers, space heaters with apermanent capacity of 3 kilowatts, expresso machines,deep-fry pans, grillers, heaters for automobiles, com-munion wafer and waffle irons, electrically operatedcoffee percolators, leather pressing irons, toasters, heat-ing equipment for aquariums, pressing irons.
------ Electrical apparatus for wire telephony and telegraphyother than equipment for high-frequency telephony,carrier communication apparatus, and water andexplosionproof telephone apparatus.
137
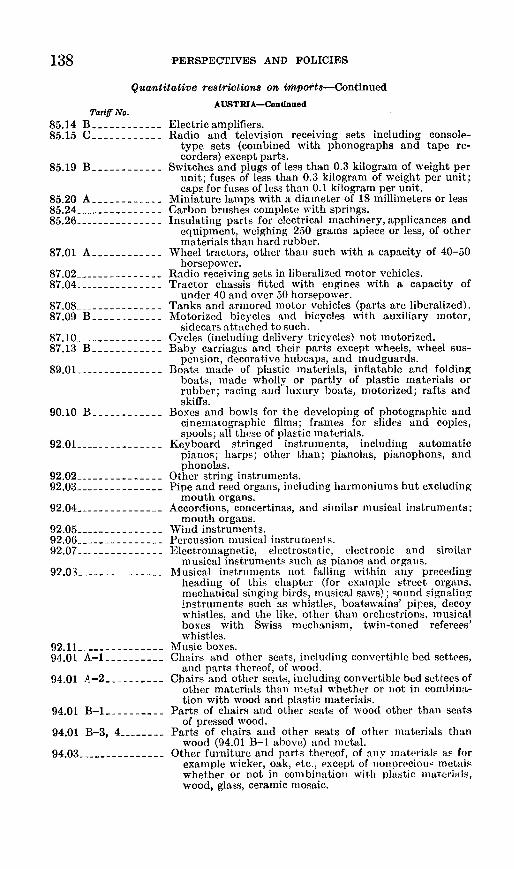
PERSPECTIVES AND POLICIES
Quantitative restrictions on imports-Continued
Tariff No.85.14 B85.15 C
85.19 B
85.20 A85.2485.26
87.01 A
87.0287.04 ------------
87.0887.09 B .
87.1087.13 B
89.01
90.10 B
92.01
92.0292.03 ---------------
92.04
92.0592.0692.07 -------------
92.03
92.11 -_- -94.01 A-1
94.01 A-2 _
94.01 B-1 i
94.01 B-3, 4 __
94.03 - _-
AUSTRIA-Continued
Electric amplifiers.Radio and television receiving sets including console-
type sets (combined with phonographs and tape re-corders) except parts.
Switches and plugs of less than 0.3 kilogram of weight perunit; fuses of less than 0.3 kilogram of weight per unit;caps for fuses of less than 0.1 kilogram per unit.
Miniature lamps with a diameter of 18 millimeters or lessCarbon brushes complete with springs.Insulating parts for electrical machinery, applicances and
equipment, weighing 250 grams apiece or less, of othermaterials than hard rubber.
Wheel tractors, other than such with it capacity of 40-50horsepower.
Radio receiving sets in liberalized motor vehicles.Tractor chassis fitted with engines with a capacity of
under 40 and over 50 horsepower.Tanks and armored motor vehicles (parts are liberalized).Motorized bicycles and bicycles with auxiliary motor,
sidecars attached to such.Cycles (including delivery tricycles) not motorized.Baby carriages and their parts except wheels, wheel sus-
pension, decorative hubcaps, and mudguards.Boats made of plastic materials, inflatable and folding
boats, made wholly or partly of plastic materials orrubber; racing and luxury boats, motorized; rafts andskiffs.
Boxes and bowls for the developing of photographic andcinematographic films; frames for slides and copies,spools; all these of plastic materials.
Keyboard stringed instruments, including automaticpianos; harps; other than; pianolas, pianophons, andphonolas.
Other string instruments.Pipe and reed organs, including harmoniums but excluding
mouth organs.Accordions, concertinas, and similar musical instruments;
mouth organs.Wind instruments.Percussion musical instruments.Electromagnetic, electrostatic, electronic and similar
musical instruments such as pianos and organs.Musical instruments not falling within any preceding
heading of this chapter (for example street organs.mechanical singing birds, musical saws); sound signalinginstruments such as whistles, boatswains' pipes, decoywhistles. and the like, other than orchestrions. musicalboxes with Swiss mechanism, twin-toned referees'whistles.
Music boxes.Chairs and other seats, including convertible bed settees,
and parts thereof, of wood.Chairs and other seats, including convertible bed settees of
other materials thanm metal whether or not in combina-tion with wood and plastic materials.
Parts of chairs and other seats of wood other than seatsof pressed wood.
Parts of chairs and other seats of other materials thanwood (94.01 B-1 above) and metal.
Other furniture and parts thereof, of any inaterials as forexample wicker, oak, etc., except of noiDnrecious nmetalswhether or not in combination with plastic materials,wood, glass, ceramic mosaic.
138
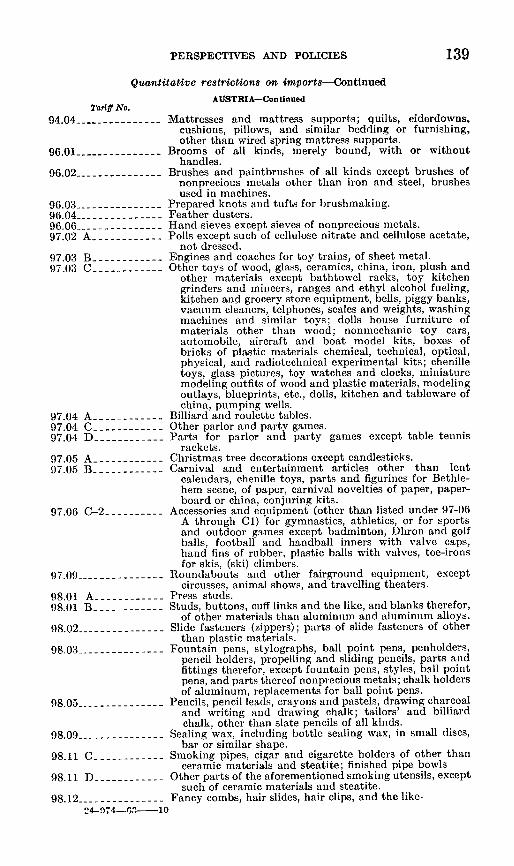
PERSPECTIVES AND POLICIES
To94.04.-__
96.01.
96.02---
96.03 - -.-96.0496.06- _97.02 A_
97.03 B_.97.03 C.
97.04 A-.97.04 C.97.04 D
97.05 A.97.05 B..
97.06 C-'
97.09 -
98.01 A98.01 B
98.02-
98.03---
98.05..
98.09- -
98.11 C
98.11 D)
98.12-
139
Quantitative restrictions on imports-Continued
AUSTRIA-Continuedhriff No.*-----------Mattresses and mattress supports; quilts, eiderdowns,
cushions, pillows, and similar bedding or furnishing,other than wired spring mattress supports.
*----------Brooms of all kinds, merely bound, with or withouthandles.
----------- Brushes and paintbrushes of all kinds except brushes ofnonprecious metals other than iron and steel, brushesused in machines.
----------- Prepared knots and tufts for brushmaking.----------- Feather dusters.----------- Hand sieves except sieves of nonprecious metals.
--------- Polls except such of cellulose nitrate and cellulose acetate,not dressed.
----------- Engines and coaches for toy trains, of sheet metal.----------- Other toys of wood, glass, ceramics, china, iron, plush and
other materials except bathtowel racks, toy kitchengrinders and mincers, ranges and ethyl alcohol fueling,kitchen and grocery store equipment, bells, piggy banks,vacuum cleaners, telphones, scales and weights, washingmachines and similar toys; dolls house furniture ofmaterials other than wood: nonmechanic toy cars,automobile, aircraft and boat model kits, boxes ofbricks of plastic materials chemical, technical, optical,physical, and radiotechnical experimental kits; chenilletoys, glass pictures, tov watches and clocks, miniaturemodeling outfits of wood and plastic materials, modelingoutlays, blueprints, etc., dolls, kitchen and tableware ofchina, pumping wells.
----------- Billiard and roulette tables.----------- Other parlor and party games.----------- Parts for parlor and party games except table tennis
rackets.----------- Christmas tree decorations except candlesticks.----------- Carnival and entertainment articles other than lent
calendars, chenille toys, parts and figurines for Bethle-hem scene, of paper, carnival novelties of paper, paper-board or china, conjuring kits.
2- Accessories and equipment (other than listed under 97-06A through Cl) for gymnastics, athletics, or for sportsand outdoor games except badminton, Dhron and golfballs, football and handball inners with valve caps,hand fins of rubber, plastic balls with valves, toe-ironsfor skis, (ski) climbers.
----------- Roundabouts and other fairground equipment, exceptcircusses, animal shows, and travelling theaters.
----------- Press studs.----------- Studs, buttons, cuff links and the like, and blanks therefor,
of other materials than aluminum and aluminum alloys.----------- Slide fasteners (zippers); parts of slide fasteners of other
than plastic materials.Fountain pens, stylographs, ball point pens, penholders,
pencil holders, propelling and sliding pencils, parts andfittings therefor, except fountain pens, styles, ball pointpens, and parts thereof nonprecious metals; chalk holdersof aluminum, replacements for ball point pens.
----------- Pencils, pencil leads, crayons and pastels, drawing charcoaland writing and drawing chalk; tailors' and billiardchalk, other than slate pencils of all kinds.
----------- Sealing wax, including bottle sealing wax, in small discs,bar or similar shape.
----------- Smoking pipes, cigar and cigarette holders of other thanceramic materials and steatite; finished pipe bowls
----------- Other parts of the aforementioned smoking utensils, exceptsuch of ceramic materials and steatite.
----------- Fancy combs, hair slides, hair clips, and the like.24-fl74-6- 10
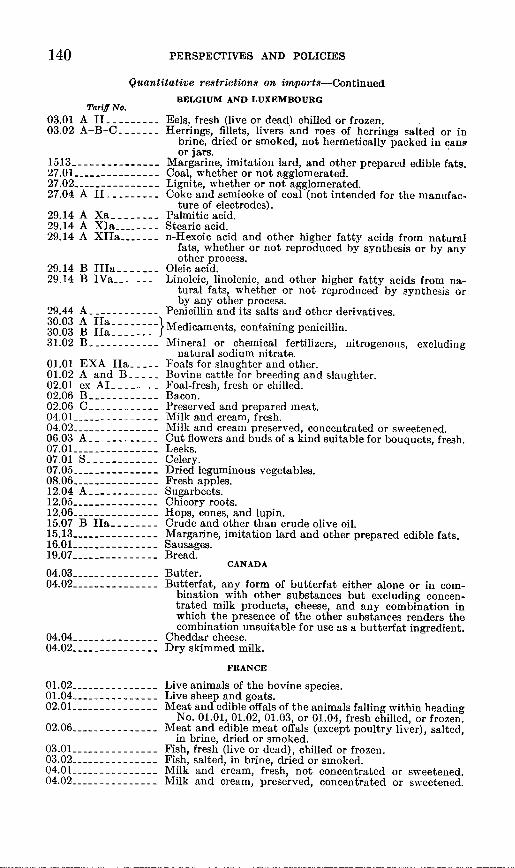
PERSPECTIVES AND POLICIES
Quantitative restrictions on imports-Continued
Tariff No.03.01 A II03.02 A-B-C
1513 _--- -27.01 _- -27.0227.04 A II
29.14 A Xa29.14 A XIa-29.14 A XIIa
29.14 B IIIa29.14 B IVa .
29.4430.0330.0331.02
A
BELGIUM AND LUXEMBOURG
Eels, fresh (live or dead) chilled or frozen.Herrings, fillets, livers and roes of herrings salted or in
brine, dried or smoked, not hermetically packed in cansor jars.
Margarine, imitation lard, and other prepared edible fats.Coal, whether or not agglomerated.Lignite, whether or not agglomerated.Coke and semicoke of coal (not intended for the manufac-
ture of electrodes).Palmitic acid.Stearic acid.n-Hexoic acid and other higher fatty acids from natural
fats, whether or not reproduced by synthesis or by anyother process.
Oleic acid.Linoleic, linolenic, and other higher fatty acids from na-
tural fats, whether or not reproduced by synthesis orby any other process.
Penicillin and its salts and other derivatives.
B Iia -------- Medicaments, con taining penicillin.B
01.01 EXA Ila01.02 A and B02.01 ex AI02.06 B02.06 C04.0104.0206.03 A07.0107.01 S07.05 _08.06 _- -12.04 A _12.0512.06 _-- --15.07 B Isa-15.13 _16.0119.07 _
04.0304.02
04.0404.02
01.0201.04 -- --------02.01
02.06
03.0103.0204.0104.02
Mineral or chemical fertilizers, nitrogenous, excludingnatural sodium nitrate.
Foals for slaughter and other.Bovine cattle for breeding and slaughter.Foal-fresh, fresh or chilled.Bacon.Preserved and prepared meat.Milk and cream, fresh.Milk and cream preserved, concentrated or sweetened.Cut flowers and buds of a kind suitable for bouquets, fresh.Leeks.Celery.Dried leguminous vegetables.Fresh apples.Sugarbeets.Chicory roots.Hops, cones, and lupin.Crude and other than crude olive oil.Margarine, imitation lard and other prepared edible fats.Sausages.Bread.
CANADAButter.Butterfat, any form of butterfat either alone or in com-
bination with other substances but excluding concen-trated milk products, cheese, and any combination inwhich the presence of the other substances renders thecombination unsuitable for use as a butterfat ingredient.
Cheddar cheese.Dry skimmed milk.
FRANCE
Live animals of the bovine species.Live sheep and goats.Meat and edible offals of the animals falling within heading
No. 01.01, 01.02, 01.03, or 01.04, fresh chilled, or frozen.Meat and edible meat offals (except poultry liver), salted,
in brine, dried or smoked.Fish, fresh (live or dead), chilled or frozen.Fish, salted, in brine, dried or smoked.Milk and cream, fresh, not concentrated or sweetened.Milk and cream, preserved, concentrated or sweetened.
140
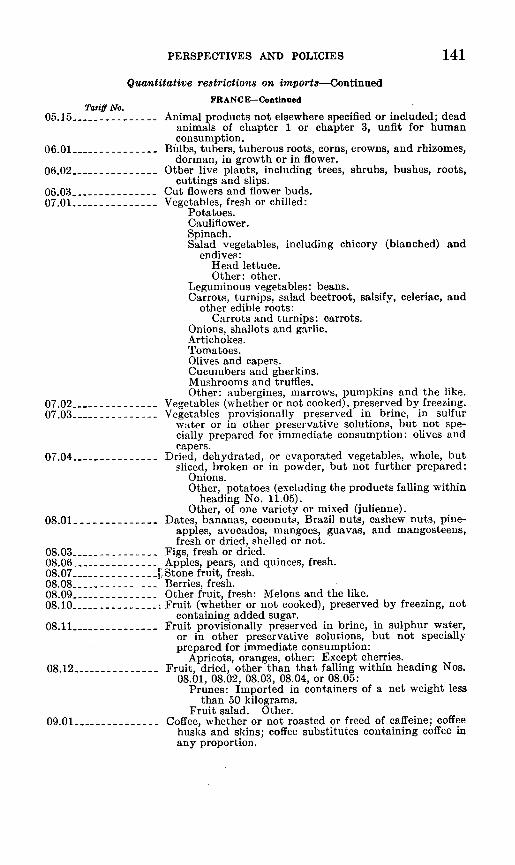
PERSPECTIVES AND POLICIES 141
Quantitative restrictions on imports-Continued
FRANCE-ContinuedTariff No.
05.15 - Animal products not elsewhere specified or included; deadanimals of chapter 1 or chapter 3, unfit for humanconsumption.
06.01- Blbs, tubers, tuberous roots, corns, crowns, and rhizomes,dorman, in growth or in flower.
06.02 -Other live plants, including trees, shrubs, bushes, roots,cuttings and slips.
06.03 -Cut flowers and flower buds.07.01 -Vegetables, fresh or chilled:
Potatoes.Cauliflower.Spinach.Salad vegetables, including chicory (blanched) and
endives:Head lettuce.Other: other.
Leguminous vegetables: beans.Carrots, turnips, salad beetroot, salsify, celeriac, and
other edible roots:Carrots and turnips: carrots.
Onions, shallots and garlic.Artichokes.Tomatoes.Olives and capers.Cucumbers and gherkins.Mushrooms and truffles.Other: aubergines, marrows, pumpkins and the like.
07.02 - Vegetables (whether or not cooked), preserved by freezing.07.03 -Vegetables provisionally preserved in brine, in sulfur
water or in other preservative solutions, but not spe-cially prepared for immediate consumption: olives andcapers.
07.04 - Dried, dehydrated, or evaporated vegetables, whole, butsliced, broken or in powder, but not further prepared:
Onions.Other, potatoes (excluding the products falling within
heading No. 11.05).Other, of one variety or mixed (julienne).
08.01 -Dates, bananas, coconuts, Brazil nuts, cashew nuts, pine-apples, avocados, mangoes, guavas, and mangosteens,fresh or dried, shelled or not.
08.03 -Figs, fresh or dried.08.06 - Apples, pears, and quinces, fresh.08.07 -[--------- Stone fruit, fresh.08.08 -Berries, fresh.08.09 -Other fruit, fresh: Melons and the like.08.10 -. Fruit (whether or not cooked), preserved by freezing, not
containing added sugar.08.11 - Fruit provisionally preserved in brine, in sulphur water,
or in other preservative solutions, but not speciallyprepared for immediate consumption:
Apricots, oranges, other: Except cherries.08.12 -Fruit, dried, other than that falling within heading Nos.
08.01, 08.02, 08.03, 08.04, or 08.05:Prunes: Imported in containers of a net weight less
than 50 kilograms.Fruit salad. Other.
09.01 -Coffee, whether or not roasted or freed of caffeine; coffeehusks and skins; coffee substitutes containing coffee inany proportion.
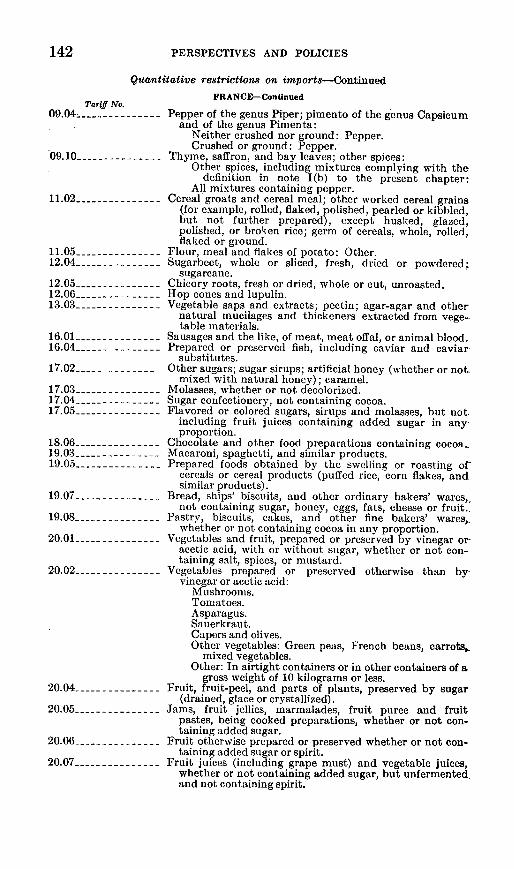
142 PERSPECTIVES AND POLICIES
Quantitative restrictions on imnports-Continuejl
Tariff No.09.04
09.10-
11.02
11.0512.04
12.0512.0613.03
16.0116.04
17.02 .
17.03 .17.04 .17.05 .
18.06 .19.03 .19.05
19.07 -
19.08 .
20.01
20.02 .
20.04 -- -------
20.05 - .-.--------
20.06
20.07 --.-----
FRANCE-Continued
Pepper of the genus Piper; pimento of the genus Capsicumand of the genus Pinmenta:
Neither crushed nor ground: Pepper.Crushed or ground: Pepper.
Thyme, saffron, and bay leaves; other spices:Other spices, including mixtures complying with the
definition in note I(b) to the present chapter:All mixtures containing pepper.
Cereal groats and cereal meal; other worked cereal grains(for example, rolled, flaked, polished, pearled or kibbled,but not further prepared), except husked, glazed,polished, or broken rice; germ of cereals, whole, rolled,flaked or ground.
Flour, meal and flakes of potato: Other.Sugarbeet, whole or sliced, fresh, dried or powdered;
sugareane.Chicory roots, fresh or dried, whole or cut, unroasted.Hop cones and lupulin.Vegetable saps and extracts; pectin; agar-agar and other
natural mucilages and thickeners extracted from vege-table materials.
Sausages and the like, of meat, meat offal, or animal blood.Prepared or preserved fish, including caviar and caviar
substitutes.Other sugars; sugar sirups; artificial honey (whether or not.
mixed with natural honey); caramel.Molasses, whether or not decolorized.Sugar confectionery, not containing cocoa.Flavored or colored sugars, sirups and molasses, but not.
including fruit juices containing added sugar in anyproportion.
Chocolate and other food preparations containing cocoa..Macaroni, spaghetti, and similar products.Prepared foods obtained by the swelling or roasting of-
cereals or cereal products (puffed rice, corn flakes, andsimilar products).
Bread, ships' biscuits, and other ordinary bakers' wares,not containing sugar, honey, eggs, fats, cheese or fruit.
Pastry, biscuits, cakes, and other fine bakers' wares,.whether or not containing cocoa in any proportion.
Vegetables and fruit, prepared or preserved by vinegar or-acetic acid, with or without sugar, whether or not con-taining salt, spices, or mustard.
Vegetables prepared or preserved otherwise than by-vinegar or acetic acid:
Mushrooms.Tomatoes.Asparagus.Sauerkraut.Capers and olives.Other vegetables: Green peas, French beans, carrots,.
mixed vegetables.Other: In airtight containers or in other containers of a
gross weight of 10 kilograms or less.Fruit, fruit-peel, and parts of plants, preserved by sugar
(drained, glace or crystallized).Jams, fruit jellies, marmalades, fruit puree and fruit
pastes, being cooked preparations, whether or not con-taining added sugar.
Fruit otherwise prepared or preserved whether or not con-taining added sugar or spirit.
Fruit juices (including grape must) and vegetable juices,whether or not containing added sugar, but unfermentedand not containing spirit.
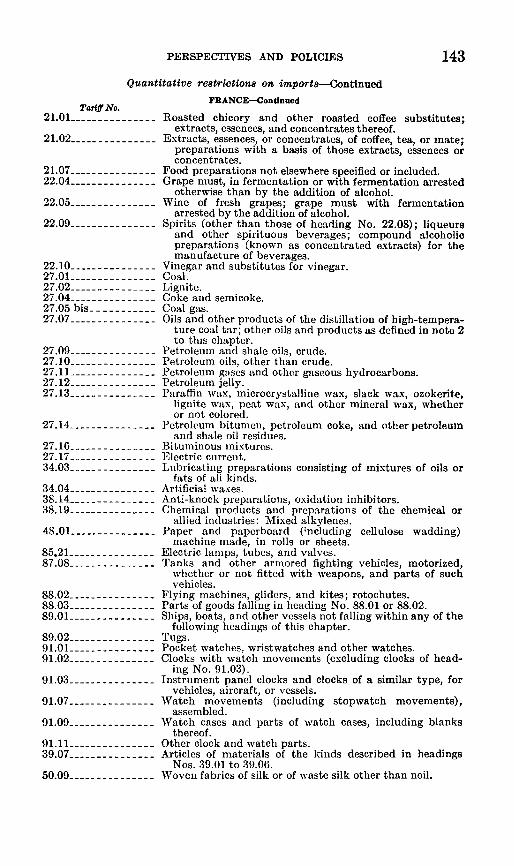
PERSPECTIVES AND POLICIES
Quantitative restrictions on imports-Continued
Tariff No.21.01
21.02
21.0722.04
22.05
22.09
22.1027.0127.0227.0427.05 bis27.07
27.0927.1027.11.27.1227.13
27.14
27.1627.1734.03
34.0438.1438.19
48.01
85.2187.08
88.0288.0389.01
89.029 1.01 ---------------91.02
91.03
91.07
91.09 _- -
91.11 - - - - - -39.07
50.09
FRANCE-Continued
Roasted chicory and other roasted coffee substitutes;extracts, essences, and concentrates thereof.
Extracts, essences, or concentrates, of coffee, tea, or mate;preparations with a basis of those extracts, essences orconcentrates.
Food preparations not elsewhere specified or included.Grape must, in fermentation or with fermentation arrested
otherwise than by the addition of alcohol.Wine of fresh grapes; grape must with fermentation
arrested by the addition of alcohol.Spirits (other than those of heading No. 22.08); liqueurs
and other spirituous beverages; compound alcoholicpreparations (known as concentrated extracts) for themanufacture of beverages.
Vinegar and substitutes for vinegar.Coal.Lignite.Coke and semicoke.Coal gas.Oils and other products of the distillation of high-tempera-
ture coal tar; other oils and products as defined in note 2to this chapter.
Petroleum and shale oils, crude.Petroleum oils, other than crude.Petroleum gases and other gaseous hydrocarbons.Petroleum jelly.Paraffin wax, microcrystalline wax, slack wax, ozokerite,
lignite wax, peat wax, and other mineral wax, whetheror not colored.
Petroleum bitumen, petroleum coke, and other petroleumand shale oil residues.
Bituminous mixtures.Electric current.Lubricating preparations consisting of mixtures of oils or
fats of ali kinds.Artificial waxes.Anti-knock preparations, oxidation inhibitors.Chemical products and preparations of the chemical or
allied industries: Mixed alkylenes.Paper and paperboard (including cellulose wadding)
machine made, in rolls or sheets.Electric lamps, tubes, and valves.Tanks and other armored fighting vehicles, motorized,
whether or not fitted with weapons, and parts of suchvehicles.
Flying machines, gliders, and kites; rotochutes.Parts of goods falling in heading No. 88.01 or 88.02.Ships, boats, and other vessels not falling within any of the
following headings of this chapter.Tugs.Pocket watches, wristwatches and other watches.Clocks with watch movements (excluding clocks of head-
ing No. 91.03).Instrument panel clocks and clocks of a similar type, for
vehicles, aircraft, or vessels.Watch movements (including stopwatch movements),
assembled.Watch cases and parts of watch cases, including blanks
thereof.Other clock and watch parts.Articles of materials of the kinds described in headings
Nos. 39.01 to 39.06.Woven fabrics of silk or of waste silk other than noil.
143

PERSPECTIVES AND POLICIES
Quantitative restrictions on imports-Continued
Tariff No.51.04
53.11
55.0755.0855.0956.07
58.02
58.04
58.05
59.05
60.02
60.03
60.04
60.05
61.0161.0261.03
61.0461.0561.0661.0761.09
62.0162.02
63.01
64.01
64.02
65.01
65.02
FRANCE-Continued
Woven fabrics of manmade fibers (continuous); includingwoven fabrics of monofil or strip of heading No. 51.01 or51.02.
Woven fabrics of sheep's or lambs' wool or of fine animalhair.
Cotton gauze.Terry toweling and similar terry fabrics, of cotton.Other woven fabrics of cotton.Woven fabrics of manmade fibers (discontinuous or
waste).Other carpets, carpeting, rugs, mats and matting, and
"Kelem," "Schumacks," and "Karamanie" rugs and thelike (made up or not).
Woven pile fabrics and chenille fabrics (other than terrytoweling or similar terry fabrics of cotton falling withinheading No. 55.08 and fabrics falling within headingNo. 58.05).
Narrow woven fabrics and narrow fabrics (bolduc) con-sisting of warp without weft assembled by means of anadhesive, other than goods falling within heading No.58.06.
Nets and netting made of twine, cordage, or rope, andmade up fishing nets of yarn, twine, cordage, or rope.
Gloves, -mittens, and mitts, knitted or crocheted, notelastic or rubberized.
Stockings, understockings, socks, sockettes, and the like,knitted or crocheted, not elastic nor rubberized.
Undergarments, knitted or crocheted, not elastic norrubberized.
Outergarments and other articles, knitted or crocheted,not elastic nor rubberized.
Men's and boys' outer garments.Women's, girls', and infants' outer garments.Men's and boys' undergarments, including collars, shirt
fronts, and cuffs.Women's, girls', and infants' undergarments.Handkerchiefs.Shawls, scarves, mufflers, mantillas, veils, and the like.Ties, bow ties, and cravats.Corsets, corset belts, suspender belts, brassieres, braces,
suspenders, garters, and the like (including such articlesof knitted or crocheted fabric), elastic or not.
Traveling rugs and blankets.Bed linen, table linen, toilet linen, and kitchen linen;
curtains and other furnishing articles.Clothing, clothing accessories, traveling rugs and blankets,
household linen and furnishing articles (other thanarticles falling within heading No. 58.01, 58.02, or58.03), of textile materials, footwear and headgear ofany material, showing signs of appreciable wear andimported in bulk, bales, sacks, or similar bulk packings.
Footwear with outer soles and uppers of rubber or arti-ficial plastic material.
Footwear with outer soles of leather or leather substitutes;footwear (other than footwear falling within headingNo. 64.01) with outer soles of rubber or artificial plasticmaterial.
Hat forms, hat bodies, and hoods of felt, neither blockedto shape nor with made brims; plateaux and manchons(including slit manchons), of felt.
Hat shapes, plaited or made from plaited or other stripsof any material, neither blocked to shape nor withmade brims.
144
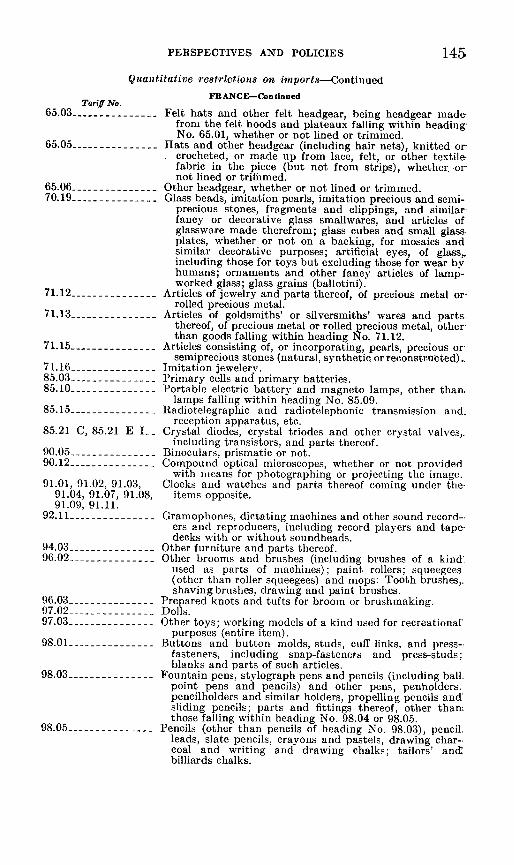
PERSPECTIVES AND POLICIES
Quantitative restrictions on inports-Continued
Tariff No.65.03 ---------------
65.05 ---------------
65.06 -- _-_-_----70.19 ---- ---- --- _
71.12 ---------------
71.13 ---------------
71.15 ---------------
71.16 ---------------85.03 ---------------85.10 ---------------
85.15 ---------------
85.21 C, 85.21 E I
90.05 ---------------90.12 ---------------
91.01, 91.02, 91.03,91.04, 91.07, 91.08,91.09, 91.11.
92.11 ---------------
94.03 ---------------96.02 ---------------
96.03 ---------------97.02 ---------------97.03 ---------------
98.01 ---------------
98.03 ---------------
98.05 ---------------
FRANCE-Continued
Felt hats and other felt headgear, being headgear madefrom the felt hoods and plateaux falling within heading:No. 65.01, whether or not lined or trimmed.
Hats and other headgear (including hair nets), knitted orcrocheted, or made up from lace, felt, or other textilefabric in the piece (but not from strips), whether. ornot lined or trifiimed.
Other headgear, whether or not lined or trimmed.Glass beads, imitation pearls, imitation precious and semi-
precious stones, fragments and clippings, and similarfancy or decorative glass smallwares, and articles ofglassware made therefrom; glass cubes and small glass.plates, whether or not on a backing, for mosaics andsimilar decorative purposes; artificial eyes, of glass,.including those for toys but excluding those for wear byhumans; ornaments and other fancy articles of lamp-worked glass; glass grains (ballotini).
Articles of jewelry and parts thereof, of precious metal or-rolled precious metal.
Articles of goldsmiths' or silversmiths' wares and partsthereof, of precious metal or rolled precious metal, other-than goods falling within heading No. 71.12.
Articles consisting of, or incorporating, pearls, precious orsemiprecious stones (natural, synthetic or reconstructed)
Imitation jewelery.Primary cells and primary batteries.Portable electric battery and magneto lamps, other than
lamps falling within heading No. 85.09.Radiotelegraphic and radiotelephonic transmission and
reception apparatus, etc.Crystal diodes, crystal triodes and other crystal valves,.
including transistors, and parts thereof.Binoculars, prismatic or not.Compound optical microscopes, whether or not provided
with means for photographing or projecting the image.Clocks and watches and parts thereof coining under the-
items opposite.
Gramophones, dictating machines and other sound record--ers and reproducers, including record players and tape-decks with or without soundheads.
Other furniture and parts thereof.Other brooms and brushes (including brushes of a kind.
used as parts of machines); paint rollers; squeegees(other than roller squeegees) and mops: Tooth brushes,.shaving brushes, drawing and paint brushes.
Prepared knots and tufts for broom or brushmaking.Dolls.Other toys; working models of a kind used for recreational'
purposes (entire item).Buttons and button molds, studs, cuff links, and press-
fasteners, including snap-fasteners and press-studs;blanks and parts of such articles.
Fountain pens, stylograph pens and pencils (including ball.point pens and pencils) and other pens, penholders.pencilholders and similar holders, propelling pencils and'sliding pencils; parts and fittings thereof, other than:those falling within heading No. 98.04 or 98.05.
Pencils (other than pencils of heading No. 98.03), pencil.leads, slate pencils, crayons and pastels, drawing char-coal and writing and drawing chalks; tailors' ancibilliards chalks.
145
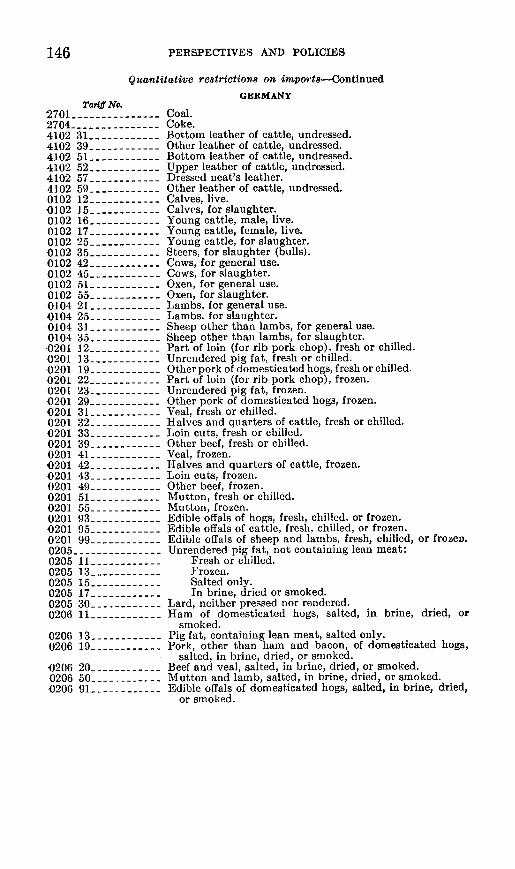
146 PERSPECTIVES AND POLICIES
Quantitative restrictions on imports-Continued
GERMANYTariff No.
2701 -- Coal.2704 ------ Coke.4102 31 --Bottom leather of cattle, undressed.4102 39 -Other leather of cattle, undressed.4102 51 -Bottom leather of cattle, undressed.4102 52 - Upper leather of cattle, undressed.4102 57 -Dressed neat's leather.4102 59 - Other leather of cattle, undressed.0102 12 -Calves, live.0102 15 - Calves, for slaughter.0102 16 - Young cattle, male, live.0102 17_----------- Young cattle, female, live.0102 25 - Young cattle, for slaughter.0102 35 - Steers, for slaughter (bulls).0102 42 - Cows, for general use.0102 45 -Cows, for slaughter.0102 51 -Oxen, for general use.0102 55 -Oxen, for slaughter.0104 21 -Lambs, for general use.0104 25 -Lambs, for slaughter.0104 31 -Sheep other than lambs, for general use.0104 35 - Sheep other than lambs, for slaughter.0201 12 -Part of loin (for rib pork chop), fresh or chilled.0201 13 -Unrendered pig fat, fresh or chilled.0201 19 -Other pork of domesticated hogs, fresh or chilled.0201 22 -Part of loin (for rib pork chop), frozen.0201 23 -Unrendered pig fat, frozen.0201 29 -Other pork of domesticated hogs, frozen.0201 31 -Veal, fresh or chilled.0201 32 -Halves and quarters of cattle, fresh or chilled.40201 33 -Loin cuts, fresh or chilled.0201 39 -Other beef, fresh or chilled.0201 41 -Veal, frozen.0201 42 -Halves and quarters of cattle, frozen.0201 43 -Loin cuts, frozen.0201 49 -Other beef, frozen.0201 51 -Mutton, fresh or chilled.0201 55 -Mutton, frozen.0201 93 -Edible offals of hogs, fresh, chilled, or frozen.0201 95 -Edible offals of cattle, fresh, chilled, or frozen.0201 99 -Edible offals of sheep and lambs, fresh, chilled, or frozeD.0205 - -Unrendered pig fat, not containing lean meat:0205 11 -Fresh or chilled.0205 13 -Frozen.0205 15 -Salted only.0205 17_----------- In brine, dried or smoked.0205 30 -Lard, neither pressed nor rendered.0206 11 -Ham of domesticated hogs, salted, in brine, dried, or
smoked.0206 13 -Pig fat, containing lean meat, salted only.0206 19 -Pork, other than ham and bacon, of domesticated hogs,
* salted, in brine, dried, or smoked.0206 20 -Beef and veal, salted, in brine, dried, or smoked.0206 50 -Mutton and lamb, salted, in brine, dried, or smoked.0206 91 -Edible offals of domesticated hogs, salted, in brine, dried,
or smoked.
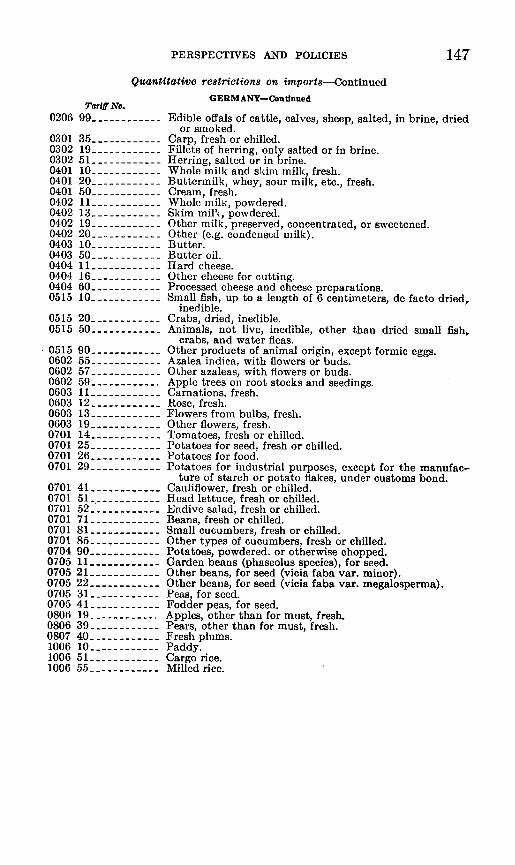
147PERSPECTIVES AND POLICIES
Quantitative restrictions on imports-Continued
Tariff No.0206 99
0301 350302 190302 510401 100401 200401 500402 110402 130402 190402 200403 100403 500404 110404 160404 600515 10
0515 200515 50
0515 900602 550602 570602 590603 110603 120603 130603 190701 140701 250701 260701 29
070107010701070107010701070407050705070507050705080608060807100610061006
41 _-- - -51 _ - .5271 _81-85-90 _- - -- - -1 1 _ -- --… ---21 _- - - -22 _- -314119 ----- -------39-401051-55-
GERMANY-Continued
Edible offals of cattle, calves, sheep, salted, in brine, driedor smoked.
Carp, fresh or chilled.Fillets of herring, only salted or in brine.Herring, salted or in brine.Whole milk and skim milk, fresh.Buttermilk, whey, sour milk, etc., fresh.Cream, fresh.Whole milk, powdered.Skim milk, powdered.Other milk, preserved, concentrated, or sweetened.Other (e.g. condensed milk).Butter.Butter oil.Hard cheese.Other cheese for cutting.Processed cheese and cheese preparations.Small fish, up to a length of 6 centimeters, de facto dried,
inedible.Crabs, dried, inedible.Animals, not live, inedible, other than dried small fish,
crabs, and water fleas.Other products of animal origin, except formic eggs.Azalea indica, with flowers or buds.Other azaleas, with flowers or buds.Apple trees on root stocks and seedings.Carnations, fresh.Rose, fresh.Flowers from bulbs, fresh.Other flowers, fresh.Tomatoes, fresh or chilled.Potatoes for seed, fresh or chilled.Potatoes for food.Potatoes for industrial purposes, except for the manufac-
ture of starch or potato flakes, under customs bond.Cauliflower, fresh or chilled.Head lettuce, fresh or chilled.Endive salad, fresh or chilled.Beans, fresh or chilled.Small cucumbers, fresh or chilled.Other types of cucumbers, fresh or chilled.Potatoes, powdered. or otherwise chopped.Garden beans (phaseolus species), for seed.Other beans, for seed (vicia faba var. minor).Other beans, for seed (vicia faba var. megalosperma).Peas, for seed.Fodder peas, for seed.Apples, other than for must, fresh.Pears, other than for must, fresh.Fresh plums.Paddy.Cargo rice.Milled rice.
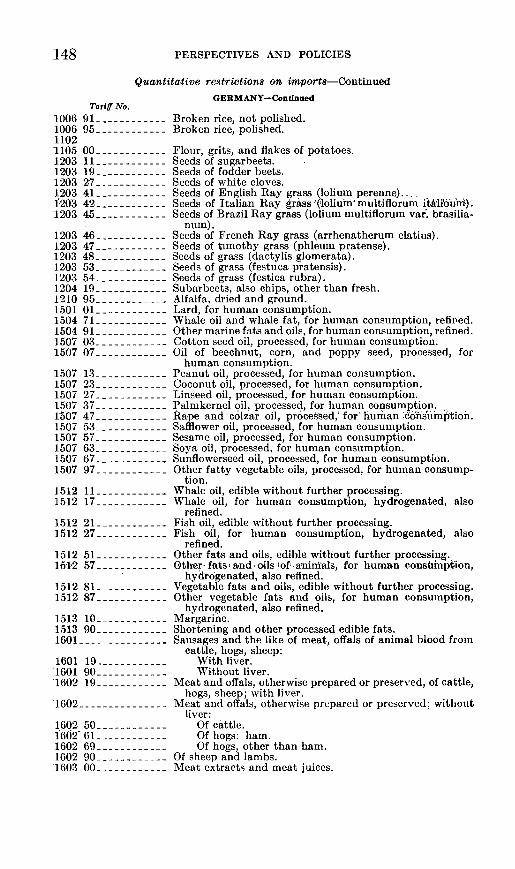
PERSPECTIVES AND POLICIES
Quantitative restrictions on imports-Continued
Tariff No.
1006 911006 95-11021105 00-1203 111203 191203 27 ----1203 41f203 421203 45 ----
1203 461203 47------------1203 481203 53 -----------1203 54 ----------1204 191210 95 ----------1501 01-1504 711504 911507 03------------1507 07 -----------
1507 131507 231507 271507 371507 47-1507 53------------1507 57 -----------1507 631507 67 .1507 97------------
1512 11 .1512 17 .
1512 21 .1512 27
1512 51 .1512 57 ----
1512 811512 87 .
1513 10 .1513 90 .1601 - .-.------.----
1601 19 .1601 90 .1602 19 .
1602
1602 501602- 61 .1602 69 .1602 90 ----1603 00 .
GERMANY-Continued
Broken rice, not polished.Broken rice, polished.
Flour, grits, and flakes of potatoes.Seeds of sugarbeets.Seeds of fodder beets.Seeds of white cloves.Seeds of English Ray grass (lolium perenne).,.Seeds of Italian Ray grass (loliuhmvmultiflorum itui?6uh).Seeds of Brazil Ray grass (lolium multiflorum vat. brasilia-
num).Seeds of French Ray grass (arrhenatherum elatius).Seeds of timothy grass (phleum pratense).Seeds of grass (dactylis glomerata).Seeds of grass (festuca pratensis).Seeds of grass (festica rubra).Subarbeets, also chips, other than fresh.Alfalfa, dried and ground.Lard, for human consumption.Whale oil and whale fat, for human consumption, refired.Other marine fats and oils, for human consumption, refined.Cotton seed oil, processed, for human consumption.Oil of beechnut, corn, and poppy seed, processed, for
human consumption.Peanut oil, processed, for human consumption.Coconut oil, processed, for human consumption.Linseed oil, processed, for human consumption.Palmkernel oil, processed, for human consumption.Rape and colzar oil, processed,' for human consuminptioh.Safflower oil, processed, for human consumption.Sesame oil, processed, for human consumption.Soya oil, processed, for human consumption.Sunflowerseed oil, processed, for human consumption.Other fatty vegetable oils, processed, for human consump-
tion.Whale oil, edible without further processing.Whale oil, for human consumption, hydrogenated, also
refined.Fish oil, edible without further processing.Fish oil, for human consumption, hydrogenated, also
refined.Other fats and oils, edible without further processing.Other fats'and oils'of atnimn8als, for human consuinption,
hydrogenated, also refined.Vegetable fats and oils, edible without further processing.Other vegetable fats and oils, for human consumption,
hydrogenated, also refined.Margarine.Shortening and other processed edible fats.Sausages and the like of meat, offals of animal blood from
cattle, hogs, sheep:With liver.Without liver.
Meat and offals, otherwise prepared or preserved, of cattle,hogs, sheep; with liver.
Meat and offals, otherwise prepared or preserved; withoutliver:
Of cattle.Of hogs: ham.Of hogs, other than ham.
Of sheep and lambs.Meat extracts and meat juices.
148
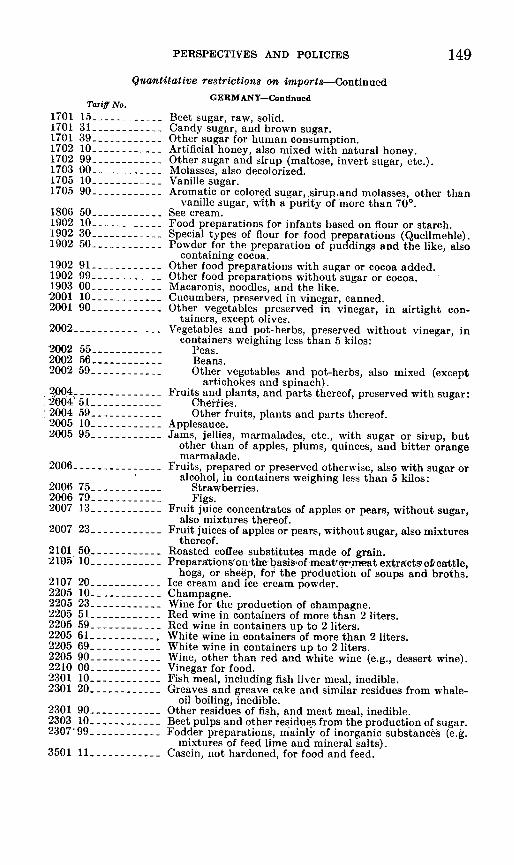
149PERSPECTIVES AND POLICIES
Quantitative restrictions on imports-Continued
Tariff No.153139-10 --- -- -- -- -- -9 9-001 0 - - --- -- -- -- -90-
1806 501902 10 -1902 301902 50 -
9199 9-00-10-90-
2002
2002 552002 562002 59
20042004 512004 59------------2005 102005 95
2006
2006 752006 792007 13
2007 23
2101 502105 10
2107 202205 102205 232205 512205 592205 612205 692205 902210 002301 102301 20
2301 902303 102307'99
3501 11
GERMANY-Continued
Beet sugar, raw, solid.Candy sugar, and brown sugar.Other sugar for human consumption.Artificial honey, also mixed with natural honey.Other sugar and sirup (maltose, invert sugar, etc.).Molasses, also decolorized.Vanille sugar.Aromatic or colored sugar,.sirup.and molasses, other than
vanille sugar, With a purity of more than 70°.See cream.Food preparations for infants based on flour or starch.Special types of flour for food preparations (Quellmehle).Powder for the preparation of puddings and the like, also
containing cocoa.Other food preparations with sugar or cocoa added.Other food preparations without sugar or cocoa.Macaronis, noodles, and the like.Cucumbers, preserved in vinegar, canned.Other vegetables preserved in vinegar, in airtight con-
tainers, except olives.Vegetables and pot-herbs, preserved without vinegar, in
containers weighing less than 5 kilos:Peas.Beans.Other vegetables and pot-herbs, also mixed (except
artichokes and spinach).Fruits and plants, and parts thereof, preserved with sugar:
Cherties.Other fruits, plants and parts thereof.
Applesauce.Jams, jellies, marmalades, etc., with sugar or sirup, but
other than of apples, plums, quinces, and bitter orangemarmalade.
Fruits, prepared or preserved otherwise, also with sugar oralcohol, in containers weighing less than 5 kilos:
Strawberries.Figs.
Fruit juice concentrates of apples or pears, without sugar,also mixtures thereof.
Fruit juices of apples or pears, without sugar, also mixturesthereof.
Roasted coffee substitutes made of grain.Preparations'on-the basisgof-meat'ormeat extractsofrcattle,
hogs, or sheep, for the production of soups and broths.Ice cream and ice cream powder.Champagne.Wine for the production of champagne.Red wine in containers of more than 2 liters.Red wine in containers up to 2 liters.White wine in containers of more than 2 liters.White wine in containers up to 2 liters.Wine, other than red and white wine (e.g., dessert wine).Vinegar for food.Fish meal, including fish liver meal, inedible.Greaves and greave cake and similar residues from whale-
oil boiling, inedible.Other residues of fish, and meat meal, inedible.Beet pulps and other residues from the production of sugar.Fodder preparations, mainly of inorganic substances (e.g.
mixtures of feed lime and mineral salts).Casein, not hardened, for food and feed.
17011701170117021702170317051705
19021902190320012001
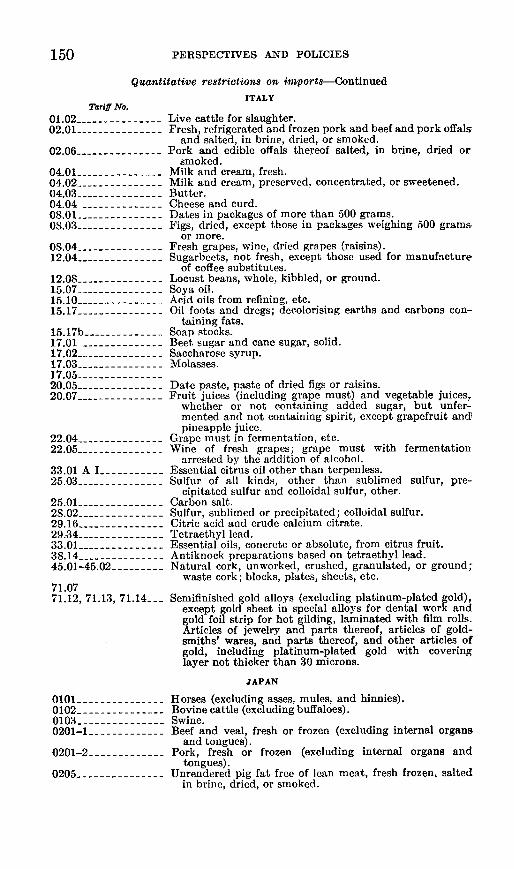
150 PERSPECTIVES AND POLICIES
Quantitative restrictions on imports-Continued
ITALYTariff No.
01.02 -- Live cattle for slaughter.02.01 -Fresh, refrigerated and frozen pork and beef and pork offals
and salted, in brine, dried, or smoked.02.06 - Pork and edible offals thereof salted, in brine, dried or
smoked.04.01 - Milk and cream, fresh.04.02. -Milk and cream, preserved, concentrated, or sweetened.04.03 -Butter.04.04 -Cheese and curd.08.01 -Dates in packages of more than 500 grams.08.03 -Figs, dried, except those in packages weighing 500 grams
or more.08.04 -Fresh grapes, wine, dried grapes (raisins).12.04 -Sugarbeets, not fresh, except those used for manufacture
of coffee substitutes.12.08 -Locust beans, whole, kibbled, or ground.15.07 -Soya oil.15.10- Acid oils from refining, etc.15.17 -Oil foots and dregs; decolorising earths and carbons con-
taining fats.15.17b - Soap stocks.17.01 -Beet sugar and cane sugar, solid.17.02 .- Saccharose syrup.17.03 -Molasses.17.05 _20.05 -Date paste, paste of dried figs or raisins.20.07 -Fruit juices (including grape must) and vegetable juices,
whether or not containing added sugar, but unfer-mented and not containing spirit, except grapefruit andpineapple juice.
22.04 - Grape must in fermentation, etc.22.05 -Wine of fresh grapes; grape must with fermentation
arrested by the addition of alcohol.33.01 A I -Essential citrus oil other than terpenless.25.03 -Sulfur of all kinds, other than sublimed sulfur, pre-
cipitated sulfur and colloidal sulfur, other.25.01 -Carbon salt.28.02 -Sulfur, sublimed or precipitated; colloidal sulfur.29.16 -Citric acid and crude calcium citrate.29.34 -Tetraethyl lead.33.01 -Essential oils, concrete or absolute, from citrus fruit.38.14 -Antiknock preparations based on tetraethyl lead.45.01-45.02 - Natural cork, unworked, crushed, granulated, or ground;
waste cork; blocks, plates, sheets, etc.71.0771.12, 71.13, 71.14..-- Semifinished gold alloys (excluding platinum-plated gold),
except gold sheet in special alloys for dental work andgold foil strip for hot gilding, laminated with film rolls.Articles of jewelry and parts thereof, articles of gold-smiths' wares, and parts thereof, and other articles ofgold, including platinum-plated gold with coveringlayer not thicker than 30 microns.
JAPAN
0101 -Horses (excluding asses, mules, and hinnies).0102 -Bovine cattle (excluding buffaloes).0103 -Swine.0201-1 - Beef and veal, fresh or frozen (excluding internal organs
and tongues).0201-2 - Pork, fresh or frozen (excluding internal organs and
tongues).0205 -Unrendered pig fat free of lean meat, fresh frozen, salted
in brine, dried, or smoked.
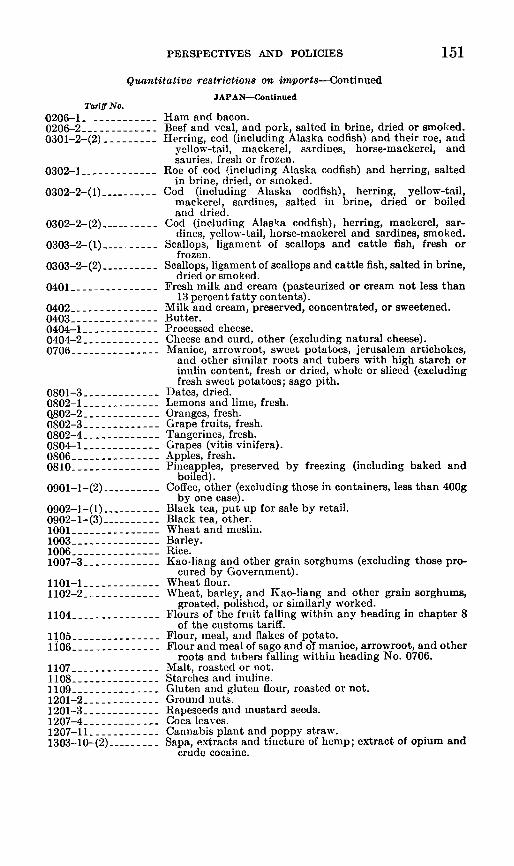
151PERSPECTIVES AND POLICIES
Quantitative restrictions on imports-Continued
JAPAN-ContinuedTariff No.
0206-1 -Ham and bacon.0206-2 -Beef and veal, and pork, salted in brine, dried or smoked.0301-2-(2) -Herring, cod (including Alaska codfish) and their roe, and
yellow-tail, mackerel, sardines, horse-mackerel, andsauries. fresh or frozen.
0302-1i - Roe of cod (including Alaska codfish) and herring, saltedin brine, dried, or smoked.
0302-2-(1) -Cod (including Alaska codfish), herring, yellow-tail,mackerel, sardines, salted in brine, dried or boiledand dried.
0302-2-(2) -Cod (including Alaska codfish), herring, mackerel, sar-dines, yellow-tail, horse-mackerel and sardines, smoked.
0303-2-(1) -Scallops, ligament of scallops and cattle fish, fresh orfrozen.
0303-2-(2) -Scallops, ligament of scallops and cattle fish, salted in brine,dried or smoked.
0401 -Fresh milk and cream (pasteurized or cream not less than13 percent fatty contents).
0402 -Milk and cream, preserved, concentrated, or sweetened.0403 -Butter.0404-1 -Processed cheese.0404-2 -Cheese and curd, other (excluding natural cheese).0706 -Manioc, arrowroot, sweet potatoes, jerusalem artichokes,
and other similar roots and tubers with high starch orinulin content, fresh or dried, whole or sliced (excludingfresh sweet potatoes; sago pith.
0801-3 -Dates, dried.0802-1 -Lemons and lime, fresh.Q802-2 -Oranges, fresh.0802-3 - Grape fruits, fresh.0802-4 - Tangerines, fresh.0804-1 … … Grapes (vitis vinifera).0806 - Apples, fresh.0810 -Pineapples, preserved by freezing (including baked and
boiled).0901-1-(2) -Coffee, other (excluding those in containers, less than 400g
by one case).0902-1-(1) -Black tea, put up for sale by retail.0902-1-(3) -Black tea, other.1001 - Wheat and meslin.1003 -Barley.1006 -Rice.1007-3 -Kao-liang and other grain sorghums (excluding those pro-
cured by Government).1101-1 -Wheat flour.1102-2 -Wheat, barley, and Kao-liang and other grain sorghums,
groated, polished, or similarly worked.1104 -Flours of the fruit falling within any heading in chapter 8
of the customs tariff.1105 -Flour, meal, and flakes of potato.liO6 -Flour and meal of sago and of manioc, arrowroot, and other
roots and tubers falling within heading No. 0706.1107 -Malt, roasted or not.1108 -Starches and inuline.1109 -Gluten and gluten flour, roasted or not.1201-2 -Ground nuts.1201-3 -Rapeseeds and mustard seeds.1207-4 -Coca leaves.1207-11 -Cannabis plant and poppy straw.1303-l0-(2) -Sapa, extracts and tincture of hemp; extract of opium and
crude cocaine.
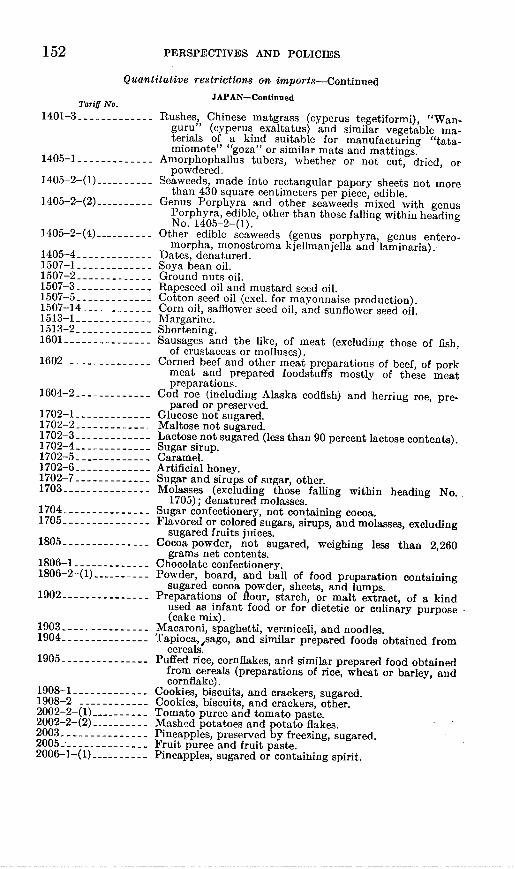
PERSPECTIVES AND POLICIES
Quantitative restrictions on imports-Continued
Tariff No.1401-3- -
1405-1 .
1405-2-(1)
1405-2-(2)
1405-2-(4)
1405-4 -------1507-11507-21507 3 ---------3--1507-5 -------------1507-141513-11513-21601
1602
1604-2
1702-11702-21702-3 3 - -1702-4 -41702-51702-61702-7 -1703
1704 -------------1705 ---------------
1805-
1806-1 -------------1806-2-(1)
1902 _
1903 ------------1904 ------------
1905 -------------
1908-11908-22002-2-(1)2002-2-(2)20032005 - --------2006-1-(1)
JAPAN-Continued
Rushes, Chinese matgrass (cyperus tegetiformi), "Wan-guru" (cyperus exaltatus) and similar vegetable ma-terials of a kind suitable for manufacturing "tata-miomote" "goza" or similar mats and mattings.
*Amorphophallus tubers, whether or not cut, dried, orpowdered.
Seaweeds, made into rectangular papery sheets not morethan 430 square centimeters per piece, edible.
Genus Porphyra and other seaweeds mixed with genusPorphyra, edible, other than those falling within headingNo. 1405-2-(1).
Other edible seaweeds (genus porphyra, genus entero-morpha, monostroma kjellmanjella and laminaria).
Dates, denatured.Soya bean oil.Ground nuts oil.Rapeseed oil and mustard seed oil.Cotton seed oil (excl. for mayonnaise production).Corn oil, safflower seed oil, and sunflower seed oil.Margarine.Shortening.Sausages and the like, of meat (excluding those of fish,
of crustaceas or molluscs).Corned beef and other meat preparations of beef, of pork
meat and prepared foodstuffs mostly of these meatpreparations.
Cod roe (including Alaska codfish) and herring roe, pre-pared or preserved.
Glucose not sugared.Maltose not sugared.Lactose not sugared (less than 90 percent lactose contents).Sugar sirup.Caramel.Artificial honey.Sugar and sirups of sugar, other.Molasses (excluding those falling within heading No.
1705); denatured molasses.Sugar confectionery, not containing cocoa.Flavored or colored sugars, sirups, and molasses, excluding
sugared fruits juices.Cocoa powder, not sugared, weighing less than 2,260
grams net contents.Chocolate confectionery.Powder, board, and ball of food preparation containing
sugared cocoa powder, sheets, and lumps.Preparations of flour, starch, or malt extract, of a kind
used as infant food or for dietetic or culinary purpose(cake mix).
Macaroni, spaghetti, vermiceli, and noodles.Tapioca, ,sago, and similar prepared foods obtained from
cereals.Puffed rice, cornflakes, and similar prepared food obtained
from cereals (preparations of rice, wheat or barley, andcornflake).
Cookies, biscuits, and crackers, sugared.Cookies, biscuits, and crackers, other.Tomato puree and tomato paste.Mashed potatoes and potato flakes.Pineapples, preserved by freezing, sugared.Fruit puree and fruit paste.Pineapples, sugared or containing spirit.
152
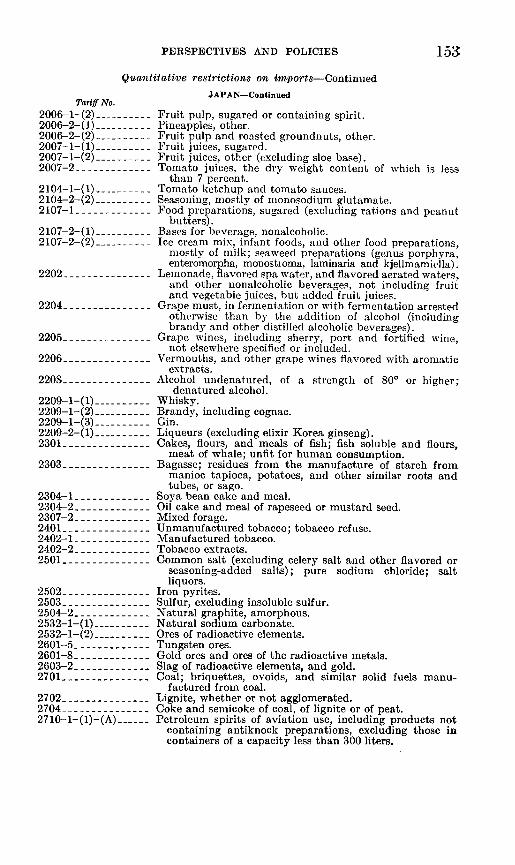
153PERSPECTIVES AND POLICIES
Quantitative restrictions on imports-Continued
Tariff No.2006-1-(2)2006-2-(1)2006-2-(2)2007-1-(1)-------2007-l-(2) ----2007-2
2104-1-(1)------2104-2-(2)2107-1
2107-2-(1)2107-2-(2)
2202
2204 ------------
2205 -------------
2206
2208
2209-1-(1)2209-1-(2)2209-1-(3)2209-2-(1)2301
2303 ------------
2304-12304-22307-224012402-12402-22501
250225032504-22532-1-(1)2532-1-(2)2601-52601-82603-22701
270227042710-1-(1)-(A)
JAPAN-Continued
Fruit pulp, sugared or containing spirit.Pineapples, other.Fruit pulp and roasted groundnuts, other.Fruit juices, sugared.Fruit juices, other (excluding sloe base).Tomato juices. the dry weight content of which is less
than 7 percent.Tomato ketchup and tomato sauces.Seasoning, mostly of monosodium glutamate.Food preparations, sugared (excluding rations and peanut
butters).Bases for beverage, nonalcoholic.Ice cream mix, infant foods, and other food preparations,
mostly of milk; seaweed preparations (genus porphyra,enteromorpha, monostioma, laminaria and kjellmamiella).
Lemonade, flavored spa water, and flavored aerated waters,and other nonalcoholic beverages, not including fruitand vegetable juices, but added fruit juices.
Grape must, in fermentation or with fermentation arrestedotherwise than by the addition of alcohol (includingbrandy and other distilled alcoholic beverages).
Grape wines, including sherry, port and fortified wine,not elsewhere specified or included.
Vermouths, and other grape wines flavored with aromaticextracts.
Alcohol undenatured, of a strength of 800 or higher;denatured alcohol.
Whisky.Brandy, including cognac.Gin.Liqueurs (excluding elixir Korea ginseng).Cakes, flours, and meals of fish; fish soluble and flours,
meat of whale; unfit for human consumption.Bagasse; residues from the manufacture of starch from
manioc tapioca, potatoes, and other similar roots andtubes, or sago.
Soya bean cake and meal.Oil cake and meal of rapeseed or mustard seed.Mixed forage.Unmanufactured tobacco; tobacco refuse.Manufactured tobacco.Tobacco extracts.Common salt (excluding celery salt and other flavored or
seasoning-added salts); pure sodium chloride; saltliquors.
Iron pyrites.Sulfur, excluding insoluble sulfur.Natural graphite, amorphous.Natural sodium carbonate.Ores of radioactive elements.Tungsten ores.Gold ores and ores of the radioactive metals.Slag of radioactive elements, and gold.Coal; briquettes, ovoids, and similar solid fuels manu-
factured from coal.Lignite, whether or not agglomerated.Coke and semicoke of coal, of lignite or of peat.Petroleum spirits of aviation use, including products not
containing antiknock preparations, excluding those incontainers of a capacity less than 300 liters.
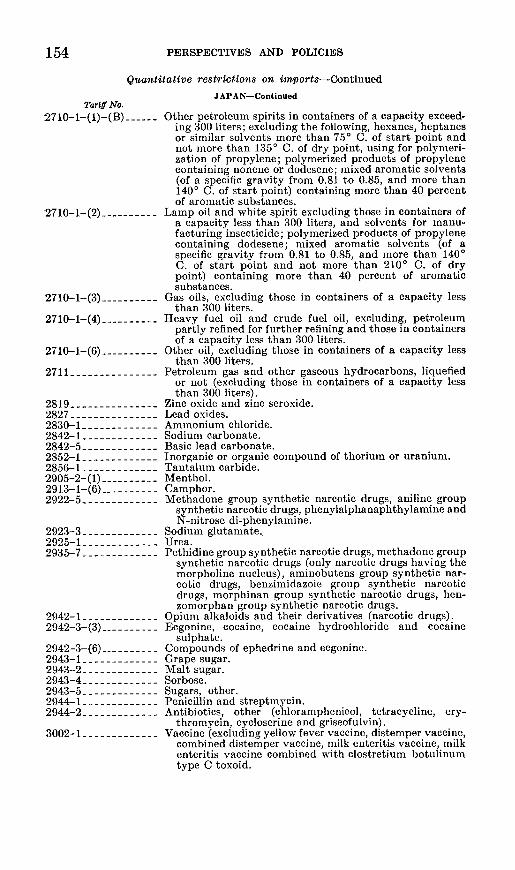
PERSPECTIVES AND POLICIES
Quantitative restrictions on imports-Continued
Tariff No.2710-1-(1)-(B)
2710-1-(2)-
2710-1-(3)-
2710-1-(4) -
2710-1-(6)-
2711
281928272830-2842-1-2842-52S52-12856-12905-2-(1)-2913-1-(6)2922-5
2923-32925-1 -2935-7
2942-12942-3-(3)
2942-3-(6)2943-12943-22943-42943-52944-12944-2-
3002-1
JAPAN-Continued
Other petroleum spirits in containers of a capacity exceed-ing 300 liters; excluding the following, hexanes, heptanesor similar solvents more than 750 C. of start point andnot more than 135° C. of dry point, using for polymeri-zation of propylene; polymerized products of propylenecontaining nonene or dodesene; mixed aromatic solvents(of a specific gravity from 0.81 to 0.85, and more than140° C. of start point) containing more than 40 percentof aromatic substances.
Lamp oil and white spirit excluding those in containers ofa capacity less than 300 liters, and solvents for manu-facturing insecticide; polymerized products of propylenecontaining dodesene; mixed aromatic solvents (of aspecific gravity from 0.81 to 0.85, and more than 140°C. of start point and not more than 2100 C. of drypoint) containing more than 40 percent of aromaticsubstances.
Gas oils, excluding those in containers of a capacity lessthan 300 liters.
Heavy fuel oil and crude fuel oil, excluding, petroleumpartly refined for further refining and those in containersof a capacity less than 300 liters.
Other oil, excluding those in containers of a capacity lessthan 300 liters.
Petroleum gas and other gaseous hydrocarbons, liquefiedor not (excluding those in containers of a capacity lessthan 300 liters).
Zinc oxide and zinc seroxide.Lead oxides.Ammonium chloride.Sodium carbonate.Basic lead carbonate.Inorganic or organic compound of thorium or uranium.Tantalum carbide.Menthol.Camphor.Methadone group synthetic narcotic drugs, aniline group
synthetic narcotic drugs, phenylalphanaphthylamine andN-nitrose di-phenylamine.
Sodium glutamate.Urea.Pethidine group synthetic narcotic drugs, methadone group
synthetic narcotic drugs (only narcotic drugs having themorpholine nucleus), aminobutens group synthetic nar-cotic drugs, benzimidazoie group synthetic narcoticdrugs, morphinan group synthetic narcotic drugs, hen-zomorphan group synthetic narcotic drugs.
Opium alkaloids and their derivatives (narcotic drugs).Ecgonine, cocaine, cocaine hydrochloride and cocaine
sulphate.Compounds of ephedrine and ecgoninc.Grape sugar.Malt sugar.Sorbose.Sugars, other.Penicillin and streptmycin.Antibiotics, other (chloramphenicol, tetracycline, ery-
thromycin, cycloserine and griseofulvin).Vaccine (excluding yellow fever vaccine, distemper vaccine,
combined distemper vaccine, milk enteritis vaccine, milkenteritis vaccine combined with clostretium botulinumtype C toxoid.
154
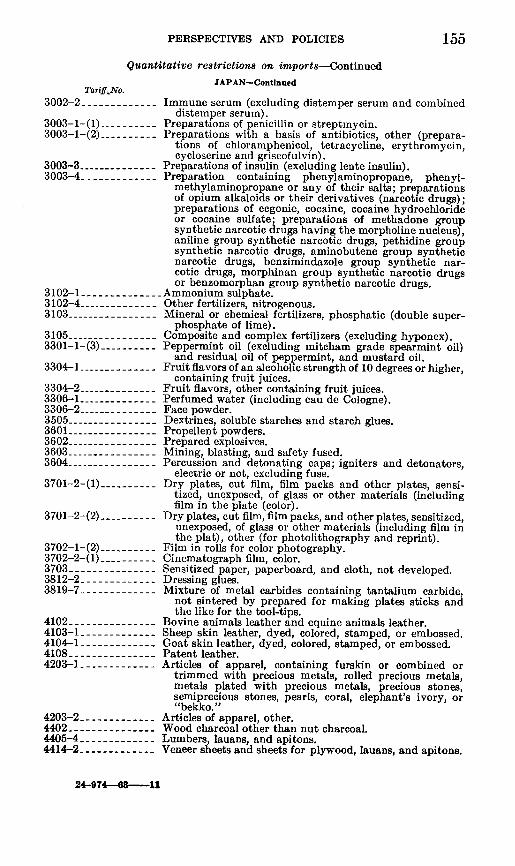
PERSPECTIVES AND POLICIES 155
Quantitative restrictions on imports-Continued
JAPAN-ContinuedTariffNo.
3002-2 -Immune serum (excluding distemper serum and combineddistemper serum).
3003-1-(i) -Preparations of penicillin or streptmycin.3003-1-(2) -Preparations with a basis of antibiotics, other (prepara-
tions of chloramphenicol, tetracycline, erythromycin,cycloserine and griseofulvin).
3003-3 -Preparations of insulin (excluding lente insulin).3003-4 -Preparation containing phenylaminopropane, phenyl-
methylaminopropane or any of their salts; preparationsof opium alkaloids or their derivatives (narcotic drugs);preparations of ecgonie, cocaine, cocaine hydrochlorideor cocaine sulfate; preparations of methadone groupsynthetic narcotic drugs having the morpholine nucleus),aniline group synthetic narcotic drugs, pethidine groupsynthetic narcotic drugs, aminobutene group syntheticnarcotic drugs, benzimindazole group synthetic nar-cotic drugs, morphinan group synthetic narcotic drugsor benzomorphan group synthetic narcotic drugs.
3102-1 -Ammonium sulphate.3102-4 -Other fertilizers, nitrogenous.3103 -Mineral or chemical fertilizers, phosphatic (double super-
phosphate of lime).3105 -Composite and complex fertilizers (excluding hyponex).3301-1-(3) -Peppermint oil (excluding mitcham grade spearmint oil)
and residual oil of peppermint, and mustard oil.3304-1 -Fruit flavors of an alcoholic strength of 10 degrees or higher,
containing fruit juices.3304-2 -Fruit flavors, other containing fruit juices.3306-1 -Perfumed water (including eau de Cologne).3306-2 -Face powder.3505 -Dextrines, soluble starches and starch glues.3601 -Propellent powders.3602 -Prepared explosives.3603 -Mining, blasting, and safety fused.3604 -Percussion and detonating caps; igniters and detonators,
electric or not, excluding fuse.3701-2-(l) -Dry plates, cut film, film packs and other plates, sensi-
tized, unexposed, of glass or other materials (includingfilm in the plate (color).
3701-2-(2) -Dry plates, cut film, film packs, and other plates, sensitized,unexposed, of glass or other materials (including film inthe plat), other (for photolithography and reprint).
3702-1-(2) -Film in rolls for color photography.3702-2-(1) -Cinematograph film, color.3703 -Sensitized paper, paperboard, and cloth, not developed.3812-2 -Dressing glues.3819-7 -Mixture of metal carbides containing tantalium carbide,
not sintered by prepared for making plates sticks andthe like for the tool-tips.
4102 -Bovine animals leather and equine animals leather.4103-1 -Sheep skin leather, dyed, colored, stamped, or embossed.4104-1 -Goat skin leather, dyed, colored, stamped, or embossed.4108 -Patent leather.4203-1 -Articles of apparel, containing furskin or combined or
trimmed with precious metals, rolled precious metals,metals plated with precious metals, precious stones,semiprecious stones, pearls, coral, elephant's ivory, or"bekko."
4203-2 -Articles of apparel, other.4402 -Wood charcoal other than nut charcoal.4405-4 - Lumbers, lauans, and apitons.4414-2 -Veneer sheets and sheets for plywood, lauans, and apitons.
24-974--- -- 11
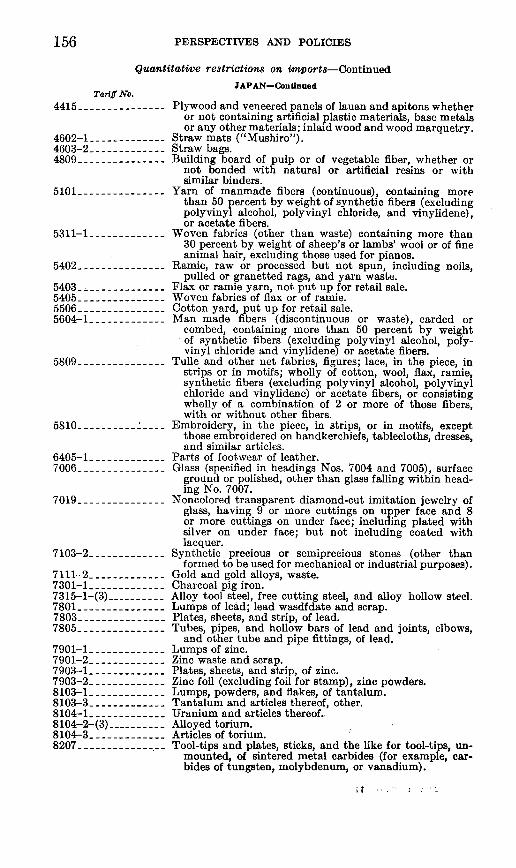
PERSPECTIVES AND POLICIES
Quantitative restrictions on imports-Continued
Tariff No.
4415-
4602-14603-24809
5101-
5311-1
5402 _
5403540555065604-1 _
5809
5810-
6405-1 _7006
7019
7103-2
7111-27301-17315-1-(3)780178037805 _
7901-17901-27903-17903-28103-18103-38104-18104-2-(3)81043 -----------38207
JAPAN-Continued
Plywood and veneered panels of lauan and apitons whetheror not containing artificial plastic materials, base metalsor any other materials; inlaid wood and wood marquetry.
Straw mats ("Mushiro").Straw bags.Building board of pulp or of vegetable fiber, whether or
not bonded with natural or artificial resins or withsimilar binders.
Yarn of manmade fibers (continuous), containing morethan 50 percent by weight of synthetic fibers (excludingpolyvinyl alcohol, polyvinyl chloride, and vinylidene),or acetate fibers.
Woven fabrics (other than waste) containing more than30 percent by weight of sheep's or lambs' wool or of fineanimal hair, excluding those used for pianos.
Ramie, raw or processed but not spun, including noils,pulled or granetted rags, and yarn waste.
Flax or ramie yarn, not put up for retail sale.Woven fabrics of flax or of ramie.Cotton yard, put up for retail sale.Man made fibers (discontinuous or waste), carded or
combed, containing more than 50 percent by weightof synthetic fibers (excluding polyvinyl alcohol, poly-vinyl chloride and vinylidene) or acetate fibers.
Tulle and other net fabrics, figures; lace, in the piece, instrips or in motifs; wholly of cotton, wool, flax, ramie,synthetic fibers (excluding polyvinyl alcohol, polyvinylchloride and vinylidene) or acetate fibers, or consistingwholly of a combination of 2 or more of those fibers,with or without other fibers.
Embroidery, in the piece, in strips, or in motifs, exceptthose embroidered on handkerchiefs, tablecloths, dresses,and similar articles.
Parts of footwear of leather.Glass (specified in headings Nos. 7004 and 7005), surface
ground or polished, other than glass falling within head-ing No. 7007.
Noncolored transparent diamond-cut imitation jewelry ofglass, having 9 or more cuttings on upper face and 8or more cuttings on under face; including plated withsilver on under face; but not including coated withlacquer.
Synthetic precious or semiprecious stones (other thanformed to be used for mechanical or industrial purposes).
Gold and gold alloys, waste.Charcoal pig iron.Alloy tool steel, free cutting steel, and alloy hollow steel.Lumps of lead; lead wasdfdate and scrap.Plates, sheets, and strip, of lead.Tubes, pipes, and hollow bars of lead and joints, elbows,
and other tube and pipe fittings, of lead.Lumps of zinc.Zinc waste and scrap.Plates, sheets, and strip, of zinc.Zinc foil (excluding foil for stamp), zinc powders.Lumps, powders, and flakes, of tantalum.Tantalum and articles thereof, other.Uranium and articles thereof.Alloyed torium.Articles of torium.Tool-tips and plates, sticks, and the like for tool-tips, un-
mounted, of sintered metal carbides (for example, car-bides of tungsten, molybdenum, or vanadium).
it - - ;
156
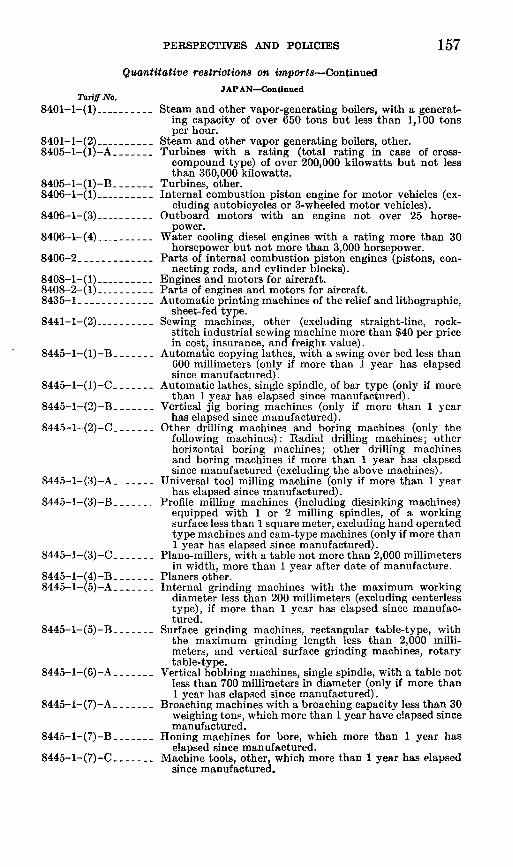
PERSPECTIVES AND POLICIES
Quantitative restrictions on imports-Continued
Tarif No.8401-1-(1)
8401-1-(2)8405-1-(1)-A
8405-1-(1)-B8406-1--(1)
8406-1-(3)
8406-1-(4)
8406-2
8408-1-(1)8408-2-(i)8435-1
8441-1-(2)
8445-1-(1)-B
8445-1-(1)-C-
8445-1-(2)-B-
8445-1-(2)-C
8445-1-(3)-A
8445-1-(3)-B-
8445-1-(3)-C-
8445-1-(4)-B-8445-1-(5)-A-
8445-1-(5)-B-
8445-1-(6)-A-
8445-1-(7)-A-
8445-1-(7)-B-
8445-1-(7)-C-
JAPAN-Continued
Steam and other vapor-generating boilers, with a generat-ing capacity of over 650 tons but less than 1,100 tonsper hour.
Steam and other vapor generating boilers, other.Turbines with a rating (total rating in case of cross-
compound type) of over 200,000 kilowatts but not lessthan 360,000 kilowatts.
Turbines, other.Internal combustion piston engine for motor vehicles (ex-
cluding autobicycles or 3-wheeled motor vehicles).Outboard motors with an engine not over 25 horse-
power.Water cooling diesel engines with a rating more than 30
horsepower but not more than 3,000 horsepower.Parts of internal combustion piston engines (pistons, con-
necting rods, and cylinder blocks).Engines and motors for aircraft.Parts of engines and motors for aircraft.Automatic printing machines of the relief and lithographic,
sheet-fed type.Sewing machines, other (excluding straight-line, rock-
stitch industrial sewing machine more than $40 per pricein cost, insurance, and freight value).
Automatic copying lathes, with a swing over bed less than600 millimeters (only if more than 1 year has elapsedsince manufactured).
Automatic lathes, single spindle, of bar type (only if morethan 1 year has elapsed since manufactured).
Vertical jig boring machines (only if more than 1 yearhas elapsed since manufactured).
Other drilling machines and boring machines (only thefollowing machines): Radial drilling machines; otherhorizontal boring machines; other drilling machinesand boring machines if more than 1 year has elapsedsince manufactured (excluding the above machines).
Universal tool milling machine (only if more than 1 yearhas elapsed since manufactured).
Profile milling machines (including diesinking machines)equipped with 1 or 2 milling spindles, of a workingsurface less than 1 square meter, excluding hand operatedtype machines and cam-type machines (only if more than1 year has elapsed since manufactured).
Plano-millers, with a table not more than 2,000 millimetersin width, more than 1 year after date of manufacture.
Planers other.Internal grinding machines with the maximum working
diameter less than 200 millimeters (excluding centerlesstype), if more than 1 year has elapsed since manufac-tured.
Surface grinding machines, rectangular table-type, withthe maximum grinding length less than 2,000 milli-meters, and vertical surface grinding machines, rotarytable-type.
Vertical hobbing machines, single spindle, with a table notless than 700 millimeters in diameter (only if more than1 year has elapsed since manufactured).
Broaching machines with a broaching capacity less than 30weighing tons, which more than 1 year have elapsed sincemanufactured.
Honing machines for bore, which more than 1 year haselapsed since manufactured.
Machine tools, other, which more than 1 year has elapsedsince manufactured.
157
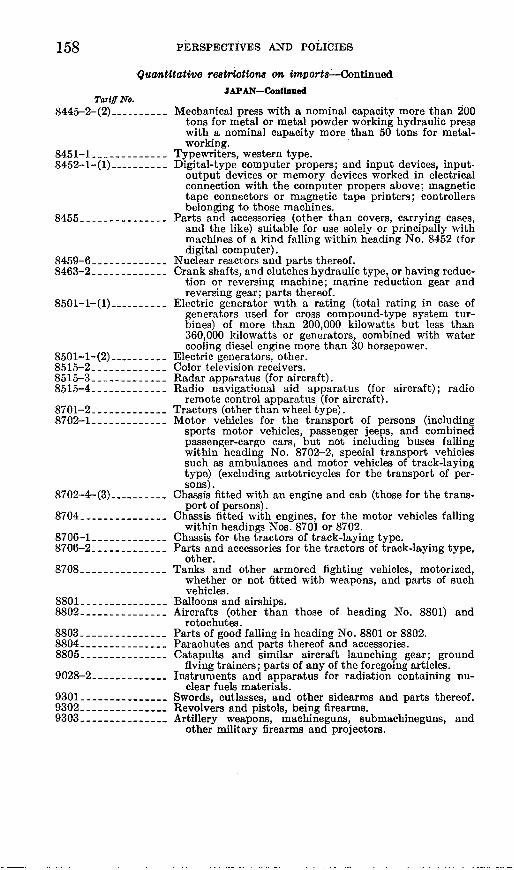
158 PERSPECTIVES AND POLICIES
Quantitative restrictions on imports-ContinuedJAPAN-Continued
Tariff No.8445-2-(2) -Mechanical press with a nominal capacity more than 200
tons for metal or metal powder working hydraulic presswith a nominal capacity more than 50 tons for metal-working.
8451-1 -Typewriters, western type.8452-1-(1) -Digital-type computer propers; and input devices, input-
output devices or memory devices worked in electricalconnection with the computer propers above: magnetictape connectors or magnetic tape printers: controllersbelonging to those machines.
8455 -Parts and accessories (other than covers, carrying cases,and the like) suitable for use solely or principally withmachines of a kind falling within heading No. 8452 (fordigital computer).
8459-6 -Nuclear reactors and parts thereof.8463-2 -Crank shafts, and clutches hydraulic type, or having reduc-
tion or reversing machine; marine reduction gear andreversing gear; parts thereof.
8501-1-(1) -Electric generator with a rating (total rating in case ofgenerators used for cross compound-type system tur-bines) of more than 200,000 kilowatts but less than360,000 kilowatts or generators, combined with watercooling diesel engine more than 30 horsepower.
8501-1-(2) -Electric generators, other.8515-2 -Color television receivers.8515-3 -Radar apparatus (for aircraft).8515-4 - Radio navigational aid apparatus (for aircraft); radio
remote control apparatus (for aircraft).8701-2 -Tractors (other than wheel type).8702-1 -Motor vehicles for the transport of persons (including
sports motor vehicles, passenger jeeps, and combinedpassenger-cargo cars, but not including buses fallingwithin heading No. 8702-2, special transport vehiclessuch as ambulances and motor vehicles of track-layingtype) (excluding autotricycles for the transport of per-sons).
8702-4-(3) -Chassis fitted with an engine and cab (those for the trans-port of persons).
8704 -Chassis fitted with engines, for the motor vehicles fallingwithin headings Nos. 8701 or 8702.
8706-1 -Chassis for the tractors of track-laying type.8706-2 -Parts and accessories for the tractors of track-laying type,
other.8708 -Tanks and other armored fighting vehicles, motorized,
whether or not fitted with weapons, and parts of suchvehicles.
8801 - Balloons and airships.8802 -Aircrafts (other than those of heading No. 8801) and
rotochutes.8803 -Parts of good falling in heading No. 8801 or 8802.8804 -Parachutes and parts thereof and accessories.8805 - Catapults and similar aircraft launching gear; ground
flving trainers; parts of any of the foregoing articles.9028-2 - Instruments and apparatus for radiation containing nu-
clear fuels materials.9301 -_------ Swords, cutlasses, and other sidearms and parts thereof.9302 -_------_Revolvers and pistols, being firearms.9303 -_ Artillery weapons, machineguns, submachineguns, and
other military firearms and projectors.
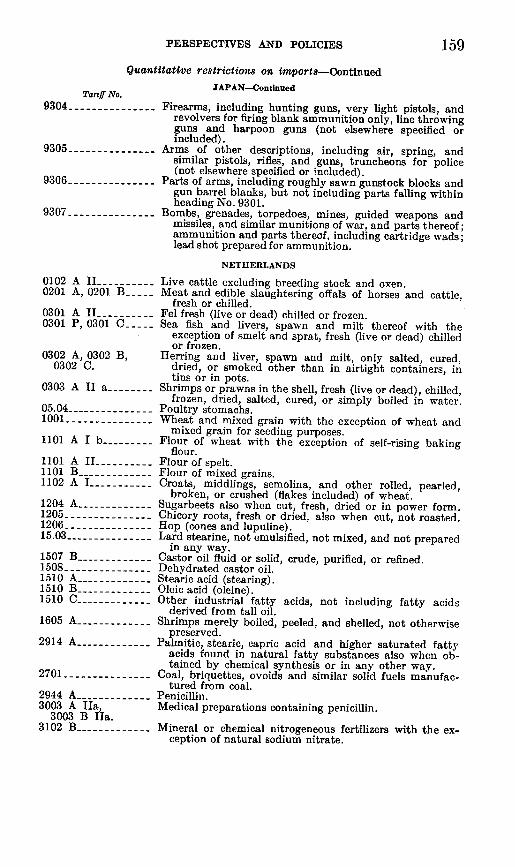
PERSPECTIVES AND POLICIES
Quantitative restrictions on imports-Continued
Tariff No.9304 _- -
9305 .
9306 ------------
9307
01020201
03010301
A IIA, 0201 B-
A IIP, 0301 C ---
0302 A, 0302 B,0302 C.
0303 A II a
05.041001 .-- - - - -
1101 A I b-
1101 A II1101 B.1102 A I
1204 A1205 -----1206 - -----15.03-- - - - - - -
1507 B.1508 - .-----------1510 A1510 B.1510 C
1605 A
2914 A
2701
2944 A3003 A Iha,
3003 B Ila.3102 B.
JAPAN-Continued
Firearms, including hunting guns, very light pistols, andrevolvers for firing blank ammunition only, line throwingguns and harpoon guns (not elsewhere specified orincluded).
Arms of other descriptions, including air, spring, andsimilar pistols, rifles, and guns, truncheons for police(not elsewhere specified or included).
Parts of arms, including roughly sawn gunstock blocks andgun barrel blanks, but not including parts falling withinheading No. 9301.
Bombs, grenades, torpedoes, mines, guided weapons andmissiles, and similar munitions of war. and parts thereof;ammunition and parts thereof, including cartridge wads;lead shot prepared for ammunition.
NETHERLANDS
Live cattle excluding breeding stock and oxen.Meat and edible slaughtering offals of horses and cattle,
fresh or chilled.Fel fresh (live or dead) chilled or frozen.Sea fish and livers, spawn and milt thereof with the
exception of smelt and sprat, fresh (live or dead) chilledor frozen.
Herring and liver, spawn and milt, only salted, cured,dried, or smoked other than in airtight containers, intins or in pots.
Shrimps or prawns in the shell, fresh (live or dead), chilled,frozen, dried, salted, cured, or simply boiled in water.
Poultry stomachs.Wheat and mixed grain with the exception of wheat and
mixed grain for seeding purposes.Flour of wheat with the exception of self-rising baking
flour.Flour of spelt.Flour of mixed grains.Croats, middlings, semolina, and other rolled, pearled,
broken, or crushed (flakes included) of wheat.Sugarbeets also when cut, fresh, dried or in power form.Chicory roots, fresh or dried, also when cut, not roasted.Hop (cones and lupuline).Lard stearine, not emulsified, not mixed, and not prepared
in any way.Castor oil fluid or solid, crude, purified, or refined.Dehydrated castor oil.Stearic acid (stearing).Oleic acid (oleine).Other industrial fatty acids, not including fatty acids
derived from tali oil.Shrimps merely boiled, peeled, and shelled, not otherwise
preserved.Palmitic, stearic, capric acid and higher saturated fatty
acids found in natural fatty substances also when ob-tained by chemical synthesis or in any other way.
Coal, briquettes, ovoids and similar solid fuels manufac-tured from coal.
Penicillin.Medical preparations containing penicillin.
Mineral or chemical nitrogeneous fertilizers with the ex-ception of natural sodium nitrate.
159
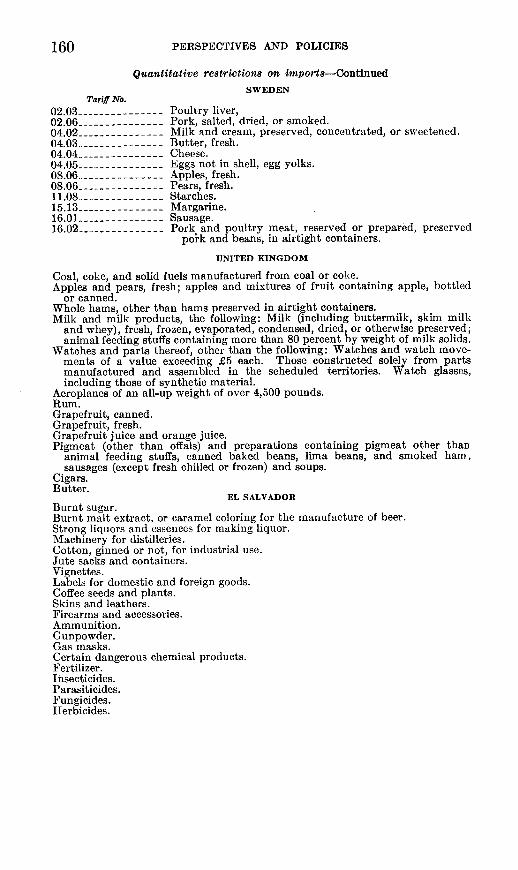
160 PERSPECTIVES AND POLICIES
Quantitative restrictions on imports-Continued
SWEDENTariff No.
02.03 -Poultry liver,02.06 -Pork, salted, dried, or smoked.04.02 -Milk and cream, preserved, concentrated, or sweetened.04.03 ..- Butter, fresh.04.04 -Cheese.04.05 -Eggs not in shell, egg yolks.08.06 -Apples, fresh.08.06 -Pears, fresh.11.08 -Starches.15.13 -Margarine.16.01 - Sausage.16.02 -Pork and poultry meat, reserved or prepared, preserved
pork and beans, in airtight containers.
UNITED KINGDOM
Coal, coke, and solid fuels manufactured from coal or coke.Apples and pears, fresh; apples and mixtures of fruit containing apple, bottled
or canned.Whole hams, other than hams preserved in airtight containers.Milk and milk products, the following: Milk (including buttermilk, skim milk
and whey), fresh, frozen, evaporated, condensed, dried, or otherwise preserved;animal feeding stuffs containing more than 80 percent by weight of milk solids.
Watches and parts thereof, other than the following: Watches and watch move-ments of a value exceeding £5 each. Those constructed solely from partsmanufactured and assembled in the scheduled territories. Watch glasses,including those of synthetic material.
Aeroplanes of an all-up weight of over 4,500 pounds.Rum.Grapefruit, canned.Grapefruit, fresh.Grapefruit juice and orange juice.Pigmeat (other than offals) and preparations containing pigmeat other than
animal feeding stuffs, canned baked beans, lima beans, and smoked ham,sausages (except fresh chilled or frozen) and soups.
Cigars.Butter.
EL SALVADORBurnt sugar.Burnt malt extract, or caramel coloring for the manufacture of beer.Strong liquors and essences for making liquor.Machinery for distilleries.Cotton, ginned or not, for industrial use.Jute sacks and containers.Vignettes.Labels for domestic and foreign goods.Coffee seeds and plants.Skins and leathers.Firearms and accessories.Ammunition.Gunpowder.Gas masks.Certain dangerous chemical products.Fertilizer.Insecticides.Parasiticides.Fungicides.Herbicides.
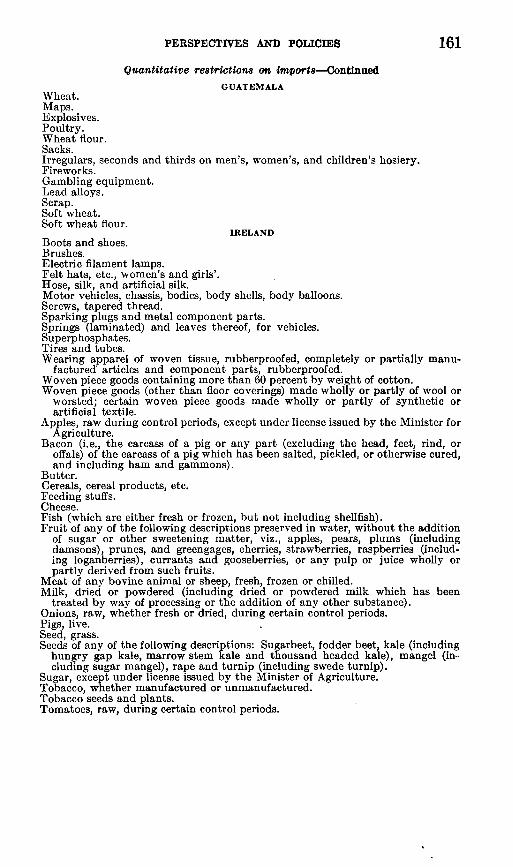
PERSPECTIVES AND POLICIES 161
Quantitative restrictions on imports-ContinuedGUATEMALA
Wheat.Maps.Explosives.Poultry.Wheat flour.Sacks.Irregulars, seconds and thirds on men's, women's, and children's hosiery.Fireworks.Gambling equipment.Lead alloys.Scrap.Soft wheat.Soft wheat flour.
IRELANDBoots and shoes.Brushes.Electric filament lamps.Felt hats, etc., women's and girls'.Hose, silk, and artificial silk.Motor vehicles, chassis, bodies, body shells, body balloons.Screws, tapered thread.Sparking plugs and metal component parts.Springs (laminated) and leaves thereof, for vehicles.Superphosphates.Tires and tubes.Wearing apparel of woven tissue, rubberproofed, completely or partially manu-
factured' articles and component parts, rubberproofed.Woven piece goods containing more than 60 percent by weight of cotton.Woven piece goods (other than floor coverings) made wholly or partly of wool or
worsted; certain woven piece goods made wholly or partly of synthetic orartificial textile.
Apples, raw during control periods, except under license issued by the Minister forAgriculture.
Bacon (i.e., the carcass of a pig or any part (excluding the head, feet, rind, oroffals) of the carcass of a pig which has been salted, pickled, or otherwise cured,and including ham and gammons).
Butter.Cereals, cereal products, etc.Feeding stuffs.Cheese.Fish (which are either fresh or frozen, but not including shellfish).Fruit of any of the following descriptions preserved in water, without the addition
of sugar or other sweetening matter, viz., apples, pears, plums (includingdamsons), prunes, and greengages, cherries, strawberries, raspberries (includ-ing loganberries), currants and gooseberries, or any pulp or juice wholly orpartly derived from such fruits.
Meat of any bovine animal or sheep, fresh, frozen or chilled.Milk, dried or powdered (including dried or powdered milk which has been
treated by way of processing or the addition of any other substance).Onions, raw, whether fresh or dried, during certain control periods.Pigs, live.Seed, grass.Seeds of any of the following descriptions: Sugarbeet, fodder beet, kale (including
hungry gap kale, marrow stem kale and thousand headed kale), mangel (in-cluding sugar mangel), rape and turnip (including swede turnip).
Sugar, except under license issued by the Minister of Agriculture.Tobacco, whether manufactured or unmanufactured.Tobacco seeds and plants.Tomatoes, raw, during certain control periods.
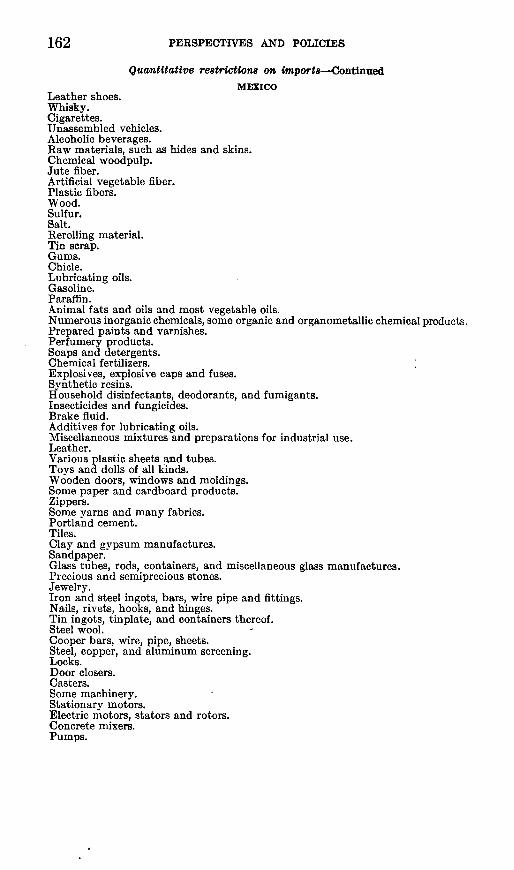
162 PERSPECTIVES AND POLICIES
Quantitative restrictions on import8-ContinuedMEXICO
Leather shoes.Whisky.Cigarettes.Unassembled vehicles.Alcoholic beverages.Raw materials, such as hides and skins.Chemical woodpulp.Jute fiber.Artificial vegetable fiber.Plastic fibers.Wood.Sulfur.Salt.Rerolling material.Tin scrap.Gums.Chicle.Lubricating oils.Gasoline.Paraffin.Animal fats and oils and most vegetable oils.Numerous inorganic chemicals, some organic and organometallic chemical products.Prepared paints and varnishes.Perfumery products.Soaps and detergents.Chemical fertilizers.Explosives, explosive caps and fuses.Synthetic resins.Household disinfectants, deodorants, and fumigants.Insecticides and fungicides.Brake fluid.Additives for lubricating oils.Miscellaneous mixtures and preparations for industrial use.Leather.Various plastic sheets and tubes.Toys and dolls of all kinds.Wooden doors, windows and moldings.Some paper and cardboard products.Zippers.Some yarns and many fabrics.Portland cement.Tiles.Clay and gypsum manufactures.Sandpaper.Glass tubes, rods, containers, and miscellaneous glass manufactures.Precious and semiprecious stones.Jewelry.Iron and steel ingots, bars, wire pipe and fittings.Nails, rivets, hooks, and hinges.Tin ingots, tinplate, and containers thereof.Steel wool.Cooper bars, wire, pipe, sheets.Steel, copper, and aluminum screening.Locks.Door closers.Casters.Some machinery.Stationary motors.Electric motors, stators and rotors.Concrete mixers.Pumps.
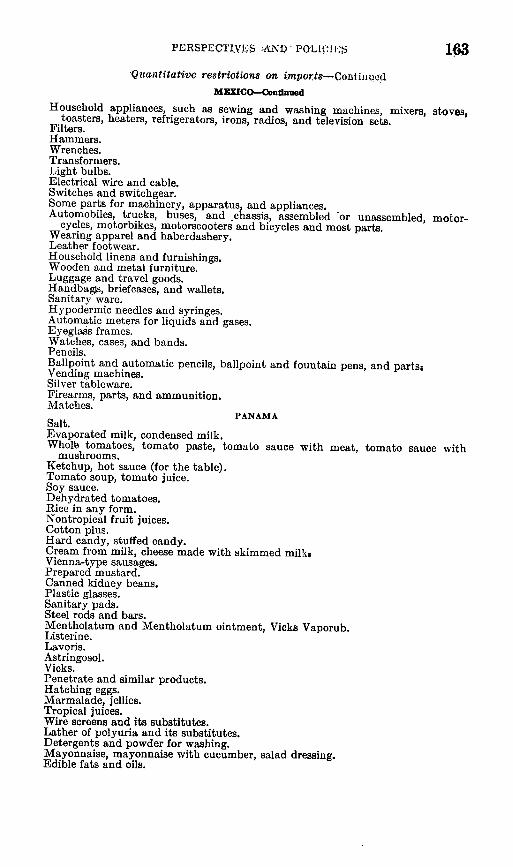
PERSPECTUNS AND POLI('!I'S 163
Qualatitative restrictions on imports-Continlued
MIXICO-Centinzed
Household appliances, such as sewing and washing machines, mixers, stoves,toasters, heaters, refrigerators, irons, radios, and television sets.
Filters.Hammers.Wrenches.Transformers.Light bulbs.Electrical wire and cable.Switches and switchgear.Some parts for machinery, apparatus, and appliances.Automobiles, trucks, buses, and chassis, assembled or unassembled, motor-
cycles, motorbikes, motorscooters and bicycles and most parts.Wearing apparel and haberdashery.Leather footwear.Household linens and furnishings.Wooden and metal furniture.Luggage and travel goods.Handbagp, briefcases, and wallets.Sanitary ware.Hypodermic needles and syringes.Automatic meters for liquids and gases.Eyeglass frames.Watches, cases, and bands.Pencils.Ballpoint and automatic pencils, ballpoint and fountain pens, and parts,Vending machines.Silver tableware.Firearms, parts, and ammunition.Matches.
PANAMASalt.Evaporated milk, condensed milk.Whole tomatoes, tomato paste, tomato sauce with meat, tomato sauce with
mushrooms.Ketchup, hot sauce (for the table).Tomato soup, tomato juice.Soy sauce.Dehydrated tomatoes.Rice in any form.Nontropical fruit juices.Cotton plus.Hard candy, stuffed candy.Cream from milk, cheese made with skimmed milk.Vienna-type sausages.Prepared mustard.Canned kidney beans.Plastic glasses.Sanitary pads.Steel rods and bars.Mentholatum and Mentholatum ointment, Vicks Vaporub.Listerine.Lavoris.Astringosol.Vicks.Penetrate and similar products.Hatching eggs.Marmalade, jellies.Tropical juices.Wire screens and its substitutes.Lather of polyuria and its substitutes.Detergents and powder for washing.Mayonnaise, mayonnaise with cucumber, salad dressing.Edible fats and oils.
164 PERSPECTIVES AND POLICIES
Quantitative restrictions on imports-ContinuedPANAMA-Continued
Lard substitutes, vegetable lard.Oleomargarine.Flour.Tin cans.Potatoes.Chewing gum.Paper bags with multiple walls.Matches.
0